UNITED STATES SECURITIES AND EXCHANGE COMMISSION
Washington, D.C. 20549
FORM N-CSR
CERTIFIED SHAREHOLDER REPORT OF REGISTERED MANAGEMENT INVESTMENT COMPANIES
Investment Company Act file number 811-06312
The Lazard Funds, Inc.
(Exact name of registrant as specified in charter)
30 Rockefeller Plaza
New York, New York 10112
(Address of principal executive offices) (Zip code)
Mark R. Anderson, Esq.
Lazard Asset Management LLC
30 Rockefeller Plaza
New York, New York 10112
(Name and address of agent for service)
Registrant’s telephone number, including area code: (212) 632-6000
Date of fiscal year end: 12/31
Date of reporting period: 12/31/20
ITEM 1. REPORTS TO STOCKHOLDERS.

Lazard Funds
Annual Report
December 31, 2020
Alternatives Funds
Lazard Enhanced Opportunities Portfolio
The Lazard Funds, Inc. Table of Contents
Please consider the Portfolio’s investment objectives, risks, charges and expenses carefully before investing. For more complete information about The Lazard Funds, Inc. (the “Fund”), you may obtain a prospectus or the Portfolio’s summary prospectus by calling 800-823-6300, or online, at ww.lazardassetmanagement.com. Read the prospectus or the Portfolio’s summary prospectus carefully before you invest. The prospectus and the Portfolio’s summary prospectus contain the investment objectives, risks, charges, expenses and other information about the Portfolio, which are not detailed in this report
Distributed by Lazard Asset Management Securities LLC.
Annual Report 1
The Lazard Funds, Inc. A Message from Lazard (unaudited)
Dear Shareholder,
As 2020 began, the outbreak of a novel coronavirus (“COVID-19”) turned into a fast-spreading pandemic, rattling global markets. Worldwide lockdowns led to a severe equity market sell-off in February and March, as well as a sharp decline in oil markets. By the conclusion of the year, COVID-19 continued to wreak havoc across much of the world, but many global equity markets closed 2020 near all-time highs. Markets rose generally steadily after the sell-off on the back of unprecedented support from global central banks and government treasuries and the introduction of several promising vaccines.
In the United States, Democrats won control of the White House and Congress in November elections. The US equity market closed 2020 near an all-time peak, and nominal yields in various US fixed income market segments closed at or near all-time lows, fueled by trillions of dollars in monetary and fiscal stimulus.
COVID-19 also severely debilitated economic activity in the emerging markets, but the recovery in emerging markets equities that began in late March picked up steam in the fourth quarter thanks to vaccine breakthroughs and the US election outcome. As a result, the MSCI Emerging Markets® Index outperformed global developed markets equities in 2020.
In Europe, interest rates have never been as low, and central bank balance sheets have never been as inflated, as they were at year-end. With an agreement now in place for the exit of the United Kingdom from the European Union, the years-long “Brexit” saga may be one less uncertainty the market has to grapple with in the year ahead.
As we write, many countries are facing record levels of new COVID-19 infections, spurring renewed economic lockdowns and increasing the risk that many companies, particularly small businesses, might not make it to the other side of this pandemic. Were that to happen, it could send a negative signal to markets equal and opposite to the positive news of the vaccines toward the end
2 Annual Report
of the last year. Investors face a timing conundrum, but it could well be darkest before the dawn.
Despite these challenges, we are optimistic for 2021 and believe that as the world does eventually return to something like the pre-pandemic days, fundamental analysis and stock selection will be crucial drivers for performance. We are privileged that you have turned to Lazard for your investment needs and value your continued confidence in our investment management capabilities. We continue to strive for the long-term patterns of performance pursued by the various investment strategies employed.
Sincerely,
Lazard Asset Management LLC
Annual Report 3
The Lazard Funds, Inc. Investment Overview (unaudited)
Market Overview
The year was defined by the rapid spread of COVID-19, leading to government-mandated lockdowns, halts in economic activity, and widespread social distancing. Equity markets sold-off dramatically in March before reaching numerous all-time highs throughout the year, thereby creating significant opportunities for value extraction in the hedged convertibles space.
A by-product of the March sell-off was a surge in primary convertible issuances, as many non-traditional convertible issuers (e.g., cruise lines, airlines, etc.) sought liquidity, with nearly $160 billion of new paper coming to market in 2020, a calendar year record. Interest rates declined dramatically (the yield on the benchmark 10-Year US Treasury note reached an all-time low of 51 basis points), causing the cost of leverage to decline by more than 70%. Elevated equity volatility, a positive factor for hedged convertibles, also added to the multi-year cheapness within the hedged convertibles space. The CBOE Volatility® Index (VIX) reached a peak in March and generally trended downward, with periodic spikes, for the rest of the year. Although the VIX has been trending downward since March 2020, equity volatility remains elevated relative to previous years.
Government stimulus, low interest rates, and positive news regarding COVID-19 vaccines supported equity markets (with notable sell-offs in September and October), with the NASDAQ Composite Index, the S&P 500® Index and the Dow Jones Industrial Average reaching all-time highs throughout the year.
Lazard Enhanced Opportunities Portfolio
For the year ended December 31, 2020, the Lazard Enhanced Opportunities Portfolio’s Institutional Shares posted a total return of 9.87%, while Open Shares posted a total return of 9.59%, as compared with the 52.05% return for the ICE BofAML US Convertible ex Mandatory® Index and the 6.61% return for the HFRX Global Hedge Fund® Index.
The Portfolio provided downside risk-mitigation when markets sold-off dramatically in March (and generated positive absolute
4 Annual Report
returns from April through December). While the S&P 500 Index and the Russell 2000® Index declined 12% and 22%, respectively, for the month, the Portfolio’s return in March avoided such a dramatic declines. The Portfolio’s performance in March was impacted as long-only investors, who represent approximately two-thirds of the convertible securities marketplace, made sales into the accelerated risk-off environment. These sales resulted in unrealized, marked-to-market losses for the affected securities held in the Portfolio. Post-March, the Portfolio benefited from improvement in COVID-19-impacted names, specifically in the travel and leisure space, elevated equity volatility, and negotiated transactions with issuers.
The Portfolio uses derivatives such as options, both opportunistically and for hedging purposes. Additionally, the Portfolio implements currency forwards to hedge the currency exposure of non-US dollar-denominated securities. For the year, the use of derivatives contributed positively to performance.
Annual Report 5
The Lazard Funds, Inc. Performance Overview (unaudited)
Lazard Enhanced Opportunities Portfolio
Comparison of Changes in Value of $10,000 Investment in the Institutional Shares of Lazard Enhanced Opportunities Portfolio, the ICE BofAML U.S. Convertible ex Mandatory® Index and the HFRX Global Hedge Fund® Index*

Average Annual Total Returns*
Periods Ended December 31, 2020
| | One | Five | Since | |
| | Year | Years | Inception | † |
| Institutional Shares | 9.87% | 5.07% | 3.80% | |
| Open Shares | 9.59% | 4.81% | 3.54% | |
| ICE BofAML U.S. Convertible ex Mandatory Index | 52.05% | 19.42% | 15.40% | |
| HFRX Global Hedge Fund Index | 6.61% | 3.25% | 2.07% | |
| † | The inception date for the Portfolio was December 31, 2014. |
Notes to Performance Overviews:
| * | Total returns reflect reinvestment of all dividends and distributions, if any. Certain expenses of the Portfolio may have been waived or reimbursed by Lazard Asset Management LLC, the Fund’s investment manager (the “Investment Manager”), State Street Bank and Trust Company, the Fund’s administrator (“State Street”), or DST Asset Manager Solutions, Inc., the Fund’s transfer agent and dividend disbursing agent (“DST”); without such waiver/reimbursement of expenses, the Portfolio’s returns would have been lower. |
| | |
| | Performance results do not include adjustments made for financial reporting purposes in accordance with US Generally Accepted Accounting Principles (“GAAP”), if any, and may differ from amounts reported in the financial highlights. For Institutional Shares and Open Shares, a one-time voluntary reimbursement by State Street increased the total return ratio by 0.49% for year ended December 31, 2017. |
| | |
| | The performance quoted represents past performance. Current performance may be lower or higher than the performance quoted. Past performance is not indicative, or a guarantee, of future results; the investment return and principal value of the Portfolio will fluctuate, so that Portfolio shares, when redeemed, may be worth more or less than their original cost. Within the longer periods illustrated there may have been short-term fluctuations, counter to the overall trend of investment results, and no single period of any length may be taken as typical of what may be expected in future periods. The graph and table above do not reflect the deduction of taxes that a shareholder would pay on the Portfolio’s distributions or the redemption of Portfolio shares. |
6 Annual Report
| | The performance data of the indices have been prepared from sources and data that the Investment Manager believes to be reliable, but no representation is made as to their accuracy. The indices are unmanaged, have no fees or costs and are not available for investment. |
| | |
| | The ICE BofAML U.S. Convertible ex Mandatory Index measures the performance of convertible securities of all corporate sectors with a par amount of $25 million or more and a maturity of at least one year and excludes preferred equity redemption stocks and converted securities. |
| | |
| | The HFRX Global Hedge Fund Index is designed to be representative of the overall composition of the hedge fund universe. It is comprised of all eligible hedge fund strategies, including but not limited to convertible arbitrage, distressed securities, equity hedge, equity market neutral, event-driven, macro, merger arbitrage, and relative value arbitrage. The strategies are asset weighted based on the distribution of assets in the hedge fund industry. |
| | |
| | The performance of Institutional Shares and Open Shares may vary, primarily based on the differences in fees borne by shareholders investing in different classes. |
Annual Report 7
The Lazard Funds, Inc.
Information About the Portfolio’s Expenses (unaudited)
Expense Example
As a shareholder in the Portfolio, you incur ongoing costs, including management fees, distribution and service (12b-1) fees (Open Shares only), and other expenses. This Example is intended to help you understand your ongoing costs (in dollars) of investing in the Portfolio and to compare these costs with the ongoing costs of investing in other mutual funds. The Example is based on an investment of $1,000 invested at the beginning of the six month period from July 1, 2020 through December 31, 2020 and held for the entire period.
Actual Expenses
For each share class of the Portfolio, the first line of the accompanying table provides information about actual account values and actual expenses. You may use the information in this line, together with the amount you invested, to estimate the expenses that you paid over the period. Simply divide your account value by $1,000 (for example, an $8,600 account value divided by $1,000=8.6), then multiply the result by the number in the first line under the heading entitled “Expenses Paid During Period” to estimate the expenses you paid on your account during this period.
Hypothetical Example for Comparison Purposes
For each share class of the Portfolio, the second line of the accompanying table provides information about hypothetical account values and hypothetical expenses based on the class’ actual expense ratio and an assumed rate of return of 5% per year before expenses, which is not the Portfolio’s actual return. The hypothetical account values and expenses may not be used to estimate the actual ending account balance or expenses you paid for the period. You may use this information to compare the ongoing costs of investing in the Portfolio and other mutual funds. To do so, compare this 5% hypothetical example with the 5% hypothetical examples that appear in the shareholder reports of other mutual funds.
8 Annual Report
| Portfolio | Beginning
Account
Value
7/1/20 | Ending
Account
Value
12/31/20 | Expenses
Paid During
Period*
7/1/20 -
12/31/20 | Annualized
Expense Ratio
During Period
7/1/20 -
12/31/20 | |
| | | | | | |
| Enhanced Opportunities† | | | | | |
| Institutional Shares | | | | | |
| Actual | $1,000.00 | $1,129.40 | $11.88 | 2.22% | |
| Hypothetical (5% Return Before Expenses) | $1,000.00 | $1,013.98 | $11.24 | 2.22% | |
| Open Shares | | | | | |
| Actual | $1,000.00 | $1,129.20 | $10.28 | 1.92% | |
| Hypothetical (5% Return Before Expenses) | $1,000.00 | $1,015.48 | $9.73 | 1.92% | |
| * | Expenses are equal to the annualized expense ratio, net of expenses waivers and reimbursements, of each Share class multiplied by the average account value over the period, multiplied by 184/366 (to reflect one-half year period). |
| | |
| † | The expense ratios include dividend and borrowing expenses on securities sold short. |
Annual Report 9
The Lazard Funds, Inc. Portfolio Holdings Presented by
Asset Class/Sector December 31, 2020
| | | Lazard Enhanced
Opportunities Portfolio | | |
| Asset Class/Sector | | Long | * | | Short | † | |
| | | | | | | | |
| Convertible Corporate Bonds | | | | | | | | | |
| Communication Services | | | 11.0 | % | | | — | % | |
| Consumer Discretionary | | | 8.3 | | | | — | | |
| Consumer Staples | | | 2.1 | | | | — | | |
| Energy | | | 1.6 | | | | — | | |
| Financials | | | 11.6 | | | | — | | |
| Health Care | | | 20.9 | | | | — | | |
| Industrials | | | 7.9 | | | | — | | |
| Information Technology | | | 26.4 | | | | — | | |
| Materials | | | 0.4 | | | | — | | |
| Real Estate | | | 2.0 | | | | — | | |
| Utilities | | | 0.5 | | | | — | | |
| Equity | | | | | | | | | |
| Communication Services | | | — | | | | –13.4 | | |
| Consumer Discretionary | | | — | | | | –10.3 | | |
| Consumer Staples | | | — | | | | –1.8 | | |
| Energy | | | — | | | | –1.1 | | |
| Financials | | | 0.1 | | | | –5.2 | | |
| Health Care | | | 0.0 | # | | | –21.1 | | |
| Industrials | | | — | | | | –7.8 | | |
| Information Technology | | | 0.0 | # | | | –31.3 | | |
| Materials | | | — | | | | –0.2 | | |
| Real Estate | | | — | | | | –4.9 | | |
| Utilities | | | — | | | | –0.3 | | |
| Exchange Traded Funds | | | — | | | | –2.6 | | |
| Short-Term Investments | | | 7.2 | | | | — | | |
| Total Investments | | | 100.0 | % | | | –100.0 | % | |
| * | Represents percentage of total investments excluding securities sold short. |
| † | Represents percentage of total securities sold short. |
| # | Amount is less than 0.05%. |
10 Annual Report
The Lazard Funds, Inc. Portfolio of Investments
December 31, 2020
| Description | | | | Shares | | | Fair
Value | |
| | | | | | | | | | | |
| Lazard Enhanced Opportunities Portfolio | | | | | | | | | | |
| | | | | | | | | | | |
| Common Stocks | 0.1% | | | | | | | | | | |
| | | | | | | | | | | |
| United States | 0.1% | | | | | | | | | | |
| Alder Biopharmaceuticals, Inc. (*), (‡) | | | | | 3,247 | | | $ | 2,857 | |
| Hope Bancorp, Inc. (±) | | | | | 2,100 | | | | 22,911 | |
| Silicon Laboratories, Inc. (*), (±) | | | | | 17 | | | | 2,165 | |
| | | | | | | | | | 27,933 | |
| | | | | | | | | | | |
Total Common Stocks
(Cost $24,990) | | | | | | | | | 27,933 | |
| | | | | | | | | | | |
| Description | | Security
Currency | | Principal
Amount
(000) | | | Fair
Value | |
| | | | | | | | | | | |
| Convertible Corporate Bonds | 173.5% | | | | | | | | | | |
| | | | | | | | | | | |
| Brazil | 0.6% | | | | | | | | | | |
GOL Equity Finance SA,
3.750%, 07/15/24 (#), (±) | | USD | | | 134 | | | $ | 116,258 | |
| | | | | | | | | | | |
| Canada | 10.4% | | | | | | | | | | |
Aphria, Inc.,
5.250%, 06/01/24 (±) | | USD | | | 323 | | | | 341,371 | |
Aurora Cannabis, Inc.,
5.500%, 02/28/24 (±) | | USD | | | 424 | | | | 316,940 | |
Canadian Solar, Inc.,
2.500%, 10/01/25 (#), (±) | | USD | | | 119 | | | | 186,429 | |
Canopy Growth Corp.,
4.250%, 07/15/23 (#), (±) | | CAD | | | 362 | | | | 293,988 | |
Colliers International Group, Inc.,
4.000%, 06/01/25 (#), (±) | | USD | | | 155 | | | | 266,988 | |
Element Fleet Management Corp.,
4.250%, 06/30/24 (±) | | CAD | | | 153 | | | | 154,436 | |
Pretium Resources, Inc.,
2.250%, 03/15/22 (±) | | USD | | | 152 | | | | 162,640 | |
Shopify, Inc.,
0.125%, 11/01/25 (±) | | USD | | | 128 | | | | 150,720 | |
The accompanying notes are an integral part of these financial statements.
Annual Report 11
| Description | | Security
Currency | | Principal
Amount
(000) | | | Fair
Value | |
| | | | | | | | | |
| Lazard Enhanced Opportunities Portfolio (continued) | | | | | | | | |
| | | | | | | | | |
Tricon Residential, Inc.,
5.750%, 03/31/22 (±) | | USD | | | 174 | | | $ | 179,220 | |
| | | | | | | | | | 2,052,732 | |
| | | | | | | | | | | |
| Chile | 0.5% | | | | | | | | | | |
Liberty Latin America, Ltd.,
2.000%, 07/15/24 (±) | | USD | | | 100 | | | | 95,023 | |
| | | | | | | | | | | |
| Hong Kong | 0.5% | | | | | | | | | | |
Seaspan Corp.,
3.750%, 12/15/25 (±) | | USD | | | 99 | | | | 106,225 | |
| | | | | | | | | | | |
| Israel | 0.5% | | | | | | | | | | |
Fiverr International, Ltd.,
0.000%, 11/01/25 (±) | | USD | | | 79 | | | | 95,345 | |
| | | | | | | | | | | |
| Netherlands | 0.6% | | | | | | | | | | |
Pharming Group NV,
3.000%, 01/21/25 (±) | | EUR | | | 100 | | | | 109,136 | |
| | | | | | | | | | | |
| Norway | 1.4% | | | | | | | | | | |
SFL Corp., Ltd.,
5.750%, 10/15/21 (±) | | USD | | | 282 | | | | 276,332 | |
| | | | | | | | | | | |
| Panama | 1.7% | | | | | | | | | | |
Copa Holdings SA,
4.500%, 04/15/25 (±) | | USD | | | 201 | | | | 338,924 | |
| | | | | | | | | | | |
| United States | 157.3% | | | | | | | | | | |
1Life Healthcare, Inc.,
3.000%, 06/15/25 (±) | | USD | | | 179 | | | | 224,452 | |
8x8, Inc.,
0.500%, 02/01/24 (±) | | USD | | | 299 | | | | 433,931 | |
Aerie Pharmaceuticals, Inc.,
1.500%, 10/01/24 (±) | | USD | | | 66 | | | | 60,518 | |
Air Transport Services Group, Inc.,
1.125%, 10/15/24 (±) | | USD | | | 213 | | | | 252,812 | |
The accompanying notes are an integral part of these financial statements.
12 Annual Report
| Description | | Security
Currency | | Principal
Amount
(000) | | | Fair
Value | |
| | | | | | | | | | | |
| Lazard Enhanced Opportunities Portfolio (continued) | | | | | | | | | | |
| | | | | | | | | | | |
Alteryx, Inc.,
0.500%, 08/01/24 (±) | | USD | | | 202 | | | $ | 208,965 | |
American Airlines Group, Inc.,
6.500%, 07/01/25 (±) | | USD | | | 235 | | | | 294,588 | |
Apellis Pharmaceuticals, Inc.,
3.500%, 09/15/26 (±) | | USD | | | 157 | | | | 263,403 | |
Arbor Realty Trust, Inc.,
4.750%, 11/01/22 (±) | | USD | | | 295 | | | | 295,268 | |
Arch Resources, Inc.,
5.250%, 11/15/25 (±) | | USD | | | 91 | | | | 127,974 | |
| Atlas Air Worldwide Holdings, Inc.: | | | | | | | | | | |
| 2.250%, 06/01/22 (±) | | USD | | | 224 | | | | 232,455 | |
| 1.875%, 06/01/24 (±) | | USD | | | 203 | | | | 230,312 | |
Avadel Finance Cayman, Ltd.,
4.500%, 02/01/23 (±) | | USD | | | 187 | | | | 186,305 | |
Avaya Holdings Corp.,
2.250%, 06/15/23 (±) | | USD | | | 200 | | | | 208,333 | |
Bloomin’ Brands, Inc.,
5.000%, 05/01/25 (±) | | USD | | | 169 | | | | 310,333 | |
Bridgebio Pharma, Inc.,
2.500%, 03/15/27 (±) | | USD | | | 157 | | | | 289,404 | |
Cardlytics, Inc.,
1.000%, 09/15/25 (±) | | USD | | | 110 | | | | 200,940 | |
Cinemark Holdings, Inc.,
4.500%, 08/15/25 (±) | | USD | | | 256 | | | | 373,628 | |
Coherus Biosciences, Inc.,
1.500%, 04/15/26 (±) | | USD | | | 153 | | | | 176,211 | |
Collegium Pharmaceutical, Inc.,
2.625%, 02/15/26 (±) | | USD | | | 146 | | | | 144,430 | |
CONMED Corp.,
2.625%, 02/01/24 (±) | | USD | | | 179 | | | | 250,219 | |
Coupa Software, Inc.,
0.375%, 06/15/26 (±) | | USD | | | 134 | | | | 180,199 | |
CryoPort, Inc.,
3.000%, 06/01/25 (±) | | USD | | | 108 | | | | 213,712 | |
CSG Systems International, Inc.,
4.250%, 03/15/36 (±) | | USD | | | 325 | | | | 342,063 | |
The accompanying notes are an integral part of these financial statements.
Annual Report 13
| Description | | Security
Currency | | Principal
Amount
(000) | | | Fair
Value | |
| | | | | | | | | | | |
| Lazard Enhanced Opportunities Portfolio (continued) | | | | | | | | | | |
| | | | | | | | | | | |
CyberArk Software, Ltd.,
0.000%, 11/15/24 (±) | | USD | | | 90 | | | $ | 109,182 | |
DISH Network Corp.,
0.000%, 12/15/25 (±) | | USD | | | 276 | | | | 277,305 | |
| Encore Capital Group, Inc.: | | | | | | | | | | |
| 2.875%, 03/15/21 (±) | | USD | | | 281 | | | | 279,747 | |
| 3.250%, 03/15/22 (±) | | USD | | | 348 | | | | 377,107 | |
| 3.250%, 10/01/25 (±) | | USD | | | 214 | | | | 250,290 | |
Envestnet, Inc.,
1.750%, 06/01/23 (±) | | USD | | | 171 | | | | 225,867 | |
Envista Holdings Corp.,
2.375%, 06/01/25 (±) | | USD | | | 188 | | | | 326,699 | |
Everbridge, Inc.,
0.125%, 12/15/24 (±) | | USD | | | 179 | | | | 265,746 | |
EZCORP, Inc.,
2.875%, 07/01/24 (±) | | USD | | | 99 | | | | 89,894 | |
FireEye, Inc.,
0.875%, 06/01/24 (±) | | USD | | | 99 | | | | 120,267 | |
Five9, Inc.,
0.500%, 06/01/25 (±) | | USD | | | 43 | | | | 62,464 | |
Flexion Therapeutics, Inc.,
3.375%, 05/01/24 (±) | | USD | | | 273 | | | | 240,923 | |
Fortive Corp.,
0.875%, 02/15/22 (±) | | USD | | | 192 | | | | 197,507 | |
FTI Consulting, Inc.,
2.000%, 08/15/23 (±) | | USD | | | 155 | | | | 193,673 | |
Gossamer Bio, Inc.,
5.000%, 06/01/27 (±) | | USD | | | 97 | | | | 87,380 | |
Guardant Health, Inc.,
0.000%, 11/15/27 (±) | | USD | | | 223 | | | | 260,916 | |
Guess?, Inc.,
2.000%, 04/15/24 (±) | | USD | | | 213 | | | | 236,839 | |
Hannon Armstrong Sustainable Infrastructure Capital, Inc.,
0.000%, 08/15/23 (±) | | USD | | | 173 | | | | 232,909 | |
Health Catalyst, Inc.,
2.500%, 04/15/25 (±) | | USD | | | 171 | | | | 270,242 | |
The accompanying notes are an integral part of these financial statements.
14 Annual Report
| Description | | Security
Currency | | Principal
Amount
(000) | | | Fair
Value | |
| | | | | | | | | | | |
| Lazard Enhanced Opportunities Portfolio (continued) | | | | | | | | | | |
| | | | | | | | | | | |
Helix Energy Solutions Group, Inc.,
6.750%, 02/15/26 (±) | | USD | | | 194 | | | $ | 201,489 | |
Herbalife Nutrition, Ltd.,
2.625%, 03/15/24 (±) | | USD | | | 384 | | | | 409,043 | |
Hope Bancorp, Inc.,
2.000%, 05/15/38 (±) | | USD | | | 238 | | | | 221,419 | |
i3 Verticals LLC,
1.000%, 02/15/25 (±) | | USD | | | 174 | | | | 178,956 | |
II-VI, Inc.,
0.250%, 09/01/22 (±) | | USD | | | 179 | | | | 298,881 | |
IIP Operating Partnership LP,
3.750%, 02/21/24 (±) | | USD | | | 210 | | | | 586,933 | |
Impinj, Inc.,
2.000%, 12/15/26 (#), (±) | | USD | | | 136 | | | | 184,928 | |
Innoviva, Inc.,
2.125%, 01/15/23 (±) | | USD | | | 385 | | | | 382,930 | |
Insmed, Inc.,
1.750%, 01/15/25 (±) | | USD | | | 170 | | | | 190,776 | |
Integra LifeSciences Holdings Corp.,
0.500%, 08/15/25 (±) | | USD | | | 134 | | | | 147,456 | |
Intercept Pharmaceuticals, Inc.,
2.000%, 05/15/26 (±) | | USD | | | 163 | | | | 97,048 | |
| Ironwood Pharmaceuticals, Inc.: | | | | | | | | | | |
| 2.250%, 06/15/22 (±) | | USD | | | 128 | | | | 137,887 | |
| 1.500%, 06/15/26 (±) | | USD | | | 128 | | | | 143,479 | |
| j2 Global, Inc.: | | | | | | | | | | |
| 1.750%, 11/01/26 (±) | | USD | | | 139 | | | | 144,051 | |
| 3.250%, 06/15/29 (±) | | USD | | | 341 | | | | 499,188 | |
Jazz Investments I, Ltd.,
2.000%, 06/15/26 (±) | | USD | | | 174 | | | | 226,436 | |
JPMorgan Chase Financial Co. LLC,
0.250%, 05/01/23 (±) | | USD | | | 341 | | | | 365,723 | |
Kaman Corp.,
3.250%, 05/01/24 (±) | | USD | | | 256 | | | | 294,847 | |
Karyopharm Therapeutics, Inc.,
3.000%, 10/15/25 (±) | | USD | | | 173 | | | | 215,282 | |
The accompanying notes are an integral part of these financial statements.
Annual Report 15
| Description | | Security
Currency | | Principal
Amount
(000) | | | Fair
Value | |
| | | | | | | | | | | |
| Lazard Enhanced Opportunities Portfolio (continued) | | | | | | | | | | |
| | | | | | | | | | | |
KBR, Inc.,
2.500%, 11/01/23 (±) | | USD | | | 268 | | | $ | 366,665 | |
Knowles Corp.,
3.250%, 11/01/21 (±) | | USD | | | 157 | | | | 177,701 | |
LendingTree, Inc.,
0.500%, 07/15/25 (±) | | USD | | | 192 | | | | 186,745 | |
Liberty Broadband Corp.,
1.250%, 09/30/50 (±) | | USD | | | 256 | | | | 258,435 | |
| Liberty Interactive LLC: | | | | | | | | | | |
| 4.000%, 11/15/29 (±) | | USD | | | 251 | | | | 192,159 | |
| 3.750%, 02/15/30 (±) | | USD | | | 42 | | | | 32,418 | |
Liberty Media Corp-Liberty Formula One,
1.000%, 01/30/23 (±) | | USD | | | 172 | | | | 219,170 | |
| Liberty Media Corp.: | | | | | | | | | | |
| 2.125%, 03/31/48 (±) | | USD | | | 261 | | | | 271,579 | |
| 2.250%, 12/01/48 (±) | | USD | | | 214 | | | | 261,050 | |
| 2.750%, 12/01/49 (±) | | USD | | | 256 | | | | 264,064 | |
| 0.500%, 12/01/50 (±) | | USD | | | 122 | | | | 129,396 | |
Ligand Pharmaceuticals, Inc.,
0.750%, 05/15/23 (±) | | USD | | | 188 | | | | 176,905 | |
LivaNova USA, Inc.,
3.000%, 12/15/25 (±) | | USD | | | 58 | | | | 75,835 | |
| Live Nation Entertainment, Inc.: | | | | | | | | | | |
| 2.500%, 03/15/23 (±) | | USD | | | 258 | | | | 333,026 | |
| 2.000%, 02/15/25 (±) | | USD | | | 85 | | | | 89,950 | |
LivePerson, Inc.,
0.750%, 03/01/24 (±) | | USD | | | 155 | | | | 273,499 | |
Lyft, Inc.,
1.500%, 05/15/25 (±) | | USD | | | 134 | | | | 198,516 | |
Marriott Vacations Worldwide Corp.,
1.500%, 09/15/22 (±) | | USD | | | 345 | | | | 390,532 | |
Mesa Laboratories, Inc.,
1.375%, 08/15/25 (±) | | USD | | | 78 | | | | 93,109 | |
MicroStrategy, Inc.,
0.750%, 12/15/25 (±) | | USD | | | 82 | | | | 105,778 | |
MongoDB, Inc.,
0.250%, 01/15/26 (±) | | USD | | | 192 | | | | 345,642 | |
The accompanying notes are an integral part of these financial statements.
16 Annual Report
| Description | | Security
Currency | | Principal
Amount
(000) | | | Fair
Value | |
| | | | | | | | | | | |
| Lazard Enhanced Opportunities Portfolio (continued) | | | | | | | | | | |
| | | | | | | | | | | |
National Vision Holdings, Inc.,
2.500%, 05/15/25 (±) | | USD | | | 201 | | | $ | 324,113 | |
Nevro Corp.,
2.750%, 04/01/25 (±) | | USD | | | 129 | | | | 233,893 | |
NextEra Energy Partners L.P.,
0.000%, 11/15/25 (±) | | USD | | | 170 | | | | 169,629 | |
Nuance Communications, Inc.,
1.000%, 12/15/35 (±) | | USD | | | 165 | | | | 307,094 | |
Nutanix, Inc.,
0.000%, 01/15/23 (±) | | USD | | | 256 | | | | 258,377 | |
| NuVasive, Inc.: | | | | | | | | | | |
| 2.250%, 03/15/21 (±) | | USD | | | 256 | | | | 257,903 | |
| 1.000%, 06/01/23 (±) | | USD | | | 248 | | | | 254,186 | |
| 0.375%, 03/15/25 (±) | | USD | | | 112 | | | | 108,625 | |
Okta, Inc.,
0.375%, 06/15/26 (±) | | USD | | | 167 | | | | 214,056 | |
Omeros Corp.,
5.250%, 02/15/26 (±) | | USD | | | 128 | | | | 135,117 | |
OSI Systems, Inc.,
1.250%, 09/01/22 (±) | | USD | | | 203 | | | | 216,572 | |
Patrick Industries, Inc.,
1.000%, 02/01/23 (±) | | USD | | | 341 | | | | 360,039 | |
PennyMac Corp.,
5.500%, 11/01/24 (±) | | USD | | | 286 | | | | 280,995 | |
Perficient, Inc.,
1.250%, 08/01/25 (±) | | USD | | | 233 | | | | 265,970 | |
PetIQ, Inc.,
4.000%, 06/01/26 (±) | | USD | | | 163 | | | | 247,436 | |
PRA Group, Inc.,
3.500%, 06/01/23 (±) | | USD | | | 254 | | | | 275,533 | |
| PROS Holdings, Inc.: | | | | | | | | | | |
| 1.000%, 05/15/24 (±) | | USD | | | 169 | | | | 178,998 | |
| 2.250%, 09/15/27 (±) | | USD | | | 89 | | | | 125,529 | |
Pure Storage, Inc.,
0.125%, 04/15/23 (±) | | USD | | | 295 | | | | 324,387 | |
Q2 Holdings, Inc.,
0.125%, 11/15/25 (±) | | USD | | | 134 | | | | 149,094 | |
The accompanying notes are an integral part of these financial statements.
Annual Report 17
| Description | | Security
Currency | | Principal
Amount
(000) | | | Fair
Value | |
| | | | | | | | | | | |
| Lazard Enhanced Opportunities Portfolio (continued) | | | | | | | | | | |
| | | | | | | | | | | |
Radius Health, Inc.,
3.000%, 09/01/24 (±) | | USD | | | 119 | | | $ | 106,367 | |
Rambus, Inc.,
1.375%, 02/01/23 (±) | | USD | | | 179 | | | | 201,163 | |
Redfin Corp.,
0.000%, 10/15/25 (±) | | USD | | | 235 | | | | 280,860 | |
Redwood Trust, Inc.,
4.750%, 08/15/23 (±) | | USD | | | 389 | | | | 366,808 | |
Revance Therapeutics, Inc.,
1.750%, 02/15/27 (±) | | USD | | | 175 | | | | 196,263 | |
RH,
0.000%, 09/15/24 (±) | | USD | | | 165 | | | | 360,377 | |
Royal Caribbean Cruises, Ltd.,
2.875%, 11/15/23 (±) | | USD | | | 215 | | | | 256,925 | |
Sailpoint Technologies Holdings, Inc.,
0.125%, 09/15/24 (±) | | USD | | | 196 | | | | 381,683 | |
Shift4 Payments, Inc.,
0.000%, 12/15/25 (±) | | USD | | | 107 | | | | 130,570 | |
Slack Technologies, Inc.,
0.500%, 04/15/25 (±) | | USD | | | 78 | | | | 114,408 | |
SMART Global Holdings, Inc.,
2.250%, 02/15/26 (±) | | USD | | | 194 | | | | 220,011 | |
Snap, Inc.,
0.250%, 05/01/25 (±) | | USD | | | 134 | | | | 315,555 | |
SolarEdge Technologies, Inc.,
0.000%, 09/15/25 (±) | | USD | | | 99 | | | | 136,083 | |
Splunk, Inc.,
1.125%, 06/15/27 (±) | | USD | | | 268 | | | | 278,547 | |
Stride, Inc.,
1.125%, 09/01/27 (±) | | USD | | | 184 | | | | 149,306 | |
Synaptics, Inc.,
0.500%, 06/15/22 (±) | | USD | | | 179 | | | | 246,820 | |
Tabula Rasa HealthCare, Inc.,
1.750%, 02/15/26 (±) | | USD | | | 155 | | | | 147,281 | |
TechTarget, Inc.,
0.125%, 12/15/25 (±) | | USD | | | 201 | | | | 218,054 | |
The accompanying notes are an integral part of these financial statements.
18 Annual Report
| Description | | Security
Currency | | Principal
Amount
(000) | | | | Fair
Value | |
| | | | | | | | | | | |
| Lazard Enhanced Opportunities Portfolio (continued) | | | | | | | | | | |
| | | | | | | | | | | |
The Chefs’ Warehouse, Inc.,
1.875%, 12/01/24 (±) | | USD | | | 43 | | | $ | 41,351 | |
The Greenbrier Cos., Inc.,
2.875%, 02/01/24 (±) | | USD | | | 187 | | | | 188,958 | |
The Marcus Corp.,
5.000%, 09/15/25 (±) | | USD | | | 107 | | | | 153,461 | |
The Middleby Corp.,
1.000%, 09/01/25 (±) | | USD | | | 134 | | | | 163,648 | |
Turning Point Brands, Inc.,
2.500%, 07/15/24 (±) | | USD | | | 283 | | | | 318,187 | |
Uber Technologies, Inc.,
0.000%, 12/15/25 (±) | | USD | | | 212 | | | | 216,884 | |
Under Armour, Inc.,
1.500%, 06/01/24 (±) | | USD | | | 112 | | | | 184,614 | |
Varex Imaging Corp.,
4.000%, 06/01/25 (±) | | USD | | | 102 | | | | 107,430 | |
Verint Systems, Inc.
1.500%, 06/01/21 (±) | | USD | | | 235 | | | | 257,691 | |
Vishay Intertechnology, Inc.,
2.250%, 06/15/25 (±) | | USD | | | 256 | | | | 266,649 | |
Wayfair, Inc.,
0.625%, 10/01/25 (±) | | USD | | | 201 | | | | 189,670 | |
Winnebago Industries, Inc.,
1.500%, 04/01/25 (±) | | USD | | | 175 | | | | 207,250 | |
Workiva, Inc.,
1.125%, 08/15/26 (±) | | USD | | | 100 | | | | 133,676 | |
Zillow Group, Inc.,
1.500%, 07/01/23 (±) | | USD | | | 222 | | | | 377,439 | |
Zogenix, Inc.,
2.750%, 10/01/27 (±) | | USD | | | 139 | | | | 153,189 | |
Zscaler, Inc.,
0.125%, 07/01/25 (±) | | USD | | | 179 | | | | 266,087 | |
| | | | | | | | | | 30,995,149 | |
Total Convertible Corporate Bonds
(Cost $29,658,161) | | | | | | | | | 34,185,124 | |
The accompanying notes are an integral part of these financial statements.
Annual Report 19
| Description | | Counterparty | | Number of
Contracts | | | Exercise
Price | | | Notional
Amount | | | Fair
Value | |
| | | | | | | | | | | | | | | | | | | |
| Lazard Enhanced Opportunities Portfolio (continued) | | | | | | | | | | | | | | | | | | |
| | | | | | | | | | | | | | | | | | | |
| Purchased Options | 0.0% | | | | | | | | | | | | | | | | | | |
| | | | | | | | | | | | | | | | | | | |
| Call | | | | | | | | | | | | | | | | | | |
Cinemark Holdings, Inc.
Expires 02/19/21 | | MSC | | | 8 | | | $ | 20 | | | $ | 800 | | | $ | 1,096 | |
II-VI, Inc.
Expires 01/15/21 | | MSC | | | 1 | | | | 75 | | | | 100 | | | | 345 | |
Marcus Corp.
Expires 02/19/21 | | MSC | | | 8 | | | | 18 | | | | 800 | | | | 400 | |
On Semiconductor Corp
Expires 01/29/21 | | MSC | | | 4 | | | | 35 | | | | 400 | | | | 280 | |
Sabre Corp.
Expires 02/19/21 | | MSC | | | 8 | | | | 15 | | | | 800 | | | | 296 | |
| | | | | | | | | | | | | | | | | |
| Put | | | | | | | | | | | | | | | | | | |
American Airlines Group, Inc.
Expires 01/15/21 | | MSC | | | 8 | | | | 12 | | | | 800 | | | | 48 | |
American Airlines Group, Inc.
Expires 01/15/21 | | MSC | | | 8 | | | | 13 | | | | 800 | | | | 88 | |
Ishares 7-10 year Treasury Bond
Expires 02/19/21 | | MSC | | | 49 | | | | 117 | | | | 4,900 | | | | 1,029 | |
Marcus Corp.
Expires 01/15/21 | | MSC | | | 9 | | | | 10 | | | | 900 | | | | 90 | |
Total Purchased Options
(Cost $4,647) | | | | | | | | | | | | | | | | | 3,672 | |
| Description | | Shares | | | Fair
Value | |
| |
| Short-Term Investments | 13.5% | | | | | | | | |
| | | | | | | | | |
State Street Institutional Treasury Money Market Fund, Premier Class,
0.01% (7 day yield)
(Cost $2,658,914) | | | 2,658,914 | | | | 2,658,914 | |
The accompanying notes are an integral part of these financial statements.
20 Annual Report
| Description | | Shares | | | Fair
Value | |
| | | | | | | | | |
| Lazard Enhanced Opportunities Portfolio (continued) | | | | | | | | |
| | | | | | | | | |
Total Investments excluding Securities Sold Short | 187.1%
(Cost $32,346,712) | | | | | | $ | 36,875,643 | |
| | | | | | | | | |
| Securities Sold Short | (90.9)% | | | | | | | | |
| | | | | | | | | |
| Common Stocks | (88.5)% | | | | | | | | |
| | | | | | | | | |
| Brazil | (0.2)% | | | | | | | | |
| Gol Linhas Aereas Inteligentes SA ADR | | | (3,352 | ) | | | (32,917 | ) |
| | | | | | | | | |
| Canada | (3.9)% | | | | | | | | |
| Aphria, Inc. | | | (21,309 | ) | | | (147,458 | ) |
| Atlas Corp. | | | (2,589 | ) | | | (28,065 | ) |
| Canadian Solar, Inc. | | | (2,694 | ) | | | (138,040 | ) |
| Canopy Growth Corp. | | | (4,212 | ) | | | (103,637 | ) |
| Colliers International Group, Inc. | | | (2,330 | ) | | | (207,673 | ) |
| Element Fleet Management Corp. | | | (7,926 | ) | | | (83,314 | ) |
| Pretium Resources, Inc. | | | (2,664 | ) | | | (30,583 | ) |
| Shopify, Inc., Class A | | | (33 | ) | | | (37,354 | ) |
| | | | | | | | (776,124 | ) |
| Chile | (0.1)% | | | | | | | | |
| Liberty Latin America, Ltd., Class C | | | (2,140 | ) | | | (23,733 | ) |
| | | | | | | | | |
| Israel | (0.3)% | | | | | | | | |
| Fiverr International, Ltd. | | | (273 | ) | | | (53,262 | ) |
| | | | | | | | | |
| Netherlands | (0.1)% | | | | | | | | |
| Pharming Group NV | | | (12,500 | ) | | | (19,475 | ) |
| | | | | | | | | |
| Norway | (0.0%) | | | | | | | | |
| SFL Corp., Ltd. | | | (1,467 | ) | | | (9,213 | ) |
| | | | | | | | | |
| Panama | (1.4)% | | | | | | | | |
| Copa Holdings SA, Class A | | | (3,518 | ) | | | (271,695 | ) |
The accompanying notes are an integral part of these financial statements.
Annual Report 21
| Description | | Shares | | | Fair
Value | |
| | | | | | | | | |
| Lazard Enhanced Opportunities Portfolio (continued) | | | | | | | | |
| | | | | | | | | |
| United States | (82.5)% | | | | | | | | |
| 1Life Healthcare, Inc. | | | (3,063 | ) | | $ | (133,700 | ) |
| 8x8, Inc. | | | (9,778 | ) | | | (337,048 | ) |
| Aerie Pharmaceuticals, Inc. | | | (1,348 | ) | | | (18,211 | ) |
| Air Transport Services Group, Inc. | | | (4,669 | ) | | | (146,326 | ) |
| Alteryx, Inc., Class A | | | (22 | ) | | | (2,679 | ) |
| American Airlines Group, Inc. | | | (13,056 | ) | | | (205,893 | ) |
| Apellis Pharmaceuticals, Inc. | | | (3,258 | ) | | | (186,358 | ) |
| Arbor Realty Trust, Inc. REIT | | | (4,216 | ) | | | (59,783 | ) |
| Arch Resources, Inc. | | | (2,127 | ) | | | (93,099 | ) |
| Atlas Air Worldwide Holdings, Inc. | | | (3,216 | ) | | | (175,401 | ) |
| Avadel Pharmaceuticals PLC ADR | �� | | (7,643 | ) | | | (51,055 | ) |
| Avaya Holdings Corp. | | | (3,143 | ) | | | (60,188 | ) |
| Bloomin’ Brands, Inc. | | | (13,007 | ) | | | (252,596 | ) |
| Bridgebio Pharma, Inc. | | | (3,265 | ) | | | (232,174 | ) |
| Cardlytics, Inc. | | | (1,125 | ) | | | (160,616 | ) |
| Charter Communications, Inc., Class A | | | (15 | ) | | | (9,923 | ) |
| Cinemark Holdings, Inc. | | | (16,746 | ) | | | (291,548 | ) |
| Coherus Biosciences, Inc. | | | (6,444 | ) | | | (111,997 | ) |
| Collegium Pharmaceutical, Inc. | | | (3,649 | ) | | | (73,089 | ) |
| CONMED Corp. | | | (1,542 | ) | | | (172,704 | ) |
| Coupa Software, Inc. | | | (339 | ) | | | (114,890 | ) |
| CryoPort, Inc. | | | (4,038 | ) | | | (177,187 | ) |
| CSG Systems International, Inc. | | | (1,148 | ) | | | (51,740 | ) |
| CyberArk Software, Ltd. | | | (334 | ) | | | (53,971 | ) |
| DISH Network Corp., Class A | | | (4,384 | ) | | | (141,779 | ) |
| Encore Capital Group, Inc. | | | (8,828 | ) | | | (343,851 | ) |
| Envestnet, Inc. | | | (1,792 | ) | | | (147,464 | ) |
| Envista Holdings Corp. | | | (7,795 | ) | | | (262,925 | ) |
| Everbridge, Inc. | | | (1,290 | ) | | | (192,300 | ) |
| EZCORP, Inc. Class A | | | (4,146 | ) | | | (19,859 | ) |
| FireEye, Inc. | | | (2,917 | ) | | | (67,266 | ) |
| Five9, Inc. | | | (249 | ) | | | (43,426 | ) |
| Flexion Therapeutics, Inc. | | | (4,456 | ) | | | (51,422 | ) |
| FTI Consulting, Inc. | | | (1,035 | ) | | | (115,630 | ) |
| Gossamer Bio, Inc. | | | (5,106 | ) | | | (49,375 | ) |
The accompanying notes are an integral part of these financial statements.
22 Annual Report
| Description | | Shares | | | Fair
Value | |
| | | | | | | | | |
| Lazard Enhanced Opportunities Portfolio (continued) | | | | | | | | |
| | | | | | | | | |
| Guardant Health, Inc. | | | (1,292 | ) | | $ | (166,513 | ) |
| Guess?, Inc. | | | (5,770 | ) | | | (130,517 | ) |
| Hannon Armstrong Sustainable Infrastructure Capital, Inc. REIT | | | (2,684 | ) | | | (170,246 | ) |
| Health Catalyst, Inc. | | | (4,928 | ) | | | (214,516 | ) |
| Helix Energy Solutions Group, Inc. | | | (20,600 | ) | | | (86,520 | ) |
| Herbalife Nutrition, Ltd. | | | (3,305 | ) | | | (158,805 | ) |
| I3 Verticals, Inc., Class A | | | (3,158 | ) | | | (104,846 | ) |
| II-VI, Inc. | | | (3,471 | ) | | | (263,657 | ) |
| Impinj, Inc. | | | (3,553 | ) | | | (148,764 | ) |
| Innovative Industrial Properties, Inc. REIT | | | (2,957 | ) | | | (541,515 | ) |
| Innoviva, Inc. | | | (3,604 | ) | | | (44,654 | ) |
| Insmed, Inc. | | | (2,830 | ) | | | (94,211 | ) |
| Integra LifeSciences Holdings Corp. | | | (903 | ) | | | (58,623 | ) |
| Intercept Pharmaceuticals, Inc. | | | (1,051 | ) | | | (25,960 | ) |
| Ironwood Pharmaceuticals, Inc. | | | (10,499 | ) | | | (119,584 | ) |
| j2 Global, Inc. | | | (5,408 | ) | | | (528,308 | ) |
| Jazz Pharmaceuticals PLC | | | (730 | ) | | | (120,486 | ) |
| Kaman Corp. | | | (1,937 | ) | | | (110,661 | ) |
| Karyopharm Therapeutics, Inc. | | | (8,081 | ) | | | (125,094 | ) |
| KBR, Inc. | | | (8,231 | ) | | | (254,585 | ) |
| Knowles Corp. | | | (2,897 | ) | | | (53,392 | ) |
| Liberty Media Corp-Liberty Formula One, Class C | | | (3,491 | ) | | | (148,717 | ) |
| Liberty Media Corp.-Liberty SiriusXM, Class A | | | (5,681 | ) | | | (245,362 | ) |
| Ligand Pharmaceuticals, Inc. | | | (155 | ) | | | (15,415 | ) |
| LivaNova PLC | | | (727 | ) | | | (48,135 | ) |
| Live Nation Entertainment, Inc. | | | (5,810 | ) | | | (426,919 | ) |
| LivePerson, Inc. | | | (3,482 | ) | | | (216,685 | ) |
| Lyft, Inc., Class A | | | (2,809 | ) | | | (138,006 | ) |
| Marriott Vacations Worldwide Corp. | | | (1,334 | ) | | | (183,051 | ) |
| Mesa Laboratories, Inc. | | | (218 | ) | | | (62,487 | ) |
| MicroStrategy, Inc., Class A | | | (158 | ) | | | (61,391 | ) |
| MongoDB, Inc. | | | (783 | ) | | | (281,128 | ) |
| National Vision Holdings, Inc. | | | (5,763 | ) | | | (261,006 | ) |
| Nevro Corp. | | | (1,079 | ) | | | (186,775 | ) |
| NextEra Energy Partners L.P. | | | (781 | ) | | | (52,366 | ) |
The accompanying notes are an integral part of these financial statements.
Annual Report 23
| Description | | Shares | | | Fair
Value | |
| | | | | | | | | |
| Lazard Enhanced Opportunities Portfolio (continued) | | | | | | | | |
| | | | | | | | | |
| Nuance Communications, Inc. | | | (6,277 | ) | | $ | (276,753 | ) |
| Nutanix, Inc., Class A | | | (1,246 | ) | | | (39,710 | ) |
| NuVasive, Inc. | | | (1,632 | ) | | | (91,931 | ) |
| Okta, Inc. | | | (536 | ) | | | (136,283 | ) |
| Omeros Corp. | | | (5,874 | ) | | | (83,910 | ) |
| OSI Systems, Inc. | | | (850 | ) | | | (79,237 | ) |
| Patrick Industries, Inc. | | | (1,942 | ) | | | (132,736 | ) |
| PennyMac Mortgage Investment Trust REIT | | | (2,736 | ) | | | (48,126 | ) |
| Perficient, Inc. | | | (3,283 | ) | | | (156,435 | ) |
| PetIQ, Inc. | | | (4,677 | ) | | | (179,831 | ) |
| PRA Group, Inc. | | | (2,694 | ) | | | (106,844 | ) |
| PROS Holdings, Inc. | | | (3,482 | ) | | | (176,781 | ) |
| Pure Storage, Inc., Class A | | | (5,498 | ) | | | (124,310 | ) |
| Q2 Holdings, Inc. | | | (357 | ) | | | (45,171 | ) |
| Radius Health, Inc. | | | (1,356 | ) | | | (24,218 | ) |
| Rambus, Inc. | | | (5,346 | ) | | | (93,341 | ) |
| Redfin Corp. | | | (1,886 | ) | | | (129,436 | ) |
| Redwood Trust, Inc. REIT | | | (1,870 | ) | | | (16,419 | ) |
| Revance Therapeutics, Inc. | | | (4,452 | ) | | | (126,170 | ) |
| RH | | | (728 | ) | | | (325,795 | ) |
| Royal Caribbean Cruises, Ltd. | | | (1,925 | ) | | | (143,778 | ) |
| SailPoint Technologies Holding, Inc. | | | (6,250 | ) | | | (332,750 | ) |
| Shift4 Payments, Inc., Class A | | | (648 | ) | | | (48,859 | ) |
| Sirius XM Holdings, Inc. | | | (25,657 | ) | | | (163,435 | ) |
| Slack Technologies, Inc., Class A | | | (1,469 | ) | | | (62,051 | ) |
| SMART Global Holdings, Inc. | | | (3,925 | ) | | | (147,698 | ) |
| Snap, Inc., Class A | | | (5,772 | ) | | | (289,004 | ) |
| SolarEdge Technologies, Inc. | | | (271 | ) | | | (86,482 | ) |
| Splunk, Inc. | | | (341 | ) | | | (57,932 | ) |
| Stride, Inc. | | | (1,704 | ) | | | (36,176 | ) |
| Synaptics, Inc. | | | (1,634 | ) | | | (157,518 | ) |
| Tabula Rasa HealthCare, Inc. | | | (1,330 | ) | | | (56,977 | ) |
| TechTarget, Inc. | | | (1,051 | ) | | | (62,125 | ) |
| The Greenbrier Cos., Inc. | | | (943 | ) | | | (34,306 | ) |
| The Marcus Corp. | | | (8,261 | ) | | | (111,358 | ) |
| The Middleby Corp. | | | (605 | ) | | | (77,997 | ) |
The accompanying notes are an integral part of these financial statements.
24 Annual Report
| Description | | Shares | | | Fair
Value | |
| | | | | | | | | |
| Lazard Enhanced Opportunities Portfolio (continued) | | | | | | | | |
| | | | | | | | | |
| Turning Point Brands, Inc. | | | (3,505 | ) | | $ | (156,183 | ) |
| Uber Technologies, Inc. | | | (1,021 | ) | | | (52,071 | ) |
| Under Armour, Inc., Class C | | | (9,666 | ) | | | (143,830 | ) |
| Varex Imaging Corp. | | | (3,708 | ) | | | (61,849 | ) |
| Verint Systems, Inc. | | | (2,005 | ) | | | (134,696 | ) |
| Vishay Intertechnology, Inc. | | | (1,011 | ) | | | (20,938 | ) |
| Voya Financial, Inc. | | | (1,513 | ) | | | (88,980 | ) |
| Wayfair, Inc., Class A | | | (288 | ) | | | (65,033 | ) |
| Winnebago Industries, Inc. | | | (2,022 | ) | | | (121,199 | ) |
| Workiva, Inc. | | | (1,012 | ) | | | (92,719 | ) |
| Zillow Group, Inc. Class C | | | (2,496 | ) | | | (323,981 | ) |
| Zogenix, Inc. | | | (4,502 | ) | | | (89,995 | ) |
| Zscaler, Inc. | | | (932 | ) | | | (186,130 | ) |
| | | | | | | | (16,255,860 | ) |
| | | | | | | | | |
Total Common Stocks
(Proceeds $14,167,637) | | | | | | | (17,442,279 | ) |
| | | | | | | | | |
| Exchange-Traded Fund | (2.4)% | | | | | | | | |
| | | | | | | | | |
| United States | (2.4)% | | | | | | | | |
| iShares 7-10 Year Treasury Bond ETF | | | (3,936 | ) | | | (472,123 | ) |
| | | | | | | | | |
Total Exchange-Traded Funds
(Proceeds $471,363) | | | | | | | (472,123 | ) |
| | | | | | | | | |
Total Securities Sold Short
(Proceeds $14,639,000) | | | | | | | (17,914,402 | ) |
| | | | | | | | | |
Total Investments | 96.2%
(Cost and short proceeds $17,707,712) (») | | | | | | $ | 18,961,241 | |
| | | | | | | | | |
| Cash and Other Assets in Excess of Liabilities | 3.8% | | | | | | | 743,758 | |
| | | | | | | | | |
| Net Assets | 100.0% | | | | | | $ | 19,704,999 | |
The accompanying notes are an integral part of these financial statements.
Annual Report 25
Lazard Enhanced Opportunities Portfolio (concluded)
Forward Currency Contracts open at December 31, 2020:
Currency
Purchased | | Quantity | | Currency
Sold | | Quantity | | Counterparty | | Settlement
Date | | Unrealized
Appreciation | |
| | | | | | | | | | | | | | | | | |
| EUR | | 201,000 | | USD | | 245,132 | | SSB | | 03/25/21 | | | $ | 863 | | |
| USD | | 208,250 | | CAD | | 265,000 | | SSB | | 03/25/21 | | | | 18 | | |
| USD | | 342,901 | | EUR | | 279,000 | | SSB | | 03/25/21 | | | | 1,446 | | |
| Total gross unrealized appreciation on Forward Currency Contracts | | | | | $ | 2,327 | | |
Written Options open at December 31, 2020:
| Description | | Counterparty | | Number
of
Contracts | | Strike
Price | | | Expiration
Date | | Notional
Amount | | | Premiums | | | Fair
Value | |
| | | | | | | | | | | | | | | | | | | | | | | | | | |
| Put | | | | | | | | | | | | | | | | | | | | | | | | | |
| Cinemark Holdings, Inc. | | MSC | | | 8 | | | $ | 15.00 | | | 02/19/21 | | $ | 800 | | | | $ | 802 | | | $ | (840 | ) |
| Synaptic, Inc. | | MSC | | | 6 | | | | 70.00 | | | 02/19/21 | | | 600 | | | | | 728 | | | | (600 | ) |
| Verint Systems, Inc. | | MSC | | | 2 | | | | 55.00 | | | 02/19/21 | | | 200 | | | | | 142 | | | | (100 | ) |
| Verint Systems, Inc. | | MSC | | | 3 | | | | 60.00 | | | 02/19/21 | | | 300 | | | | | 507 | | | | (330 | ) |
| Total Written Options | | | | | 19 | | | | | | | | | | | | | | $ | 2,179 | | | $ | (1,870 | ) |
The accompanying notes are an integral part of these financial statements.
26 Annual Report
The Lazard Funds, Inc. Notes to Portfolio of Investments
December 31, 2020
| (*) | | Non-income producing security. |
| (‡) | | Security valued using Level 2 inputs, based on reference to a similar security which was trading on an active market, under GAAP hierarchy - see Note 9 in the Notes to Financial Statements. |
| (±) | | Some or all of this security position has been pledged to cover collateral requirements on securities sold short. |
| (#) | | Pursuant to Rule 144A under the Securities Act of 1933, these securities may only be traded among “qualified institutional buyers.” At December 31, 2020, these securities amounted to 5.3% of net assets. |
| (») | | The Portfolio, at all times, maintains portfolio securities in sufficient amount to cover its obligations related to investments in forward currency contracts. |
Security Abbreviations:
| ADR | — | American Depositary Receipt |
| ETF | — | Exchange-Traded Fund |
| REIT | — | Real Estate Investment Trust |
Currency Abbreviations:
| EUR | — | Euro | | CAD | — | Canadian Dollar |
| USD | — | United States Dollar | | | | |
Counterparty Abbreviations:
| MSC | — | Morgan Stanley & Co. Inc. |
| SSB | — | State Street Bank and Trust Co. |
Portfolio holdings by industry (as a percentage of net assets), for the Portfolio previously presented by country:
| Industry† | | Long | | | Short | | |
| | | | | | | | | | |
| Common Stocks and Convertible Corporate Bonds | | | | | | | | | |
| Aerospace & Defense | | | 1.5 | % | | | –0.6 | % | |
| Air Freight & Logistics | | | 3.6 | | | | –1.6 | | |
| Airlines | | | 3.8 | | | | –2.6 | | |
| Auto Components | | | 1.8 | | | | –0.7 | | |
| Automobiles | | | 1.1 | | | | –0.6 | | |
| Banks | | | 1.2 | | | | — | | |
| Biotechnology | | | 11.3 | | | | –5.4 | | |
| Capital Markets | | | 1.9 | | | | — | | |
| Consumer Finance | | | 7.4 | | | | –2.4 | | |
| Diversified Consumer Services | | | 0.8 | | | | –0.2 | | |
| Diversified Financial Services | | | 1.7 | | | | –0.9 | | |
| Diversified Telecommunication Services | | | 0.5 | | | | –0.1 | | |
| Electronic Equipment, Instruments & Components | | | 4.9 | | | | –2.1 | | |
| Energy Equipment & Services | | | 1.0 | | | | –0.4 | | |
| Entertainment | | | 4.8 | | | | –5.0 | | |
| Equity Real Estate Investment Trusts (REITs) | | | 3.0 | | | | –2.7 | | |
| Food & Staples Retailing | | | 0.2 | | | | — | | |
The accompanying notes are an integral part of these financial statements.
Annual Report 27
| Industry† | | Long | | | Short | | |
| | | | | | | | | | |
| Common Stocks and Convertible Corporate Bonds (continued) | | | | | | | | | |
| Health Care Equipment & Supplies | | | 10.5 | % | | | –5.7 | % | |
| Health Care Providers & Services | | | 3.7 | | | | –2.4 | | |
| Health Care Technology | | | 2.1 | | | | –1.4 | | |
| Hotels, Restaurants & Leisure | | | 4.9 | | | | –2.9 | | |
| Independent Power & Renewable Electricity Producers | | | 0.9 | | | | –0.3 | | |
| Interactive Media & Services | | | 4.0 | | | | –3.1 | | |
| Internet & Direct Marketing Retail | | | 1.0 | | | | –0.6 | | |
| IT Services | | | 10.1 | | | | –5.4 | | |
| Machinery | | | 2.8 | | | | –0.6 | | |
| Marine | | | — | | | | –0.1 | | |
| Media | | | 11.8 | | | | –4.0 | | |
| Metals & Mining | | | 0.8 | | | | –0.2 | | |
| Mortgage Real Estate Investment Trusts (REITs) | | | 6.0 | | | | –1.5 | | |
| Oil, Gas & Consumable Fuels | | | 2.6 | | | | –0.5 | | |
| Personal Products | | | 2.1 | | | | –0.8 | | |
| Pharmaceuticals | | | 11.4 | | | | –4.4 | | |
| Professional Services | | | 1.0 | | | | –0.6 | | |
| Real Estate Management & Development | | | 3.7 | | | | –1.7 | | |
| Road & Rail | | | 2.1 | | | | –1.0 | | |
| Semiconductors & Semiconductor Equipment | | | 6.0 | | | | –3.9 | | |
| Software | | | 26.8 | | | | –16.4 | | |
| Specialty Retail | | | 4.7 | | | | –3.6 | | |
| Technology Hardware, Storage & Peripherals | | | 1.6 | | | | –0.6 | | |
| Textiles, Apparel & Luxury Goods | | | 0.9 | | | | –0.7 | | |
| Tobacco | | | 1.6 | | | | –0.8 | | |
| Subtotal | | | 173.6 | | | | –88.5 | | |
| Exchange Traded Funds | | | — | | | | –2.4 | | |
| Short-Term Investments | | | 13.5 | | | | — | | |
| Total Investments | | | 187.1 | % | | | –90.9 | % | |
| † | Industry classifications may be different than those used for compliance monitoring purposes. |
The accompanying notes are an integral part of these financial statements.
28 Annual Report
The Lazard Funds, Inc. Statement of Assets and Liabilities
| December 31, 2020 | Lazard
Enhanced
Opportunities
Portfolio | |
| ASSETS | | | | |
| Investments in securities, at fair value | | $ | 36,875,643 | |
| Cash | | | 3,998 | |
| Receivables for: | | | | |
| Investments sold | | | 1,720,697 | |
| Dividends and interest | | | 155,935 | |
| Capital stock sold | | | 15,000 | |
| Cash collateral due from broker on options | | | 83,000 | |
| Amount due from Investment Manager (Note 3) | | | 13,664 | |
| Gross unrealized appreciation on forward currency contracts | | | 2,327 | |
| Total assets | | | 38,870,264 | |
| | | | | |
| LIABILITIES | | | | |
| Securities sold short, at fair value | | | 17,914,402 | |
| Foreign currency due to custodian | | | 2,602 | |
| Payables for: | | | | |
| Accrued custodian fees | | | 52,457 | |
| Accrued professional services | | | 32,285 | |
| Accrued directors’ fees | | | 64 | |
| Investments purchased | | | 1,142,230 | |
| Dividends on securities sold short | | | 8,471 | |
| Written options, at fair value | | | 1,870 | |
| Other accrued expenses and payables | | | 10,884 | |
| Total liabilities | | | 19,165,265 | |
| Net assets | | $ | 19,704,999 | |
| | | | | |
| NET ASSETS | | | | |
| Paid in capital | | $ | 19,716,851 | |
| Distributable earnings (Accumulated loss) | | | (11,852 | ) |
| Net assets | | $ | 19,704,999 | |
| Institutional Shares | | | | |
| Net assets | | $ | 19,537,447 | |
| Shares of capital stock outstanding* | | | 2,140,850 | |
| Net asset value, offering and redemption price per share | | $ | 9.13 | |
| | | | | |
| Open Shares | | | | |
| Net assets | | $ | 167,552 | |
| Shares of capital stock outstanding* | | | 18,359 | |
| Net asset value, offering and redemption price per share | | $ | 9.13 | |
| Cost of investments in securities | | $ | 32,346,712 | |
| Proceeds received from securities sold short | | $ | 14,639,000 | |
| Proceeds received from written options | | $ | 2,179 | |
| * $0.001 par value, 6,900,000,000 shares authorized for the Portfolios in total. |
The accompanying notes are an integral part of these financial statements.
Annual Report 29
The Lazard Funds, Inc. Statement of Operations
| For the Year Ended December 31, 2020 | Lazard
Enhanced
Opportunities
Portfolio | |
| Investment Income (Loss) | | | | |
| | | | | |
| Income | | | | |
| Interest | | $ | 576,257 | |
| Dividends | | | 4,440 | |
| Total investment income* | | | 580,697 | |
| | | | | |
| Expenses | | | | |
| Management fees (Note 3) | | | 124,144 | |
| Custodian fees | | | 91,331 | |
| Professional services | | | 49,567 | |
| Registration fees | | | 36,146 | |
| Administration fees | | | 25,865 | |
| Shareholders’ reports | | | 24,837 | |
| Shareholders’ services | | | 9,259 | |
| Directors’ fees and expenses | | | 5,541 | |
| Distribution fees (Open Shares) | | | 1,012 | |
| Other | | | 6,535 | |
| Total gross expenses before expenses on securities sold short | | | 374,237 | |
| Broker expense on securities sold short | | | 89,524 | |
| Dividend expense on securities sold short | | | 38,129 | |
| Total gross expenses | | | 501,890 | |
| Management fees waived and expenses reimbursed | | | (209,374 | ) |
| Total net expenses | | | 292,516 | |
| Net investment income (loss) | | | 288,181 | |
| | | | | |
| Net Realized and Unrealized Gain (Loss) | | | | |
| Net realized gain (loss) on: | | | | |
| Investments | | | 2,271,862 | |
| Securities sold short | | | (2,077,543 | ) |
| Foreign currency transactions | | | (3,978 | ) |
| Forward currency contracts | | | (8,786 | ) |
| Futures contracts | | | 35,174 | |
| Written options | | | 20,920 | |
| Total net realized gain (loss) | | | 237,649 | |
| Net change in unrealized appreciation (depreciation) on: | | | | |
| Investments | | | 4,277,873 | |
| Securities sold short | | | (2,910,199 | ) |
| Foreign currency translations | | | 71 | |
| Forward currency contracts | | | 4,141 | |
| Written options | | | 530 | |
| Total net change in unrealized appreciation (depreciation) | | | 1,372,416 | |
| Net realized and unrealized gain (loss) | | | 1,610,065 | |
| Net increase (decrease) in net assets resulting from operations | | $ | 1,898,246 | |
| * Net of foreign withholding taxes of | | $ | 11 | |
The accompanying notes are an integral part of these financial statements.
30 Annual Report
The Lazard Funds, Inc. Statement of Changes in Net Assets
| | | Lazard
Enhanced Opportunities Portfolio | |
| | | Year Ended
December 31, 2020 | | | Year Ended
December 31, 2019 | |
| Increase in Net Assets | | | | | | | | | | |
| | | | | | | | | | | |
| Operations | | | | | | | | | | |
| Net investment income (loss) | | | $ | 288,181 | | | | $ | 123,402 | |
| Net realized gain (loss) | | | | 237,649 | | | | | 205,536 | |
| Net change in unrealized appreciation (depreciation) | | | | 1,372,416 | | | | | 473,630 | |
| Net increase (decrease) in net assets resulting from operations | | | | 1,898,246 | | | | | 802,568 | |
| | | | | | | | | | | |
| Distributions to shareholders (Note 2(h)) | | | | | | | | | | |
| Net investment income and net realized gains | | | | | | | | | | |
| Institutional Shares | | | | (1,185,411 | ) | | | | (90,507 | ) |
| Open Shares | | | | (9,395 | ) | | | | (1,247 | ) |
| Net decrease in net assets resulting from distributions | | | | (1,194,806 | ) | | | | (91,754 | ) |
| | | | | | | | | | | |
| Capital stock transactions | | | | | | | | | | |
| Net proceeds from sales | | | | | | | | | | |
| Institutional Shares | | | | 11,095,505 | | | | | 1,320,608 | |
| Open Shares | | | | 3,369,722 | | | | | 42,717 | |
| Net proceeds from reinvestment of distributions | | | | | | | | | | |
| Institutional Shares | | | | 1,185,411 | | | | | 90,507 | |
| Open Shares | | | | 9,395 | | | | | 1,247 | |
| Cost of shares redeemed | | | | | | | | | | |
| Institutional Shares | | | | (2,567,231 | ) | | | | (9,075,438 | ) |
| Open Shares | | | | (3,436,893 | ) | | | | (33,358 | ) |
| Net increase (decrease) in net assets from capital stock transactions | | | | 9,655,909 | | | | | (7,653,717 | ) |
| Total increase (decrease) in net assets | | | | 10,359,349 | | | | | (6,942,903 | ) |
| Net assets at beginning of period | | | | 9,345,650 | | | | | 16,288,553 | |
| Net assets at end of period | | | $ | 19,704,999 | | | | $ | 9,345,650 | |
The accompanying notes are an integral part of these financial statements.
Annual Report 31
| | | Lazard
Enhanced Opportunities Portfolio | |
| | | Year Ended
December 31, 2020 | | | Year Ended
December 31, 2019 | |
| Shares issued and redeemed | | | | | | | | | | |
| | | | | | | | | | | |
| Institutional Shares | | | | | | | | | | |
| Shares outstanding at beginning of period | | | | 1,043,282 | | | | | 1,948,553 | |
| Shares sold | | | | 1,253,802 | | | | | 155,988 | |
| Shares issued to shareholders from reinvestment of distributions | | | | 130,284 | | | | | 10,308 | |
| Shares redeemed | | | | (286,518 | ) | | | | (1,071,567 | ) |
| Net increase (decrease) | | | | 1,097,568 | | | | | (905,271 | ) |
| Shares outstanding at end of period | | | | 2,140,850 | | | | | 1,043,282 | |
| | | | | | | | | | | |
| Open Shares | | | | | | | | | | |
| Shares outstanding at beginning of period | | | | 13,910 | | | | | 12,624 | |
| Shares sold | | | | 402,978 | | | | | 4,922 | |
| Shares issued to shareholders from reinvestment of distributions | | | | 1,035 | | | | | 142 | |
| Shares redeemed | | | | (399,564 | ) | | | | (3,778 | ) |
| Net increase (decrease) | | | | 4,449 | | | | | 1,286 | |
| Shares outstanding at end of period | | | | 18,359 | | | | | 13,910 | |
The accompanying notes are an integral part of these financial statements.
32 Annual Report
The Lazard Funds, Inc. Financial Highlights
LAZARD ENHANCED OPPORTUNITIES PORTFOLIO
Selected data for a share
of capital stock outstanding | Year Ended | |
| throughout each period | 12/31/20 | | 12/31/19 | | 12/31/18 | | 12/31/17 | | 12/31/16 | |
| Institutional Shares | | | | | | | | | | | | | | | | | | | | |
| Net asset value, beginning of period | | $ | 8.84 | | | $ | 8.31 | | | $ | 8.67 | | | $ | 9.16 | | | $ | 8.89 | |
| Income (Loss) from investment operations: | | | | | | | | | | | | | | | | | | | | |
| Net investment income (loss) (a) | | | 0.20 | | | | 0.10 | | | | 0.06 | | | | 0.11 | ^ | | | 0.05 | |
| Net realized and unrealized gain (loss) | | | 0.69 | | | | 0.52 | | | | (0.20 | ) | | | 0.40 | | | | 0.35 | |
| Total from investment operations | | | 0.89 | | | | 0.62 | | | | (0.14 | ) | | | 0.51 | | | | 0.40 | |
| Less distributions from: | | | | | | | | | | | | | | | | | | | | |
| Net investment income | | | (0.22 | ) | | | — | | | | (0.10 | ) | | | (0.17 | ) | | | (0.08 | ) |
| Net realized gains | | | (0.38 | ) | | | (0.09 | ) | | | (0.12 | ) | | | (0.83 | ) | | | (0.05 | ) |
| Total distributions | | | (0.60 | ) | | | (0.09 | ) | | | (0.22 | ) | | | (1.00 | ) | | | (0.13 | ) |
| Net asset value, end of period | | $ | 9.13 | | | $ | 8.84 | | | $ | 8.31 | | | $ | 8.67 | | | $ | 9.16 | |
| Total Return (b) | | | 10.11 | % | | | 7.44 | % | | | –1.66 | % | | | 5.56 | %^ | | | 4.50 | % |
| | | | | | | | | | | | | | | | | | | | | |
| Ratios and Supplemental Data: | | | | | | | | | | | | | | | | | | | | |
| Net assets, end of period (in thousands) | | $ | 19,537 | | | $ | 9,223 | | | $ | 16,184 | | | $ | 15,206 | | | $ | 14,077 | |
| Ratios to average net assets: | | | | | | | | | | | | | | | | | | | | |
| Net expenses | | | 2.23 | % | | | 2.71 | % | | | 2.36 | % | | | 2.78 | %^ | | | 1.79 | % |
| Gross expenses | | | 3.79 | % | | | 5.52 | % | | | 3.80 | % | | | 5.02 | %^ | | | 3.60 | % |
| Gross expenses, excluding expenses on securities sold short | | | 2.82 | % | | | 4.06 | % | | | 2.71 | % | | | 3.45 | % | | | 3.51 | % |
| Net investment income (loss) | | | 2.22 | % | | | 1.19 | % | | | 0.73 | % | | | 1.20 | % | | | 0.57 | % |
| Portfolio turnover rate: | | | | | | | | | | | | | | | | | | | | |
| Excluding securities sold short | | | 167 | % | | | 272 | % | | | 312 | % | | | 210 | % | | | 247 | % |
| Including securities sold short | | | 241 | % | | | 354 | % | | | 409 | % | | | 310 | % | | | 340 | % |
The accompanying notes are an integral part of these financial statements.
Annual Report 33
Selected data for a share
of capital stock outstanding | Year Ended | |
| throughout each period | 12/31/20 | | 12/31/19 | | 12/31/18 | | 12/31/17 | | 12/31/16 | |
| Open Shares | | | | | | | | | | | | | | | | | | | | |
| Net asset value, beginning of period | | $ | 8.82 | | | $ | 8.30 | | | $ | 8.65 | | | $ | 9.15 | | | $ | 8.89 | |
| Income (Loss) from investment operations: | | | | | | | | | | | | | | | | | | | | |
| Net investment income (loss) (a) | | | 0.16 | | | | 0.10 | | | | 0.04 | | | | 0.10 | ^ | | | 0.04 | |
| Net realized and unrealized gain (loss) | | | 0.70 | | | | 0.51 | | | | (0.19 | ) | | | 0.37 | | | | 0.33 | |
| Total from investment operations | | | 0.86 | | | | 0.61 | | | | (0.15 | ) | | | 0.47 | | | | 0.37 | |
| Less distributions from: | | | | | | | | | | | | | | | | | | | | |
| Net investment income | | | (0.17 | ) | | | — | | | | (0.08 | ) | | | (0.14 | ) | | | (0.06 | ) |
| Net realized gains | | | (0.38 | ) | | | (0.09 | ) | | | (0.12 | ) | | | (0.83 | ) | | | (0.05 | ) |
| Total distributions | | | (0.55 | ) | | | (0.09 | ) | | | (0.20 | ) | | | (0.97 | ) | | | (0.11 | ) |
| Net asset value, end of period | | $ | 9.13 | | | $ | 8.82 | | | $ | 8.30 | | | $ | 8.65 | | | $ | 9.15 | |
| Total Return (b) | | | 9.83 | % | | | 7.33 | % | | | –1.80 | % | | | 5.16 | %^ | | | 4.13 | % |
| | | | | | | | | | | | | | | | | | | | | |
| Ratios and Supplemental Data: | | | | | | | | | | | | | | | | | | | | |
| Net assets, end of period (in thousands) | | $ | 168 | | | $ | 123 | | | $ | 105 | | | $ | 117 | | | $ | 112 | |
| Ratios to average net assets: | | | | | | | | | | | | | | | | | | | | |
| Net expenses | | | 2.45 | % | | | 2.83 | % | | | 2.60 | % | | | 3.01 | %^ | | | 2.07 | % |
| Gross expenses | | | 4.94 | % | | | 13.76 | % | | | 14.49 | % | | | 16.40 | %^ | | | 15.58 | % |
| Gross expenses, excluding expenses on securities sold short | | | 3.99 | % | | | 12.30 | % | | | 13.40 | % | | | 14.85 | % | | | 15.46 | % |
| Net investment income (loss) | | | 1.75 | % | | | 1.10 | % | | | 0.48 | % | | | 1.06 | % | | | 0.45 | % |
| Portfolio turnover rate: | | | | | | | | | | | | | | | | | | | | |
| Excluding securities sold short | | | 167 | % | | | 272 | % | | | 312 | % | | | 210 | % | | | 247 | % |
| Including securities sold short | | | 241 | % | | | 354 | % | | | 409 | % | | | 310 | % | | | 340 | % |
| ^ | A one-time voluntary reimbursement by the administrator increased the net investment income per share amount of $0.04 per share. For Institutional Shares and Open Shares, the one-time voluntary reimbursement by the administrator increased the total return ratio by 0.49%, decreased the gross expense and net expense ratios by 0.44% and increased the net investment income (loss) ratio by 0.44%. |
| (a) | Net investment income (loss) has been computed using the average shares method. |
| (b) | Total returns reflect reinvestment of all dividends and distributions, if any. Certain expenses of the Portfolio may have been waived or reimbursed by the Investment Manager, State Street or DST; without such waiver/reimbursement of expenses, the Portfolio’s returns would have been lower. |
The accompanying notes are an integral part of these financial statements.
34 Annual Report
The Lazard Funds, Inc. Notes to Financial Statements
December 31, 2020
1. Organization
The Lazard Funds, Inc. was incorporated in Maryland on May 17, 1991 and is registered under the Investment Company Act of 1940, as amended (the “1940 Act”), as an open-end management investment company. As of December 31, 2020, the Fund was comprised of thirty no-load portfolios (each referred to as a “Portfolio”). This report includes only the financial statements of the Lazard Enhanced Opportunities Portfolio (“Enhanced Opportunities”). The financial statements of the other twenty-nine Portfolios are presented separately.
The Portfolio is operated as a “non-diversified” fund, as defined in the 1940 Act.
The Portfolio currently offers Institutional Shares and Open Shares. Each share class is identical except as to minimum investment requirements; the services offered to, and expenses borne by, each class; and the availability of Service Payments (as defined in the Fund’s prospectus).
2. Significant Accounting Policies
The accompanying financial statements are presented in conformity with GAAP. The Fund is an investment company and therefore applies specialized accounting guidance in accordance with Accounting Standards Codification Topic 946. The following is a summary of significant accounting policies consistently followed by the Fund in the preparation of the financial statements:
(a) Valuation of Investments—Equity securities traded on a securities exchange or market, including exchange-traded option contracts, rights and warrants, are valued at the last reported sales price (for US listed equity securities) or the closing price (for non-US listed equity securities) on the exchange or market on which the security is principally traded or, for securities trading on the NASDAQ National Market System (“NASDAQ”), the NASDAQ Official Closing Price. If there is no available closing price for a non-US listed equity security, the last reported sales price is used. If there are no reported sales of a security on the valuation date, the security is valued at the most recent quoted bid price on such date reported by such principal exchange or market. Futures
Annual Report 35
contracts are valued at the settlement price on the exchange on which the contract is principally traded. Over-the-counter swap agreements are valued by an independent pricing service and centrally cleared swaps are valued at the last reported sale on the clearing exchange. Forward currency contracts generally are valued using quotations from an independent pricing service. Investments in money market funds are valued at the fund’s net asset value (“NAV”) per share.
Bonds and other fixed-income securities that are not exchange-traded are valued on the basis of prices provided by independent pricing services which are based on, among other things, trading in securities with similar characteristics, brokers’ quotations and/or a matrix system which considers such factors as other security prices, yields and maturities.
Calculation of the Portfolio’s NAV may not take place contemporaneously with the determination of the prices of portfolio assets used in such calculation. Trading on certain non-US securities exchanges or markets, such as those in Europe and Asia, ordinarily may be completed before the close of business on each business day in New York (i.e., a day on which the New York Stock Exchange (the “NYSE”) is open). In addition, securities trading in a particular non-US country or countries, may not take place on all business days in New York and on which the NAV of the Portfolio is calculated.
If a significant event materially affecting the value of securities occurs between the close of the exchange or market on which the security is principally traded and the time when the Portfolio’s NAV is calculated, or when current market quotations otherwise are determined not to be readily available or reliable (including restricted or other illiquid securities such as certain derivative instruments), such securities will be valued at their fair value as determined by, or in accordance with procedures approved by, the Fund’s Board of Directors (the “Board”). The fair value of non-US securities may be determined with the assistance of an independent pricing service using correlations between the movement of prices of such securities and indices of US securities and other appropriate indicators, such as closing market prices of
36 Annual Report
relevant American Depositary Receipts (“ADRs”) or futures contracts. Certain non-US securities may trade on days when the Portfolio is not open for business, thus affecting the value of the Portfolio’s assets on days when Portfolio shareholders may not be able to buy or sell Portfolio shares.
The Valuation Committee of the Investment Manager, which is subject to the oversight of the Board, may evaluate a variety of factors to determine the fair value of securities for which market quotations are determined not to be readily available or reliable. These factors include, but are not limited to, the type of security, the value of comparable securities, observations from financial institutions and relevant news events. Input from the Investment Manager’s portfolio management team also will be considered.
The effect of using fair value pricing is that the NAV of the Portfolio will reflect the affected securities’ values as determined in the judgment of the Board or its designee instead of being determined by the market. Using a fair value pricing methodology to price securities may result in a value that is different from the most recent closing price of a security and from the prices used by other investment companies to calculate their portfolios’ NAVs.
(b) Portfolio Securities Transactions and Investment Income—Portfolio securities transactions are accounted for on trade date. Realized gain (loss) on sales of investments are recorded on a specific identification basis. Dividend income and dividend expenses on short sales are recorded on the ex-dividend date except for certain dividends from non-US securities where the dividend rate is not available. In such cases, the dividend is recorded as soon as the information is received by the Portfolio. Interest income, if any, is accrued daily. The Portfolio amortizes premiums and accretes discounts on fixed-income securities using the effective yield method.
The Portfolio may be subject to taxes imposed by non-US countries in which it invests. Such taxes are generally based upon income earned or capital gains (realized and/or unrealized). If applicable, the Portfolio accrues and applies such taxes to net investment income, net realized gains and net unrealized gains
Annual Report 37
concurrent with the recognition of income earned or capital gains (realized and/or unrealized) from the applicable portfolio securities.
(c) Foreign Currency Translation and Forward Currency Contracts—The accounting records of the Fund are maintained in US dollars. Portfolio securities and other assets and liabilities denominated in a foreign currency are translated daily into US dollars at the prevailing rates of exchange. Purchases and sales of securities, income receipts and expense payments are translated into US dollars at the prevailing exchange rates on the respective transaction dates.
The Portfolio does not isolate the portion of operations resulting from changes in foreign exchange rates on investments from the fluctuations arising from changes in their market prices. Such fluctuations are included in net realized and unrealized gain (loss) on investments.
A forward currency contract is an agreement between two parties to buy or sell currency at a set price on a future date. Daily fluctuations in the value of forward currency contracts are recorded as unrealized appreciation (depreciation) on forward currency contracts. When the contract is closed, the Portfolio records a realized gain (loss) equal to the difference between the value at the time it was opened and the value at the time it was closed. Net realized gain (loss) on foreign currency transactions and forward currency contracts represent net foreign currency gain (loss) from forward currency contracts, disposition of foreign currencies, currency gain (loss) realized between the trade and settlement dates on securities transactions, and the difference between the amount of dividends, interest and foreign withholding taxes recorded on the Portfolio’s accounting records and the US dollar equivalent amounts actually received or paid. Net change in unrealized appreciation (depreciation) on foreign currency translations reflects the impact of changes in exchange rates on the value of assets and liabilities, other than investments in securities, during the period.
During the year ended December 31, 2020, the Portfolio traded in forward currency contracts.
38 Annual Report
(d) Futures Contracts—For hedging and investment purposes, the Portfolio may enter into futures contracts in US domestic markets, or exchanges located outside the United States.
Foreign markets may offer advantages such as trading opportunities or arbitrage possibilities not available in the United States. Foreign markets, however, may have greater risk potential than domestic markets. For example, some foreign exchanges are principal markets so that no common clearing facility exists and an investor may look only to the broker for performance of the contract. In addition, any profits the Portfolio might realize in trading could be eliminated by adverse changes in the currency exchange rate, or the Portfolio could incur losses as a result of those changes. Transactions on foreign exchanges may include both commodities which are traded on domestic exchanges and those which are not. Unlike trading on domestic commodity exchanges, trading on foreign commodity exchanges is not regulated by the Commodity Futures Trading Commission.
Engaging in these transactions involves risk of loss to the Portfolio which could adversely affect the value of the Portfolio’s net assets.
Although the Portfolio intends to purchase or sell futures contracts only if there is an active market for such contracts, no assurance can be given that a liquid market will exist for any particular contract at any particular time. Many futures exchanges and boards of trade limit the amount of fluctuation permitted in futures contract prices during a single trading day. Once the daily limit has been reached in a particular contract, no trades may be made that day at a price beyond that limit or trading may be suspended for specified periods during the trading day. Futures contract prices could move to the limit for several consecutive trading days with little or no trading, thereby preventing prompt liquidation of futures positions and potentially subjecting the Portfolio to substantial losses.
During the year ended December 31, 2020, the Portfolio traded in futures contracts.
(e) Options Transactions—Put and call options purchased are accounted for in the same manner as portfolio securities and other
Annual Report 39
assets. Certain options may be written with premiums to be determined on a future date. The premiums for these options are based upon implied volatility parameters at specified terms. When the Portfolio writes an option, the premium received by the Portfolio is recorded as a liability and is subsequently adjusted to the current market value of the option written.
During the year ended December 31, 2020, the Portfolio traded in options.
(f) Short Sales—A short sale is a transaction in which the Portfolio sells securities it does not own but has borrowed in anticipation of a decline in the market price of the securities. The initial amount of a short sale is recorded as a liability which is marked-to-market daily. Fluctuations in the value of the short liability are recorded as unrealized gains or losses. The Portfolio realizes a gain or loss upon closing of the short sale (returning the security to the counterparty by way of purchase or delivery of a long position owned). The Portfolio may have to pay a fee to borrow the particular security and is liable to the buyer for any dividends or interest payable on securities while those securities are in a short position. These dividends and interest amounts are an expense of the Portfolio. The Portfolio designates collateral consisting of cash, US government securities or other liquid assets sufficient to collateralize the market value of short positions.
Proceeds from short sales are generally retained in cash accounts or invested in securities that are cash equivalents. With regard to securities borrowed as of December 31, 2020, pursuant to short sale arrangements, the Portfolio has a right to set off any assets held (including the borrowed securities) or obligations owed to the lender (State Street), in the event of the lender’s default, against any obligations owed by the lender to the Portfolio under any agreement or collateral document, including the collateral value of the Securities Loan Collateral, as that term is defined in the Securities Lending and Services Agreement between the Fund and State Street. At December 31, 2020, the Portfolio had pledged $34,210,199 of long securities as collateral under such arrangements.
40 Annual Report
For the year ended December 31, 2020, proceeds from securities sold short and purchases to cover short positions for the Portfolio were $36,779,628 and $26,209,556, respectively.
(g) Federal Income Taxes—The Fund’s policy is for the Portfolio to qualify as a regulated investment company under Subchapter M of the Internal Revenue Code of 1986, as amended (the “Code”), and to distribute all of its taxable income, including any net realized capital gains, to shareholders. Therefore, no federal income tax provision is required.
At December 31, 2020, the Portfolio had no unused realized capital loss carryovers which, for federal income tax purposes, could be used to offset future realized capital gains.
During the year ended December 31, 2020, the Portfolio had utilized realized capital loss carryovers from previous year amounting to $105,582.
Under current tax law, post-October capital losses or certain late-year ordinary losses, as defined by the Code, within the taxable year may be deferred and treated as occurring on the first day of the following tax year. For the tax year ended December 31, 2020, the Portfolio had no such losses to defer.
For federal income tax purposes, the aggregate cost, aggregate gross unrealized appreciation, aggregate gross unrealized depreciation and the net unrealized appreciation (depreciation) were as follows:
| Portfolio | | Aggregate
Cost | | | Aggregate
Gross
Unrealized
Appreciation | | | Aggregate
Gross
Unrealized
Depreciation | | | Net
Unrealized
Appreciation
(Depreciation) | |
| Enhanced Opportunities | | | $19,317,664 | | | | $3,204,598 | | | | $3,558,851 | | | | $(354,253) | |
Management has analyzed the Portfolio’s tax positions, and has concluded that no liability for unrecognized tax benefits should be recorded related to uncertain tax positions taken on tax returns filed for any open tax years (or expected to be taken on future tax returns). Open tax years are those that remain subject to examination and are based on each tax jurisdiction’s statute of
Annual Report 41
limitations. The Portfolio files a US federal income tax return annually after its fiscal year-end, which is subject to examination by the Internal Revenue Service for a period of three years from the date of filing.
(h) Dividends and Distributions—Dividends from net investment income, if any, will be declared and paid annually. During any particular year, net realized gains from investment transactions in excess of available capital loss carryforwards would be taxable to the Portfolio, if not distributed. The Portfolio intends to declare and distribute these amounts, at least annually, to shareholders, but such amounts may be distributed more frequently. Differences in per share distributions, by class, are generally due to differences in class specific expenses.
The Portfolio intends, on its 2020 tax return, to treat as a distribution of investment company taxable income and net capital gain the portion of redemption proceeds paid to redeeming shareholders that represents the redeeming shareholders’ portion of the Portfolio’s undistributed investment company taxable income and net capital gain. This practice, which involves the use of equalization accounting, will have the effect of reducing the amount of income and gains that the Portfolio would otherwise be required to distribute as dividends to shareholders in order for the Portfolio to avoid federal income and excise taxes. This practice reduces the amount of distributions required to be made to non-redeeming shareholders and defers the recognition of taxable income by such shareholders. However, since the amount of any undistributed income will be reflected in the value of the Portfolio’s shares, the total return on a shareholder’s investment is not affected by the Portfolio’s use of equalization.
Income and capital gains distributions are determined in accordance with federal income tax regulations which may differ from GAAP. These book/tax differences, which resulted in distribution reclassifications, are primarily due to differing treatments of foreign currency transactions, passive foreign investment company gains and losses, 305(c) deemed dividends, wash sales, equalization, certain expenses and straddles. The
42 Annual Report
book/tax differences relating to shareholder distributions resulted in reclassifications among certain capital accounts as follows:
| Portfolio | | Paid in Capital | | | Total
Distributable
Earnings
(Accumulated
Loss) | |
| Enhanced Opportunities | | | $35,289 | | | | $(35,289) | |
The tax character of dividends and distributions paid during the years ended December 31, were as follows:
| | | Ordinary Income | | | Long-Term Capital Gain | |
| Portfolio | | | 2020 | | | | 2019 | | | | 2020 | | | | 2019 | | |
| Enhanced Opportunities | | $ | 1,194,806 | | | $ | 91,754 | | | | $— | | | | $— | | |
At December 31, 2020, the components of distributable earnings (accumulated loss), on a tax basis, were as follows:
| Portfolio | | | Undistributed
Ordinary Income
(Deferred
Ordinary
Losses) | | | | Undistributed
Long-Term
Capital Gain
(Deferred
Capital Losses) | | | | Net Unrealized
Appreciation
(Depreciation)
Including
Foreign Currency | |
| | | | | | | | | | | | | |
| Enhanced Opportunities | | | $385,995 | | | | $— | | | | $(397,847) | |
(i) Allocation of Expenses—Expenses common to the Fund, Lazard Retirement Series, Inc., and Lazard Global Total Return and Income Fund, Inc. (each a “Lazard Fund” and collectively, the “Lazard Fund Complex”), each a registered management investment company advised by the Investment Manager, not directly chargeable to one or more specific Lazard Funds are allocated to the Fund and among its Portfolios primarily on the basis of relative net assets. Expenses of the Fund not directly chargeable to one or more Portfolios are similarly allocated among the Portfolios primarily on the basis of relative net assets. The Portfolio accrues distribution and service (12b-1) fees in the Open Share class. Each Portfolio’s income, expenses (other than class specific expenses) and realized and unrealized gains and losses are allocated proportionally each
Annual Report 43
day between the classes based upon the relative net assets of each class.
(j) Estimates—The preparation of financial statements in conformity with GAAP requires management to make estimates and assumptions that affect the reported amounts of assets and liabilities and disclosure of contingent assets and liabilities at the date of the financial statements and the reported amounts of increases and decreases in net assets resulting from operations during the reporting period. Actual results could differ from those estimates.
(k) Net Asset Value—The NAV per share for each class of the Portfolio is determined each day the NYSE is open for trading as of the close of regular trading on the NYSE (generally 4:00 p.m. Eastern time). The Fund will not treat an intraday unscheduled disruption in NYSE trading as a closure of the NYSE, and will price its shares as of 4:00 p.m., if the particular disruption directly affects only the NYSE. The NAV per share of a class is determined by dividing the value of the total assets of the Portfolio represented by such class, less all liabilities, by the total number of Portfolio shares of such class outstanding.
3. Investment Management, Administration, Custody, Distribution and Transfer Agency Agreements
The Fund, on behalf of the Portfolio, has entered into a management agreement (the “Management Agreement”) with the Investment Manager. Pursuant to the Management Agreement, the Investment Manager manages the investment operations of the Portfolio and the assets of the Portfolio including the purchase, retention and disposition thereof, in accordance with the Portfolio’s investment objectives, policies, and restrictions, and provides the Portfolio with administrative, operational and compliance assistance services. For its services provided to the Portfolio, the Investment Manager earns a management fee, accrued daily as a percentage of the Portfolio’s average daily net assets and payable by the Portfolio monthly, at the annual rate set forth below:
| Portfolio | | | Annual Rate | | |
| Enhanced Opportunities | | | 0.95 | % | |
44 Annual Report
The Investment Manager has voluntarily agreed to waive its fees and, if necessary, reimburse the Portfolio until May 1, 2021 if the aggregate direct expenses of the Portfolio, exclusive of taxes, brokerage, interest on borrowings, dividend and interest expenses on securities sold short, fees and expenses of “Acquired Funds” (as defined in Form N-1A), fees and expenses related to filing foreign tax reclaims, and extraordinary expenses, exceed the percentages of the value of the Portfolio’s average daily net assets set forth in the table below. The Fund, on behalf of the Portfolio, may deduct from the payment to be made to the Investment Manager under the Management Agreement, or the Investment Manager will bear, such excess expenses.
| Portfolio | | Institutional
Shares | | | Open
Shares | | |
| Enhanced Opportunities | | | 1.25 | % | | | 1.50 | % | |
During the year ended December 31, 2020, the Investment Manager waived its management fees and reimbursed the Portfolio for other expenses as follows:
| | | Institutional Shares | | | Open Shares | |
| | | Management | | | Expenses | | | Management | | | Expenses | | |
| Portfolio | | Fees Waived | | | Reimbursed | | | Fees Waived | | | Reimbursed | | |
| Enhanced Opportunities | | | $120,050 | | | | $78,569 | | | | $4,094 | | | | $6,661 | | |
The aforementioned waivers and/or reimbursements are not subject to recoupment by the Investment Manager.
State Street serves as the Fund’s custodian and provides the Fund with certain administrative services.
The Fund has a distribution agreement with Lazard Asset Management Securities LLC (the “Distributor”), a wholly-owned subsidiary of the Investment Manager, to serve as the distributor for shares of the Portfolio. The Distributor bears, among other things, the cost of preparing and distributing materials used by the Distributor in connection with its offering Portfolio shares and other advertising and promotional expenses.
Annual Report 45
Under a distribution and servicing plan adopted pursuant to Rule 12b-1 under the 1940 Act, the Portfolio pays a monthly fee to the Distributor, at an annual rate of 0.25% of the average daily net assets of its Open Shares, for certain distribution activities and providing services to holders of the Portfolio’s Open Shares. The Distributor may make payments to third parties such as financial institutions, securities dealers and other industry professionals, in respect of these services.
DST is the Fund’s transfer agent and dividend disbursing agent.
4. Directors’ Compensation
Certain Directors of the Fund are officers of the Investment Manager. For the year ended December 31, 2020, each Director who is not an affiliated person of the Investment Manager or any of its affiliates was paid by all of the funds in the Lazard Fund Complex: (1) an annual retainer of $237,000, (2) an additional annual retainer of $33,700 to the lead Independent Director, and (3) an additional annual retainer of $23,500 to the Audit Committee Chair. The Independent Directors (an “Independent Director” is a Director who is not an “interested person” (as defined in the 1940 Act) of the Fund) also may be paid additional fees for participation on ad hoc committees or other work performed on behalf of the Board. The Independent Directors are reimbursed for travel and other out-of-pocket expenses for attending Board and committee meetings or incurred in connection with work performed on behalf of the Board. The Directors do not receive benefits from the Fund pursuant to any pension, retirement or similar arrangement. The compensation policy (i.e., retainer amounts and any additional fees as described above) for Independent Directors for the Lazard Fund Complex will remain the same in 2021. Independent Directors’ compensation and expenses are allocated among the funds in the Lazard Fund Complex at a rate of $5,000 per active portfolio with the remainder allocated among the active portfolios on the basis of relative net assets. The Statement of Operations shows the Independent Directors’ compensation and expenses paid by the Portfolio.
46 Annual Report
5. Securities Transactions and Transactions with Affiliates
Purchases and sales of portfolio securities (excluding short-term investments and short sales) for the year ended December 31, 2020 were as follows:
| Portfolio | | Purchases | | | Sales | |
| Enhanced Opportunities | | | $52,047,680 | | | | $32,810,522 | |
For the year ended December 31, 2020, the Portfolio did not engage in any cross-trades in accordance with Rule 17a-7 under the 1940 Act, and no brokerage commissions were paid to affiliates of the Investment Manager or other affiliates of the Fund for portfolio transactions executed on behalf of the Fund.
At December 31, 2020, the Investment Manager owned 31.77% of the outstanding shares of the Portfolio.
6. Line of Credit
The Fund has a $100 million committed line of credit pursuant to an Amended and Restated Loan Agreement (the “Agreement”) with State Street, primarily for temporary or emergency purposes, including the meeting of redemption requests that otherwise might require the untimely disposition of securities. Interest on borrowings is payable at 1.00% plus the “Applicable Rate,” which is the higher of (a) the Federal Funds Rate plus 10 basis points and (b) the Overnight Bank Funding Rate (OBFR) plus 10 basis points, on an annualized basis. Under the Agreement, the Fund has agreed to pay a 0.20% per annum fee on the unused portion of the commitment, payable quarterly in arrears. The Fund has also agreed to pay an upfront fee of 0.05% of the committed line amount. During the year ended December 31, 2020, the Portfolio had no borrowings under the Agreement.
Management believes that the fair value of the liabilities under the Agreement is equivalent to the recorded amount based on its short-term maturity and interest rate, which fluctuates with the Applicable Rate. The Portfolio’s outstanding balance under the Agreement, if any, would be categorized as Level 2.
Annual Report 47
7. Investment Risks
Not all risks applicable to an investment in the Portfolio are described below. Please see the Portfolio’s current summary prospectus or a current Portfolio prospectus for further information regarding the Portfolio’s investment strategy and related risks.
(a) Market Risk—The Portfolio may incur losses due to declines in one or more markets in which it invests. These declines may be the result of, among other things, political, regulatory, market, economic or social developments affecting the relevant market(s). To the extent that such developments impact specific industries, market sectors, countries or geographic regions, the Portfolio’s investments in such industries, market sectors, countries and/or geographic regions can be expected to be particularly affected, especially if such investments are a significant portion of its investment portfolio. In addition, turbulence in financial markets and reduced liquidity in equity, credit and/or fixed income markets may negatively affect many issuers, which could adversely affect the Portfolio. Global economies and financial markets are increasingly interconnected, and conditions and events in one country, region or financial market may adversely impact issuers worldwide. As a result, local, regional or global events such as war, acts of terrorism, the spread of infectious illness or other public health issues, recessions or other events could have a significant negative impact on global economic and market conditions. The coronavirus disease 2019 (COVID-19) global pandemic and the aggressive responses taken by many governments or voluntarily imposed by private parties, including closing borders, restricting travel and imposing prolonged quarantines or similar restrictions, as well as the closure of, or operational changes to, many retail and other businesses, has had negative impacts, and in many cases severe negative impacts, on markets worldwide. It is not known how long such impacts, or any future impacts of other significant events described above, will or would last, but there could be a prolonged period of global economic slowdown, which may be expected to impact the Portfolio and its investments.
(b) Convertible Securities Risk—The market value of convertible securities may perform like that of non-convertible fixed income
48 Annual Report
securities; that is, their prices move inversely with changes in interest rates (i.e., as interest rates go up, prices go down). In addition, convertible securities are subject to the risk that the issuer will not make interest or principal payments, or will not make payments on a timely basis. Since it derives a portion of its value from the common stock into which it may be converted, a convertible security also is subject to the same types of market and issuer risks that apply to the underlying common stock.
(c) Fixed-Income and Debt Securities Risk—The market value of a debt security may decline due to general market conditions that are not specifically related to a particular company, such as real or perceived adverse economic conditions, changes in the outlook for corporate earnings, changes in interest or currency rates or adverse investor sentiment generally. The debt securities market can be susceptible to increases in volatility and decreases in liquidity. Liquidity can decline unpredictably in response to overall economic conditions or credit tightening.
Prices of bonds and other debt securities tend to move inversely with changes in interest rates. Interest rate risk is usually greater for fixed-income securities with longer maturities or durations. A rise in interest rates (or the expectation of a rise in interest rates) may result in periods of volatility, decreased liquidity and increased redemptions, and, as a result, the Portfolio may have to liquidate portfolio securities at disadvantageous prices.
The Portfolio’s investments in lower-rated, higher-yielding securities (“junk bonds”) are subject to greater credit risk than its higher rated investments. Credit risk is the risk that the issuer will not make interest or principal payments, or will not make payments on a timely basis. Non-investment grade securities tend to be more volatile, less liquid and are considered speculative. If there is a decline, or perceived decline, in the credit quality of a debt security (or any guarantor of payment on such security), the security’s value could fall, potentially lowering the Portfolio’s share price. The prices of non-investment grade securities, unlike investment grade debt securities, may fluctuate unpredictably and not necessarily inversely with changes in interest rates. The
Annual Report 49
market for these securities may be less liquid and therefore these securities may be harder to value or sell at an acceptable price, especially during times of market volatility or decline.
Some debt securities may give the issuer the option to call, or redeem, the securities before their maturity, and, during a time of declining interest rates, the Portfolio may have to reinvest the proceeds of called or redeemed securities in an investment offering a lower yield (and the Portfolio may not fully benefit from any increase in the value of its portfolio holdings as a result of declining interest rates).
Adjustable rate securities provide the Portfolio with a certain degree of protection against rises in interest rates, although adjustable rate securities will participate in any declines in interest rates. Certain adjustable rate securities, such as those with interest rates that fluctuate directly or indirectly based on multiples of a stated index, are designed to be highly sensitive to changes in interest rates and can subject the holders thereof to extreme reductions of yield and possibly loss of principal. Certain fixed-income securities may be issued at a discount from their face value (such as zero coupon securities) or purchased at a price less than their stated face amount or at a price less than their issue price plus the portion of “original issue discount” previously accrued thereon, i.e., purchased at a “market discount.” The amount of original issue discount and/or market discount on certain obligations may be significant, and accretion of market discount together with original issue discount will cause the Portfolio to realize income prior to the receipt of cash payments with respect to these securities.
(d) Preferred Securities Risk-There are various risks associated with investing in preferred securities. In addition, unlike common stock, participation in the growth of an issuer may be limited.
| · | Credit risk is the risk that a security held by the Portfolio will decline in price or the issuer of the security will fail to make dividend, interest or principal payments when due because the issuer experiences a decline in its financial status. |
50 Annual Report
| · | Interest rate risk is the risk that securities will decline in value because of changes in market interest rates. When market interest rates rise, the market value of such securities generally will fall. |
| · | Preferred securities may include provisions that permit the issuer, at its discretion, to defer or omit distributions for a stated period without any adverse consequences to the issuer. |
| · | Preferred securities are generally subordinated to bonds and other debt instruments in an issuer’s capital structure in terms of having priority to corporate income, claims to corporate assets and liquidation payments, and therefore will be subject to greater credit risk than more senior debt instruments. |
| · | During periods of declining interest rates, an issuer may be able to exercise an option to call, or redeem its issue at par earlier than the scheduled maturity. If this occurs during a time of lower or declining interest rates, the Portfolio may have to reinvest the proceeds in lower yielding securities (and the Portfolio may not benefit from any increase in the value of its portfolio holdings as a result of declining interest rates). |
| · | Certain preferred securities may be substantially less liquid than many other securities, such as common stocks or US government securities. Illiquid securities involve the risk that the securities will not be able to be sold at the time desired by the Portfolio or at prices approximating the value at which the Portfolio is carrying the securities on its books. |
(e) Short Position Risk—Short positions may involve substantial risks. If a short position appreciates in value during the period of the Portfolio’s investment, there will be a loss to the Portfolio that could be substantial. Short positions involve more risk than long positions because the maximum sustainable loss on a security purchased is limited to the amount paid for the security plus the transaction costs. However, the Portfolio’s potential loss on a short position is unlimited because, theoretically, there is no limit to the potential price increase of a security. In addition, the Portfolio’s short sales transactions are dependent on counterparties to its securities borrowing transactions and are subject to the risk of
Annual Report 51
default by a counterparty, which could result in a loss of Portfolio assets used as collateral or the loss of monies owed to the Portfolio by a counterparty.
(f) Derivatives and Hedging Risk—Derivatives transactions, including those entered into for hedging purposes (i.e., seeking to protect Portfolio investments), may increase volatility, reduce returns, limit gains or magnify losses, perhaps substantially, particularly since most derivatives have a leverage component that provides investment exposure in excess of the amount invested. Swap agreements; forward currency contracts; over-the-counter options on securities (including options on ETFs), indexes and currencies; and other over-the-counter derivatives transactions are subject to the risks of the creditworthiness of, and default by, the counterparty and consequently may lose all or a portion of their value due solely to the creditworthiness of, or default, by the counterparty. Over-the-counter derivatives frequently may be illiquid and difficult to value. Changes in liquidity may result in significant, rapid and unpredictable changes in the prices for derivatives. These derivatives transactions, as well as the exchange-traded futures and options in which the Portfolio may invest, are subject to many of the risks of, and can be highly sensitive to changes in the value of, the related reference asset, index or rate. As such, a small investment could have a potentially large impact on the Portfolio’s performance. In fact, many derivatives may be subject to greater risks than those associated with investing directly in the underlying or other reference asset. Derivatives transactions incur costs, either explicitly or implicitly, which reduce returns, and costs of engaging in such transactions may outweigh any gains or any losses averted from hedging activities. Successful use of derivatives, whether for hedging or for other investment purposes, is subject to the Investment Manager’s ability to predict correctly movements in the direction of the relevant reference asset or market and, for hedging activities, correlation of the derivative instruments used with the investments seeking to be hedged. Use of derivatives transactions, even if entered into for hedging purposes, may cause the Portfolio to experience losses greater than if the Portfolio had not engaged in such transactions.
52 Annual Report
(g) Non-US Securities Risk—The Portfolio’s performance will be influenced by political, social and economic factors affecting the non-US countries and companies in which the Portfolio invests. Non-US securities carry special risks, such as less developed or less efficient trading markets, political instability, a lack of company information, differing auditing and legal standards, and, potentially, less liquidity.
(h) Foreign Currency Risk—Investments denominated in currencies other than US dollars may experience a decline in value, in US dollar terms, due solely to fluctuations in currency exchange rates. The Portfolio’s investments could be adversely affected by delays in, or a refusal to grant, repatriation of funds or conversion of emerging market currencies.
(i) Non-Diversification Risk—The Portfolio’s net asset value may be more vulnerable to changes in the market value of a single issuer or group of issuers and may be relatively more susceptible to adverse effects from any single corporate, industry, economic, market, political or regulatory occurrence than if the Portfolio’s investments consisted of securities issued by a larger number of issuers.
(j) ETF Risk—Shares of ETFs may trade at prices that vary from their net asset values, sometimes significantly. The shares of ETFs may trade at prices at, below or above their most recent net asset value. In addition, the performance of an ETF pursuing a passive index-based strategy may diverge from the performance of the index. The Portfolio’s investments in ETFs are subject to the risks of such ETF’s investments, as well as to the general risks of investing in ETFs. Portfolio shares will bear not only the Portfolio’s management fees and operating expenses, but also the Portfolio’s proportional share of the management fees and operating expenses of the ETFs in which the Portfolio invests. The Portfolio may be limited by the 1940 Act in the amount of its assets that may be invested in ETFs unless another ETF has received an exemptive order from the SEC on which the Portfolio may rely or an exemption is available.
(k) Cybersecurity Risk—The Portfolio and its service providers are susceptible to operational and information security and related risks
Annual Report 53
of cybersecurity incidents. Cybersecurity attacks include, but are not limited to, gaining unauthorized access to digital systems (e.g., through “hacking” or malicious software coding) for purposes of misappropriating assets or sensitive information, corrupting data or causing operational disruption. Cybersecurity incidents affecting the Investment Manager, transfer agent or custodian or other service providers such as financial intermediaries have the ability to cause disruptions and impact business operations, potentially resulting in financial losses, including by impediments to the Portfolio’s investment trading; the inability of Portfolio shareholders to purchase and redeem Portfolio shares; interference with the Portfolio’s ability to calculate its NAV; violations of applicable privacy, data security or other laws; regulatory fines and penalties; reputational damage; reimbursement or other compensation or remediation costs; legal fees; or additional compliance costs. Similar adverse consequences could result from cybersecurity incidents affecting issuers of securities in which the Portfolio invests; counterparties with which the Portfolio engages in transactions; governmental and other regulatory authorities, exchange and other financial market operators; and banks, brokers, dealers, insurance companies and other financial institutions and other parties. There are inherent limitations in any cybersecurity risk management systems or business continuity plans, including the possibility that certain risks have not been identified.
8. Contractual Obligations
The Fund enters into contracts in the normal course of business that contain a variety of indemnification provisions. The Fund’s maximum exposure under these arrangements is unknown. Management has reviewed the Portfolio’s existing contracts and expects the risk of loss to be remote.
9. Fair Value Measurements
Fair value is defined as the price that the Portfolio would receive to sell an asset, or would pay to transfer a liability, in an orderly transaction between market participants at the date of measurement. The Fair Value Measurements and Disclosures provisions of GAAP also establish a framework for measuring fair value, and a three-level hierarchy for fair value measurement that is based
54 Annual Report
upon the transparency of inputs to the valuation of an asset or liability. Inputs may be observable or unobservable and refer, broadly, to the assumptions that market participants would use in pricing the asset or liability. Observable inputs reflect the assumptions that market participants would use in pricing the asset or liability based on market data obtained from sources independent of the Fund. Unobservable inputs reflect the Fund’s own assumptions about the assumptions that market participants would use in pricing the asset or liability, developed based on the best information available in the circumstances. The fair value measurement level within the fair value hierarchy for the assets and liabilities of the Fund is based on the lowest level of any input that is significant to the overall fair value measurement. The three-level hierarchy of inputs is summarized below:
| · | Level 1 – unadjusted quoted prices in active markets for identical assets and liabilities |
| · | Level 2 – other significant observable inputs (including unadjusted quoted prices for similar assets and liabilities, interest rates, prepayment speeds, credit risk, etc.) |
| · | Level 3 – significant unobservable inputs (including the Fund’s own assumptions in determining the fair value of assets and liabilities) |
Changes in valuation methodology or inputs may result in transfers into or out of the current assigned level within the hierarchy.
The inputs or methodology used for valuing securities are not necessarily an indication of the risks associated with investing in these securities.
Annual Report 55
The following table summarizes the valuation of the Portfolio’s assets and liabilities by each fair value hierarchy level as of December 31, 2020:
| Description | | Unadjusted
Quoted Prices in
Active Markets
for Identical
Assets
and Liabilities
(Level 1) | | | Significant
Other
Observable
Inputs
(Level 2) | | | Significant
Unobservable
Inputs
(Level 3) | | | Balance as of
December 31, 2020 | |
| Enhanced Opportunities Portfolio | | | | | | | | | | | | | | | | | |
| Assets: | | | | | | | | | | | | | | | | | |
| Common Stocks* | | | $ | 25,076 | | | $ | 2,857 | | | $ | — | | | $ | 27,933 | |
| Convertible Corporate Bonds* | | | | — | | | | 34,185,124 | | | | — | | | | 34,185,124 | |
| Purchased Options | | | | 3,672 | | | | — | | | | — | | | | 3,672 | |
| Short-Term Investments | | | | 2,658,914 | | | | — | | | | — | | | | 2,658,914 | |
| Other Financial Instruments† | | | | | | | | | | | | | | | | | |
| Forward Currency Contracts | | | | — | | | | 2,327 | | | | — | | | | 2,327 | |
| Total | | | $ | 2,687,662 | | | $ | 34,190,308 | | | $ | — | | | $ | 36,877,970 | |
| Liabilities: | | | | | | | | | | | | | | | | | |
| Securities Sold Short | | | | | | | | | | | | | | | | | |
| Common Stocks* | | | $ | (17,422,804 | ) | | $ | (19,475 | ) | | $ | — | | | $ | (17,442,279 | ) |
| Exchange-Traded Fund | | | | (472,123 | ) | | | — | | | | — | | | | (472,123 | ) |
| Other Financial Instruments† | | | | | | | | | | | | | | | | | |
| Written Options | | | | (1,870 | ) | | | — | | | | — | | | | (1,870 | ) |
| Total | | | $ | (17,896,797 | ) | | $ | (19,475 | ) | | $ | — | | | $ | (17,916,272 | ) |
| * | Please refer to Portfolio of Investments and Notes to Portfolio of Investments for portfolio holdings by country and industry. |
| † | Other financial instruments are derivative instruments which are valued at their respective unrealized appreciation (depreciation). |
10. Derivative Instruments
Forward currency contracts may be used for hedging purposes or to seek to increase returns.
The Portfolio may write or purchase a call or put option to seek to realize, through the receipt of premiums or changes in market value, a greater return than would be realized on the underlying securities alone, or to seek to protect the Portfolio from losses.
The Portfolio may enter into futures transactions to hedge against changes in interest rates, securities prices, and/or currency
56 Annual Report
exchange rates, to increase total return, or to otherwise gain access or attain exposure to certain markets or other underliers.
During the year ended December 31, 2020, the approximate average monthly notional exposure for derivative instruments was as follows:
| Forward currency contracts: | |
| Average amounts purchased | $100,000# |
| Average amounts sold | $200,000 |
| # | Represents average monthly notional exposure for the two months the derivative instrument was open during the period. |
| Futures contracts: | |
| Average notional value of contracts – long | $300,000* |
| * | Represents average daily notional exposure for the six days the derivative instrument was open during the period. |
The Portfolio purchased options having an average monthly notional exposure of less than $50,000. The Portfolio also wrote options having an average monthly notional exposure of less than $50,000.
The following table summarizes the fair value of derivative instruments on the Statement of Assets and Liabilities as of December 31, 2020:
| Assets – Derivative Financial Instruments | | | | Total | |
| Forward currency contracts | | Unrealized appreciation on forward currency contracts | | $ | 2,327 | |
| Purchased options | | Investment in securities, at fair value | | | 3,672 | |
| Total | | | | $ | 5,999 | |
| | | | | | | |
| Liabilities – Derivative Financial Instruments | | | | Total | |
| Written options | | Written options, at fair value | | $ | 1,870 | |
Annual Report 57
The effect of derivative instruments on the Statement of Operations for the year ended December 31, 2020 was:
| Net Realized Gain (Loss) from: | | Equity
Contracts | | | Foreign
Currency
Exchange
Contracts | | | Total | |
| Forward currency contracts | | $ | –– | | | $ | (8,786 | ) | | $ | (8,786 | ) |
| Futures contracts | | | 35,174 | | | | — | | | | 35,174 | |
| Purchased options | | | (15,414 | ) | | | — | | | | (15,414 | ) |
| Written options | | | 20,920 | | | | — | | | | 20,920 | |
| Total | | $ | 40,680 | | | $ | (8,786 | ) | | $ | 31,894 | |
| | | | | | | | | | | | | |
| Net Change in Unrealized Appreciation (Depreciation) on: | | Equity
Contracts | | | Foreign
Currency
Exchange
Contracts | | | Total | |
| Forward currency contracts | | $ | — | | | $ | 4,141 | | | $ | 4,141 | |
| Purchased options | | | 418 | | | | — | | | | 418 | |
| Written options | | | 530 | | | | — | | | | 530 | |
| Total | | $ | 948 | | | $ | 4,141 | | | $ | 5,089 | |
As of December 31, 2020, the Portfolio held derivative instruments that are eligible for offset in the Statement of Assets and Liabilities and are subject to master netting arrangements. A master netting arrangement is an agreement between two counterparties who have multiple contracts with each other that provides for the net settlement of all contracts, as well as any cash collateral, through a single payment in the event of default on, or termination of, any one contract.
The required information for the Portfolio is presented in the below table, as of December 31, 2020:
| Description | | Gross Amounts of
Recognized Assets | | Gross Amounts Offset
in the Statement of
Assets and Liabilities | | Net Amounts of
Assets Presented
in the Statement of
Assets and Liabilities |
| Forward Currency Contracts | | | $ | 2,327 | | | | $ | — | | | | $ | 2,327 | |
| | | | | | | Amounts Not Offset
in the Statement of
Assets and Liabilities | | | | |
| Counterparty | | Net Amounts of
Assets Presented
in the Statement of
Assets and Liabilities | | Financial
Instruments | | Collateral
Received | | Net Amounts of
Derivative Assets |
| State Street Bank and Trust Co. | | | $ | 2,327 | | | | $ | — | | | | $ | — | | | | $ | 2,327 | |
58 Annual Report
11. Accounting Pronouncements
In March 2017, the Financial Accounting Standards Board issued Accounting Standards Update No. 2017-08, Receivables – Nonre-fundable Fees and Other Costs (Subtopic 310-20): Premium Amortization on Purchased Callable Debt Securities (“ASU No. 2017-08”). ASU No. 2017-08 shortened the amortization period for certain purchased callable debt securities held at a premium to the earliest call date. Management has implemented the applicable changes, and they did not have a material impact on the Portfolio’s financial statements. In October 2020, ASU No. 2017-08 was amended by the Financial Accounting Standards Board’s issuance of Accounting Standards Update No. 2020-08, Codification Improvements to Subtopic 310-20, Receivables – Nonrefundable Fees and Other Costs (“ASU No. 2020-08”). This amendment requires that entities re-evaluate whether callable debt securities fall within the scope of ASU No. 2017-08 for each reporting period. ASU No. 2020-08 also amends ASU No. 2017-08 to require that premiums be amortized to the “next call date” rather than the “earliest call date” and further clarifies the definition of “next call date.” ASU No. 2020-08 is effective for fiscal years, and interim periods within those fiscal years, beginning after December 15, 2020. Early adoption of ASU No. 2020-08 is not permitted. Management is currently evaluating the impact, if any, of applying ASU No. 2020-08.
On March 12, 2020, the Financial Accounting Standards Board concluded its reference rate reform project with the issuance of Accounting Standards Update No. 2020-04, Reference Rate Reform (Topic 848) – Facilitation of the Effects of Reference Rate Reform on Financial Reporting (“ASU No. 2020-04”). ASU No. 2020-04 provides elective temporary financial reporting relief from the effect of certain types of contract modifications due to the planned discontinuation of the London Interbank Offered Rate (LIBOR) and other interbank offered based reference rates as of the end of 2021. ASU No. 2020-04 is effective for certain reference rate-related contract modifications that occur during the period March 12, 2020 through December 31, 2022. Management is currently evaluating the impact, if any, of applying ASU No. 2020-04.
Annual Report 59
12. Subsequent Events
Management has evaluated subsequent events potentially affecting the Portfolio through the issuance of the financial statements and has determined that there were no subsequent events that required adjustment or disclosure.
60 Annual Report
The Lazard Funds, Inc.
Report of Independent Registered Public Accounting Firm
To the Board of Directors of The Lazard Funds, Inc. and Shareholders of Lazard Enhanced Opportunities Portfolio:
Opinion on the Financial Statements and Financial Highlights
We have audited the accompanying statement of assets and liabilities, including the portfolio of investments, of Lazard Enhanced Opportunities Portfolio (the “Portfolio”), one of the portfolios constituting The Lazard Funds, Inc. (the “Fund”), as of December 31, 2020, the related statement of operations for the year then ended, the statement of changes in net assets for each of the two years in the period then ended, the financial highlights for each of the five years in the period then ended, and the related notes. In our opinion, the financial statements and financial highlights present fairly, in all material respects, the financial position of the Portfolio, as of December 31, 2020, and the results of its operations for the year then ended, the changes in its net assets for each of the two years in the period then ended, and the financial highlights for each of the five years in the period then ended in conformity with accounting principles generally accepted in the United States of America.
Basis for Opinion
These financial statements and financial highlights are the responsibility of the Portfolio’s management. Our responsibility is to express an opinion on the Portfolio’s financial statements and financial highlights based on our audits. We are a public accounting firm registered with the Public Company Accounting Oversight Board (United States) (PCAOB) and are required to be independent with respect to the Portfolio in accordance with the U.S. federal securities laws and the applicable rules and regulations of the Securities and Exchange Commission and the PCAOB.
We conducted our audits in accordance with the standards of the PCAOB. Those standards require that we plan and perform the audit to obtain reasonable assurance about whether the financial statements and financial highlights are free of material misstatement, whether due to error or fraud. The Portfolio is not
Annual Report 61
required to have, nor were we engaged to perform, an audit of its internal control over financial reporting. As part of our audits we are required to obtain an understanding of internal control over financial reporting but not for the purpose of expressing an opinion on the effectiveness of the Portfolio’s internal control over financial reporting. Accordingly, we express no such opinion.
Our audits included performing procedures to assess the risks of material misstatement of the financial statements and financial highlights, whether due to error or fraud, and performing procedures that respond to those risks. Such procedures included examining, on a test basis, evidence regarding the amounts and disclosures in the financial statements and financial highlights. Our audits also included evaluating the accounting principles used and significant estimates made by management, as well as evaluating the overall presentation of the financial statements and financial highlights. Our procedures included confirmation of securities owned as of December 31, 2020, by correspondence with the custodian and brokers; when replies were not received from brokers, we performed other auditing procedures. We believe that our audits provide a reasonable basis for our opinion.
/s/ DELOITTE & TOUCHE LLP
New York, New York
February 24, 2021
We have served as the auditor of one or more of the investment companies in the Lazard Fund Complex since 2004.
62 Annual Report
The Lazard Funds, Inc.
Board of Directors and Officers Information (unaudited)
Name (Year of Birth)
Address(1) | | Position(s) with the
Fund (Since) and Term(2) | | Principal Occupation(s) and Other Public
Company Directorships Held During the
Past Five Years(2) |
| | | | | |
| Independent Directors(3): | | | | |
| | | | | |
| Franci J. Blassberg (1953) | | Director
(August 2014) | | Debevoise & Plimpton LLP, a law firm, Of Counsel (2013 – present) |
| | |
| | Cornell Law School, Adjunct Professor (2013 – present) |
| | |
| | The Buchmann Faculty of Law, Tel Aviv University, Visiting Professor (2019) |
| | |
| | University of California, Berkeley School of Law, Adjunct Professor (Spring 2017) |
| | |
| Kenneth S. Davidson (1945) | | Director
(August 1995) | | Davidson Capital Management Corporation, an investment manager, President (1978 – present) |
| | | | | |
| Nancy A. Eckl (1962) | | Director
(April 2007) | | College Retirement Equities Fund (eight accounts), Trustee (2007 – present) |
| | |
| | TIAA-CREF Funds (68 funds) and TIAA-CREF Life Funds (11 funds), Trustee (2007 – present) |
| | |
| | TIAA Separate Account VA-1, Member of the Management Committee (2007 – present) |
| | |
| Trevor W. Morrison (1971) | | Director
(April 2014) | | New York University School of Law, Dean and Eric M. and Laurie B. Roth Professor of Law (2013 – present) |
| | | | | |
| Richard Reiss, Jr. (1944) | | Director
(May 1991) | | Georgica Advisors LLC, an investment manager, Chairman (1997 – present) |
| | |
| | Resource America, Inc., a real estate asset management company, Director (2016 – 2018) |
| | |
| | Osprey Technology Acquisition Corp, a special purpose acquisition company, Director (2019 – present) |
Annual Report 63
Name (Year of Birth)
Address(1) | | Position(s) with the
Fund (Since) and Term(2) | | Principal Occupation(s) and Other Public
Company Directorships Held During the
Past Five Years(2) |
| | | | | |
| Robert M. Solmson (1947) | | Director (September 2004) | | Fairwood Capital, LLC, a private investment corporation engaged primarily in real estate and hotel investments, Co-Managing Partner and Managing Director (2008 – present) |
| | | | | |
| Interested Directors(4): | | | | |
| | | | | |
| Ashish Bhutani (1960) | | Director (July 2005) | | Investment Manager, Chief Executive Officer (2004 – present) |
| | | | | |
| | | | | Lazard Ltd, Vice Chairman and Director (2010 – present) |
| | | | | |
| Nathan A. Paul (1973) | | Director (October 2017), Chief Executive Officer and President (February 2017) | | Investment Manager, Chief Business Officer (April 2017 – present) and Managing Director (2003 – present) |
| | | | | |
| | | | | Investment Manager, General Counsel (2002 – April 2017) |
| (1) | The address of each Director of the Fund is Lazard Asset Management LLC, 30 Rockefeller Plaza, New York, New York 10112-6300. |
| (2) | Each Director serves as a Director for each of the funds in the Lazard Fund Complex, comprised of, as of January 31, 2021, 35 active investment portfolios. Each Director serves an indefinite term, until his or her successor is elected and qualifies or until his or her earlier resignation. |
| (3) | “Independent Directors” are not “interested persons” (as defined in the 1940 Act) of the Fund. |
| (4) | Messrs. Bhutani and Paul are “interested persons” (as defined in the 1940 Act) of the Fund because of their positions with the Investment Manager. |
The Fund’s Statement of Additional Information contains further information about the Directors and is available without charge by calling 800-823-6300, or online, at www.lazardassetmanagement.com.
64 Annual Report
Name (Year of Birth)
Address(1) | | Position(s) with the Fund
(Since) and Term(2) | | Principal Occupation(s)
During the Past Five Years |
| | | | | |
| Officers(3): | | | | |
| | | | | |
| Mark R. Anderson (1970) | | Vice President and Secretary
(February 2017) | | Managing Director (since February 2017), General Counsel (since April 2017) and Chief Compliance Officer of the Investment Manager |
| | | | | |
| Nargis Hilal (1984) | | Chief Compliance Officer (July 2020) | | Senior Vice President and Counsel of the Investment Manager (since August 2017) |
| | | | | |
| | | | | Chief Compliance Officer of KLS Diversified Asset Management LP (March 2016 – August 2017) |
| | | | | |
| | | | | Deputy Chief Compliance Office KLS Diversified Asset Management LP (January 2015 – March 2016) |
| | | | | |
| Christopher Snively (1984) | | Chief Financial Officer (March 2016) and Treasurer (September 2019) | | Senior Vice President of the Investment Manager |
| | | | | |
| Shari L. Soloway (1981) | | Assistant Secretary
(November 2015) | | Head of Legal, North America (since January 2019, previously Senior Vice President, Legal and Compliance) of the Investment Manager |
| | | | | |
| Jessica A. Falzone (1989) | | Assistant Secretary
(January 2019) | | Vice President, Legal and Compliance, of the Investment Manager (since March 2018) |
| | | | | |
| | | | | Associate at Schulte Roth & Zabel LLP (October 2014 – March 2018) |
| | | | | |
| Christina Kennedy (1990) | | Assistant Treasurer
(May 2020) | | Vice President of the Investment Manager (since July 2019) |
| | | | | |
| | | | | Senior Fund Accountant, Gates Capital Management Inc. (July 2016 – July 2019) |
| | | | | |
| | | | | Assurance Senior Associate at PricewaterhouseCoopers LLP (August 2013 – July 2016) |
| | | | | |
| Cesar A. Trelles (1975) | | Assistant Treasurer
(December 2004) | | Vice President of the Investment Manager |
Annual Report 65
| (1) | The address of each officer of the Fund is Lazard Asset Management LLC, 30 Rockefeller Plaza, New York, New York 10112-6300. |
| (2) | Each officer serves for an indefinite term, until his or her successor is elected and qualifies or until his or her earlier resignation or removal. Each officer serves in the same capacity for the other funds in the Lazard Fund Complex. |
| (3) | In addition to Nathan A. Paul, Chief Executive Officer and President (since February 2017; previously, Vice President and Secretary), whose information is included in the Interested Directors section above. |
66 Annual Report
The Lazard Funds, Inc. Tax and Other Information (unaudited)
Tax Information
Year Ended December 31, 2020
The following tax information represents year end disclosures of the tax benefits passed through to shareholders for 2020:
Of the dividends paid by the Portfolio, the percentage shown below is qualified dividend income.
| Portfolio | | Percentage |
| Enhanced Opportunities | | 0.26 | % |
Of the dividends paid by the Portfolio, no dividends qualify for the dividends received deduction available to corporate shareholders.
| Portfolio | | Percentage |
| Enhanced Opportunities | | 0.28 | % |
Pursuant to Section 871 of the Code, the Portfolio has no designated qualified short-term gains for purposes of exempting withholding of tax on such distributions to US nonresident shareholders.
Proxy Voting
A description of the policies and procedures used to determine how proxies relating to Fund portfolio securities are voted is available (1) without charge, upon request, by calling (800) 823-6300 or (2) on the Securities and Exchange Commission (the “SEC”) website at https://www.sec.gov.website at https://www.sec.gov.
The Fund’s proxy voting record for the most recent 12-month period ended June 30 is available (1) without charge, upon request, by calling (800) 823-6300 or (2) on the SEC’s website at https://www.sec.gov. Information as of June 30 each year will generally be available by the following August 31.
Schedule of Portfolio Holdings
The Fund files the complete schedule of the Portfolio’s holdings with the SEC for the first and third quarters of each fiscal year as an exhibit to its reports on Form N-PORT. The Fund’s Form N-PORT reports are available on the SEC’s website at https://www.sec.gov.
Annual Report 67
NOTES
NOTES
NOTES
NOTES
NOTES
The Lazard Funds, Inc.
30 Rockefeller Plaza
New York, New York 10112-6300
Telephone: 800-823-6300
www.lazardassetmanagement.com
Investment Manager
Lazard Asset Management LLC
30 Rockefeller Plaza
New York, New York 10112-6300
Telephone: 800-823-6300
Distributor
Lazard Asset Management Securities LLC
30 Rockefeller Plaza
New York, New York 10112-6300
Custodian
State Street Bank and Trust Company
One Iron Street
Boston, Massachusetts 02210-1641
Transfer Agent and Dividend Disbursing Agent
DST Asset Manager Solutions, Inc.
2000 Crown Colony Drive
Quincy, Massachusetts 02169-0953
Telephone: 617-483-7000
Independent Registered Public Accounting Firm
Deloitte & Touche LLP
30 Rockefeller Plaza
New York, New York 10112-0015
Legal Counsel
Proskauer Rose LLP
Eleven Times Square
New York, New York 10036-8299
www.proskauer.com


| Lazard Asset Management LLC • 30 Rockefeller Plaza • New York, NY 10112 • www.lazardassetmanagement.com | |
| | |
Performance information as of the most recent month end is available online at www.lazardassetmanagement.com.
LZDPS031 |  |

Lazard Funds
Annual Report
December 31, 2020
Equity Funds
| Lazard Developing Markets Equity Portfolio | Lazard International Equity Portfolio |
| Lazard Emerging Markets Core Equity Portfolio | Lazard International Equity Select Portfolio |
| Lazard Emerging Markets Equity Advantage Portfolio | Lazard International Equity Value Portfolio |
| Lazard Emerging Markets Equity Blend Portfolio | Lazard International Quality Growth Portfolio |
| Lazard Emerging Markets Equity Portfolio | Lazard International Small Cap Equity Portfolio |
| Lazard Equity Franchise Portfolio | Lazard International Strategic Equity Portfolio |
| Lazard Global Equity Select Portfolio | Lazard Managed Equity Volatility Portfolio |
| Lazard Global Listed Infrastructure Portfolio | Lazard US Equity Concentrated Portfolio |
| Lazard Global Strategic Equity Portfolio | Lazard US Equity Focus Portfolio |
| Lazard International Equity Advantage Portfolio | Lazard US Small-Mid Cap Equity Portfolio |
| Lazard International Equity Concentrated Portfolio | Lazard US Sustainable Equity Portfolio |
The Lazard Funds, Inc. Table of Contents
Please consider a Portfolio’s investment objective, risks, charges and expenses carefully before investing. For more complete information about The Lazard Funds, Inc. (the “Fund”), you may obtain a prospectus or a Portfolio’s summary prospectus by calling 800-823-6300, or online, at www.lazardassetmanagement.com. Read the prospectus or the Portfolio’s summary prospectus carefully before you invest. The prospectus and a Portfolio’s summary prospectus contain the investment objective, risks, charges, expenses and other information about the Portfolio, which are not detailed in this report.
Distributed by Lazard Asset Management Securities LLC.
Annual Report 1
The Lazard Funds, Inc. A Message from Lazard (unaudited)
Dear Shareholder,
As 2020 began, the outbreak of a novel coronavirus (“COVID-19”) turned into a fast-spreading pandemic, rattling global markets. Worldwide lockdowns led to a severe equity market sell-off in February and March, as well as a sharp decline in oil markets. By the conclusion of the year, COVID-19 continued to wreak havoc across much of the world, but many global equity markets closed 2020 near all-time highs. Markets generally rose steadily after the sell-off on the back of unprecedented support from global central banks and government treasuries and the introduction of several promising vaccines.
In the United States, Democrats won control of the White House and Congress in November elections. The US equity market closed 2020 near an all-time peak, and nominal yields in various US fixed income market segments closed at or near all-time lows, fueled by trillions of dollars in monetary and fiscal stimulus.
COVID-19 also severely debilitated economic activity in the emerging markets, but the recovery in emerging markets equities that began in late March picked up steam in the fourth quarter thanks to vaccine breakthroughs and the US election outcome. As a result, the MSCI Emerging Markets® Index outperformed global developed markets equities in 2020.
In Europe, interest rates have never been as low, and central bank balance sheets have never been as inflated, as they were at year-end. With an agreement now in place for the exit of the United Kingdom from the European Union, the years-long “Brexit” saga may be one less uncertainty the market has to grapple with in the year ahead.
As we write, many countries are facing record levels of new COVID-19 infections, spurring renewed economic lockdowns and increasing the risk that many companies, particularly small businesses, might not make it to the other side of this pandemic. Were that to happen, it could send a negative signal to markets equal and opposite to the positive news of the vaccines toward the end
2 Annual Report
of the last year. Investors face a timing conundrum, but it could well be darkest before the dawn.
Despite these challenges, we are optimistic for 2021 and believe that as the world does eventually return to something like the pre-pandemic days, fundamental analysis and stock selection will be crucial drivers for performance. We are privileged that you have turned to Lazard for your investment needs and value your continued confidence in our investment management capabilities. We continue to strive for the long-term patterns of performance pursued by the various investment strategies employed.
Sincerely,
Lazard Asset Management LLC
Annual Report 3
Lazard Funds, Inc. Investment Overviews (unaudited)
Emerging Markets Equities
Despite a once in a hundred years global pandemic, which severely debilitated world economic activity, the MSCI Emerging Markets Index finished 2020 up over 18% on unprecedented monetary easing and fiscal stimulus. This result disproportionately impacted by Asian stocks, which rose by more than 28%, while markets collapsed in Latin America by almost 14% and by about 12% in Eastern Europe.
Latin American markets were ill prepared and hard hit by the COVID-19 pandemic. High infection rates and conflicting health and economic policies in some countries, resulted in worsening market conditions and negative sentiment. Despite a powerful stock market recovery in the fourth quarter, in large part due to announcements of efficacious vaccines, all Latin American markets finished the year lower.
Similarly, markets in Eastern Europe were unprepared for the pandemic and finished the year lower. Economically sensitive economies such as Russia were harmed by a crude oil price war and plummeting demand. Turkish equities fell sharply on lira weakness as currency reserves were used, but rebounded late in the year on interest rate increases. In South Africa, stocks finished only modestly lower as economic growth estimates improved marginally.
The three best performing markets were all in north Asia and, ironically, included China, where the virus originated. Its market rose by approximately 30% in 2020. The other two countries, Taiwan and South Korea, each of whose markets rose by more than 40%, both benefited from large technology sector exposures as well as the stricter health care and isolation controls which resulted in relatively lower infection rates. The Association of Southeast Asian Nations country markets, such as in Indonesia, the Philippines, and Thailand fared significantly worse, exhibiting more economic sensitivity and fewer lockdown controls. Although Indian stocks underperformed the MSCI Emerging Markets Index, they finished significantly higher on relatively resilient economic results.
4 Annual Report
From a sector perspective, information technology, health care, consumer discretionary, and communications services all performed very strongly. Energy, real estate, utilities, and financials all finished 2020 lower.
International Equities
For the year ended December 31, 2020, international equity markets gained despite seesawing risk sentiment amid mixed news flow and formidable macro challenges.
Risk assets began 2020 positively, thanks to the truce in the US-China trade war, greater clarity on Brexit, and a global monetary easing cycle. However, market optimism gave way to panic selling in mid-February through the latter part of March, as the coronavirus epidemic that began in China metastasized into a full-scale pandemic and investors worried about the threat it posed to the global economy.
With the US Federal Reserve (the “Fed”) taking the lead, central banks worldwide and government fiscal policymakers initiated aggressive stimulus measures to contain the economic fallout from the intensifying viral outbreak. Despite stiffening headwinds, which included severe economic downturns in several countries and regions of the world, these actions buoyed market confidence that central banks and governments would continue to act when necessary to support risk assets and backstop the world economy.
Investor confidence wavered in the latter part of the year amid growing anxiety about the spike in cases across the United States, Europe, and elsewhere, as well as the emergence of a new, more infectious strain of the virus. However, investors enthusiastically greeted news of the development of coronavirus vaccines, anticipating that their successful, widespread deployment would provide a pathway for the world economy to normalize in 2021. Stock markets worldwide received an additional boost in November when Democratic Party nominee Joe Biden was declared the winner in the US presidential election, with investors hopeful that the new administration would, among other things, enact more stable global trade policies than its predecessor.
Annual Report 5
Against this backdrop, stock market performance in 2020 was mostly positive in the developed world and emerging Asia, while uniformly negative in the rest of the developing world. In Europe, the combination of encouraging vaccine news, stimulus initiatives by the European Central Bank and European Union (“EU”) policymakers, and news that the United Kingdom (“UK”) and the EU had agreed upon a free trade deal that resolved the last sticking point in the Brexit saga led to a surge in Europe’s equity markets. In Japan, positive momentum on coronavirus vaccine development, an ultra-low interest rate environment, and attractive valuations lifted the country’s stock market to its highest level in 31 years. Meanwhile, South Korea’s stock market was among the best performing in the developing world, as investors were bullish on the country’s economic outlook and confident that its chipmakers were well positioned to benefit from an expected near-term semiconductor upcycle.
Technology was the best performing international equity sector in 2020, as traders bid up shares of companies with resilient business models and reliable earnings. Energy was the worst performing sector, as shares of oil producers came under pressure from weakened demand for oil amid heightened global economic uncertainty caused by the coronavirus pandemic.
US Equities
For the year ended December 31, 2020, the US equity market rose despite seesawing risk sentiment amid mixed news flow and formidable macro challenges.
The US stock market entered 2020 on an upswing, thanks to encouraging domestic economic data, progress in the US-China trade war, and a new trade deal with Canada and Mexico. However, market optimism gave way to indiscriminate selling in mid-February through the latter part of March, as the coronavirus epidemic that began in China became a full-scale pandemic, and investors worried about the threat it posed to the global economy. As the US became a hub for the viral outbreak, at least one-fourth of the US economy was taken offline in an effort to contain the public health emergency.
6 Annual Report
In response, the Fed and fiscal policymakers initiated aggressive stimulus measures to mitigate the economic fallout from the intensifying viral outbreak. Despite stiffening headwinds, which included a severe economic downturn in the first quarter and mass unemployment, the Fed’s actions buoyed investor confidence that the Fed would continue to act when necessary to support risk assets and backstop the US economy. This support, along with solid quarterly corporate results, led to a sharp rally in the US stock market.
Investor optimism dimmed in the latter part of the year amid growing anxiety about the spike in cases across the US, as well as the emergence of a new, more infectious strain of the virus, which led to fears of another round of economically punishing lockdowns. However, news of the development of coronavirus vaccines was greeted enthusiastically by investors, who bet that its successful, widespread deployment would provide a pathway for the US economy to normalize in 2021. The US stock market received an additional boost from a market-friendly result from the country’s November elections and the signing of another fiscal relief bill.
Against this backdrop, the S&P 500® Index—the bellwether of the US equity market—climbed 18.4% for the year. Technology was the best performing S&P sector in 2020, particularly among large US companies with resilient business models and reliable earnings. Energy was the worst performing sector, as shares of oil producers came under pressure from weakened demand for oil amid heightened global economic uncertainty caused by the coronavirus pandemic.
Global Equities
For the year ended December 31, 2020, global equity markets rose sharply despite seesawing risk sentiment amid mixed news flow and formidable macro challenges.
Equities began the year positively, thanks to the truce in the US-China trade war, greater clarity on Brexit, and a global monetary easing cycle. However, market optimism gave way to indiscriminate selling in mid-February through the latter part of March, as the
Annual Report 7
coronavirus epidemic that began in China became a full-scale pandemic and investors worried about the threat it posed to the global economy.
With the US Federal Reserve taking the lead, central banks worldwide and government fiscal policymakers initiated aggressive stimulus measures to contain the economic fallout from the intensifying viral outbreak. Despite stiffening headwinds, which included severe economic downturns in several countries and regions of the world, these actions buoyed market confidence that central banks and governments would continue to act when necessary to backstop the world economy.
Investor confidence wavered in the latter part of the year amid growing anxiety about the spike in cases across the US, Europe, and elsewhere, as well as the emergence of a new, more infectious strain of the virus. However, news of the discovery of coronavirus vaccines was greeted enthusiastically by investors, who bet that their successful, widespread deployment would provide a pathway for the world economy to normalize in 2021.
Against this backdrop, stock market performance in 2020 was mostly positive in the developed world and emerging Asia, while uniformly negative in the rest of the developing world. In the US, positive momentum on coronavirus vaccine development, a market-friendly result from the country’s November elections, and monetary and fiscal relief initiatives drove stocks higher. Across the Atlantic, the combination of encouraging vaccine news, stimulus initiatives by the European Central Bank, and news that the UK and the European Union had agreed on a free trade deal that resolved the last sticking point in the Brexit saga led to a surge in Europe’s equity markets. Meanwhile, South Korean and Taiwanese equities were among the best performing in the developing world, as investors were bullish on the economic outlook and confident that its chipmakers were positioned to benefit from strong semiconductor demand.
8 Annual Report
Technology was the best performing sector in global markets in 2020, particularly among large US companies with resilient business models and reliable earnings. Energy was the worst performing sector, as shares of oil producers came under pressure from weakened demand for oil amid heightened global economic uncertainty caused by the coronavirus pandemic.
Global Infrastructure
In the year ended December 31, 2020, global equity markets were severely impacted by the worldwide spread of COVID-19. Infrastructure assets, especially those dependent on patronage, suffered as a result of restrictions on travel and self-isolation measures, brought about by the pandemic, which adversely impacted airports and toll roads. Meanwhile, railroads suffered due to the expected sharp drop in the movement of goods.
After the sharp sell-off in February and March, the combination of coordinated monetary stimulus measures initiated by global central banks and fiscal relief measures put in place by governments to contain the economic fallout of the viral outbreak helped calm investor fears. The process of easing COVID-19-related restrictions also added to investor optimism that global growth could be restored to pre-pandemic levels. However, investor confidence wavered in September, as a second wave of COVID-19 infections descended upon Europe, forcing a return to earlier pandemic protocols.
The introduction of two vaccines in the final months of the year provided increasing hope that the end of the global pandemic was in sight, despite subsequent challenges in administering widespread distribution amid a sharp increase in worldwide cases. Risk sentiment was further bolstered by a market-friendly result in the US elections and news that the UK and the EU had agreed to a free trade agreement, resolving the last sticking point in the Brexit saga.
Annual Report 9
Positive vaccine news boosted patronage infrastructure assets, and, as a result, airports, toll roads, and railroads all performed strongly in the last quarter of the year, although utility assets lagged the broader global equity market and infrastructure indices. For the full year, however, in local currency terms, global infrastructure indices ended a tumultuous 2020 down modestly, with utility assets performing well and airports down materially.
Lazard Developing Markets Equity Portfolio
For the year ended December 31, 2020, the Lazard Developing Markets Equity Portfolio’s Institutional Shares posted a total return of 19.33%, while Open Shares posted a total return of 18.97%, as compared with the 18.31% return for the MSCI Emerging Markets Index.
Stock selection in the communication services, consumer staples, energy, and industrials sectors, as well as in Russia, China, and South Korea, helped performance. Higher-than-index exposure to the communication services, financials, and information technology sectors contributed. Lower-than-index exposure to the consumer staples and real estate sectors, as well as to Mexico, Poland, Saudi Arabia, Malaysia, and Thailand, also benefited. Chinese gaming and social media company,Tencent, continued to do well on high user engagement, a rebound in advertising, and a strong mobile games offering. South Korean technology company, Samsung Electronics, moved higher on a more favorable outlook for memory and a rebounding smartphone market. Taiwanese semiconductor foundry,Taiwan Semiconductor Manufacturing Company, rose on strong demand for its advanced node processing. Wuliangye, a Chinese premium spirits manufacturer, outperformed as management executed on its strategy to deliver growth by developing the group/corporate purchase channel. Chinese e-commerce company, Alibaba, performed well on increased online demand for goods and services driven by the COVID-19 pandemic.
Conversely, stock selection in the consumer discretionary, financials, and materials sectors undercut performance. Stock selection in South Africa, India, and Philippines also detracted value. Lower-than-index exposure to China and higher-than-index exposure to
10 Annual Report
the industrials sector as well as to Colombia, Peru, India, and Philippines, hurt performance. Chinese energy company, CNOOC, was weak on concerns that it would be included in a list of companies with ties to the Chinese military banned from investment by US investors. Bancolombia, the largest bank in Colombia, fell as a result of weak oil prices. China-based social networking platform MOMO underperformed on the announcement of a restructuring of its core business and ongoing weakness in engagement levels for its dating app. BDO Unibank, the largest bank in the Philippines, underperformed after it posted results that were shy of market expectations. South Africa-based, Standard Bank, underperformed on the back of the country’s credit downgrade and the weak South Africa rand.
Lazard Emerging Markets Core Equity Portfolio
For the year ended December 31, 2020, the Lazard Emerging Markets Core Equity Portfolio’s Institutional Shares posted a total return of 11.98%, while Open Shares posted a total return of 11.66% and R6 Shares posted a total return of 11.97%, as compared with the 18.31% return for the MSCI Emerging Markets Index.
Stock selection in the consumer discretionary, financials, materials, and energy sectors, as well as in Brazil, China, the Philippines, Russia, and India detracted from performance in the period. Additionally, an underweight to the health care sector further detracted from returns. Brazil was one of the worst performing markets over the period due to its relatively large exposure to financials and energy securities, sectors that were particularly impacted by global growth concerns. The Portfolio’s holdings of Banco do Brasil, a bank, and IRB Brasil Resseguros, a reinsurance business, underperformed. Additionally, IRB experienced share price weakness following the publication of a short report by a local investor. The share price of Lukoil, a Russian oil and gas company, moved lower along with the price of oil and commodity prices on global growth concerns. Industrial and Commercial Bank of China, a leading Chinese bank, reported weaker net profit for the first half of 2020 due to an increase in impairment losses amid the COVID-19 pandemic. BDO Unibank, the largest bank in the Philippines, underperformed on rising provisions during the first half of the year.
Annual Report 11
In contrast, the impact of stock selection in the communication services, consumer staples, and health care sectors, as well as within Taiwan and Poland, was positive. An overweight to information technology further helped over the period. Taiwan Semiconductor Manufacturing Company, a Taiwanese semiconductor foundry, jumped higher on expectations that it could receive new orders from Intel. Techtronic Industries, a Chinese manufacturer of power equipment and floor care products, including brands such as Milwaukee, Ryobi, Hoover, and Dirt Devil, reported stronger earnings for the first half of 2020, aided by new product development and successful distribution through e-commerce channels. Wuliangye Yibin, a premium maker of alcoholic beverage baijiu in China, outperformed due to strong demand recovery and price increases by year-end. Wuxi Biologics, a Chinese health care company, engaged in the development of biologics services, was a top performer on strong earnings growth, driven by numerous COVID-19 projects and contracts. Supported by strong sales from its lineage mobile series and a strong pipeline of content, NCSoft Corporation, a South Korean gaming company, rebounded over the period.
Lazard Emerging Markets Equity Advantage Portfolio
For the year ended December 31, 2020, the Lazard Emerging Markets Equity Advantage Portfolio’s Institutional Shares posted a total return of 17.40%, while Open Shares posted a total return of 17.10%, as compared with the 18.31% return for the MSCI Emerging Markets Index.
The Portfolio finished the year with returns near that of its benchmark in spite of a difficult fourth quarter. Favorable sector positioning accounted for the year’s attractive return offset, partially by residual cash and weakness in stock selection. Overweight exposure to information technology and underweight exposure to financials consistently benefited the Portfolio throughout the year. The underweight exposure to consumer discretionary partially offset this benefit. Stock selection was strong in information technology and industrials, but this was more than offset by weakness in materials and financials. Stock selection was strong in Taiwan and Thailand for the year, but China proved challenging, especially in the last quarter of the year.
12 Annual Report
Stocks that aided return in the year included Taiwan Semiconductor Manufacturing Company, the world largest semiconductor manufacturer. The steady increase for chips for smart phones, gaming devices, and home appliances drove a steady increase in revenue, and margins reached peak levels. Production issues with the company’s major competitor also aided the stock. Delta Electronics soared throughout the year. The company benefited from the demand for video conferencing, and its entry as a supplier to electric vehicles has propelled the stock. The Portfolio steadily took profit in the stock. Great Wall Motor has seen a pick-up in sales despite the pandemic, and the introduction of a new fleet has attracted investor interest. A weaker rupee has also improved the company’s price competitiveness.
In contrast, positions that detracted from the year’s performance included the lack of exposure to NIO, the Chinese electric vehicle manufacturer, which rose 1,100% in the year. China Minsheng Banking detracted from performance as it struggled throughout most of the year and underperformed the sector. Despite management efforts to tighten underwriting, the company’s loan portfolio has seen an escalation in non-performing loans and top line revenue growth has been weak. IRB Brasil Resseguros detracted from performance as it was accused of accounting deception by a hedge fund that was short the stock. Berkshire Hathway detracted on allegations of corporate malfeasance that resulted in the dismissal of the company’s president. While the allegation was not substantiated, the Portfolio management team exited the position.
Lazard Emerging Markets Equity Blend Portfolio
For the year ended December 31, 2020, the Lazard Emerging Markets Equity Blend Portfolio’s Institutional Shares posted a total return of 14.74%, while Open Shares posted a total return of 14.39%, as compared with the 18.31% return for the MSCI Emerging Markets Index.
Annual Report 13
Performance was hurt by the Portfolio’s allocation to value and small cap stocks. Other detractors included stock selection in banks and technology hardware companies, as well as higher-than-index exposure to banks and an underweight to retailing industries. By country, stock selection in China, South Korea, and Brazil, as well as higher-than-index exposure to Indonesia and an underweight to Taiwan, hurt performance.
In contrast, the Portfolio benefited from exposure to growth stocks. There were positive stock selection contributions from the food & beverage, media & entertainment, and materials industries. Higher-than-index exposure to the media & entertainment and software & services industries, and a below index weight to real estate sector, also contributed. Performance was also helped by stock selection in Russia, and India, as well as overweight exposure to South Korea and underweight exposures to South Africa and Thailand.
Lazard Emerging Markets Equity Portfolio
For the year ended December 31, 2020, the Lazard Emerging Markets Equity Portfolio’s Institutional Shares recorded a total return of -0.04%, while Open Shares posted a total return of -0.29% and R6 Shares posted a total return of -0.01%, as compared with the 18.31% return for the MSCI Emerging Markets Index.
A lower-than-benchmark exposure to the consumer discretionary sector and to China and Taiwan hurt relative performance. Higher-than-benchmark exposure to the financials sector, and to Russia and Indonesia, also detracted. Shares of Banco do Brasil, a Brazilian bank, were hurt by declining lending rates, falling net interest margins, and the expectation for deteriorating credit trends in Brazil. Shares of IRB Brasil, a Brazilian reinsurance company, were weaker after the regulator announced its intention to carry out a special inspection regarding the coverage of technical provisions due to the recent weakness in the real. CNOOC, a Chinese energy company, declined on lower oil prices due to the COVID-19 crisis and concerns that they would be on a list of companies with ties to the Chinese military banned from investment by US investors. CCR, a Brazilian toll-road operator, underperformed on expectations that the COVID-19 pandemic would lead to declines in traffic
14 Annual Report
volumes. Tupras, a Turkish oil refining company, was negatively affected by the COVID-19 pandemic and experienced meaningful declines in demand for its products, which also resulted in lower refining margins. Security selection within the communication services, information technology, financials, energy, industrials, consumer discretionary, health care, and materials sectors hurt relative performance. Security selection within China, Korea, and Brazil also detracted from returns.
In contrast, a lower-than-benchmark exposure to the communication services and real estate sectors, and a higher-than-benchmark exposure to the information technology sector and to Korea, helped relative performance. Korean chipmakers Samsung Electronics and SK Hynix, a manufacturer of electronic products and a semiconductor company, respectively, benefited from rising memory prices. Taiwan Semiconductor Manufacturing Company rose on strong foundry demand during the year and expectations that 2021 demand will remain robust. Infosys, an Indian provider of information technology services, benefited from growing confidence that the strong information technology service demand experienced in the second half of the year would continue. Shares of Baidu, a Chinese online search engine, rose as the Chinese advertising market continued to recover and after the company announced it would increase focus on its autonomous driving software. Security selection within the utilities sector and within Taiwan, Mexico, and Russia added value.
Lazard Equity Franchise Portfolio
For the year ended December 31, 2020, the Lazard Equity Franchise Portfolio’s Institutional Shares posted a total return of 1.15%, while Open Shares posted a total return of 0.90%, as compared with the 15.90% return for the MSCI World® Index.
H&R Block (HRB) detracted from performance in 2020. The US-based tax preparation firm reported losses compared to a year ago due to a smaller income-tax benefit compared with a year earlier. Italian infrastructure giant Atlantia’s share price suffered over the period from the resurgence of regulatory risk linked to the news that the Italian government may potentially remove the country’s
Annual Report 15
motorway concessions. Atlantia’s shares were also hurt when movement was restricted in Italy and throughout Europe due to the pandemic, heavily affecting on the company’s motorway network and its airports, including the closure of one of its two airports in Rome. Given the heavy impact on traffic and a more aggressive financial structure following the acquisition of Abertis, we decreased Atlantia’s position in the Portfolio.
In contrast, US-based freight rail network Norfolk Southern performed strongly over the year. Its share price fell sharply at the start of the pandemic but by June 30, 2020 had recovered most of the decline. Rail volumes were lower than previous years and we believe they will be negatively affected for as long as the economic impact of the pandemic continues. However, the company displayed strong cost management in its first-quarter earnings results, showing it had reduced headcount and other costs to such an extent that it was able to report higher the first quarter operating margins. The volume contraction appears to be assisting with the speed of the Precision Scheduled Railroading programs, which improves operating metrics, by lowering costs, and capital requirements. Longer term, our view remains positive on the company’s ability to generate returns on invested capital. US-based luxury goods retailer Tapestry continued to contribute to positive performance for the Portfolio during 2020, thanks to market confidence that the company will emerge from the COVID-19 crisis stronger in terms of brand positioning and value chain, as well as operational management.
Lazard Global Equity Select Portfolio
For the year ended December 31, 2020, the Lazard Global Equity Select Portfolio’s Institutional Shares posted a total return of 15.97%, while Open Shares posted a total return of 15.67%, as compared with the 16.26% return for the MSCI ACWI.
Stock selection in the consumer discretionary sector detracted from performance. UK-based caterer Compass Group saw its stock price falter due to changes in behavior due to the COVID-19 pandemic (e.g., work from home, sporting events without spectators, etc.), which materially affected the company’s business and
16 Annual Report
improvement is taking longer than anticipated. We exited our position in order to invest in what we believe were more attractive opportunities. Stock selection and an overweight to the consumer staples sector also detracted from performance. Shares of Tesco, the UK food retailer, lagged as the market recovered from March lows on concerns about margin pressure from supply chain difficulties, product mix, and costs associated with social measures.
Stock selection in the financials sector contributed to performance. The performance was helped by a position in brokerage firm Charles Schwab, which saw its shares rise after reporting strong third-quarter results, including solid new flows and large increases in cash balances. Lack of exposure to the energy sector also contributed to performance.
Lazard Global Listed Infrastructure Portfolio
For the year ended December 31, 2020, the Lazard Global Listed Infrastructure Portfolio’s Institutional Shares recorded a total return of -4.48%, while Open Shares posted a total return of -4.68%, as compared with the -2.72% return for the MSCI World Core Infrastructure® (Hedged) Index and 15.90% return for the MSCI World Index.
Atlantia’s share price suffered from the resurgence of regulatory risk linked to the news that the Italian government may potentially remove its Italian motorway concessions. Fraport, owner of Frankfurt airport, detracted from performance as the company clarified its longer-term outlook in the face of COVID-19-related falls in air traffic. It is now expecting an 80% decrease in traffic over the winter season and longer-term (until 2023) for traffic to be 15% lower than pre-pandemic levels due to fleet reductions from Lufthansa and systematically lower corporate travel. The company is looking to reduce staffing by around 4,000 and has pushed back the Terminal 3 capital expenditure program but has not yet abandoned it. Early in the year, leading satellite operator SES reported calendar year 2019 results in-line with market expectations. However, the share price fell on a notable decline in its announced proposed dividend, as well as lowering its fiscal year guidance due to the next phase of its previously announced transformation. In our view, the
Annual Report 17
decision to reduce the dividend was prudent in light of a large capital expenditure program planned for 2021 totaling € 1.3 billion. We believe the reduction in dividend would allow SES to be able to fund the entire program without needing to access capital markets.
In contrast, US freight rail networks Norfolk Southern and CSX performed strongly over the year. The share prices of these freight rail companies fell sharply at the start of the COVID-19 pandemic, but by June 30, 2020 they had recovered most of the decline. Rail volumes for both railroads continue to be lower than previous years and we believe they will be negatively affected for as long as the economic impact of the pandemic continues. Both companies displayed strong cost management at their first quarter profit results, showing they had reduced headcount and other costs to such an extent that they were able to report higher first quarter operating margins.
Lazard Global Strategic Equity Portfolio
For the year ended December 31, 2020, the Lazard Global Strategic Equity Portfolio’s Institutional Shares posted a total return of 21.48%, while Open Shares posted a total return of 20.96%, as compared with the 16.26% return for the MSCI ACWI.
The Portfolio defended during the market weakness in the first quarter, advancing slightly ahead of the subsequent recovery, then outperformed again in the fourth quarter as COVID-19 vaccines were announced and value stocks rallied. Relative performance was driven by stock selection, underscoring the flexibility and opportunistic approach of the strategy. The Portfolio outperformed despite significant relative performance headwinds from not owning Apple, Amazon, and Tesla. Contributors included Siemens Gamesa Renewable Energy, a provider of onshore and offshore wind power, which benefited from the improved economics of renewables. Both China and the US are placing a greater focus on the energy transition to a net zero carbon economy, and the incoming Biden Administration is set to rejoin the Paris Climate Agreement. The company also reported strong backlog growth in its higher margin offshore and services segments. Genmab, the Danish biotech firm, advanced, as its multiple myeloma drug
18 Annual Report
Darzalex was approved for home injection, potentially expanding its applications. QIAGEN, the Dutch molecular diagnostic company, posted favorable results as it began to ship evaluation samples of its coronavirus test kits.
In contrast, Suncor Energy, the Canadian oil producer, saw its stock price fall on lower oil prices as the global economy was hit by the pandemic. Informa, the global business-to-business event organizer, was caught in the “eye of the storm” as the pandemic limited travel. The company moved quickly with a rights issue that should provide the balance sheet resilience to operate through a recovery phase. It began to recover towards the end of the year with the prospect of a vaccine and the normalization of business travel and the international conference schedule. Tesco, the UK food retailer, appreciated slightly over the year but lagged the market recovery. Sales had outpaced its low-cost rival Aldi, but a remuneration committee proposal to change the executive compensation comparative peer group caused investor consternation.
Lazard International Equity Advantage Portfolio
For the year ended December 31, 2020, the Lazard International Equity Advantage Portfolio’s Institutional Shares posted a total return of 5.41%, while Open Shares posted a total return of 5.14%, as compared with the 7.82% return for the MSCI EAFE Index.
The year proved a difficult one for the Portfolio, as the market was driven primarily by the single macro theme of COVID-19. Performance was concentrated into a narrow group of stocks with increasingly expensive multiples. The three sharp rotations—COVID onset in February, sharp rebound in April, and vaccine announcement—prompted market leadership shifts, which were difficult to assimilate into our investment process. The rotation of stocks in response to these events tended to place more importance on individual company financial characteristics than on industry and sector exposure. This was illustrated by the Portfolio’s exposure to the transportation industry during the year. The Portfolio had a modest overweight to the airlines (i.e., Air France and Japan Airlines) as we entered the year. As the pandemic spread, these companies sold off massively, and we subsequently eliminated airline
Annual Report 19
exposure across the Portfolio. To control risk relative to the benchmark, we rotated into railroads as their cargo freight was expected to provide a stable form of income. These stocks held up through October but underperformed with the positive news on vaccines. Airline and shipping companies rallied over 40% in the last quarter.
The Portfolio had the greatest excess returns relative to the benchmark in the materials, communication services, and energy sectors. Holdings in materials were helped by holdings in hard metals companies (i.e., gold and iron ore) and underweight exposure to several major chemical concerns. The communication services sector was dominated by the global rollout of 5G, with several of the European telecom companies suffering losses as they announced capital expenditures to upgrade their infrastructure. The Portfolio benefited from the decision by NTT to buy its remaining interest in NTT DoCoMo. Energy stocks were the worst performing sector, as an oversupply, weakening demand due in part to the pandemic, and shift to alternative energy sources all weighed on the sector. The Portfolio’s lack of exposure to the largest integrated oil producers in the sector helped as they suffered losses averaging close to 40%.
The industrials sector was challenging for all of 2020. The Portfolio’s positions in many airline and related stocks at the beginning of the year (i.e., Quantas, Japan Airlines Fly Leasing, MTU Aero) hurt after the COVID-19 pandemic effectively curtailed all air travel. The Portfolio’s exposure was conservatively positioned throughout most of the final three quarters of the year, missing the fourth-quarter sharp rally in more cyclical names such as Airbus, Rolls Royce, and Siemens. Consumer discretionary also saw significant rotation where we sold homebuilders and more economically sensitive stocks in March and rotated into lower risk names. These stocks outperformed in the relief rally, thereby adversely impacting results.
Lazard International Equity Concentrated Portfolio
For the year ended December 31, 2020, the Lazard International Equity Concentrated Portfolio’s Institutional Shares posted a total
20 Annual Report
return of 0.47%, while Open Shares posted a total return of 0.33%, as compared with the 10.65% return for the MSCI ACWI ex-US.
Most of the negative performance attribution came from the consumer discretionary sector, which cost the Portfolio 6.9% of performance relative to the benchmark. Samsonite, the maker of travel luggage, was hit very hard by COVID-19, with its business coming to a near standstill. We believe that management has done a solid job in managing through the pandemic, but the stock still fell by 58% in the year. Samsonite is (normally) an incredibly stable business model, with moderate financial leverage, but during this exceptional downturn the market became concerned about the financial leverage of the company. We were also concerned and sold the position. Also within the sector, Compass Group a UK-based caterer was hit hard by the pandemic. The stock suffered after the market slowly began to realize that lockdowns would become common and frequent in the company’s key markets, with a significant level of disruption caused to offices, factories, sporting events, and universities. The ongoing threat of a more sustained working-from-home environment as the “new normal”, even after widespread vaccination, meant that expectations of the long-term earnings power of the business were materially reduced.
In the consumer staples space, Arca Continental performed very poorly, costing the Portfolio 1.8% in relative performance. This leading Mexican Coca-Cola bottler was hit by small earnings downgrades from a lower “out of home” business, but was also hit hard by the very acute depreciation in the Mexican peso. It was a large position, warranted by what we believed to be a very stable business model, hence the outsized effect. In the information technology space, Hitachi performed poorly, which was disappointing in the context of the strong Japanese market. Management guided very conservatively in terms of future results for the company’s fiscal year and in March 2021. There was also a technical but large effect from acquisition accounting for ABB, which resulted in depressed accounting profit by a non-cash item.
The Portfolio’s best performing sectors were industrials and real estate. Siemens Gamesa added 1.9% to relative returns, as the
Annual Report 21
stock was highlighted as a champion of environmental, social, and governance (ESG), with its dominant offshore wind exposure being seen as a key area of future investment by governments globally. In real estate, Germany-based Vonovia was strong, as the resilience of the business model become apparent. In Germany, the government offers generous financial support to backstop rental payments during times of unemployment. Persistently low interest rates meant that the strong yield and price appreciation of the assets were appreciated by the market.
Lazard International Equity Portfolio
For the year ended December 31, 2020, the Lazard International Equity Portfolio’s Institutional Shares posted a total return of 8.76%, while Open Shares posted a total return of 8.43%, and R6 Shares posted a total return of 8.79%, as compared with the 7.82% return for the MSCI EAFE Index.
Stock selection was positive in Europe and Japan, while positioning in emerging markets was also beneficial. Japan-based video game manufacturer Nintendo was a top contributor, with shares rising more than 60% in 2020, thanks in part to strong third-quarter results that saw a significant rise in both gross and operating margins and bullish sentiment about upcoming game releases. Global power tool manufacturer Makita saw its stock price rise more than 40% in 2020, with sales and operating profit significantly outpacing consensus expectations. Shares of Vestas Wind Systems boosted performance, gaining more than 130% in the year. The Denmark-based turbine maker’s most recent quarterly report saw revenue exceed expectations. Shares of Spain-based lender Banco Santander S.A. advanced as part of a larger rally in bank stocks, fueled mostly by positive coronavirus vaccine news in the fourth quarter.
In contrast, stock selection in the consumer discretionary, health care, and information technology sectors detracted from relative returns, as did the Portfolio’s lower-than-benchmark exposure to Japan. With oil prices under pressure due to weakened demand from the coronavirus pandemic, shares of Canadian oil company Suncor faltered, ending the year down nearly 50%, as part of a
22 Annual Report
larger decline in oil producer stocks. Shares of Compass Group saw its stock price fall on fears about the UK-based catering company’s earnings outlook after a significant portion of its business was shut due to the coronavirus pandemic. We sold the stock in the third quarter. UK-based supermarket operator Tesco saw its stock price end the year flat despite rising nearly 20% in the fourth quarter. Shares were weighed down on fears about margin pressure after the supermarket operator warned that it expected to spend £925 million to cover the costs of additional staff and operating expenditures to deal with the impact of the coronavirus outbreak.
Lazard International Equity Select Portfolio
For the year ended December 31, 2020, the Lazard International Equity Select Portfolio’s Institutional Shares posted a total return of 8.33%, while Open Shares posted a total return of 8.02%, as compared with the 10.65% return for the MSCI ACWI ex-US Index.
Underperformance in the year was driven by poor stock selection in the consumer discretionary and information technology sectors. From a regional perspective, stock selection hurt in emerging markets and North America. In contrast, stock selection in the communication services and industrials sectors was strong, as well as in Europe and Japan. Compass Group saw its stock price falter after the UK-based caterer announced that it would issue £2 billion in equity to reinforce the balance sheet and remove any liquidity questions from the investment. We sold the stock in the third quarter on concerns about the company’s near-term outlook. Shares of Brazilian insurer IRB Brasil fell, after a short-seller claimed that the company was overvalued and was reporting one-off gains within net income, which management indicated were more recurring in nature. After multiple missteps from management and the subsequent exit of the CEO/CFO, we viewed our investment thesis as broken and exited the position. After suffering greatly from the combined effect of supply and demand shocks early in 2020, the energy sector led the market after the announcement of successful vaccine trials in the fourth quarter. Suncor shares rose nearly 40% in the fourth quarter, but ended the year down nearly 50%.
Annual Report 23
In contrast, Nintendo saw its share price rise more than 60% after the Japanese video game manufacturer reported strong growth in both gross margins and operating margins. Investors were also bullish on the potential sales of new release games. Shares of global power tool manufacturer Makita gained more than 40%, with sales and operating profit significantly outpacing consensus expectations. Denmark-based wind turbine maker Vestas Wind Systems A/S, develops, manufactures, and markets wind turbines. The stock advanced significantly this year, thanks largely to strong revenue growth, as the company’s most recent report saw revenue beat estimates by 21% in original equipment and 2% in service. Services margins hit 28.6% driving group EBIT 13% and net income 8% ahead of expectations.
Lazard International Equity Value Portfolio
For the year ended December 31, 2020, the Lazard International Equity Value Portfolio’s Institutional Shares posted a total return of -3.81%, while Open Shares recorded a total return of -4.06%, as compared with the 7.82% return for the MSCI EAFE Index.
Value stocks faced stiff headwinds in 2020, resulting in the Portfolio underperforming its benchmark, the MSCI EAFE Index. Almost all of the Portfolio’s negative attribution in the year occurred during the first quarter when the COVID-19 pandemic forced an unprecedented suspension of operations among several companies owned in the Portfolio. Since the end of the first quarter, however, the Portfolio strongly outperformed its benchmark, as well as the MSCI EAFE Value Index. Shares of Spanish lender Banco Santander retreated due to falling interest rates, margin pressure, and worries regarding the company’s balance sheet and capital generation. Shares came under further pressure after the bank reported mixed results during the year. While cost control was good, higher loan loss provisions, particularly in the UK and Brazil, larger-than-expected write-downs of goodwill and deferred tax assets, and the announcement of a scrip dividend, in place of cash, disappointed some investors.
24 Annual Report
Shares of Kion Group were a top contributor after the Germany-based industrial equipment manufacturer released better-than-expected results that highlighted the company’s upside potential, with forklift demand better than expected and warehouse automation orders growing sharply.
Lazard International Quality Growth Portfolio
For the year ended December 31, 2020, the Lazard International Quality Growth Portfolio’s Institutional Shares posted a total return of 23.95%, while Open Shares posted a total return of 23.63%, as compared with the 10.65% return for the MSCI ACWI ex-US Index.
Stock selection in the financials sector contributed to performance. A position in Swedish online retail broker Avanza Bank contributed to performance. Shares rose sharply as the company reported record profits due to strong brokerage income and new customer growth amid the high market volatility this year. We subsequently sold our position in the stock. Stock selection in the health care sector also contributed to performance. Shares of Genmab, a specialized antibody company with a focus on cancer treatments, rose on strong sales of its multiple myeloma drug, Darzalex, and investors appreciated its robust emerging pipeline.
In contrast, stock selection in the consumer discretionary sector detracted from performance. A position in UK-based caterer Compass Group detracted from performance. The company has a very strong competitive position in our view, and it has historically generated robust return on capital. However, changes in behavior due to COVID-19 (individuals working from home, sporting events without spectators, etc.) have materially affected their business, and improvement is taking longer than anticipated. As a result, we exited the Portfolio’s position in order to invest in what we believe were more attractive opportunities. An underweight to the materials sector also detracted, as shares of mining companies rose, along with commodity prices such as iron ore and copper, in the second half of the year.
Annual Report 25
Lazard International Small Cap Equity Portfolio
For the year ended December 31, 2020, the Lazard International Small Cap Equity Portfolio’s Institutional Shares posted a total return of 13.44%, while Open Shares posted a total return of 13.15%, as compared with the 12.34% return for the MSCI EAFE Small Cap® Index.
On a sector basis, stock selection drove positive overall attribution in spite of moderate headwinds from allocation effects. Stocks within the real estate, industrials, and financials sectors contributed the most to relative returns while those in the consumer discretionary, utilities, and healthcare sectors detracted the most.
Germany-based online brokerage and financial services company flatexDEGIRO, contributed to relative performance. The company benefited from increased volatility in markets, which provided a favorable backdrop for market share gains versus its peers. fla-texDEGIRO also delivered better-than-expected results from a recently completed transformative acquisition. The Portfolio continues to hold the shares.
Belgium-listed movie theater operator Kinepolis detracted after the company’s business was negatively impacted by falling demand because of the COVID-19 pandemic. In addition, concern increased among some investors that the virus accelerated a secular shift in consumer behavior towards watching movies at home rather than in the theater. The Portfolio no longer holds the shares.
Lazard International Strategic Equity Portfolio
For the year ended December 31, 2020, the Lazard International Strategic Equity Portfolio’s Institutional Shares posted a total return of 10.58%, while Open Shares posted a total return of 10.34%, and R6 Shares posted a total return of 10.64%, as compared with the 7.82% return for the MSCI EAFE Index.
Stock selection drove the Portfolio’s outperformance in the year. Some of the best-performing stocks were net beneficiaries of the global pandemic crisis. Power tools company Makita benefited from households prioritizing spending on their homes, while
26 Annual Report
video game stocks Nexon and Ninetendo saw a jump in sales. ESR reported strong demand for space in its e-commerce and third party logistics properties, while Accenture saw resilient demand for digital transformation projects. Industrials sector company ABB began to realize benefits from its restructuring, while Genmab reported encouraging sales and partnerships for some of its key drugs. Low-cost airline Ryanair is considered to have strengthened its competitive position in a difficult period for the aviation industry and that helped the stock outperform for the year. The stock that added the most value to the Portfolio was Siemens Gamesa, the leading global maker of offshore wind turbines, which combined an acceleration in the outlook for energy transition with progress on its own internal restructuring under new management. Owning very few mainstream banks also helped relative performance.
On the negative side, the Portfolio was hurt by holding a number of companies that would normally be considered resilient in a crisis, but suffered from the very unusual circumstances of the pandemic. These included consumer staples companies such as Coca-Cola’s European and Mexican distributors, which sell much of their product to bars and restaurants. In addition, aerospace companies such as pilot training firm CAE and supplier Safran suffered, and the utilities sector company Engie, which normally conducts a range of facility management services for clients, underperformed. Another underperforming company, Informa, makes the majority of its profits in a normal year from exhibitions, and these were severely curtailed due to the pandemic. On a relative basis, the Portfolio’s performance was also hurt by not owning some of the stocks that performed well during the crisis, such as e-commerce and luxury companies.
Lazard Managed Equity Volatility Portfolio
For the year ended December 31, 2020, the Lazard Managed Equity Volatility Portfolio’s Institutional Shares posted a total return of -5.18%, while Open Shares posted a total return of -5.34%, as compared with the 15.90% return for the MSCI World Index.
Annual Report 27
Unfavorable stock selection and sector allocations accounted for the performance shortfall during the year. Stock selection was favorable in only one of eleven sectors, materials. Holdings in industrials and consumer discretionary detracted the most. The underweights to energy and financials provided the greatest value in terms of sector positioning; however, this was more than offset by the underweight to information technology and overweight to consumer staples. Regionally, stock selection was strongest in Asia ex-Japan and weakest in the United States and Europe.
Detractors for the year included Simon Property Group, the biggest US mall owner, which furloughed about 30% of its workforce, as the company had to cope with all of its properties being temporarily shut because of the coronavirus pandemic. The furloughs affected full and part-time workers at its Indianapolis headquarters and at its malls and outlet centers across the United States. We sold our position as we looked to reduce the Portfolio’s exposure to real estate investment trusts (REITs). The COVID-19 environment heavily affected National Retail Properties, in line with the majority of retail-heavy REITS. Restaurant chain operator Darden Restaurants, was severely impacted by lockdown restrictions brought about by the pandemic. We sold the Portfolio’s position in Darden Restaurants as well.
Stocks that contributed to the Portfolio’s 2020 return included Fortescue Metals, which finished the year up strongly as iron ore prices soared late in the year due to ongoing supply issues in Brazil where miner Vale trimmed its forecast for their 2020 output, pushing up prices that had already gained more than 80% last year. Target Corporation continued to outperform throughout the year. The company reported an online sales spike, the largest in its 58-year-history. NTT DoCoMo bought out and took private its mobile unit as it restructured for the 5G era. NTT Corp bought back the remaining 34% minority stake of NTT DoCoMo for $38 billion with a 40% premium.
28 Annual Report
Lazard US Equity Concentrated Portfolio
For the year ended December 31, 2020, the Lazard US Equity Concentrated Portfolio’s Institutional Shares posted a total return of 8.98%, while Open Shares posted a total return of 8.63% and R6 Shares posted a total return of 8.90%, as compared with the 18.40% return for the S&P 500 Index.
A position in construction materials maker Armstrong detracted from returns, as shares remained under pressure amid COVID-19 and secular headwinds facing construction. A position in payment processor Fiserv detracted from performance, as shares fell amid concerns that a recovery may be slow due to exposure to small businesses that have been especially impacted by the crisis and typically have higher fees. A position in dental products maker Envista also hurt returns, as shares fell amid demand headwinds during the pandemic. We sold our position in March, as our thesis was no longer valid.
In contrast, a position in home improvement retailer Lowe’s contributed to performance, as shares rose amid a surge in demand for home repair products during the pandemic. The Portfolio also benefited from its position in logistics technology provider Zebra, as shares rose after the company reported broadly strong quarterly results after the third quarter. Management also issued encouraging guidance for the fourth quarter, as demand from large customers began to recover following a pandemic-induced slowdown in corporate digital and e-commerce investment. A position in chipmaker Skyworks also contributed to performance, as shares rose after the company reported strong fourth quarter results with stable margins despite a difficult demand environment. The company has visibility on improving trends in China, and expected content increases in 5G.
Lazard US Equity Focus Portfolio
For the year ended December 31, 2020, the Lazard US Equity Focus Portfolio’s Institutional Shares posted a total return of 17.29%, while Open Shares posted a total return of 17.08% and R6 Shares posted a total return of 17.28%, as compared with the 18.40% return for the S&P 500 Index.
Annual Report 29
Stock selection in the information technology sector detracted from returns. In January 2020, shares of networking equipment maker Cisco fell after the company reported lackluster fourth-quarter results for 2019 and cautious guidance, citing continued macroeconomic uncertainty. Stock selection in the industrials sector also hurt performance. Shares of aerospace manufacturer Boeing fell amid a halt in demand driven by the pandemic. We sold our position in March, as our thesis was no longer valid.
In contrast, stock selection in the financials sector contributed to performance. Shares of diversified wealth manager Charles Schwab rose, as the company saw strong investor inflows throughout the year, while investors anticipated synergies and scale advantages from its $22 billion acquisition of TD Ameritrade, which closed in October. An underweight position in the energy sector also helped returns, as the sector was the worst performer in the index during the period.
Lazard US Small-Mid Cap Equity Portfolio
For the year ended December 31, 2020, the Lazard US Small-Mid Cap Equity Portfolio’s Institutional Shares posted a total return of 6.44%, while Open Shares posted a total return of 6.10% and R6 posted a since inception total return of 6.59%, as compared with the 19.99% return for the Russell 2500® Index.
Stock selection in the information technology sector detracted from performance. Shares of travel technology company Sabre fell, as a rapid decline in global travel hurt the company’s business and left its outlook unclear. We sold the Portfolio’s position in March, as our thesis was broken. Stock selection and an underweight position in the health care sector also hurt returns. Shares of dental products maker Envista fell, as the pandemic led to a significant decrease in demand for dental equipment. We also sold this position in March, as our thesis was broken.
In contrast, stock selection in the financials sector contributed positively to performance. Shares of financial data and ratings provider Morningstar rose after the company reported generally stronger-than-expected earnings, driven by its recently acquired
30 Annual Report
bond ratings business. A less-than-benchmark position in the energy sector also helped returns, as the sector was the worst performer in the index during the period.
The Portfolio’s relative value philosophy is implemented by assessing the relationship between valuation and financial productivity for an individual security. We believe that financial productivity (the return a company generates) measures how effectively a company is putting its shareholders’ capital to work, and ultimately this drives valuation. The Portfolio’s 2020 performance was disappointing and did not meet our standards. However, much of our underperformance can be attributed to the recent market environment, which has benefited companies with negative earnings and expensive valuations (as measured by price/earnings), and which has been narrowly concentrated in two sectors: health care and information technology. We have also seen certain stocks rally in response to their perceived “pandemic-winner” status, regardless of their underlying fundamentals.
At year end, companies with negative earnings for the year ended December 31, 2020 (“non-earners”) made up 25% of weight of the Russell 2500 Index, and greatly outperformed companies with positive earnings (“positive earners”) (during the second quarter—the height of the pandemic—non-earners outperformed positive earners by 1,900 basis points (“bps”).This was a difficult environment for the Portfolio, as we focus on financially productive companies, and non-earners typically do not align with our investment philosophy.
We have also seen the pandemic drive valuations in certain industries to extremes not seen since the dot-com bubble in the late 1990s. Three quarters into the year, performance had been driven primarily by the health care (+20.5%) and information technology (+13.4%) sectors, with all other sectors flat or negative, including some deep in the red (energy lost 58% and financials were down 27%). While some losers gained ground in the fourth quarter, all sectors were nonetheless eclipsed by gains in the information technology (+53%) and health care (+48%) sectors for the year. The Portfolio had been underweight the health care and information
Annual Report 31
technology sectors, as we believe that in many cases valuations in these sectors have recently expanded beyond reasonable levels. Given their positive contribution to the return of the benchmark, this positioning significantly hurt our relative performance in the past year.
The health care and information technology sectors combined detracted over 600 bps from the Portfolio’s performance over the year. Of the index names not held in the Portfolio, the five largest detractors from relative performance, all either health care or information technology stocks, detracted over 200 bps in the aggregate. Of these names, four of the five were negative earners. Because of their lack of fundamental underpinnings, the negative earners are not names that we would have considered owning, and thus we do not attribute the associated underperformance relative to the benchmark to be missed opportunities or stock selection mistakes, but rather a disconnect between the market’s preference for growth at any price and our preference for strong fundamentals that we believe define long-term winners. Despite exceptional moves and changes to the underlying forces of the market this year, we have not wavered from our conviction in our investment process.
Lazard US Sustainable Equity Portfolio
Since inception on June 30, 2020 through December 31, 2020, the Lazard US Sustainable Equity Portfolio’s Institutional Shares posted a total return of 22.69%, while Open Shares posted a total return of 22.48%, as compared with the 22.16% return for the S&P 500 Index for the period.
Stock selection in the information technology sector detracted from returns. Shares of Cisco fell after the networking equipment maker reported lackluster results in the fourth quarter of 2019 and cautious guidance, citing continued macroeconomic uncertainty. Stock selection in the consumer discretionary sector also hurt performance. Shares of Home Depot lagged following strong outperformance earlier in the year, and after the home improvement retailer announced the acquisition of HD Supply for $8 billion, a 23% premium to its stock prior to the announcement.
32 Annual Report
In contrast, stock selection in the health care sector contributed to performance. Shares of Medtronic rose on investor hopes that pent-up demand for elective surgeries postponed during the pandemic would help the medical device maker recover from earlier headwinds. A lack of exposure to the energy sector also helped returns, as the sector was among the worst performers in the index during the period.
Annual Report 33
The Lazard Funds, Inc. Performance Overviews (unaudited)
Lazard Developing Markets Equity Portfolio
Comparison of Changes in Value of $10,000 Investment in the Institutional Shares of Lazard Developing Markets Equity Portfolio and the MSCI Emerging Markets® Index*

Average Annual Total Returns*
Periods Ended December 31, 2020
| | | One
year | | Five
year | | Ten
year | |
| Institutional Shares** | | 19.33% | | 14.51% | | 2.50% | |
| Open Shares** | | 18.97% | | 14.10% | | 2.17% | |
| MSCI Emerging Markets Index | | 18.31% | | 12.81% | | 3.63% | |
34 Annual Report
Lazard Emerging Markets Core Equity Portfolio
Comparison of Changes in Value of $10,000 Investment in the Institutional Shares of Lazard Emerging Markets Core Equity Portfolio and the MSCI Emerging Markets Index*

Average Annual Total Returns*
Periods Ended December 31, 2020
| | | One
Year | | Five
Years | | Since
Inception | † |
| Institutional Shares | | 11.98% | | 10.11% | | 4.90% | |
| Open Shares | | 11.66% | | 9.73% | | 4.52% | |
| R6 Shares | | 11.97% | | N/A | | 4.35% | |
| MSCI Emerging Markets Index | | 18.31% | | 12.81% | | 5.59% | |
| | | | | | | (Institutional
and Open
Shares) | |
| | | | | | | 6.53% | |
| | | | | | | (R6 Shares) | |
| † | The inception date for the Institutional and Open Shares was October 31, 2013 and for the R6 Shares was April 6, 2018. |
Annual Report 35
Lazard Emerging Markets Equity Advantage Portfolio
Comparison of Changes in Value of $10,000 Investment in the Institutional Shares of Lazard Emerging Markets Equity Advantage Portfolio and the MSCI Emerging Markets Index*

Average Annual Total Returns*
Periods Ended December 31, 2020
| | | One
Year | | Five
Years | | Since
Inception | † |
| Institutional Shares** | | 17.40% | | 13.14% | | 7.78% | |
| Open Shares** | | 17.10% | | 12.82% | | 7.47% | |
| MSCI Emerging Markets Index | | 18.31% | | 12.81% | | 7.15% | |
| † | The inception date for the Portfolio was May 29, 2015. |
Lazard Emerging Markets Equity Blend Portfolio
Comparison of Changes in Value of $10,000 Investment in the Institutional Shares of Lazard Emerging Markets Equity Blend Portfolio and the MSCI Emerging Markets Index*

Average Annual Total Returns*
Periods Ended December 31, 2020
| | | One | | Five | | Ten | |
| | | Year | | Years | | Years | |
| Institutional Shares** | | 14.74% | | 11.60% | | 2.52% | |
| Open Shares** | | 14.39% | | 11.26% | | 2.23% | |
| MSCI Emerging Markets Index | | 18.31% | | 12.81% | | 3.63% | |
36 Annual Report
Lazard Emerging Markets Equity Portfolio
Comparison of Changes in Value of $10,000 Investment in the Institutional Shares of Lazard Emerging Markets Equity Portfolio and the MSCI Emerging Markets Index*
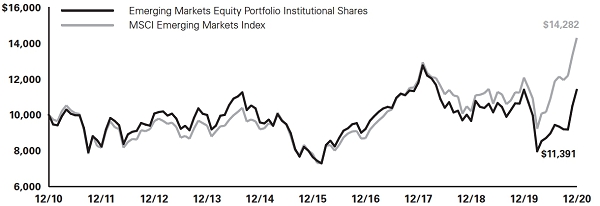
Average Annual Total Returns*
Periods Ended December 31, 2020
| | | One | | Five | | Ten | | Since | |
| | | Year | | Years | | Years | | Inception | † |
| Institutional Shares** | | –0.04% | | 8.32% | | 1.31% | | 6.38% | |
| Open Shares** | | –0.29% | | 8.04% | | 1.04% | | 6.08% | |
| R6 Shares** | | 0.01% | | 8.32% | | N/A | | 2.90% | |
| MSCI Emerging Markets Index | | 18.31% | | 12.81% | | 3.63% | | 6.08% | |
| | | | | | | | | (Institutional
Shares) | |
| | | | | | | | | 6.65% | |
| | | | | | | | | (Open Shares) | |
| | | | | | | | | 7.66% | |
| | | | | | | | | (R6 Shares) | |
| † | The inception date for the Institutional Shares was July 15, 1994, for the Open Shares was January 8, 1997 and for the R6 Shares was January 19, 2015. |
Annual Report 37
Lazard Equity Franchise Portfolio
Comparison of Changes in Value of $10,000 Investment in the Institutional Shares of Lazard Equity Franchise Portfolio and the MSCI World® Index*

Average Annual Total Returns*
Periods Ended December 31, 2020
| | | One | | Since | |
| | | Year | | Inception | † |
| Institutional Shares** | | 1.15% | | 6.24% | |
| Open Shares** | | 0.90% | | 5.97% | |
| MSCI World Index | | 15.90% | | 11.52% | |
| † | The inception date for the Portfolio was September 29, 2017. |
Lazard Global Equity Select Portfolio
Comparison of Changes in Value of $10,000 Investment in the Institutional Shares of Lazard Global Equity Select Portfolio and the MSCI ACWI®*

Average Annual Total Returns*
Periods Ended December 31, 2020
| | | One | | Five | | Since | |
| | | Year | | Years | | Inception | † |
| Institutional Shares** | | 15.97% | | 12.21% | | 9.23% | |
| Open Shares** | | 15.67% | | 11.88% | | 8.92% | |
| MSCI ACWI | | 16.26% | | 12.26% | | 8.87% | |
| † | The inception date for the Portfolio was December 31, 2013. |
38 Annual Report
Lazard Global Listed Infrastructure Portfolio
Comparison of Changes in Value of $10,000 Investment in the Institutional Shares of Lazard Global Listed Infrastructure Portfolio, the MSCI World Core Infrastructure (Hedged) Index and the MSCI World Index*

Average Annual Total Returns*
Periods Ended December 31, 2020
| | | One | | Five | | Ten | |
| | | Year | | Years | | Years | |
| Institutional Shares** | | –4.48% | | 8.22% | | 10.90% | |
| Open Shares** | | –4.68% | | 7.95% | | 10.59% | |
| MSCI World Index | | 15.90% | | 12.19% | | 9.87% | |
| MSCI World Core Infrastructure (Hedged) Index | | –2.72% | | 9.93% | | 9.95% | |
Annual Report 39
Lazard Global Strategic Equity Portfolio
Comparison of Changes in Value of $10,000 Investment in the Institutional Shares of Lazard Global Strategic Equity Portfolio and the MSCI ACWI*

Average Annual Total Returns*
Periods Ended December 31, 2020
| | | One | | Five | | Since | |
| | | Year | | Years | | Inception | † |
| Institutional Shares** | | 21.48% | | 12.07% | | 9.02% | |
| Open Shares** | | 20.96% | | 11.73% | | 8.69% | |
| MSCI ACWI | | 16.26% | | 12.26% | | 8.65% | |
| † | The inception date for the Portfolio was August 29, 2014. |
40 Annual Report
Lazard International Equity Advantage Portfolio
Comparison of Changes in Value of $10,000 Investment in the Institutional Shares of Lazard International Equity Advantage Portfolio and the MSCI EAFE® Index*
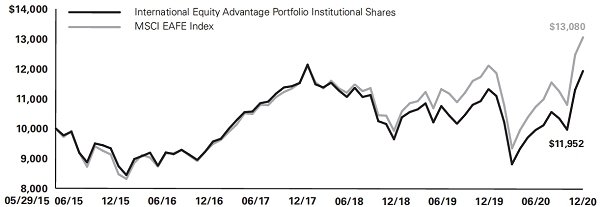
Average Annual Total Returns*
Periods Ended December 31, 2020
| | | One | | Five | | Since | |
| | | Year | | Years | | Inception | † |
| Institutional Shares** | | 5.41% | | 5.06% | | 3.24% | |
| Open Shares** | | 5.14% | | 4.76% | | 2.94% | |
| MSCI EAFE Index | | 7.82% | | 7.45% | | 4.93% | |
| † | The inception date for the Portfolio was May 29, 2015. |
Lazard International Equity Concentrated Portfolio
Comparison of Changes in Value of $10,000 Investment in the Institutional Shares of Lazard International Equity Concentrated Portfolio and the MSCI ACWI ex-US*

Average Annual Total Returns*
Periods Ended December 31, 2020
| | | One | | Five | | Since | |
| | | Year | | Years | | Inception | † |
| Institutional Shares** | | 0.47% | | 6.42% | | 2.16% | |
| Open Shares** | | 0.33% | | 6.14% | | 1.91% | |
| MSCI ACWI ex-US | | 10.65% | | 8.93% | | 4.52% | |
| † | The inception date for the Portfolio was August 29, 2014. |
Annual Report 41
Lazard International Equity Portfolio
Comparison of Changes in Value of $10,000 Investment in the Institutional Shares of Lazard International Equity Portfolio and the MSCI EAFE Index*
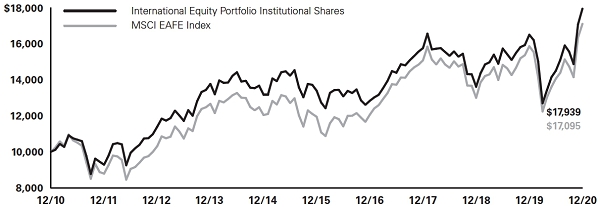
Average Annual Total Returns*
Periods Ended December 31, 2020
| | | One | | Five | | Ten | | Since | |
| | | Year | | Years | | Years | | Inception | † |
| Institutional Shares** | | 8.76% | | 6.03% | | 6.02% | | 6.04% | |
| Open Shares** | | 8.43% | | 5.74% | | 5.73% | | 4.97% | |
| R6 Shares** | | 8.79% | | 6.03% | | N/A | | 4.46% | |
| MSCI EAFE Index | | 7.82% | | 7.45% | | 5.51% | | 5.49% | |
| | | | | | | | | (Institutional
Shares) | |
| | | | | | | | | 5.14% | |
| | | | | | | | | (Open Shares) | |
| | | | | | | | | 5.39% | |
| | | | | | | | | (R6 Shares) | |
| † | The inception date for the Institutional Shares was October 29, 1991, for the Open Shares was January 23, 1997 and for the R6 Shares was April 1, 2015. |
42 Annual Report
Lazard International Equity Select Portfolio
Comparison of Changes in Value of $10,000 Investment in the Institutional Shares of Lazard International Equity Select Portfolio, the MSCI ACWI ex-US and the MSCI EAFE/ACWI ex-US Linked Index*

Average Annual Total Returns*
Periods Ended December 31, 2020
| | | One | | Five | | Ten | |
| | | Year | | Years | | Years | |
| Institutional Shares** | | 8.33% | | 7.18% | | 5.41% | |
| Open Shares** | | 8.02% | | 6.83% | | 5.06% | |
| MSCI ACWI ex-US | | 10.65% | | 8.93% | | 4.92% | |
| MSCI EAFE/ACWI ex-US Linked Index | | 10.65% | | 8.93% | | 4.92% | |
Lazard International Equity Value Portfolio
Comparison of Changes in Value of $10,000 Investment in the Institutional Shares of Lazard International Equity Value Portfolio and the MSCI EAFE Index*
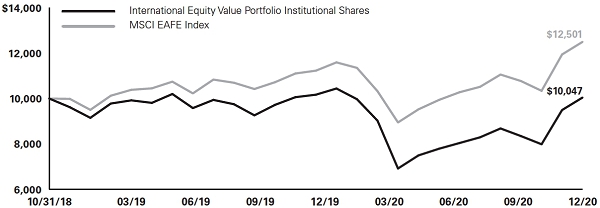
Average Annual Total Returns*
Periods Ended December 31, 2020
| | | One | | Since | |
| | | Year | | Inception | † |
| Institutional Shares** | | –3.81% | | 0.22% | |
| Open Shares** | | –4.06% | | –0.04% | |
| MSCI EAFE Index | | 7.82% | | 10.85% | |
| † | The inception date for the Portfolio was October 31, 2018. |
Annual Report 43
Lazard International Quality Growth Portfolio
Comparison of Changes in Value of $10,000 Investment in the Institutional Shares of Lazard International Quality Growth Portfolio and the MSCI ACWI ex-US*
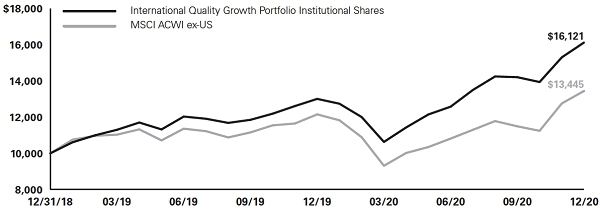
Average Annual Total Returns*
Periods Ended December 31, 2020
| | | One | | Since | |
| | | Year | | Inception | † |
| Institutional Shares** | | 23.95% | | 26.97% | |
| Open Shares** | | 23.63% | | 26.61% | |
| MSCI ACWI ex-US | | 10.65% | | 15.95% | |
| † | The inception date for the Portfolio was December 31, 2018. |
Lazard International Small Cap Equity Portfolio
Comparison of Changes in Value of $10,000 Investment in the Institutional Shares of Lazard International Small Cap Equity Portfolio and the MSCI EAFE Small Cap® Index*

Average Annual Total Returns*
Periods Ended December 31, 2020
| | | One | | Five | | Ten | |
| | | Year | | Years | | Years | |
| Institutional Shares** | | 13.44% | | 6.93% | | 7.39% | |
| Open Shares** | | 13.15% | | 6.65% | | 7.09% | |
| MSCI EAFE Small Cap Index | | 12.34% | | 9.40% | | 7.85% | |
44 Annual Report
Lazard International Strategic Equity Portfolio
Comparison of Changes in Value of $10,000 Investment in the Institutional Shares of Lazard International Strategic Equity Portfolio and the MSCI EAFE Index*

Average Annual Total Returns*
Periods Ended December 31, 2020
| | | One | | Five | | Ten | | Since | |
| | | Year | | Years | | Years | | Inception | † |
| Institutional Shares** | | 10.58% | | 7.88% | | 7.16% | | 6.75% | |
| Open Shares** | | 10.34% | | 7.60% | | 6.89% | | 5.57% | |
| R6 Shares** | | 10.64% | | 7.88% | | N/A | | 6.27% | |
| MSCI EAFE Index | | 7.82% | | 7.45% | | 5.51% | | 4.91% | |
| | | | | | | | | (Institutional
Shares) | |
| | | | | | | | | 4.09% | |
| | | | | | | | | (Open Shares) | |
| | | | | | | | | 6.40% | |
| | | | | | | | | (R6 Shares) | |
| † | The inception date for the Institutional Shares was October 31, 2005, for the Open Shares was February 3, 2006 and for the R6 Shares was January 19, 2015. |
Annual Report 45
Lazard Managed Equity Volatility Portfolio
Comparison of Changes in Value of $10,000 Investment in the Institutional Shares of Lazard Managed Equity Volatility Portfolio and the MSCI World Index*
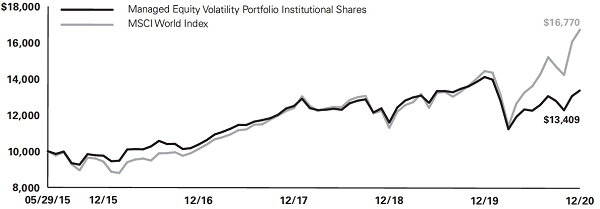
Average Annual Total Returns*
Periods Ended December 31, 2020
| | | One | | Five | | Since | |
| | | Year | | Years | | Inception | † |
| Institutional Shares** | | –5.18% | | 6.56% | | 5.38% | |
| Open Shares** | | –5.34% | | 6.26% | | 5.08% | |
| MSCI World Index | | 15.90% | | 12.19% | | 9.70% | |
| † | The inception date for the Portfolio was May 29, 2015. |
46 Annual Report
Lazard US Equity Concentrated Portfolio
Comparison of Changes in Value of $10,000 Investment in the Institutional Shares of Lazard US Equity Concentrated Portfolio, the S&P 500 Index and the Russell 1000 Value/S&P 500 Linked Index*

Average Annual Total Returns*
Periods Ended December 31, 2020
| | | One | | Five | | Ten | | Since | |
| | | Year | | Years | | Years | | Inception | † |
| Institutional Shares** | | 8.98% | | 10.83% | | 12.24% | | 8.80% | |
| Open Shares** | | 8.63% | | 10.52% | | 11.90% | | 8.48% | |
| R6 Shares** | | 8.90% | | N/A | | N/A | | 11.37% | |
| S&P 500 Index | | 18.40% | | 15.22% | | 13.88% | | 9.86% | |
| | | | | | | | | (Institutional
and Open
Shares) | |
| | | | | | | | | 16.33% | |
| | | | | | | | | (R6 Shares) | |
| Russell 1000 Value/S&P 500 Linked Index | | 18.40% | | 15.22% | | 13.48% | | 9.19% | |
| | | | | | | | | (Institutional
and Open
Shares) | |
| | | | | | | | | N/A | |
| | | | | | | | | (R6 Shares) | |
| † | The inception date for the Institutional and Open Shares was September 30, 2005 and for the R6 Shares was November 15, 2016. |
Annual Report 47
Lazard US Equity Focus Portfolio
Comparison of Changes in Value of $10,000 Investment in the Institutional Shares of Lazard US Equity Select Portfolio and the S&P 500 Index*

Average Annual Total Returns*
Periods Ended December 31, 2020
| | | One | | Five | | Ten | | Since | |
| | | Year | | Years | | Years | | Inception | † |
| Institutional Shares** | | 17.29% | | 14.17% | | 12.25% | | 8.48% | |
| Open Shares** | | 17.08% | | 13.86% | | 11.93% | | 8.17% | |
| R6 Shares** | | 17.28% | | 14.20% | | N/A | | 11.57% | |
| S&P 500 Index | | 18.40% | | 15.22% | | 13.88% | | 9.55% | |
| | | | | | | | | (Institutional
and Open
Shares) | |
| | | | | | | | | 13.22% | |
| | | | | | | | | (R6 Shares) | |
| † | The inception date for the Institutional and Open Shares was December 30, 2004 and for the R6 Shares was May 19, 2014. |
48 Annual Report
Lazard US Small-Mid Cap Equity Portfolio
Comparison of Changes in Value of $10,000 Investment in the Institutional Shares of Lazard US Small-Mid Cap Equity Portfolio and the Russell 2500 Index*

Average Annual Total Returns*
Periods Ended December 31, 2020
| | | One | | Five | | Ten | | Since | |
| | | Year | | Years | | Years | | Inception† | |
| Institutional Shares** | | 6.44% | | 9.75% | | 9.39% | | 10.60% | |
| Open Shares** | | 6.10% | | 9.42% | | 9.05% | | 8.24% | |
| R6 Shares** | | N/A | | N/A | | N/A | | 6.59% | |
| Russell 2500 Index | | 19.99% | | 13.64% | | 11.97% | | 11.15% | |
| | | | | | | | | (Institutional
Shares) | |
| | | | | | | | | 9.89% | |
| | | | | | | | | (Open Shares) | |
| | | | | | | | | 20.09% | |
| | | | | | | | | (R6 Shares) | |
| † | The inception date for the Institutional Shares was October 30, 1991, for the Open Shares was January 30, 1997 and for the R6 Shares was January 8, 2020. |
Annual Report 49
Lazard US Sustainable Equity Portfolio
Comparison of Changes in Value of $10,000 Investment in the Institutional Shares of Lazard US Sustainable Equity Portfolio and the S&P 500 Index*
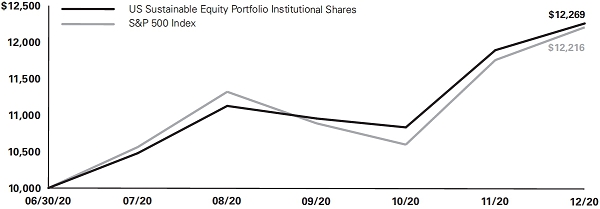
Average Annual Total Returns*
Periods Ended December 31, 2020
| | | Since | |
| | | Inception | † |
| Institutional Shares** | | 22.69% | |
| Open Shares** | | 22.48% | |
| S&P 500 Index | | 22.16% | |
| † | The inception date for the Institutional Shares and Open Shares was June 30, 2020. |
| Notes to Performance Overviews: | |
| | |
| * | Total returns reflect reinvestment of all dividends and distributions, if any. Certain expenses of the Portfolio may have been waived or reimbursed by Lazard Asset Management LLC, the Fund’s investment manager (the “Investment Manager”), State Street Bank and Trust Company, the Fund’s administrator (“State Street”), or DST Asset Manager Solutions, Inc., the Fund’s transfer agent and dividend disbursement agent (“DST”); without such waiver/reimbursement of expenses, the Portfolio’s returns would have been lower. Returns for a period of less than one year are not annualized. |
| | |
| | Performance results do not include adjustments made for financial reporting purposes in accordance with US Generally Accepted Accounting Principles (“GAAP”), if any, and also exclude one-time adjustments related to reimbursed custodian out-of-pocket expenses (Note 3 in the Notes to Financial Statements) for Lazard International Small Cap Equity and Lazard US Small-Mid Cap Equity Portfolios and settlement proceeds received from class action lawsuits by the Lazard International Equity and Lazard International Small Cap Equity Portfolios, as well as by the Lazard Developing Markets Equity Portfolio. For the Lazard Developing Markets Equity Portfolio, these proceeds impacted the total return of Open Shares but did not impact that of Institutional Shares; amounts may differ from amounts reported in the financial highlights. |
| | |
| | The performance quoted represents past performance. Current performance may be lower or higher than the performance quoted. Past performance is not indicative, or a guarantee, of future results; the investment return and principal value of the Portfolio will fluctuate, so that Portfolio shares, when redeemed, may be worth more or less than their original cost. Within the longer periods illustrated, there may have been short-term fluctuations, counter to the overall trend of investment results, and no single period of any length may be taken as typical of what may be expected in future |
50 Annual Report
| | periods. The graph and table above do not reflect the deduction of taxes that a shareholder would pay on the Portfolio’s distributions or the redemption of Portfolio shares. |
| | |
| | The performance data of the indices have been prepared from sources and data that the Investment Manager believes to be reliable, but no representation is made as to their accuracy. The indices are unmanaged, have no fees or costs and are not available for investment. |
| | |
| ** | The performance of Institutional Shares, Open Shares and R6 Shares of a Portfolio as applicable may vary, primarily based on the differences in fees borne by shareholders investing in different classes of the Portfolio. |
| | |
| | The MSCI Emerging Markets Index is a free-float-adjusted market capitalization index that is designed to measure equity market performance in the global emerging markets. The MSCI Emerging Markets Index consists of 26 emerging markets country indices. |
| | |
| | The MSCI World Index is a free-float-adjusted market capitalization index that is designed to measure global developed markets equity performance. The MSCI World Index consists of 23 developed markets country indices. |
| | |
| | The MSCI ACWI is a free-float-adjusted market capitalization weighted index that is designed to measure the equity market performance of developed and emerging markets. The MSCI ACWI consists of 50 country indices comprising 23 developed and 27 emerging markets country indices. |
| | |
| | The MSCI World Core Infrastructure (Hedged) Index (the “Infrastructure Index”) captures large and mid-cap securities across the 23 developed market countries. The Infrastructure Index is designed to represent the performance of listed companies within the developed markets that are engaged in core industrial infrastructure activities. Note that Lazard Global Listed Infrastructure Portfolio invests in a range of companies globally, not specifically developed markets countries. |
| | |
| | The MSCI EAFE Index is a free-float-adjusted market capitalization index that is designed to measure developed markets equity performance, excluding the United States and Canada. The MSCI EAFE Index consists of 21 developed markets country indices. |
| | |
| | The MSCI ACWI ex-US is a free-float-adjusted market capitalization weighted index that is designed to measure the equity market performance of developed and emerging markets, excluding the United States. The MSCI ACWI ex-US consists of 48 country indices comprising 22 developed and 26 emerging markets country indices. |
| | |
| | The MSCI EAFE/ACWI ex-US Linked Index is an unmanaged index created by the Investment Manager which links the performance of the MSCI EAFE Index for all periods through June 30, 2010 (when Lazard International Equity Select Portfolio’s benchmark index changed) and the MSCI ACWI ex-US for all periods thereafter. |
| | |
| | The MSCI EAFE Small Cap Index targets all companies with market capitalizations below that of the companies in the MSCI EAFE Index and up to 99% coverage of the free-float-adjusted market capitalization in each market (subject to minimum investability criteria and a universal minimum size range). The MSCI EAFE Small Cap Index consists of 21 developed markets country indices. |
| | |
| | The S&P 500 Index is a market capitalization-weighted index of 500 companies in leading industries of the US economy. |
Annual Report 51
| | The Russell 1000 Value/S&P 500 Linked Index is an unmanaged index created by the Investment Manager which links the performance of the Russell 1000® Value Index for all periods through May 30, 2012 (when Lazard US Equity Concentrated Portfolio’s investment strategy changed) and the S&P 500 Index for all periods thereafter. |
| | |
| | The Russell 1000 Value Index measures the performance of those Russell 1000 companies with lower price-to-book ratios and lower forecasted growth values. The Russell 1000 Index measures the performance of the large-cap segment of the US equity universe. It includes approximately 1000 of the largest securities based on a combination of their market cap and current index membership. |
| | |
| | The Russell 2500 Index measures the performance of the small-to mid-cap segment of the US equity universe, commonly referred to as “smid” cap. The Russell 2500 Index is a subset of the Russell 3000® Index. The Russell 3000 Index measures the performance of the largest 3000 US companies, representing approximately 98% of the investable US equity market. The Russell 2500 Index includes approximately 2500 of the smallest securities based on a combination of their market cap and current index membership. |
52 Annual Report
The Lazard Funds, Inc.
Information About Your Portfolio’s Expenses (unaudited)
Expense Example
As a shareholder in a Portfolio, you incur ongoing costs, including management fees, distribution and service (12b-1) fees (Open Shares only), and other expenses. This Example is intended to help you understand your ongoing costs (in dollars) of investing in a Portfolio and to compare these costs with the ongoing costs of investing in other mutual funds. The Example is based on an investment of $1,000 invested at the beginning of the six month period from July 1, 2020 through December 31, 2020 and held for the entire period.
Actual Expenses
For each share class of the Portfolios, the first line of the accompanying table provides information about actual account values and actual expenses. You may use the information in this line, together with the amount you invested, to estimate the expenses that you paid over the period. Simply divide your account value by $1,000 (for example, an $8,600 account value divided by $1,000=8.6), then multiply the result by the number in the first line under the heading entitled “Expenses Paid During Period” to estimate the expenses you paid on your account during this period.
Hypothetical Example for Comparison Purposes
For each share class of the Portfolios, the second line of the accompanying table provides information about hypothetical account values and hypothetical expenses based on the class’ actual expense ratio and an assumed rate of return of 5% per year before expenses, which is not the Portfolio’s actual return. The hypothetical account values and expenses may not be used to estimate the actual ending account balance or expenses you paid for the period. You may use this information to compare the ongoing costs of investing in the Portfolio and other mutual funds. To do so, compare this 5% hypothetical example with the 5% hypothetical examples that appear in the shareholder reports of other mutual funds.
Annual Report 53
| Portfolio | | Beginning
Account Value
7/1/20 | | Ending
Account
Value
12/31/20 | | Expenses Paid
During Period*
7/1/20 - 12/31/20 | | Annualized
Expense Ratio
During Period
7/1/20 - 12/31/20 |
| | | | | | | | | | | | | | | | | | |
| Developing Markets Equity | | | | | | | | | | | | | | | | | |
| Institutional Shares | | | | | | | | | | | | | | | | | |
| Actual | | $ | 1,000.00 | | | $ | 1,343.90 | | | | $ | 6.78 | | | | 1.15 | % |
| Hypothetical (5% Return Before Expenses) | | $ | 1,000.00 | | | $ | 1,019.36 | | | | $ | 5.84 | | | | 1.15 | % |
| Open Shares | | | | | | | | | | | | | | | | | |
| Actual | | $ | 1,000.00 | | | $ | 1,342.40 | | | | $ | 8.24 | | | | 1.40 | % |
| Hypothetical (5% Return Before Expenses) | | $ | 1,000.00 | | | $ | 1,018.10 | | | | $ | 7.10 | | | | 1.40 | % |
| Emerging Markets Core Equity | | | | | | | | | | | | | | | | | |
| Institutional Shares | | | | | | | | | | | | | | | | | |
| Actual | | $ | 1,000.00 | | | $ | 1,314.90 | | | | $ | 6.87 | | | | 1.18 | % |
| Hypothetical (5% Return Before Expenses) | | $ | 1,000.00 | | | $ | 1,019.20 | | | | $ | 5.99 | | | | 1.18 | % |
| Open Shares | | | | | | | | | | | | | | | | | |
| Actual | | $ | 1,000.00 | | | $ | 1,313.10 | | | | $ | 8.72 | | | | 1.50 | % |
| Hypothetical (5% Return Before Expenses) | | $ | 1,000.00 | | | $ | 1,017.60 | | | | $ | 7.61 | | | | 1.50 | % |
| R6 Shares | | | | | | | | | | | | | | | | | |
| Actual | | $ | 1,000.00 | | | $ | 1,314.60 | | | | $ | 6.98 | | | | 1.20 | % |
| Hypothetical (5% Return Before Expenses) | | $ | 1,000.00 | | | $ | 1,019.10 | | | | $ | 6.09 | | | | 1.20 | % |
| Emerging Markets Equity Advantage | | | | | | | | | | | | | | | | | |
| Institutional Shares | | | | | | | | | | | | | | | | | |
| Actual | | $ | 1,000.00 | | | $ | 1,306.30 | | | | $ | 6.38 | | | | 1.10 | % |
| Hypothetical (5% Return Before Expenses) | | $ | 1,000.00 | | | $ | 1,019.61 | | | | $ | 5.58 | | | | 1.10 | % |
| Open Shares | | | | | | | | | | | | | | | | | |
| Actual | | $ | 1,000.00 | | | $ | 1,304.20 | | | | $ | 7.82 | | | | 1.35 | % |
| Hypothetical (5% Return Before Expenses) | | $ | 1,000.00 | | | $ | 1,018.35 | | | | $ | 6.85 | | | | 1.35 | % |
| Emerging Markets Equity Blend | | | | | | | | | | | | | | | | | |
| Institutional Shares | | | | | | | | | | | | | | | | | |
| Actual | | $ | 1,000.00 | | | $ | 1,304.90 | | | | $ | 6.95 | | | | 1.20 | % |
| Hypothetical (5% Return Before Expenses) | | $ | 1,000.00 | | | $ | 1,019.10 | | | | $ | 6.09 | | | | 1.20 | % |
54 Annual Report
| Portfolio | | Beginning
Account Value
7/1/20 | | Ending
Account
Value
12/31/20 | | Expenses Paid
During Period*
7/1/20 - 12/31/20 | | Annualized
Expense Ratio
During Period
7/1/20 - 12/31/20 |
| | | | | | | | | | | | | | | | | | |
| Open Shares | | | | | | | | | | | | | | | | | |
| Actual | | $ | 1,000.00 | | | $ | 1,302.60 | | | | $ | 8.39 | | | | 1.45 | % |
| Hypothetical (5% Return Before Expenses) | | $ | 1,000.00 | | | $ | 1,017.85 | | | | $ | 7.35 | | | | 1.45 | % |
| Emerging Markets Equity | | | | | | | | | | | | | | | | | |
| Institutional Shares | | | | | | | | | | | | | | | | | |
| Actual | | $ | 1,000.00 | | | $ | 1,271.30 | | | | $ | 6.17 | | | | 1.08 | % |
| Hypothetical (5% Return Before Expenses) | | $ | 1,000.00 | | | $ | 1,019.71 | | | | $ | 5.48 | | | | 1.08 | % |
| Open Shares | | | | | | | | | | | | | | | | | |
| Actual | | $ | 1,000.00 | | | $ | 1,270.10 | | | | $ | 7.59 | | | | 1.33 | % |
| Hypothetical (5% Return Before Expenses) | | $ | 1,000.00 | | | $ | 1,018.45 | | | | $ | 6.75 | | | | 1.33 | % |
| R6 Shares | | | | | | | | | | | | | | | | | |
| Actual | | $ | 1,000.00 | | | $ | 1,271.30 | | | | $ | 5.94 | | | | 1.04 | % |
| Hypothetical (5% Return Before Expenses) | | $ | 1,000.00 | | | $ | 1,019.91 | | | | $ | 5.28 | | | | 1.04 | % |
| Equity Franchise | | | | | | | | | | | | | | | | | |
| Institutional Shares | | | | | | | | | | | | | | | | | |
| Actual | | $ | 1,000.00 | | | $ | 1,279.40 | | | | $ | 5.44 | | | | 0.95 | % |
| Hypothetical (5% Return Before Expenses) | | $ | 1,000.00 | | | $ | 1,020.36 | | | | $ | 4.82 | | | | 0.95 | % |
| Open Shares | | | | | | | | | | | | | | | | | |
| Actual | | $ | 1,000.00 | | | $ | 1,277.90 | | | | $ | 6.87 | | | | 1.20 | % |
| Hypothetical (5% Return Before Expenses) | | $ | 1,000.00 | | | $ | 1,019.10 | | | | $ | 6.09 | | | | 1.20 | % |
| Global Equity Select | | | | | | | | | | | | | | | | | |
| Institutional Shares | | | | | | | | | | | | | | | | | |
| Actual | | $ | 1,000.00 | | | $ | 1,225.40 | | | | $ | 5.03 | | | | 0.90 | % |
| Hypothetical (5% Return Before Expenses) | | $ | 1,000.00 | | | $ | 1,020.61 | | | | $ | 4.57 | | | | 0.90 | % |
| Open Shares | | | | | | | | | | | | | | | | | |
| Actual | | $ | 1,000.00 | | | $ | 1,223.90 | | | | $ | 6.43 | | | | 1.15 | % |
| Hypothetical (5% Return Before Expenses) | | $ | 1,000.00 | | | $ | 1,019.36 | | | | $ | 5.84 | | | | 1.15 | % |
Annual Report 55
| Portfolio | | Beginning
Account Value
7/1/20 | | Ending
Account
Value
12/31/20 | | Expenses Paid
During Period*
7/1/20 - 12/31/20 | | Annualized
Expense Ratio
During Period
7/1/20 - 12/31/20 |
| | | | | | | | | | | | | | | | | | |
| Global Listed Infrastructure | | | | | | | | | | | | | | | | | |
| Institutional Shares | | | | | | | | | | | | | | | | | |
| Actual | | $ | 1,000.00 | | | $ | 1,033.20 | | | | $ | 4.96 | | | | 0.97 | % |
| Hypothetical (5% Return Before Expenses) | | $ | 1,000.00 | | | $ | 1,020.26 | | | | $ | 4.93 | | | | 0.97 | % |
| Open Shares | | | | | | | | | | | | | | | | | |
| Actual | | $ | 1,000.00 | | | $ | 1,032.50 | | | | $ | 6.23 | | | | 1.22 | % |
| Hypothetical (5% Return Before Expenses) | | $ | 1,000.00 | | | $ | 1,019.00 | | | | $ | 6.19 | | | | 1.22 | % |
| Global Strategic Equity | | | | | | | | | | | | | | | | | |
| Institutional Shares | | | | | | | | | | | | | | | | | |
| Actual | | $ | 1,000.00 | | | $ | 1,251.30 | | | | $ | 5.38 | | | | 0.95 | % |
| Hypothetical (5% Return Before Expenses) | | $ | 1,000.00 | | | $ | 1,020.36 | | | | $ | 4.82 | | | | 0.95 | % |
| Open Shares | | | | | | | | | | | | | | | | | |
| Actual | | $ | 1,000.00 | | | $ | 1,252.40 | | | | $ | 6.79 | | | | 1.20 | % |
| Hypothetical (5% Return Before Expenses) | | $ | 1,000.00 | | | $ | 1,019.10 | | | | $ | 6.09 | | | | 1.20 | % |
| International Equity Advantage | | | | | | | | | | | | | | | | | |
| Institutional Shares | | | | | | | | | | | | | | | | | |
| Actual | | $ | 1,000.00 | | | $ | 1,198.00 | | | | $ | 4.97 | | | | 0.90 | % |
| Hypothetical (5% Return Before Expenses) | | $ | 1,000.00 | | | $ | 1,020.61 | | | | $ | 4.57 | | | | 0.90 | % |
| Open Shares | | | | | | | | | | | | | | | | | |
| Actual | | $ | 1,000.00 | | | $ | 1,196.30 | | | | $ | 6.35 | | | | 1.15 | % |
| Hypothetical (5% Return Before Expenses) | | $ | 1,000.00 | | | $ | 1,019.36 | | | | $ | 5.84 | | | | 1.15 | % |
| International Equity Concentrated | | | | | | | | | | | | |
| Institutional Shares | | | | | | | | | | | | | | | | | |
| Actual | | $ | 1,000.00 | | | $ | 1,227.60 | | | | $ | 5.15 | | | | 0.92 | % |
| Hypothetical (5% Return Before Expenses) | | $ | 1,000.00 | | | $ | 1,020.51 | | | | $ | 4.67 | | | | 0.92 | % |
| Open Shares | | | | | | | | | | | | | | | | | |
| Actual | | $ | 1,000.00 | | | $ | 1,226.80 | | | | $ | 4.81 | | | | 0.86 | % |
| Hypothetical (5% Return Before Expenses) | | $ | 1,000.00 | | | $ | 1,020.81 | | | | $ | 4.37 | | | | 0.86 | % |
56 Annual Report
| Portfolio | | Beginning
Account Value
7/1/20 | | Ending
Account
Value
12/31/20 | | Expenses Paid
During Period*
7/1/20 - 12/31/20 | | Annualized
Expense Ratio
During Period
7/1/20 - 12/31/20 |
| | | | | | | | | | | | | | | | | | |
| International Equity | | | | | | | | | | | | | | | | | |
| Institutional Shares | | | | | | | | | | | | | | | | | |
| Actual | | $ | 1,000.00 | | | $ | 1,237.10 | | | | $ | 4.61 | | | | 0.82 | % |
| Hypothetical (5% Return Before Expenses) | | $ | 1,000.00 | | | $ | 1,021.01 | | | | $ | 4.17 | | | | 0.82 | % |
| Open Shares | | | | | | | | | | | | | | | | | |
| Actual | | $ | 1,000.00 | | | $ | 1,235.10 | | | | $ | 6.01 | | | | 1.07 | % |
| Hypothetical (5% Return Before Expenses) | | $ | 1,000.00 | | | $ | 1,019.76 | | | | $ | 5.43 | | | | 1.07 | % |
| R6 Shares | | | | | | | | | | | | | | | | | |
| Actual | | $ | 1,000.00 | | | $ | 1,237.00 | | | | $ | 4.50 | | | | 0.80 | % |
| Hypothetical (5% Return Before Expenses) | | $ | 1,000.00 | | | $ | 1,021.11 | | | | $ | 4.06 | | | | 0.80 | % |
| International Equity Select | | | | | | | | | | | | | | | | | |
| Institutional Shares | | | | | | | | | | | | | | | | | |
| Actual | | $ | 1,000.00 | | | $ | 1,232.40 | | | | $ | 5.05 | | | | 0.90 | % |
| Hypothetical (5% Return Before Expenses) | | $ | 1,000.00 | | | $ | 1,020.61 | | | | $ | 4.57 | | | | 0.90 | % |
| Open Shares | | | | | | | | | | | | | | | | | |
| Actual | | $ | 1,000.00 | | | $ | 1,230.70 | | | | $ | 6.45 | | | | 1.15 | % |
| Hypothetical (5% Return Before Expenses) | | $ | 1,000.00 | | | $ | 1,019.36 | | | | $ | 5.84 | | | | 1.15 | % |
| International Equity Value | | | | | | | | | | | | | | | | | |
| Institutional Shares | | | | | | | | | | | | | | | | | |
| Actual | | $ | 1,000.00 | | | $ | 1,249.50 | | | | $ | 5.37 | | | | 0.95 | % |
| Hypothetical (5% Return Before Expenses) | | $ | 1,000.00 | | | $ | 1,020.36 | | | | $ | 4.82 | | | | 0.95 | % |
| Open Shares | | | | | | | | | | | | | | | | | |
| Actual | | $ | 1,000.00 | | | $ | 1,247.80 | | | | $ | 6.55 | | | | 1.16 | % |
| Hypothetical (5% Return Before Expenses) | | $ | 1,000.00 | | | $ | 1,019.30 | | | | $ | 5.89 | | | | 1.16 | % |
| International Quality Growth | | | | | | | | | | | | | | | | | |
| Institutional Shares | | | | | | | | | | | | | | | | | |
| Actual | | $ | 1,000.00 | | | $ | 1,281.90 | | | | $ | 4.88 | | | | 0.85 | % |
| Hypothetical (5% Return Before Expenses) | | $ | 1,000.00 | | | $ | 1,020.86 | | | | $ | 4.32 | | | | 0.85 | % |
Annual Report 57
| Portfolio | | Beginning
Account Value
7/1/20 | | Ending
Account
Value
12/31/20 | | Expenses Paid
During Period*
7/1/20 - 12/31/20 | | Annualized
Expense Ratio
During Period
7/1/20 - 12/31/20 |
| | | | | | | | | |
| Open Shares | | | | | | | | | | | | | | | | | |
| Actual | | $ | 1,000.00 | | | $ | 1,280.90 | | | | $ | 6.31 | | | | 1.10 | % |
| Hypothetical (5% Return Before Expenses) | | $ | 1,000.00 | | | $ | 1,019.61 | | | | $ | 5.58 | | | | 1.10 | % |
| International Small Cap Equity | | | | | | | | | | | | | | | | | |
| Institutional Shares | | | | | | | | | | | | | | | �� | | |
| Actual | | $ | 1,000.00 | | | $ | 1,254.80 | | | | $ | 6.52 | | | | 1.15 | % |
| Hypothetical (5% Return Before Expenses) | | $ | 1,000.00 | | | $ | 1,019.36 | | | | $ | 5.84 | | | | 1.15 | % |
| Open Shares | | | | | | | | | | | | | | | | | |
| Actual | | $ | 1,000.00 | | | $ | 1,253.90 | | | | $ | 7.93 | | | | 1.40 | % |
| Hypothetical (5% Return Before Expenses) | | $ | 1,000.00 | | | $ | 1,018.10 | | | | $ | 7.10 | | | | 1.40 | % |
| International Strategic Equity | | | | | | | | | | | | | | | | | |
| Institutional Shares | | | | | | | | | | | | | | | | | |
| Actual | | $ | 1,000.00 | | | $ | 1,250.60 | | | | $ | 4.58 | | | | 0.81 | % |
| Hypothetical (5% Return Before Expenses) | | $ | 1,000.00 | | | $ | 1,021.06 | | | | $ | 4.12 | | | | 0.81 | % |
| Open Shares | | | | | | | | | | | | | | | | | |
| Actual | | $ | 1,000.00 | | | $ | 1,249.00 | | | | $ | 5.99 | | | | 1.06 | % |
| Hypothetical (5% Return Before Expenses) | | $ | 1,000.00 | | | $ | 1,019.81 | | | | $ | 5.38 | | | | 1.06 | % |
| R6 Shares | | | | | | | | | | | | | | | | | |
| Actual | | $ | 1,000.00 | | | $ | 1,250.20 | | | | $ | 4.58 | | | | 0.81 | % |
| Hypothetical (5% Return Before Expenses) | | $ | 1,000.00 | | | $ | 1,021.06 | | | | $ | 4.12 | | | | 0.81 | % |
| Managed Equity Volatility | | | | | | | | | | | | | | | | | |
| Institutional Shares | | | | | | | | | | | | | | | | | |
| Actual | | $ | 1,000.00 | | | $ | 1,091.30 | | | | $ | 3.94 | | | | 0.75 | % |
| Hypothetical (5% Return Before Expenses) | | $ | 1,000.00 | | | $ | 1,021.37 | | | | $ | 3.81 | | | | 0.75 | % |
| Open Shares | | | | | | | | | | | | | | | | | |
| Actual | | $ | 1,000.00 | | | $ | 1,090.60 | | | | $ | 5.26 | | | | 1.00 | % |
| Hypothetical (5% Return Before Expenses) | | $ | 1,000.00 | | | $ | 1,020.11 | | | | $ | 5.08 | | | | 1.00 | % |
58 Annual Report
| Portfolio | | Beginning
Account Value
7/1/20 | | Ending
Account
Value
12/31/20 | | Expenses Paid
During Period*
7/1/20 - 12/31/20 | | Annualized
Expense Ratio
During Period
7/1/20 - 12/31/20 |
| | | | | | | | | | | | | | | | | | |
| US Equity Concentrated | | | | | | | | | | | | | | | | | |
| Institutional Shares | | | | | | | | | | | | | | | | | |
| Actual | | $ | 1,000.00 | | | $ | 1,176.40 | | | | $ | 4.21 | | | | 0.77 | % |
| Hypothetical (5% Return Before Expenses) | | $ | 1,000.00 | | | $ | 1,021.27 | | | | $ | 3.91 | | | | 0.77 | % |
| Open Shares | | | | | | | | | | | | | | | | | |
| Actual | | $ | 1,000.00 | | | $ | 1,174.80 | | | | $ | 5.63 | | | | 1.03 | % |
| Hypothetical (5% Return Before Expenses) | | $ | 1,000.00 | | | $ | 1,019.96 | | | | $ | 5.23 | | | | 1.03 | % |
| R6 Shares | | | | | | | | | | | | | | | | | |
| Actual | | $ | 1,000.00 | | | $ | 1,176.00 | | | | $ | 4.21 | | | | 0.77 | % |
| Hypothetical (5% Return Before Expenses) | | $ | 1,000.00 | | | $ | 1,021.27 | | | | $ | 3.91 | | | | 0.77 | % |
| US Equity Focus | | | | | | | | | | | | | | | | | |
| Institutional Shares | | | | | | | | | | | | | | | | | |
| Actual | | $ | 1,000.00 | | | $ | 1,229.10 | | | | $ | 3.92 | | | | 0.70 | % |
| Hypothetical (5% Return Before Expenses) | | $ | 1,000.00 | | | $ | 1,021.62 | | | | $ | 3.56 | | | | 0.70 | % |
| Open Shares | | | | | | | | | | | | | | | | | |
| Actual | | $ | 1,000.00 | | | $ | 1,227.70 | | | | $ | 5.32 | | | | 0.95 | % |
| Hypothetical (5% Return Before Expenses) | | $ | 1,000.00 | | | $ | 1,020.36 | | | | $ | 4.82 | | | | 0.95 | % |
| R6 Shares | | | | | | | | | | | | | | | | | |
| Actual | | $ | 1,000.00 | | | $ | 1,228.90 | | | | $ | 3.92 | | | | 0.70 | % |
| Hypothetical (5% Return Before Expenses) | | $ | 1,000.00 | | | $ | 1,021.62 | | | | $ | 3.56 | | | | 0.70 | % |
Annual Report 59
| Portfolio | | Beginning
Account Value
7/1/20 | | Ending
Account
Value
12/31/20 | | Expenses Paid
During Period*
7/1/20 - 12/31/20 | | Annualized
Expense Ratio
During Period
7/1/20 - 12/31/20 |
| | | | | | | | | | | | | | | | | | |
| US Small-Mid Cap Equity | | | | | | | | | | | | | | | | | |
| Institutional Shares | | | | | | | | | | | | | | | | | |
| Actual | | $ | 1,000.00 | | | $ | 1,280.20 | | | | $ | 5.73 | | | | 1.00 | % |
| Hypothetical (5% Return Before Expenses) | | $ | 1,000.00 | | | $ | 1,020.11 | | | | $ | 5.08 | | | | 1.00 | % |
| Open Shares | | | | | | | | | | | | | | | | | |
| Actual | | $ | 1,000.00 | | | $ | 1,278.50 | | | | $ | 7.56 | | | | 1.32 | % |
| Hypothetical (5% Return Before Expenses) | | $ | 1,000.00 | | | $ | 1,018.50 | | | | $ | 6.70 | | | | 1.32 | % |
| R6 Shares | | | | | | | | | | | | | | | | | |
| Actual | | $ | 1,000.00 | | | $ | 1,281.40 | | | | $ | 5.10 | | | | 0.89 | % |
| Hypothetical (5% Return Before Expenses) | | $ | 1,000.00 | | | $ | 1,020.66 | | | | $ | 4.52 | | | | 0.89 | % |
| US Sustainable Equity | | | | | | | | | | | | | | | | | |
| Institutional Shares | | | | | | | | | | | | | | | | | |
| Actual | | $ | 1,000.00 | | | $ | 1,226.90 | | | | $ | 4.20 | | | | 0.75 | % |
| Hypothetical (5% Return Before Expenses) | | $ | 1,000.00 | | | $ | 1,021.37 | | | | $ | 3.81 | | | | 0.75 | % |
| Open Shares | | | | | | | | | | | | | | | | | |
| Actual | | $ | 1,000.00 | | | $ | 1,224.80 | | | | $ | 5.59 | | | | 1.00 | % |
| Hypothetical (5% Return Before Expenses) | | $ | 1,000.00 | | | $ | 1,020.11 | | | | $ | 5.08 | | | | 1.00 | % |
| * | Expenses are equal to the annualized expense ratio, net of expenses waivers and reimbursements, of each Share class multiplied by the average account value over the period, multiplied by 184/366 (to reflect one-half year period). |
60 Annual Report
The Lazard Funds, Inc.
Portfolio Holdings Presented by Asset Class/Sector December 31, 2020
| Asset Class/Sector* | | Lazard
Developing
Markets
Equity
Portfolio | | Lazard
Emerging
Markets Core
Equity
Portfolio | | | Lazard
Emerging
Markets
Equity
Advantage
Portfolio | | Lazard
Emerging
Markets
Equity
Blend
Portfolio |
| | | | | | | | | | | | | | | | | | |
| Equity | | | | | | | | | | | | | | | | | |
| Communication Services | | | 14.7 | % | | | 13.3 | % | | | | 11.5 | % | | | 13.3 | % |
| Consumer Discretionary | | | 13.8 | | | | 17.1 | | | | | 18.2 | | | | 7.8 | |
| Consumer Staples | | | 0.8 | | | | 6.1 | | | | | 4.6 | | | | 4.4 | |
| Energy | | | 3.8 | | | | 4.2 | | | | | 5.0 | | | | 4.5 | |
| Financials | | | 25.1 | | | | 17.6 | | | | | 17.4 | | | | 27.5 | |
| Health Care | | | 0.7 | | | | 1.3 | | | | | 4.4 | | | | 1.9 | |
| Industrials | | | 8.8 | | | | 4.7 | | | | | 4.6 | | | | 5.5 | |
| Information Technology | | | 23.8 | | | | 26.6 | | | | | 23.6 | | | | 24.2 | |
| Materials | | | 5.6 | | | | 7.5 | | | | | 7.8 | | | | 5.8 | |
| Real Estate | | | — | | | | — | | | | | 0.9 | | | | 1.0 | |
| Utilities | | | 1.8 | | | | 0.8 | | | | | 1.5 | | | | 0.8 | |
| Short-Term Investments | | | 1.1 | | | | 0.8 | | | | | 0.5 | | | | 3.3 | |
| Total Investments | | | 100.0 | % | | | 100.0 | % | | | | 100.0 | % | | | 100.0 | % |
| | | | | | | | | | | | | | | | | | |
| Asset Class/Sector* | | Lazard
Emerging
Markets
Equity
Portfolio† | | Lazard
Equity
Franchise
Portfolio | | Lazard
Global
Equity Select
Portfolio | | Lazard
Global Listed
Infrastructure
Portfolio |
| | | | | | | | | | | | | | | | | | |
| Equity | | | | | | | | | | | | | | | | | |
| Communication Services | | | 9.4 | % | | | 9.3 | % | | | | 7.5 | % | | | 4.3 | % |
| Consumer Discretionary | | | 5.7 | | | | 18.1 | | | | | 12.4 | | | | — | |
| Consumer Staples | | | 6.5 | | | | 1.9 | | | | | 14.2 | | | | — | |
| Energy | | | 7.1 | | | | — | | | | | — | | | | — | |
| Financials | | | 28.3 | | | | — | | | | | 12.6 | | | | — | |
| Health Care | | | 1.9 | | | | 22.7 | | | | | 13.5 | | | | — | |
| Industrials | | | 3.0 | | | | 18.1 | | | | | 13.8 | | | | 33.4 | |
| Information Technology | | | 23.4 | | | | 16.5 | | | | | 19.3 | | | | — | |
| Materials | | | 9.8 | | | | — | | | | | 3.0 | | | | — | |
| Real Estate | | | 0.8 | | | | — | | | | | — | | | | — | |
| Utilities | | | 2.3 | | | | 7.3 | | | | | 1.7 | | | | 47.3 | |
| Short-Term Investments | | | 1.8 | | | | 6.1 | | | | | 2.0 | | | | 15.0 | |
| Total Investments | | | 100.0 | % | | | 100.0 | % | | | | 100.0 | % | | | 100.0 | % |
| * | Represents percentage of total investments. |
| † | Equity sector breakdown is based upon the underlying holdings of exchange-traded funds held by the Portfolio. |
Annual Report 61
| Asset Class/Sector* | | Lazard
Global
Strategic
Equity
Portfolio | | Lazard
International
Equity
Advantage
Portfolio | | Lazard
International
Equity
Concentrated
Portfolio | | Lazard
International
Equity
Portfolio |
| | | | | | | | | | | | | | | | | | |
| Equity | | | | | | | | | | | | | | | | | |
| Communication Services | | | 12.5 | % | | | 6.1 | % | | | | 6.9 | % | | | 9.5 | % |
| Consumer Discretionary | | | 11.6 | | | | 12.0 | | | | | 7.7 | | | | 6.8 | |
| Consumer Staples | | | 3.3 | | | | 11.4 | | | | | 10.5 | | | | 8.7 | |
| Energy | | | — | | | | 2.5 | | | | | 3.6 | | | | 2.4 | |
| Financials | | | 16.9 | | | | 17.0 | | | | | 11.4 | | | | 14.4 | |
| Health Care | | | 14.3 | | | | 13.5 | | | | | 7.3 | | | | 10.6 | |
| Industrials | | | 12.1 | | | | 14.1 | | | | | 16.5 | | | | 20.7 | |
| Information Technology | | | 20.3 | | | | 8.3 | | | | | 16.8 | | | | 7.6 | |
| Materials | | | 3.6 | | | | 8.4 | | | | | 3.5 | | | | 7.3 | |
| Real Estate | | | — | | | | 2.2 | | | | | 6.5 | | | | 3.8 | |
| Utilities | | | 3.5 | | | | 3.7 | | | | | 9.3 | | | | 7.1 | |
| Short-Term Investments | | | 1.9 | | | | 0.8 | | | | | — | | | | 1.1 | |
| Total Investments | | | 100.0 | % | | | 100.0 | % | | | | 100.0 | % | | | 100.0 | % |
| | | | | | | | | | | | | | | | | | |
| Asset Class/Sector* | | Lazard
International
Equity Select
Portfolio | | Lazard
International
Equity Value
Portfolio | | Lazard
International
Quality Growth
Portfolio | | Lazard
International
Small Cap
Equity
Portfolio |
| | | | | | | | | | | | | | | | | | |
| Equity | | | | | | | | | | | | | | | | | |
| Communication Services | | | 9.5 | % | | | 5.0 | % | | | | 9.4 | % | | | 7.1 | % |
| Consumer Discretionary | | | 10.4 | | | | 24.3 | | | | | 11.6 | | | | 8.9 | |
| Consumer Staples | | | 9.7 | | | | 13.2 | | | | | 7.5 | | | | 6.0 | |
| Energy | | | 1.8 | | | | 2.4 | | | | | — | | | | 0.7 | |
| Financials | | | 16.0 | | | | 19.4 | | | | | 18.4 | | | | 11.9 | |
| Health Care | | | 8.4 | | | | 3.3 | | | | | 7.9 | | | | 7.2 | |
| Industrials | | | 20.3 | | | | 12.1 | | | | | 22.6 | | | | 20.3 | |
| Information Technology | | | 7.6 | | | | 7.9 | | | | | 14.2 | | | | 15.0 | |
| Materials | | | 5.7 | | | | 6.7 | | | | | 1.9 | | | | 5.8 | |
| Real Estate | | | 1.9 | | | | — | | | | | — | | | | 12.0 | |
| Utilities | | | 6.5 | | | | 3.5 | | | | | — | | | | 3.5 | |
| Short-Term Investments | | | 2.2 | | | | 2.2 | | | | | 6.5 | | | | 1.6 | |
| Total Investments | | | 100.0 | % | | | 100.0 | % | | | | 100.0 | % | | | 100.0 | % |
| * | Represents percentage of total investments. |
62 Annual Report
| Asset Class/Sector* | | Lazard
International
Strategic
Equity
Portfolio | | Lazard
Managed
Equity
Volatility
Portfolio | | Lazard US
Equity
Concentrated
Portfolio | | Lazard US
Equity Focus
Portfolio |
| | | | | | | | | | | | | | | | | | |
| Equity | | | | | | | | | | | | | | | | | |
| Communication Services | | | 10.1 | % | | | 10.1 | % | | | | 8.9 | % | | | 8.3 | % |
| Consumer Discretionary | | | 13.2 | | | | 10.1 | | | | | 17.9 | | | | 15.9 | |
| Consumer Staples | | | 11.4 | | | | 18.7 | | | | | 1.5 | | | | 5.7 | |
| Energy | | | 1.0 | | | | — | | | | | — | | | | — | |
| Financials | | | 18.2 | | | | 8.1 | | | | | 9.3 | | | | 17.9 | |
| Health Care | | | 7.2 | | | | 17.7 | | | | | 14.2 | | | | 17.8 | |
| Industrials | | | 20.3 | | | | 10.6 | | | | | 8.2 | | | | 11.7 | |
| Information Technology | | | 4.4 | | | | 8.3 | | | | | 24.5 | | | | 21.5 | |
| Materials | | | 4.0 | | | | 3.9 | | | | | 3.8 | | | | — | |
| Real Estate | | | 3.2 | | | | 3.5 | | | | | 9.2 | | | | — | |
| Utilities | | | 5.5 | | | | 8.4 | | | | | — | | | | — | |
| Short-Term Investments | | | 1.5 | | | | 0.6 | | | | | 2.5 | | | | 1.2 | |
| Total Investments | | | 100.0 | % | | | 100.0 | % | | | | 100.0 | % | | | 100.0 | % |
| | | | | | | | | | | | | | | | | | |
| Asset Class/Sector* | | Lazard US
Small-Mid
Cap Equity
Portfolio | | Lazard US
Sustainable
Equity
Portfolio | | | | | | | | | |
| | | | | | | | | | | | | | | | | | |
| Equity | | | | | | | | | | | | | | | | | |
| Communication Services | | | 3.1 | % | | | 2.0 | % | | | | | | | | | |
| Consumer Discretionary | | | 12.3 | | | | 11.5 | | | | | | | | | | |
| Consumer Staples | | | 2.4 | | | | 3.7 | | | | | | | | | | |
| Energy | | | 2.0 | | | | — | | | | | | | | | | |
| Financials | | | 12.2 | | | | 10.8 | | | | | | | | | | |
| Health Care | | | 14.5 | | | | 24.5 | | | | | | | | | | |
| Industrials | | | 17.4 | | | | 12.3 | | | | | | | | | | |
| Information Technology | | | 17.9 | | | | 27.1 | | | | | | | | | | |
| Materials | | | 8.4 | | | | 4.3 | | | | | | | | | | |
| Real Estate | | | 8.2 | | | | 2.2 | | | | | | | | | | |
| Utilities | | | 1.6 | | | | — | | | | | | | | | | |
| Short-Term Investments | | | — | | | | 1.6 | | | | | | | | | | |
| Total Investments | | | 100.0 | % | | | 100.0 | % | | | | | | | | | |
| * | Represents percentage of total investments. |
Annual Report 63
The Lazard Funds, Inc. Portfolios of Investments
December 31, 2020
| Description | | Shares | | | Fair
Value | |
| | | | | | | | | |
| Lazard Developing Markets Equity Portfolio | | | | | | | | |
| | | | | | | | | |
| Common Stocks | 96.8% | | | | | | | | |
| | | | | | | | | |
| Brazil | 5.6% | | | | | | | | |
| Duratex SA | | | 568,141 | | | $ | 2,103,492 | |
| Lojas Americanas SA | | | 207,562 | | | | 1,055,420 | |
| Pagseguro Digital, Ltd., Class A (*) | | | 27,754 | | | | 1,578,648 | |
| Petroleo Brasileiro SA | | | 911,560 | | | | 5,037,086 | |
| Rumo SA (*) | | | 407,044 | | | | 1,512,841 | |
| | | | | | | | 11,287,487 | |
| Canada | 2.1% | | | | | | | | |
| First Quantum Minerals, Ltd. | | | 236,393 | | | | 4,243,523 | |
| | | | | | | | | |
| China | 28.2% | | | | | | | | |
| Alibaba Group Holding, Ltd. Sponsored ADR (*) | | | 30,859 | | | | 7,181,815 | |
| Anhui Conch Cement Co., Ltd., Class H | | | 134,000 | | | | 839,475 | |
| Beijing Enterprises Water Group, Ltd. | | | 3,814,000 | | | | 1,532,133 | |
| Beijing Thunisoft Corp., Ltd., Class A | | | 561,365 | | | | 2,051,217 | |
| Chow Tai Seng Jewellery Co., Ltd., Class A | | | 416,800 | | | | 1,701,094 | |
| Minth Group, Ltd. | | | 772,000 | | | | 4,090,296 | |
| NetEase, Inc. ADR | | | 24,845 | | | | 2,379,406 | |
| New Oriental Education & Technology Group, Inc. Sponsored ADR (*) | | | 7,475 | | | | 1,388,930 | |
| Ping An Insurance (Group) Co. of China, Ltd., Class H | | | 320,000 | | | | 3,930,572 | |
| Shenzhen Sunway Communication Co., Ltd., Class A | | | 184,300 | | | | 1,015,076 | |
| Tencent Holdings, Ltd. | | | 187,200 | | | | 13,678,185 | |
| Tencent Music Entertainment Group ADR (*) | | | 167,604 | | | | 3,224,701 | |
| Trip.com Group, Ltd. ADR (*) | | | 94,578 | | | | 3,190,116 | |
| Weibo Corp. Sponsored ADR (*) | | | 88,959 | | | | 3,646,429 | |
| Wuliangye Yibin Co., Ltd. Class A | | | 37,200 | | | | 1,664,282 | |
| Xiabuxiabu Catering Management China Holdings Co., Ltd. | | | 1,271,500 | | | | 2,909,130 | |
| Zhongsheng Group Holdings, Ltd. | | | 293,000 | | | | 2,088,958 | |
| | | | | | | | 56,511,815 | |
| Colombia | 2.1% | | | | | | | | |
| Bancolombia SA Sponsored ADR | | | 104,827 | | | | 4,211,949 | |
The accompanying notes are an integral part of these financial statements.
64 Annual Report
| Description | | Shares | | | Fair
Value | |
| | | | | | | |
| Lazard Developing Markets Equity Portfolio (continued) | | | | | | | | |
| | | | | | | | | |
| Hong Kong | 2.2% | | | | | | | | |
| China Gas Holdings, Ltd. | | | 537,000 | | | $ | 2,141,135 | |
| Techtronic Industries Co., Ltd. | | | 156,502 | | | | 2,240,823 | |
| | | | | | | | 4,381,958 | |
| India | 9.0% | | | | | | | | |
| HDFC Bank, Ltd. ADR (*) | | | 57,560 | | | | 4,159,286 | |
| ICICI Bank, Ltd. Sponsored ADR (*) | | | 404,746 | | | | 6,014,525 | |
| Motherson Sumi Systems, Ltd. | | | 783,251 | | | | 1,776,461 | |
| Mphasis, Ltd. | | | 68,552 | | | | 1,448,514 | |
| Reliance Industries, Ltd. | | | 46,208 | | | | 1,258,750 | |
| Shriram Transport Finance Co., Ltd. | | | 106,771 | | | | 1,535,958 | |
| UPL, Ltd. | | | 309,362 | | | | 1,977,502 | |
| | | | | | | | 18,170,996 | |
| Indonesia | 3.0% | | | | | | | | |
| PT Bank Central Asia Tbk | | | 1,107,300 | | | | 2,667,974 | |
| PT Bank Rakyat Indonesia (Persero) Tbk | | | 11,257,200 | | | | 3,341,522 | |
| | | | | | | | 6,009,496 | |
| Macau | 1.2% | | | | | | | | |
| SJM Holdings, Ltd. | | | 2,210,000 | | | | 2,475,927 | |
| | | | | | | | | |
| Mexico | 2.2% | | | | | | | | |
| Grupo Financiero Banorte SAB de CV, Class O (*) | | | 802,557 | | | | 4,433,533 | |
| | | | | | | | | |
| Peru | 1.3% | | | | | | | | |
| Credicorp, Ltd. | | | 15,454 | | | | 2,534,765 | |
| | | | | | | | | |
| Philippines | 1.8% | | | | | | | | |
| BDO Unibank, Inc. | | | 1,018,055 | | | | 2,266,423 | |
| International Container Terminal Services, Inc. | | | 566,809 | | | | 1,458,060 | |
| | | | | | | | 3,724,483 | |
| Russia | 4.2% | | | | | | | | |
| Mail.Ru Group, Ltd. GDR (*) | | | 86,799 | | | | 2,274,091 | |
| Novatek PJSC Sponsored GDR | | | 7,807 | | | | 1,266,631 | |
| Sberbank of Russia PJSC (‡) | | | 959,121 | | | | 3,515,139 | |
| Yandex NV Class A (*) | | | 18,831 | | | | 1,310,261 | |
| | | | | | | | 8,366,122 | |
The accompanying notes are an integral part of these financial statements.
Annual Report 65
| Description | | Shares | | | Fair
Value | |
| | | | | | | |
| Lazard Developing Markets Equity Portfolio (continued) | | | | | | | | |
| | | | | | | | | |
| South Africa | 3.5% | | | | | | | | |
| Capitec Bank Holdings, Ltd. (*) | | | 40,040 | | | $ | 3,901,809 | |
| Standard Bank Group, Ltd. | | | 364,979 | | | | 3,164,417 | |
| | | | | | | | 7,066,226 | |
| South Korea | 14.9% | | | | | | | | |
| CJ Logistics Corp. (*) | | | 12,152 | | | | 1,852,118 | |
| NCSoft Corp. | | | 3,571 | | | | 3,065,602 | |
| Samsung Biologics Co., Ltd. (*) | | | 1,745 | | | | 1,324,342 | |
| Samsung Electronics Co., Ltd. | | | 180,041 | | | | 13,455,802 | |
| SK Hynix, Inc. | | | 54,360 | | | | 5,946,851 | |
| WONIK IPS Co., Ltd. (*) | | | 103,258 | | | | 4,221,017 | |
| | | | | | | | 29,865,732 | |
| Taiwan | 14.4% | | | | | | | | |
| Airtac International Group | | | 109,000 | | | | 3,492,835 | |
| ASE Technology Holding Co., Ltd. | | | 799,289 | | | | 2,312,920 | |
| Bizlink Holding, Inc. | | | 293,000 | | | | 2,548,485 | |
| Chroma ATE, Inc. | | | 471,000 | | | | 2,820,458 | |
| Hiwin Technologies Corp. | | | 332,742 | | | | 4,555,036 | |
| Largan Precision Co., Ltd. | | | 15,860 | | | | 1,796,827 | |
| MediaTek, Inc. | | | 53,000 | | | | 1,415,409 | |
| RichWave Technology Corp. | | | 128,000 | | | | 1,805,768 | |
| Silicon Motion Technology Corp. ADR | | | 36,777 | | | | 1,770,813 | |
| Taiwan Semiconductor Manufacturing Co., Ltd. | | | 340,000 | | | | 6,385,704 | |
| | | | | | | | 28,904,255 | |
| United Kingdom | 1.1% | | | | | | | | |
| KAZ Minerals PLC | | | 235,655 | | | | 2,127,367 | |
| | | | | | | | | |
Total Common Stocks
(Cost $134,665,440) | | | | | | | 194,315,634 | |
| | | | | | | | | |
| Preferred Stocks | 2.5% | | | | | | | | |
| | | | | | | | | |
| Brazil | 2.5% | | | | | | | | |
Banco Bradesco SA ADR
(Cost $4,231,494) | | | 941,955 | | | | 4,954,683 | |
The accompanying notes are an integral part of these financial statements.
66 Annual Report
| Description | | Shares | | | Fair
Value | |
| | | | | | | |
| Lazard Developing Markets Equity Portfolio (concluded) | | | | | | | | |
| | | | | | | | | |
| Short-Term Investments | 1.1% | | | | | | | | |
State Street Institutional Treasury Money Market Fund, Premier Class, 0.01% (7 day yield)
(Cost $2,209,385) | | | 2,209,385 | | | $ | 2,209,385 | |
| | | | | | | | | |
Total Investments | 100.4%
(Cost $141,106,319) | | | | | | | 201,479,702 | |
| | | | | | | | | |
| Liabilities in Excess of Cash and Other Assets | (0.4)% | | | | | | | (876,326 | ) |
| | | | | | | | | |
| Net Assets | 100.0% | | | | | | $ | 200,603,376 | |
The accompanying notes are an integral part of these financial statements.
Annual Report 67
| Description | | Shares | | | Fair
Value | |
| | | | | | | |
| Lazard Emerging Markets Core Equity Portfolio | | | | | | | | |
| | | | | | | | | |
| Common Stocks | 98.5% | | | | | | | | |
| | | | | | | | | |
| Argentina | 1.1% | | | | | | | | |
| MercadoLibre, Inc. (*) | | | 1,385 | | | $ | 2,320,180 | |
| | | | | | | | | |
| Brazil | 6.3% | | | | | | | | |
| Azul SA ADR (*) | | | 45,970 | | | | 1,049,035 | |
| Banco BTG Pactual SA | | | 126,995 | | | | 2,311,096 | |
| Banco do Brasil SA | | | 322,800 | | | | 2,433,757 | |
| C&A Modas Ltda | | | 411,100 | | | | 1,026,425 | |
| CCR SA | | | 319,330 | | | | 832,371 | |
| Lojas Renner SA | | | 84,000 | | | | 708,282 | |
| Pet Center Comercio e Participacoes SA | | | 560,081 | | | | 2,066,186 | |
| Rumo SA (*) | | | 435,058 | | | | 1,616,959 | |
| Telefonica Brasil SA ADR | | | 146,448 | | | | 1,296,065 | |
| | | | | | | | 13,340,176 | |
| Canada | 0.7% | | | | | | | | |
| Parex Resources, Inc. (*) | | | 105,998 | | | | 1,458,940 | |
| | | | | | | | | |
| China | 35.7% | | | | | | | | |
| 21Vianet Group, Inc. ADR (*) | | | 101,066 | | | | 3,505,980 | |
| Alibaba Group Holding, Ltd. (*) | | | 44,900 | | | | 1,311,871 | |
| Alibaba Group Holding, Ltd. Sponsored ADR (*) | | | 46,264 | | | | 10,767,021 | |
| Bilibili, Inc. Sponsored ADR (*) | | | 20,183 | | | | 1,730,087 | |
| Budweiser Brewing Co. APAC, Ltd. | | | 581,800 | | | | 1,923,307 | |
| China National Building Material Co., Ltd., Class H | | | 2,484,000 | | | | 2,995,912 | |
| Industrial & Commercial Bank of China, Ltd., Class H | | | 8,869,633 | | | | 5,770,948 | |
| JD.com, Inc. ADR (*) | | | 24,955 | | | | 2,193,544 | |
| Kingsoft Cloud Holdings, Ltd. ADR (*) | | | 39,961 | | | | 1,740,302 | |
| Midea Group Co., Ltd., Class A | | | 108,100 | | | | 1,629,941 | |
| NetEase, Inc. | | | 50,800 | | | | 972,033 | |
| NetEase, Inc. ADR | | | 22,229 | | | | 2,128,871 | |
| New Oriental Education & Technology Group, Inc. Sponsored ADR (*) | | | 18,503 | | | | 3,438,042 | |
| PICC Property & Casualty Co., Ltd., Class H | | | 1,595,770 | | | | 1,209,084 | |
| Ping An Insurance (Group) Co. of China, Ltd., Class H | | | 419,000 | | | | 5,146,592 | |
The accompanying notes are an integral part of these financial statements.
68 Annual Report
| Description | | Shares | | | Fair
Value | |
| | | | | | | |
| Lazard Emerging Markets Core Equity Portfolio (continued) | | | | | | | | |
| | | | | | | | | |
| Prosus NV | | | 9,686 | | | $ | 1,041,955 | |
| Shenzhen Sunway Communication Co., Ltd., Class A | | | 182,700 | | | | 1,006,264 | |
| Shenzhou International Group Holdings, Ltd. | | | 162,591 | | | | 3,189,009 | |
| Tencent Holdings, Ltd. | | | 221,800 | | | | 16,206,311 | |
| Wuliangye Yibin Co., Ltd. Class A | | | 76,300 | | | | 3,413,567 | |
| Wuxi Biologics Cayman, Inc. (*) | | | 209,000 | | | | 2,783,893 | |
| Wuxi Lead Intelligent Equipment Co., Ltd. | | | 137,000 | | | | 1,764,874 | |
| | | | | | | | 75,869,408 | |
| Hong Kong | 2.5% | | | | | | | | |
| China Gas Holdings, Ltd. | | | 405,000 | | | | 1,614,822 | |
| Techtronic Industries Co., Ltd. | | | 258,000 | | | | 3,694,089 | |
| | | | | | | | 5,308,911 | |
| India | 9.9% | | | | | | | | |
| HDFC Bank, Ltd. ADR (*) | | | 100,022 | | | | 7,227,590 | |
| Hindalco Industries, Ltd. | | | 728,554 | | | | 2,407,308 | |
| Infosys, Ltd. Sponsored ADR | | | 189,350 | | | | 3,209,482 | |
| Maruti Suzuki India, Ltd. | | | 17,740 | | | | 1,861,440 | |
| Motherson Sumi Systems, Ltd. | | | 514,785 | | | | 1,167,564 | |
| Reliance Industries, Ltd. | | | 110,717 | | | | 3,016,036 | |
| UPL, Ltd. | | | 336,826 | | | | 2,153,057 | |
| | | | | | | | 21,042,477 | |
| Indonesia | 1.4% | | | | | | | | |
| PT Bank Mandiri (Persero) Tbk | | | 4,004,400 | | | | 1,807,066 | |
| PT Telekomunikasi Indonesia (Persero) Tbk Sponsored ADR | | | 49,683 | | | | 1,168,544 | |
| | | | | | | | 2,975,610 | |
| Luxembourg | 1.3% | | | | | | | | |
| Ternium SA Sponsored ADR (*) | | | 93,449 | | | | 2,717,497 | |
| | | | | | | | | |
| Mexico | 2.7% | | | | | | | | |
| Arca Continental SAB de CV | | | 257,345 | | | | 1,237,356 | |
| Gruma SAB de CV, Class B | | | 126,398 | | | | 1,504,936 | |
| Grupo Aeroportuario del Pacifico SAB de CV ADR (*) | | | 14,386 | | | | 1,601,018 | |
| Grupo Financiero Banorte SAB de CV, Class O (*) | | | 268,500 | | | | 1,483,264 | |
| | | | | | | | 5,826,574 | |
The accompanying notes are an integral part of these financial statements.
Annual Report 69
| Description | | Shares | | | Fair
Value | |
| | | | | | | |
| Lazard Emerging Markets Core Equity Portfolio (continued) | | | | | | | | |
| | | | | | | | | |
| Philippines | 0.9% | | | | | | | | |
| BDO Unibank, Inc. | | | 875,401 | | | $ | 1,948,843 | |
| | | | | | | | | |
| Poland | 2.0% | | | | | | | | |
| CD Projekt SA (*) | | | 15,039 | | | | 1,105,496 | |
| KGHM Polska Miedz SA (*) | | | 63,509 | | | | 3,113,193 | |
| | | | | | | | 4,218,689 | |
| Russia | 3.9% | | | | | | | | |
| LUKOIL PJSC Sponsored ADR | | | 65,723 | | | | 4,481,318 | |
| Sberbank of Russia PJSC Sponsored ADR (United States) | | | 53,682 | | | | 778,389 | |
| Sberbank of Russia PJSC Sponsored ADR (London) | | | 204,405 | | | | 2,946,680 | |
| | | | | | | | 8,206,387 | |
| South Africa | 2.7% | | | | | | | | |
| Mondi PLC | | | 111,702 | | | | 2,636,372 | |
| Naspers, Ltd., N Shares | | | 9,203 | | | | 1,883,594 | |
| The Bidvest Group, Ltd. | | | 107,450 | | | | 1,154,527 | |
| | | | | | | | 5,674,493 | |
| South Korea | 12.1% | | | | | | | | |
| DB Insurance Co., Ltd. | | | 25,145 | | | | 1,013,233 | |
| NCSoft Corp. | | | 4,305 | | | | 3,695,720 | |
| Orion Corp. | | | 14,046 | | | | 1,600,262 | |
| Samsung Electronics Co., Ltd. | | | 197,890 | | | | 14,789,790 | |
| SK Hynix, Inc. | | | 42,730 | | | | 4,674,557 | |
| | | | | | | | 25,773,562 | |
| Taiwan | 12.2% | | | | | | | | |
| Accton Technology Corp. | | | 143,000 | | | | 1,614,719 | |
| Largan Precision Co., Ltd. | | | 14,000 | | | | 1,586,102 | |
| Micro-Star International Co., Ltd. | | | 367,000 | | | | 1,731,366 | |
| Taiwan Semiconductor Manufacturing Co., Ltd. Sponsored ADR | | | 192,038 | | | | 20,939,823 | |
| | | | | | | | 25,872,010 | |
| Turkey | 0.8% | | | | | | | | |
| Turkiye Garanti Bankasi AS (*) | | | 1,254,973 | | | | 1,758,148 | |
| | | | | | | | | |
| United Kingdom | 1.5% | | | | | | | | |
| Unilever PLC Sponsored ADR | | | 54,530 | | | | 3,291,431 | |
The accompanying notes are an integral part of these financial statements.
70 Annual Report
| Description | | Shares | | | Fair
Value | |
| | | | | | | |
| Lazard Emerging Markets Core Equity Portfolio (concluded) | | | | | | | | |
| | | | | | | | | |
| United States | 0.8% | | | | | | | | |
| Yum China Holdings, Inc. | | | 30,416 | | | $ | 1,736,449 | |
| | | | | | | | | |
Total Common Stocks
(Cost $139,253,527) | | | | | | | 209,339,785 | |
| | | | | | | | | |
| Preferred Stocks | 0.8% | | | | | | | | |
| | | | | | | | | |
| Brazil | 0.8% | | | | | | | | |
Itau Unibanco Holding SA Sponsored ADR
(Cost $1,876,251) | | | 276,311 | | | | 1,682,734 | |
| | | | | | | | | |
| Short-Term Investments | 0.8% | | | | | | | | |
State Street Institutional Treasury Money Market Fund, Premier Class, 0.01% (7 day yield)
(Cost $1,681,375) | | | 1,681,375 | | | | 1,681,375 | |
| | | | | | | | | |
Total Investments | 100.1%
(Cost $142,811,153) | | | | | | $ | 212,703,894 | |
| | | | | | | | | |
| Liabilities in Excess of Cash and Other Assets | (0.1)% | | | | | | | (113,039 | ) |
| | | | | | | | | |
| Net Assets | 100.0% | | | | | | $ | 212,590,855 | |
The accompanying notes are an integral part of these financial statements.
Annual Report 71
| Description | | Shares | | | Fair
Value | |
| | | | | | | |
| Lazard Emerging Markets Equity Advantage Portfolio | | | | | | | | |
| | | | | | | | | |
| Common Stocks | 98.0% | | | | | | | | |
| | | | | | | | | |
| Argentina | 0.2% | | | | | | | | |
| Globant SA (*) | | | 288 | | | $ | 62,672 | |
| | | | | | | | | |
| Brazil | 3.8% | | | | | | | | |
| Ambev SA | | | 43,300 | | | | 130,843 | |
| BRF SA (*) | | | 18,300 | | | | 76,457 | |
| Cia Paranaense de Energia | | | 3,800 | | | | 54,227 | |
| Pagseguro Digital, Ltd., Class A (*) | | | 1,308 | | | | 74,399 | |
| Petroleo Brasileiro SA | | | 31,439 | | | | 173,725 | |
| Totvs SA | | | 12,900 | | | | 71,414 | |
| Vale SA | | | 20,709 | | | | 345,958 | |
| WEG SA | | | 10,600 | | | | 155,551 | |
| | | | | | | | 1,082,574 | |
| | | | | | | | | |
| China | 38.1% | | | | | | | | |
| Agricultural Bank of China, Ltd., Class H | | | 481,000 | | | | 176,291 | |
| Alibaba Group Holding, Ltd. Sponsored ADR (*) | | | 7,687 | | | | 1,788,995 | |
| Anhui Conch Cement Co., Ltd., Class H | | | 12,500 | | | | 78,309 | |
| Anhui Guangxin Agrochemical Co., Ltd., Class A (*) | | | 36,000 | | | | 132,153 | |
| Anhui Hengyuan Coal Industry and Electricity Power Co., Ltd., Class A | | | 54,700 | | | | 52,728 | |
| Autohome, Inc. ADR | | | 522 | | | | 52,002 | |
| Baidu, Inc. Sponsored ADR (*) | | | 1,463 | | | | 316,359 | |
| Bank of China, Ltd., Class H | | | 403,000 | | | | 137,828 | |
| Bank of Communications Co., Ltd., Class H | | | 543,000 | | | | 287,245 | |
| Bank of Jiangsu Co., Ltd., Class A | | | 90,500 | | | | 75,570 | |
| Baoshan Iron & Steel Co., Ltd., Class A | | | 48,800 | | | | 44,431 | |
| Brilliance China Automotive Holdings, Ltd. | | | 48,000 | | | | 43,796 | |
| China CITIC Bank Corp., Ltd., Class H | | | 153,000 | | | | 64,969 | |
| China Construction Bank Corp., Class H | | | 391,000 | | | | 297,550 | |
| China Everbright Bank Co., Ltd., Class H | | | 229,000 | | | | 87,349 | |
| China Feihe, Ltd. | | | 44,000 | | | | 103,479 | |
| China Lesso Group Holdings, Ltd. | | | 41,000 | | | | 64,367 | |
| China Life Insurance Co., Ltd., Class H | | | 22,000 | | | | 48,667 | |
The accompanying notes are an integral part of these financial statements.
72 Annual Report
| Description | | Shares | | | Fair
Value | |
| | | | | | | |
| Lazard Emerging Markets Equity Advantage Portfolio (continued) | | | | | | | | |
| | | | | | | | | |
| China Medical System Holdings, Ltd. | | | 55,000 | | | $ | 61,638 | |
| China Meidong Auto Holdings, Ltd. | | | 14,000 | | | | 56,920 | |
| China Merchants Bank Co., Ltd., Class H | | | 22,500 | | | | 142,893 | |
| China Minsheng Banking Corp., Ltd., Class H | | | 505,000 | | | | 287,995 | |
| China Pacific Insurance Group Co., Ltd., Class A | | | 10,000 | | | | 58,828 | |
| China Petroleum & Chemical Corp., Class H | | | 120,000 | | | | 53,336 | |
| China Resources Cement Holdings, Ltd. | | | 62,000 | | | | 69,296 | |
| China Resources Land, Ltd. | | | 10,000 | | | | 41,435 | |
| China Resources Power Holdings Co., Ltd. | | | 34,000 | | | | 36,729 | |
| China Shenhua Energy Co., Ltd., Class H | | | 112,500 | | | | 211,983 | |
| China Vanke Co., Ltd., Class H | | | 21,300 | | | | 73,649 | |
| China Yuhua Education Corp., Ltd. | | | 94,000 | | | | 82,004 | |
| COSCO SHIPPING Holdings Co., Ltd. (*) | | | 62,500 | | | | 75,031 | |
| CSC Financial Co., Ltd., Class H | | | 57,000 | | | | 75,796 | |
| CSPC Pharmaceutical Group, Ltd. | | | 105,840 | | | | 108,232 | |
| ENN Energy Holdings, Ltd. | | | 4,700 | | | | 68,986 | |
| Great Wall Motor Co., Ltd., Class H | | | 53,500 | | | | 184,224 | |
| Guangdong Baolihua New Energy Stock Co., Ltd., Class A | | | 46,000 | | | | 51,406 | |
| Guangdong Tapai Group Co., Ltd., Class A | | | 17,000 | | | | 33,173 | |
| Industrial & Commercial Bank of China, Ltd., Class H | | | 208,000 | | | | 135,333 | |
| JD.com, Inc. ADR (*) | | | 4,184 | | | | 367,774 | |
| Jiangsu Hengrui Medicine Co., Ltd., Class A | | | 3,760 | | | | 64,231 | |
| Kunlun Energy Co., Ltd. | | | 66,000 | | | | 57,078 | |
| Li Ning Co., Ltd. | | | 30,500 | | | | 210,115 | |
| Meituan, Class B (*) | | | 12,500 | | | | 478,079 | |
| NetEase, Inc. ADR | | | 1,586 | | | | 151,891 | |
| New China Life Insurance Co., Ltd., Class H | | | 11,900 | | | | 46,592 | |
| New Oriental Education & Technology Group, Inc. Sponsored ADR (*) | | | 469 | | | | 87,145 | |
| PetroChina Co., Ltd., Class H | | | 166,000 | | | | 50,973 | |
| Pharmaron Beijing Co., Ltd., Class H | | | 7,600 | | | | 128,807 | |
| Pinduoduo, Inc. ADR (*) | | | 1,268 | | | | 225,286 | |
| Ping An Insurance (Group) Co. of China, Ltd., Class H | | | 33,500 | | | | 411,482 | |
| Sany Heavy Industry Co., Ltd., Class A | | | 19,300 | | | | 103,278 | |
| Shandong Nanshan Aluminum Co., Ltd., Class A | | | 106,600 | | | | 51,608 | |
The accompanying notes are an integral part of these financial statements.
Annual Report 73
| Description | | Shares | | | Fair
Value | |
| | | | | | | |
| Lazard Emerging Markets Equity Advantage Portfolio (continued) | | | | | | | | |
| | | | | | | | | |
| Shanghai Liangxin Electrical Co., Ltd. | | | 25,400 | | | $ | 119,199 | |
| Shenzhen Inovance Technology Co., Ltd., Class A | | | 3,900 | | | | 55,762 | |
| Shenzhen Mindray Bio-Medical Electronics Co., Ltd., Class A | | | 900 | | | | 58,475 | |
| Shenzhou International Group Holdings, Ltd. | | | 6,800 | | | | 133,373 | |
| Sinotruk Hong Kong, Ltd. | | | 23,500 | | | | 60,184 | |
| Tencent Holdings, Ltd. | | | 22,400 | | | | 1,636,706 | |
| Tencent Music Entertainment Group ADR (*) | | | 6,664 | | | | 128,215 | |
| Tian Di Science & Technology Co., Ltd., Class A | | | 299,500 | | | | 141,271 | |
| Vipshop Holdings, Ltd. ADR (*) | | | 4,779 | | | | 134,338 | |
| Xiaomi Corp., Class B (*) | | | 26,800 | | | | 115,580 | |
| Yuexiu Property Co., Ltd. | | | 282,000 | | | | 56,862 | |
| Zhejiang Weixing New Building Materials Co., Ltd., Class A | | | 17,900 | | | | 51,207 | |
| Zhongsheng Group Holdings, Ltd. | | | 9,500 | | | | 67,731 | |
| | | | | | | | 10,954,217 | |
| Greece | 0.6% | | | | | | | | |
| Hellenic Telecommunications Organization SA | | | 10,450 | | | | 168,528 | |
| | | | | | | | | |
| Hong Kong | 0.2% | | | | | | | | |
| Shimao Group Holdings, Ltd. | | | 14,500 | | | | 46,358 | |
| | | | | | | | | |
| Hungary | 0.8% | | | | | | | | |
| MOL Hungarian Oil & Gas PLC (*) | | | 10,483 | | | | 76,275 | |
| Richter Gedeon Nyrt. | | | 6,475 | | | | 162,496 | |
| | | | | | | | 238,771 | |
| India | 7.3% | | | | | | | | |
| Axis Bank, Ltd. GDR (*) | | | 813 | | | | 34,607 | |
| Dr Reddy’s Laboratories, Ltd. ADR | | | 3,865 | | | | 275,536 | |
| GAIL India, Ltd. GDR | | | 4,656 | | | | 45,975 | |
| HDFC Bank, Ltd. ADR (*) | | | 5,556 | | | | 401,477 | |
| ICICI Bank, Ltd. Sponsored ADR (*) | | | 13,435 | | | | 199,644 | |
| Infosys, Ltd. Sponsored ADR | | | 28,453 | | | | 482,278 | |
| Reliance Industries, Ltd. Sponsored GDR (#) | | | 3,571 | | | | 195,391 | |
| State Bank of India GDR (*) | | | 2,443 | | | | 91,568 | |
| Tata Motors, Ltd. Sponsored ADR (*) | | | 5,027 | | | | 63,340 | |
The accompanying notes are an integral part of these financial statements.
74 Annual Report
| Description | | Shares | | | Fair
Value | |
| | | | | | | |
| Lazard Emerging Markets Equity Advantage Portfolio (continued) | | | | | | | | |
| | | | | | | | | |
| Wipro, Ltd. ADR | | | 32,001 | | | $ | 180,806 | |
| WNS Holdings, Ltd. ADR (*) | | | 1,774 | | | | 127,817 | |
| | | | | | | | 2,098,439 | |
| Indonesia | 1.5% | | | | | | | | |
| Kalbe Farma Tbk PT | | | 484,000 | | | | 50,986 | |
| PT Bank Central Asia Tbk | | | 72,800 | | | | 175,407 | |
| PT Bank Mandiri (Persero) Tbk | | | 210,200 | | | | 94,857 | |
| PT Bank Rakyat Indonesia (Persero) Tbk | | | 156,300 | | | | 46,395 | |
| PT Telekomunikasi Indonesia (Persero) Tbk Sponsored ADR | | | 3,134 | | | | 73,712 | |
| | | | | | | | 441,357 | |
| Malaysia | 1.8% | | | | | | | | |
| Frontken Corp. Bhd | | | 53,800 | | | | 47,704 | |
| Hartalega Holdings Berhad | | | 33,700 | | | | 101,891 | |
| Hong Leong Financial Group Bhd | | | 14,800 | | | | 66,576 | |
| Inari Amertron Berhad | | | 155,900 | | | | 107,021 | |
| Kossan Rubber Industries | | | 41,700 | | | | 46,765 | |
| Petronas Chemicals Group Bhd | | | 46,600 | | | | 86,271 | |
| VS Industry Berhad | | | 79,800 | | | | 51,430 | |
| | | | | | | | 507,658 | |
| Mexico | 2.7% | | | | | | | | |
| America Movil SAB de CV, Class L Sponsored ADR | | | 8,720 | | | | 126,789 | |
| Arca Continental SAB de CV | | | 28,400 | | | | 136,552 | |
| Gruma SAB de CV, Class B | | | 3,790 | | | | 45,125 | |
| Grupo Mexico SAB de CV, Series B | | | 17,900 | | | | 75,668 | |
| Kimberly-Clark de Mexico SAB de CV, Series A | | | 27,300 | | | | 46,631 | |
| Qualitas Controladora SAB de CV | | | 28,000 | | | | 150,753 | |
| Wal-Mart de Mexico SAB de CV | | | 70,300 | | | | 197,763 | |
| | | | | | | | 779,281 | |
| Philippines | 0.5% | | | | | | | | |
| International Container Terminal Services, Inc. | | | 26,100 | | | | 67,140 | |
| Metropolitan Bank & Trust Co. | | | 72,700 | | | | 74,282 | |
| | | | | | | | 141,422 | |
| Poland | 1.6% | | | | | | | | |
| Dino Polska SA (*) | | | 660 | | | | 51,107 | |
| KGHM Polska Miedz SA (*) | | | 2,055 | | | | 100,736 | |
The accompanying notes are an integral part of these financial statements.
Annual Report 75
| Description | | Shares | | | Fair
Value | |
| | | | | | | |
| Lazard Emerging Markets Equity Advantage Portfolio (continued) | | | | | | | | |
| | | | | | | | | |
| Orange Polska SA (*) | | | 38,115 | | | $ | 67,213 | |
| Polskie Gornictwo Naftowe i Gazownictwo SA | | | 114,145 | | | | 169,242 | |
| Powszechna Kasa Oszczednosci Bank Polski SA (*) | | | 8,958 | | | | 69,051 | |
| | | | | | | | 457,349 | |
| Russia | 3.5% | | | | | | | | |
| Gazprom PJSC Sponsored ADR | | | 9,205 | | | | 51,172 | |
| LUKOIL PJSC Sponsored ADR | | | 3,197 | | | | 217,987 | |
| MMC Norilsk Nickel PJSC ADR | | | 2,967 | | | | 92,663 | |
| PhosAgro PJSC GDR | | | 2,592 | | | | 35,347 | |
| Polyus PJSC GDR | | | 1,070 | | | | 107,810 | |
| RusHydro PJSC ADR | | | 41,344 | | | | 44,375 | |
| Sberbank of Russia PJSC Sponsored ADR (London) | | | 21,970 | | | | 316,717 | |
| Tatneft PJSC Sponsored ADR | | | 2,128 | | | | 86,800 | |
| Yandex NV Class A (*) | | | 738 | | | | 51,350 | |
| | | | | | | | 1,004,221 | |
| | | | | | | | | |
| South Africa | 2.4% | | | | | | | | |
| African Rainbow Minerals, Ltd. | | | 3,084 | | | | 55,003 | |
| Clicks Group, Ltd. | | | 2,691 | | | | 46,302 | |
| Impala Platinum Holdings, Ltd. | | | 4,498 | | | | 61,857 | |
| Kumba Iron Ore, Ltd. | | | 1,098 | | | | 46,648 | |
| Naspers, Ltd., N Shares | | | 1,099 | | | | 224,934 | |
| Ninety One, Ltd. | | | 12,339 | | | | 36,977 | |
| Northam Platinum, Ltd. (*) | | | 3,416 | | | | 48,801 | |
| Sibanye Stillwater, Ltd. | | | 22,273 | | | | 89,692 | |
| Tiger Brands, Ltd. | | | 5,468 | | | | 77,060 | |
| | | | | | | | 687,274 | |
| | | | | | | | | |
| South Korea | 15.1% | | | | | | | | |
| BNK Financial Group, Inc. | | | 9,145 | | | | 47,853 | |
| Celltrion, Inc. (*) | | | 385 | | | | 126,881 | |
| Coway Co., Ltd. (*) | | | 1,063 | | | | 71,151 | |
| DongKook Pharmaceutical Co., Ltd. | | | 2,146 | | | | 57,926 | |
| DoubleUGames Co., Ltd. | | | 822 | | | | 45,654 | |
| Hana Financial Group, Inc. | | | 10,518 | | | | 334,447 | |
| Hankook Tire & Technology Co., Ltd. | | | 1,502 | | | | 54,574 | |
The accompanying notes are an integral part of these financial statements.
76 Annual Report
| Description | | Shares | | | Fair
Value | |
| | | | | | | |
| Lazard Emerging Markets Equity Advantage Portfolio (continued) | | | | | | | | |
| | | | | | | | | |
| Hansol Chemical Co., Ltd. | | | 372 | | | $ | 67,517 | |
| Hanwha Chemical Corp. | | | 2,006 | | | | 88,236 | |
| Hyundai Mobis Co., Ltd. | | | 467 | | | | 110,166 | |
| JYP Entertainment Corp. | | | 1,447 | | | | 51,223 | |
| KB Financial Group, Inc. ADR | | | 4,991 | | | | 197,644 | |
| KEPCO Plant Service & Engineering Co., Ltd. | | | 2,967 | | | | 81,222 | |
| Kia Motors Corp. | | | 3,815 | | | | 219,715 | |
| Korea Electric Power Corp. (*) | | | 2,198 | | | | 55,547 | |
| Korea Zinc Co., Ltd. | | | 284 | | | | 104,844 | |
| KT&G Corp. | | | 741 | | | | 56,755 | |
| LG Electronics, Inc. | | | 1,020 | | | | 126,866 | |
| LG Household & Health Care, Ltd. | | | 120 | | | | 178,963 | |
| LOTTE Fine Chemical Co., Ltd. | | | 2,687 | | | | 136,296 | |
| Mirae Asset Daewoo Co., Ltd. | | | 11,477 | | | | 100,047 | |
| NAVER Corp. | | | 194 | | | | 52,384 | |
| NCSoft Corp. | | | 118 | | | | 101,300 | |
| Orion Corp. | | | 355 | | | | 40,445 | |
| POSCO | | | 347 | | | | 86,953 | |
| Samsung Electro-Mechanics Co., Ltd. | | | 300 | | | | 49,303 | |
| Samsung Electronics Co., Ltd. GDR | | | 888 | | | | 1,613,998 | |
| SK Telecom Co., Ltd. | | | 323 | | | | 70,879 | |
| | | | | | | | 4,328,789 | |
| Taiwan | 14.8% | | | | | | | | |
| Asia Cement Corp. | | | 36,000 | | | | 55,467 | |
| Delta Electronics, Inc. | | | 31,000 | | | | 289,172 | |
| Elan Microelectronics Corp. | | | 26,000 | | | | 123,986 | |
| Evergreen Marine Corp. Taiwan, Ltd. (*) | | | 82,000 | | | | 118,845 | |
| Feng TAY Enterprise Co., Ltd. | | | 7,000 | | | | 49,832 | |
| Gigabyte Technology Co., Ltd. | | | 28,000 | | | | 77,782 | |
| International Games System Co., Ltd. | | | 4,000 | | | | 108,270 | |
| Kenda Rubber Industrial Co., Ltd. | | | 40,000 | | | | 49,768 | |
| Kindom Development Co., Ltd. | | | 39,000 | | | | 46,613 | |
| Lotes Co., Ltd. | | | 4,000 | | | | 67,595 | |
| Makalot Industrial Co., Ltd. | | | 11,000 | | | | 74,984 | |
| MediaTek, Inc. | | | 3,000 | | | | 80,117 | |
| Micro-Star International Co., Ltd. | | | 32,000 | | | | 150,964 | |
The accompanying notes are an integral part of these financial statements.
Annual Report 77
| Description | | Shares | | | Fair
Value | |
| | | | | | | |
| Lazard Emerging Markets Equity Advantage Portfolio (continued) | | | | | | | | |
| | | | | | | | | |
| Nantex Industry Co., Ltd. | | | 38,000 | | | $ | 82,805 | |
| Nien Made Enterprise Co., Ltd. | | | 7,000 | | | | 81,305 | |
| Novatek Microelectronics Corp. | | | 6,000 | | | | 78,483 | |
| Parade Technologies, Ltd. | | | 2,000 | | | | 79,434 | |
| Taiwan Cement Corp. | | | 30,600 | | | | 47,126 | |
| Taiwan Semiconductor Manufacturing Co., Ltd. Sponsored ADR | | | 19,498 | | | | 2,126,062 | |
| United Microelectronics Corp. | | | 149,000 | | | | 249,768 | |
| Wan Hai Lines, Ltd. | | | 92,000 | | | | 172,377 | |
| Yuanta Financial Holding Co., Ltd. | | | 80,000 | | | | 58,522 | |
| | | | | | | | 4,269,277 | |
| Thailand | 2.0% | | | | | | | | |
| Com7 Public Co., Ltd. NVDR | | | 39,000 | | | | 50,770 | |
| Delta Electronics Thailand Public Co., Ltd. NVDR | | | 22,300 | | | | 361,781 | |
| Hana Microelectronics Public Co., Ltd. NVDR | | | 71,000 | | | | 94,134 | |
| PTT Exploration & Production Public Co., Ltd. (‡) | | | 24,800 | | | | 81,329 | |
| | | | | | | | 588,014 | |
| Turkey | 0.8% | | | | | | | | |
| BIM Birlesik Magazalar AS | | | 12,480 | | | | 126,790 | |
| Turk Telekomunikasyon AS | | | 38,894 | | | | 44,724 | |
| Turkcell Iletisim Hizmetleri AS | | | 31,002 | | | | 67,359 | |
| | | | | | | | 238,873 | |
| United States | 0.3% | | | | | | | | |
| Yum China Holdings, Inc. | | | 1,500 | | | | 85,635 | |
| | | | | | | | | |
Total Common Stocks
(Cost $22,181,621) | | | | | | | 28,180,709 | |
| | | | | | | | | |
| Preferred Stocks | 0.4% | | | | | | | | |
| | | | | | | | | |
| Brazil | 0.4% | | | | | | | | |
| Banco Bradesco SA ADR | | | 11,778 | | | | 61,952 | |
| Itau Unibanco Holding SA Sponsored ADR | | | 10,109 | | | | 61,564 | |
| | | | | | | | | |
Total Preferred Stocks
(Cost $108,321) | | | | | | | 123,516 | |
The accompanying notes are an integral part of these financial statements.
78 Annual Report
| Description | | Shares | | | Fair
Value | |
| | | | | | | |
| Lazard Emerging Markets Equity Advantage Portfolio (concluded) | | | | | | | | |
| | | | | | | | | |
| Short-Term Investments | 0.4% | | | | | | | | |
State Street Institutional Treasury Money Market Fund, Premier Class, 0.01% (7 day yield)
(Cost $124,214) | | | 124,214 | | | $ | 124,214 | |
| | | | | | | | | |
Total Investments | 98.8%
(Cost $22,414,156) | | | | | | $ | 28,428,439 | |
| | | | | | | | | |
| Cash and Other Assets in Excess of Liabilities | 1.2% | | | | | | | 345,137 | |
| | | | | | | | | |
| Net Assets | 100.0% | | | | | | $ | 28,773,576 | |
The accompanying notes are an integral part of these financial statements.
Annual Report 79
| Description | | Shares | | | Fair
Value | |
| | | | | | | |
| Lazard Emerging Markets Equity Blend Portfolio | | | | | | | | |
| | | | | | | | | |
| Common Stocks | 95.7% | | | | | | | | |
| | | | | | | | | |
| Brazil | 4.9% | | | | | | | | |
| Banco do Brasil SA | | | 95,957 | | | $ | 723,470 | |
| Banco Pan SA (Preference Shares) | | | 109,200 | | | | 201,403 | |
| CCR SA | | | 173,430 | | | | 452,065 | |
| Cia de Saneamento do Parana | | | 41,500 | | | | 208,422 | |
| Construtora Tenda SA | | | 34,700 | | | | 201,839 | |
| Log-in Logistica Intermodal SA (*) | | | 57,800 | | | | 181,150 | |
| Lojas Quero Quero S/A | | | 62,942 | | | | 197,770 | |
| Pagseguro Digital, Ltd., Class A (*) | | | 18,294 | | | | 1,040,563 | |
| Petroleo Brasileiro SA (Preference Shares) | | | 120,100 | | | | 663,647 | |
| | | | | | | | 3,870,329 | |
| Canada | 2.3% | | | | | | | | |
| First Quantum Minerals, Ltd. | | | 99,515 | | | | 1,786,407 | |
| | | | | | | | | |
| Chile | 0.4% | | | | | | | | |
| Geopark, Ltd. | | | 24,523 | | | | 318,554 | |
| | | | | | | | | |
| China | 21.9% | | | | | | | | |
| 21Vianet Group, Inc. ADR (*) | | | 6,883 | | | | 238,771 | |
| 360 DigiTech, Inc. ADR (*) | | | 13,757 | | | | 162,195 | |
| Alibaba Group Holding, Ltd. Sponsored ADR (*) | | | 7,050 | | | | 1,640,746 | |
| Anhui Conch Cement Co., Ltd., Class H | | | 101,500 | | | | 635,871 | |
| Ausnutria Dairy Corp., Ltd. | | | 883 | | | | 1,483 | |
| Baidu, Inc. Sponsored ADR (*) | | | 6,495 | | | | 1,404,479 | |
| China Aoyuan Group, Ltd. | | | 187,000 | | | | 181,991 | |
| China Construction Bank Corp., Class H | | | 1,528,281 | | | | 1,163,019 | |
| China Meidong Auto Holdings, Ltd. | | | 52,000 | | | | 211,416 | |
| China Merchants Bank Co., Ltd., Class H | | | 173,000 | | | | 1,098,691 | |
| China Mobile, Ltd. Sponsored ADR | | | 10,244 | | | | 292,364 | |
| China Shenhua Energy Co., Ltd., Class H | | | 377,500 | | | | 711,320 | |
| CNOOC, Ltd. | | | 239,917 | | | | 220,535 | |
| Hengan International Group Co., Ltd. | | | 51,000 | | | | 361,067 | |
| Huami Corp. ADR (*) | | | 13,730 | | | | 162,701 | |
| JNBY Design, Ltd. | | | 190,000 | | | | 220,657 | |
The accompanying notes are an integral part of these financial statements.
80 Annual Report
| Description | | Shares | | | Fair
Value | |
| | | | | | | |
| Lazard Emerging Markets Equity Blend Portfolio (continued) | | | | | | | | |
| | | | | | | | | |
| Kaisa Prosperity Holdings, Ltd. | | | 55,750 | | | $ | 137,723 | |
| Maoyan Entertainment (*) | | | 118,400 | | | | 187,077 | |
| NetEase, Inc. ADR | | | 9,974 | | | | 955,210 | |
| Ping An Insurance (Group) Co. of China, Ltd., Class H | | | 221,500 | | | | 2,720,693 | |
| Precision Tsugami China Corp., Ltd. | | | 236,000 | | | | 227,124 | |
| Sinopharm Group Co., Ltd., Class H | | | 208,400 | | | | 507,994 | |
| Tencent Holdings, Ltd. | | | 35,692 | | | | 2,607,915 | |
| Tianyun International Holdings, Ltd. | | | 1,236,000 | | | | 240,722 | |
| West China Cement, Ltd. | | | 1,032,000 | | | | 153,141 | |
| Wuliangye Yibin Co., Ltd. Class A | | | 16,600 | | | | 742,663 | |
| | | | | | | | 17,187,568 | |
| Colombia | 1.6% | | | | | | | | |
| Bancolombia SA Sponsored ADR | | | 30,208 | | | | 1,213,757 | |
| | | | | | | | | |
| Czech Republic | 0.3% | | | | | | | | |
| Moneta Money Bank AS (*) | | | 72,302 | | | | 228,889 | |
| | | | | | | | | |
| Egypt | 1.0% | | | | | | | | |
| Commercial International Bank Egypt SAE GDR | | | 108,150 | | | | 405,700 | |
| Credit Agricole Egypt SAE | | | 97,291 | | | | 179,498 | |
| Six of October Development & Investment | | | 237,220 | | | | 223,798 | |
| | | | | | | | 808,996 | |
| Estonia | 0.2% | | | | | | | | |
| Tallinna Sadam AS | | | 87,102 | | | | 191,549 | |
| | | | | | | | | |
| Georgia | 0.5% | | | | | | | | |
| Bank of Georgia Group PLC (*) | | | 12,034 | | | | 200,894 | |
| TBC Bank Group PLC (*) | | | 12,688 | | | | 217,104 | |
| | | | | | | | 417,998 | |
| Greece | 0.3% | | | | | | | | |
| OPAP SA | | | 19,969 | | | | 267,407 | |
| | | | | | | | | |
| Hong Kong | 2.4% | | | | | | | | |
| China Water Affairs Group, Ltd. | | | 216,000 | | | | 168,872 | |
| Techtronic Industries Co., Ltd. | | | 112,782 | | | | 1,614,832 | |
| TK Group Holdings, Ltd. | | | 308,000 | | | | 99,509 | |
| | | | | | | | 1,883,213 | |
The accompanying notes are an integral part of these financial statements.
Annual Report 81
| Description | | Shares | | | Fair
Value | |
| | | | | | | |
| Lazard Emerging Markets Equity Blend Portfolio (continued) | | | | | | | | |
| | | | | | | | | |
| Hungary | 1.3% | | | | | | | | |
| OTP Bank Nyrt. (*) | | | 21,838 | | | $ | 982,643 | |
| | | | | | | | | |
| India | 10.2% | | | | | | | | |
| Axis Bank, Ltd. (*) | | | 153,562 | | | | 1,307,239 | |
| Bajaj Auto, Ltd. | | | 14,934 | | | | 704,572 | |
| Gujarat State Petronet, Ltd. | | | 72,990 | | | | 221,701 | |
| HCL Technologies, Ltd. | | | 41,864 | | | | 543,315 | |
| ICICI Bank, Ltd. Sponsored ADR (*) | | | 135,062 | | | | 2,007,021 | |
| Infosys, Ltd. Sponsored ADR | | | 44,695 | | | | 757,580 | |
| Jubilant Life Sciences, Ltd. | | | 21,333 | | | | 247,003 | |
| Kiri Industries, Ltd. | | | 22,258 | | | | 164,332 | |
| Petronet LNG, Ltd. | | | 78,634 | | | | 267,168 | |
| Reliance Industries, Ltd. | | | 20,559 | | | | 560,047 | |
| Tata Consultancy Services, Ltd. | | | 14,946 | | | | 586,532 | |
| The South Indian Bank, Ltd. (*) | | | 748,459 | | | | 92,464 | |
| Uflex, Ltd. | | | 47,212 | | | | 243,234 | |
| UPL, Ltd. | | | 42,042 | | | | 268,741 | |
| | | | | | | | 7,970,949 | |
| Indonesia | 4.3% | | | | | | | | |
| PT Bank Mandiri (Persero) Tbk | | | 1,649,600 | | | | 744,415 | |
| PT Bank Pembangunan Daerah Jawa Timur Tbk | | | 4,641,000 | | | | 224,636 | |
| PT Bank Rakyat Indonesia (Persero) Tbk | | | 4,359,759 | | | | 1,294,126 | |
| PT Bekasi Fajar Industrial Estate Tbk (*) | | | 9,411,600 | | | | 120,586 | |
| PT Erajaya Swasembada Tbk (*) | | | 835,900 | | | | 130,903 | |
| PT Media Nusantara Citra Tbk (*) | | | 3,632,900 | | | | 295,354 | |
| PT Telkom Indonesia (Persero) Tbk Sponsored ADR | | | 25,439 | | | | 598,325 | |
| | | | | | | | 3,408,345 | |
| Kenya | 0.2% | | | | | | | | |
| KCB Group, Ltd. | | | 442,400 | | | | 154,692 | |
| | | | | | | | | |
| Kuwait | 0.3% | | | | | | | | |
| Human Soft Holding Co. KSC (*) | | | 17,550 | | | | 219,325 | |
The accompanying notes are an integral part of these financial statements.
82 Annual Report
| Description | | Shares | | | Fair
Value | |
| | | | | | | |
| Lazard Emerging Markets Equity Blend Portfolio (continued) | | | | | | | | |
| | | | | | | | | |
| Mexico | 5.6% | | | | | | | | |
| America Movil SAB de CV, Class L Sponsored ADR | | | 52,122 | | | $ | 757,854 | |
| Credito Real SAB de CV (*) | | | 164,400 | | | | 102,608 | |
| Genomma Lab Internacional SAB de CV, B Shares (*) | | | 178,300 | | | | 168,807 | |
| Grupo Cementos de Chihuahua SAB de CV | | | 34,400 | | | | 207,477 | |
| Grupo Financiero Banorte SAB de CV, Class O (*) | | | 287,164 | | | | 1,586,368 | |
| Grupo Mexico SAB de CV, Series B | | | 258,799 | | | | 1,094,006 | |
| Kimberly-Clark de Mexico SAB de CV, Series A | | | 261,700 | | | | 447,005 | |
| | | | | | | | 4,364,125 | |
| Oman | 0.2% | | | | | | | | |
| Ooredoo | | | 160,160 | | | | 163,020 | |
| | | | | | | | | |
| Pakistan | 0.2% | | | | | | | | |
| Bank Alfalah, Ltd. | | | 875,631 | | | | 194,054 | |
| | | | | | | | | |
| Poland | 0.3% | | | | | | | | |
| Eurocash SA (*) | | | 24,650 | | | | 92,666 | |
| Warsaw Stock Exchange | | | 11,461 | | | | 140,176 | |
| | | | | | | | 232,842 | |
| Russia | 5.6% | | | | | | | | |
| Detsky Mir PJSC | | | 134,590 | | | | 246,952 | |
| LSR Group PJSC GDR | | | 61,038 | | | | 139,060 | |
| LUKOIL PJSC Sponsored ADR | | | 11,831 | | | | 808,767 | |
| Mobile TeleSystems PJSC Sponsored ADR | | | 71,104 | | | | 636,381 | |
| Sberbank of Russia PJSC (‡) | | | 267,371 | | | | 979,904 | |
| Sberbank of Russia PJSC Sponsored ADR (United States) | | | 77,865 | | | | 1,129,043 | |
| Yandex NV Class A (*) | | | 6,621 | | | | 460,689 | |
| | | | | | | | 4,400,796 | |
| South Africa | 0.8% | | | | | | | | |
| Standard Bank Group, Ltd. | | | 68,252 | | | | 591,754 | |
| | | | | | | | | |
| South Korea | 20.4% | | | | | | | | |
| AfreecaTV Co., Ltd. | | | 3,358 | | | | 187,292 | |
| BGF retail Co., Ltd. | | | 1,718 | | | | 214,538 | |
| HS Industries Co., Ltd. | | | 38,450 | | | | 253,011 | |
| Hyundai Mobis Co., Ltd. | | | 3,491 | | | | 823,531 | |
The accompanying notes are an integral part of these financial statements.
Annual Report 83
| Description | | Shares | | | Fair
Value | |
| | | | | | | |
| Lazard Emerging Markets Equity Blend Portfolio (continued) | | | | | | | | |
| | | | | | | | | |
| KT&G Corp. | | | 4,680 | | | $ | 358,454 | |
| MegaStudyEdu Co., Ltd. | | | 7,929 | | | | 284,120 | |
| NCSoft Corp. | | | 2,479 | | | | 2,128,151 | |
| Nice Information & Telecommunication, Inc. | | | 8,438 | | | | 221,079 | |
| NICE Information Service Co., Ltd. | | | 9,003 | | | | 206,005 | |
| Ray Co., Ltd. (*) | | | 4,534 | | | | 222,848 | |
| Samjin Pharmaceutical Co., Ltd. | | | 4,746 | | | | 119,155 | |
| Samsung Electronics Co., Ltd. | | | 79,539 | | | | 5,944,541 | |
| SFA Engineering Corp. | | | 4,954 | | | | 176,521 | |
| Shinhan Financial Group Co., Ltd. | | | 21,590 | | | | 638,672 | |
| SK Hynix, Inc. | | | 31,917 | | | | 3,491,641 | |
| Tokai Carbon Korea Co., Ltd. | | | 1,424 | | | | 164,672 | |
| WONIK IPS Co., Ltd. (*) | | | 5,393 | | | | 220,457 | |
| Zinus, Inc. | | | 3,441 | | | | 326,278 | |
| | | | | | | | 15,980,966 | |
| Taiwan | 9.0% | | | | | | | | |
| Airtac International Group | | | 32,000 | | | | 1,025,420 | |
| Bizlink Holding, Inc. | | | 21,000 | | | | 182,656 | |
| Hon Hai Precision Industry Co., Ltd. | | | 166,136 | | | | 542,492 | |
| Largan Precision Co., Ltd. | | | 4,614 | | | | 522,734 | |
| Lotes Co., Ltd. | | | 9,000 | | | | 152,088 | |
| Lotus Pharmaceutical Co., Ltd. (*) | | | 67,000 | | | | 191,250 | |
| MediaTek, Inc. | | | 18,000 | | | | 480,705 | |
| Powertech Technology, Inc. | | | 53,000 | | | | 179,544 | |
| Poya International Co., Ltd. | | | 8,000 | | | | 163,741 | |
| Sercomm Corp. | | | 70,000 | | | | 194,095 | |
| Silicon Motion Technology Corp. ADR | | | 17,867 | | | | 860,296 | |
| Simplo Technology Co., Ltd. | | | 16,000 | | | | 199,264 | |
| Sitronix Technology Corp. | | | 39,000 | | | | 226,326 | |
| Taiwan Semiconductor Manufacturing Co., Ltd. | | | 89,387 | | | | 1,678,820 | |
| Tripod Technology Corp. | | | 40,000 | | | | 168,763 | |
| TSC Auto ID Technology Co., Ltd. | | | 18,700 | | | | 130,009 | |
| Wiwynn Corp. | | | 7,000 | | | | 175,338 | |
| | | | | | | | 7,073,541 | |
The accompanying notes are an integral part of these financial statements.
84 Annual Report
| Description | | Shares | | | Fair
Value | |
| | | | | | | |
| Lazard Emerging Markets Equity Blend Portfolio (concluded) | | | | | | | | |
| | | | | | | | | |
| Thailand | 0.2% | | | | | | | | |
| PTG Energy Public Co., Ltd (‡) | | | 315,900 | | | $ | 167,651 | |
| | | | | | | | | |
| Ukraine | 0.3% | | | | | | | | |
| Kernel Holding SA | | | 15,235 | | | | 200,575 | |
| | | | | | | | | |
| United Kingdom | 1.0% | | | | | | | | |
| Unilever PLC | | | 12,901 | | | | 781,170 | |
| | | | | | | | | |
Total Common Stocks
(Cost $58,753,875) | | | | | | | 75,061,115 | |
| | | | | | | | | |
| Preferred Stocks | 1.2% | | | | | | | | |
| | | | | | | | | |
| Brazil | 1.2% | | | | | | | | |
Banco Bradesco SA ADR
(Cost $814,639) | | | 170,738 | | | | 898,082 | |
| | | | | | | | | |
| Short-Term Investments | 3.3% | | | | | | | | |
State Street Institutional Treasury Money Market Fund, Premier Class, 0.01% (7 day yield)
(Cost $2,612,365) | | | 2,612,365 | | | | 2,612,365 | |
| | | | | | | | | |
Total Investments | 100.2%
(Cost $62,180,879) | | | | | | $ | 78,571,562 | |
| | | | | | | | | |
| Liabilities in Excess of Cash and Other Assets | (0.2)% | | | | | | | (146,687 | ) |
| | | | | | | | | |
| Net Assets | 100.0% | | | | | | $ | 78,424,875 | |
The accompanying notes are an integral part of these financial statements.
Annual Report 85
| Description | | Shares | | | Fair
Value | |
| | | | | | | |
| Lazard Emerging Markets Equity Portfolio | | | | | | | | |
| | | | | | | | | |
| Common Stocks | 92.9% | | | | | | | | |
| | | | | | | | | |
| Brazil | 5.3% | | | | | | | | |
| Banco do Brasil SA | | | 11,825,926 | | | $ | 89,161,797 | |
| BB Seguridade Participacoes SA | | | 9,869,700 | | | | 56,520,286 | |
| CCR SA | | | 15,723,545 | | | | 40,985,257 | |
| Engie Brasil Energia SA | | | 3,497,976 | | | | 29,670,590 | |
| Petrobras Distribuidora SA | | | 3,618,516 | | | | 15,482,949 | |
| | | | | | | | 231,820,879 | |
| China | 18.1% | | | | | | | | |
| AAC Technologies Holdings, Inc. | | | 5,344,665 | | | | 30,075,534 | |
| Anhui Conch Cement Co., Ltd., Class H | | | 9,497,451 | | | | 59,499,068 | |
| Baidu, Inc. Sponsored ADR (*) | | | 412,852 | | | | 89,275,116 | |
| China Construction Bank Corp., Class H | | | 153,401,224 | | | | 116,738,045 | |
| China Merchants Bank Co., Ltd., Class H | | | 13,156,494 | | | | 83,554,445 | |
| China Mobile, Ltd. Sponsored ADR | | | 1,050,829 | | | | 29,990,660 | |
| China Shenhua Energy Co., Ltd., Class H | | | 31,071,110 | | | | 58,547,002 | |
| China Vanke Co., Ltd., Class H | | | 9,880,400 | | | | 34,163,416 | |
| CNOOC, Ltd. | | | 33,362,532 | | | | 30,667,321 | |
| ENN Energy Holdings, Ltd. | | | 2,253,800 | | | | 33,081,171 | |
| Hengan International Group Co., Ltd. | | | 7,813,500 | | | | 55,317,615 | |
| Ping An Insurance (Group) Co. of China, Ltd., Class H | | | 6,735,000 | | | | 82,726,254 | |
| Sinopharm Group Co., Ltd., Class H | | | 20,324,814 | | | | 49,543,541 | |
| Weichai Power Co., Ltd., Class H | | | 19,152,288 | | | | 38,526,344 | |
| | | | | | | | 791,705,532 | |
| Egypt | 0.8% | | | | | | | | |
| Commercial International Bank Egypt SAE GDR | | | 9,174,975 | | | | 34,417,818 | |
| | | | | | | | | |
| Hong Kong | 1.2% | | | | | | | | |
| ASM Pacific Technology, Ltd. | | | 3,927,700 | | | | 51,847,292 | |
| | | | | | | | | |
| Hungary | 2.6% | | | | | | | | |
| OTP Bank Nyrt. (*) | | | 2,510,433 | | | | 112,961,769 | |
The accompanying notes are an integral part of these financial statements.
86 Annual Report
| Description | | Shares | | | Fair
Value | |
| | | | | | | |
| Lazard Emerging Markets Equity Portfolio (continued) | | | | | | | | |
| | | | | | | | | |
| India | 11.1% | | | | | | | | |
| Axis Bank, Ltd. (*) | | | 7,714,690 | | | $ | 65,673,435 | |
| Bajaj Auto, Ltd. | | | 791,899 | | | | 37,361,018 | |
| Bharat Petroleum Corp., Ltd. | | | 5,511,333 | | | | 28,825,224 | |
| Coal India, Ltd. | | | 10,916,712 | | | | 20,255,175 | |
| HCL Technologies, Ltd. | | | 3,791,748 | | | | 49,209,665 | |
| Hero MotoCorp, Ltd. | | | 783,528 | | | | 33,394,691 | |
| Indus Towers, Ltd. | | | 10,577,398 | | | | 33,380,062 | |
| Infosys, Ltd. Sponsored ADR | | | 3,892,784 | | | | 65,982,689 | |
| Oil and Natural Gas Corp., Ltd. | | | 30,019,654 | | | | 38,292,507 | |
| Power Grid Corp. of India, Ltd. | | | 12,214,856 | | | | 31,848,156 | |
| Tata Consultancy Services, Ltd. | | | 931,343 | | | | 36,549,091 | |
| UPL, Ltd. | | | 6,863,984 | | | | 43,875,919 | |
| | | | | | | | 484,647,632 | |
| Indonesia | 4.1% | | | | | | | | |
| PT Astra International Tbk | | | 93,241,900 | | | | 40,047,572 | |
| PT Bank Mandiri (Persero) Tbk | | | 175,731,842 | | | | 79,302,520 | |
| PT Telkom Indonesia (Persero) Tbk Sponsored ADR | | | 2,632,637 | | | | 61,919,622 | |
| | | | | | | | 181,269,714 | |
| Luxembourg | 0.9% | | | | | | | | |
| Ternium SA Sponsored ADR (*) | | | 1,310,917 | | | | 38,121,466 | |
| | | | | | | | | |
| Mexico | 5.5% | | | | | | | | |
| America Movil SAB de CV, Class L Sponsored ADR | | | 6,125,627 | | | | 89,066,617 | |
| Grupo Financiero Banorte SAB de CV, Class O (*) | | | 7,248,616 | | | | 40,043,235 | |
| Grupo Mexico SAB de CV, Series B | | | 19,239,942 | | | | 81,331,889 | |
| Kimberly-Clark de Mexico SAB de CV, Series A | | | 16,581,795 | | | | 28,323,084 | |
| | | | | | | | 238,764,825 | |
| Portugal | 0.8% | | | | | | | | |
| Galp Energia SGPS SA | | | 3,388,958 | | | | 36,252,041 | |
| | | | | | | | | |
| Russia | 8.2% | | | | | | | | |
| ALROSA PAO (*), (‡) | | | 43,645,460 | | | | 58,303,133 | |
| LUKOIL PJSC Sponsored ADR | | | 1,140,470 | | | | 77,762,864 | |
| Magnit PJSC Sponsored GDR | | | 1,934,618 | | | | 34,078,592 | |
| Mobile TeleSystems PJSC Sponsored ADR | | | 6,158,690 | | | | 55,120,275 | |
The accompanying notes are an integral part of these financial statements.
Annual Report 87
| Description | | Shares | | | Fair
Value | |
| |
| Lazard Emerging Markets Equity Portfolio (continued) | | | |
| |
| Novolipetskiy Metallurgicheskiy Kombinat PAO | | | 495,153 | | | $ | 13,743,662 | |
| Sberbank of Russia PJSC (‡) | | | 32,982,390 | | | | 120,879,107 | |
| | | | | | | | 359,887,633 | |
| South Africa | 6.4% | | | | | | | | |
| Life Healthcare Group Holdings, Ltd. (*) | | | 26,892,290 | | | | 30,819,918 | |
| Mondi PLC | | | 1,243,663 | | | | 29,352,730 | |
| Nedbank Group, Ltd. | | | 4,632,808 | | | | 40,862,826 | |
| Sanlam, Ltd. | | | 8,568,917 | | | | 34,292,159 | |
| Shoprite Holdings, Ltd. | | | 3,863,438 | | | | 36,596,446 | |
| Standard Bank Group, Ltd. | | | 4,267,216 | | | | 36,997,332 | |
| The Bidvest Group, Ltd. | | | 4,004,382 | | | | 43,026,220 | |
| Vodacom Group, Ltd. | | | 3,557,787 | | | | 30,008,053 | |
| | | | | | | | 281,955,684 | |
| South Korea | 16.2% | | | | | | | | |
| Coway Co., Ltd. (*) | | | 719,169 | | | | 48,136,756 | |
| Hyundai Mobis Co., Ltd. | | | 265,403 | | | | 62,608,917 | |
| KB Financial Group, Inc. | | | 1,768,515 | | | | 70,239,144 | |
| KT&G Corp. | | | 406,378 | | | | 31,125,580 | |
| Samsung Electronics Co., Ltd. | | | 3,251,967 | | | | 243,043,661 | |
| Shinhan Financial Group Co., Ltd. | | | 2,171,397 | | | | 64,233,894 | |
| SK Hynix, Inc. | | | 1,713,529 | | | | 187,455,868 | |
| | | | | | | | 706,843,820 | |
| Taiwan | 6.9% | | | | | | | | |
| Catcher Technology Co., Ltd. | | | 4,282,000 | | | | 31,494,621 | |
| Globalwafers Co., Ltd. | | | 2,694,000 | | | | 68,174,835 | |
| Hon Hai Precision Industry Co., Ltd. | | | 19,424,425 | | | | 63,427,516 | |
| Novatek Microelectronics Corp. | | | 4,995,000 | | | | 65,336,886 | |
| Taiwan Semiconductor Manufacturing Co., Ltd. | | | 3,974,913 | | | | 74,654,754 | |
| | | | | | | | 303,088,612 | |
| Thailand | 1.7% | | | | | | | | |
| Kasikornbank Public Co. Ltd. | | | 11,153,054 | | | | 42,574,416 | |
| The Siam Cement Public Co., Ltd. (‡) | | | 2,473,800 | | | | 31,211,495 | |
| | | | | | | | 73,785,911 | |
The accompanying notes are an integral part of these financial statements.
88 Annual Report
| Description | | Shares | | | Fair
Value | |
| | | | | | | |
| Lazard Emerging Markets Equity Portfolio (concluded) | | | | | | | | |
| | | | | | | | | |
| United Kingdom | 3.1% | | | | | | | | |
| Anglo American PLC | | | 1,450,522 | | | $ | 48,312,978 | |
| Unilever PLC | | | 1,415,742 | | | | 85,724,716 | |
| | | | | | | | 134,037,694 | |
Total Common Stocks
(Cost $3,247,084,404) | | | | | | | 4,061,408,322 | |
| | | | | | | | | |
| Exchange-Traded Funds | 5.0% | | | | | | | | |
| iShares Core MSCI Emerging Markets ETF | | | 1,750,278 | | | | 108,587,247 | |
| Vanguard FTSE Emerging Markets ETF | | | 2,152,350 | | | | 107,854,259 | |
| | | | | | | | | |
Total Exchange-Traded Funds
(Cost $176,623,829) | | | | | | | 216,441,506 | |
| | | | | | | | | |
| Short-Term Investments | 1.8% | | | | | | | | |
State Street Institutional Treasury Money Market Fund, Premier Class, 0.01% (7 day yield)
(Cost $78,259,363) | | | 78,259,363 | | | | 78,259,363 | |
| | | | | | | | | |
Total Investments | 99.7%
(Cost $3,501,967,596) | | | | | | $ | 4,356,109,191 | |
| | | | | | | | | |
| Cash and Other Assets in Excess of Liabilities | 0.3% | | | | | | | 13,389,074 | |
| | | | | | | | | |
| Net Assets | 100.0% | | | | | | $ | 4,369,498,265 | |
The accompanying notes are an integral part of these financial statements.
Annual Report 89
| Description | | Shares | | | Fair
Value | |
| | | | | | | |
| Lazard Equity Franchise Portfolio | | | | | | | | |
| | | | | | | | | |
| Common Stocks | 93.9% | | | | | | | | |
| | | | | | | | | |
| Belgium | 1.9% | | | | | | | | |
| Anheuser-Busch InBev SA/NV | | | 24,895 | | | $ | 1,739,725 | |
| | | | | | | | | |
| France | 7.1% | | | | | | | | |
| Bureau Veritas SA (*) | | | 134,131 | | | | 3,567,755 | |
| EssilorLuxottica SA | | | 18,923 | | | | 2,951,157 | |
| | | | | | | | 6,518,912 | |
| Germany | 3.9% | | | | | | | | |
| Fresenius Medical Care AG & Co. KGaA | | | 43,448 | | | | 3,623,951 | |
| | | | | | | | | |
| Italy | 4.8% | | | | | | | | |
| Atlantia SpA (*) | | | 100,008 | | | | 1,795,465 | |
| Snam SpA | | | 458,172 | | | | 2,572,908 | |
| | | | | | | | 4,368,373 | |
| Luxembourg | 3.9% | | | | | | | | |
| SES SA | | | 380,969 | | | | 3,603,607 | |
| | | | | | | | | |
| Spain | 3.0% | | | | | | | | |
| Ferrovial SA | | | 100,069 | | | | 2,765,141 | |
| | | | | | | | | |
| United Kingdom | 4.5% | | | | | | | | |
| National Grid PLC | | | 199,535 | | | | 2,376,578 | |
| United Utilities Group PLC | | | 138,900 | | | | 1,708,427 | |
| | | | | | | | 4,085,005 | |
| United States | 64.8% | | | | | | | | |
| Cisco Systems, Inc. | | | 107,687 | | | | 4,818,993 | |
| Cognizant Technology Solutions Corp., Class A | | | 33,408 | | | | 2,737,786 | |
| CVS Health Corp. | | | 77,946 | | | | 5,323,712 | |
| H&R Block, Inc. | | | 340,594 | | | | 5,401,821 | |
| Henry Schein, Inc. (*) | | | 24,521 | | | | 1,639,474 | |
| Intel Corp. | | | 92,804 | | | | 4,623,495 | |
| International Game Technology PLC | | | 225,552 | | | | 3,820,851 | |
| McKesson Corp. | | | 25,421 | | | | 4,421,220 | |
| MEDNAX, Inc. (*) | | | 136,236 | | | | 3,343,231 | |
The accompanying notes are an integral part of these financial statements.
90 Annual Report
| Description | | Shares | | | Fair
Value | |
| | | | | | | |
| Lazard Equity Franchise Portfolio (concluded) | | | | | | | | |
| | | | | | | | | |
| Medtronic PLC | | | 20,959 | | | $ | 2,455,137 | |
| Nielsen Holdings PLC | | | 277,699 | | | | 5,795,578 | |
| Omnicom Group, Inc. | | | 79,810 | | | | 4,977,750 | |
| Oracle Corp. | | | 46,453 | | | | 3,005,045 | |
| Stericycle, Inc. (*) | | | 39,077 | | | | 2,709,208 | |
| Tapestry, Inc. | | | 142,961 | | | | 4,443,228 | |
| | | | | | | | 59,516,529 | |
Total Common Stocks
(Cost $72,919,376) | | | | | | | 86,221,243 | |
| | | | | | | | | |
| Short-Term Investments | 6.1% | | | | | | | | |
State Street Institutional Treasury Money Market Fund, Premier Class, 0.01% (7 day yield)
(Cost $5,598,898) | | | 5,598,898 | | | | 5,598,898 | |
| | | | | | | | | |
Total Investments | 100.0%
(Cost $78,518,274) | | | | | | $ | 91,820,141 | |
| | | | | | | | | |
| Cash and Other Assets in Excess of Liabilities | 0.0% | | | | | | | 29,304 | |
| | | | | | | | | |
| Net Assets | 100.0% | | | | | | $ | 91,849,445 | |
The accompanying notes are an integral part of these financial statements.
Annual Report 91
| Description | | Shares | | | Fair
Value | |
| | | | | | | | | |
| Lazard Global Equity Select Portfolio | | | | | | | | |
| | | | | | | | | |
| Common Stocks | 98.0% | | | | | | | | |
| | | | | | | | | |
| Canada | 5.1% | | | | | | | | |
| CAE, Inc. | | | 55,295 | | | $ | 1,532,135 | |
| Canadian National Railway Co. | | | 9,031 | | | | 992,849 | |
| Dollarama, Inc. | | | 26,029 | | | | 1,060,872 | |
| National Bank of Canada | | | 21,427 | | | | 1,205,932 | |
| | | | | | | | 4,791,788 | |
| China | 4.4% | | | | | | | | |
| Alibaba Group Holding, Ltd. Sponsored ADR (*) | | | 8,589 | | | | 1,998,918 | |
| Tencent Holdings, Ltd. | | | 29,423 | | | | 2,149,857 | |
| | | | | | | | 4,148,775 | |
| Denmark | 1.1% | | | | | | | | |
| Vestas Wind Systems A/S | | | 4,464 | | | | 1,056,512 | |
| | | | | | | | | |
| France | 2.3% | | | | | | | | |
| LVMH Moet Hennessy Louis Vuitton SE | | | 1,819 | | | | 1,136,567 | |
| Pernod Ricard SA | | | 5,309 | | | | 1,017,673 | |
| | | | | | | | 2,154,240 | |
| Germany | 2.9% | | | | | | | | |
| Merck KGaA | | | 5,086 | | | | 871,809 | |
| Symrise AG | | | 7,052 | | | | 932,717 | |
| Teamviewer AG (*) | | | 17,543 | | | | 939,521 | |
| | | | | | | | 2,744,047 | |
| Hong Kong | 4.6% | | | | | | | | |
| AIA Group, Ltd. | | | 137,783 | | | | 1,697,165 | |
| China Gas Holdings, Ltd. | | | 388,800 | | | | 1,550,230 | |
| Sands China, Ltd. | | | 245,600 | | | | 1,079,563 | |
| | | | | | | | 4,326,958 | |
| Japan | 3.6% | | | | | | | | |
| Kansai Paint Co., Ltd. | | | 29,467 | | | | 907,948 | |
| Nintendo Co., Ltd. | | | 2,300 | | | | 1,467,835 | |
| Shimano, Inc. | | | 4,200 | | | | 980,858 | |
| | | | | | | | 3,356,641 | |
The accompanying notes are an integral part of these financial statements.
92 Annual Report
| Description | | Shares | | | Fair
Value | |
| | | | | | | |
| Lazard Global Equity Select Portfolio (continued) | | | | | | | | |
| | | | | | | | | |
| Netherlands | 3.8% | | | | | | | | |
| NXP Semiconductors NV | | | 7,232 | | | $ | 1,149,960 | |
| Wolters Kluwer NV | | | 28,174 | | | | 2,377,971 | |
| | | | | | | | 3,527,931 | |
| South Korea | 1.4% | | | | | | | | |
| LG Household & Health Care, Ltd. | | | 853 | | | | 1,272,125 | |
| | | | | | | | | |
| Spain | 1.0% | | | | | | | | |
| Industria de Diseno Textil SA | | | 28,054 | | | | 893,293 | |
| | | | | | | | | |
| Sweden | 4.0% | | | | | | | | |
| Assa Abloy AB, Class B | | | 26,111 | | | | 642,237 | |
| Epiroc AB, Class A | | | 88,115 | | | | 1,601,725 | |
| Hexagon AB, B Shares | | | 15,903 | | | | 1,448,183 | |
| | | | | | | | 3,692,145 | |
| Switzerland | 2.6% | | | | | | | | |
| ABB, Ltd. | | | 43,011 | | | | 1,203,075 | |
| Partners Group Holding AG | | | 1,040 | | | | 1,214,816 | |
| | | | | | | | 2,417,891 | |
| Taiwan | 2.2% | | | | | | | | |
| Taiwan Semiconductor Manufacturing Co., Ltd. Sponsored ADR | | | 19,040 | | | | 2,076,122 | |
| | | | | | | | | |
| United Kingdom | 10.6% | | | | | | | | |
| Coca-Cola European Partners PLC | | | 20,650 | | | | 1,028,990 | |
| Diageo PLC | | | 42,620 | | | | 1,684,389 | |
| Prudential PLC | | | 54,984 | | | | 1,014,908 | |
| RELX PLC | | | 62,719 | | | | 1,541,859 | |
| Rio Tinto PLC | | | 12,400 | | | | 927,817 | |
| Tesco PLC | | | 509,360 | | | | 1,608,129 | |
| Unilever PLC | | | 35,774 | | | | 2,153,501 | |
| | | | | | | | 9,959,593 | |
The accompanying notes are an integral part of these financial statements.
Annual Report 93
| Description | | Shares | | | Fair
Value | |
| | | | | | | | | |
| Lazard Global Equity Select Portfolio (continued) | | | | | | | | |
| | | | | | | | | |
| United States | 48.4% | | | | | | | | |
| Accenture PLC, Class A | | | 8,187 | | | $ | 2,138,526 | |
| Alphabet, Inc., Class A (*) | | | 1,539 | | | | 2,697,313 | |
| AmerisourceBergen Corp. | | | 12,410 | | | | 1,213,202 | |
| Aon PLC, Class A | | | 10,318 | | | | 2,179,884 | |
| Boston Scientific Corp. (*) | | | 28,265 | | | | 1,016,127 | |
| Dollar General Corp. | | | 7,918 | | | | 1,665,155 | |
| Honeywell International, Inc. | | | 4,129 | | | | 878,238 | |
| Intercontinental Exchange, Inc. | | | 16,568 | | | | 1,910,125 | |
| IQVIA Holdings, Inc. (*) | | | 13,067 | | | | 2,341,214 | |
| Johnson & Johnson | | | 12,532 | | | | 1,972,286 | |
| Kimberly-Clark Corp. | | | 7,630 | | | | 1,028,753 | |
| Lowe’s Cos., Inc. | | | 8,638 | | | | 1,386,485 | |
| McDonald’s Corp. | | | 6,622 | | | | 1,420,949 | |
| Microsoft Corp. | | | 13,239 | | | | 2,944,618 | |
| Motorola Solutions, Inc. | | | 8,979 | | | | 1,526,969 | |
| Palo Alto Networks, Inc. (*) | | | 2,932 | | | | 1,042,003 | |
| PTC, Inc. (*) | | | 11,299 | | | | 1,351,473 | |
| Rockwell Automation, Inc. | | | 4,402 | | | | 1,104,066 | |
| S&P Global, Inc. | | | 4,389 | | | | 1,442,796 | |
| Texas Instruments, Inc. | | | 9,364 | | | | 1,536,913 | |
| The Charles Schwab Corp. | | | 21,912 | | | | 1,162,212 | |
| The Coca-Cola Co. | | | 36,728 | | | | 2,014,164 | |
| The Procter & Gamble Co. | | | 10,789 | | | | 1,501,181 | |
| Thermo Fisher Scientific, Inc. | | | 6,461 | | | | 3,009,405 | |
| Visa, Inc., Class A | | | 8,813 | | | | 1,927,668 | |
| Warner Music Group Corp., Class A | | | 17,313 | | | | 657,721 | |
| Zoetis, Inc. | | | 13,103 | | | | 2,168,547 | |
| | | | | | | | 45,237,993 | |
Total Common Stocks
(Cost $65,481,651) | | | | | | | 91,656,054 | |
The accompanying notes are an integral part of these financial statements.
94 Annual Report
| Description | | Shares | | | Fair
Value | |
| | | | | | | | | |
| Lazard Global Equity Select Portfolio (concluded) | | | | | | | | |
| | | | | | | | | |
| Short-Term Investments | 2.0% | | | | | | | | |
State Street Institutional Treasury Money Market Fund, Premier Class, 0.01% (7 day yield)
(Cost $1,891,314) | | | 1,891,314 | | | $ | 1,891,314 | |
| | | | | | | | | |
Total Investments | 100.0%
(Cost $67,372,965) | | | | | | $ | 93,547,368 | |
| | | | | | | | | |
| Cash and Other Assets in Excess of Liabilities | 0.0% | | | | | | | 28,461 | |
| | | | | | | | | |
| Net Assets | 100.0% | | | | | | $ | 93,575,829 | |
The accompanying notes are an integral part of these financial statements.
Annual Report 95
| Description | | Shares | | | Fair
Value | |
| | | | | | | |
| Lazard Global Listed Infrastructure Portfolio | | | | | | | | |
| | | | | | | | | |
| Common Stocks | 85.2% | | | | | | | | |
| | | | | | | | | |
| Australia | 8.0% | | | | | | | | |
| Atlas Arteria, Ltd. (^) | | | 48,907,421 | | | $ | 245,363,263 | |
| Spark Infrastructure Group | | | 83,493,195 | | | | 135,927,924 | |
| Transurban Group | | | 21,680,116 | | | | 228,531,295 | |
| | | | | | | | 609,822,482 | |
| Canada | 0.7% | | | | | | | | |
| Atco, Ltd., Class I | | | 1,898,489 | | | | 54,423,650 | |
| | | | | | | | | |
| France | 6.4% | | | | | | | | |
| Eutelsat Communications SA | | | 11,456,887 | | | | 129,664,643 | |
| Vinci SA | | | 3,546,463 | | | | 352,878,001 | |
| | | | | | | | 482,542,644 | |
| Hong Kong | 3.3% | | | | | | | | |
| CK Infrastructure Holdings, Ltd. | | | 11,085,000 | | | | 59,577,215 | |
| Power Assets Holdings, Ltd. | | | 34,797,965 | | | | 188,755,560 | |
| | | | | | | | 248,332,775 | |
| Italy | 21.5% | | | | | | | | |
| ASTM SpA (*) | | | 3,990,113 | | | | 100,327,585 | |
| Atlantia SpA (*) | | | 21,551,848 | | | | 386,924,870 | |
| Hera SpA | | | 48,018,401 | | | | 175,747,529 | |
| Italgas SpA | | | 34,322,945 | | | | 219,025,645 | |
| Snam SpA | | | 66,358,224 | | | | 372,640,950 | |
| Terna Rete Elettrica Nazionale SpA | | | 50,053,401 | | | | 381,893,205 | |
| | | | | | | | 1,636,559,784 | |
| Luxembourg | 2.6% | | | | | | | | |
| SES SA (^) | | | 20,569,089 | | | | 194,564,135 | |
| | | | | | | | | |
| Portugal | 0.8% | | | | | | | | |
| Redes Energeticas Nacionais SGPS SA | | | 21,468,951 | | | | 62,151,022 | |
| | | | | | | | | |
| Spain | 8.4% | | | | | | | | |
| Ferrovial SA | | | 23,060,842 | | | | 637,225,157 | |
The accompanying notes are an integral part of these financial statements.
96 Annual Report
| Description | | Shares | | | Fair
Value | |
| | | | | | | |
| Lazard Global Listed Infrastructure Portfolio (continued) | | | | | | | | |
| | | | | | | | | |
| United Kingdom | 20.4% | | | | | | | | |
| National Grid PLC | | | 52,478,267 | | | $ | 625,046,767 | |
| Pennon Group PLC (^) | | | 21,423,608 | | | | 279,091,668 | |
| Severn Trent PLC | | | 9,720,937 | | | | 304,457,586 | |
| United Utilities Group PLC | | | 28,035,266 | | | | 344,825,096 | |
| | | | | | | | 1,553,421,117 | |
| United States | 13.1% | | | | | | | | |
| Consolidated Edison, Inc. | | | 3,220,600 | | | | 232,752,762 | |
| CSX Corp. | | | 3,970,311 | | | | 360,305,723 | |
| Norfolk Southern Corp. | | | 983,190 | | | | 233,615,776 | |
| Southwest Gas Holdings, Inc. | | | 2,761,944 | | | | 167,788,098 | |
| | | | | | | | 994,462,359 | |
| | | | | | | | | |
Total Common Stocks
(Cost $6,110,414,614) | | | | | | | 6,473,505,125 | |
| | | | | | | | | |
| Short-Term Investments | 15.0% | | | | | | | | |
State Street Institutional Treasury Money Market Fund, Premier Class, 0.01% (7 day yield)
(Cost $1,142,375,288) | | | 1,142,375,288 | | | | 1,142,375,288 | |
| | | | | | | | | |
Total Investments | 100.2%
(Cost $7,252,789,902) (») | | | | | | $ | 7,615,880,413 | |
| | | | | | | | | |
| Liabilities in Excess of Cash and Other Assets | (0.2)% | | | | | | | (18,443,408 | ) |
| | | | | | | | | |
| Net Assets | 100.0% | | | | | | $ | 7,597,437,005 | |
The accompanying notes are an integral part of these financial statements.
Annual Report 97
Lazard Global Listed Infrastructure Portfolio (concluded)
Forward Currency Contracts open at December 31, 2020:
Currency
Purchased | | Quantity | | | Currency
Sold | | Quantity | | | Counterparty | | Settlement
Date | | Unrealized
Appreciation | | Unrealized
Depreciation | |
| | | | | | | | | | | | | | | | | | | | | | | | |
| AUD | | | 87,651,361 | | | USD | | | 66,057,747 | | | BNP | | 03/25/21 | | | $ | 1,560,894 | | | $ | — | |
| EUR | | | 124,198,638 | | | USD | | | 151,934,678 | | | RBC | | 03/25/21 | | | | 66,283 | | | | — | |
| USD | | | 147,413,536 | | | AUD | | | 195,300,158 | | | BNP | | 03/25/21 | | | | — | | | | 3,250,767 | |
| USD | | | 127,030,219 | | | AUD | | | 168,234,120 | | | CIT | | 03/25/21 | | | | — | | | | 2,753,989 | |
| USD | | | 132,062,970 | | | AUD | | | 174,975,780 | | | HSB | | 03/25/21 | | | | — | | | | 2,922,092 | |
| USD | | | 125,821,938 | | | AUD | | | 166,616,264 | | | SCB | | 03/25/21 | | | | — | | | | 2,714,176 | |
| USD | | | 138,684,728 | | | AUD | | | 183,700,548 | | | SSB | | 03/25/21 | | | | — | | | | 3,031,055 | |
| USD | | | 6,226,061 | | | CAD | | | 7,936,858 | | | BNP | | 03/25/21 | | | | — | | | | 10,563 | |
| USD | | | 16,103,822 | | | CAD | | | 20,528,991 | | | HSB | | 03/25/21 | | | | — | | | | 27,447 | |
| USD | | | 13,014,984 | | | CAD | | | 16,590,656 | | | RBC | | 03/25/21 | | | | — | | | | 21,620 | |
| USD | | | 19,833,940 | | | CAD | | | 25,288,670 | | | SCB | | 03/25/21 | | | | — | | | | 37,390 | |
| USD | | | 378,873,911 | | | EUR | | | 311,045,214 | | | BNP | | 03/25/21 | | | | — | | | | 1,799,922 | |
| USD | | | 492,460,852 | | | EUR | | | 404,418,865 | | | CAN | | 03/25/21 | | | | — | | | | 2,488,667 | |
| USD | | | 436,244,933 | | | EUR | | | 357,965,120 | | | CIT | | 03/25/21 | | | | — | | | | 1,852,000 | |
| USD | | | 423,624,193 | | | EUR | | | 347,834,528 | | | HSB | | 03/25/21 | | | | — | | | | 2,074,376 | |
| USD | | | 417,989,025 | | | EUR | | | 343,204,717 | | | MEL | | 03/25/21 | | | | — | | | | 2,043,334 | |
| USD | | | 465,748,573 | | | EUR | | | 382,428,808 | | | RBC | | 03/25/21 | | | | — | | | | 2,288,335 | |
| USD | | | 515,288,075 | | | EUR | | | 423,050,397 | | | SSB | | 03/25/21 | | | | — | | | | 2,463,713 | |
| USD | | | 407,326,193 | | | GBP | | | 302,563,560 | | | CAN | | 03/25/21 | | | | — | | | | 6,634,322 | |
| USD | | | 384,008,616 | | | GBP | | | 285,808,948 | | | HSB | | 03/25/21 | | | | — | | | | 7,028,624 | |
| USD | | | 367,916,872 | | | GBP | | | 273,732,397 | | | RBC | | 03/25/21 | | | | — | | | | 6,597,508 | |
| USD | | | 460,980,105 | | | GBP | | | 342,556,582 | | | SSB | | 03/25/21 | | | | — | | | | 7,697,944 | |
| USD | | | 77,270,299 | | | HKD | | | 599,014,809 | | | BNP | | 03/25/21 | | | | — | | | | 10,044 | |
| USD | | | 19,123,532 | | | HKD | | | 148,244,089 | | | HSB | | 03/25/21 | | | | — | | | | 1,795 | |
| USD | | | 68,671,063 | | | HKD | | | 532,336,017 | | | HSB | | 03/25/21 | | | | — | | | | 6,889 | |
| USD | | | 78,428,692 | | | HKD | | | 608,002,748 | | | SSB | | 03/25/21 | | | | — | | | | 11,207 | |
| Total gross unrealized appreciation/depreciation on Forward Currency Contracts | | | | | $ | 1,627,177 | | | $ | 57,767,779 | |
The accompanying notes are an integral part of these financial statements.
98 Annual Report
| Description | | Shares | | | Fair
Value | |
| | | | | | | |
| Lazard Global Strategic Equity Portfolio | | | | | | | | |
| | | | | | | | | |
| Common Stocks | 97.3% | | | | | | | | |
| | | | | | | | | |
| Brazil | 1.0% | | | | | | | | |
| Lojas Renner SA | | | 5,151 | | | $ | 43,433 | |
| | | | | | | | | |
| Canada | 3.7% | | | | | | | | |
| CAE, Inc. | | | 2,126 | | | | 58,908 | |
| TMX Group, Ltd. | | | 426 | | | | 42,550 | |
| Toromont Industries, Ltd. | | | 803 | | | | 56,271 | |
| | | | | | | | 157,729 | |
| China | 3.5% | | | | | | | | |
| Alibaba Group Holding, Ltd. Sponsored ADR (*) | | | 358 | | | | 83,317 | |
| Tencent Holdings, Ltd. | | | 900 | | | | 65,761 | |
| | | | | | | | 149,078 | |
| Denmark | 1.9% | | | | | | | | |
| Genmab A/S (*) | | | 198 | | | | 80,087 | |
| | | | | | | | | |
| France | 2.8% | | | | | | | | |
| Safran SA (*) | | | 315 | | | | 44,673 | |
| Vivendi SA | | | 2,368 | | | | 76,365 | |
| | | | | | | | 121,038 | |
| Germany | 2.9% | | | | | | | | |
| Infineon Technologies AG | | | 1,453 | | | | 55,761 | |
| Merck KGaA | | | 389 | | | | 66,680 | |
| | | | | | | | 122,441 | |
| Greece | 0.9% | | | | | | | | |
| Public Power Corp. SA (*) | | | 4,448 | | | | 40,726 | |
| | | | | | | | | |
| Hong Kong | 1.7% | | | | | | | | |
| AIA Group, Ltd. | | | 5,800 | | | | 71,443 | |
| | | | | | | | | |
| India | 1.4% | | | | | | | | |
| HDFC Bank, Ltd. ADR (*) | | | 808 | | | | 58,386 | |
| | | | | | | | | |
| Israel | 1.3% | | | | | | | | |
| CyberArk Software, Ltd. (*) | | | 344 | | | | 55,587 | |
The accompanying notes are an integral part of these financial statements.
Annual Report 99
| Description | | Shares | | | Fair
Value | |
| | | | | | | |
| Lazard Global Strategic Equity Portfolio (continued) | | | | | | | | |
| | | | | | | | | |
| Italy | 1.4% | | | | | | | | |
| Enel SpA | | | 5,869 | | | $ | 59,267 | |
| | | | | | | | | |
| Japan | 4.2% | | | | | | | | |
| Digital Garage, Inc. | | | 900 | | | | 37,191 | |
| Nintendo Co., Ltd. | | | 100 | | | | 63,819 | |
| TechnoPro Holdings, Inc. | | | 500 | | | | 41,503 | |
| Z Holdings Corp. | | | 6,200 | | | | 37,604 | |
| | | | | | | | 180,117 | |
| Netherlands | 1.5% | | | | | | | | |
| Koninklijke DSM NV | | | 367 | | | | 63,222 | |
| | | | | | | | | |
| Portugal | 1.2% | | | | | | | | |
| Energias de Portugal SA | | | 8,168 | | | | 51,470 | |
| | | | | | | | | |
| South Korea | 1.3% | | | | | | | | |
| SK Hynix, Inc. | | | 493 | | | | 53,933 | |
| | | | | | | | | |
| Spain | 2.4% | | | | | | | | |
| Siemens Gamesa Renewable Energy SA | | | 2,493 | | | | 101,206 | |
| | | | | | | | | |
| Sweden | 1.3% | | | | | | | | |
| Nordnet AB publ (*) | | | 3,500 | | | | 54,919 | |
| | | | | | | | | |
| Switzerland | 3.4% | | | | | | | | |
| ABB, Ltd. | | | 1,959 | | | | 54,796 | |
| Idorsia, Ltd. (*) | | | 816 | | | | 23,508 | |
| Partners Group Holding AG | | | 56 | | | | 65,413 | |
| | | | | | | | 143,717 | |
| United Kingdom | 13.0% | | | | | | | | |
| Clarivate PLC (*) | | | 1,860 | | | | 55,261 | |
| Coca-Cola European Partners PLC | | | 878 | | | | 42,393 | |
| Dechra Pharmaceuticals PLC | | | 945 | | | | 44,605 | |
| Informa PLC (*) | | | 6,536 | | | | 49,115 | |
| ITV PLC (*) | | | 46,268 | | | | 67,636 | |
| Linde PLC | | | 200 | | | | 51,941 | |
The accompanying notes are an integral part of these financial statements.
100 Annual Report
| Description | | Shares | | | Fair
Value | |
| | | | | | | |
| Lazard Global Strategic Equity Portfolio (continued) | | | | | | | | |
| | | | | | | | | |
| RELX PLC | | | 4,319 | | | $ | 106,176 | |
| Rio Tinto PLC | | | 491 | | | | 36,738 | |
| Tesco PLC | | | 12,718 | | | | 40,153 | |
| THG Holdings PLC (*) | | | 5,530 | | | | 59,049 | |
| | | | | | | | 553,067 | |
| United States | 46.5% | | | | | | | | |
| Accenture PLC, Class A | | | 234 | | | | 61,123 | |
| Adobe, Inc. (*) | | | 129 | | | | 64,515 | |
| Alphabet, Inc., Class A (*) | | | 83 | | | | 145,469 | |
| American Express Co. | | | 609 | | | | 73,634 | |
| Analog Devices, Inc. | | | 364 | | | | 53,774 | |
| Aon PLC, Class A | | | 399 | | | | 84,297 | |
| Applied Materials, Inc. | | | 609 | | | | 52,557 | |
| Bank of America Corp. | | | 1,770 | | | | 53,649 | |
| Danaher Corp. | | | 358 | | | | 79,526 | |
| Dollar General Corp. | | | 219 | | | | 46,056 | |
| Dollar Tree, Inc. (*) | | | 802 | | | | 86,648 | |
| Electronic Arts, Inc. | | | 662 | | | | 95,063 | |
| Fidelity National Information Services, Inc. | | | 310 | | | | 43,853 | |
| Intercontinental Exchange, Inc. | | | 1,068 | | | | 123,130 | |
| IQVIA Holdings, Inc. (*) | | | 555 | | | | 99,439 | |
| Medtronic PLC | | | 558 | | | | 65,364 | |
| Microsoft Corp. | | | 843 | | | | 187,500 | |
| Palo Alto Networks, Inc. (*) | | | 226 | | | | 80,318 | |
| S&P Global, Inc. | | | 297 | | | | 97,633 | |
| Starbucks Corp. | | | 532 | | | | 56,913 | |
| Synopsys, Inc. (*) | | | 222 | | | | 57,551 | |
| The Coca-Cola Co. | | | 1,032 | | | | 56,595 | |
| Thermo Fisher Scientific, Inc. | | | 193 | | | | 89,896 | |
| UnitedHealth Group, Inc. | | | 178 | | | | 62,421 | |
| Visa, Inc., Class A | | | 302 | | | | 66,056 | |
| | | | | | | | 1,982,980 | |
Total Common Stocks
(Cost $2,880,805) | | | | | | | 4,143,846 | |
The accompanying notes are an integral part of these financial statements.
Annual Report 101
| Description | | Shares | | | Fair
Value | |
| | | | | | | |
| Lazard Global Strategic Equity Portfolio (concluded) | | | | | | | | |
| | | | | | | | | |
| Preferred Stocks | 1.3% | | | | | | | | |
| | | | | | | | | |
| Germany | 1.3% | | | | | | | | |
Volkswagen AG
(Cost $49,606) | | | 296 | | | $ | 55,148 | |
| | | | | | | | | |
| Short-Term Investments | 1.9% | | | | | | | | |
State Street Institutional Treasury Money Market Fund, Premier Class, 0.01% (7 day yield)
(Cost $80,664) | | | 80,664 | | | | 80,664 | |
| | | | | | | | | |
Total Investments | 100.5%
(Cost $3,011,075) | | | | | | $ | 4,279,658 | |
| | | | | | | | | |
| Liabilities in Excess of Cash and Other Assets | (0.5)% | | | | | | | (19,350 | ) |
| | | | | | | | | |
| Net Assets | 100.0% | | | | | | $ | 4,260,308 | |
The accompanying notes are an integral part of these financial statements.
102 Annual Report
| Description | | Shares | | | Fair
Value | |
| | | | | | | |
| Lazard International Equity Advantage Portfolio | | | | | | | | |
| | | | | | | | | |
| Common Stocks | 100.4% | | | | | | | | |
| | | | | | | | | |
| Australia | 7.4% | | | | | | | | |
| AGL Energy, Ltd. | | | 656 | | | $ | 6,049 | |
| Aristocrat Leisure, Ltd. | | | 199 | | | | 4,762 | |
| BHP Group, Ltd. | | | 370 | | | | 12,054 | |
| Breville Group, Ltd. | | | 231 | | | | 4,575 | |
| Charter Hall Group REIT | | | 642 | | | | 7,287 | |
| CSL, Ltd. | | | 45 | | | | 9,833 | |
| Data#3, Ltd. | | | 650 | | | | 2,809 | |
| Fortescue Metals Group, Ltd. | | | 3,971 | | | | 71,797 | |
| Goodman Group REIT | | | 427 | | | | 6,229 | |
| IGO, Ltd. | | | 642 | | | | 3,161 | |
| Inghams Group, Ltd. | | | 1,245 | | | | 2,996 | |
| Netwealth Group, Ltd. | | | 465 | | | | 5,757 | |
| REA Group, Ltd. | | | 36 | | | | 4,135 | |
| Regis Resources, Ltd. | | | 2,955 | | | | 8,451 | |
| Santos, Ltd. | | | 5,737 | | | | 27,745 | |
| Stockland REIT | | | 4,642 | | | | 14,974 | |
| | | | | | | | 192,614 | |
| Austria | 0.2% | | | | | | | | |
| OMV AG | | | 52 | | | | 2,100 | |
| Raiffeisen Bank International AG (*) | | | 103 | | | | 2,080 | |
| | | | | | | | 4,180 | |
| China | 0.3% | | �� | | | | | | |
| S-Enjoy Service Group Co., Ltd. | | | 2,000 | | | | 4,592 | |
| SITC International Holdings Co., Ltd. | | | 1,000 | | | | 2,165 | |
| | | | | | | | 6,757 | |
| Denmark | 3.3% | | | | | | | | |
| Coloplast A/S, Class B | | | 120 | | | | 18,332 | |
| Novo Nordisk A/S, Class B | | | 965 | | | | 67,497 | |
| | | | | | | | 85,829 | |
| Finland | 1.2% | | | | | | | | |
| Neles Oyj | | | 200 | | | | 2,651 | |
| Neste Oyj | | | 103 | | | | 7,441 | |
| UPM-Kymmene Oyj | | | 55 | | | | 2,046 | |
The accompanying notes are an integral part of these financial statements.
Annual Report 103
| Description | | Shares | | | Fair
Value | |
| | | | | | | |
| Lazard International Equity Advantage Portfolio (continued) | | | | | | | | |
| | | | | | | | | |
| Valmet Oyj | | | 712 | | | $ | 20,355 | |
| | | | | | | | 32,493 | |
| France | 9.3% | | | | | | | | |
| Air Liquide SA | | | 71 | | | | 11,653 | |
| Cie de Saint-Gobain (*) | | | 892 | | | | 40,901 | |
| Cie Generale des Etablissements Michelin SCA | | | 240 | | | | 30,801 | |
| Electricite de France SA (*) | | | 392 | | | | 6,209 | |
| Elis SA (*) | | | 125 | | | | 2,094 | |
| Gaztransport Et Technigaz SA | | | 40 | | | | 3,871 | |
| Hermes International | | | 6 | | | $ | 6,452 | |
| L’Oreal SA | | | 86 | | | | 32,676 | |
| Orange SA | | | 983 | | | | 11,699 | |
| Peugeot SA (*) | | | 463 | | | | 12,671 | |
| Sartorius Stedim Biotech | | | 7 | | | | 2,495 | |
| Schneider Electric SE | | | 471 | | | | 68,128 | |
| Societe Generale SA (*) | | | 550 | | | | 11,458 | |
| | | | | | | | 241,108 | |
| Germany | 8.6% | | | | | | | | |
| Allianz SE | | | 270 | | | | 66,062 | |
| Continental AG | | | 28 | | | | 4,149 | |
| Daimler AG | | | 451 | | | | 31,846 | |
| Deutsche Bank AG (*) | | | 2,078 | | | | 22,623 | |
| Deutsche Post AG | | | 903 | | | | 44,687 | |
| DWS Group GmbH & Co. KGaA | | | 145 | | | | 6,166 | |
| Henkel AG & Co. KGaA (Preference Shares) | | | 263 | | | | 29,636 | |
| Muenchener Rueckversicherungs AG | | | 46 | | | | 13,623 | |
| Siltronic AG | | | 24 | | | | 3,756 | |
| | | | | | | | 222,548 | |
| Hong Kong | 2.2% | | | | | | | | |
| CK Hutchison Holdings, Ltd. | | | 2,000 | | | | 13,967 | |
| Man Wah Holdings, Ltd. | | | 7,200 | | | | 15,681 | |
| Sun Hung Kai Properties, Ltd. | | | 1,000 | | | | 12,910 | |
| WH Group, Ltd. | | | 18,000 | | | | 15,093 | |
| | | | | | | | 57,651 | |
| Ireland | 0.2% | | | | | | | | |
| Kingspan Group PLC (*) | | | 85 | | | | 5,967 | |
The accompanying notes are an integral part of these financial statements.
104 Annual Report
| Description | | Shares | | | Fair
Value | |
| | | | | | | |
| Lazard International Equity Advantage Portfolio (continued) | | | | | | | | |
| | | | | | | | | |
| Israel | 0.3% | | | | | | | | |
| Plus500, Ltd. | | | 370 | | | $ | 7,339 | |
| | | | | | | | | |
| Italy | 1.4% | | | | | | | | |
| Banca Generali SpA (*) | | | 78 | | | | 2,593 | |
| Banco BPM SpA (*) | | | 2,289 | | | | 5,025 | |
| Buzzi Unicem SpA | | | 489 | | | | 11,680 | |
| De’ Longhi SpA | | | 71 | | | | 2,234 | |
| Intesa Sanpaolo SpA (*) | | | 3,459 | | | | 8,070 | |
| Reply SpA | | | 60 | | | | 7,004 | |
| | | | | | | | 36,606 | |
| Japan | 25.8% | | | | | | | | |
| AGC, Inc. | | | 200 | | | | 6,985 | |
| Amada Co., Ltd. | | | 2,100 | | | | 23,195 | |
| Chugai Pharmaceutical Co., Ltd. | | | 100 | | | | 5,339 | |
| Credit Saison Co., Ltd. | | | 200 | | | | 2,323 | |
| Dai Nippon Printing Co., Ltd. | | | 500 | | | | 9,019 | |
| Dai-ichi Life Holdings, Inc. | | | 2,500 | | | | 37,975 | |
| Daikin Industries, Ltd. | | | 100 | | | | 22,272 | |
| Daito Trust Construction Co., Ltd. Sponsored ADR | | | 145 | | | | 3,405 | |
| DCM Holdings Co., Ltd. | | | 500 | | | | 5,699 | |
| East Japan Railway Co. ADR | | | 1,388 | | | | 15,434 | |
| EDION Corp. | | | 600 | | | | 6,095 | |
| Electric Power Development Co., Ltd. | | | 700 | | | | 9,707 | |
| Japan Post Bank Co., Ltd. | | | 900 | | | | 7,435 | |
| Japan Tobacco, Inc. | | | 900 | | | | 18,341 | |
| Kao Corp. | | | 100 | | | | 7,731 | |
| KDDI Corp. | | | 400 | | | | 11,879 | |
| Kureha Corp. | | | 100 | | | | 7,057 | |
| McDonald’s Holdings Co. Japan, Ltd. | | | 200 | | | | 9,685 | |
| MEIJI Holdings Co., Ltd. | | | 100 | | | | 7,032 | |
| MS&AD Insurance Group Holdings, Inc. | | | 300 | | | | 9,148 | |
| Murata Manufacturing Co., Ltd. | | | 600 | | | | 54,037 | |
| Nikkiso Co., Ltd. | | | 200 | | | | 1,949 | |
| Nintendo Co., Ltd. ADR | | | 691 | | | | 55,639 | |
| Nishi-Nippon Financial Holdings, Inc. | | | 500 | | | | 3,223 | |
The accompanying notes are an integral part of these financial statements.
Annual Report 105
| Description | | Shares | | | Fair
Value | |
| | | | | | | |
| Lazard International Equity Advantage Portfolio (continued) | | | | | | | | |
| | | | | | | | | |
| Nitori Holdings Co., Ltd. ADR | | | 621 | | | $ | 13,153 | |
| Nitto Denko Corp. | | | 200 | | | | 17,959 | |
| Nitto Denko Corp. ADR | | | 230 | | | | 10,299 | |
| Obayashi Corp. | | | 600 | | | | 5,198 | |
| Ono Pharmaceutical Co., Ltd. | | | 500 | | | | 15,068 | |
| Open House Co., Ltd. | | | 100 | | | | 3,678 | |
| ORIX Corp. | | | 1,000 | | | | 15,519 | |
| Osaka Gas Co., Ltd. | | | 400 | | | | 8,194 | |
| Sekisui Chemical Co., Ltd. | | | 600 | | | | 11,382 | |
| Sekisui House, Ltd. | | | 1,100 | | | | 22,411 | |
| Seven & I Holdings Co., Ltd. | | | 700 | | | | 24,858 | |
| Shin-Etsu Chemical Co., Ltd. | | | 233 | | | | 40,790 | |
| Softbank Corp. | | | 3,300 | | | | 41,371 | |
| T&D Holdings, Inc. | | | 1,400 | | | | 16,569 | |
| Taiheiyo Cement Corp. | | | 200 | | | | 5,032 | |
| The 77 Bank, Ltd. | | | 200 | | | | 2,743 | |
| The Gunma Bank, Ltd. | | | 1,000 | | | | 3,102 | |
| The Okinawa Electric Power Co., Inc. | | | 100 | | | | 1,349 | |
| The Shizuoka Bank, Ltd. | | | 300 | | | | 2,210 | |
| Tohoku Electric Power Co., Inc. | | | 200 | | | | 1,657 | |
| Tokyo Electron, Ltd. | | | 100 | | | | 37,299 | |
| Trend Micro, Inc. | | | 400 | | | | 23,028 | |
| Trend Micro, Inc. Sponsored ADR | | | 84 | | | | 4,821 | |
| | | | | | | | 668,294 | |
| Luxembourg | 0.1% | | | | | | | | |
| ArcelorMittal SA (*) | | | 130 | | | | 2,983 | |
| | | | | | | | | |
| Netherlands | 4.9% | | | | | | | | |
| ASM International NV | | | 109 | | | | 23,830 | |
| ASML Holding NV | | | 48 | | | | 23,197 | |
| Koninklijke Ahold Delhaize NV | | | 1,196 | | | | 33,775 | |
| NN Group NV | | | 380 | | | | 16,624 | |
| Randstad NV (*) | | | 95 | | | | 6,184 | |
| Royal Dutch Shell PLC, A Shares | | | 1,177 | | | | 20,896 | |
| Signify NV (*) | | | 80 | | | | 3,389 | |
| | | | | | | | 127,895 | |
The accompanying notes are an integral part of these financial statements.
106 Annual Report
| Description | | Shares | | | Fair
Value | |
| | | | | | | |
| Lazard International Equity Advantage Portfolio (continued) | | | | | | | | |
| | | | | | | | | |
| New Zealand | 0.6% | | | | | | | | |
| Fisher & Paykel Healthcare Corp., Ltd. | | | 669 | | | $ | 15,887 | |
| | | | | | | | | |
| Norway | 1.6% | | | | | | | | |
| DNB ASA (*) | | | 573 | | | | 11,282 | |
| Orkla ASA | | | 1,926 | | | | 19,541 | |
| Yara International ASA | | | 284 | | | | 11,790 | |
| | | | | | | | 42,613 | |
| Singapore | 1.5% | | | | | | | | |
| AEM Holdings, Ltd. | | | 3,200 | | | | 8,387 | |
| DBS Group Holdings, Ltd. | | | 400 | | | | 7,566 | |
| Genting Singapore, Ltd. | | | 5,400 | | | | 3,467 | |
| Oversea-Chinese Banking Corp., Ltd. | | | 2,100 | | | | 15,966 | |
| UOL Group, Ltd. | | | 400 | | | | 2,339 | |
| | | | | | | | 37,725 | |
| South Africa | 0.1% | | | | | | | | |
| Investec PLC | | | 673 | | | | 1,740 | |
| | | | | | | | | |
| Spain | 2.7% | | | | | | | | |
| Amadeus IT Group SA | | | 127 | | | | 9,195 | |
| Iberdrola SA | | | 1,747 | | | | 24,985 | |
| Industria de Diseno Textil SA | | | 1,111 | | | | 35,376 | |
| | | | | | | | 69,556 | |
| Sweden | 4.7% | | | | | | | | |
| Assa Abloy AB, Class B | | | 526 | | | | 12,938 | |
| Axfood AB | | | 143 | | | | 3,333 | |
| Essity AB, Class B | | | 407 | | | | 13,080 | |
| Evolution Gaming Group AB | | | 241 | | | | 24,434 | |
| Husqvarna AB, B Shares | | | 1,389 | | | | 17,969 | |
| Kinnevik AB, Class B | | | 106 | | | | 5,350 | |
| Lundin Energy AB | | | 116 | | | | 3,132 | |
| Sandvik AB (*) | | | 179 | | | | 4,376 | |
| Skandinaviska Enskilda Banken AB, Class A (*) | | | 820 | | | | 8,418 | |
| Swedish Match AB | | | 258 | | | | 20,042 | |
| Thule Group AB (*) | | | 96 | | | | 3,588 | |
The accompanying notes are an integral part of these financial statements.
Annual Report 107
| Description | | Shares | | | Fair
Value | |
| | | | | | | |
| Lazard International Equity Advantage Portfolio (continued) | | | | | | | | |
| | | | | | | | | |
| Volvo AB, Class B (*) | | | 198 | | | $ | 4,659 | |
| | | | | | | | 121,319 | |
| | | | | | | | | |
| Switzerland | 9.7% | | | | | | | | |
| Credit Suisse Group AG | | | 1,141 | | | | 14,678 | |
| Geberit AG | | | 4 | | | | 2,503 | |
| Logitech International SA | | | 138 | | | | 13,384 | |
| Nestle SA | | | 77 | | | | 9,065 | |
| Novartis AG | | | 829 | | | | 78,300 | |
| Partners Group Holding AG | | | 9 | | | | 10,513 | |
| Roche Holding AG | | | 247 | | | | 86,180 | |
| Sonova Holding AG (*) | | | 86 | | | | 22,140 | |
| UBS Group AG | | | 1,062 | | | | 14,854 | |
| | | | | | | | 251,617 | |
| United Kingdom | 13.9% | | | | | | | | |
| 3i Group PLC | | | 303 | | | | 4,841 | |
| Associated British Foods PLC (*) | | | 454 | | | | 14,066 | |
| AstraZeneca PLC | | | 54 | | | | 5,395 | |
| Barclays PLC (*) | | | 20,248 | | | | 40,638 | |
| British American Tobacco PLC | | | 370 | | | | 13,762 | |
| BT Group PLC | | | 6,585 | | | | 11,919 | |
| Computacenter PLC | | | 78 | | | | 2,614 | |
| Fiat Chrysler Automobiles NV (*) | | | 1,005 | | | | 17,972 | |
| GlaxoSmithKline PLC | | | 1,015 | | | | 18,598 | |
| Howden Joinery Group PLC (*) | | | 172 | | | | 1,624 | |
| IMI PLC | | | 645 | | | | 10,328 | |
| Imperial Brands PLC | | | 380 | | | | 7,984 | |
| ITV PLC (*) | | | 2,391 | | | | 3,495 | |
| National Grid PLC | | | 3,341 | | | | 39,793 | |
| Persimmon PLC | | | 497 | | | | 18,826 | |
| RELX PLC | | | 1,459 | | | | 35,887 | |
| Rio Tinto PLC | | | 50 | | | | 3,741 | |
| Natwest Group PLC (*) | | | 7,924 | | | | 18,327 | |
| Segro PLC REIT | | | 614 | | | | 7,960 | |
| Spirent Communications PLC | | | 1,016 | | | | 3,661 | |
| Standard Chartered PLC (*) | | | 3,931 | | | | 25,207 | |
The accompanying notes are an integral part of these financial statements.
108 Annual Report
| Description | | Shares | | | Fair
Value | |
| | | | | | | |
| Lazard International Equity Advantage Portfolio (concluded) | | | | | | | | |
| | | | | | | | | |
| Tate & Lyle PLC | | | 1,666 | | | $ | 15,379 | |
| Unilever PLC | | | 176 | | | | 10,657 | |
| Vodafone Group PLC | | | 16,371 | | | | 26,941 | |
| | | | | | | | 359,615 | |
| United States | 0.4% | | | | | | | | |
| ICON PLC (*) | | | 51 | | | | 9,944 | |
| | | | | | | | | |
Total Common Stocks
(Cost $2,185,778) | | | | | | | 2,602,280 | |
| | | | | | | | | |
| Preferred Stocks | 0.2% | | | | | | | | |
| | | | | | | | | |
| Germany | 0.2% | | | | | | | | |
Volkswagen AG
(Cost $5,237) | | | 27 | | | | 5,031 | |
| | | | | | | | | |
| Rights | 0.0% | | | | | | | | |
| | | | | | | | | |
| Australia | 0.0% | | | | | | | | |
IGO NL Expires 01/15/21
(Cost $0) | | | 75 | | | | 0 | |
| | | | | | | | | |
| Short-Term Investments | 0.8% | | | | | | | | |
State Street Institutional Treasury Money Market Fund, Premier Class, 0.01% (7 day yield)
(Cost $20,453) | | | 20,453 | | | | 20,453 | |
| | | | | | | | | |
Total Investments | 101.4%
(Cost $2,211,468) | | | | | | $ | 2,627,764 | |
| | | | | | | | | |
| Liabilities in Excess of Cash and Other Assets | (1.4)% | | | | | | | (36,674 | ) |
| | | | | | | | | |
| Net Assets | 100.0% | | | | | | $ | 2,591,090 | |
The accompanying notes are an integral part of these financial statements.
Annual Report 109
| Description | | Shares | | |
Fair
Value | |
| | | | | |
| Lazard International Equity Concentrated Portfolio | | | | | | | | |
| | | | | | | | | |
| Common Stocks | 98.6% | | | | | | | | |
| | | | | | | | | |
| Brazil | 2.6% | | | | | | | | |
| Lojas Renner SA | | | 43,200 | | | $ | 364,259 | |
| | | | | | | | | |
| Canada | 2.2% | | | | | | | | |
| Toromont Industries, Ltd. | | | 4,474 | | | | 313,521 | |
| | | | | | | | | |
| China | 12.0% | | | | | | | | |
| Autohome, Inc. ADR | | | 2,478 | | | | 246,858 | |
| Ping An Insurance (Group) Co. of China, Ltd., Class H | | | 56,000 | | | | 687,850 | |
| Tencent Holdings, Ltd. | | | 10,218 | | | | 746,601 | |
| | | | | | | | 1,681,309 | |
| France | 15.0% | | | | | | | | |
| Engie SA (*) | | | 56,413 | | | | 863,753 | |
| Safran SA (*) | | | 3,763 | | | | 533,670 | |
| Sanofi | | | 7,359 | | | | 711,031 | |
| | | | | | | | 2,108,454 | |
| Germany | 8.1% | | | | | | | | |
| Beiersdorf AG | | | 5,961 | | | | 687,261 | |
| Vonovia SE | | | 6,262 | | | | 456,638 | |
| | | | | | | | 1,143,899 | |
| Hong Kong | 6.7% | | | | | | | | |
| China Gas Holdings, Ltd. | | | 116,600 | | | | 464,909 | |
| ESR Cayman, Ltd. (*) | | | 131,400 | | | | 472,258 | |
| | | | | | | | 937,167 | |
| India | 3.6% | | | | | | | | |
| Reliance Industries, Ltd. Sponsored GDR (#) | | | 9,340 | | | | 510,898 | |
| | | | | | | | | |
| Japan | 12.8% | | | | | | | | |
| Digital Garage, Inc. | | | 14,900 | | | | 615,719 | |
| Hitachi, Ltd. | | | 22,600 | | | | 891,783 | |
| Ryohin Keikaku Co., Ltd. | | | 14,200 | | | | 290,097 | |
| | | | | | | | 1,797,599 | |
The accompanying notes are an integral part of these financial statements.
110 Annual Report
| Description | | Shares | | |
Fair
Value | |
| | | | | |
| Lazard International Equity Concentrated Portfolio (continued) | | | | | | | | |
| | | | | | | | | |
| Luxembourg | 3.6% | | | | | | | | |
| ArcelorMittal SA (*) | | | 22,093 | | | $ | 507,002 | |
| | | | | | | | | |
| Mexico | 5.9% | | | | | | | | |
| Arca Continental SAB de CV | | | 171,296 | | | | 823,619 | |
| | | | | | | | | |
| South Korea | 6.3% | | | | | | | | |
| Samsung Electronics Co., Ltd. | | | 11,922 | | | | 891,020 | |
| | | | | | | | | |
| Spain | 3.7% | | | | | | | | |
| Siemens Gamesa Renewable Energy SA | | | 12,956 | | | | 525,963 | |
| | | | | | | | | |
| United Kingdom | 11.1% | | | | | | | | |
| Prudential PLC | | | 31,401 | | | | 579,607 | |
| RELX PLC | | | 18,275 | | | | 449,509 | |
| The Weir Group PLC (*) | | | 19,672 | | | | 535,834 | |
| | | | | | | | 1,564,950 | |
| United States | 5.0% | | | | | | | | |
| Aon PLC, Class A | | | 1,691 | | | | 357,258 | |
| Medtronic PLC | | | 2,910 | | | | 340,877 | |
| | | | | | | | 698,135 | |
Total Common Stocks
(Cost $11,705,814) | | | | | | | 13,867,795 | |
| | | | | | | | | |
| Preferred Stocks | 3.2% | | | | | | | | |
| | | | | | | | | |
| Germany | 3.2% | | | | | | | | |
Volkswagen AG
(Cost $376,431) | | | 2,374 | | | | 442,301 | |
The accompanying notes are an integral part of these financial statements.
Annual Report 111
| Description | | | | |
Fair
Value | |
| | | | | | | |
| Lazard International Equity Concentrated Portfolio (concluded) | | | | | | | | |
| | | | | | | | | |
Total Investments | 101.8%
(Cost $12,082,245) | | | | | | $ | 14,310,096 | |
| | | | | | | | | |
| Liabilities in Excess of Cash and Other Assets | (1.8)% | | | | | | | (249,247 | ) |
| | | | | | | | | |
| Net Assets | 100.0% | | | | | | $ | 14,060,849 | |
The accompanying notes are an integral part of these financial statements.
112 Annual Report
| Description | | Shares | | |
Fair
Value | |
| | | | | |
| Lazard International Equity Portfolio | | | | | | | | |
| | | | | | | | | |
| Common Stocks | 97.0% | | | | | | | | |
| | | | | | | | | |
| Australia | 1.3% | | | | | | | | |
| BHP Group PLC | | | 1,571,981 | | | $ | 41,427,705 | |
| | | | | | | | | |
| Canada | 3.3% | | | | | | | | |
| Canadian National Railway Co. | | | 333,019 | | | | 36,611,422 | |
| Suncor Energy, Inc. | | | 1,999,274 | | | | 33,533,270 | |
| TMX Group, Ltd. | | | 306,565 | | | | 30,620,374 | |
| | | | | | | | 100,765,066 | |
| China | 3.4% | | | | | | | | |
| Autohome, Inc. ADR | | | 304,577 | | | | 30,341,961 | |
| ENN Energy Holdings, Ltd. | | | 1,875,000 | | | | 27,521,162 | |
| Ping An Insurance (Group) Co. of China, Ltd., Class H | | | 3,882,000 | | | | 47,682,750 | |
| | | | | | | | 105,545,873 | |
| Denmark | 3.7% | | | | | | | | |
| Carlsberg AS, Class B | | | 292,515 | | | | 46,895,463 | |
| Vestas Wind Systems A/S | | | 284,181 | | | | 67,258,183 | |
| | | | | | | | 114,153,646 | |
| Finland | 2.2% | | | | | | | | |
| Nordea Bank Abp (*) | | | 4,107,287 | | | | 33,538,533 | |
| Sampo Oyj, A Shares | | | 828,852 | | | | 35,151,114 | |
| | | | | | | | 68,689,647 | |
| France | 15.9% | | | | | | | | |
| Air Liquide SA | | | 333,806 | | | | 54,787,148 | |
| Alstom SA (*) | | | 956,777 | | | | 54,257,775 | |
| BNP Paribas SA (*) | | | 496,234 | | | | 26,173,474 | |
| Engie SA (*) | | | 5,441,356 | | | | 83,313,913 | |
| Pernod Ricard SA | | | 211,460 | | | | 40,534,397 | |
| Safran SA (*) | | | 439,759 | | | | 62,366,818 | |
| Sanofi | | | 786,196 | | | | 75,962,684 | |
| Vinci SA | | | 299,794 | | | | 29,829,920 | |
| Vivendi SA | | | 1,846,719 | | | | 59,554,088 | |
| | | | | | | | 486,780,217 | |
The accompanying notes are an integral part of these financial statements.
Annual Report 113
| Description | | Shares | | |
Fair
Value | |
| | | | | |
| Lazard International Equity Portfolio (continued) | | | | | | | | |
| | | | | | | | | |
| Germany | 6.9% | | | | | | | | |
| Continental AG | | | 241,943 | | | $ | 35,850,870 | |
| Fresenius Medical Care AG & Co. KGaA | | | 377,275 | | | | 31,468,105 | |
| Infineon Technologies AG | | | 943,943 | | | | 36,225,382 | |
| Merck KGaA | | | 251,862 | | | | 43,172,546 | |
| ProSiebenSat.1 Media SE (*) | | | 1,665,575 | | | | 27,993,665 | |
| Vonovia SE | | | 491,815 | | | | 35,864,132 | |
| | | | | | | | 210,574,700 | |
| Hong Kong | 1.1% | | | | | | | | |
| ESR Cayman, Ltd. (*) | | | 9,267,800 | | | | 33,308,898 | |
| | | | | | | | | |
| Ireland | 1.1% | | | | | | | | |
| Ryanair Holdings PLC Sponsored ADR (*) | | | 312,652 | | | | 34,385,467 | |
| | | | | | | | | |
| Israel | 1.0% | | | | | | | | |
| Bank Leumi Le-Israel BM | | | 5,309,391 | | | | 31,338,537 | |
| | | | | | | | | |
| Italy | 2.3% | | | | | | | | |
| Enel SpA | | | 6,953,966 | | | | 70,223,686 | |
| | | | | | | | | |
| Japan | 15.9% | | | | | | | | |
| Daiwa House Industry Co., Ltd. | | | 1,564,981 | | | | 46,714,151 | |
| Fujitsu, Ltd. | | | 259,478 | | | | 37,562,865 | |
| Hitachi, Ltd. | | | 1,822,100 | | | | 71,899,002 | |
| Kao Corp. | | | 263,480 | | | | 20,370,931 | |
| Makita Corp. | | | 937,200 | | | | 47,045,794 | |
| Nexon Co., Ltd. | | | 1,699,782 | | | | 52,349,785 | |
| Nintendo Co., Ltd. | | | 93,500 | | | | 59,670,690 | |
| Ryohin Keikaku Co., Ltd. | | | 1,266,200 | | | | 25,867,676 | |
| Sumitomo Mitsui Financial Group, Inc. | | | 1,201,000 | | | | 37,162,660 | |
| Suzuki Motor Corp. | | | 742,000 | | | | 34,448,705 | |
| Yamaha Corp. | | | 526,700 | | | | 31,047,285 | |
| Z Holdings Corp. | | | 3,552,769 | | | | 21,548,052 | |
| | | | | | | | 485,687,596 | |
| Luxembourg | 1.2% | | | | | | | | |
| ArcelorMittal SA (*) | | | 1,570,842 | | | | 36,048,550 | |
The accompanying notes are an integral part of these financial statements.
114 Annual Report
| Description | | Shares | | |
Fair
Value | |
| | | | | |
| Lazard International Equity Portfolio (continued) | | | | | | | | |
| | | | | | | | | |
| Mexico | 0.7% | | | | | | | | |
| Arca Continental SAB de CV | | | 4,414,012 | | | $ | 21,223,280 | |
| | | | | | | | | |
| Netherlands | 4.9% | | | | | | | | |
| Akzo Nobel NV | | | 264,905 | | | | 28,455,907 | |
| JDE Peet’s NV (*) | | | 511,091 | | | | 23,039,372 | |
| Koninklijke DSM NV | | | 364,424 | | | | 62,777,865 | |
| Wolters Kluwer NV | | | 432,355 | | | | 36,492,063 | |
| | | | | | | | 150,765,207 | |
| Norway | 2.3% | | | | | | | | |
| Equinor ASA | | | 1,815,011 | | | | 30,115,792 | |
| Telenor ASA | | | 2,317,409 | | | | 39,246,901 | |
| | | | | | | | 69,362,693 | |
| Portugal | 1.5% | | | | | | | | |
| Energias de Portugal SA | | | 5,884,930 | | | | 37,083,690 | |
| Galp Energia SGPS SA | | | 857,083 | | | | 9,168,307 | |
| | | | | | | | 46,251,997 | |
| Singapore | 1.1% | | | | | | | | |
| DBS Group Holdings, Ltd. | | | 1,737,920 | | | | 32,872,550 | |
| | | | | | | | | |
| South Korea | 2.0% | | | | | | | | |
| Samsung Electronics Co., Ltd. | | | 825,939 | | | | 61,728,560 | |
| | | | | | | | | |
| Spain | 1.3% | | | | | | | | |
| Banco Santander SA (*) | | | 12,748,342 | | | | 39,582,055 | |
| | | | | | | | | |
| Sweden | 2.2% | | | | | | | | |
| Hexagon AB, B Shares | | | 288,475 | | | | 26,269,538 | |
| Sandvik AB (*) | | | 1,643,975 | | | | 40,185,758 | |
| | | | | | | | 66,455,296 | |
| Switzerland | 5.8% | | | | | | | | |
| ABB, Ltd. | | | 2,464,370 | | | | 68,931,730 | |
| Flughafen Zuerich AG (*) | | | 136,710 | | | | 24,181,386 | |
| Novartis AG | | | 892,378 | | | | 84,285,815 | |
| | | | | | | | 177,398,931 | |
The accompanying notes are an integral part of these financial statements.
Annual Report 115
| Description | | Shares | | |
Fair
Value | |
| | | | | |
| Lazard International Equity Portfolio (concluded) | | | | | | | | |
| | | | | | | | | |
| United Kingdom | 9.6% | | | | | | | | |
| 3i Group PLC | | | 1,552,490 | | | $ | 24,803,309 | |
| Informa PLC (*) | | | 3,540,914 | | | | 26,608,253 | |
| Prudential PLC | | | 2,468,934 | | | | 45,572,166 | |
| RELX PLC | | | 3,401,526 | | | | 83,667,066 | |
| Tesco PLC | | | 18,535,401 | | | | 58,519,151 | |
| Unilever PLC | | | 917,540 | | | | 55,233,515 | |
| | | | | | | | 294,403,460 | |
| United States | 6.3% | | | | | | | | |
| Aon PLC, Class A | | | 261,335 | | | | 55,212,246 | |
| Ferguson PLC | | | 387,643 | | | | 47,141,648 | |
| Medtronic PLC | | | 773,521 | | | | 90,610,250 | |
| | | | | | | | 192,964,144 | |
Total Common Stocks
(Cost $2,322,971,104) | | | | | | | 2,971,937,761 | |
| | | | | | | | | |
| Preferred Stocks | 1.7% | | | | | | | | |
| | | | | | | | | |
| Germany | 1.7% | | | | | | | | |
Volkswagen AG
(Cost $47,421,165) | | | 280,089 | | | | 52,183,445 | |
| | | | | | | | | |
| Short-Term Investments | 1.1% | | | | | | | | |
State Street Institutional Treasury Money Market Fund, Premier Class,
0.01% (7 day yield)
(Cost $33,605,219) | | | 33,605,219 | | | | 33,605,219 | |
| | | | | | | | | |
Total Investments | 99.8%
(Cost $2,403,997,488) | | | | | | $ | 3,057,726,425 | |
| | | | | | | | | |
| Cash and Other Assets in Excess of Liabilities | 0.2% | | | | | | | 4,923,688 | |
| | | | | | | | | |
| Net Assets | 100.0% | | | | | | $ | 3,062,650,113 | |
The accompanying notes are an integral part of these financial statements.
116 Annual Report
| Description | | Shares | | |
Fair
Value | |
| | | | | |
| Lazard International Equity Select Portfolio | | | | | | | | |
| | | | | | | | | |
| Common Stocks | 95.6% | | | | | | | | |
| | | | | | | | | |
| Australia | 1.4% | | | | | | | | |
| BHP Group, Ltd. | | | 39,417 | | | $ | 1,284,162 | |
| | | | | | | | | |
| Brazil | 2.4% | | | | | | | | |
| BB Seguridade Participacoes SA | | | 117,800 | | | | 674,599 | |
| Cia de Saneamento Basico do Estado de Sao Paulo | | | 76,600 | | | | 657,942 | |
| Lojas Renner SA | | | 113,100 | | | | 953,651 | |
| | | | | | | | 2,286,192 | |
| Canada | 2.0% | | | | | | | | |
| Canadian National Railway Co. | | | 9,258 | | | | 1,017,805 | |
| Suncor Energy, Inc. | | | 53,631 | | | | 899,538 | |
| | | | | | | | 1,917,343 | |
| China | 8.7% | | | | | | | | |
| Alibaba Group Holding, Ltd. (*) | | | 26,900 | | | | 785,955 | |
| Autohome, Inc. ADR | | | 11,642 | | | | 1,159,776 | |
| ENN Energy Holdings, Ltd. | | | 99,600 | | | | 1,461,924 | |
| Ping An Insurance (Group) Co. of China, Ltd., Class H | | | 180,500 | | | | 2,217,088 | |
| Tencent Holdings, Ltd. | | | 35,700 | | | | 2,608,500 | |
| | | | | | | | 8,233,243 | |
| Denmark | 2.9% | | | | | | | | |
| Carlsberg AS, Class B | | | 7,515 | | | | 1,204,791 | |
| Vestas Wind Systems A/S | | | 6,753 | | | | 1,598,258 | |
| | | | | | | | 2,803,049 | |
| Finland | 2.1% | | | | | | | | |
| Nordea Bank Abp (*) | | | 104,375 | | | | 852,287 | |
| Sampo Oyj, A Shares | | | 26,911 | | | | 1,141,279 | |
| | | | | | | | 1,993,566 | |
| France | 14.3% | | | | | | | | |
| Air Liquide SA | | | 7,291 | | | | 1,196,663 | |
| Alstom SA (*) | | | 25,248 | | | | 1,431,786 | |
| BNP Paribas SA (*) | | | 19,702 | | | | 1,039,167 | |
| Engie SA (*) | | | 143,930 | | | | 2,203,747 | |
| Pernod Ricard SA | | | 5,218 | | | | 1,000,229 | |
| Safran SA (*) | | | 15,901 | | | | 2,255,087 | |
The accompanying notes are an integral part of these financial statements.
Annual Report 117
| Description | | Shares | | |
Fair
Value | |
| | | | | |
| Lazard International Equity Select Portfolio (continued) | | | | | | | | |
| | | | | | | | | |
| Sanofi | | | 21,644 | | | $ | 2,091,255 | |
| Vinci SA | | | 8,265 | | | | 822,379 | |
| Vivendi SA | | | 48,953 | | | | 1,578,665 | |
| | | | | | | | 13,618,978 | |
| Germany | 4.2% | | | | | | | | |
| Beiersdorf AG | | | 10,930 | | | | 1,260,151 | |
| Continental AG | | | 4,245 | | | | 629,020 | |
| Knorr-Bremse AG | | | 7,864 | | | | 1,071,280 | |
| Merck KGaA | | | 6,217 | | | | 1,065,678 | |
| | | �� | | | | | 4,026,129 | |
| Hong Kong | 1.9% | | | | | | | | |
| ESR Cayman, Ltd. (*) | | | 235,600 | | | | 846,757 | |
| Sands China, Ltd. | | | 226,800 | | | | 996,926 | |
| | | | | | | | 1,843,683 | |
| India | 2.1% | | | | | | | | |
| Hero MotoCorp, Ltd. | | | 11,521 | | | | 491,036 | |
| ICICI Bank, Ltd. Sponsored ADR (*) | | | 103,910 | | | | 1,544,102 | |
| | | | | | | | 2,035,138 | |
| Indonesia | 1.1% | | | | | | | | |
| PT Bank Mandiri (Persero) Tbk | | | 837,000 | | | | 377,713 | |
| PT Telkom Indonesia (Persero) Tbk Sponsored ADR | | | 26,885 | | | | 632,335 | |
| | | | | | | | 1,010,048 | |
| Ireland | 1.4% | | | | | | | | |
| Ryanair Holdings PLC Sponsored ADR (*) | | | 11,879 | | | | 1,306,452 | |
| | | | | | | | | |
| Italy | 1.9% | | | | | | | | |
| Enel SpA | | | 182,264 | | | | 1,840,568 | |
| | | | | | | | | |
| Japan | 12.7% | | | | | | | | |
| Daiwa House Industry Co., Ltd. | | | 31,100 | | | | 928,325 | |
| Hitachi, Ltd. | | | 37,800 | | | | 1,491,566 | |
| Kao Corp. | | | 10,900 | | | | 842,733 | |
| Makita Corp. | | | 28,600 | | | | 1,435,670 | |
| Nintendo Co., Ltd. | | | 3,100 | | | | 1,978,387 | |
| Ryohin Keikaku Co., Ltd. | | | 44,400 | | | | 907,064 | |
| Shimano, Inc. | | | 4,500 | | | | 1,050,919 | |
The accompanying notes are an integral part of these financial statements.
118 Annual Report
| Description | | Shares | | |
Fair
Value | |
| | | | | |
| Lazard International Equity Select Portfolio (continued) | | | | | | | | |
| | | | | | | | | |
| Shin-Etsu Chemical Co., Ltd. | | | 8,500 | | | $ | 1,488,040 | |
| Sumitomo Mitsui Financial Group, Inc. | | | 34,176 | | | | 1,057,511 | |
| Suzuki Motor Corp. | | | 18,200 | | | | 844,968 | |
| | | | | | | | 12,025,183 | |
| Mexico | 1.6% | | | | | | | | |
| Grupo Financiero Banorte SAB de CV, Class O (*) | | | 268,600 | | | | 1,483,816 | |
| | | | | | | | | |
| Netherlands | 3.4% | | | | | | | | |
| JDE Peet’s NV (*) | | | 16,735 | | | | 754,394 | |
| Koninklijke DSM NV | | | 8,106 | | | | 1,396,388 | |
| Wolters Kluwer NV | | | 12,432 | | | | 1,049,298 | |
| | | | | | | | 3,200,080 | |
| Norway | 2.0% | | | | | | | | |
| Equinor ASA | | | 47,025 | | | | 780,268 | |
| Telenor ASA | | | 63,860 | | | | 1,081,513 | |
| | | | | | | | 1,861,781 | |
| Singapore | 1.0% | | | | | | | | |
| DBS Group Holdings, Ltd. | | | 48,700 | | | | 921,155 | |
| | | | | | | | | |
| South Africa | 0.9% | | | | | | | | |
| Mr Price Group, Ltd. | | | 72,486 | | | | 843,004 | |
| | | | | | | | | |
| South Korea | 4.5% | | | | | | | | |
| LG Household & Health Care, Ltd. | | | 724 | | | | 1,079,741 | |
| Samsung Electronics Co., Ltd. | | | 43,147 | | | | 3,224,696 | |
| | | | | | | | 4,304,437 | |
| Spain | 0.5% | | | | | | | | |
| Industria de Diseno Textil SA | | | 15,022 | | | | 478,329 | |
| | | | | | | | | |
| Sweden | 2.4% | | | | | | | | |
| Hexagon AB, B Shares | | | 11,804 | | | | 1,074,914 | |
| Sandvik AB (*) | | | 49,795 | | | | 1,217,202 | |
| | | | | | | | 2,292,116 | |
| Switzerland | 5.8% | | | | | | | | |
| ABB, Ltd. | | | 74,378 | | | | 2,080,452 | |
| Flughafen Zuerich AG (*) | | | 3,048 | | | | 539,133 | |
The accompanying notes are an integral part of these financial statements.
Annual Report 119
| Description | | Shares | | |
Fair
Value | |
| | | | | |
| Lazard International Equity Select Portfolio (concluded) | | | | | | | | |
| | | | | | | | | |
| Lonza Group AG | | | 1,464 | | | $ | 940,276 | |
| Novartis AG | | | 20,833 | | | | 1,967,694 | |
| | | | | | | | 5,527,555 | |
| United Kingdom | 7.7% | | | | | | | | |
| London Stock Exchange Group PLC | | | 7,210 | | | | 888,740 | |
| Prudential PLC | | | 64,801 | | | | 1,196,112 | |
| RELX PLC | | | 89,834 | | | | 2,209,640 | |
| Tesco PLC | | | 482,347 | | | | 1,522,845 | |
| Unilever PLC | | | 25,306 | | | | 1,523,355 | |
| | | | | | | | 7,340,692 | |
| United States | 6.7% | | | | | | | | |
| Accenture PLC, Class A | | | 5,686 | | | | 1,485,240 | |
| Aon PLC, Class A | | | 8,542 | | | | 1,804,669 | |
| Ferguson PLC | | | 9,930 | | | | 1,207,597 | |
| Medtronic PLC | | | 16,030 | | | | 1,877,754 | |
| | | | | | | | 6,375,260 | |
Total Common Stocks
(Cost $74,457,997) | | | | | | | 90,851,959 | |
| | | | | | | | | |
| Preferred Stocks | 2.0% | | | | | | | | |
| | | | | | | | | |
| Germany | 2.0% | | | | | | | | |
Volkswagen AG
(Cost $1,732,597) | | | 10,067 | | | | 1,875,585 | |
| | | | | | | | | |
| Short-Term Investments | 2.2% | | | | | | | | |
State Street Institutional Treasury Money Market Fund, Premier Class,
0.01% (7 day yield)
(Cost $2,104,351) | | | 2,104,351 | | | | 2,104,351 | |
| | | | | | | | | |
Total Investments | 99.8%
(Cost $78,294,945) | | | | | | $ | 94,831,895 | |
| | | | | | | | | |
| Cash and Other Assets in Excess of Liabilities | 0.2% | | | | | | | 156,943 | |
| | | | | | | | | |
| Net Assets | 100.0% | | | | | | $ | 94,988,838 | |
The accompanying notes are an integral part of these financial statements.
120 Annual Report
| Description | | Shares | | |
Fair
Value | |
| | | | | |
| Lazard International Equity Value Portfolio | | | | | | | | |
| | | | | | | | | |
| Common Stocks | 98.1% | | | | | | | | |
| | | | | | | | | |
| Austria | 2.0% | | | | | | | | |
| BAWAG Group AG (*) | | | 1,159 | | | $ | 54,376 | |
| | | | | | | | | |
| France | 22.6% | | | | | | | | |
| Bollore SA | | | 21,163 | | | | 87,515 | |
| Carrefour SA | | | 5,734 | | | | 98,319 | |
| Credit Agricole SA (*) | | | 9,818 | | | | 123,975 | |
| Engie SA (*) | | | 6,373 | | | | 97,579 | |
| Peugeot SA (*) | | | 2,693 | | | | 73,700 | |
| Sanofi | | | 932 | | | | 90,050 | |
| Thales SA | | | 563 | | | | 51,572 | |
| | | | | | | | 622,710 | |
| Germany | 10.0% | | | | | | | | |
| Allianz SE | | | 340 | | | | 83,188 | |
| KION Group AG | | | 996 | | | | 86,594 | |
| Siemens AG | | | 741 | | | | 106,057 | |
| | | | | | | | 275,839 | |
| Italy | 2.1% | | | | | | | | |
| Pirelli & C SpA (*) | | | 10,534 | | | | 56,989 | |
| | | | | | | | | |
| Japan | 20.1% | | | | | | | | |
| Hitachi, Ltd. | | | 2,900 | | | | 114,432 | |
| Nexon Co., Ltd. | | | 1,654 | | | | 50,940 | |
| Shin-Etsu Chemical Co., Ltd. | | | 491 | | | | 85,956 | |
| Sony Corp. Sponsored ADR | | | 838 | | | | 84,722 | |
| Suzuki Motor Corp. | | | 1,368 | | | | 63,512 | |
| Toyota Industries Corp. | | | 1,086 | | | | 86,320 | |
| Universal Entertainment Corp. (*) | | | 2,885 | | | | 66,679 | |
| | | | | | | | 552,561 | |
| Macau | 2.9% | | | | | | | | |
| SJM Holdings, Ltd. | | | 72,306 | | | | 81,006 | |
The accompanying notes are an integral part of these financial statements.
Annual Report 121
| Description | | Shares | | |
Fair
Value | |
| | | | | |
| Lazard International Equity Value Portfolio (continued) | | | | | | | | |
| | | | | | | | | |
| Mexico | 5.2% | | | | | | | | |
| Arca Continental SAB de CV | | | 15,037 | | | $ | 72,300 | |
| Fomento Economico Mexicano SAB de CV Sponsored ADR | | | 919 | | | | 69,633 | |
| | | | | | | | 141,933 | |
| Netherlands | 3.5% | | | | | | | | |
| Akzo Nobel NV | | | 910 | | | | 97,752 | |
| | | | | | | | | |
| South Korea | 7.0% | | | | | | | | |
| Kangwon Land, Inc. | | | 4,143 | | | | 89,604 | |
| SK Hynix, Inc. | | | 943 | | | | 103,162 | |
| | | | | | | | 192,766 | |
| Spain | 2.5% | | | | | | | | |
| Banco Santander SA (*) | | | 21,980 | | | | 68,245 | |
| | | | | | | | | |
| Sweden | 3.3% | | | | | | | | |
| Sandvik AB (*) | | | 3,688 | | | | 90,150 | |
| | | | | | | | | |
| Switzerland | 11.2% | | | | | | | | |
| Coca-Cola HBC AG | | | 3,820 | | | | 124,243 | |
| Credit Suisse Group AG | | | 8,874 | | | | 114,160 | |
| The Swatch Group AG | | | 257 | | | | 70,045 | |
| | | | | | | | 308,448 | |
| United Kingdom | 5.7% | | | | | | | | |
| BP PLC | | | 18,883 | | | | 65,047 | |
| Prudential PLC | | | 4,918 | | | | 90,778 | |
| | | | | | | | 155,825 | |
Total Common Stocks
(Cost $2,313,850) | | | | | | | 2,698,600 | |
The accompanying notes are an integral part of these financial statements.
122 Annual Report
| Description | | Shares | | |
Fair
Value | |
| | | | | |
| Lazard International Equity Value Portfolio (concluded) | | | | | | | | |
| | | | | | | | | |
| Short-Term Investments | 2.2% | | | | | | | | |
State Street Institutional Treasury Money Market Fund, Premier Class, 0.01% (7 day yield)
(Cost $60,990) | | | 60,990 | | | $ | 60,990 | |
| | | | | | | | | |
Total Investments | 100.3%
(Cost $2,374,840) | | | | | | $ | 2,759,590 | |
| | | | | | | | | |
| Liabilities in Excess of Cash and Other Assets | (0.3)% | | | | | | | (8,693 | ) |
| | | | | | | | | |
| Net Assets | 100.0% | | | | | | $ | 2,750,897 | |
The accompanying notes are an integral part of these financial statements.
Annual Report 123
| Description | | Shares | | | Fair
Value | |
| | | | | | | |
| Lazard International Quality Growth Portfolio | | | | | | | | |
| | | | | | | | | |
| Common Stocks | 95.3% | | | | | | | | |
| | | | | | | | | |
| Canada | 9.0% | | | | | | | | |
| CAE, Inc. | | | 10,390 | | | $ | 287,890 | |
| Dollarama, Inc. | | | 4,728 | | | | 192,701 | |
| National Bank of Canada | | | 3,241 | | | | 182,406 | |
| Toromont Industries, Ltd. | | | 4,379 | | | | 306,864 | |
| | | | | | | | 969,861 | |
| China | 6.7% | | | | | | | | |
| Alibaba Group Holding, Ltd. Sponsored ADR (*) | | | 1,352 | | | | 314,651 | |
| Tencent Holdings, Ltd. | | | 5,500 | | | | 401,870 | |
| | | | | | | | 716,521 | |
| Denmark | 6.5% | | | | | | | | |
| Coloplast A/S, Class B | | | 1,068 | | | | 163,150 | |
| Demant A/S (*) | | | 5,299 | | | | 209,180 | |
| Genmab A/S (*) | | | 818 | | | | 330,866 | |
| | | | | | | | 703,196 | |
| France | 4.7% | | | | | | | | |
| Legrand SA | | | 2,254 | | | | 201,176 | |
| LVMH Moet Hennessy Louis Vuitton SE | | | 480 | | | | 299,919 | |
| | | | | | | | 501,095 | |
| Germany | 8.7% | | | | | | | | |
| Rational AG | | | 260 | | | | 241,920 | |
| SAP SE | | | 1,612 | | | | 211,831 | |
| Scout24 AG | | | 3,325 | | | | 272,387 | |
| Symrise AG | | | 1,610 | | | | 212,943 | |
| | | | | | | | 939,081 | |
| Hong Kong | 2.3% | | | | | | | | |
| AIA Group, Ltd. | | | 20,000 | | | | 246,353 | |
| | | | | | | | | |
| India | 3.5% | | | | | | | | |
| HDFC Bank, Ltd. ADR (*) | | | 5,277 | | | | 381,316 | |
| | | | | | | | | |
| Israel | 1.7% | | | | | | | | |
| Check Point Software Technologies, Ltd. (*) | | | 1,344 | | | | 178,631 | |
The accompanying notes are an integral part of these financial statements.
124 Annual Report
| Description | | Shares | | | Fair
Value | |
| | | | | | | |
| Lazard International Quality Growth Portfolio (continued) | | | | | | | | |
| | | | | | | | | |
| Japan | 11.2% | | | | | | | | |
| Pigeon Corp. | | | 3,400 | | | $ | 140,529 | |
| Shimano, Inc. | | | 700 | | | | 163,477 | |
| SMS Co., Ltd. | | | 9,800 | | | | 375,494 | |
| Toei Animation Co., Ltd. | | | 4,600 | | | | 360,835 | |
| Workman Co., Ltd. | | | 2,000 | | | | 170,695 | |
| | | | | | | | 1,211,030 | |
| Netherlands | 5.1% | | | | | | | | |
| ASML Holding NV | | | 769 | | | | 371,628 | |
| Wolters Kluwer NV | | | 2,146 | | | | 181,129 | |
| | | | | | | | 552,757 | |
| Norway | 1.5% | | | | | | | | |
| Gjensidige Forsikring ASA | | | 7,253 | | | | 161,895 | |
| | | | | | | | | |
| South Africa | 2.1% | | | | | | | | |
| Clicks Group, Ltd. | | | 12,915 | | | | 222,221 | |
| | | | | | | | | |
| South Korea | 2.1% | | | | | | | | |
| LG Household & Health Care, Ltd. | | | 150 | | | | 223,703 | |
| | | | | | | | | |
| Spain | 1.2% | | | | | | | | |
| Industria de Diseno Textil SA | | | 3,993 | | | | 127,145 | |
| | | | | | | | | |
| Sweden | 4.6% | | | | | | | | |
| Assa Abloy AB, Class B | | | 10,021 | | | | 246,481 | |
| Hexagon AB, B Shares | | | 2,739 | | | | 249,423 | |
| | | | | | | | 495,904 | |
| Switzerland | 5.1% | | | | | | | | |
| Geberit AG | | | 337 | | | | 210,852 | |
| Partners Group Holding AG | | | 290 | | | | 338,747 | |
| | | | | | | | 549,599 | |
| Taiwan | 5.1% | | | | | | | | |
| Taiwan Semiconductor Manufacturing Co., Ltd. Sponsored ADR | | | 5,025 | | | | 547,926 | |
The accompanying notes are an integral part of these financial statements.
Annual Report 125
| Description | | Shares | | | Fair
Value | |
| | | | |
| Lazard International Quality Growth Portfolio (concluded) | | | | | | | | |
| | | | | | | | | |
| United Kingdom | 11.6% | | | | | | | | |
| Dechra Pharmaceuticals PLC | | | 3,569 | | | $ | 168,462 | |
| Diageo PLC | | | 6,101 | | | | 241,118 | |
| Intertek Group PLC | | | 2,305 | | | | 178,124 | |
| London Stock Exchange Group PLC | | | 2,248 | | | | 277,100 | |
| Prudential PLC | | | 7,669 | | | | 141,556 | |
| RELX PLC | | | 9,939 | | | | 244,336 | |
| | | | | | | | 1,250,696 | |
| United States | 2.6% | | | | | | | | |
| Aon PLC, Class A | | | 1,345 | | | | 284,158 | |
| | | | | | | | | |
Total Common Stocks
(Cost $7,824,500) | | | | | | | 10,263,088 | |
| | | | | | | | | |
| Short-Term Investments | 6.6% | | | | | | | | |
State Street Institutional Treasury Money Market Fund, Premier Class, 0.01% (7 day yield)
(Cost $710,467) | | | 710,467 | | | | 710,467 | |
| | | | | | | | | |
Total Investments | 101.9%
(Cost $8,534,967) | | | | | | $ | 10,973,555 | |
| | | | | | | | | |
| Liabilities in Excess of Cash and Other Assets | (1.9)% | | | | | | | (209,304 | ) |
| | | | | | | | | |
| Net Assets | 100.0% | | | | | | $ | 10,764,251 | |
The accompanying notes are an integral part of these financial statements.
126 Annual Report
| Description | | Shares | | | Fair
Value | |
| | | | | | | |
| Lazard International Small Cap Equity Portfolio | | | | | | | | |
| | | | | | | | | |
| Common Stocks | 98.1% | | | | | | | | |
| | | | | | | | | |
| Australia | 2.4% | | | | | | | | |
| AUB Group, Ltd. | | | 30,426 | | | $ | 379,963 | |
| Bravura Solutions, Ltd. | | | 151,435 | | | | 376,318 | |
| carsales.com, Ltd. | | | 16,201 | | | | 250,101 | |
| | | | | | | | 1,006,382 | |
| Austria | 1.3% | | | | | | | | |
| BAWAG Group AG (*) | | | 11,631 | | | | 545,679 | |
| | | | | | | | | |
| Belgium | 2.9% | | | | | | | | |
| Barco NV | | | 14,027 | | | | 305,675 | |
| Fagron | | | 18,442 | | | | 428,319 | |
| Shurgard Self Storage SA | | | 10,966 | | | | 475,707 | |
| | | | | | | | 1,209,701 | |
| Canada | 3.3% | | | | | | | | |
| Stelco Holdings, Inc. | | | 38,797 | | | | 692,793 | |
| The Descartes Systems Group, Inc. (*) | | | 4,888 | | | | 285,892 | |
| WPT Industrial Real Estate Investment Trust | | | 29,767 | | | | 430,133 | |
| | | | | | | | 1,408,818 | |
| Denmark | 1.4% | | | | | | | | |
| Royal Unibrew A/S | | | 5,224 | | | | 605,666 | |
| | | | | | | | | |
| Finland | 3.4% | | | | | | | | |
| Altia Oyj | | | 40,590 | | | | 492,861 | |
| Kemira Oyj | | | 30,515 | | | | 478,103 | |
| Kojamo Oyj | | | 20,002 | | | | 441,364 | |
| | | | | | | | 1,412,328 | |
| France | 1.5% | | | | | | | | |
| Gaztransport Et Technigaz SA | | | 3,211 | | | | 310,725 | |
| Kaufman & Broad SA | | | 7,040 | | | | 315,008 | |
| | | | | | | | 625,733 | |
| Germany | 13.1% | | | | | | | | |
| Aroundtown SA | | | 80,180 | | | | 599,584 | |
| CompuGroup Medical SE & Co. KgaA | | | 3,623 | | | | 347,931 | |
| Covestro AG | | | 8,645 | | | | 533,247 | |
The accompanying notes are an integral part of these financial statements.
Annual Report 127
| Description | | Shares | | | Fair
Value | |
| | | | | | | |
| Lazard International Small Cap Equity Portfolio (continued) | | | | | | | | |
| | | | | | | | | |
| Dermapharm Holding SE | | | 11,881 | | | $ | 826,837 | |
| Flatex AG (*) | | | 14,452 | | | | 1,121,195 | |
| JOST Werke AG (*) | | | 11,258 | | | | 592,860 | |
| LEG Immobilien AG | | | 3,091 | | | | 479,224 | |
| PATRIZIA AG | | | 15,191 | | | | 487,218 | |
| Teamviewer AG (*) | | | 9,885 | | | | 529,394 | |
| | | | | | | | 5,517,490 | |
| Greece | 1.4% | | | | | | | | |
| JUMBO SA | | | 14,914 | | | | 259,700 | |
| Terna Energy SA | | | 20,886 | | | | 336,169 | |
| | | | | | | | 595,869 | |
| Hong Kong | 1.0% | | | | | | | | |
| ESR Cayman, Ltd. (*) | | | 112,400 | | | | 403,971 | |
| | | | | | | | | |
| India | 0.7% | | | | | | | | |
| Jubilant Life Sciences, Ltd. | | | 25,361 | | | | 293,641 | |
| | | | | | | | | |
| Ireland | 1.2% | | | | | | | | |
| Dalata Hotel Group PLC (*) | | | 106,699 | | | | 493,382 | |
| | | | | | | | | |
| Italy | 3.5% | | | | | | | | |
| Banca Generali SpA (*) | | | 13,509 | | | | 449,071 | |
| Italgas SpA | | | 84,969 | | | | 542,214 | |
| Tinexta Spa (*) | | | 18,618 | | | | 477,253 | |
| | | | | | | | 1,468,538 | |
| Japan | 24.5% | | | | | | | | |
| Ariake Japan Co., Ltd. | | | 6,500 | | | | 467,626 | |
| ARTERIA Networks Corp. | | | 31,100 | | | | 450,309 | |
| Bell System24 Holdings, Inc. | | | 24,700 | | | | 387,630 | |
| Broadleaf Co., Ltd. | | | 58,300 | | | | 384,641 | |
| Daiseki Co., Ltd. | | | 15,200 | | | | 446,153 | |
| Digital Garage, Inc. | | | 11,200 | | | | 462,823 | |
| DTS Corp. | | | 20,600 | | | | 424,729 | |
| GMO internet, Inc. | | | 14,900 | | | | 428,090 | |
| Industrial & Infrastructure Fund Investment Corp. REIT | | | 278 | | | | 513,258 | |
| JAFCO Group Co., ltd. | | | 11,900 | | | | 594,607 | |
The accompanying notes are an integral part of these financial statements.
128 Annual Report
| Description | | Shares | | | Fair
Value | |
| | | | | | | |
| Lazard International Small Cap Equity Portfolio (continued) | | | | | | | | |
| | | | | | | | | |
| Japan Lifeline Co., Ltd. | | | 29,900 | | | $ | 472,065 | |
| Nippon Shinyaku Co., Ltd. | | | 3,900 | | | | 256,135 | |
| Open House Co., Ltd. | | | 12,600 | | | | 463,450 | |
| Relo Group, Inc. | | | 17,300 | | | | 419,596 | |
| Roland Corp. | | | 14,500 | | | | 442,352 | |
| Sanwa Holdings Corp. | | | 36,500 | | | | 424,999 | |
| Seria Co., Ltd. | | | 11,000 | | | | 403,159 | |
| TechnoPro Holdings, Inc. | | | 6,845 | | | | 568,171 | |
| Trend Micro, Inc. | | | 7,300 | | | | 420,272 | |
| Trusco Nakayama Corp. | | | 16,000 | | | | 450,507 | |
| Tsuruha Holdings, Inc. | | | 3,700 | | | | 527,512 | |
| USS Co., Ltd. | | | 23,300 | | | | 471,341 | |
| Zenkoku Hosho Co., Ltd. | | | 8,342 | | | | 383,665 | |
| | | | | | | | 10,263,090 | |
| Jersey | 1.5% | | | | | | | | |
| JTC PLC | | | 84,123 | | | | 640,423 | |
| | | | | | | | | |
| Luxembourg | 1.1% | | | | | | | | |
| Stabilus SA | | | 6,311 | | | | 444,884 | |
| | | | | | | | | |
| Netherlands | 6.4% | | | | | | | | |
| Aalberts NV | | | 11,844 | | | | 524,948 | |
| Arcadis NV (*) | | | 19,248 | | | | 636,360 | |
| ASM International NV | | | 3,923 | | | | 857,656 | |
| Meltwater Holding BV (*) | | | 23,801 | | | | 139,349 | |
| Van Lanschot Kempen NV (*) | | | 19,990 | | | | 513,079 | |
| | | | | | | | 2,671,392 | |
| New Zealand | 1.1% | | | | | | | | |
| Freightways, Ltd. | | | 64,161 | | | | 464,775 | |
| | | | | | | | | |
| Norway | 0.9% | | | | | | | | |
| Crayon Group Holding ASA (*) | | | 25,459 | | | | 373,432 | |
| | | | | | | | | |
| Singapore | 1.0% | | | | | | | | |
| XP Power, Ltd. | | | 6,556 | | | | 421,756 | |
The accompanying notes are an integral part of these financial statements.
Annual Report 129
| Description | | Shares | | | Fair
Value | |
| | | | | | | |
| Lazard International Small Cap Equity Portfolio (continued) | | | | | | | | |
| | | | | | | | | |
| Spain | 1.7% | | | | | | | | |
| Bankinter SA | | | 73,820 | | | $ | 399,458 | |
| Merlin Properties Socimi SA REIT | | | 31,951 | | | | 303,849 | |
| | | | | | | | 703,307 | |
| Sweden | 5.8% | | | | | | | | |
| Getinge AB, B Shares | | | 15,402 | | | | 359,501 | |
| Karnov Group AB | | | 112,856 | | | | 813,958 | |
| Lindab International AB | | | 23,571 | | | | 487,987 | |
| Nordnet AB publ (*) | | | 13,582 | | | | 213,116 | |
| Stillfront Group AB (*) | | | 45,230 | | | | 549,360 | |
| | | | | | | | 2,423,922 | |
| Switzerland | 0.9% | | | | | | | | |
| Swissquote Group Holding SA | | | 4,068 | | | | 395,273 | |
| | | | | | | | | |
| United Kingdom | 15.1% | | | | | | | | |
| Ascential PLC (*) | | | 61,448 | | | | 323,925 | |
| Auto Trader Group PLC (*) | | | 69,505 | | | | 566,855 | |
| Bellway PLC | | | 11,743 | | | | 475,240 | |
| Britvic PLC | | | 37,611 | | | | 417,847 | |
| Bytes Technology Group PLC (*) | | | 52,697 | | | | 241,412 | |
| Dechra Pharmaceuticals PLC | | | 6,732 | | | | 317,760 | |
| Electrocomponents PLC | | | 43,744 | | | | 521,207 | |
| GB Group PLC | | | 22,081 | | | | 283,289 | |
| JD Sports Fashion PLC (*) | | | 37,602 | | | | 442,999 | |
| Pennon Group PLC | | | 45,673 | | | | 594,996 | |
| Polypipe Group PLC (*) | | | 71,806 | | | | 590,192 | |
| Smart Metering Systems PLC | | | 43,478 | | | | 422,876 | |
| Synthomer PLC | | | 117,089 | | | | 720,418 | |
| The Weir Group PLC (*) | | | 15,619 | | | | 425,437 | |
| | | | | | | | 6,344,453 | |
| United States | 1.0% | | | | | | | | |
| Nexteer Automotive Group, Ltd. | | | 396,000 | | | | 426,629 | |
| | | | | | | | | |
Total Common Stocks
(Cost $31,692,603) | | | | | | | 41,160,534 | |
The accompanying notes are an integral part of these financial statements.
130 Annual Report
| Description | | Shares | | | Fair
Value | |
| | | | | | | |
| Lazard International Small Cap Equity Portfolio (concluded) | | | | | | | | |
| | | | | | | | | |
| Short-Term Investments | 1.6% | | | | | | | | |
State Street Institutional Treasury Money Market Fund, Premier Class, 0.01% (7 day yield)
(Cost $689,364) | | | 689,364 | | | $ | 689,364 | |
| | | | | | | | | |
Total Investments | 99.7%
(Cost $32,381,967) | | | | | | $ | 41,849,898 | |
| | | | | | | | | |
| Cash and Other Assets in Excess of Liabilities | 0.3% | | | | | | | 105,290 | |
| | | | | | | | | |
| Net Assets | 100.0% | | | | | | $ | 41,955,188 | |
The accompanying notes are an integral part of these financial statements.
Annual Report 131
| Description | | Shares | | | Fair
Value | |
| | | | | | | |
| Lazard International Strategic Equity Portfolio | | | | | | | | |
| | | | | | | | | |
| Common Stocks | 95.6% | | | | | | | | |
| | | | | | | | | |
| Brazil | 0.8% | | | | | | | | |
| Lojas Renner SA | | | 5,855,300 | | | $ | 49,371,448 | |
| | | | | | | | | |
| Canada | 6.7% | | | | | | | | |
| CAE, Inc. | | | 6,031,256 | | | | 167,116,348 | |
| National Bank of Canada | | | 1,935,191 | | | | 108,914,355 | |
| Suncor Energy, Inc. | | | 3,655,971 | | | | 61,320,591 | |
| TMX Group, Ltd. | | | 582,771 | | | | 58,208,426 | |
| | | | | | | | 395,559,720 | |
| China | 5.1% | | | | | | | | |
| Alibaba Group Holding, Ltd. Sponsored ADR (*) | | | 280,550 | | | | 65,292,401 | |
| Autohome, Inc. ADR | | | 441,521 | | | | 43,984,322 | |
| Kingsoft Cloud Holdings, Ltd. ADR (*) | | | 767,304 | | | | 33,416,089 | |
| Ping An Bank Co., Ltd., Class A | | | 25,603,382 | | | | 75,867,874 | |
| Ping An Insurance (Group) Co. of China, Ltd., Class H | | | 4,717,248 | | | | 57,942,132 | |
| Tencent Holdings, Ltd. | | | 356,140 | | | | 26,022,162 | |
| | | | | | | | 302,524,980 | |
| Denmark | 3.0% | | | | | | | | |
| Carlsberg AS, Class B | | | 639,559 | | | | 102,532,914 | |
| Genmab A/S (*) | | | 192,989 | | | | 78,060,494 | |
| | | | | | | | 180,593,408 | |
| Finland | 1.6% | | | | | | | | |
| Sampo Oyj, A Shares | | | 2,268,132 | | | | 96,190,110 | |
| | | | | | | | | |
| France | 12.2% | | | | | | | | |
| Alstom SA (*) | | | 1,430,418 | | | | 81,117,437 | |
| Engie SA (*) | | | 8,725,871 | | | | 133,603,914 | |
| Pernod Ricard SA | | | 583,191 | | | | 111,790,860 | |
| Safran SA (*) | | | 690,981 | | | | 97,995,235 | |
| Sanofi | | | 1,768,661 | | | | 170,888,984 | |
| Vivendi SA | | | 3,939,079 | | | | 127,029,753 | |
| | | | | | | | 722,426,183 | |
The accompanying notes are an integral part of these financial statements.
132 Annual Report
| Description | | Shares | | | Fair
Value | |
| | | | | | | |
| Lazard International Strategic Equity Portfolio (continued) | | | | | | | | |
| | | | | | | | | |
| Germany | 4.8% | | | | | | | | |
| Beiersdorf AG | | | 636,510 | | | $ | 73,385,090 | |
| Infineon Technologies AG | | | 1,740,699 | | | | 66,802,219 | |
| Rational AG | | | 46,504 | | | | 43,270,179 | |
| Vonovia SE | | | 1,408,787 | | | | 102,731,562 | |
| | | | | | | | 286,189,050 | |
| Hong Kong | 2.5% | | | | | | | | |
| ESR Cayman, Ltd. (*) | | | 24,445,800 | | | | 87,859,327 | |
| Sands China, Ltd. | | | 13,832,800 | | | | 60,803,684 | |
| | | | | | | | 148,663,011 | |
| India | 1.2% | | | | | | | | |
| Housing Development Finance Corp., Ltd. | | | 2,084,950 | | | | 73,515,802 | |
| | | | | | | | | |
| Ireland | 1.7% | | | | | | | | |
| Ryanair Holdings PLC Sponsored ADR (*) | | | 901,661 | | | | 99,164,677 | |
| | | | | | | | | |
| Israel | 1.6% | | | | | | | | |
| Bank Leumi Le-Israel BM | | | 15,700,932 | | | | 92,674,328 | |
| | | | | | | | | |
| Italy | 2.3% | | | | | | | | |
| Enel SpA | | | 13,734,272 | | | | 138,693,689 | |
| | | | | | | | | |
| Japan | 12.3% | | | | | | | | |
| Daikin Industries, Ltd. | | | 279,000 | | | | 62,137,983 | |
| FANUC Corp. | | | 338,900 | | | | 83,443,058 | |
| Makita Corp. | | | 2,837,891 | | | | 142,457,145 | |
| Nexon Co., Ltd. | | | 3,541,835 | | | | 109,081,223 | |
| Nintendo Co., Ltd. | | | 266,150 | | | | 169,854,053 | |
| Suzuki Motor Corp. | | | 1,869,272 | | | | 86,784,367 | |
| Yamaha Corp. | | | 1,318,072 | | | | 77,696,140 | |
| | | | | | | | 731,453,969 | |
| Mexico | 1.0% | | | | | | | | |
| Arca Continental SAB de CV | | | 11,931,200 | | | | 57,367,131 | |
| | | | | | | | | |
| Netherlands | 1.2% | | | | | | | | |
| JDE Peet’s NV (*) | | | 1,522,927 | | | | 68,651,729 | |
The accompanying notes are an integral part of these financial statements.
Annual Report 133
| Description | | Shares | | | Fair
Value | |
| | | | | | | |
| Lazard International Strategic Equity Portfolio (continued) | | | | | | | | |
| | | | | | | | | |
| Portugal | 0.9% | | | | | | | | |
| Energias de Portugal SA | | | 8,470,218 | | | $ | 53,374,796 | |
| | | | | | | | | |
| Spain | 5.7% | | | | | | | | |
| Bankinter SA | | | 12,127,123 | | | | 65,622,748 | |
| Industria de Diseno Textil SA | | | 3,816,497 | | | | 121,524,610 | |
| Siemens Gamesa Renewable Energy SA | | | 3,738,528 | | | | 151,769,594 | |
| | | | | | | | 338,916,952 | |
| Sweden | 1.0% | | | | | | | | |
| Hexagon AB, B Shares | | | 668,510 | | | | 60,876,848 | |
| | | | | | | | | |
| Switzerland | 5.7% | | | | | | | | |
| ABB, Ltd. | | | 4,757,260 | | | | 133,066,935 | |
| Idorsia, Ltd. (*) | | | 920,279 | | | | 26,511,738 | |
| Julius Baer Group, Ltd. | | | 1,685,365 | | | | 97,623,811 | |
| Partners Group Holding AG | | | 66,975 | | | | 78,232,937 | |
| | | | | | | | 335,435,421 | |
| United Kingdom | 17.4% | | | | | | | | |
| Coca-Cola European Partners PLC | | | 3,015,552 | | | | 145,602,845 | |
| Compass Group PLC | | | 3,180,612 | | | | 59,351,537 | |
| Informa PLC (*) | | | 15,932,299 | | | | 119,723,505 | |
| InterContinental Hotels Group PLC (*) | | | 1,028,364 | | | | 66,805,094 | |
| Linde PLC | | | 238,833 | | | | 62,025,836 | |
| Prudential PLC | | | 6,473,838 | | | | 119,495,629 | |
| RELX PLC | | | 5,649,006 | | | | 138,948,154 | |
| Rio Tinto PLC | | | 2,308,818 | | | | 172,754,792 | |
| Tesco PLC | | | 36,859,712 | | | | 116,371,858 | |
| THG Holdings, PLC (*) | | | 2,548,090 | | | | 27,208,244 | |
| | | | | | | | 1,028,287,494 | |
| United States | 6.9% | | | | | | | | |
| Accenture PLC, Class A | | | 391,296 | | | | 102,210,428 | |
| Aon PLC, Class A | | | 734,494 | | | | 155,176,548 | |
| Medtronic PLC | | | 1,290,844 | | | | 151,209,466 | |
| | | | | | | | 408,596,442 | |
Total Common Stocks
(Cost $4,162,460,832) | | | | | | | 5,668,527,188 | |
The accompanying notes are an integral part of these financial statements.
134 Annual Report
| Description | | Shares | | | Fair
Value | |
| | | | | | | |
| Lazard International Strategic Equity Portfolio (concluded) | | | | | | | | |
| | | | | | | | | |
| Preferred Stocks | 2.8% | | | | | | | | |
| | | | | | | | | |
| Germany | 2.8% | | | | | | | | |
Volkswagen AG
(Cost $159,366,195) | | | 886,088 | | | $ | 165,087,256 | |
| | | | | | | | | |
| Short-Term Investments | 1.5% | | | | | | | | |
State Street Institutional Treasury Money Market Fund, Premier Class, 0.01% (7 day yield)
(Cost $86,117,830) | | | 86,117,830 | | | | 86,117,830 | |
| | | | | | | | | |
Total Investments | 99.9%
(Cost $4,407,944,857) | | | | | | $ | 5,919,732,274 | |
| | | | | | | | | |
| Cash and Other Assets in Excess of Liabilities | 0.1% | | | | | | | 4,842,513 | |
| | | | | | | | | |
| Net Assets | 100.0% | | | | | | $ | 5,924,574,787 | |
The accompanying notes are an integral part of these financial statements.
Annual Report 135
| Description | | Shares | | | Fair
Value | |
| | | | | | | | | |
| Lazard Managed Equity Volatility Portfolio | | | | | | | | |
| | | | | | | | | |
| Common Stocks | 99.3% | | | | | | | | |
| | | | | | | | | |
| Australia | 1.4% | | | | | | | | |
| AGL Energy, Ltd. | | | 15,827 | | | $ | 145,933 | |
| Ansell, Ltd. | | | 2,302 | | | | 61,840 | |
| CSL, Ltd. | | | 316 | | | | 69,048 | |
| Fortescue Metals Group, Ltd. | | | 5,088 | | | | 91,993 | |
| | | | | | | | 368,814 | |
| Belgium | 0.5% | | | | | | | | |
| Etablissements Franz Colruyt NV | | | 1,284 | | | | 76,077 | |
| Telenet Group Holding NV | | | 1,521 | | | | 65,243 | |
| | | | | | | | 141,320 | |
| Canada | 2.5% | | | | | | | | |
| Constellation Software, Inc. | | | 53 | | | | 68,823 | |
| Empire Co., Ltd., Class A | | | 4,904 | | | | 134,033 | |
| George Weston, Ltd. | | | 617 | | | | 46,087 | |
| Quebecor, Inc., Class B | | | 7,985 | | | | 205,506 | |
| Rogers Communications, Inc., Class B | | | 4,265 | | | | 198,558 | |
| Topicus.com, Inc. (*) | | | 98 | | | | 370 | |
| | | | | | | | 653,377 | |
| Denmark | 2.0% | | | | | | | | |
| Coloplast A/S, Class B | | | 1,053 | | | | 160,858 | |
| Novo Nordisk A/S, Class B | | | 5,063 | | | | 354,134 | |
| | | | | | | | 514,992 | |
| Finland | 0.5% | | | | | | | | |
| Elisa Oyj | | | 1,202 | | | | 65,616 | |
| Valmet Oyj | | | 2,178 | | | | 62,266 | |
| | | | | | | | 127,882 | |
| France | 1.3% | | | | | | | | |
| Carrefour SA | | | 983 | | | | 16,855 | |
| Cie Generale des Etablissements Michelin SCA | | | 468 | | | | 60,062 | |
| Orange SA | | | 12,199 | | | | 145,188 | |
| Schneider Electric SE | | | 816 | | | | 118,031 | |
| | | | | | | | 340,136 | |
The accompanying notes are an integral part of these financial statements.
136 Annual Report
| Description | | Shares | | | Fair
Value | |
| | | | | | | | | |
| Lazard Managed Equity Volatility Portfolio (continued) | | | | | | | | |
| | | | | | | | | |
| Hong Kong | 2.5% | | | | | | | | |
| CK Hutchison Holdings, Ltd. | | | 24,000 | | | $ | 167,597 | |
| CLP Holdings, Ltd. | | | 10,500 | | | | 97,202 | |
| Hysan Development Co., Ltd. | | | 18,000 | | | | 66,202 | |
| Jardine Matheson Holdings, Ltd. | | | 1,300 | | | | 72,810 | |
| Sun Hung Kai Properties, Ltd. | | | 19,000 | | | | 245,295 | |
| | | | | | | | 649,106 | |
| Israel | 0.4% | | | | | | | | |
| Bezeq The Israeli Telecommunication Corp., Ltd. (*) | | | 33,716 | | | | 33,861 | |
| Plus500, Ltd. | | | 3,047 | | | | 60,442 | |
| | | | | | | | 94,303 | |
| Japan | 15.6% | | | | | | | | |
| AGC, Inc. | | | 2,100 | | | | 73,340 | |
| Ajinomoto Co., Inc. | | | 6,900 | | | | 156,365 | |
| Chubu Electric Power Co., Inc. | | | 8,600 | | | | 103,549 | |
| Daito Trust Construction Co., Ltd. | | | 700 | | | | 65,470 | |
| Daiwa Securities Group, Inc. | | | 29,800 | | | | 135,915 | |
| DCM Holdings Co., Ltd. | | | 12,800 | | | | 145,906 | |
| East Japan Railway Co. | | | 3,300 | | | | 220,900 | |
| Electric Power Development Co., Ltd. | | | 8,800 | | | | 122,038 | |
| Fuji Media Holdings, Inc. | | | 4,700 | | | | 50,169 | |
| FUJIFILM Holdings Corp. | | | 1,100 | | | | 58,014 | |
| ITOCHU Corp. | | | 4,000 | | | | 115,205 | |
| Japan Logistics Fund, Inc. REIT | | | 39 | | | | 115,016 | |
| Japan Post Bank Co., Ltd. | | | 28,700 | | | | 237,093 | |
| Japan Post Holdings Co., Ltd. | | | 13,400 | | | | 104,395 | |
| K’s Holdings Corp. | | | 4,900 | | | | 68,154 | |
| KDDI Corp. | | | 5,200 | | | | 154,426 | |
| Kyudenko Corp. | | | 2,200 | | | | 71,048 | |
| McDonald’s Holdings Co. Japan, Ltd. | | | 5,200 | | | | 251,823 | |
| Mizuho Financial Group, Inc. | | | 10,960 | | | | 139,708 | |
| MS&AD Insurance Group Holdings, Inc. | | | 4,600 | | | | 140,263 | |
| NEC Corp. | | | 1,100 | | | | 58,897 | |
| Nintendo Co., Ltd. | | | 200 | | | | 127,638 | |
| Nitori Holdings Co., Ltd. | | | 300 | | | | 62,894 | |
| Obayashi Corp. | | | 7,500 | | | | 64,971 | |
The accompanying notes are an integral part of these financial statements.
Annual Report 137
| Description | | Shares | | | Fair
Value | |
| | | | | | | | | |
| Lazard Managed Equity Volatility Portfolio (continued) | | | | | | | | |
| | | | | | | | | |
| Osaka Gas Co., Ltd. | | | 7,600 | | | $ | 155,685 | |
| Rengo Co., Ltd. | | | 6,600 | | | | 55,285 | |
| Sankyo Co., Ltd. | | | 2,400 | | | | 64,933 | |
| Secom Co., Ltd. | | | 1,100 | | | | 101,561 | |
| Seven & I Holdings Co., Ltd. | | | 3,900 | | | | 138,495 | |
| Sumitomo Mitsui Trust Holdings, Inc. | | | 1,600 | | | | 49,612 | |
| Sumitomo Osaka Cement Co., Ltd. | | | 1,600 | | | | 46,964 | |
| Teijin, Ltd. | | | 4,400 | | | | 82,966 | |
| The Hachijuni Bank, Ltd. | | | 20,800 | | | | 69,630 | |
| The Kansai Electric Power Co., Inc. | | | 11,500 | | | | 109,353 | |
| The Shizuoka Bank, Ltd. | | | 9,200 | | | | 67,769 | |
| Tohoku Electric Power Co., Inc. | | | 19,200 | | | | 159,122 | |
| Trend Micro, Inc. | | | 1,300 | | | | 74,843 | |
| | | | | | | | 4,019,415 | |
| Netherlands | 1.9% | | | | | | | | |
| Flow Traders | | | 2,663 | | | | 88,030 | |
| Koninklijke Ahold Delhaize NV | | | 8,188 | | | | 231,231 | |
| Koninklijke KPN NV | | | 25,569 | | | | 77,520 | |
| NN Group NV | | | 2,127 | | | | 93,051 | |
| | | | | | | | 489,832 | |
| New Zealand | 0.6% | | | | | | | | |
| Fisher & Paykel Healthcare Corp., Ltd. Class C | | | 6,494 | | | | 154,214 | |
| | | | | | | | | |
| Norway | 1.9% | | | | | | | | |
| Orkla ASA | | | 35,381 | | | | 358,964 | |
| Telenor ASA | | | 4,496 | | | | 76,143 | |
| Yara International ASA | | | 1,457 | | | | 60,488 | |
| | | | | | | | 495,595 | |
| Singapore | 0.6% | | | | | | | | |
| Singapore Exchange, Ltd. | | | 20,400 | | | | 143,579 | |
| | | | | | | | | |
| Spain | 0.7% | | | | | | | | |
| Corporacion Financiera Alba SA | | | 500 | | | | 23,801 | |
| Iberdrola SA | | | 10,732 | | | | 153,484 | |
| | | | | | | | 177,285 | |
The accompanying notes are an integral part of these financial statements.
138 Annual Report
| Description | | Shares | | | Fair
Value | |
| | | | | | | | | |
| Lazard Managed Equity Volatility Portfolio (continued) | | | | | | | | |
| | | | | | | | | |
| Sweden | 1.1% | | | | | | | | |
| Axfood AB | | | 5,930 | | | $ | 138,221 | |
| Husqvarna AB, B Shares | | | 5,385 | | | | 69,663 | |
| Swedish Match AB | | | 1,052 | | | | 81,721 | |
| | | | | | | | 289,605 | |
| Switzerland | 3.9% | | | | | | | | |
| Credit Suisse Group AG | | | 5,444 | | | | 70,035 | |
| Novartis AG | | | 1,447 | | | | 136,670 | |
| Roche Holding AG | | | 1,254 | | | | 437,531 | |
| Swisscom AG | | | 345 | | | | 185,847 | |
| Tecan Group AG | | | 251 | | | | 123,250 | |
| UBS Group AG | | | 4,139 | | | | 57,890 | |
| | | | | | | | 1,011,223 | |
| United Kingdom | 3.1% | | | | | | | | |
| GlaxoSmithKline PLC | | | 4,278 | | | | 78,386 | |
| J Sainsbury PLC | | | 86,629 | | | | 267,247 | |
| National Grid PLC | | | 10,433 | | | | 124,263 | |
| Rio Tinto, Ltd. | | | 1,625 | | | | 142,731 | |
| Standard Chartered PLC (*) | | | 12,255 | | | | 78,583 | |
| Vodafone Group PLC | | | 61,384 | | | | 101,016 | |
| | | | | | | | 792,226 | |
| United States | 58.8% | | | | | | | | |
| AbbVie, Inc. | | | 1,563 | | | | 167,475 | |
| Accenture PLC, Class A | | | 449 | | | | 117,283 | |
| Activision Blizzard, Inc. | | | 682 | | | | 63,324 | |
| AGCO Corp. | | | 666 | | | | 68,658 | |
| Agilent Technologies, Inc. | | | 613 | | | | 72,634 | |
| Altria Group, Inc. | | | 1,883 | | | | 77,203 | |
| Amdocs, Ltd. | | | 1,333 | | | | 94,550 | |
| American Tower Corp. REIT | | | 228 | | | | 51,177 | |
| American Water Works Co., Inc. | | | 390 | | | | 59,853 | |
| AmerisourceBergen Corp. | | | 1,182 | | | | 115,552 | |
| Apple, Inc. | | | 814 | | | | 108,010 | |
| AptarGroup, Inc. | | | 1,491 | | | | 204,103 | |
| AT&T, Inc. | | | 3,765 | | | | 108,281 | |
| Atmos Energy Corp. | | | 613 | | | | 58,499 | |
| | | | | | | | | |
The accompanying notes are an integral part of these financial statements.
Annual Report 139
| Description | | Shares | | | Fair
Value | |
| | | | | | | | | |
| Lazard Managed Equity Volatility Portfolio (continued) | | | | | | | | |
| | | | | | | | | |
| AutoZone, Inc. (*) | | | 53 | | | $ | 62,828 | |
| Best Buy Co., Inc. | | | 667 | | | | 66,560 | |
| Booz Allen Hamilton Holding Corp. | | | 2,871 | | | | 250,294 | |
| Bristol-Myers Squibb Co. | | | 829 | | | | 51,423 | |
| Broadridge Financial Solutions, Inc. | | | 412 | | | | 63,118 | |
| Cadence Design Systems, Inc. (*) | | | 1,335 | | | | 182,134 | |
| California Water Service Group | | | 1,180 | | | | 63,755 | |
| Campbell Soup Co. | | | 1,978 | | | | 95,636 | |
| Cboe Global Markets, Inc. | | | 675 | | | | 62,856 | |
| Charter Communications, Inc., Class A (*) | | | 305 | | | | 201,773 | |
| Cisco Systems, Inc. | | | 3,902 | | | | 174,615 | |
| CMS Energy Corp. | | | 940 | | | | 57,349 | |
| Colgate-Palmolive Co. | | | 3,350 | | | | 286,458 | |
| Comcast Corp., Class A | | | 2,588 | | | | 135,611 | |
| Costco Wholesale Corp. | | | 383 | | | | 144,307 | |
| Cummins, Inc. | | | 564 | | | | 128,084 | |
| CVS Health Corp. | | | 2,715 | | | | 185,435 | |
| DaVita, Inc. (*) | | | 1,015 | | | | 119,161 | |
| Dolby Laboratories, Inc., Class A | | | 549 | | | | 53,324 | |
| Dollar General Corp. | | | 1,392 | | | | 292,738 | |
| Domino’s Pizza, Inc. | | | 464 | | | | 177,925 | |
| DTE Energy Co. | | | 480 | | | | 58,277 | |
| Easterly Government Properties, Inc. REIT | | | 4,999 | | | | 113,227 | |
| Electronic Arts, Inc. | | | 904 | | | | 129,814 | |
| Eli Lilly & Co. | | | 1,561 | | | | 263,559 | |
| Entergy Corp. | | | 885 | | | | 88,358 | |
| Equity Lifestyle Properties, Inc. REIT | | | 999 | | | | 63,297 | |
| Evergy, Inc. | | | 1,216 | | | | 67,500 | |
| Exlservice Holdings, Inc. (*) | | | 744 | | | | 63,337 | |
| Flowers Foods, Inc. | | | 2,298 | | | | 52,004 | |
| General Mills, Inc. | | | 2,077 | | | | 122,128 | |
| Gilead Sciences, Inc. | | | 1,654 | | | | 96,362 | |
| Graco, Inc. | | | 1,621 | | | | 117,279 | |
| Hormel Foods Corp. | | | 3,289 | | | | 153,300 | |
| Humana, Inc. | | | 166 | | | | 68,105 | |
| Huntington Ingalls Industries, Inc. | | | 346 | | | | 58,986 | |
The accompanying notes are an integral part of these financial statements.
140 Annual Report
| Description | | Shares | | | Fair
Value | |
| | | | | | | | | |
| Lazard Managed Equity Volatility Portfolio (continued) | | | | | | | | |
| | | | | | | | | |
| IDEXX Laboratories, Inc. (*) | | | 200 | | | $ | 99,974 | |
| Intuit, Inc. | | | 183 | | | | 69,513 | |
| Jack Henry & Associates, Inc. | | | 875 | | | | 141,741 | |
| JB Hunt Transport Services, Inc.JB Hunt Transport Services, Inc. | | | 610 | | | | 83,357 | |
| Johnson & Johnson | | | 2,440 | | | | 384,007 | |
| Kellogg Co. | | | 2,961 | | | | 184,263 | |
| Kimberly-Clark Corp. | | | 2,375 | | | | 320,221 | |
| La-Z-Boy, Inc. | | | 1,563 | | | | 62,270 | |
| Laboratory Corp. of America Holdings (*) | | | 300 | | | | 61,065 | |
| Lennox International, Inc. | | | 407 | | | | 111,506 | |
| Lockheed Martin Corp. | | | 921 | | | | 326,937 | |
| McDonald’s Corp. | | | 518 | | | | 111,152 | |
| McKesson Corp. | | | 433 | | | | 75,307 | |
| MDU Resources Group, Inc. | | | 2,551 | | | | 67,193 | |
| Merck & Co., Inc. | | | 3,699 | | | | 302,578 | |
| Mettler-Toledo International, Inc. (*) | | | 63 | | | | 71,800 | |
| Microsoft Corp. | | | 769 | | | | 171,041 | |
| Mid-America Apartment Communities, Inc. REIT | | | 436 | | | | 55,237 | |
| Moody’s Corp. | | | 223 | | | | 64,724 | |
| National Fuel Gas Co. | | | 1,467 | | | | 60,338 | |
| Newmont Mining Corp. | | | 1,627 | | | | 97,441 | |
| Northrop Grumman Corp. | | | 634 | | | | 193,192 | |
| O’Reilly Automotive, Inc. (*) | | | 247 | | | | 111,785 | |
| Old Republic International Corp. | | | 4,612 | | | | 90,903 | |
| PennyMac Financial Services, Inc. | | | 1,091 | | | | 71,591 | |
| PepsiCo, Inc. | | | 1,728 | | | | 256,262 | |
| Pfizer, Inc. | | | 1,956 | | | | 72,000 | |
| Philip Morris International, Inc. | | | 846 | | | | 70,040 | |
| Pool Corp. | | | 281 | | | | 104,673 | |
| QUALCOMM, Inc. | | | 894 | | | | 136,192 | |
| Quest Diagnostics, Inc. | | | 734 | | | | 87,471 | |
| Regeneron Pharmaceuticals, Inc. (*) | | | 96 | | | | 46,379 | |
| Republic Services, Inc. | | | 3,499 | | | | 336,954 | |
| S&P Global, Inc. | | | 189 | | | | 62,130 | |
| SBA Communications Corp. REIT | | | 418 | | | | 117,930 | |
The accompanying notes are an integral part of these financial statements.
Annual Report 141
| Description | | Shares | | | Fair
Value | |
| | | | | | | | | |
| Lazard Managed Equity Volatility Portfolio (continued) | | | | | | | | |
| | | | | | | | | |
| Sempra Energy | | | 509 | | | $ | 64,852 | |
| Service Corp. International | | | 4,134 | | | | 202,979 | |
| Silgan Holdings, Inc. | | | 4,120 | | | | 152,770 | |
| Sirius XM Holdings, Inc. | | | 11,199 | | | | 71,338 | |
| Southwest Gas Holdings, Inc. | | | 3,206 | | | | 194,765 | |
| Stepan Co. | | | 503 | | | | 60,018 | |
| STERIS PLC | | | 326 | | | | 61,790 | |
| Sturm Ruger & Co., Inc. | | | 962 | | | | 62,597 | |
| Synopsys, Inc. (*) | | | 1,012 | | | | 262,351 | |
| Target Corp. | | | 2,018 | | | | 356,238 | |
| Terminix Global Holdings, Inc. (*) | | | 1,282 | | | | 65,395 | |
| The Bank of New York Mellon Corp. | | | 2,272 | | | | 96,424 | |
| The Clorox Co. | | | 1,560 | | | | 314,995 | |
| The Hanover Insurance Group, Inc. | | | 784 | | | | 91,665 | |
| The Hershey Co. | | | 1,161 | | | | 176,855 | |
| The Home Depot, Inc. | | | 296 | | | | 78,624 | |
| The J.M. Smucker Co. | | | 566 | | | | 65,430 | |
| The Kroger Co. | | | 3,551 | | | | 112,780 | |
| The New York Times Co. | | | 1,312 | | | | 67,922 | |
| The Procter & Gamble Co. | | | 2,519 | | | | 350,494 | |
| Thermo Fisher Scientific, Inc. | | | 439 | | | | 204,477 | |
| Tractor Supply Co. | | | 882 | | | | 123,992 | |
| UnitedHealth Group, Inc. | | | 206 | | | | 72,240 | |
| Verizon Communications, Inc. | | | 5,801 | | | | 340,809 | |
| Vertex Pharmaceuticals, Inc. (*) | | | 204 | | | | 48,213 | |
| Viatris, Inc. (*) | | | 2,852 | | | | 53,446 | |
| Walmart, Inc. | | | 2,388 | | | | 344,230 | |
| Waste Management, Inc. | | | 1,187 | | | | 139,983 | |
| WEC Energy Group, Inc. | | | 1,091 | | | | 100,405 | |
| Weis Markets, Inc. | | | 949 | | | | 45,372 | |
| Werner Enterprises, Inc. | | | 1,232 | | | | 48,319 | |
| West Pharmaceutical Services, Inc. | | | 361 | | | | 102,275 | |
| WW Grainger, Inc. | | | 124 | | | | 50,634 | |
| Xcel Energy, Inc. | | | 1,029 | | | | 68,603 | |
| Zoetis, Inc. | | | 629 | | | | 104,100 | |
| | | | | | | | 15,174,066 | |
The accompanying notes are an integral part of these financial statements.
142 Annual Report
| Description | | Shares | | | Fair
Value | |
| | | | | | | | | |
| Lazard Managed Equity Volatility Portfolio (concluded) | | | | | | | | |
| | | | | | | | |
Total Common Stocks
(Cost $23,943,315) | | | | | | $ | 25,636,970 | |
| | | | | | | | | |
| Short-Term Investments | 0.6% | | | | | | | | |
State Street Institutional Treasury Money Market Fund, Premier Class, 0.01% (7 day yield)
(Cost $160,040) | | | 160,040 | | | | 160,040 | |
| | | | | | | | |
Total Investments | 99.9%
(Cost $24,103,355) | | | | | | $ | 25,797,010 | |
| | | | | | | | | |
| Cash and Other Assets in Excess of Liabilities | 0.1% | | | | | | | 16,702 | |
| | | | | | | | | |
| Net Assets | 100.0% | | | | | | $ | 25,813,712 | |
The accompanying notes are an integral part of these financial statements.
Annual Report 143
| Description | | Shares | | | Fair
Value | |
| | | | | | | | | |
| Lazard US Equity Concentrated Portfolio | | | | | | | | |
| | | | | | | | | |
| Common Stocks | 97.4% | | | | | | | | |
| | | | | | | | | |
| Building Products | 2.8% | | | | | | | | |
| Armstrong World Industries, Inc. | | | 742,162 | | | $ | 55,209,431 | |
| | | | | | | | | |
| Capital Markets | 9.3% | | | | | | | | |
| Intercontinental Exchange, Inc. | | | 886,001 | | | | 102,147,055 | |
| S&P Global, Inc. | | | 245,239 | | | | 80,617,417 | |
| | | | | | | | 182,764,472 | |
| Commercial Services & Supplies | 3.6% | | | | | | | | |
| Waste Management, Inc. | | | 597,466 | | | | 70,459,165 | |
| | | | | | | | | |
| Construction Materials | 3.8% | | | | | | | | |
| Vulcan Materials Co. | | | 509,424 | | | | 75,552,674 | |
| | | | | | | | | |
| Distributors | 1.6% | | | | | | | | |
| LKQ Corp. (*) | | | 913,885 | | | | 32,205,308 | |
| | | | | | | | | |
| Electronic Equipment, Instruments & Components | 3.4% | | | | | | | | |
| CDW Corp. | | | 156,835 | | | | 20,669,285 | |
| Zebra Technologies Corp., Class A (*) | | | 122,001 | | | | 46,888,644 | |
| | | | | | | | 67,557,929 | |
| Entertainment | 1.0% | | | | | | | | |
| Electronic Arts, Inc. | | | 136,239 | | | | 19,563,920 | |
| | | | | | | | | |
| Equity Real Estate Investment Trusts (REITs) | 9.2% | | | | | | | | |
| Crown Castle International Corp., REIT | | | 473,809 | | | | 75,425,655 | |
| Public Storage REIT | | | 456,065 | | | | 105,319,090 | |
| | | | | | | | 180,744,745 | |
| Food & Staples Retailing | 1.6% | | | | | | | | |
| Sysco Corp. | | | 414,052 | | | | 30,747,502 | |
| | | | | | | | | |
| Health Care Equipment & Supplies | 12.9% | | | | | | | | |
| Baxter International, Inc. | | | 1,053,608 | | | | 84,541,506 | |
| Medtronic PLC | | | 1,457,709 | | | | 170,756,032 | |
| | | | | | | | 255,297,538 | |
The accompanying notes are an integral part of these financial statements.
144 Annual Report
| Description | | Shares | | | Fair
Value | |
| | | | | | | | | |
| Lazard US Equity Concentrated Portfolio (continued) | | | | | | | | |
| | | | | | | | | |
| Hotels, Restaurants & Leisure | 6.7% | | | | | | | | |
| McDonald’s Corp. | | | 390,218 | | | $ | 83,732,979 | |
| Starbucks Corp. | | | 459,085 | | | | 49,112,913 | |
| | | | | | | | 132,845,892 | |
| Interactive Media & Services | 7.9% | | | | | | | | |
| Alphabet, Inc., Class A (*) | | | 88,727 | | | | 155,506,489 | |
| | | | | | | | | |
| IT Services | 9.7% | | | | | | | | |
| Fiserv, Inc. (*) | | | 1,315,879 | | | | 149,825,983 | |
| Visa, Inc., Class A | | | 195,158 | | | | 42,686,909 | |
| | | | | | | | 192,512,892 | |
| Leisure Products | 2.1% | | | | | | | | |
| Brunswick Corp. | | | 536,254 | | | | 40,884,005 | |
| | | | | | | | | |
| Life Sciences Tools & Services | 1.2% | | | | | | | | |
| Sotera Health Co. (*) | | | 874,938 | | | | 24,008,299 | |
| | | | | | | | | |
| Multiline Retail | 3.8% | | | | | | | | |
| Dollar Tree, Inc. (*) | | | 687,952 | | | | 74,326,334 | |
| | | | | | | | | |
| Road & Rail | 1.8% | | | | | | | | |
| Norfolk Southern Corp. | | | 152,279 | | | | 36,183,013 | |
| | | | | | | | | |
| Semiconductors & Semiconductor Equipment | 11.3% | | | | | | | | |
| Analog Devices, Inc. | | | 902,051 | | | | 133,259,994 | |
| Skyworks Solutions, Inc. | | | 593,957 | | | | 90,804,146 | |
| | | | | | | | 224,064,140 | |
| Specialty Retail | 3.7% | | | | | | | | |
| Lowe’s Cos., Inc. | | | 450,638 | | | | 72,331,905 | |
| | | | | | | | | |
Total Common Stocks
(Cost $1,355,070,121) | | | | | | | 1,922,765,653 | |
The accompanying notes are an integral part of these financial statements.
Annual Report 145
| Description | | Shares | | | Fair
Value | |
| | | | | | | | | |
| Lazard US Equity Concentrated Portfolio (concluded) | | | | | | | | |
| | | | | | | | | |
| Short-Term Investments | 2.5% | | | | | | | | |
State Street Institutional Treasury Money Market Fund, Premier Class, 0.01% (7 day yield)
(Cost $48,536,284) | | | 48,536,284 | | | $ | 48,536,284 | |
| | | | | | | | |
Total Investments | 99.9%
(Cost $1,403,606,405) | | | | | | $ | 1,971,301,937 | |
| | | | | | | | |
| Cash and Other Assets in Excess of Liabilities | 0.1% | | | | | | | 1,600,322 | |
| | | | | | | | | |
| Net Assets | 100.0% | | | | | | $ | 1,972,902,259 | |
The accompanying notes are an integral part of these financial statements.
146 Annual Report
| Description | | Shares | | | Fair
Value | |
| | | | | | | | | |
| Lazard US Equity Focus Portfolio | | | | | | | | |
| | | | | | | | | |
| Common Stocks | 98.9% | | | | | | | | |
| | | | | | | | | |
| Auto Components | 1.1% | | | | | | | | |
| Aptiv PLC | | | 4,551 | | | $ | 592,950 | |
| | | | | | | | | |
| Banks | 5.4% | | | | | | | | |
| Bank of America Corp. | | | 71,738 | | | | 2,174,379 | |
| Commerce Bancshares, Inc. | | | 10,437 | | | | 685,711 | |
| | | | | | | | 2,860,090 | |
| Beverages | 3.4% | | | | | | | | |
| The Coca-Cola Co. | | | 32,935 | | | | 1,806,155 | |
| | | | | | | | | |
| Capital Markets | 6.2% | | | | | | | | |
| Intercontinental Exchange, Inc. | | | 22,156 | | | | 2,554,365 | |
| The Charles Schwab Corp. | | | 13,533 | | | | 717,791 | |
| | | | | | | | 3,272,156 | |
| Commercial Services & Supplies | 3.0% | | | | | | | | |
| Waste Management, Inc. | | | 13,548 | | | | 1,597,716 | |
| | | | | | | | | |
| Communications Equipment | 2.7% | | | | | | | | |
| Cisco Systems, Inc. | | | 32,096 | | | | 1,436,296 | |
| | | | | | | | | |
| Consumer Finance | 3.3% | | | | | | | | |
| American Express Co. | | | 14,606 | | | | 1,766,011 | |
| | | | | | | | | |
| Entertainment | 1.3% | | | | | | | | |
| Electronic Arts, Inc. | | | 4,910 | | | | 705,076 | |
| | | | | | | | | |
| Food & Staples Retailing | 2.3% | | | | | | | | |
| Sysco Corp. | | | 16,243 | | | | 1,206,205 | |
| | | | | | | | | |
| Health Care Equipment & Supplies | 9.9% | | | | | | | | |
| Danaher Corp. | | | 9,222 | | | | 2,048,575 | |
| Medtronic PLC | | | 27,306 | | | | 3,198,625 | |
| | | | | | | | 5,247,200 | |
The accompanying notes are an integral part of these financial statements.
Annual Report 147
| Description | | Shares | | | Fair
Value | |
| | | | | | | | | |
| Lazard US Equity Focus Portfolio (continued) | | | | | | | | |
| | | | | | | | | |
| Hotels, Restaurants & Leisure | 6.4% | | | | | | | | |
| McDonald’s Corp. | | | 9,821 | | | $ | 2,107,390 | |
| Starbucks Corp. | | | 12,096 | | | | 1,294,030 | |
| | | | | | | | 3,401,420 | |
| Industrial Conglomerates | 4.5% | | | | | | | | |
| Honeywell International, Inc. | | | 11,138 | | | | 2,369,053 | |
| | | | | | | | | |
| Insurance | 3.0% | | | | | | | | |
| Marsh & McLennan Cos., Inc. | | | 13,653 | | | | 1,597,401 | |
| | | | | | | | | |
| Interactive Media & Services | 7.1% | | | | | | | | |
| Alphabet, Inc., Class A (*) | | | 2,156 | | | | 3,778,692 | |
| | | | | | | | | |
| IT Services | 5.9% | | | | | | | | |
| Visa, Inc., Class A | | | 14,392 | | | | 3,147,962 | |
| | | | | | | | | |
| Life Sciences Tools & Services | 2.2% | | | | | | | | |
| IQVIA Holdings, Inc. (*) | | | 6,467 | | | | 1,158,692 | |
| | | | | | | | | |
| Multiline Retail | 2.1% | | | | | | | | |
| Dollar Tree, Inc. (*) | | | 10,539 | | | | 1,138,634 | |
| | | | | | | | | |
| Pharmaceuticals | 5.8% | | | | | | | | |
| Johnson & Johnson | | | 19,402 | | | | 3,053,487 | |
| | | | | | | | | |
| Road & Rail | 4.2% | | | | | | | | |
| Norfolk Southern Corp. | | | 9,461 | | | | 2,248,028 | |
| | | | | | | | | |
| Semiconductors & Semiconductor Equipment | 5.4% | | | | | | | | |
| Analog Devices, Inc. | | | 19,282 | | | | 2,848,530 | |
| | | | | | | | | |
| Software | 7.5% | | | | | | | | |
| Microsoft Corp. | | | 17,833 | | | | 3,966,416 | |
The accompanying notes are an integral part of these financial statements.
148 Annual Report
| Description | | Shares | | | Fair
Value | |
| | | | | | | | | |
| Lazard US Equity Focus Portfolio (concluded) | | | | | | | | |
| | | | | | | | | |
| Specialty Retail | 6.2% | | | | | | | | |
| Lowe’s Cos., Inc. | | | 15,462 | | | $ | 2,481,805 | |
| Ross Stores, Inc. | | | 6,707 | | | | 823,687 | |
| | | | | | | | 3,305,492 | |
| | | | | | | | | |
Total Common Stocks
(Cost $36,118,304) | | | | | | | 52,503,662 | |
| | | | | | | | | |
| Short-Term Investments | 1.2% | | | | | | | | |
State Street Institutional Treasury Money Market Fund, Premier Class, 0.01% (7 day yield)
(Cost $635,125) | | | 635,125 | | | | 635,125 | |
| | | | | | | | | |
Total Investments | 100.1%
(Cost $36,753,429) | | | | | | $ | 53,138,787 | |
| | | | | | | | | |
| Liabilities in Excess of Cash and Other Assets | (0.1)% | | | | | | | (31,036 | ) |
| | | | | | | | | |
| Net Assets | 100.0% | | | | | | $ | 53,107,751 | |
The accompanying notes are an integral part of these financial statements.
Annual Report 149
| Description | | Shares | | | Fair
Value | |
| | | | | | | | | |
| Lazard US Small-Mid Cap Equity Portfolio | | | | | | | | |
| | | | | | | | | |
| Common Stocks | 98.6% | | | | | | | | |
| | | | | | | | | |
| Aerospace & Defense | 2.4% | | | | | | | | |
| Curtiss-Wright Corp. | | | 14,721 | | | $ | 1,712,788 | |
| HEICO Corp. | | | 6,166 | | | | 816,379 | |
| | | | | | | | 2,529,167 | |
| Air Freight & Logistics | 0.9% | | | | | | | | |
| Echo Global Logistics, Inc. (*) | | | 32,845 | | | | 880,903 | |
| | | | | | | | | |
| Airlines | 0.8% | | | | | | | | |
| Alaska Air Group, Inc. | | | 15,755 | | | | 819,260 | |
| | | | | | | | | |
| Auto Components | 0.8% | | | | | | | | |
| Gentherm, Inc. (*) | | | 13,313 | | | | 868,274 | |
| | | | | | | | | |
| Banks | 6.2% | | | | | | | | |
| Citizens Financial Group, Inc. | | | 52,331 | | | | 1,871,357 | |
| Comerica, Inc. | | | 21,680 | | | | 1,211,045 | |
| Commerce Bancshares, Inc. | | | 24,186 | | | | 1,589,020 | |
| Home BancShares, Inc. | | | 91,863 | | | | 1,789,491 | |
| | | | | | | | 6,460,913 | |
| Biotechnology | 4.1% | | | | | | | | |
| Emergent Biosolutions, Inc. (*) | | | 13,683 | | | | 1,225,997 | |
| Exelixis, Inc. (*) | | | 66,002 | | | | 1,324,660 | |
| United Therapeutics Corp. (*) | | | 11,351 | | | | 1,722,968 | |
| | | | | | | | 4,273,625 | |
| Building Products | 2.6% | | | | | | | | |
| Armstrong World Industries, Inc. | | | 16,162 | | | | 1,202,291 | |
| PGT Innovations, Inc. (*) | | | 75,071 | | | | 1,526,944 | |
| | | | | | | | 2,729,235 | |
| Capital Markets | 1.6% | | | | | | | | |
| Morningstar, Inc. | | | 7,164 | | | | 1,658,967 | |
The accompanying notes are an integral part of these financial statements.
150 Annual Report
| Description | | Shares | | | Fair
Value | |
| | | | | | | | | |
| Lazard US Small-Mid Cap Equity Portfolio (continued) | | | | | | | | |
| | | | | | | | | |
| Chemicals | 2.9% | | | | | | | | |
| Ingevity Corp. (*) | | | 20,156 | | | $ | 1,526,414 | |
| Innospec, Inc. | | | 16,071 | | | | 1,458,122 | |
| | | | | | | | 2,984,536 | |
| Communications Equipment | 2.6% | | | | | | | | |
| Ciena Corp. (*) | | | 18,228 | | | | 963,350 | |
| F5 Networks, Inc. (*) | | | 9,894 | | | | 1,740,750 | |
| | | | | | | | 2,704,100 | |
| Construction & Engineering | 1.8% | | | | | | | | |
| Valmont Industries, Inc. | | | 10,920 | | | | 1,910,236 | |
| | | | | | | | | |
| Construction Materials | 1.4% | | | | | | | | |
| Eagle Materials, Inc. | | | 14,347 | | | | 1,454,068 | |
| | | | | | | | | |
| Containers & Packaging | 2.4% | | | | | | | | |
| Avery Dennison Corp. | | | 7,242 | | | | 1,123,307 | |
| Graphic Packaging Holding Co. | | | 81,547 | | | | 1,381,406 | |
| | | | | | | | 2,504,713 | |
| Electrical Equipment | 2.2% | | | | | | | | |
| Atkore International Group, Inc. (*) | | | 25,659 | | | | 1,054,842 | |
| EnerSys | | | 14,272 | | | | 1,185,432 | |
| | | | | | | | 2,240,274 | |
| Electronic Equipment, Instruments & Components | 1.0% | | | | | | | | |
| Zebra Technologies Corp., Class A (*) | | | 2,770 | | | | 1,064,594 | |
| | | | | | | | | |
| Energy Equipment & Services | 1.6% | | | | | | | | |
| Cactus, Inc., Class A | | | 62,241 | | | | 1,622,623 | |
| | | | | | | | | |
| Entertainment | 1.2% | | | | | | | | |
| Take-Two Interactive Software, Inc. (*) | | | 5,901 | | | | 1,226,169 | |
| | | | | | | | | |
| Equity Real Estate Investment Trusts (REITs) | 8.0% | | | | | | | | |
| Alexandria Real Estate Equities, Inc. | | | 9,657 | | | | 1,721,070 | |
| Brixmor Property Group, Inc. | | | 63,166 | | | | 1,045,397 | |
| Camden Property Trust | | | 11,780 | | | | 1,177,058 | |
| Hudson Pacific Properties, Inc. | | | 48,933 | | | | 1,175,371 | |
The accompanying notes are an integral part of these financial statements.
Annual Report 151
| Description | | Shares | | | Fair
Value | |
| | | | | | | | | |
| Lazard US Small-Mid Cap Equity Portfolio (continued) | | | | | | | | |
| | | | | | | | | |
| Invitation Homes, Inc. | | | 17,050 | | | $ | 506,385 | |
| PS Business Parks, Inc. | | | 12,784 | | | | 1,698,610 | |
| Summit Hotel Properties, Inc. | | | 110,390 | | | | 994,614 | |
| | | | | | | | 8,318,505 | |
| Food & Staples Retailing | 1.3% | | | | | | | | |
| Casey’s General Stores, Inc. | | | 7,633 | | | | 1,363,406 | |
| | | | | | | | | |
| Food Products | 1.1% | | | | | | | | |
| Flowers Foods, Inc. | | | 48,121 | | | | 1,088,978 | |
| | | | | | | | | |
| Gas Utilities | 1.6% | | | | | | | | |
| New Jersey Resources Corp. | | | 46,695 | | | | 1,660,007 | |
| | | | | | | | | |
| Health Care Equipment & Supplies | 1.3% | | | | | | | | |
| STERIS PLC | | | 7,175 | | | | 1,359,950 | |
| | | | | | | | | |
| Health Care Providers & Services | 1.4% | | | | | | | | |
| Henry Schein, Inc. (*) | | | 21,136 | | | | 1,413,153 | |
| | | | | | | | | |
| Health Care Technology | 1.1% | | | | | | | | |
| HMS Holdings Corp. (*) | | | 31,555 | | | | 1,159,646 | |
| | | | | | | | | |
| Hotels, Restaurants & Leisure | 1.6% | | | | | | | | |
| Wyndham Hotels & Resorts, Inc. | | | 27,855 | | | | 1,655,701 | |
| | | | | | | | | |
| Household Durables | 1.9% | | | | | | | | |
| Helen of Troy, Ltd. (*) | | | 3,415 | | | | 758,779 | |
| Leggett & Platt, Inc. | | | 27,363 | | | | 1,212,181 | |
| | | | | | | | 1,970,960 | |
| Industrial Conglomerates | 1.5% | | | | | | | | |
| Carlisle Cos., Inc. | | | 9,995 | | | | 1,561,019 | |
The accompanying notes are an integral part of these financial statements.
152 Annual Report
| Description | | Shares | | | Fair
Value | |
| | | | | | | | | |
| Lazard US Small-Mid Cap Equity Portfolio (continued) | | | | | | | | |
| | | | | | | | | |
| Insurance | 4.2% | | | | | | | | |
| Arch Capital Group, Ltd. (*) | | | 45,054 | | | $ | 1,625,098 | |
| Brown & Brown, Inc. | | | 34,304 | | | | 1,626,352 | |
| Reinsurance Group of America, Inc. | | | 9,801 | | | | 1,135,936 | |
| | | | | | | | 4,387,386 | |
| Interactive Media & Services | 1.9% | | | | | | | | |
| Cars.com, Inc. (*) | | | 119,536 | | | | 1,350,757 | |
| MediaAlpha, Inc., Class A | | | 15,402 | | | | 601,756 | |
| | | | | | | | 1,952,513 | |
| IT Services | 4.4% | | | | | | | | |
| Amdocs, Ltd. | | | 22,682 | | | | 1,608,834 | |
| Leidos Holdings, Inc. | | | 15,180 | | | | 1,595,722 | |
| NIC, Inc. | | | 53,827 | | | | 1,390,351 | |
| | | | | | | | 4,594,907 | |
| Leisure Products | 2.6% | | | | | | | | |
| Brunswick Corp. | | | 15,353 | | | | 1,170,513 | |
| Hasbro, Inc. | | | 16,402 | | | | 1,534,243 | |
| | | | | | | | 2,704,756 | |
| Life Sciences Tools & Services | 5.0% | | | | | | | | |
| Adaptive Biotechnologies Corp. (*) | | | 23,695 | | | | 1,401,085 | |
| Charles River Laboratories International, Inc. (*) | | | 5,683 | | | | 1,419,955 | |
| ICON PLC (*) | | | 6,393 | | | | 1,246,507 | |
| Maravai LifeSciences Holdings, Inc., Class A | | | 38,674 | | | | 1,084,806 | |
| | | | | | | | 5,152,353 | |
| Machinery | 3.6% | | | | | | | | |
| Altra Industrial Motion Corp. | | | 22,952 | | | | 1,272,229 | |
| Columbus McKinnon Corp. | | | 13,255 | | | | 509,522 | |
| Ingersoll Rand, Inc. (*) | | | 15,564 | | | | 709,096 | |
| Kennametal, Inc. | | | 33,453 | | | | 1,212,337 | |
| | | | | | | | 3,703,184 | |
| Oil, Gas & Consumable Fuels | 0.4% | | | | | | | | |
| Magnolia Oil & Gas Corp., Class A (*) | | | 64,066 | | | | 452,306 | |
| | | | | | | | | |
| Paper & Forest Products | 1.6% | | | | | | | | |
| Neenah, Inc. | | | 29,004 | | | | 1,604,501 | |
The accompanying notes are an integral part of these financial statements.
Annual Report 153
| Description | | Shares | | | Fair
Value | |
| | | | | | | | | |
| Lazard US Small-Mid Cap Equity Portfolio (concluded) | | | | | | | | |
| | | | | | | | | |
| Pharmaceuticals | 1.4% | | | | | | | | |
| Catalent, Inc. (*) | | | 14,152 | | | $ | 1,472,799 | |
| | | | | | | | | |
| Semiconductors & Semiconductor Equipment | 2.8% | | | | | | | | |
| CMC Materials, Inc. | | | 6,722 | | | | 1,017,039 | |
| MKS Instruments, Inc. | | | 12,622 | | | | 1,898,980 | |
| | | | | | | | 2,916,019 | |
| Software | 6.8% | | | | | | | | |
| Datto Holding Corp. | | | 38,692 | | | | 1,044,684 | |
| j2 Global, Inc. (*) | | | 16,683 | | | | 1,629,762 | |
| PTC, Inc. (*) | | | 10,974 | | | | 1,312,600 | |
| RealPage, Inc. (*) | | | 13,369 | | | | 1,166,312 | |
| SolarWinds Corp. (*) | | | 67,957 | | | | 1,015,957 | |
| Vertex, Inc., Class A | | | 24,988 | | | | 870,832 | |
| | | | | | | | 7,040,147 | |
| Specialty Retail | 2.3% | | | | | | | | |
| Designer Brands, Inc., Class A | | | 115,098 | | | | 880,500 | |
| Floor & Decor Holdings, Inc., Class A (*) | | | 7,311 | | | | 678,826 | |
| Leslie’s, Inc. | | | 27,705 | | | | 768,814 | |
| | | | | | | | 2,328,140 | |
| Textiles, Apparel & Luxury Goods | 3.0% | | | | | | | | |
| Carter’s, Inc. | | | 15,684 | | | | 1,475,394 | |
| Tapestry, Inc. | | | 51,253 | | | | 1,592,943 | |
| | | | | | | | 3,068,337 | |
| Trading Companies & Distributors | 1.3% | | | | | | | | |
| Air Lease Corp. | | | 30,467 | | | | 1,353,344 | |
| | | | | | | | | |
Total Common Stocks
(Cost $76,969,454) | | | | | | | 102,213,674 | |
| | | | | | | | | |
Total Investments | 98.6%
(Cost $76,969,454) | | | | | | $ | 102,213,674 | |
| | | | | | | | | |
| Cash and Other Assets in Excess of Liabilities | 1.4% | | | | | | | 1,418,739 | |
| | | | | | | | | |
| Net Assets | 100.0% | | | | | | $ | 103,632,413 | |
The accompanying notes are an integral part of these financial statements.
154 Annual Report
| Description | | Shares | | | Fair
Value | |
| | | | | | | | | |
| Lazard US Sustainable Equity Portfolio | | | | | | | | |
| | | | | | | | | |
| Common Stocks | 98.0% | | | | | | | | |
| | | | | | | | | |
| Auto Components | 1.0% | | | | | | | | |
| Aptiv PLC | | | 923 | | | $ | 120,258 | |
| | | | | | | | | |
| Banks | 6.2% | | | | | | | | |
| Commerce Bancshares, Inc. | | | 4,549 | | | | 298,869 | |
| The PNC Financial Services Group, Inc. | | | 2,850 | | | | 424,650 | |
| | | | | | | | 723,519 | |
| Capital Markets | 4.5% | | | | | | | | |
| Intercontinental Exchange, Inc. | | | 3,009 | | | | 346,907 | |
| The Charles Schwab Corp. | | | 3,319 | | | | 176,040 | |
| | | | | | | | 522,947 | |
| Chemicals | 2.1% | | | | | | | | |
| Ecolab, Inc. | | | 1,106 | | | | 239,294 | |
| | | | | | | | | |
| Commercial Services & Supplies | 3.2% | | | | | | | | |
| MSA Safety, Inc. | | | 554 | | | | 82,762 | |
| Waste Management, Inc. | | | 2,439 | | | | 287,631 | |
| | | | | | | | 370,393 | |
| Communications Equipment | 2.1% | | | | | | | | |
| Cisco Systems, Inc. | | | 4,124 | | | | 184,549 | |
| Motorola Solutions, Inc. | | | 334 | | | | 56,800 | |
| | | | | | | | 241,349 | |
| Containers & Packaging | 2.2% | | | | | | | | |
| Ball Corp. | | | 2,764 | | | | 257,549 | |
| | | | | | | | | |
| Electrical Equipment | 2.9% | | | | | | | | |
| Rockwell Automation, Inc. | | | 1,353 | | | | 339,346 | |
| | | | | | | | | |
| Entertainment | 2.0% | | | | | | | | |
| The Walt Disney Co. (*) | | | 1,276 | | | | 231,186 | |
| | | | | | | | | |
| Equity Real Estate Investment Trusts (REITs) | 2.2% | | | | | | | | |
| Prologis, Inc., REIT | | | 2,564 | | | | 255,528 | |
The accompanying notes are an integral part of these financial statements.
Annual Report 155
| Description | | Shares | | | Fair
Value | |
| | | | | | | | | |
| Lazard US Sustainable Equity Portfolio (continued) | | | | | | | | |
| | | | | | | | | |
| Food & Staples Retailing | 1.0% | | | | | | | | |
| Sysco Corp. | | | 1,533 | | | $ | 113,841 | |
| | | | | | | | | |
| Food Products | 0.2% | | | | | | | | |
| Vital Farms, Inc. (*) | | | 936 | | | | 23,690 | |
| | | | | | | | | |
| Health Care Equipment & Supplies | 8.4% | | | | | | | | |
| Boston Scientific Corp. (*) | | | 4,553 | | | | 163,680 | |
| Danaher Corp. | | | 1,477 | | | | 328,101 | |
| Medtronic PLC | | | 4,077 | | | | 477,580 | |
| | | | | | | | 969,361 | |
| Health Care Providers & Services | 4.6% | | | | | | | | |
| Humana, Inc. | | | 375 | | | | 153,851 | |
| Laboratory Corp. of America Holdings (*) | | | 1,071 | | | | 218,002 | |
| UnitedHealth Group, Inc. | | | 471 | | | | 165,171 | |
| | | | | | | | 537,024 | |
| Hotels, Restaurants & Leisure | 2.5% | | | | | | | | |
| Starbucks Corp. | | | 2,719 | | | | 290,879 | |
| | | | | | | | | |
| Household Products | 2.5% | | | | | | | | |
| The Procter & Gamble Co. | | | 2,062 | | | | 286,907 | |
| | | | | | | | | |
| IT Services | 7.0% | | | | | | | | |
| Accenture PLC, Class A | | | 1,504 | | | | 392,860 | |
| Visa, Inc., Class A | | | 1,933 | | | | 422,805 | |
| | | | | | | | 815,665 | |
| Life Sciences Tools & Services | 5.2% | | | | | | | | |
| Agilent Technologies, Inc. | | | 1,365 | | | | 161,739 | |
| IQVIA Holdings, Inc. (*) | | | 955 | | | | 171,107 | |
| Maravai LifeSciences Holdings, Inc., Class A | | | 1,337 | | | | 37,503 | |
| Thermo Fisher Scientific, Inc. | | | 488 | | | | 227,301 | |
| | | | | | | | 597,650 | |
The accompanying notes are an integral part of these financial statements.
156 Annual Report
| Description | | Shares | | | Fair
Value | |
| | | | | | | | | |
| Lazard US Sustainable Equity Portfolio (continued) | | | | | | | | |
| | | | | | | | | |
| Machinery | 3.4% | | | | | | | | |
| Deere & Co. | | | 848 | | | $ | 228,155 | |
| Watts Water Technologies, Inc., Class A | | | 656 | | | | 79,835 | |
| Xylem, Inc. | | | 851 | | | | 86,623 | |
| | | | | | | | 394,613 | |
| | | | | | | | | |
| Multiline Retail | 2.6% | | | | | | | | |
| Dollar General Corp. | | | 1,415 | | | | 297,574 | |
| | | | | | | | | |
| Pharmaceuticals | 6.3% | | | | | | | | |
| Johnson & Johnson | | | 2,061 | | | | 324,360 | |
| Pfizer, Inc. | | | 4,844 | | | | 178,308 | |
| Zoetis, Inc. | | | 1,400 | | | | 231,700 | |
| | | | | | | | 734,368 | |
| Road & Rail | 2.7% | | | | | | | | |
| Norfolk Southern Corp. | | | 1,336 | | | | 317,447 | |
| | | | | | | | | |
| Semiconductors & Semiconductor Equipment | 6.1% | | | | | | | | |
| Analog Devices, Inc. | | | 2,126 | | | | 314,074 | |
| Applied Materials, Inc. | | | 1,918 | | | | 165,523 | |
| Texas Instruments, Inc. | | | 1,397 | | | | 229,290 | |
| | | | | | | | 708,887 | |
| Software | 11.8% | | | | | | | | |
| Intuit, Inc. | | | 468 | | | | 177,770 | |
| Microsoft Corp. | | | 3,873 | | | | 861,432 | |
| Palo Alto Networks, Inc. (*) | | | 284 | | | | 100,931 | |
| salesforce.com, Inc. (*) | | | 1,053 | | | | 234,324 | |
| | | | | | | | 1,374,457 | |
| Specialty Retail | 5.3% | | | | | | | | |
| Ross Stores, Inc. | | | 1,447 | | | | 177,706 | |
| The Home Depot, Inc. | | | 1,651 | | | | 438,539 | |
| | | | | | | | 616,245 | |
Total Common Stocks
(Cost $9,660,642) | | | | | | | 11,379,977 | |
The accompanying notes are an integral part of these financial statements.
Annual Report 157
| Description | | Shares | | | Fair
Value | |
| | | | | | | | | |
| Lazard US Sustainable Equity Portfolio (concluded) | | | | | | | | |
| | | | | | | | | |
| Short-Term Investments | 1.6% | | | | | | | | |
State Street Institutional Treasury Money Market Fund, Premier Class, 0.01% (7 day yield)
(Cost $188,816) | | | 188,816 | | | $ | 188,816 | |
| | | | | | | | | |
Total Investments | 99.6%
(Cost $9,849,458) | | | | | | $ | 11,568,793 | |
| | | | | | | | | |
| Cash and Other Assets in Excess of Liabilities | 0.4% | | | | | | | 49,186 | |
| | | | | | | | | |
| Net Assets | 100.0% | | | | | | $ | 11,617,979 | |
The accompanying notes are an integral part of these financial statements.
158 Annual Report
The Lazard Funds, Inc. Notes to Portfolios of Investments
December 31, 2020
| (*) | Non-income producing security. |
| (‡) | Security valued using Level 2 inputs, based on reference to a similar security which was trading on an active market, under GAAP hierarchy—see Note 9 in the Notes to Financial Statements. |
| (#) | Pursuant to Rule 144A under the Securities Act of 1933, these securities may only be traded among “qualified institutional buyers.” At December 31, 2020, these securities accounted for 0.6% of the net assets for the Lazard Emerging Markets Equity Advantage Portfolio and 3.6% of the net assets of Lazard International Equity Concentrated Portfolio. |
| (^) | Refer to Note 5 in the Notes to Financial Statements for further details related to holdings of 5% voting securities of portfolio companies. |
| (») | The portfolio, at all times, maintains portfolio securities in sufficient amount to cover its obligations related to investments in forward currency contracts. |
Security Abbreviations:
| ADR | — | American Depositary Receipt |
| GDR | — | Global Depositary Receipt |
| NVDR | — | Non-Voting Depositary Receipt |
| PJSC | — | Public Joint Stock Company |
| REIT | — | Real Estate Investment Trust |
Currency Abbreviations:
| AUD | — | Australian Dollar | GBP | — | British Pound Sterling |
| CAD | — | Canadian Dollar | HKD | — | Hong- Kong Dollar |
| EUR | — | Euro | USD | — | United State Dollar |
Counterparty Abbreviations:
| BNP | — | BNP Paribas SA | MEL | — | The Bank of New York Mellon Corp. |
| CAN | — | Canadian Imperial Bank of Commerce | RBC | — | Royal Bank of Canada |
| CIT | — | Citibank NA | SCB | — | Standard Chartered Bank |
| HSB | — | HSBC Bank USA NA | SSB | — | State Street Bank and Trust Co. |
The accompanying notes are an integral part of these financial statements.
Annual Report 159
Portfolio holdings by industry (as a percentage of net assets), for those Portfolios previously presented by country:
| Industry† | | Lazard
Developing
Markets
Equity
Portfolio | | Lazard
Emerging
Markets
Core Equity
Portfolio | | Lazard
Emerging
Markets
Equity
Advantage
Portfolio | | Lazard
Emerging
Markets
Equity
Blend
Portfolio | |
| | | | | | | | | | |
| Common & Preferred Stocks | | | | | | | | | | | | | | | | | |
| Aerospace & Defense | | | — | % | | | — | % | | | — | % | | | — | % | |
| Airlines | | | — | | | | 0.5 | | | | — | | | | — | | |
| Auto Components | | | 2.9 | | | | 0.6 | | | | 0.8 | | | | 1.1 | | |
| Automobiles | | | — | | | | 0.9 | | | | 1.8 | | | | 0.9 | | |
| Banks | | | 22.5 | | | | 13.1 | | | | 13.8 | | | | 23.5 | | |
| Beverages | | | 0.8 | | | | 3.1 | | | | 0.9 | | | | 0.9 | | |
| Biotechnology | | | — | | | | — | | | | 0.4 | | | | — | | |
| Building Products | | | — | | | | — | | | | 0.4 | | | | — | | |
| Capital Markets | | | — | | | | 1.1 | | | | 0.7 | | | | 0.2 | | |
| Chemicals | | | 1.0 | | | | 1.0 | | | | 2.2 | | | | 0.6 | | |
| Commercial Services & Suppliers | | | — | | | | — | | | | 0.5 | | | | — | | |
| Communications Equipment | | | 0.5 | | | | 1.2 | | | | — | | | | 0.2 | | |
| Construction & Engineering | | | — | | | | — | | | | — | | | | — | | |
| Construction Materials | | | 0.4 | | | | 1.4 | | | | 1.0 | | | | 1.3 | | |
| Consumer Finance | | | 0.8 | | | | — | | | | — | | | | 0.3 | | |
| Containers & Packaging | | | — | | | | — | | | | — | | | | 0.3 | | |
| Diversified Consumer Services | | | 0.7 | | | | 1.6 | | | | 0.6 | | | | 0.6 | | |
| Diversified Financial Services | | | — | | | | — | | | | 0.2 | | | | — | | |
| Diversified Telecommunication Services | | | — | | | | 1.2 | | | | 1.2 | | | | 0.8 | | |
| Electric Utilities | | | — | | | | — | | | | 0.5 | | | | — | | |
| Electrical Equipment | | | 1.3 | | | | — | | | | 1.0 | | | | 0.2 | | |
| Electronic Equipment, Instruments & Components | | | 2.3 | | | | 1.6 | | | | 3.6 | | | | 2.4 | | |
| Entertainment | | | 4.3 | | | | 4.5 | | | | 1.9 | | | | 3.9 | | |
| Food & Staples Retailing | | | — | | | | — | | | | 1.5 | | | | 0.4 | | |
| Food Products | | | — | | | | 1.5 | | | | 1.2 | | | | 0.6 | | |
| Gas Utilities | | | 1.1 | | | | 0.8 | | | | 0.6 | | | | 0.3 | | |
| Health Care Equipment & Supplies | | | — | | | | — | | | | 0.7 | | | | 0.3 | | |
| Health Care Providers & Services | | | — | | | | — | | | | — | | | | 0.6 | | |
| Hotels, Restaurants & Leisure | | | 2.7 | | | | 0.8 | | | | 0.5 | | | | 0.3 | | |
| Household Durables | | | — | | | | 0.8 | | | | 1.0 | | | | 0.7 | | |
| Household Products | | | — | | | | — | | | | 0.2 | | | | 0.6 | | |
| Independent Power & Renewable Electricity Producers | | | — | | | | — | | | | 0.3 | | | | — | | |
| Industrial Conglomerates | | | — | | | | 0.5 | | | | — | | | | — | | |
| Insurance | | | 2.0 | | | | 3.5 | | | | 2.5 | | | | 3.5 | | |
| Interactive Media & Services | | | 10.4 | | | | 7.6 | | | | 7.3 | | | | 5.9 | | |
| Internet & Direct Marketing Retail | | | 5.2 | | | | 9.2 | | | | 11.2 | | | | 2.3 | | |
| IT Services | | | 1.5 | | | | 4.0 | | | | 3.2 | | | | 4.3 | | |
| Leisure Products | | | — | | | | — | | | | — | | | | — | | |
The accompanying notes are an integral part of these financial statements.
160 Annual Report
Lazard
Emerging
Markets
Equity
Portfolio | | Lazard
Equity
Franchise
Portfolio | | Lazard
Global
Equity Select
Portfolio | | Lazard
Global
Listed
Infrastructure
Portfolio | | Lazard
Global
Strategic
Equity
Portfolio | |
| | | | | | | | | | | | | | | | | | | | |
| | — | % | | | — | % | | | 1.6 | % | | | — | % | | | 2.4 | % | |
| | — | | | | — | | | | — | | | | — | | | | — | | |
| | 1.4 | | | | — | | | | — | | | | — | | | | — | | |
| | 2.5 | | | | — | | | | — | | | | — | | | | 1.3 | | |
| | 22.8 | | | | — | | | | 1.3 | | | | — | | | | 2.6 | | |
| | — | | | | 1.9 | | | | 6.3 | | | | — | | | | 2.3 | | |
| | — | | | | — | | | | — | | | | — | | | | 2.4 | | |
| | — | | | | — | | | | 0.7 | | | | — | | | | — | | |
| | — | | | | — | | | | 6.1 | | | | — | | | | 7.7 | | |
| | 1.0 | | | | — | | | | 2.0 | | | | — | | | | 2.7 | | |
| | — | | | | 2.9 | | | | — | | | | — | | | | — | | |
| | — | | | | 5.2 | | | | 1.6 | | | | — | | | | — | | |
| | — | | | | 3.0 | | | | — | | | | 13.0 | | | | — | | |
| | 2.1 | | | | — | | | | — | | | | — | | | | — | | |
| | — | | | | — | | | | — | | | | — | | | | 1.7 | | |
| | — | | | | — | | | | — | | | | — | | | | — | | |
| | — | | | | 5.9 | | | | — | | | | — | | | | — | | |
| | — | | | | — | | | | — | | | | — | | | | 1.3 | | |
| | | | | | | | | | | | | | | | | | | | |
| | 2.2 | | | | — | | | | — | | | | — | | | | — | | |
| | 0.7 | | | | — | | | | — | | | | 10.1 | | | | 3.7 | | |
| | — | | | | — | | | | 3.6 | | | | — | | | | 3.7 | | |
| | | | | | | | | | | | | | | | | | | | |
| | 2.1 | | | | — | | | | 1.5 | | | | — | | | | — | | |
| | — | | | | — | | | | 2.3 | | | | — | | | | 5.5 | | |
| | 1.6 | | | | — | | | | 1.7 | | | | — | | | | 1.0 | | |
| | — | | | | — | | | | — | | | | — | | | | — | | |
| | 0.8 | | | | 2.8 | | | | 1.7 | | | | 10.0 | | | | — | | |
| | — | | | | 2.7 | | | | 1.1 | | | | — | | | | 3.4 | | |
| | 1.8 | | | | 20.0 | | | | 1.3 | | | | — | | | | 1.5 | | |
| | — | | | | 4.2 | | | | 2.7 | | | | — | | | | 1.3 | | |
| | 1.1 | | | | — | | | | — | | | | — | | | | — | | |
| | 0.6 | | | | — | | | | 2.7 | | | | — | | | | — | | |
| | | | | | | | | | | | | | | | | | | | |
| | 0.7 | | | | — | | | | — | | | | — | | | | — | | |
| | 1.0 | | | | — | | | | 0.9 | | | | — | | | | — | | |
| | 4.0 | | | | — | | | | 5.2 | | | | — | | | | 3.7 | | |
| | 2.0 | | | | — | | | | 5.2 | | | | — | | | | 5.8 | | |
| | — | | | | — | | | | 2.1 | | | | — | | | | 3.3 | | |
| | 3.5 | | | | 3.0 | | | | 4.3 | | | | — | | | | 4.9 | | |
| | — | | | | — | | | | 1.0 | | | | — | | | | — | | |
The accompanying notes are an integral part of these financial statements.
Annual Report 161
Portfolio holdings by industry (as a percentage of net assets), for those Portfolios previously presented by country (continued):
| Industry† | | Lazard
Developing
Markets
Equity
Portfolio | | Lazard
Emerging
Markets
Core Equity
Portfolio | | Lazard
Emerging
Markets
Equity
Advantage
Portfolio | | Lazard
Emerging
Markets
Equity
Blend
Portfolio | |
| | | | | | | | | | |
| Life Sciences Tools & Services | | | 0.7 | % | | | 1.3 | % | | | 0.4 | % | | | — | % | |
| Machinery | | | 5.1 | | | | 1.7 | | | | 1.3 | | | | 4.0 | | |
| Marine | | | — | | | | — | | | | 1.3 | | | | 0.2 | | |
| Media | | | — | | | | — | | | | — | | | | 0.4 | | |
| Metals & Mining | | | 3.2 | | | | 3.9 | | | | 4.6 | | | | 3.7 | | |
| Multiline Retail | | | 0.5 | | | | 0.3 | | | | — | | | | 0.2 | | |
| Multi-Utilities | | | — | | | | — | | | | — | | | | — | | |
| Oil, Gas & Consumable Fuels | | | 3.8 | | | | 4.2 | | | | 4.9 | | | | 4.5 | | |
| Paper & Forest Products | | | 1.0 | | | | 1.2 | | | | — | | | | — | | |
| Personal Products | | | — | | | | 1.5 | | | | 0.6 | | | | 1.5 | | |
| Pharmaceuticals | | | — | | | | — | | | | 2.7 | | | | 0.9 | | |
| Professional Services | | | — | | | | — | | | | — | | | | 0.3 | | |
| Real Estate Management & Development | | | — | | | | — | | | | 0.9 | | | | 1.0 | | |
| Road & Rail | | | 1.7 | | | | 0.8 | | | | — | | | | — | | |
| Semiconductors & Semiconductor Equipment | | | 11.9 | | | | 12.0 | | | | 9.5 | | | | 9.3 | | |
| Software | | | 1.0 | | | | — | | | | 0.2 | | | | — | | |
| Specialty Retail | | | 1.0 | | | | 1.5 | | | | 0.6 | | | | 1.1 | | |
| Technology Hardware, Storage & Peripherals | | | 6.7 | | | | 7.8 | | | | 6.8 | | | | 8.0 | | |
| Textiles, Apparel & Luxury Goods | | | 0.8 | | | | 1.5 | | | | 1.6 | | | | 0.6 | | |
| Tobacco | | | — | | | | — | | | | 0.2 | | | | 0.5 | | |
| Trading Companies & Distributors | | | — | | | | — | | | | — | | | | — | | |
| Transportation Infrastructure | | | 0.7 | | | | 1.1 | | | | 0.2 | | | | 0.8 | | |
| Water Utilities | | | 0.8 | | | | — | | | | — | | | | 0.5 | | |
| Wireless Telecommunication Services | | | — | | | | — | | | | 0.9 | | | | 2.4 | | |
| Subtotal | | | 99.3 | | | | 99.3 | | | | 98.4 | | | | 96.9 | | |
| Exchange Traded Fund | | | — | | | | — | | | | — | | | | — | | |
| Short-Term Investments | | | 1.1 | | | | 0.8 | | | | 0.4 | | | | 3.3 | | |
| Total Investments | | | 100.4 | % | | | 100.1 | % | | | 98.8 | % | | | 100.2 | % | |
| † | Industry classifications may be different than those used for compliance monitoring purposes. |
The accompanying notes are an integral part of these financial statements.
162 Annual Report
Lazard
Emerging
Markets
Equity
Portfolio | | Lazard
Equity
Franchise
Portfolio | | Lazard
Global
Equity Select
Portfolio | | Lazard
Global
Listed
Infrastructure
Portfolio | | Lazard
Global
Strategic
Equity
Portfolio | |
| | | | | | | | | | | | | | | | | | | | |
| | — | % | | | — | % | | | 5.7 | % | | | — | % | | | 4.4 | % | |
| | 0.9 | | | | — | | | | 1.7 | | | | — | | | | — | | |
| | — | | | | — | | | | — | | | | — | | | | — | | |
| | — | | | | 9.3 | | | | — | | | | 4.3 | | | | 2.7 | | |
| | 5.5 | | | | — | | | | 1.0 | | | | — | | | | 0.9 | | |
| | — | | | | — | | | | 2.9 | | | | — | | | | 4.1 | | |
| | — | | | | 2.6 | | | | — | | | | 15.1 | | | | — | | |
| | 6.7 | | | | — | | | | — | | | | — | | | | — | | |
| | 0.7 | | | | — | | | | — | | | | — | | | | — | | |
| | 3.2 | | | | — | | | | 3.7 | | | | — | | | | — | | |
| | — | | | | — | | | | 5.4 | | | | — | | | | 2.6 | | |
| | — | | | | 10.2 | | | | 4.2 | | | | — | | | | 4.8 | | |
| | | | | | | | | | | | | | | | | | | | |
| | 0.8 | | | | — | | | | — | | | | — | | | | — | | |
| | — | | | | — | | | | 1.1 | | | | 7.8 | | | | — | | |
| | | | | | | | | | | | | | | | | | | | |
| | 10.2 | | | | 5.0 | | | | 5.1 | | | | — | | | | 5.1 | | |
| | — | | | | 3.3 | | | | 6.7 | | | | — | | | | 10.5 | | |
| | 0.4 | | | | — | | | | 2.4 | | | | — | | | | — | | |
| | | | | | | | | | | | | | | | | | | | |
| | 6.3 | | | | — | | | | — | | | | — | | | | — | | |
| | — | | | | 8.0 | | | | 1.2 | | | | — | | | | — | | |
| | 0.7 | | | | — | | | | — | | | | — | | | | — | | |
| | — | | | | — | | | | — | | | | — | | | | 1.3 | | |
| | 0.9 | | | | 2.0 | | | | — | | | | 12.7 | | | | — | | |
| | — | | | | 1.9 | | | | — | | | | 12.2 | | | | — | | |
| | | | | | | | | | | | | | | | | | | | |
| | 4.7 | | | | — | | | | — | | | | — | | | | — | | |
| | 92.9 | | | | 93.9 | | | | 98.0 | | | | 85.2 | | | | 98.6 | | |
| | 5.0 | | | | — | | | | — | | | | — | | | | — | | |
| | 1.8 | | | | 6.1 | | | | 2.0 | | | | 15.0 | | | | 1.9 | | |
| | 99.7 | % | | | 100.0 | % | | | 100.0 | % | | | 100.2 | % | | | 100.5 | % | |
The accompanying notes are an integral part of these financial statements.
Annual Report 163
Portfolio holdings by industry (as a percentage of net assets), for those Portfolios previously presented by country (continued):
| Industry† | | Lazard
International
Equity
Advantage
Portfolio | | Lazard
International
Equity
Concentrated
Portfolio | | Lazard
International
Equity
Portfolio | | Lazard
International
Equity Select
Portfolio | |
| | | | | | | | | | |
| Common & Preferred Stocks | | | | | | | | | | | | | | | | | |
| Aerospace & Defense | | | — | % | | | 3.8 | % | | | 2.0 | % | | | 2.4 | % | |
| Air Freight & Logistics | | | 1.7 | | | | — | | | | — | | | | — | | |
| Airlines | | | — | | | | — | | | | 1.1 | | | | 1.4 | | |
| Auto Components | | | 1.4 | | | | — | | | | 1.2 | | | | 0.6 | | |
| Automobiles | | | 2.6 | | | | 3.2 | | | | 2.8 | | | | 3.4 | | |
| Banks | | | 6.7 | | | | — | | | | 6.6 | | | | 7.7 | | |
| Beverages | | | — | | | | 5.9 | | | | 3.6 | | | | 2.3 | | |
| Biotechnology | | | 0.4 | | | | — | | | | — | | | | — | | |
| Building Products | | | 3.5 | | | | — | | | | — | | | | — | | |
| Capital Markets | | | 3.2 | | | | — | | | | 1.8 | | | | 0.9 | | |
| Chemicals | | | 3.8 | | | | — | | | | 4.8 | | | | 4.3 | | |
| Commercial Services & Suppliers | | | 0.6 | | | | — | | | | — | | | | — | | |
| Communications Equipment | | | 0.1 | | | | — | | | | — | | | | — | | |
| Construction & Engineering | | | 0.2 | | | | — | | | | 1.0 | | | | 0.9 | | |
| Construction Materials | | | 0.6 | | | | — | | | | — | | | | — | | |
| Consumer Finance | | | 0.1 | | | | — | | | | — | | | | — | | |
| Containers & Packaging | | | — | | | | — | | | | — | | | | — | | |
| Distributors | | | — | | | | — | | | | — | | | | — | | |
| Diversified Consumer Services | | | — | | | | — | | | | — | | | | — | | |
| Diversified Financial Services | | | 1.1 | | | | — | | | | — | | | | — | | |
| Diversified Telecommunication Services | | | 0.9 | | | | — | | | | 1.3 | | | | 1.8 | | |
| Electric Utilities | | | 1.3 | | | | — | | | | 3.5 | | | | 1.9 | | |
| Electrical Equipment | | | 2.8 | | | | 3.7 | | | | 4.4 | | | | 3.9 | | |
| Electronic Equipment, Instruments & Components | | | 2.1 | | | | 6.3 | | | | 3.2 | | | | 2.7 | | |
| Entertainment | | | 2.1 | | | | — | | | | 5.6 | | | | 3.7 | | |
| Equity Real Estate Investment Trusts (REITs) | | | 1.4 | | | | — | | | | — | | | | — | | |
| Food & Staples Retailing | | | 2.4 | | | | — | | | | 1.9 | | | | 1.6 | | |
| Food Products | | | 3.2 | | | | — | | | | 0.8 | | | | 0.8 | | |
| Gas Utilities | | | 0.3 | | | | 3.3 | | | | 0.9 | | | | 1.5 | | |
| Health Care Equipment & Supplies | | | 2.2 | | | | 2.4 | | | | 3.0 | | | | 2.0 | | |
| Health Care Providers & Services | | | — | | | | — | | | | 1.0 | | | | — | | |
| Health Care Technology | | | — | | | | — | | | | — | | | | — | | |
| Hotels, Restaurants & Leisure | | | 1.6 | | | | — | | | | — | | | | 1.0 | | |
| Household Durables | | | 3.6 | | | | — | | | | — | | | | — | | |
| Household Products | | | 1.7 | | | | — | | | | — | | | | — | | |
| Independent Power & Renewable Electricity Producers | | | 0.4 | | | | — | | | | — | | | | — | | |
| Industrial Conglomerates | | | 0.5 | | | | — | | | | — | | | | — | | |
The accompanying notes are an integral part of these financial statements.
164 Annual Report
Lazard
International
Equity Value
Portfolio | | Lazard
International
Quality Growth
Portfolio | | Lazard
International
Small Cap
Equity
Portfolio | | Lazard
International
Strategic Equity
Portfolio | | Lazard
Managed
Equity
Volatility
Portfolio | |
| | | | | | | | | | | | | | | | | | | | |
| | 1.8 | % | | | 2.7 | % | | | — | % | | | 4.5 | % | | | 2.2 | % | |
| | — | | | | — | | | | 1.1 | | | | — | | | | — | | |
| | — | | | | — | | | | — | | | | 1.7 | | | | — | | |
| | 5.2 | | | | — | | | | 1.0 | | | | — | | | | 0.2 | | |
| | 5.0 | | | | — | | | | — | | | | 4.3 | | | | — | | |
| | 9.0 | | | | 5.2 | | | | 3.5 | | | | 5.8 | | | | 2.5 | | |
| | 9.7 | | | | 2.2 | | | | 3.6 | | | | 7.0 | | | | 1.0 | | |
| | — | | | | 3.1 | | | | — | | | | 1.8 | | | | 1.7 | | |
| | — | | | | 4.2 | | | | 3.6 | | | | 1.0 | | | | 0.7 | | |
| | 4.1 | | | | 5.7 | | | | 6.1 | | | | 4.0 | | | | 3.0 | | |
| | 6.7 | | | | 2.0 | | | | 4.1 | | | | 1.0 | | | | 0.8 | | |
| | — | | | | — | | | | 3.0 | | | | — | | | | 2.2 | | |
| | — | | | | — | | | | — | | | | — | | | | 0.7 | | |
| | — | | | | — | | | | 1.5 | | | | — | | | | 0.5 | | |
| | — | | | | — | | | | — | | | | — | | | | 0.2 | | |
| | — | | | | — | | | | — | | | | — | | | | — | | |
| | — | | | | — | | | | — | | | | — | | | | 1.6 | | |
| | — | | | | — | | | | — | | | | — | | | | 0.4 | | |
| | — | | | | — | | | | — | | | | — | | | | 1.0 | | |
| | — | | | | — | | | | 1.4 | | | | — | | | | 0.3 | | |
| | | | | | | | | | | | | | | | | | | | |
| | — | | | | — | | | | 1.1 | | | | — | | | | 4.0 | | |
| | — | | | | — | | | | — | | | | 3.2 | | | | 3.3 | | |
| | — | | | | 1.9 | | | | 1.0 | | | | 4.8 | | | | 0.5 | | |
| | | | | | | | | | | | | | | | | | | | |
| | 4.2 | | | | 2.3 | | | | 0.7 | | | | 1.0 | | | | 0.2 | | |
| | 5.0 | | | | 3.4 | | | | 1.3 | | | | 6.9 | | | | 1.2 | | |
| | | | | | | | | | | | | | | | | | | | |
| | — | | | | — | | | | 3.2 | | | | — | | | | 2.0 | | |
| | 3.6 | | | | 2.1 | | | | 1.3 | | | | 2.0 | | | | 6.6 | | |
| | — | | | | — | | | | 1.1 | | | | 1.2 | | | | 5.3 | | |
| | — | | | | — | | | | 1.3 | | | | — | | | | 1.8 | | |
| | — | | | | 3.4 | | | | 2.0 | | | | 2.6 | | | | 2.5 | | |
| | — | | | | — | | | | 1.0 | | | | — | | | | 3.0 | | |
| | — | | | | — | | | | 0.8 | | | | — | | | | — | | |
| | 6.2 | | | | — | | | | 2.2 | | | | 3.2 | | | | 2.1 | | |
| | 3.1 | | | | — | | | | 1.9 | | | | — | | | | 0.5 | | |
| | — | | | | 1.3 | | | | — | | | | — | | | | 4.9 | | |
| | | | | | | | | | | | | | | | | | | | |
| | — | | | | — | | | | 0.8 | | | | — | | | | 0.5 | | |
| | 3.9 | | | | — | | | | — | | | | — | | | | 0.9 | | |
The accompanying notes are an integral part of these financial statements.
Annual Report 165
Portfolio holdings by industry (as a percentage of net assets), for those Portfolios previously presented by country (continued):
| Industry† | | Lazard
International
Equity
Advantage
Portfolio | | Lazard
International
Equity
Concentrated
Portfolio | | Lazard
International
Equity
Portfolio | | Lazard
International
Equity Select
Portfolio | |
| | | | | | | | | | | | | | |
| Insurance | | | 6.2 | % | | | 11.6 | % | | | 6.0 | % | | | 7.4 | % | |
| Interactive Media & Services | | | 0.2 | | | | 7.1 | | | | 1.7 | | | | 4.0 | | |
| Internet & Direct Marketing Retail | | | — | | | | — | | | | — | | | | 0.8 | | |
| IT Services | | | 0.8 | | | | 4.4 | | | | 1.2 | | | | 1.6 | | |
| Leisure Products | | | 0.1 | | | | — | | | | 1.0 | | | | 1.1 | | |
| Life Sciences Tools & Services | | | 0.5 | | | | — | | | | — | | | | 1.0 | | |
| Machinery | | | 2.6 | | | | 3.8 | | | | 4.6 | | | | 5.4 | | |
| Marine | | | 0.1 | | | | — | | | | — | | | | — | | |
| Media | | | 0.1 | | | | — | | | | 1.8 | | | | — | | |
| Metals & Mining | | | 3.9 | | | | 3.6 | | | | 2.5 | | | | 1.3 | | |
| Multiline Retail | | | — | | | | 4.7 | | | | 0.8 | | | | 2.0 | | |
| Multi-Utilities | | | 1.8 | | | | 6.1 | | | | 2.7 | | | | 2.3 | | |
| Oil, Gas & Consumable Fuels | | | 2.5 | | | | 3.6 | | | | 2.4 | | | | 1.8 | | |
| Paper & Forest Products | | | 0.1 | | | | — | | | | — | | | | — | | |
| Personal Products | | | 2.0 | | | | 4.9 | | | | 2.5 | | | | 4.9 | | |
| Pharmaceuticals | | | 10.7 | | | | 5.1 | | | | 6.6 | | | | 5.4 | | |
| Professional Services | | | 1.6 | | | | 3.2 | | | | 3.9 | | | | 3.4 | | |
| Real Estate Management & Development | | | 0.9 | | | | 6.6 | | | | 3.8 | | | | 1.9 | | |
| Road & Rail | | | 0.6 | | | | — | | | | 1.2 | | | | 1.1 | | |
| Semiconductors & Semiconductor Equipment | | | 3.7 | | | | — | | | | 1.2 | | | | — | | |
| Software | | | 1.1 | | | | — | | | | — | | | | — | | |
| Specialty Retail | | | 2.3 | | | | — | | | | — | | | | 1.4 | | |
| Technology Hardware, Storage & Peripherals | | | 0.5 | | | | 6.3 | | | | 2.0 | | | | 3.4 | | |
| Textiles, Apparel & Luxury Goods | | | 0.3 | | | | — | | | | — | | | | — | | |
| Thrifts & Mortgage Finance | | | — | | | | — | | | | — | | | | — | | |
| Tobacco | | | 2.3 | | | | — | | | | — | | | | — | | |
| Trading Companies & Distributors | | | 0.1 | | | | 2.2 | | | | 1.5 | | | | 1.3 | | |
| Transportation Infrastructure | | | — | | | | — | | | | 0.8 | | | | 0.6 | | |
| Water Utilities | | | — | | | | — | | | | — | | | | 0.7 | | |
| Wireless Telecommunication Services | | | 3.1 | | | | — | | | | — | | | | — | | |
| Subtotal | | | 100.6 | | | | 101.8 | | | | 98.7 | | | | 97.6 | | |
| Short-Term Investments | | | 0.8 | | | | — | | | | 1.1 | | | | 2.2 | | |
| Total Investments | | | 101.4 | % | | | 101.8 | % | | | 99.8 | % | | | 99.8 | % | |
| † | Industry classifications may be different than those used for compliance monitoring purposes. |
The accompanying notes are an integral part of these financial statements.
166 Annual Report
Lazard
International
Equity Value
Portfolio | | Lazard
International
Quality Growth
Portfolio | | Lazard
International
Small Cap
Equity
Portfolio | | Lazard
International
Strategic Equity
Portfolio | | Lazard
Managed
Equity
Volatility
Portfolio | |
| | | | | | | | | | | | | | | | | | | | |
| | 6.3 | % | | | 7.7 | % | | | 0.9 | % | | | 7.2 | % | | | 2.0 | % | |
| | — | | | | 6.3 | | | | 3.9 | | | | 1.2 | | | | — | | |
| | — | | | | 2.9 | | | | — | | | | 1.6 | | | | — | | |
| | — | | | | — | | | | 3.1 | | | | 2.3 | | | | 3.1 | | |
| | 2.4 | | | | 1.5 | | | | — | | | | 1.3 | | | | 0.5 | | |
| | — | | | | — | | | | — | | | | — | | | | 1.8 | | |
| | 6.4 | | | | 2.2 | | | | 4.7 | | | | 5.9 | | | | 1.5 | | |
| | — | | | | — | | | | — | | | | — | | | | — | | |
| | — | | | | — | | | | 0.8 | | | | 2.0 | | | | 3.1 | | |
| | — | | | | — | | | | 1.7 | | | | 2.9 | | | | 1.3 | | |
| | — | | | | 1.8 | | | | 1.0 | | | | 0.8 | | | | 2.5 | | |
| | 3.5 | | | | — | | | | — | | | | 2.3 | | | | 2.4 | | |
| | 2.4 | | | | — | | | | 0.7 | | | | 1.0 | | | | — | | |
| | — | | | | — | | | | — | | | | — | | | | — | | |
| | — | | | | 2.1 | | | | — | | | | 1.2 | | | | — | | |
| | 3.3 | | | | 1.6 | | | | 4.0 | | | | 2.9 | | | | 8.7 | | |
| | — | | | | 9.1 | | | | 4.0 | | | | 2.3 | | | | — | | |
| | | | | | | | | | | | | | | | | | | | |
| | — | | | | — | | | | 9.0 | | | | 3.2 | | | | 1.5 | | |
| | — | | | | — | | | | — | | | | — | | | | 1.4 | | |
| | | | | | | | | | | | | | | | | | | | |
| | 3.8 | | | | 8.5 | | | | 2.0 | | | | 1.1 | | | | 0.5 | | |
| | — | | | | 3.6 | | | | 7.2 | | | | — | | | | 3.2 | | |
| | — | | | | 2.8 | | | | 2.8 | | | | 2.1 | | | | 2.8 | | |
| | | | | | | | | | | | | | | | | | | | |
| | — | | | | — | | | | — | | | | — | | | | 0.6 | | |
| | 2.5 | | | | 2.8 | | | | — | | | | — | | | | — | | |
| | — | | | | — | | | | — | | | | 1.2 | | | | 0.3 | | |
| | — | | | | — | | | | — | | | | — | | | | 0.9 | | |
| | — | | | | 2.9 | | | | 2.3 | | | | — | | | | 0.6 | | |
| | — | | | | — | | | | — | | | | — | | | | — | | |
| | — | | | | — | | | | 1.4 | | | | — | | | | 0.5 | | |
| | | | | | | | | | | | | | | | | | | | |
| | — | | | | — | | | | — | | | | — | | | | 1.8 | | |
| | 98.1 | | | | 95.3 | | | | 98.1 | | | | 98.5 | | | | 99.3 | | |
| | 2.2 | | | | 6.6 | | | | 1.6 | | | | 1.5 | | | | 0.6 | | |
| | 100.3 | % | | | 101.9 | % | | | 99.7 | % | | | 100.0 | % | | | 99.9 | % | |
The accompanying notes are an integral part of these financial statements.
Annual Report 167
Portfolio holdings by industry (as a percentage of net assets), for those Portfolios previously presented by country (concluded):
| Industry† | | Lazard
US Equity
Concentrated
Portfolio | | Lazard
US Equity
Focus
Portfolio | | Lazard
US Small
Mid Cap
Equity
-Portfolio | | Lazard
US
Sustainable
Equity
Portfolio | |
| | | | | | | | | | | | | | | | | | |
| Common & Preferred Stocks | | | | | | | | | | | | | | | | | |
| Aerospace & Defense | | | — | % | | | — | % | | | 2.4 | % | | | — | % | |
| Air Freight & Logistics | | | — | | | | — | | | | 0.9 | | | | — | | |
| Airlines | | | — | | | | — | | | | 0.8 | | | | — | | |
| Auto Components | | | — | | | | 1.2 | | | | 0.8 | | | | 1.0 | | |
| Banks | | | — | | | | 5.4 | | | | 6.2 | | | | 6.2 | | |
| Beverages | | | — | | | | 3.4 | | | | — | | | | — | | |
| Biotechnology | | | — | | | | — | | | | 4.1 | | | | — | | |
| Building Products | | | 2.8 | | | | — | | | | 2.6 | | | | — | | |
| Capital Markets | | | 9.3 | | | | 6.2 | | | | 1.6 | | | | 4.5 | | |
| Chemicals | | | — | | | | — | | | | 2.9 | | | | 2.1 | | |
| Commercial Services & Suppliers | | | 3.6 | | | | 3.0 | | | | — | | | | 3.2 | | |
| Communications Equipment | | | — | | | | 2.7 | | | | 2.6 | | | | 2.3 | | |
| Construction & Engineering | | | — | | | | — | | | | 1.8 | | | | — | | |
| Construction Materials | | | 3.8 | | | | — | | | | 1.4 | | | | — | | |
| Consumer Finance | | | — | | | | 3.3 | | | | — | | | | — | | |
| Containers & Packaging | | | — | | | | — | | | | 2.4 | | | | 2.2 | | |
| Distributors | | | 1.6 | | | | — | | | | — | | | | — | | |
| Electrical Equipment | | | — | | | | — | | | | 2.2 | | | | 2.9 | | |
| Electronic Equipment, Instruments & Components | | | 3.4 | | | | — | | | | 1.0 | | | | — | | |
| Energy Equipment & Services | | | — | | | | — | | | | 1.6 | | | | — | | |
| Entertainment | | | 1.0 | | | | 1.3 | | | | 1.2 | | | | 2.0 | | |
| Equity Real Estate Investment Trusts (REITs) | | | 9.2 | | | | — | | | | 8.0 | | | | 2.2 | | |
| Food & Staples Retailing | | | 1.6 | | | | 2.3 | | | | 1.3 | | | | 1.0 | | |
| Food Products | | | — | | | | — | | | | 1.1 | | | | 0.2 | | |
| Gas Utilities | | | — | | | | — | | | | 1.6 | | | | — | | |
| Health Care Equipment & Supplies | | | 12.9 | | | | 9.9 | | | | 1.3 | | | | 8.3 | | |
| Health Care Providers & Services | | | — | | | | — | | | | 1.4 | | | | 4.6 | | |
| Health Care Technology | | | — | | | | — | | | | 1.1 | | | | — | | |
| Hotels, Restaurants & Leisure | | | 6.7 | | | | 6.4 | | | | 1.6 | | | | 2.5 | | |
| Household Durables | | | — | | | | — | | | | 1.9 | | | | — | | |
| Household Products | | | — | | | | — | | | | — | | | | 2.5 | | |
| Industrial Conglomerates | | | — | | | | 4.5 | | | | 1.5 | | | | — | | |
| Insurance | | | — | | | | 3.0 | | | | 4.2 | | | | — | | |
| Interactive Media & Services | | | 7.9 | | | | 7.1 | | | | 1.9 | | | | — | | |
| IT Services | | | 9.7 | | | | 5.9 | | | | 4.4 | | | | 7.0 | | |
| Leisure Products | | | 2.1 | | | | — | | | | 2.6 | | | | — | | |
| Life Sciences Tools & Services | | | 1.2 | | | | 2.2 | | | | 5.0 | | | | 5.1 | | |
| Machinery | | | — | | | | — | | | | 3.6 | | | | 3.4 | | |
| Multiline Retail | | | 3.8 | | | | 2.1 | | | | — | | | | 2.6 | | |
The accompanying notes are an integral part of these financial statements.
168 Annual Report
| Industry† | | Lazard
US Equity
Concentrated
Portfolio | | Lazard
US Equity
Focus
Portfolio | | Lazard
US Small
Mid Cap
Equity
-Portfolio | | Lazard
US
Sustainable
Equity
Portfolio | |
| | | | | | | | | | | | | | | | | | |
| Oil, Gas & Consumable Fuels | | | — | % | | | — | % | | | 0.4 | % | | | — | % | |
| Paper & Forest Products | | | — | | | | — | | | | 1.6 | | | | — | | |
| Pharmaceuticals | | | — | | | | 5.7 | | | | 1.4 | | | | 6.3 | | |
| Professional Services | | | — | | | | — | | | | — | | | | — | | |
| Road & Rail | | | 1.8 | | | | 4.2 | | | | — | | | | 2.7 | | |
| Semiconductors & Semiconductor Equipment | | | 11.3 | | | | 5.4 | | | | 2.8 | | | | 6.1 | | |
| Software | | | — | | | | 7.5 | | | | 6.8 | | | | 11.8 | | |
| Specialty Retail | | | 3.7 | | | | 6.2 | | | | 2.3 | | | | 5.3 | | |
| Textiles, Apparel & Luxury Goods | | | — | | | | — | | | | 3.0 | | | | — | | |
| Trading Companies & Distributors | | | — | | | | — | | | | 1.3 | | | | — | | |
| Subtotal | | | 97.4 | | | | 98.9 | | | | 98.6 | | | | 98.0 | | |
| Short-Term Investments | | | 2.5 | | | | 1.2 | | | | — | | | | 1.6 | | |
| Total Investments | | | 99.9 | % | | | 100.1 | % | | | 98.6 | % | | | 99.6 | % | |
| † | Industry classifications may be different than those used for compliance monitoring purposes. |
The accompanying notes are an integral part of these financial statements.
Annual Report 169
The Lazard Funds, Inc. Statements of Assets and Liabilities
| December 31, 2020 | Lazard
Developing Markets
Equity Portfolio | | Lazard Emerging
Markets Core
Equity Portfolio | |
| ASSETS | | | | | | | | | | |
| Investments in securities, at fair value | | $ | 201,479,702 | | | | $ | 212,703,894 | | |
| Foreign currency, at fair value | | | 4,674 | | | | | 10,926 | | |
| Receivables for: | | | | | | | | | | |
| Investments sold | | | 113,427 | | | | | 30,580 | | |
| Dividends | | | 202,070 | | | | | 212,126 | | |
| Capital stock sold | | | 142,624 | | | | | 150,388 | | |
| Prepaid expenses | | | — | | | | | 1,127 | | |
| Total assets | | | 201,942,497 | | | | | 213,109,041 | | |
| LIABILITIES | | | | | | | | | | |
| Payables for: | | | | | | | | | | |
| Foreign capital gains taxes | | | 61,111 | | | | | 129,557 | | |
| Management fees | | | 159,222 | | | | | 175,862 | | |
| Accrued custodian fees | | | 45,941 | | | | | 36,350 | | |
| Accrued shareholders’ reports | | | 12,728 | | | | | 11,666 | | |
| Accrued professional services | | | 45,973 | | | | | 32,540 | | |
| Accrued distribution fees | | | 2,137 | | | | | 490 | | |
| Accrued directors’ fees | | | 881 | | | | | 1,029 | | |
| Accrued registration fees | | | 6,812 | | | | | 20,024 | | |
| Investments purchased | | | 515,170 | | | | | 31 | | |
| Capital stock redeemed | | | 483,237 | | | | | 104,520 | | |
| Other accrued expenses and payables | | | 5,909 | | | | | 6,117 | | |
| Total liabilities | | | 1,339,121 | | | | | 518,186 | | |
| Net assets | | $ | 200,603,376 | | | | $ | 212,590,855 | | |
| NET ASSETS | | | | | | | | | | |
| Paid in capital | | $ | 255,643,436 | | | | $ | 169,793,199 | | |
| Distributable earnings (Accumulated loss) | | | (55,040,060 | ) | | | | 42,797,656 | | |
| Net assets | | $ | 200,603,376 | | | | $ | 212,590,855 | | |
| Institutional Shares | | | | | | | | | | |
| Net assets | | $ | 190,689,018 | | | | $ | 209,502,638 | | |
| Shares of capital stock outstanding* | | | 11,013,865 | | | | | 15,971,095 | | |
| Net asset value, offering and redemption price per share | | $ | 17.31 | | | | $ | 13.12 | | |
| Open Shares | | | | | | | | | | |
| Net assets | | $ | 9,914,358 | | | | $ | 2,543,976 | | |
| Shares of capital stock outstanding* | | | 575,985 | | | | | 194,354 | | |
| Net asset value, offering and redemption price per share | | $ | 17.21 | | | | $ | 13.09 | | |
| R6 Shares | | | | | | | | | | |
| Net assets | | | — | | | | $ | 544,241 | | |
| Shares of capital stock outstanding* | | | — | | | | | 41,454 | | |
| Net asset value, offering and redemption price per share | | | — | | | | $ | 13.13 | | |
| Cost of investments in securities | | $ | 141,106,319 | | | | $ | 142,811,153 | | |
| Cost of foreign currency | | $ | 4,670 | | | | $ | 10,920 | | |
| * | $0.001 par value, 6,900,000,000 shares authorized for the Portfolios in total. |
The accompanying notes are an integral part of these financial statements.
170 Annual Report
| | Lazard
Emerging Markets
Equity Advantage
Portfolio | | Lazard Emerging
Markets Equity
Blend Portfolio | | Lazard
Emerging Markets
Equity Portfolio | | Lazard
Equity Franchise
Portfolio | | Lazard Global
Equity Select
Portfolio |
| | | | | | | | | | | | | | | | | | | | | | | | | |
| | | $ | 28,428,439 | | | | $ | 78,571,562 | | | | $ | 4,356,109,191 | | | | $ | 91,820,141 | | | | $ | 93,547,368 | |
| | | | 3,711 | | | | | 2,030 | | | | | 254,772 | | | | | 19 | | | | | 39 | |
| | | | | | | | | | | | | | | | | | | | | | | | | |
| | | | 411,927 | | | | | 113,415 | | | | | 38,287,560 | | | | | — | | | | | — | |
| | | | 17,483 | | | | | 162,295 | | | | | 4,666,946 | | | | | 248,672 | | | | | 73,231 | |
| | | | 14,099 | | | | | 19,900 | | | | | 1,920,573 | | | | | 46 | | | | | 74,853 | |
| | | | — | | | | | — | | | | | — | | | | | — | | | | | — | |
| | | | 28,875,659 | | | | | 78,869,202 | | | | | 4,401,239,042 | | | | | 92,068,878 | | | | | 93,695,491 | |
| | | | | | | | | | | | | | | | | | | | | | | | | |
| | | | — | | | | | 114,882 | | | | | 4,274,918 | | | | | — | | | | | — | |
| | | | 6,234 | | | | | 46,935 | | | | | 3,646,577 | | | | | 48,457 | | | | | 47,276 | |
| | | | 20,006 | | | | | 47,335 | | | | | 732,587 | | | | | 14,216 | | | | | 21,954 | |
| | | | 3,245 | | | | | 73,134 | | | | | 430,216 | | | | | 2,969 | | | | | 1,973 | |
| | | | 46,649 | | | | | 51,882 | | | | | 193,997 | | | | | 24,017 | | | | | 26,276 | |
| | | | 202 | | | | | 899 | | | | | 99,916 | | | | | 22 | | | | | 237 | |
| | | | 187 | | | | | 1,331 | | | | | 29,806 | | | | | 28 | | | | | 75 | |
| | | | 1,224 | | | | | 6,233 | | | | | 27,579 | | | | | 1,996 | | | | | 10,203 | |
| | | | — | | | | | 31,116 | | | | | 15,462,888 | | | | | 112,433 | | | | | — | |
| | | | 21,315 | | | | | 64,885 | | | | | 6,618,644 | | | | | 11,681 | | | | | 7,149 | |
| | | | 3,021 | | | | | 5,695 | | | | | 223,649 | | | | | 3,614 | | | | | 4,519 | |
| | | | 102,083 | | | | | 444,327 | | | | | 31,740,777 | | | | | 219,433 | | | | | 119,662 | |
| | | $ | 28,773,576 | | | | $ | 78,424,875 | | | | $ | 4,369,498,265 | | | | $ | 91,849,445 | | | | $ | 93,575,829 | |
| | | | | | | | | | | | | | | | | | | | | | | | | |
| | | $ | 22,209,938 | | | | $ | 117,667,376 | | | | $ | 4,943,187,758 | | | | $ | 80,900,880 | | | | $ | 66,912,171 | |
| | | | 6,563,638 | | | | | (39,242,501 | ) | | | | (573,689,493 | ) | | | | 10,948,565 | | | | | 26,663,658 | |
| | | $ | 28,773,576 | | | | $ | 78,424,875 | | | | $ | 4,369,498,265 | | | | $ | 91,849,445 | | | | $ | 93,575,829 | |
| | | | | | | | | | | | | | | | | | | | | | | | | |
| | | $ | 27,897,734 | | | | $ | 74,406,215 | | | | $ | 3,923,877,626 | | | | $ | 91,720,205 | | | | $ | 92,418,059 | |
| | | | 2,022,986 | | | | | 5,390,573 | | | | | 217,598,338 | | | | | 9,016,463 | | | | | 5,662,503 | |
| | | | | | | | | | | | | | | | | | | | | | | | | |
| | | $ | 13.79 | | | | $ | 13.80 | | | | $ | 18.03 | | | | $ | 10.17 | | | | $ | 16.32 | |
| | | | | | | | | | | | | | | | | | | | | | | | | |
| | | $ | 875,842 | | | | $ | 4,018,660 | | | | $ | 421,989,760 | | | | $ | 129,240 | | | | $ | 1,157,770 | |
| | | | 63,491 | | | | | 290,075 | | | | | 22,707,741 | | | | | 12,708 | | | | | 70,899 | |
| | | | | | | | | | | | | | | | | | | | | | | | | |
| | | $ | 13.79 | | | | $ | 13.85 | | | | $ | 18.58 | | | | $ | 10.17 | | | | $ | 16.33 | |
| | | | | | | | | | | | | | | | | | | | | | | | | |
| | | | — | | | | | — | | | | $ | 23,630,879 | | | | | — | | | | | — | |
| | | | — | | | | | — | | | | | 1,310,139 | | | | | — | | | | | — | |
| | | | | | | | | | | | | | | | | | | | | | | | | |
| | | | — | | | | | — | | | | $ | 18.04 | | | | | — | | | | | — | |
| | | $ | 22,414,156 | | | | $ | 62,180,879 | | | | $ | 3,501,967,596 | | | | $ | 78,518,274 | | | | $ | 67,372,965 | |
| | | $ | 3,710 | | | | $ | 2,029 | | | | $ | 254,597 | | | | $ | 18 | | | | $ | 39 | |
Annual Report 171
| December 31, 2020 | Lazard
Global Listed
Infrastructure
Portfolio | | Lazard
Global Strategic
Equity Portfolio | |
| ASSETS | | | | | | | | | | |
| Investments in securities, at fair value | | $ | 6,896,861,347 | | | | $ | 4,279,658 | | |
| Non-controlled affiliated issuers, at fair value (Note 5) | | | 719,019,066 | | | | | — | | |
| Cash | | | 3,731 | | | | | — | | |
| Foreign currency, at fair value | | | 551,768 | | | | | 36 | | |
| Receivables for: | | | | | | | | | | |
| Dividends | | | 30,424,445 | | | | | 5,556 | | |
| Capital stock sold | | | 19,276,747 | | | | | — | | |
| Investments sold | | | 2,979,092 | | | | | — | | |
| Amount due from Investment Manager (Note 3) | | | — | | | | | 23,449 | | |
| Gross unrealized appreciation on forward currency contracts | | | 1,627,177 | | | | | — | | |
| Prepaid expenses | | | — | | | | | — | | |
| Total assets | | | 7,670,743,373 | | | | | 4,308,699 | | |
| LIABILITIES | | | | | | | | | | |
| Payables for: | | | | | | | | | | |
| Management fees | | | 5,824,404 | | | | | — | | |
| Accrued custodian fees | | | 373,170 | | | | | 13,720 | | |
| Accrued professional services | | | 78,975 | | | | | 26,054 | | |
| Accrued distribution fees | | | 68,286 | | | | | 37 | | |
| Accrued registration fees | | | 42,874 | | | | | 5,250 | | |
| Accrued shareholders’ reports | | | 24,122 | | | | | 1,962 | | |
| Accrued directors’ fees | | | 1,128 | | | | | 467 | | |
| Capital stock redeemed | | | 8,399,280 | | | | | — | | |
| Investments purchased | | | 521,660 | | | | | — | | |
| Gross unrealized depreciation on forward currency contracts | | | 57,767,779 | | | | | — | | |
| Line of credit outstanding | | | — | | | | | — | | |
| Other accrued expenses and payables | | | 204,690 | | | | | 901 | | |
| Total liabilities | | | 73,306,368 | | | | | 48,391 | | |
| Net assets | | $ | 7,597,437,005 | | | | $ | 4,260,308 | | |
| NET ASSETS | | | | | | | | | | |
| Paid in capital | | $ | 7,522,413,726 | | | | $ | 2,951,142 | | |
| Distributable earnings (Accumulated loss) | | | 75,023,279 | | | | | 1,309,166 | | |
| Net assets | | $ | 7,597,437,005 | | | | $ | 4,260,308 | | |
| Institutional Shares | | | | | | | | | | |
| Net assets | | $ | 7,289,679,801 | | | | $ | 4,075,837 | | |
| Shares of capital stock outstanding* | | | 497,500,386 | | | | | 336,354 | | |
| Net asset value, offering and redemption price per share | | $ | 14.65 | | | | $ | 12.12 | | |
| Open Shares | | | | | | | | | | |
| Net assets | | $ | 307,757,204 | | | | $ | 184,471 | | |
| Shares of capital stock outstanding* | | | 20,993,761 | | | | | 15,347 | | |
| Net asset value, offering and redemption price per share | | $ | 14.66 | | | | $ | 12.02 | | |
| R6 Shares | | | | | | | | | | |
| Net assets | | $ | — | | | | $ | — | | |
| Shares of capital stock outstanding* | | | — | | | | | — | | |
| Net asset value, offering and redemption price per share | | $ | — | | | | $ | — | | |
| Cost of investments in securities | | $ | 6,409,521,676 | | | | $ | 3,011,075 | | |
| Cost of non-controlled affiliated issuers | | $ | 843,268,226 | | | | $ | — | | |
| Cost of foreign currency | | $ | 550,254 | | | | $ | 35 | | |
| * | $0.001 par value, 6,900,000,000 shares authorized for the Portfolios in total. |
The accompanying notes are an integral part of these financial statements.
172 Annual Report
| | Lazard
International
Equity
Advantage
Portfolio | | Lazard
International
Equity
Concentrated
Portfolio | | Lazard
International
Equity
Portfolio | | Lazard
International
Equity
Select
Portfolio | | Lazard
International
Equity
Value
Portfolio |
| | | | | | | | | | | | | | | | | | | | | | | | | |
| | | $ | 2,627,764 | | | | $ | 14,310,096 | | | | $ | 3,057,726,425 | | | | $ | 94,831,895 | | | | $ | 2,759,590 | |
| | | | — | | | | | — | | | | | — | | | | | — | | | | | — | |
| | | | — | | | | | 1,421 | | | | | — | | | | | — | | | | | — | |
| | | | 342 | | | | | 1 | | | | | 79 | | | | | 387 | | | | | — | |
| | | | | | | | | | | | | | | | | | | | | | | | | |
| | | | 7,654 | | | | | 70,955 | | | | | 7,116,334 | | | | | 177,132 | | | | | 12,384 | |
| | | | — | | | | | — | | | | | 3,371,346 | | | | | 154,891 | | | | | 2,000 | |
| | | | — | | | | | 163,124 | | | | | — | | | | | — | | | | | 19,581 | |
| | | | 17,016 | | | | | 8,200 | | | | | — | | | | | — | | | | | 16,465 | |
| | | | | | | | | | | | | | | | | | | | | | | | | |
| | | | — | | | | | — | | | | | — | | | | | — | | | | | — | |
| | | | — | | | | | — | | | | | 50,969 | | | | | — | | | | | — | |
| | | | 2,652,776 | | | | | 14,553,797 | | | | | 3,068,265,153 | | | | | 95,164,305 | | | | | 2,810,020 | |
| | | | | | | | | | | | | | | | | | | | | | | | | |
| | | | — | | | | | — | | | | | 1,916,535 | | | | | 47,024 | | | | | — | |
| | | | 19,495 | | | | | 19,469 | | | | | 183,561 | | | | | 22,479 | | | | | 12,969 | |
| | | | 34,196 | | | | | 27,412 | | | | | 62,185 | | | | | 41,619 | | | | | 26,905 | |
| | | | 24 | | | | | 89 | | | | | 50,631 | | | | | 551 | | | | | 13 | |
| | | | 1,593 | | | | | 4,974 | | | | | 3,163 | | | | | 21,286 | | | | | 14,057 | |
| | | | 3,567 | | | | | 3,663 | | | | | 101,080 | | | | | 5,170 | | | | | 3,837 | |
| | | | 53 | | | | | 459 | | | | | 456 | | | | | 34 | | | | | 210 | |
| | | | — | | | | | — | | | | | 3,117,763 | | | | | 34,005 | | | | | — | |
| | | | — | | | | | — | | | | | — | | | | | — | | | | | — | |
| | | | | | | | | | | | | | | | | | | | | | | | | |
| | | | — | | | | | — | | | | | — | | | | | — | | | | | — | |
| | | | — | | | | | 435,000 | | | | | — | | | | | — | | | | | — | |
| | | | 2,758 | | | | | 1,882 | | | | | 179,666 | | | | | 3,299 | | | | | 1,132 | |
| | | | 61,686 | | | | | 492,948 | | | | | 5,615,040 | | | | | 175,467 | | | | | 59,123 | |
| | | $ | 2,591,090 | | | | $ | 14,060,849 | | | | $ | 3,062,650,113 | | | | $ | 94,988,838 | | | | $ | 2,750,897 | |
| | | | | | | | | | | | | | | | | | | | | | | | | |
| | | $ | 2,458,287 | | | | $ | 24,049,320 | | | | $ | 2,466,096,465 | | | | $ | 82,290,992 | | | | $ | 3,321,726 | |
| | | | 132,803 | | | | | (9,988,471 | ) | | | | 596,553,648 | | | | | 12,697,846 | | | | | (570,829 | ) |
| | | $ | 2,591,090 | | | | $ | 14,060,849 | | | | $ | 3,062,650,113 | | | | $ | 94,988,838 | | | | $ | 2,750,897 | |
| | | | | | | | | | | | | | | | | | | | | | | | | |
| | | $ | 2,472,170 | | | | $ | 13,648,283 | | | | $ | 2,812,450,496 | | | | $ | 92,120,963 | | | | $ | 2,710,628 | |
| | | | 239,526 | | | | | 1,364,089 | | | | | 140,490,643 | | | | | 7,993,045 | | | | | 289,650 | |
| | | | | | | | | | | | | | | | | | | | | | | | | |
| | | $ | 10.32 | | | | $ | 10.01 | | | | $ | 20.02 | | | | $ | 11.53 | | | | $ | 9.36 | |
| | | | | | | | | | | | | | | | | | | | | | | | | |
| | | $ | 118,920 | | | | $ | 412,566 | | | | $ | 120,781,017 | | | | $ | 2,867,875 | | | | $ | 40,269 | |
| | | | 11,520 | | | | | 41,089 | | | | | 5,960,372 | | | | | 247,615 | | | | | 4,300 | |
| | | | | | | | | | | | | | | | | | | | | | | | | |
| | | $ | 10.32 | | | | $ | 10.04 | | | | $ | 20.26 | | | | $ | 11.58 | | | | $ | 9.36 | |
| | | | | | | | | | | | | | | | | | | | | | | | | |
| | | $ | — | | | | $ | — | | | | $ | 129,418,600 | | | | $ | — | | | | $ | — | |
| | | | — | | | | | — | | | | | 6,473,822 | | | | | — | | | | | — | |
| | | | | | | | | | | | | | | | | | | | | | | | | |
| | | $ | — | | | | $ | — | | | | $ | 19.99 | | | | $ | — | | | | $ | — | |
| | | $ | 2,211,468 | | | | $ | 12,082,245 | | | | $ | 2,403,997,488 | | | | $ | 78,294,945 | | | | $ | 2,374,840 | |
| | | $ | — | | | | $ | — | | | | $ | — | | | | $ | — | | | | $ | — | |
| | | $ | 339 | | | | $ | 1 | | | | $ | 79 | | | | $ | 385 | | | | $ | — | |
Annual Report 173
| December 31, 2020 | Lazard
International
Quality Growth
Portfolio | | Lazard
International
Small Cap
Equity Portfolio | |
| ASSETS | | | | | | | | | | |
| Investments in securities, at fair value | | $ | 10,973,555 | | | | $ | 41,849,898 | | |
| Cash | | | — | | | | | — | | |
| Foreign currency, at fair value | | | — | | | | | 63 | | |
| Receivables for: | | | | | | | | | | |
| Dividends | | | 8,764 | | | | | 148,320 | | |
| Capital stock sold | | | 145,729 | | | | | 50,780 | | |
| Investments sold | | | — | | | | | 449 | | |
| Amount due from Investment Manager (Note 3) | | | 11,286 | | | | | — | | |
| Prepaid expenses | | | — | | | | | 59,856 | | |
| Total assets | | | 11,139,334 | | | | | 42,109,366 | | |
| LIABILITIES | | | | | | | | | | |
| Payables for: | | | | | | | | | | |
| Management fees | | | — | | | | | 15,548 | | |
| Foreign capital gains taxes | | | — | | | | | 8,994 | | |
| Accrued custodian fees | | | 10,688 | | | | | 23,391 | | |
| Accrued shareholders’ reports | | | 7,131 | | | | | 7,009 | | |
| Accrued distribution fees | | | 59 | | | | | 2,774 | | |
| Accrued professional services | | | 25,129 | | | | | 49,587 | | |
| Accrued directors’ fees | | | 36 | | | | | 154 | | |
| Capital stock redeemed | | | — | | | | | 33,633 | | |
| Investments purchased | | | 327,659 | | | | | — | | |
| Other accrued expenses and payables | | | 4,381 | | | | | 13,088 | | |
| Total liabilities | | | 375,083 | | | | | 154,178 | | |
| Net assets | | $ | 10,764,251 | | | | $ | 41,955,188 | | |
| NET ASSETS | | | | | | | | | | |
| Paid in capital | | $ | 8,382,032 | | | | $ | 33,967,563 | | |
| Distributable earnings (Accumulated loss) | | | 2,382,219 | | | | | 7,987,625 | | |
| Net assets | | $ | 10,764,251 | | | | $ | 41,955,188 | | |
| Institutional Shares | | | | | | | | | | |
| Net assets | | $ | 10,473,094 | | | | $ | 29,373,738 | | |
| Shares of capital stock outstanding* | | | 671,884 | | | | | 2,175,223 | | |
| Net asset value, offering and redemption price per share | | $ | 15.59 | | | | $ | 13.50 | | |
| Open Shares | | | | | | | | | | |
| Net assets | | $ | 291,157 | | | | $ | 12,581,450 | | |
| Shares of capital stock outstanding* | | | 18,777 | | | | | 931,724 | | |
| Net asset value, offering and redemption price per share | | $ | 15.51 | | | | $ | 13.50 | | |
| R6 Shares | | | | | | | | | | |
| Net assets | | | — | | | | | — | | |
| Shares of capital stock outstanding* | | | — | | | | | — | | |
| Net asset value, offering and redemption price per share | | | — | | | | | — | | |
| Cost of investments in securities | | $ | 8,534,967 | | | | $ | 32,381,967 | | |
| Cost of foreign currency | | $ | — | | | | $ | 63 | | |
| * | $0.001 par value, 6,900,000,000 shares authorized for the Portfolios in total. |
The accompanying notes are an integral part of these financial statements.
174 Annual Report
| | Lazard
International
Strategic
Equity Portfolio | | Lazard
Managed Equity
Volatility Portfolio | | Lazard
US Equity
Concentrated
Portfolio | | Lazard
US Equity
Focus
Portfolio | | Lazard
US Small-Mid
Cap Equity
Portfolio |
| | | | | | | | | | | | | | | | | | | | | | | | | |
| | | $ | 5,919,732,274 | | | | $ | 25,797,010 | | | | $ | 1,971,301,937 | | | | $ | 53,138,787 | | | | $ | 102,213,674 | |
| | | | — | | | | | — | | | | | — | | | | | — | | | | | 2,080,779 | |
| | | | 53,644 | | | | | 45 | | | | | — | | | | | — | | | | | — | |
| | | | | | | | | | | | | | | | | | | | | | | | | |
| | | | 11,956,166 | | | | | 53,222 | | | | | 1,104,601 | | | | | 16,666 | | | | | 95,042 | |
| | | | 3,984,784 | | | | | 19,357 | | | | | 2,775,140 | | | | | 42,344 | | | | | 5,805 | |
| | | | — | | | | | — | | | | | — | | | | | — | | | | | — | |
| | | | — | | | | | 3,291 | | | | | — | | | | | 1,415 | | | | | — | |
| | | | 258,472 | | | | | — | | | | | — | | | | | — | | | | | — | |
| | | | 5,935,985,340 | | | | | 25,872,925 | | | | | 1,975,181,678 | | | | | 53,199,212 | | | | | 104,395,300 | |
| | | | | | | | | | | | | | | | | | | | | | | | | |
| | | | 3,704,519 | | | | | — | | | | | 1,149,753 | | | | | — | | | | | 67,145 | |
| | | | 1,997,334 | | | | | — | | | | | — | | | | | — | | | | | — | |
| | | | 305,441 | | | | | 21,478 | | | | | 70,455 | | | | | 14,199 | | | | | 19,332 | |
| | | | 144,705 | | | | | 3,092 | | | | | 3,784 | | | | | 2,778 | | | | | 7,941 | |
| | | | 120,237 | | | | | 22 | | | | | 7,903 | | | | | 267 | | | | | 2,528 | |
| | | | 59,947 | | | | | 28,988 | | | | | 39,221 | | | | | 51,230 | | | | | 29,457 | |
| | | | 697 | | | | | 660 | | | | | 481 | | | | | 1,872 | | | | | 523 | |
| | | | 4,857,333 | | | | | — | | | | | 972,078 | | | | | 15,001 | | | | | 627,452 | |
| | | | — | | | | | — | | | | | — | | | | | — | | | | | — | |
| | | | 220,340 | | | | | 4,973 | | | | | 35,744 | | | | | 6,114 | | | | | 8,509 | |
| | | | 11,410,553 | | | | | 59,213 | | | | | 2,279,419 | | | | | 91,461 | | | | | 762,887 | |
| | | $ | 5,924,574,787 | | | | $ | 25,813,712 | | | | $ | 1,972,902,259 | | | | $ | 53,107,751 | | | | $ | 103,632,413 | |
| | | | | | | | | | | | | | | | | | | | | | | | | |
| | | $ | 4,507,544,142 | | | | $ | 25,284,784 | | | | $ | 1,385,702,554 | | | | $ | 35,131,898 | | | | $ | 83,356,311 | |
| | | | 1,417,030,645 | | | | | 528,928 | | | | | 587,199,705 | | | | | 17,975,853 | | | | | 20,276,102 | |
| | | $ | 5,924,574,787 | | | | $ | 25,813,712 | | | | $ | 1,972,902,259 | | | | $ | 53,107,751 | | | | $ | 103,632,413 | |
| | | | | | | | | | | | | | | | | | | | | | | | | |
| | | $ | 5,270,610,960 | | | | $ | 25,737,309 | | | | $ | 1,936,366,991 | | | | $ | 31,075,300 | | | | $ | 91,983,986 | |
| | | | 313,114,237 | | | | | 2,184,318 | | | | | 107,284,843 | | | | | 2,323,580 | | | | | 6,377,893 | |
| | | | | | | | | | | | | | | | | | | | | | | | | |
| | | $ | 16.83 | | | | $ | 11.78 | | | | $ | 18.05 | | | | $ | 13.37 | | | | $ | 14.42 | |
| | | | | | | | | | | | | | | | | | | | | | | | | |
| | | $ | 535,285,408 | | | | $ | 76,403 | | | | $ | 34,358,484 | | | | $ | 1,285,343 | | | | $ | 10,964,641 | |
| | | | 31,509,845 | | | | | 6,488 | | | | | 1,888,783 | | | | | 95,597 | | | | | 827,420 | |
| | | | | | | | | | | | | | | | | | | | | | | | | |
| | | $ | 16.99 | | | | $ | 11.78 | | | | $ | 18.19 | | | | $ | 13.45 | | | | $ | 13.25 | |
| | | | | | | | | | | | | | | | | | | | | | | | | |
| | | $ | 118,678,419 | | | | | — | | | | $ | 2,176,784 | | | | $ | 20,747,108 | | | | $ | 683,786 | |
| | | | 7,044,138 | | | | | — | | | | | 120,303 | | | | | 1,550,718 | | | | | 47,409 | |
| | | | | | | | | | | | | | | | | | | | | | | | | |
| | | $ | 16.85 | | | | | — | | | | $ | 18.09 | | | | $ | 13.38 | | | | $ | 14.42 | |
| | | $ | 4,407,944,857 | | | | $ | 24,103,355 | | | | $ | 1,403,606,405 | | | | $ | 36,753,429 | | | | $ | 76,969,454 | |
| | | $ | 54,032 | | | | $ | 44 | | | | $ | — | | | | $ | — | | | | $ | — | |
Annual Report 175
| December 31, 2020 | | Lazard
US Sustainable
Equity Portfolio |
| ASSETS | | | | |
| Investments in securities, at fair value | | | $ | 11,568,793 | |
| Receivables for: | | | | | |
| Capital stock sold | | | | 105,000 | |
| Amount due from Investment Manager (Note 3) | | | | 23,863 | |
| Dividends | | | | 4,387 | |
| Deferred offering costs (Note 2(f)) | | | | 65,721 | |
| Total assets | | | | 11,767,764 | |
| LIABILITIES | | | | | |
| Payables for: | | | | | |
| Offering costs (Note 2(f)) | | | | 113,422 | |
| Accrued professional services | | | | 14,366 | |
| Accrued custodian fees | | | | 9,489 | |
| Accrued distribution fees | | | | 25 | |
| Accrued directors’ fees | | | | 14 | |
| Other accrued expenses and payables | | | | 12,469 | |
| Total liabilities | | | | 149,785 | |
| Net assets | | | $ | 11,617,979 | |
| NET ASSETS | | | | | |
| Paid in capital | | | $ | 9,869,936 | |
| Distributable earnings (Accumulated loss) | | | | 1,748,043 | |
| Net assets | | | $ | 11,617,979 | |
| Institutional Shares | | | | | |
| Net assets | | | $ | 11,489,830 | |
| Shares of capital stock outstanding* | | | | 942,026 | |
| Net asset value, offering and redemption price per share | | | $ | 12.20 | |
| Open Shares | | | | | |
| Net assets | | | $ | 128,149 | |
| Shares of capital stock outstanding* | | | | 10,495 | |
| Net asset value, offering and redemption price per share | | | $ | 12.21 | |
| Cost of investments in securities | | | $ | 9,849,458 | |
| * | $0.001 par value, 6,900,000,000 shares authorized for the Portfolios in total. |
The accompanying notes are an integral part of these financial statements.
176 Annual Report
[This page intentionally left blank]
Annual Report 177
The Lazard Funds, Inc. Statements of Operations
| For the Year Ended December 31, 2020 | | Lazard
Developing Markets
Equity Portfolio | | Lazard Emerging
Markets Core
Equity Portfolio | |
| Investment Income (Loss) | | | | | | | | | | | |
| Income | | | | | | | | | | | |
| Dividends* | | | $ | 2,730,752 | | | | $ | 3,406,067 | | |
| Expenses | | | | | | | | | | | |
| Management fees (Note 3) | | | | 1,827,386 | | | | | 1,797,609 | | |
| Custodian fees | | | | 152,182 | | | | | 116,416 | | |
| Distribution fees (Open Shares) | | | | 20,212 | | | | | 4,929 | | |
| Shareholders’ reports | | | | 29,247 | | | | | 25,161 | | |
| Administration fees | | | | 42,263 | | | | | 44,539 | | |
| Professional services | | | | 69,327 | | | | | 58,184 | | |
| Directors’ fees and expenses | | | | 15,474 | | | | | 14,806 | | |
| Shareholders’ services | | | | 23,808 | | | | | 16,690 | | |
| Registration fees | | | | 42,265 | | | | | 67,034 | | |
| Other^ | | | | 9,332 | | | | | 15,020 | | |
| Total gross expenses | | | | 2,231,496 | | | | | 2,160,388 | | |
| Management fees waived and expenses reimbursed | | | | (75,915 | ) | | | | (5,291 | ) | |
| Total net expenses | | | | 2,155,581 | | | | | 2,155,097 | | |
| Net investment income (loss) | | | | 575,171 | | | | | 1,250,970 | | |
| Net Realized and Unrealized Gain (Loss) | | | | | | | | | | | |
| Net realized gain (loss) on: | | | | | | | | | | | |
| Investments** | | | | 1,142,588 | | | | | (15,213,418 | ) | |
| Foreign currency transactions | | | | (212,122 | ) | | | | (50,411 | ) | |
| Total net realized gain (loss) | | | | 930,466 | | | | | (15,263,829 | ) | |
| Net change in unrealized appreciation (depreciation) on: | | | | | | | | | | | |
| Investments† | | | | 19,622,987 | | | | | 36,378,070 | | |
| Foreign currency translations | | | | 39,612 | | | | | 2,223 | | |
| Total net change in unrealized appreciation (depreciation) | | | | 19,662,599 | | | | | 36,380,293 | | |
| Net realized and unrealized gain (loss) | | | | 20,593,065 | | | | | 21,116,464 | | |
| Net increase (decrease) in net assets resulting from operations | | | $ | 21,168,236 | | | | $ | 22,367,434 | | |
| * | Net of foreign withholding taxes of | | | $ | 315,471 | | | | $ | 511,556 | | |
| ** | Net of foreign capital gains taxes of | | | $ | (74,087 | ) | | | $ | — | | |
| † | Includes net change in unrealized appreciation (depreciation) of foreign capital gains taxes of | | | $ | 18,265 | | | | $ | 7,324 | | |
| ^ | Includes interest on line of credit of | | | $ | 496 | | | | $ | 1,304 | | |
The accompanying notes are an integral part of these financial statements.
178 Annual Report
| | Lazard
Emerging Markets
Equity Advantage
Portfolio | | Lazard Emerging
Markets Equity
Blend Portfolio | | Lazard
Emerging Markets
Equity Portfolio | | Lazard
Equity Franchise
Portfolio | | Lazard Global
Equity Select
Portfolio |
| | | | | | | | | | | | | | | | | | | | | | | | | |
| | | $ | 363,694 | | | | $ | 1,863,664 | | | | $ | 176,839,140 | | | | $ | 1,155,506 | | | | $ | 944,396 | |
| | | | | | | | | | | | | | | | | | | | | | | | | |
| | | | 156,399 | | | | | 775,430 | | | | | 51,292,796 | | | | | 451,276 | | | | | 449,689 | |
| | | | 72,743 | | | | | 133,881 | | | | | 2,089,502 | | | | | 44,170 | | | | | 64,347 | |
| | | | 2,197 | | | | | 9,975 | | | | | 1,284,097 | | | | | 454 | | | | | 2,489 | |
| | | | 6,276 | | | | | 59,274 | | | | | 715,618 | | | | | 5,127 | | | | | 8,586 | |
| | | | 23,405 | | | | | 30,392 | | | | | 516,342 | | | | | 27,525 | | | | | 29,115 | |
| | | | 48,753 | | | | | 68,288 | | | | | 461,734 | | | | | 43,535 | | | | | 43,408 | |
| | | | 5,707 | | | | | 11,485 | | | | | 345,252 | | | | | 6,823 | | | | | 7,979 | |
| | | | 9,926 | | | | | 17,482 | | | | | 298,404 | | | | | 9,954 | | | | | 12,796 | |
| | | | 36,678 | | | | | 36,410 | | | | | 18,926 | | | | | 33,619 | | | | | 33,404 | |
| | | | 6,572 | | | | | 7,174 | | | | | 235,217 | | | | | 9,753 | | | | | 9,957 | |
| | | | 368,656 | | | | | 1,149,791 | | | | | 57,257,888 | | | | | 632,236 | | | | | 661,770 | |
| | | | (163,845 | ) | | | | (189,894 | ) | | | | (5,235 | ) | | | | (93,658 | ) | | | | (35,058 | ) |
| | | | 204,811 | | | | | 959,897 | | | | | 57,252,653 | | | | | 538,578 | | | | | 626,712 | |
| | | | 158,883 | | | | | 903,767 | | | | | 119,586,487 | | | | | 616,928 | | | | | 317,684 | |
| | | | | | | | | | | | | | | | | | | | | | | | | |
| | | | 883,099 | | | | | (2,249,451 | ) | | | | (419,542,443 | ) | | | | (1,409,184 | ) | | | | 9,748,110 | |
| | | | (21,992 | ) | | | | (59,146 | ) | | | | (7,269,687 | ) | | | | (2,954 | ) | | | | (17,711 | ) |
| | | | 861,107 | | | | | (2,308,597 | ) | | | | (426,812,130 | ) | | | | (1,412,138 | ) | | | | 9,730,399 | |
| | | | | | | | | | | | | | | | | | | | | | | | | |
| | | | 4,662,594 | | | | | 7,729,362 | | | | | (347,964,757 | ) | | | | 12,203,586 | | | | | 8,083,708 | |
| | | | 1,310 | | | | | 1,360 | | | | | 27,675 | | | | | 656 | | | | | 2,672 | |
| | | | | | | | | | | | | | | | | | | | | | | | | |
| | | | 4,663,904 | | | | | 7,730,722 | | | | | (347,937,082 | ) | | | | 12,204,242 | | | | | 8,086,380 | |
| | | | 5,525,011 | | | | | 5,422,125 | | | | | (774,749,212 | ) | | | | 10,792,104 | | | | | 17,816,779 | |
| | | | | | | | | | | | | | | | | | | | | | | | | |
| | | $ | 5,683,894 | | | | $ | 6,325,892 | | | | $ | (655,162,725 | ) | | | $ | 11,409,032 | | | | $ | 18,134,463 | |
| | | $ | 52,817 | | | | $ | 243,079 | | | | $ | 23,393,996 | | | | $ | 35,872 | | | | $ | 46,080 | |
| | | $ | — | | | | $ | (7,704 | ) | | | $ | 5,627,164 | | | | $ | — | | | | $ | — | |
| | | | | | | | | | | | | | | | | | | | | | | | | |
| | | $ | — | | | | $ | (44,117 | ) | | | $ | 6,784,698 | | | | $ | — | | | | $ | — | |
| | | $ | 50 | | | | $ | 504 | | | | $ | 376 | | | | $ | 1,193 | | | | $ | 939 | |
Annual Report 179
| For the Year Ended December 31, 2020 | | Lazard
Global Listed
Infrastructure
Portfolio | | Lazard
Global Strategic
Equity Portfolio | |
| Investment Income (Loss) | | | | | | | | | | | |
| | | | | | | | | | | | |
| Income | | | | | | | | | | | |
| Dividends | | | | | | | | | | | |
| Unaffiliated issuers | | | $ | 170,193,652 | | | | $ | 41,318 | | |
| Non-controlled affiliated issuers (a) | | | | 22,800,822 | | | | | — | | |
| Non-cash dividends | | | | 15,419,827 | | | | | — | | |
| Total investment income* | | | | 208,414,301 | | | | | 41,318 | | |
| Expenses | | | | | | | | | | | |
| Management fees (Note 3) | | | | 66,219,755 | | | | | 25,734 | | |
| Custodian fees | | | | 1,142,522 | | | | | 42,128 | | |
| Distribution fees (Open Shares) | | | | 900,234 | | | | | 368 | | |
| Administration fees | | | | 691,619 | | | | | 21,798 | | |
| Professional services | | | | 643,818 | | | | | 45,452 | | |
| Shareholders’ reports | | | | 559,332 | | | | | 6,480 | | |
| Shareholders’ services | | | | 490,742 | | | | | 8,579 | | |
| Directors’ fees and expenses | | | | 365,835 | | | | | 5,616 | | |
| Registration fees | | | | 276,294 | | | | | 43,925 | | |
| Other^ | | | | 291,370 | | | | | 1,348 | | |
| Total gross expenses | | | | 71,581,521 | | | | | 201,428 | | |
| Management fees waived and expenses reimbursed | | | | — | | | | | (167,730 | ) | |
| Total net expenses | | | | 71,581,521 | | | | | 33,698 | | |
| Net investment income (loss) | | | | 136,832,780 | | | | | 7,620 | | |
| Net Realized and Unrealized Gain (Loss) | | | | | | | | | | | |
| Net realized gain (loss) on: | | | | | | | | | | | |
| Investments | | | | 111,160,782 | | | | | 175,088 | | |
| Non-controlled affiliated issuers (a) | | | | (12,355,921 | ) | | | | — | | |
| Foreign currency transactions | | | | 1,733,930 | | | | | (442 | ) | |
| Forward currency contracts | | | | (342,450,293 | ) | | | | — | | |
| Total net realized gain (loss) | | | | (241,911,502 | ) | | | | 174,646 | | |
| Net change in unrealized appreciation (depreciation) on: | | | | | | | | | | | |
| Investments | | | | (245,851,794 | ) | | | | 562,514 | | |
| Non-controlled affiliated issuers (a) | | | | (77,970,187 | ) | | | | — | | |
| Foreign currency translations | | | | 108,452 | | | | | 351 | | |
| Forward currency contracts | | | | 3,106,193 | | | | | — | | |
| Total net change in unrealized appreciation (depreciation) | | | | (320,607,336 | ) | | | | 562,865 | | |
| Net realized and unrealized gain (loss) | | | | (562,518,838 | ) | | | | 737,511 | | |
| Net increase from payments by affiliates (a) | | | | — | | | | | — | | |
| Net increase (decrease) in net assets resulting from operations | | | $ | (425,686,058 | ) | | | $ | 745,131 | | |
| * | Net of foreign withholding taxes of | | | $ | 14,242,011 | | | | $ | 2,878 | | |
| ^ | Includes interest on line of credit of | | | $ | — | | | | $ | — | | |
| (a) | See Note 5 for information on affiliated issuers. |
The accompanying notes are an integral part of these financial statements.
180 Annual Report
| | Lazard
International
Equity
Advantage
Portfolio | | Lazard
International
Equity
Concentrated
Portfolio | | Lazard
International
Equity
Portfolio | | Lazard
International
Equity
Select
Portfolio | | Lazard
International
Equity
Value
Portfolio |
| | | | | | | | | | | | | | | | | | | | | | | | | |
| | | $ | 65,936 | | | | $ | 1,039,008 | | | | $ | 54,700,603 | | | | $ | 1,715,650 | | | | $ | 61,220 | |
| | | | — | | | | | — | | | | | — | | | | | — | | | | | — | |
| | | | 5,598 | | | | | — | | | | | — | | | | | — | | | | | 12,718 | |
| | | | 71,534 | | | | | 1,039,008 | | | | | 54,700,603 | | | | | 1,715,650 | | | | | 73,938 | |
| | | | | | | | | | | | | | | | | | | | | | | | | |
| | | | 14,782 | | | | | 439,611 | | | | | 20,170,669 | | | | | 557,382 | | | | | 21,897 | |
| | | | 63,534 | | | | | 64,194 | | | | | 549,992 | | | | | 74,141 | | | | | 30,779 | |
| | | | 258 | | | | | 938 | | | | | 576,879 | | | | | 5,930 | | | | | 128 | |
| | | | 21,671 | | | | | 28,112 | | | | | 314,898 | | | | | 31,176 | | | | | 21,736 | |
| | | | 39,785 | | | | | 43,470 | | | | | 385,445 | | | | | 52,818 | | | | | 42,708 | |
| | | | 5,308 | | | | | 7,089 | | | | | 301,935 | | | | | 15,951 | | | | | 5,075 | |
| | | | 8,168 | | | | | 10,580 | | | | | 108,801 | | | | | 12,736 | | | | | 8,428 | |
| | | | 5,161 | | | | | 9,213 | | | | | 132,549 | | | | | 9,310 | | | | | 5,546 | |
| | | | 39,362 | | | | | 39,575 | | | | | 95,564 | | | | | 56,090 | | | | | 47,996 | |
| | | | 1,005 | | | | | 7,023 | | | | | 103,241 | | | | | 8,292 | | | | | 311 | |
| | | | 199,034 | | | | | 649,805 | | | | | 22,739,973 | | | | | 823,826 | | | | | 184,604 | |
| | | | (178,287 | ) | | | | (133,625 | ) | | | | (22,312 | ) | | | | (45,318 | ) | | | | (158,438 | ) |
| | | | 20,747 | | | | | 516,180 | | | | | 22,717,661 | | | | | 778,508 | | | | | 26,166 | |
| | | | 50,787 | | | | | 522,828 | | | | | 31,982,942 | | | | | 937,142 | | | | | 47,772 | |
| | | | | | | | | | | | | | | | | | | | | | | | | |
| | | | (134,393 | ) | | | | (9,954,036 | ) | | | | (22,036,061 | ) | | | | (1,758,547 | ) | | | | 1,801 | |
| | | | — | | | | | — | | | | | — | | | | | — | | | | | — | |
| | | | 149 | | | | | (5,710 | ) | | | | (332,308 | ) | | | | (21,864 | ) | | | | 8,460 | |
| | | | — | | | | | — | | | | | — | | | | | — | | | | | — | |
| | | | (134,244 | ) | | | | (9,959,746 | ) | | | | (22,368,369 | ) | | | | (1,780,411 | ) | | | | 10,261 | |
| | | | | | | | | | | | | | | | | | | | | | | | | |
| | | | 210,769 | | | | | (7,025,060 | ) | | | | 259,070,629 | | | | | 7,049,360 | | | | | (297,370 | ) |
| | | | — | | | | | — | | | | | — | | | | | — | | | | | — | |
| | | | 338 | | | | | 5,387 | | | | | 500,059 | | | | | 13,621 | | | | | 511 | |
| | | | — | | | | | — | | | | | — | | | | | — | | | | | — | |
| | | | | | | | | | | | | | | | | | | | | | | | | |
| | | | 211,107 | | | | | (7,019,673 | ) | | | | 259,570,688 | | | | | 7,062,981 | | | | | (296,859 | ) |
| | | | 76,863 | | | | | (16,979,419 | ) | | | | 237,202,319 | | | | | 5,282,570 | | | | | (286,598 | ) |
| | | | — | | | | | — | | | | | — | | | | | — | | | | | 88,959 | |
| | | | | | | | | | | | | | | | | | | | | | | | | |
| | | $ | 127,650 | | | | $ | (16,456,591 | ) | | | $ | 269,185,261 | | | | $ | 6,219,712 | | | | $ | (149,867 | ) |
| | | $ | 8,449 | | | | $ | 106,196 | | | | $ | 6,642,434 | | | | $ | 204,446 | | | | $ | 8,771 | |
| | | $ | — | | | | $ | 1,106 | | | | $ | — | | | | $ | — | | | | $ | 262 | |
Annual Report 181
| For the Year Ended December 31, 2020 | | Lazard
International
Quality Growth
Portfolio | | Lazard
International
Small Cap
Equity Portfolio | |
| Investment Income (Loss) | | | | | | | | | | | |
| | | | | | | | | | | | |
| Income | | | | | | | | | | | |
| Dividends* | | | $ | 62,013 | | | | $ | 759,104 | | |
| Expenses | | | | | | | | | | | |
| Management fees (Note 3) | | | | 42,575 | | | | | 330,827 | | |
| Distribution fees (Open Shares) | | | | 173 | | | | | 34,764 | | |
| Custodian fees | | | | 30,503 | | | | | 70,858 | | |
| Professional services | | | | 42,145 | | | | | 67,334 | | |
| Administration fees | | | | 22,026 | | | | | 26,509 | | |
| Shareholders’ reports | | | | 11,794 | | | | | 9,569 | | |
| Directors’ fees and expenses | | | | 5,194 | | | | | 7,477 | | |
| Shareholders’ services | | | | 8,366 | | | | | 16,107 | | |
| Registration fees | | | | 40,041 | | | | | 37,504 | | |
| Shareholders’ meeting | | | | — | | | | | — | | |
| Other^ | | | | 4,802 | | | | | 5,999 | | |
| Total gross expenses | | | | 207,619 | | | | | 606,948 | | |
| Management fees waived and expenses reimbursed | | | | (159,113 | ) | | | | (64,234 | ) | |
| Shareholders’ services fees waived | | | | — | | | | | — | | |
| Total net expenses | | | | 48,506 | | | | | 542,714 | | |
| Net investment income (loss) | | | | 13,507 | | | | | 216,390 | | |
| Net Realized and Unrealized Gain (Loss) | | | | | | | | | | | |
| Net realized gain (loss) on: | | | | | | | | | | | |
| Investments** | | | | 92,211 | | | | | 562,801 | | |
| Foreign currency transactions | | | | (3,149 | ) | | | | (15,472 | ) | |
| Total net realized gain (loss) | | | | 89,062 | | | | | 547,329 | | |
| Net change in unrealized appreciation (depreciation) on: | | | | | | | | | | | |
| Investments† | | | | 1,554,746 | | | | | 2,265,974 | | |
| Foreign currency translations | | | | 283 | | | | | 4,989 | | |
| Total net change in unrealized appreciation (depreciation) | | | | 1,555,029 | | | | | 2,270,963 | | |
| Net realized and unrealized gain (loss) | | | | 1,644,091 | | | | | 2,818,292 | | |
| Net increase (decrease) in net assets resulting from operations | | | $ | 1,657,598 | | | | $ | 3,034,682 | | |
| * | Net of foreign withholding taxes of | | | $ | 9,578 | | | | $ | 14,751 | | |
| ** | Net of foreign capital gains taxes of | | | $ | — | | | | $ | (55 | ) | |
| † | Includes net change in unrealized appreciation (depreciation) of foreign capital gains taxes of | | | $ | — | | | | $ | (8,994 | ) | |
| ^ | Includes interest on line of credit of | | | $ | — | | | | $ | 363 | | |
The accompanying notes are an integral part of these financial statements.
182 Annual Report
| | Lazard
International
Strategic
Equity Portfolio | | Lazard
Managed Equity
Volatility Portfolio | | Lazard
US Equity
Concentrated
Portfolio | | Lazard
US Equity
Focus
Portfolio | | Lazard
US Small-Mid Cap
Equity
Portfolio |
| | | | | | | | | | | | | | | | | | | | | | | | | |
| | | $ | 105,916,365 | | | | $ | 784,643 | | | | $ | 24,503,526 | | | | $ | 675,690 | | | | $ | 1,386,135 | |
| | | | | | | | | | | | | | | | | | | | | | | | | |
| | | | 39,977,480 | | | | | 182,045 | | | | | 11,593,825 | | | | | 230,830 | | | | | 806,229 | |
| | | | 1,332,947 | | | | | 364 | | | | | 92,132 | | | | | 2,790 | | | | | 28,021 | |
| | | | 1,039,962 | | | | | 66,136 | | | | | 197,168 | | | | | 40,299 | | | | | 50,711 | |
| | | | 538,014 | | | | | 40,502 | | | | | 139,552 | | | | | 133,496 | | | | | 51,403 | |
| | | | 532,426 | | | | | 24,932 | | | | | 211,605 | | | | | 28,875 | | | | | 36,553 | |
| | | | 314,955 | | | | | 5,881 | | | | | 137,473 | | | | | 7,671 | | | | | 13,868 | |
| | | | 285,960 | | | | | 7,096 | | | | | 75,416 | | | | | 9,244 | | | | | 10,947 | |
| | | | 158,672 | | | | | 9,624 | | | | | 72,397 | | | | | 12,789 | | | | | 20,987 | |
| | | | 73,481 | | | | | 35,268 | | | | | 94,086 | | | | | 40,624 | | | | | 58,164 | |
| | | | — | | | | | — | | | | | — | | | | | 21,974 | | | | | — | |
| | | | 198,596 | | | | | 6,913 | | | | | 66,130 | | | | | 7,187 | | | | | 10,330 | |
| | | | 44,452,493 | | | | | 378,761 | | | | | 12,679,784 | | | | | 535,779 | | | | | 1,087,213 | |
| | | | (7,162 | ) | | | | (150,233 | ) | | | | (3,142 | ) | | | | (238,819 | ) | | | | (3,325 | ) |
| | | | — | | | | | — | | | | | — | | | | | — | | | | | (534 | ) |
| | | | 44,445,331 | | | | | 228,528 | | | | | 12,676,642 | | | | | 296,960 | | | | | 1,083,354 | |
| | | | 61,471,034 | | | | | 556,115 | | | | | 11,826,884 | | | | | 378,730 | | | | | 302,781 | |
| | | | | | | | | | | | | | | | | | | | | | | | | |
| | | | (38,214,138 | ) | | | | (1,494,073 | ) | | | | 44,140,640 | | | | | 3,423,426 | | | | | (4,631,410 | ) |
| | | | (2,509,376 | ) | | | | 7,096 | | | | | — | | | | | — | | | | | — | |
| | | | (40,723,514 | ) | | | | (1,486,977 | ) | | | | 44,140,640 | | | | | 3,423,426 | | | | | (4,631,410 | ) |
| | | | | | | | | | | | | | | | | | | | | | | | | |
| | | | 412,260,632 | | | | | (962,542 | ) | | | | 276,752,935 | | | | | 4,304,928 | | | | | 9,989,695 | |
| | | | 799,513 | | | | | 1,933 | | | | | — | | | | | — | | | | | — | |
| | | | 413,060,145 | | | | | (960,609 | ) | | | | 276,752,935 | | | | | 4,304,928 | | | | | 9,989,695 | |
| | | | 372,336,631 | | | | | (2,447,586 | ) | | | | 320,893,575 | | | | | 7,728,354 | | | | | 5,358,285 | |
| | | | | | | | | | | | | | | | | | | | | | | | | |
| | | $ | 433,807,665 | | | | $ | (1,891,471 | ) | | | $ | 332,720,459 | | | | $ | 8,107,084 | | | | $ | 5,661,066 | |
| | | $ | 11,024,752 | | | | $ | 47,221 | | | | $ | — | | | | $ | — | | | | $ | — | |
| | | $ | 53,277 | | | | $ | — | | | | $ | — | | | | $ | — | | | | $ | — | |
| | | | | | | | | | | | | | | | | | | | | | | | | |
| | | $ | (682,690 | ) | | | $ | — | | | | $ | — | | | | $ | — | | | | $ | — | |
| | | $ | 7,570 | | | | $ | 310 | | | | $ | 2,718 | | | | $ | — | | | | $ | — | |
Annual Report 183
| For the Year Ended December 31, 2020 | | Lazard
US Sustainable
Equity Portfolio (a) |
| Investment Income (Loss) | | | | | |
| | | | | | |
| Income | | | | | |
| Dividends | | | $ | 64,795 | |
| Expenses | | | | | |
| Amortization of offering costs (Note 2(f)) | | | | 59,822 | |
| Professional services | | | | 31,125 | |
| Management fees (Note 3) | | | | 27,673 | |
| Custodian fees | | | | 15,000 | |
| Administration fees | | | | 9,576 | |
| Registration fees | | | | 6,980 | |
| Organization expenses (Note 2(f)) | | | | 3,949 | |
| Shareholders’ services | | | | 3,025 | |
| Shareholders’ reports | | | | 2,999 | |
| Directors’ fees and expenses | | | | 2,611 | |
| Distribution fees (Open Shares) | | | | 140 | |
| Other | | | | 649 | |
| Total gross expenses | | | | 163,549 | |
| Management fees waived and expenses reimbursed | | | | (127,324 | ) |
| Shareholders’ services fees waived | | | | (1,493 | ) |
| Total net expenses | | | | 34,732 | |
| Net investment income (loss) | | | | 30,063 | |
| Net Realized and Unrealized Gain (Loss) | | | | | |
| Net realized gain (loss) on Investments | | | | 61,946 | |
| Total net realized gain (loss) | | | | 61,946 | |
| Net change in unrealized appreciation (depreciation) on Investments | | | | 1,719,335 | |
| Total net change in unrealized appreciation (depreciation) | | | | 1,719,335 | |
| Net realized and unrealized gain (loss) | | | | 1,781,281 | |
| Net increase (decrease) in net assets resulting from operations | | | $ | 1,811,344 | |
| (a) | From the Portfolio’s commencement of operations on June 30, 2020 |
The accompanying notes are an integral part of these financial statements.
184 Annual Report
[This page intentionally left blank]
Annual Report 185
The Lazard Funds, Inc. Statements of Changes in Net Assets
| | | Lazard
Developing Markets Equity Portfolio | |
| | | Year Ended
December 31,
2020 | | Year Ended
December 31,
2019 | |
| Increase (Decrease) in Net Assets | | | | | | | | | |
| | | | | | | | | | |
| Operations | | | | | | | | | |
| Net investment income (loss) | | $ | 575,171 | | | $ | 1,472,917 | | |
| Net realized gain (loss) | | | 930,466 | | | | 10,699,901 | | |
| Net change in unrealized appreciation (depreciation) | | | 19,662,599 | | | | 46,727,992 | | |
| Net increase (decrease) in net assets resulting from operations | | | 21,168,236 | | | | 58,900,810 | | |
| | | | | | | | | | |
| Distributions to shareholders (Note 2(e)) | | | | | | | | | |
| Net investment income and net realized gains | | | | | | | | | |
| Institutional Shares | | | (500,286 | ) | | | (1,268,157 | ) | |
| Open Shares | | | (23,947 | ) | | | (3,920 | ) | |
| R6 Shares | | | — | | | | — | | |
| Return of capital | | | | | | | | | |
| Institutional Shares | | | — | | | | — | | |
| Open Shares | | | — | | | | — | | |
| Net decrease in net assets resulting from distributions | | | (524,233 | ) | | | (1,272,077 | ) | |
| | | | | | | | | | |
| Capital stock transactions | | | | | | | | | |
| Net proceeds from sales | | | | | | | | | |
| Institutional Shares | | | 33,579,728 | | | | 60,661,677 | | |
| Open Shares | | | 3,336,260 | | | | 4,243,002 | | |
| R6 Shares | | | — | | | | — | | |
| Net proceeds from reinvestment of distributions | | | | | | | | | |
| Institutional Shares | | | 389,550 | | | | 871,419 | | |
| Open Shares | | | 21,686 | | | | 3,642 | | |
| R6 Shares | | | — | | | | — | | |
| Cost of shares redeemed | | | | | | | | | |
| Institutional Shares | | | (88,565,915 | ) | | | (106,223,710 | ) | |
| Open Shares | | | (4,209,453 | ) | | | (4,159,882 | ) | |
| R6 Shares | | | — | | | | — | | |
| Net increase (decrease) in net assets from capital stock transactions | | | (55,448,144 | ) | | | (44,603,852 | ) | |
| Total increase (decrease) in net assets | | | (34,804,141 | ) | | | 13,024,881 | | |
| Net assets at beginning of period | | | 235,407,517 | | | | 222,382,636 | | |
| Net assets at end of period | | $ | 200,603,376 | | | $ | 235,407,517 | | |
The accompanying notes are an integral part of these financial statements.
186 Annual Report
| | Lazard Emerging
Markets Core Equity Portfolio | | Lazard Emerging
Markets Equity Advantage Portfolio | |
| | Year Ended
December 31,
2020 | | Year Ended
December 31,
2019 | | Year Ended
December 31,
2020 | | Year Ended
December 31,
2019 | |
| | | | | | | | | | | | | | | | | |
| | $ | 1,250,970 | | | $ | 4,000,423 | | | $ | 158,883 | | | $ | 189,925 | | |
| | | (15,263,829 | ) | | | (7,673,952 | ) | | | 861,107 | | | | (136,829 | ) | |
| | | 36,380,293 | | | | 42,879,231 | | | | 4,663,904 | | | | 1,227,385 | | |
| | | | | | | | | | | | | | | | | |
| | | 22,367,434 | | | | 39,205,702 | | | | 5,683,894 | | | | 1,280,481 | | |
| | | | | | | | | | | | | | | | | |
| | | (1,248,908 | ) | | | (3,951,746 | ) | | | (250,704 | ) | | | (180,292 | ) | |
| | | (6,940 | ) | | | (38,801 | ) | | | (6,176 | ) | | | (18,695 | ) | |
| | | (3,206 | ) | | | (11,560 | ) | | | — | | | | — | | |
| | | | | | | | | | | | | | | | | |
| | | — | | | | — | | | | — | | | | — | | |
| | | — | | | | — | | | | — | | | | — | | |
| | | (1,259,054 | ) | | | (4,002,107 | ) | | | (256,880 | ) | | | (198,987 | ) | |
| | | | | | | | | | | | | | | | | |
| | | 53,105,750 | | | | 52,118,039 | | | | 17,937,030 | | | | 5,720,662 | | |
| | | 1,691,273 | | | | 1,564,146 | | | | 608,209 | | | | 702,687 | | |
| | | 62,330 | | | | 29,966 | | | | — | | | | — | | |
| | | | | | | | | | | | | | | | | |
| | | 1,200,626 | | | | 3,771,010 | | | | 250,704 | | | | 180,292 | | |
| | | 6,902 | | | | 37,924 | | | | 6,176 | | | | 18,695 | | |
| | | 3,206 | | | | 11,560 | | | | — | | | | — | | |
| | | | | | | | | | | | | | | | | |
| | | (62,957,718 | ) | | | (101,386,896 | ) | | | (4,770,498 | ) | | | (784,072 | ) | |
| | | (1,705,658 | ) | | | (1,384,619 | ) | | | (1,037,074 | ) | | | (149,975 | ) | |
| | | (158,910 | ) | | | (32,195 | ) | | | — | | | | — | | |
| | | | | | | | | | | | | | | | | |
| | | (8,752,199 | ) | | | (45,271,065 | ) | | | 12,994,547 | | | | 5,688,289 | | |
| | | 12,356,181 | | | | (10,067,470 | ) | | | 18,421,561 | | | | 6,769,783 | | |
| | | 200,234,674 | | | | 210,302,144 | | | | 10,352,015 | | | | 3,582,232 | | |
| | $ | 212,590,855 | | | $ | 200,234,674 | | | $ | 28,773,576 | | | $ | 10,352,015 | | |
Annual Report 187
| | | Lazard
Developing Markets Equity Portfolio | |
| | | Year Ended
December 31,
2020 | | Year Ended
December 31,
2019 | |
| Shares issued and redeemed | | | | | | | | | |
| | | | | | | | | | |
| Institutional Shares | | | | | | | | | |
| Shares outstanding at beginning of period | | | 15,534,848 | | | | 18,836,550 | | |
| Shares sold | | | 2,536,944 | | | | 4,748,515 | | |
| Shares issued to shareholders from reinvestment of distributions | | | 27,818 | | | | 65,429 | | |
| Shares redeemed | | | (7,085,745 | ) | | | (8,115,646 | ) | |
| Net increase (decrease) | | | (4,520,983 | ) | | | (3,301,702 | ) | |
| Shares outstanding at end of period | | | 11,013,865 | | | | 15,534,848 | | |
| | | | | | | | | | |
| Open Shares | | | | | | | | | |
| Shares outstanding at beginning of period | | | 643,853 | | | | 639,563 | | |
| Shares sold | | | 242,484 | | | | 327,824 | | |
| Shares issued to shareholders from reinvestment of distributions | | | 1,556 | | | | 293 | | |
| Shares redeemed | | | (311,908 | ) | | | (323,827 | ) | |
| Net increase (decrease) | | | (67,868 | ) | | | 4,290 | | |
| Shares outstanding at end of period | | | 575,985 | | | | 643,853 | | |
| | | | | | | | | | |
| R6 Shares | | | | | | | | | |
| Shares outstanding at beginning of period | | | — | | | | — | | |
| Shares sold | | | — | | | | — | | |
| Shares issued to shareholders from reinvestment of distributions | | | — | | | | — | | |
| Shares redeemed | | | — | | | | — | | |
| Net increase (decrease) | | | — | | | | — | | |
| Shares outstanding at end of period | | | — | | | | — | | |
The accompanying notes are an integral part of these financial statements.
188 Annual Report
| | Lazard Emerging
Markets Core Equity Portfolio | | Lazard Emerging
Markets Equity Advantage Portfolio | |
| | Year Ended
December 31,
2020 | | Year Ended
December 31,
2019 | | Year Ended
December 31,
2020 | | Year Ended
December 31,
2019 | |
| | | | | | | | | | | | | | | | | |
| | | 16,728,969 | | | | 21,031,193 | | | | 775,852 | | | | 309,610 | | |
| | | 5,299,853 | | | | 4,828,636 | | | | 1,609,818 | | | | 519,700 | | |
| | | | | | | | | | | | | | | | | |
| | | 95,867 | | | | 322,340 | | | | 19,017 | | | | 15,331 | | |
| | | (6,153,594 | ) | | | (9,453,200 | ) | | | (381,701 | ) | | | (68,789 | ) | |
| | | (757,874 | ) | | | (4,302,224 | ) | | | 1,247,134 | | | | 466,242 | | |
| | | 15,971,095 | | | | 16,728,969 | | | | 2,022,986 | | | | 775,852 | | |
| | | | | | | | | | | | | | | | | |
| | | 206,183 | | | | 187,835 | | | | 98,083 | | | | 47,382 | | |
| | | 152,220 | | | | 143,185 | | | | 58,240 | | | | 63,649 | | |
| | | | | | | | | | | | | | | | | |
| | | 559 | | | | 3,247 | | | | 469 | | | | 1,588 | | |
| | | (164,608 | ) | | | (128,084 | ) | | | (93,301 | ) | | | (14,536 | ) | |
| | | (11,829 | ) | | | 18,348 | | | | (34,592 | ) | | | 50,701 | | |
| | | 194,354 | | | | 206,183 | | | | 63,491 | | | | 98,083 | | |
| | | | | | | | | | | | | | | | | |
| | | 50,582 | | | | 49,941 | | | | — | | | | — | | |
| | | 5,652 | | | | 2,722 | | | | — | | | | — | | |
| | | | | | | | | | | | | | | | | |
| | | 255 | | | | 987 | | | | — | | | | — | | |
| | | (15,035 | ) | | | (3,068 | ) | | | — | | | | — | | |
| | | (9,128 | ) | | | 641 | | | | — | | | | — | | |
| | | 41,454 | | | | 50,582 | | | | — | | | | — | | |
Annual Report 189
| | | Lazard Emerging
Markets Equity Blend Portfolio | |
| | | Year Ended
December 31,
2020 | | Year Ended
December 31,
2019 | |
| Increase (Decrease) in Net Assets | | | | | | | | | |
| | | | | | | | | | |
| Operations | | | | | | | | | |
| Net investment income (loss) | | $ | 903,767 | | | $ | 2,249,542 | | |
| Net realized gain (loss) | | | (2,308,597 | ) | | | 3,912,605 | | |
| Net change in unrealized appreciation (depreciation) | | | 7,730,722 | | | | 35,773,294 | | |
| Net increase (decrease) in net assets resulting from operations | | | 6,325,892 | | | | 41,935,441 | | |
| | | | | | | | | | |
| Distributions to shareholders (Note 2(e)) | | | | | | | | | |
| Net investment income and net realized gains | | | | | | | | | |
| Institutional Shares | | | (902,733 | ) | | | (2,027,625 | ) | |
| Open Shares | | | (38,967 | ) | | | (109,850 | ) | |
| R6 Shares | | | — | | | | — | | |
| Net decrease in net assets resulting from distributions | | | (941,700 | ) | | | (2,137,475 | ) | |
| | | | | | | | | | |
| Capital stock transactions | | | | | | | | | |
| Net proceeds from sales | | | | | | | | | |
| Institutional Shares | | | 13,037,212 | | | | 18,596,727 | | |
| Open Shares | | | 447,062 | | | | 671,088 | | |
| R6 Shares | | | — | | | | — | | |
| Net proceeds from reinvestment of distributions | | | | | | | | | |
| Institutional Shares | | | 889,530 | | | | 1,963,352 | | |
| Open Shares | | | 38,190 | | | | 108,503 | | |
| R6 Shares | | | — | | | | — | | |
| Cost of shares redeemed | | | | | | | | | |
| Institutional Shares | | | (41,254,117 | ) | | | (254,171,213 | ) | |
| Open Shares | | | (2,493,332 | ) | | | (2,194,573 | ) | |
| R6 Shares | | | — | | | | — | | |
| Net increase (decrease) in net assets from capital stock transactions | | | (29,335,455 | ) | | | (235,026,116 | ) | |
| Total increase (decrease) in net assets | | | (23,951,263 | ) | | | (195,228,150 | ) | |
| Net assets at beginning of period | | | 102,376,138 | | | | 297,604,288 | | |
| Net assets at end of period | | $ | 78,424,875 | | | $ | 102,376,138 | | |
The accompanying notes are an integral part of these financial statements.
190 Annual Report
| | Lazard Emerging
Markets Equity Portfolio | | Lazard Equity Franchise Portfolio | |
| | Year Ended
December 31,
2020 | | Year Ended
December 31,
2019 | | Year Ended
December 31,
2020 | | Year Ended
December 31,
2019 | |
| | | | | | | | | | | | | | | | | |
| | $ | 119,586,487 | | | $ | 202,889,114 | | | $ | 616,928 | | | $ | 553,844 | | |
| | | (426,812,130 | ) | | | (249,752,788 | ) | | | (1,412,138 | ) | | | 1,129,637 | | |
| | | (347,937,082 | ) | | | 1,440,971,114 | | | | 12,204,242 | | | | 2,184,201 | | |
| | | | | | | | | | | | | | | | | |
| | | (655,162,725 | ) | | | 1,394,107,440 | | | | 11,409,032 | | | | 3,867,682 | | |
| | | | | | | | | | | | | | | | | |
| | | (92,081,985 | ) | | | (169,041,662 | ) | | | (1,012,397 | ) | | | (2,185,328 | ) | |
| | | (8,363,930 | ) | | | (21,287,659 | ) | | | (1,121 | ) | | | (16,362 | ) | |
| | | (1,004,977 | ) | | | (4,559,729 | ) | | | — | | | | — | | |
| | | | | | | | | | | | | | | | | |
| | | (101,450,892 | ) | | | (194,889,050 | ) | | | (1,013,518 | ) | | | (2,201,690 | ) | |
| | | | | | | | | | | | | | | | | |
| | | 846,924,581 | | | | 1,241,319,671 | | | | 66,915,810 | | | | 32,121,208 | | |
| | | 40,640,285 | | | | 184,190,310 | | | | 33,698 | | | | 81,131 | | |
| | | 14,719,078 | | | | 23,433,026 | | | | — | | | | — | | |
| | | | | | | | | | | | | | | | | |
| | | 88,030,506 | | | | 158,855,659 | | | | 1,012,397 | | | | 2,185,328 | | |
| | | 8,264,600 | | | | 21,088,746 | | | | 1,121 | | | | 16,362 | | |
| | | 847,221 | | | | 4,399,954 | | | | — | | | | — | | |
| | | | | | | | | | | | | | | | | |
| | | (3,083,569,274 | ) | | | (3,359,204,875 | ) | | | (26,514,732 | ) | | | (4,408,143 | ) | |
| | | (453,247,114 | ) | | | (381,266,772 | ) | | | (183,641 | ) | | | (3,489 | ) | |
| | | (135,610,119 | ) | | | (103,858,799 | ) | | | — | | | | — | | |
| | | | | | | | | | | | | | | | | |
| | | (2,673,000,236 | ) | | | (2,211,043,080 | ) | | | 41,264,653 | | | | 29,992,397 | | |
| | | (3,429,613,853 | ) | | | (1,011,824,690 | ) | | | 51,660,167 | | | | 31,658,389 | | |
| | | 7,799,112,118 | | | | 8,810,936,808 | | | | 40,189,278 | | | | 8,530,889 | | |
| | $ | 4,369,498,265 | | | $ | 7,799,112,118 | | | $ | 91,849,445 | | | $ | 40,189,278 | | |
Annual Report 191
| | | Lazard Emerging
Markets Equity Blend Portfolio | |
| | | Year Ended
December 31,
2020 | | Year Ended
December 31,
2019 | |
| Shares issued and redeemed | | | | | | | | | |
| | | | | | | | | | |
| Institutional Shares | | | | | | | | | |
| Shares outstanding at beginning of period | | | 7,913,478 | | | | 29,084,201 | | |
| Shares sold | | | 1,164,850 | | | | 1,644,397 | | |
| Shares issued to shareholders from reinvestment of distributions | | | 67,134 | | | | 162,664 | | |
| Shares redeemed | | | (3,754,889 | ) | | | (22,977,784 | ) | |
| Net increase (decrease) | | | (2,522,905 | ) | | | (21,170,723 | ) | |
| Shares outstanding at end of period | | | 5,390,573 | | | | 7,913,478 | | |
| | | | | | | | | | |
| Open Shares | | | | | | | | | |
| Shares outstanding at beginning of period | | | 488,799 | | | | 617,871 | | |
| Shares sold | | | 37,429 | | | | 59,566 | | |
| Shares issued to shareholders from reinvestment of distributions | | | 2,871 | | | | 8,960 | | |
| Shares redeemed | | | (239,024 | ) | | | (197,598 | ) | |
| Net increase (decrease) | | | (198,724 | ) | | | (129,072 | ) | |
| Shares outstanding at end of period | | | 290,075 | | | | 488,799 | | |
| | | | | | | | | | |
| R6 Shares | | | | | | | | | |
| Shares outstanding at beginning of period | | | — | | | | — | | |
| Shares sold | | | — | | | | — | | |
| Shares issued to shareholders from reinvestment of distributions | | | — | | | | — | | |
| Shares redeemed | | | — | | | | — | | |
| Net increase (decrease) | | | — | | | | — | | |
| Shares outstanding at end of period | | | — | | | | — | | |
The accompanying notes are an integral part of these financial statements.
192 Annual Report
| | Lazard Emerging
Markets Equity Portfolio | | Lazard Equity Franchise Portfolio | |
| | Year Ended
December 31,
2020 | | Year Ended
December 31,
2019 | | Year Ended
December 31,
2020 | | Year Ended
December 31,
2019 | |
| | | | | | | | | | | | | | | | | |
| | | 359,649,575 | | | | 471,588,782 | | | | 3,919,193 | | | | 943,047 | | |
| | | 55,904,093 | | | | 72,409,703 | | | | 8,314,466 | | | | 3,186,958 | | |
| | | | | | | | | | | | | | | | | |
| | | 5,536,608 | | | | 9,054,452 | | | | 102,163 | | | | 214,812 | | |
| | | (203,491,938 | ) | | | (193,403,362 | ) | | | (3,319,359 | ) | | | (425,624 | ) | |
| | | (142,051,237 | ) | | | (111,939,207 | ) | | | 5,097,270 | | | | 2,976,146 | | |
| | | 217,598,338 | | | | 359,649,575 | | | | 9,016,463 | | | | 3,919,193 | | |
| | | | | | | | | | | | | | | | | |
| | | 50,941,578 | | | | 60,776,573 | | | | 30,624 | | | | 21,455 | | |
| | | 2,571,349 | | | | 10,411,216 | | | | 4,284 | | | | 7,904 | | |
| | | | | | | | | | | | | | | | | |
| | | 509,353 | | | | 1,171,555 | | | | 113 | | | | 1,608 | | |
| | | (31,314,539 | ) | | | (21,417,766 | ) | | | (22,313 | ) | | | (343 | ) | |
| | | (28,233,837 | ) | | | (9,834,995 | ) | | | (17,916 | ) | | | 9,169 | | |
| | | 22,707,741 | | | | 50,941,578 | | | | 12,708 | | | | 30,624 | | |
| | | | | | | | | | | | | | | | | |
| | | 9,977,898 | | | | 14,479,168 | | | | — | | | | — | | |
| | | 1,007,773 | | | | 1,342,114 | | | | — | | | | — | | |
| | | | | | | | | | | | | | | | | |
| | | 54,837 | | | | 250,131 | | | | — | | | | — | | |
| | | (9,730,369 | ) | | | (6,093,515 | ) | | | — | | | | — | | |
| | | (8,667,759 | ) | | | (4,501,270 | ) | | | — | | | | — | | |
| | | 1,310,139 | | | | 9,977,898 | | | | — | | | | — | | |
Annual Report 193
| | | Lazard Global Equity Select Portfolio | |
| | | Year Ended
December 31,
2020 | | Year Ended
December 31,
2019 | |
| Increase (Decrease) in Net Assets | | | | | |
| Operations | | | | | | | | | |
| Net investment income (loss) | | $ | 317,684 | | | $ | 625,877 | | |
| Net realized gain (loss) | | | 9,730,399 | | | | 582,620 | | |
| Net change in unrealized appreciation (depreciation) | | | 8,086,380 | | | | 15,260,079 | | |
| Net increase (decrease) in net assets resulting from operations | | | 18,134,463 | | | | 16,468,576 | | |
| Distributions to shareholders (Note 2(e)) | | | | | | | | | |
| Net investment income and net realized gains | | | | | | | | | |
| Institutional Shares | | | (3,043,294 | ) | | | (591,542 | ) | |
| Open Shares | | | (35,091 | ) | | | (4,254 | ) | |
| Return of capital | | | | | | | | | |
| Institutional Shares | | | — | | | | (41,874 | ) | |
| Open Shares | | | — | | | | (301 | ) | |
| Net decrease in net assets resulting from distributions | | | (3,078,385 | ) | | | (637,971 | ) | |
| Capital stock transactions | | | | | | | | | |
| Net proceeds from sales | | | | | | | | | |
| Institutional Shares | | | 57,343,908 | | | | 23,902,011 | | |
| Open Shares | | | 414,176 | | | | 300,952 | | |
| Net proceeds from reinvestment of distributions | | | | | | | | | |
| Institutional Shares | | | 3,031,617 | | | | 632,600 | | |
| Open Shares | | | 35,091 | | | | 4,555 | | |
| Cost of shares redeemed | | | | | | | | | |
| Institutional Shares | | | (64,939,018 | ) | | | (23,506,223 | ) | |
| Open Shares | | | (355,466 | ) | | | (319,957 | ) | |
| Net increase (decrease) in net assets from capital stock transactions | | | (4,469,692 | ) | | | 1,013,938 | | |
| Total increase (decrease) in net assets | | | 10,586,386 | | | | 16,844,543 | | |
| Net assets at beginning of period | | | 82,989,443 | | | | 66,144,900 | | |
| Net assets at end of period | | $ | 93,575,829 | | | $ | 82,989,443 | | |
The accompanying notes are an integral part of these financial statements.
194 Annual Report
| | Lazard Global
Listed Infrastructure Portfolio | | Lazard Global
Strategic Equity Portfolio | |
| | Year Ended
December 31,
2020 | | Year Ended
December 31,
2019 | | Year Ended
December 31,
2020 | | Year Ended
December 31,
2019 | |
| | | | | | | | | |
| | $ | 136,832,780 | | | $ | 174,078,680 | | | $ | 7,620 | | | $ | 30,113 | | |
| | | (241,911,502 | ) | | | 166,388,366 | | | | 174,646 | | | | 70,692 | | |
| | | (320,607,336 | ) | | | 946,115,341 | | | | 562,865 | | | | 666,188 | | |
| | | | | | | | | | | | | | | | | |
| | | (425,686,058 | ) | | | 1,286,582,387 | | | | 745,131 | | | | 766,993 | | |
| | | | | | | | | | | | | | | | | |
| | | (146,650,767 | ) | | | (297,455,372 | ) | | | (123,283 | ) | | | (86,901 | ) | |
| | | (7,331,111 | ) | | | (20,318,540 | ) | | | (5,397 | ) | | | (3,549 | ) | |
| | | | | | | | | | | | | | | | | |
| | | (34,264,854 | ) | | | — | | | | — | | | | — | | |
| | | (1,712,909 | ) | | | — | | | | — | | | | — | | |
| | | (189,959,641 | ) | | | (317,773,912 | ) | | | (128,680 | ) | | | (90,450 | ) | |
| | | | | | | | | | | | | | | | | |
| | | 2,811,013,767 | | | | 2,399,951,864 | | | | 253,851 | | | | 10,597 | | |
| | | 97,410,328 | | | | 148,379,347 | | | | 23,248 | | | | 3,345 | | |
| | | | | | | | | | | | | | | | | |
| | | 137,048,805 | | | | 231,028,647 | | | | 123,283 | | | | 86,901 | | |
| | | 8,929,119 | | | | 20,099,034 | | | | 5,397 | | | | 3,549 | | |
| | | | | | | | | | | | | | | | | |
| | | (2,357,774,296 | ) | | | (1,175,735,705 | ) | | | (77,247 | ) | | | (62,241 | ) | |
| | | (209,443,477 | ) | | | (217,741,894 | ) | | | (13,133 | ) | | | (26,927 | ) | |
| | | | | | | | | | | | | | | | | |
| | | 487,184,246 | | | | 1,405,981,293 | | | | 315,399 | | | | 15,224 | | |
| | | (128,461,453 | ) | | | 2,374,789,768 | | | | 931,850 | | | | 691,767 | | |
| | | 7,725,898,458 | | | | 5,351,108,690 | | | | 3,328,458 | | | | 2,636,691 | | |
| | $ | 7,597,437,005 | | | $ | 7,725,898,458 | | | $ | 4,260,308 | | | $ | 3,328,458 | | |
Annual Report 195
| | | Lazard Global Equity Select Portfolio | |
| | | Year Ended
December 31,
2020 | | Year Ended
December 31,
2019 | |
| Shares issued and redeemed | | | | | | | | | |
| Institutional Shares | | | | | | | | | |
| Shares outstanding at beginning of period | | | 5,634,353 | | | | 5,577,806 | | |
| Shares sold | | | 4,228,592 | | | | 1,750,065 | | |
| Shares issued to shareholders from reinvestment of distributions | | | 188,886 | | | | 43,567 | | |
| Shares redeemed | | | (4,389,328 | ) | | | (1,737,085 | ) | |
| Net increase (decrease) | | | 28,150 | | | | 56,547 | | |
| Shares outstanding at end of period | | | 5,662,503 | | | | 5,634,353 | | |
| Open Shares | | | | | | | | | |
| Shares outstanding at beginning of period | | | 64,021 | | | | 65,049 | | |
| Shares sold | | | 28,090 | | | | 22,134 | | |
| Shares issued to shareholders from reinvestment of distributions | | | 2,185 | | | | 314 | | |
| Shares redeemed | | | (23,397 | ) | | | (23,476 | ) | |
| Net increase (decrease) | | | 6,878 | | | | (1,028 | ) | |
| Shares outstanding at end of period | | | 70,899 | | | | 64,021 | | |
| * | Shares and shares transactions were adjusted to reflect 1:5 reverse stock split effective November 17, 2020. |
The accompanying notes are an integral part of these financial statements.
196 Annual Report
| | Lazard Global
Listed Infrastructure Portfolio | | Lazard Global
Strategic Equity Portfolio | |
| | Year Ended
December 31,
2020 | | Year Ended
December 31,
2019 | | Year Ended
December 31,
2020 | | Year Ended
December 31,
2019 | |
| | | | | | | | | |
| | | 461,276,357 | | | | 364,507,349 | | | | 309,023 | * | | | 306,168 | * | |
| | | 194,182,619 | | | | 160,154,321 | | | | 24,511 | * | | | 1,248 | * | |
| | | | | | | | | | | | | | | | | |
| | | 10,363,887 | | | | 15,108,909 | | | | 10,552 | * | | | 8,564 | * | |
| | | (168,322,477 | ) | | | (78,494,222 | ) | | | (7,732 | )* | | | (6,957 | )* | |
| | | 36,224,029 | | | | 96,769,008 | | | | 27,331 | * | | | 2,855 | * | |
| | | 497,500,386 | | | | 461,276,357 | | | | 336,354 | * | | | 309,023 | * | |
| | | | | | | | | | | | | | | | | |
| | | 28,396,647 | | | | 31,560,099 | | | | 14,046 | * | | | 16,156 | * | |
| | | 6,691,684 | | | | 9,940,665 | | | | 2,123 | * | | | 345 | * | |
| | | | | | | | | | | | | | | | | |
| | | 677,742 | | | | 1,315,681 | | | | 466 | * | | | 354 | * | |
| | | (14,772,312 | ) | | | (14,419,798 | ) | | | (1,288 | )* | | | (2,809 | )* | |
| | | (7,402,886 | ) | | | (3,163,452 | ) | | | 1,301 | * | | | (2,110 | )* | |
| | | 20,993,761 | | | | 28,396,647 | | | | 15,347 | | | | 14,046 | * | |
Annual Report 197
| | | Lazard International
Equity Advantage Portfolio | |
| | | Year Ended
December 31,
2020 | | Year Ended
December 31,
2019 | |
| Increase (Decrease) in Net Assets | | | | | | | | | |
| Operations | | | | | | | | | |
| Net investment income (loss) | | $ | 50,787 | | | $ | 53,796 | | |
| Net realized gain (loss) | | | (134,244 | ) | | | (114,244 | ) | |
| Net change in unrealized appreciation (depreciation) | | | 211,107 | | | | 433,593 | | |
| Net increase (decrease) in net assets resulting from operations | | | 127,650 | | | | 373,145 | | |
| Distributions to shareholders (Note 2(e)) | | | | | | | | | |
| Net investment income and net realized gains | | | | | | | | | |
| Institutional Shares | | | (48,006 | ) | | | (51,885 | ) | |
| Open Shares | | | (2,025 | ) | | | (2,117 | ) | |
| R6 Shares | | | — | | | | — | | |
| Net decrease in net assets resulting from distributions | | | (50,031 | ) | | | (54,002 | ) | |
| Capital stock transactions | | | | | | | | | |
| Net proceeds from sales | | | | | | | | | |
| Institutional Shares | | | — | | | | — | | |
| Open Shares | | | — | | | | — | | |
| R6 Shares | | | — | | | | — | | |
| Net proceeds from reinvestment of distributions | | | | | | | | | |
| Institutional Shares | | | 48,006 | | | | 51,885 | | |
| Open Shares | | | 2,025 | | | | 2,117 | | |
| R6 Shares | | | — | | | | — | | |
| Cost of shares redeemed | | | | | | | | | |
| Institutional Shares | | | (57,767 | ) | | | — | | |
| Open Shares | | | — | | | | — | | |
| R6 Shares | | | — | | | | — | | |
| Net increase (decrease) in net assets from capital stock transactions | | | (7,736 | ) | | | 54,002 | | |
| Total increase (decrease) in net assets | | | 69,883 | | | | 373,145 | | |
| Net assets at beginning of period | | | 2,521,207 | | | | 2,148,062 | | |
| Net assets at end of period | | $ | 2,591,090 | | | $ | 2,521,207 | | |
The accompanying notes are an integral part of these financial statements.
198 Annual Report
| | Lazard International
Equity Concentrated Portfolio | | Lazard International Equity Portfolio | |
| | Year Ended
December 31,
2020 | | Year Ended
December 31,
2019 | | Year Ended
December 31,
2020 | | Year Ended
December 31,
2019 | |
| | | | | | | | | |
| | $ | 522,828 | | | $ | 1,615,102 | | | $ | 31,982,942 | | | $ | 57,722,385 | | |
| | | (9,959,746 | ) | | | 409,364 | | | | (22,368,369 | ) | | | 11,065,023 | | |
| | | (7,019,673 | ) | | | 14,997,265 | | | | 259,570,688 | | | | 444,077,959 | | |
| | | | | | | | | | | | | | | | | |
| | | (16,456,591 | ) | | | 17,021,731 | | | | 269,185,261 | | | | 512,865,367 | | |
| | | | | | | | | | | | | | | | | |
| | | (502,330 | ) | | | (1,603,404 | ) | | | (28,031,055 | ) | | | (51,130,885 | ) | |
| | | (12,425 | ) | | | (5,862 | ) | | | (2,010,258 | ) | | | (4,599,789 | ) | |
| | | — | | | | — | | | | (1,244,237 | ) | | | (2,207,785 | ) | |
| | | | | | | | | | | | | | | | | |
| | | (514,755 | ) | | | (1,609,266 | ) | | | (31,285,550 | ) | | | (57,938,459 | ) | |
| | | | | | | | | | | | | | | | | |
| | | 21,575,394 | | | | 39,506,689 | | | | 829,447,085 | | | | 624,890,241 | | |
| | | 2,660 | | | | 650 | | | | 52,835,440 | | | | 59,304,312 | | |
| | | — | | | | — | | | | 55,056,018 | | | | 39,351,180 | | |
| | | | | | | | | | | | | | | | | |
| | | 502,184 | | | | 1,554,391 | | | | 25,025,241 | | | | 45,137,028 | | |
| | | 12,425 | | | | 5,862 | | | | 1,799,295 | | | | 4,082,937 | | |
| | | — | | | | — | | | | 1,241,734 | | | | 2,202,815 | | |
| | | | | | | | | | | | | | | | | |
| | | (89,284,855 | ) | | | (7,673,168 | ) | | | (749,116,212 | ) | | | (673,719,289 | ) | |
| | | (21,492 | ) | | | (65,223 | ) | | | (206,597,466 | ) | | | (74,619,091 | ) | |
| | | — | | | | — | | | | (44,843,974 | ) | | | (58,387,031 | ) | |
| | | | | | | | | | | | | | | | | |
| | | (67,213,684 | ) | | | 33,329,201 | | | | (35,152,839 | ) | | | (31,756,898 | ) | |
| | | (84,185,030 | ) | | | 48,741,666 | | | | 202,746,872 | | | | 423,170,010 | | |
| | | 98,245,879 | | | | 49,504,213 | | | | 2,859,903,241 | | | | 2,436,733,231 | | |
| | $ | 14,060,849 | | | $ | 98,245,879 | | | $ | 3,062,650,113 | | | $ | 2,859,903,241 | | |
Annual Report 199
| | | Lazard International
Equity Advantage Portfolio | |
| | | Year Ended
December 31,
2020 | | Year Ended
December 31,
2019 | |
| Shares issued and redeemed | | | | | | | | | |
| Institutional Shares | | | | | | | | | |
| Shares outstanding at beginning of period | | | 241,125 | | | | 235,905 | | |
| Shares sold | | | — | | | | — | | |
| Shares issued to shareholders from reinvestment of distributions | | | 4,784 | | | | 5,220 | | |
| Shares redeemed | | | (6,383 | ) | | | — | | |
| Net increase (decrease) | | | (1,599 | ) | | | 5,220 | | |
| Shares outstanding at end of period | | | 239,526 | | | | 241,125 | | |
| Open Shares | | | | | | | | | |
| Shares outstanding at beginning of period | | | 11,318 | | | | 11,106 | | |
| Shares sold | | | — | | | | — | | |
| Shares issued to shareholders from reinvestment of distributions | | | 202 | | | | 212 | | |
| Shares redeemed | | | — | | | | — | | |
| Net increase (decrease) | | | 202 | | | | 212 | | |
| Shares outstanding at end of period | | | 11,520 | | | | 11,318 | | |
| R6 Shares | | | | | | | | | |
| Shares outstanding at beginning of period | | | — | | | | — | | |
| Shares sold | | | — | | | | — | | |
| Shares issued to shareholders from reinvestment of distributions | | | — | | | | — | | |
| Shares redeemed | | | — | | | | — | | |
| Net increase (decrease) | | | — | | | | — | | |
| Shares outstanding at end of period | | | — | | | | — | | |
The accompanying notes are an integral part of these financial statements.
200 Annual Report
| | Lazard International
Equity Concentrated Portfolio | | Lazard International Equity Portfolio | |
| | Year Ended
December 31,
2020 | | Year Ended
December 31,
2019 | | Year Ended
December 31,
2020 | | Year Ended
December 31,
2019 | |
| | | | | | | | | | | | | |
| | | 9,493,019 | | | | 5,888,251 | | | | 134,082,503 | | | | 134,128,473 | | |
| | | 2,373,255 | | | | 4,243,583 | | | | 50,874,540 | | | | 35,978,227 | | |
| | | | | | | | | | | | | | | | | |
| | | 51,745 | | | | 151,058 | | | | 1,327,534 | | | | 2,468,167 | | |
| | | (10,553,930 | ) | | | (789,873 | ) | | | (45,793,934 | ) | | | (38,492,364 | ) | |
| | | (8,128,930 | ) | | | 3,604,768 | | | | 6,408,140 | | | | (45,970 | ) | |
| | | 1,364,089 | | | | 9,493,019 | | | | 140,490,643 | | | | 134,082,503 | | |
| | | | | | | | | | | | | | | | | |
| | | 41,695 | | | | 47,769 | | | | 13,658,790 | | | | 14,336,300 | | |
| | | 272 | | | | 67 | | | | 3,165,143 | | | | 3,324,184 | | |
| | | | | | | | | | | | | | | | | |
| | | 1,277 | | | | 569 | | | | 95,416 | | | | 221,021 | | |
| | | (2,155 | ) | | | (6,710 | ) | | | (10,958,977 | ) | | | (4,222,715 | ) | |
| | | (606 | ) | | | (6,074 | ) | | | (7,698,418 | ) | | | (677,510 | ) | |
| | | 41,089 | | | | 41,695 | | | | 5,960,372 | | | | 13,658,790 | | |
| | | | | | | | | | | | | | | | | |
| | | — | | | | — | | | | 5,788,801 | | | | 6,803,382 | | |
| | | — | | | | — | | | | 3,191,487 | | | | 2,243,161 | | |
| | | | | | | | | | | | | | | | | |
| | | — | | | | — | | | | 65,933 | | | | 120,673 | | |
| | | — | | | | — | | | | (2,572,399 | ) | | | (3,378,415 | ) | |
| | | — | | | | — | | | | 685,021 | | | | (1,014,581 | ) | |
| | | — | | | | — | | | | 6,473,822 | | | | 5,788,801 | | |
Annual Report 201
| | | Lazard International
Equity Select Portfolio | |
| | | Year Ended
December 31,
2020 | | Year Ended
December 31,
2019 | |
| Increase (Decrease) in Net Assets | | | | | | | | | |
| Operations | | | | | | | | | |
| Net investment income (loss) | | $ | 937,142 | | | $ | 2,026,601 | | |
| Net realized gain (loss) | | | (1,780,411 | ) | | | (1,249,040 | ) | |
| Net change in unrealized appreciation (depreciation) | | | 7,062,981 | | | | 15,192,386 | | |
| Net increase from payments by affiliates | | | — | | | | — | | |
| Net increase (decrease) in net assets resulting from operations | | | 6,219,712 | | | | 15,969,947 | | |
| Distributions to shareholders (Note 2(e)) | | | | | | | | | |
| Net investment income and net realized gains | | | | | | | | | |
| Institutional Shares | | | (898,108 | ) | | | (1,961,509 | ) | |
| Open Shares | | | (20,139 | ) | | | (45,672 | ) | |
| Net decrease in net assets resulting from distributions | | | (918,247 | ) | | | (2,007,181 | ) | |
| Capital stock transactions | | | | | | | | | |
| Net proceeds from sales | | | | | | | | | |
| Institutional Shares | | | 23,196,482 | | | | 27,372,157 | | |
| Open Shares | | | 1,529,531 | | | | 2,220,101 | | |
| Net proceeds from reinvestment of distributions | | | | | | | | | |
| Institutional Shares | | | 874,186 | | | | 1,894,543 | | |
| Open Shares | | | 19,885 | | | | 45,594 | | |
| Cost of shares redeemed | | | | | | | | | |
| Institutional Shares | | | (30,557,726 | ) | | | (23,919,475 | ) | |
| Open Shares | | | (1,462,806 | ) | | | (1,572,183 | ) | |
| Net increase (decrease) in net assets from capital stock transactions | | | (6,400,448 | ) | | | 6,040,737 | | |
| Total increase (decrease) in net assets | | | (1,098,983 | ) | | | 20,003,503 | | |
| Net assets at beginning of period | | | 96,087,821 | | | | 76,084,318 | | |
| Net assets at end of period | | $ | 94,988,838 | | | $ | 96,087,821 | | |
| Shares issued and redeemed | | | | | | | | | |
| Institutional Shares | | | | | | | | | |
| Shares outstanding at beginning of period | | | 8,707,246 | | | | 8,172,571 | | |
| Shares sold | | | 2,451,854 | | | | 2,702,352 | | |
| Shares issued to shareholders from reinvestment of distributions | | | 77,913 | | | | 177,060 | | |
| Shares redeemed | | | (3,243,968 | ) | | | (2,344,737 | ) | |
| Net increase (decrease) | | | (714,201 | ) | | | 534,675 | | |
| Shares outstanding at end of period | | | 7,993,045 | | | | 8,707,246 | | |
| Open Shares | | | | | | | | | |
| Shares outstanding at beginning of period | | | 231,629 | | | | 163,761 | | |
| Shares sold | | | 156,101 | | | | 216,058 | | |
| Shares issued to shareholders from reinvestment of distributions | | | 1,763 | | | | 4,241 | | |
| Shares redeemed | | | (141,878 | ) | | | (152,431 | ) | |
| Net increase (decrease) | | | 15,986 | | | | 67,868 | | |
| Shares outstanding at end of period | | | 247,615 | | | | 231,629 | | |
The accompanying notes are an integral part of these financial statements.
202 Annual Report
| | Lazard International
Equity Value Portfolio | | Lazard International
Quality Growth Portfolio | |
| | Year Ended
December 31,
2020 | | Year Ended
December 31,
2019 | | Year Ended
December 31,
2020 | | Year Ended
December 31,
2019 | |
| | | | | | | | | | | | | | | | | |
| | $ | 47,772 | | | $ | 620,073 | | | $ | 13,507 | | | $ | 22,481 | | |
| | | 10,261 | | | | (332,938 | ) | | | 89,062 | | | | 908 | | |
| | | (296,859 | ) | | | 2,145,026 | | | | 1,555,029 | | | | 884,213 | | |
| | | 88,959 | | | | — | | | | — | | | | — | | |
| | | | | | | | | | | | | | | | | |
| | | (149,867 | ) | | | 2,432,161 | | | | 1,657,598 | | | | 907,602 | | |
| | | | | | | | | | | | | | | | | |
| | | (58,054 | ) | | | (632,861 | ) | | | (84,866 | ) | | | (95,391 | ) | |
| | | (741 | ) | | | (6,391 | ) | | | (2,354 | ) | | | (236 | ) | |
| | | (58,795 | ) | | | (639,252 | ) | | | (87,220 | ) | | | (95,627 | ) | |
| | | | | | | | | | | | | | | | | |
| | | 2,686,850 | | | | 386,965 | | | | 5,094,900 | | | | 2,920,464 | | |
| | | 9,981 | | | | 111,790 | | | | 265,673 | | | | 18,500 | | |
| | | | | | | | | | | | | | | | | |
| | | 58,054 | | | | 632,861 | | | | 84,866 | | | | 95,391 | | |
| | | 680 | | | | 6,262 | | | | 2,354 | | | | 236 | | |
| | | | | | | | | | | | | | | | | |
| | | (12,992,331 | ) | | | (12,619,880 | ) | | | (208,991 | ) | | | (17,321 | ) | |
| | | (77,178 | ) | | | (21,311 | ) | | | (12,636 | ) | | | (11,243 | ) | |
| | | | | | | | | | | | | | | | | |
| | | (10,313,944 | ) | | | (11,503,313 | ) | | | 5,226,166 | | | | 3,006,027 | | |
| | | (10,522,606 | ) | | | (9,710,404 | ) | | | 6,796,544 | | | | 3,818,002 | | |
| | | 13,273,503 | | | | 22,983,907 | | | | 3,967,707 | | | | 149,705 | | |
| | $ | 2,750,897 | | | $ | 13,273,503 | | | $ | 10,764,251 | | | $ | 3,967,707 | | |
| | | | | | | | | | | | | | | | | |
| | | 1,319,964 | | | | 2,509,997 | | | | 311,939 | | | | 14,900 | | |
| | | 273,087 | | | | 39,472 | | | | 370,047 | | | | 290,807 | | |
| | | | | | | | | | | | | | | | | |
| | | 6,508 | | | | 63,925 | | | | 5,572 | | | | 7,589 | | |
| | | (1,309,909 | ) | | | (1,293,430 | ) | | | (15,674 | ) | | | (1,357 | ) | |
| | | (1,030,314 | ) | | | (1,190,033 | ) | | | 359,945 | | | | 297,039 | | |
| | | 289,650 | | | | 1,319,964 | | | | 671,884 | | | | 311,939 | | |
| | | | | | | | | | | | | | | | | |
| | | 14,189 | | | | 4,211 | | | | 771 | | | | 100 | | |
| | | 1,262 | | | | 11,500 | | | | 18,836 | | | | 1,613 | | |
| | | | | | | | | | | | | | | | | |
| | | 76 | | | | 633 | | | | 155 | | | | 19 | | |
| | | (11,227 | ) | | | (2,155 | ) | | | (985 | ) | | | (961 | ) | |
| | | (9,889 | ) | | | 9,978 | | | | 18,006 | | | | 671 | | |
| | | 4,300 | | | | 14,189 | | | | 18,777 | | | | 771 | | |
Annual Report 203
| | | Lazard International
Small Cap Equity Portfolio | |
| | | Year Ended
December 31,
2020 | | Year Ended
December 31,
2019 | |
| Increase (Decrease) in Net Assets | | | | | | | | | |
| Operations | | | | | | | | | |
| Net investment income (loss) | | $ | 216,390 | | | $ | 597,260 | | |
| Net realized gain (loss) | | | 547,329 | | | | (1,233,823 | ) | |
| Net change in unrealized appreciation (depreciation) | | | 2,270,963 | | | | 13,644,978 | | |
| Net increase (decrease) in net assets resulting from operations | | | 3,034,682 | | | | 13,008,415 | | |
| Distributions to shareholders (Note 2(e)) | | | | | | | | | |
| Net investment income and net realized gains | | | | | | | | | |
| Institutional Shares | | | (729,812 | ) | | | (993,572 | ) | |
| Open Shares | | | (274,269 | ) | | | (532,378 | ) | |
| R6 Shares | | | — | | | | — | | |
| Net decrease in net assets resulting from distributions | | | (1,004,081 | ) | | | (1,525,950 | ) | |
| Capital stock transactions | | | | | | | | | |
| Net proceeds from sales | | | | | | | | | |
| Institutional Shares | | | 6,686,012 | | | | 5,735,020 | | |
| Open Shares | | | 1,357,370 | | | | 2,821,054 | | |
| R6 Shares | | | — | | | | — | | |
| Net proceeds from reinvestment of distributions | | | | | | | | | |
| Institutional Shares | | | 728,414 | | | | 985,401 | | |
| Open Shares | | | 269,502 | | | | 525,950 | | |
| R6 Shares | | | — | | | | — | | |
| Cost of shares redeemed | | | | | | | | | |
| Institutional Shares | | | (17,662,848 | ) | | | (11,597,241 | ) | |
| Open Shares | | | (8,911,562 | ) | | | (7,881,149 | ) | |
| R6 Shares | | | — | | | | — | | |
| Net increase (decrease) in net assets from capital stock transactions | | | (17,533,112 | ) | | | (9,410,965 | ) | |
| Total increase (decrease) in net assets | | | (15,502,511 | ) | | | 2,071,500 | | |
| Net assets at beginning of period | | | 57,457,699 | | | | 55,386,199 | | |
| Net assets at end of period | | $ | 41,955,188 | | | $ | 57,457,699 | | |
The accompanying notes are an integral part of these financial statements.
204 Annual Report
| | Lazard International
Strategic Equity Portfolio | | Lazard Managed
Equity Volatility Portfolio | |
| | Year Ended
December 31,
2020 | | Year Ended
December 31,
2019 | | Year Ended
December 31,
2020 | | Year Ended
December 31,
2019 | |
| | | | | | | | | | | | | |
| | $ | 61,471,034 | | | $ | 101,146,547 | | | $ | 556,115 | | | $ | 444,759 | | |
| | | (40,723,514 | ) | | | (31,395,597 | ) | | | (1,486,977 | ) | | | 716,348 | | |
| | | 413,060,145 | | | | 1,109,551,562 | | | | (960,609 | ) | | | 3,732,305 | | |
| | | | | | | | | | | | | | | | | |
| | | 433,807,665 | | | | 1,179,302,512 | | | | (1,891,471 | ) | | | 4,893,412 | | |
| | | | | | | | | | | | | | | | | |
| | | (53,074,159 | ) | | | (100,719,323 | ) | | | (562,392 | ) | | | (480,167 | ) | |
| | | (4,116,579 | ) | | | (11,005,478 | ) | | | (1,918 | ) | | | (2,562 | ) | |
| | | (1,190,335 | ) | | | (2,219,743 | ) | | | — | | | | — | | |
| | | | | | | | | | | | | | | | | |
| | | (58,381,073 | ) | | | (113,944,544 | ) | | | (564,310 | ) | | | (482,729 | ) | |
| | | | | | | | | | | | | | | | | |
| | | 867,984,229 | | | | 792,681,193 | | | | 3,728,503 | | | | 9,905,800 | | |
| | | 109,837,899 | | | | 124,036,050 | | | | 7,770 | | | | 9,000 | | |
| | | 6,884,808 | | | | 21,028,905 | | | | — | | | | — | | |
| | | | | | | | | | | | | | | | | |
| | | 49,928,530 | | | | 94,513,926 | | | | 527,907 | | | | 439,293 | | |
| | | 3,877,654 | | | | 10,047,508 | | | | 1,918 | | | | 2,562 | | |
| | | 1,163,760 | | | | 2,174,455 | | | | — | | | | — | | |
| | | | | | | | | | | | | | | | | |
| | | (1,489,992,288 | ) | | | (911,120,127 | ) | | | (10,447,520 | ) | | | (1,072,923 | ) | |
| | | (288,996,541 | ) | | | (431,740,280 | ) | | | (134,993 | ) | | | (574 | ) | |
| | | (18,963,448 | ) | | | (19,831,488 | ) | | | — | | | | — | | |
| | | | | | | | | | | | | | | | | |
| | | (758,275,397 | ) | | | (318,209,858 | ) | | | (6,316,415 | ) | | | 9,283,158 | | |
| | | (382,848,805 | ) | | | 747,148,110 | | | | (8,772,196 | ) | | | 13,693,841 | | |
| | | 6,307,423,592 | | | | 5,560,275,482 | | | | 34,585,908 | | | | 20,892,067 | | |
| | $ | 5,924,574,787 | | | $ | 6,307,423,592 | | | $ | 25,813,712 | | | $ | 34,585,908 | | |
Annual Report 205
| | | Lazard International
Small Cap Equity Portfolio | |
| | | Year Ended
December 31,
2020 | | Year Ended
December 31,
2019 | |
| Shares issued and redeemed | | | | | | | |
| Institutional Shares | | | | | | | | | |
| Shares outstanding at beginning of period | | | 3,090,617 | | | | 3,529,666 | | |
| Shares sold | | | 589,232 | | | | 514,178 | | |
| Shares issued to shareholders from reinvestment of distributions | | | 63,230 | | | | 92,962 | | |
| Shares redeemed | | | (1,567,856 | ) | | | (1,046,189 | ) | |
| Net increase (decrease) | | | (915,394 | ) | | | (439,049 | ) | |
| Shares outstanding at end of period | | | 2,175,223 | | | | 3,090,617 | | |
| Open Shares | | | | | | | | | |
| Shares outstanding at beginning of period | | | 1,622,591 | | | | 2,031,598 | | |
| Shares sold | | | 121,575 | | | | 254,632 | | |
| Shares issued to shareholders from reinvestment of distributions | | | 23,374 | | | | 49,571 | | |
| Shares redeemed | | | (835,816 | ) | | | (713,210 | ) | |
| Net increase (decrease) | | | (690,867 | ) | | | (409,007 | ) | |
| Shares outstanding at end of period | | | 931,724 | | | | 1,622,591 | | |
| R6 Shares | | | | | | | | | |
| Shares outstanding at beginning of period | | | — | | | | — | | |
| Shares sold | | | — | | | | — | | |
| Shares issued to shareholders from reinvestment of distributions | | | — | | | | — | | |
| Shares redeemed | | | — | | | | — | | |
| Net increase (decrease) | | | — | | | | — | | |
| Shares outstanding at end of period | | | — | | | | — | | |
The accompanying notes are an integral part of these financial statements.
206 Annual Report
| | Lazard International
Strategic Equity Portfolio | | Lazard Managed
Equity Volatility Portfolio | |
| | Year Ended
December 31,
2020 | | Year Ended
December 31,
2019 | | Year Ended
December 31,
2020 | | Year Ended
December 31,
2019 | |
| | | | | | | | | | | | | | | | | |
| | | 357,911,733 | | | | 359,227,186 | | | | 2,714,105 | | | | 1,963,386 | | |
| | | 63,824,929 | | | | 55,219,621 | | | | 339,588 | | | | 804,074 | | |
| | | | | | | | | | | | | | | | | |
| | | 3,094,195 | | | | 6,217,811 | | | | 45,732 | | | | 34,782 | | |
| | | (111,716,620 | ) | | | (62,752,885 | ) | | | (915,107 | ) | | | (88,137 | ) | |
| | | (44,797,496 | ) | | | (1,315,453 | ) | | | (529,787 | ) | | | 750,719 | | |
| | | 313,114,237 | | | | 357,911,733 | | | | 2,184,318 | | | | 2,714,105 | | |
| | | | | | | | | | | | | | | | | |
| | | 43,939,513 | | | | 64,009,753 | | | | 18,298 | | | | 17,404 | | |
| | | 8,170,528 | | | | 8,545,569 | | | | 693 | | | | 736 | | |
| | | | | | | | | | | | | | | | | |
| | | 239,698 | | | | 656,801 | | | | 167 | | | | 203 | | |
| | | (20,839,894 | ) | | | (29,272,610 | ) | | | (12,670 | ) | | | (45 | ) | |
| | | (12,429,668 | ) | | | (20,070,240 | ) | | | (11,810 | ) | | | 894 | | |
| | | 31,509,845 | | | | 43,939,513 | | | | 6,488 | | | | 18,298 | | |
| | | | | | | | | | | | | | | | | |
| | | 7,802,421 | | | | 7,549,275 | | | | — | | | | — | | |
| | | 482,711 | | | | 1,459,355 | | | | — | | | | — | | |
| | | | | | | | | | | | | | | | | |
| | | 72,070 | | | | 142,878 | | | | — | | | | — | | |
| | | (1,313,064 | ) | | | (1,349,087 | ) | | | — | | | | — | | |
| | | (758,283 | ) | | | 253,146 | | | | — | | | | — | | |
| | | 7,044,138 | | | | 7,802,421 | | | | — | | | | — | | |
Annual Report 207
| | | Lazard US Equity Concentrated Portfolio | |
| | | Year Ended
December 31,
2020 | | Year Ended
December 31,
2019 | |
| Increase in Net Assets | | | | | | | | | |
| Operations | | | | | | | | | |
| Net investment income (loss) | | $ | 11,826,884 | | | $ | 10,746,418 | | |
| Net realized gain (loss) | | | 44,140,640 | | | | 16,675,749 | | |
| Net change in unrealized appreciation (depreciation) | | | 276,752,935 | | | | 316,438,020 | | |
| Net increase (decrease) in net assets resulting from operations | | | 332,720,459 | | | | 343,860,187 | | |
| Distributions to shareholders (Note 2(e)) | | | | | | | | | |
| Net investment income and net realized gains | | | | | | | | | |
| Institutional Shares | | | (31,466,690 | ) | | | (10,474,453 | ) | |
| Open Shares | | | (474,468 | ) | | | (251,259 | ) | |
| R6 Shares | | | (35,269 | ) | | | (16,815 | ) | |
| Net decrease in net assets resulting from distributions | | | (31,976,427 | ) | | | (10,742,527 | ) | |
| Capital stock transactions | | | | | | | | | |
| Net proceeds from sales | | | | | | | | | |
| Institutional Shares | | | 832,814,325 | | | | 239,444,709 | | |
| Open Shares | | | 7,487,780 | | | | 10,485,661 | | |
| R6 Shares | | | 39,699 | | | | 52,111 | | |
| Net proceeds from reinvestment of distributions | | | | | | | | | |
| Institutional Shares | | | 29,424,137 | | | | 9,489,994 | | |
| Open Shares | | | 465,481 | | | | 245,698 | | |
| R6 Shares | | | 35,269 | | | | 16,815 | | |
| Cost of shares redeemed | | | | | | | | | |
| Institutional Shares | | | (496,523,782 | ) | | | (337,781,398 | ) | |
| Open Shares | | | (21,891,108 | ) | | | (27,918,973 | ) | |
| R6 Shares | | | (133,537 | ) | | | (444,560 | ) | |
| Net increase (decrease) in net assets from capital stock transactions | | | 351,718,264 | | | | (106,409,943 | ) | |
| Total increase (decrease) in net assets | | | 652,462,296 | | | | 226,707,717 | | |
| Net assets at beginning of period | | | 1,320,439,963 | | | | 1,093,732,246 | | |
| Net assets at end of period | | $ | 1,972,902,259 | | | $ | 1,320,439,963 | | |
The accompanying notes are an integral part of these financial statements.
208 Annual Report
| | Lazard US Equity Focus Portfolio | | Lazard US Small-Mid Cap Equity Portfolio | |
| | Year Ended
December 31,
2020 | | Year Ended
December 31,
2019 | | Year Ended
December 31,
2020 | | Year Ended
December 31,
2019 | |
| | | | | | | | | | | | | | | | | |
| | $ | 378,730 | | | $ | 775,182 | | | $ | 302,781 | | | $ | 528,891 | | |
| | | 3,423,426 | | | | 9,274,046 | | | | (4,631,410 | ) | | | 9,996,563 | | |
| | | 4,304,928 | | | | 8,829,523 | | | | 9,989,695 | | | | 24,785,901 | | |
| | | | | | | | | | | | | | | | | |
| | | 8,107,084 | | | | 18,878,751 | | | | 5,661,066 | | | | 35,311,355 | | |
| | | | | | | | | | | | | | | | | |
| | | (1,576,592 | ) | | | (3,507,462 | ) | | | (689,524 | ) | | | (3,405,960 | ) | |
| | | (62,169 | ) | | | (115,921 | ) | | | (79,756 | ) | | | (467,265 | ) | |
| | | (978,148 | ) | | | (1,131,458 | ) | | | (4,077 | ) | | | — | | |
| | | | | | | | | | | | | | | | | |
| | | (2,616,909 | ) | | | (4,754,841 | ) | | | (773,357 | ) | | | (3,873,225 | ) | |
| | | | | | | | | | | | | | | | | |
| | | 1,198,572 | | | | 2,432,592 | | | | 41,076,855 | | | | 43,497,892 | | |
| | | 49,836 | | | | 24,674 | | | | 1,508,700 | | | | 1,907,057 | | |
| | | 11,195,761 | | | | 5,577,813 | | | | 710,287 | | | | — | | |
| | | | | | | | | | | | | | | | | |
| | | 1,575,875 | | | | 3,507,279 | | | | 684,306 | | | | 3,376,123 | | |
| | | 61,322 | | | | 115,887 | | | | 73,301 | | | | 439,046 | | |
| | | 978,148 | | | | 1,131,458 | | | | 4,077 | | | | — | | |
| | | | | | | | | | | | | | | | | |
| | | (7,184,723 | ) | | | (46,017,010 | ) | | | (62,404,831 | ) | | | (80,591,007 | ) | |
| | | (68,642 | ) | | | (61,182 | ) | | | (5,586,777 | ) | | | (4,715,661 | ) | |
| | | (4,575,266 | ) | | | (8,015,687 | ) | | | (75,526 | ) | | | — | | |
| | | | | | | | | | | | | | | | | |
| | | 3,230,883 | | | | (41,304,176 | ) | | | (24,009,608 | ) | | | (36,086,550 | ) | |
| | | 8,721,058 | | | | (27,180,266 | ) | | | (19,121,899 | ) | | | (4,648,420 | ) | |
| | | 44,386,693 | | | | 71,566,959 | | | | 122,754,312 | | | | 127,402,732 | | |
| | $ | 53,107,751 | | | $ | 44,386,693 | | | $ | 103,632,413 | | | $ | 122,754,312 | | |
Annual Report 209
| | | Lazard US Equity Concentrated Portfolio | |
| | | Year Ended
December 31,
2020 | | Year Ended
December 31,
2019 | |
| Shares issued and redeemed | | | | | | | | | |
| Institutional Shares | | | | | | | | | |
| Shares outstanding at beginning of period | | | 75,485,283 | | | | 80,772,130 | | |
| Shares sold | | | 61,909,549 | | | | 16,233,590 | | |
| Shares issued to shareholders from reinvestment of distributions | | | 1,653,980 | | | | 564,545 | | |
| Shares redeemed | | | (31,763,969 | ) | | | (22,084,982 | ) | |
| Net increase (decrease) | | | 31,799,560 | | | | (5,286,847 | ) | |
| Shares outstanding at end of period | | | 107,284,843 | | | | 75,485,283 | | |
| Open Shares | | | | | | | | | |
| Shares outstanding at beginning of period | | | 2,759,073 | | | | 3,925,727 | | |
| Shares sold | | | 471,205 | | | | 683,831 | | |
| Shares issued to shareholders from reinvestment of distributions | | | 25,961 | | | | 14,504 | | |
| Shares redeemed | | | (1,367,456 | ) | | | (1,864,989 | ) | |
| Net increase (decrease) | | | (870,290 | ) | | | (1,166,654 | ) | |
| Shares outstanding at end of period | | | 1,888,783 | | | | 2,759,073 | | |
| R6 Shares† | | | | | | | | | |
| Shares outstanding at beginning of period | | | 123,837 | | | | 147,098 | | |
| Shares sold | | | 2,646 | | | | 3,494 | | |
| Shares issued to shareholders from reinvestment of distributions | | | 1,978 | | | | 998 | | |
| Shares redeemed | | | (8,158 | ) | | | (27,753 | ) | |
| Net increase (decrease) | | | (3,534 | ) | | | (23,261 | ) | |
| Shares outstanding at end of period | | | 120,303 | | | | 123,837 | | |
| † | The inception date for the US Small-Mid Cap Equity R6 Shares was January 8, 2020. |
The accompanying notes are an integral part of these financial statements.
210 Annual Report
| | Lazard US Equity Focus Portfolio | | Lazard US Small-Mid Cap Equity Portfolio | |
| | Year Ended
December 31,
2020 | | Year Ended
December 31,
2019 | | Year Ended
December 31,
2020 | | Year Ended
December 31,
2019 | |
| | | | | | | | | | | | | | | | | |
| | | 2,714,562 | | | | 5,927,072 | | | | 7,925,745 | | | | 10,493,688 | | |
| | | 100,582 | | | | 202,537 | | | | 3,732,653 | | | | 3,337,117 | | |
| | | | | | | | | | | | | | | | | |
| | | 122,119 | | | | 292,273 | | | | 56,694 | | | | 247,154 | | |
| | | (613,683 | ) | | | (3,707,320 | ) | | | (5,337,199 | ) | | | (6,152,214 | ) | |
| | | (390,982 | ) | | | (3,212,510 | ) | | | (1,547,852 | ) | | | (2,567,943 | ) | |
| | | 2,323,580 | | | | 2,714,562 | | | | 6,377,893 | | | | 7,925,745 | | |
| | | | | | | | | | | | | | | | | |
| | | 92,372 | | | | 85,762 | | | | 1,164,098 | | | | 1,368,812 | | |
| | | 4,311 | | | | 2,053 | | | | 138,148 | | | | 159,368 | | |
| | | | | | | | | | | | | | | | | |
| | | 4,733 | | | | 9,609 | | | | 6,598 | | | | 34,845 | | |
| | | (5,819 | ) | | | (5,052 | ) | | | (481,424 | ) | | | (398,927 | ) | |
| | | 3,225 | | | | 6,610 | | | | (336,678 | ) | | | (204,714 | ) | |
| | | 95,597 | | | | 92,372 | | | | 827,420 | | | | 1,164,098 | | |
| | | | | | | | | | | | | | | | | |
| | | 881,361 | | | | 982,747 | | | | — | | | | — | | |
| | | 1,003,398 | | | | 474,198 | | | | 53,236 | | | | — | | |
| | | | | | | | | | | | | | | | | |
| | | 75,523 | | | | 94,367 | | | | 338 | | | | — | | |
| | | (409,564 | ) | | | (669,951 | ) | | | (6,165 | ) | | | — | | |
| | | 669,357 | | | | (101,386 | ) | | | 47,409 | | | | — | | |
| | | 1,550,718 | | | | 881,361 | | | | 47,409 | | | | — | | |
Annual Report 211
| Year Ended December 31, 2020 (a) | | Lazard
US Sustainable
Equity Portfolio | |
| Increase in Net Assets | | | | |
| Operations | | | | |
| Net investment income (loss) | | $ | 30,063 | |
| Net realized gain (loss) | | | 61,946 | |
| Net change in unrealized appreciation (depreciation) | | | 1,719,335 | |
| Net increase (decrease) in net assets resulting from operations | | | 1,811,344 | |
| Distributions to shareholders (Note 2(e)) | | | | |
| Net investment income and net realized gains | | | | |
| Institutional Shares | | | (62,973 | ) |
| Open Shares | | | (393 | ) |
| Net decrease in net assets resulting from distributions | | | (63,366 | ) |
| Capital stock transactions | | | | |
| Net proceeds from sales | | | | |
| Institutional Shares | | | 9,704,139 | |
| Open Shares | | | 105,500 | |
| Net proceeds from reinvestment of distributions | | | | |
| Institutional Shares | | | 62,973 | |
| Open Shares | | | 393 | |
| Cost of shares redeemed | | | | |
| Institutional Shares | | | (3,004 | ) |
| Net increase (decrease) in net assets from capital stock transactions | | | 9,870,001 | |
| Total increase (decrease) in net assets | | | 11,617,979 | |
| Net assets at beginning of period | | | — | |
| Net assets at end of period | | $ | 11,617,979 | |
| Shares issued and redeemed | | | | |
| Institutional Shares | | | | |
| Shares outstanding at beginning of period | | | — | |
| Shares sold | | | 937,041 | |
| Shares issued to shareholders from reinvestment of distributions | | | 5,235 | |
| Shares redeemed | | | (250 | ) |
| Net increase (decrease) | | | 942,026 | |
| Shares outstanding at end of period | | | 942,026 | |
| Open Shares | | | | |
| Shares outstanding at beginning of period | | | — | |
| Shares sold | | | 10,462 | |
| Shares issued to shareholders from reinvestment of distributions | | | 33 | |
| Net increase (decrease) | | | 10,495 | |
| Shares outstanding at end of period | | | 10,495 | |
| (a) | The Portfolio commenced operations on June 30, 2020 |
The accompanying notes are an integral part of these financial statements.
212 Annual Report
The Lazard Funds, Inc. Financial Highlights
LAZARD DEVELOPING MARKETS EQUITY PORTFOLIO
Selected data for a share
of capital stock outstanding | | Year Ended | |
| throughout each period | | 12/31/20 | | | 12/31/19 | | | 12/31/18 | | | 12/31/17 | | | 12/31/16 | | |
| Institutional Shares | | | | | | | | | | | | | | | | | | | | | |
| Net asset value, beginning of period | | $ | 14.55 | | | $ | 11.42 | | | $ | 14.48 | | | $ | 10.28 | | | $ | 9.04 | | |
| Income (Loss) from investment operations: | | | | | | | | | | | | | | | | | | | | | |
| Net investment income (loss) (a) | | | 0.04 | | | | 0.08 | | | | 0.11 | | | | 0.03 | | | | 0.05 | ^ | |
| Net realized and unrealized gain (loss) | | | 2.76 | | | | 3.13 | | | | (3.08 | ) | | | 4.20 | | | | 1.29 | | |
| Total from investment operations | | | 2.80 | | | | 3.21 | | | | (2.97 | ) | | | 4.23 | | | | 1.34 | | |
| Less distributions from: | | | | | | | | | | | | | | | | | | | | | |
| Net investment income | | | (0.04 | ) | | | (0.08 | ) | | | (0.09 | ) | | | (0.03 | ) | | | (0.10 | ) | |
| Total distributions | | | (0.04 | ) | | | (0.08 | ) | | | (0.09 | ) | | | (0.03 | ) | | | (0.10 | ) | |
| Redemption fees | | | — | | | | — | | | | — | | | | — | | | | — | (b) | |
| Net asset value, end of period | | $ | 17.31 | | | $ | 14.55 | | | $ | 11.42 | | | $ | 14.48 | | | $ | 10.28 | | |
| Total Return (c) | | | 19.33 | % | | | 28.17 | % | | | –20.58 | % | | | 41.15 | % | | | 14.81 | %^ | |
| | | | | | | | | | | | | | | | | | | | | | |
| Ratios and Supplemental Data: | | | | | | | | | | | | | | | | | | | | | |
| Net assets, end of period (in thousands) | | $ | 190,689 | | | $ | 226,067 | | | $ | 215,120 | | | $ | 268,730 | | | $ | 189,035 | | |
| Ratios to average net assets: | | | | | | | | | | | | | | | | | | | | | |
| Net expenses | | | 1.17 | % | | | 1.16 | % | | | 1.14 | % | | | 1.18 | % | | | 1.21 | %^ | |
| Gross expenses | | | 1.21 | % | | | 1.16 | % | | | 1.14 | % | | | 1.18 | % | | | 1.23 | % | |
| Net investment income (loss) | | | 0.33 | % | | | 0.63 | % | | | 0.83 | % | | | 0.24 | % | | | 0.48 | %^ | |
| Portfolio turnover rate | | | 57 | % | | | 55 | % | | | 63 | % | | | 46 | % | | | 56 | % | |
The accompanying notes are an integral part of these financial statements.
Annual Report 213
Selected data for a share
of capital stock outstanding | | Year Ended | |
| throughout each period | | 12/31/20 | | | 12/31/19 | | | 12/31/18 | | | 12/31/17 | | | 12/31/16 | | |
| Open Shares | | | | | | | | | | | | | | | | | | | | | |
| Net asset value, beginning of period | | $ | 14.51 | | | $ | 11.36 | | | $ | 14.45 | | | $ | 10.28 | | | $ | 9.05 | | |
| Income (Loss) from investment operations: | | | | | | | | | | | | | | | | | | | | | |
| Net investment income (loss) (a) | | | 0.01 | | | | 0.05 | | | | 0.06 | | | | (0.02 | ) | | | 0.01 | ^ | |
| Net realized and unrealized gain (loss) | | | 2.73 | | | | 3.11 | | | | (3.06 | ) | | | 4.19 | | | | 1.28 | | |
| Total from investment operations | | | 2.74 | | | | 3.16 | | | | (3.00 | ) | | | 4.17 | | | | 1.29 | | |
| Less distributions from: | | | | | | | | | | | | | | | | | | | | | |
| Net investment income | | | (0.04 | ) | | | (0.01 | ) | | | (0.09 | ) | | | — | | | | (0.06 | ) | |
| Total distributions | | | (0.04 | ) | | | (0.01 | ) | | | (0.09 | ) | | | — | | | | (0.06 | ) | |
| Redemption fees | | | — | | | | — | | | | — | | | | — | | | | — | (b) | |
| Net asset value, end of period | | $ | 17.21 | | | $ | 14.51 | | | $ | 11.36 | | | $ | 14.45 | | | $ | 10.28 | | |
| Total Return (c) | | | 18.97 | % | | | 27.79 | % | | –20.83 | %# | | | 40.56 | % | | | 14.31 | % | |
| |
| Ratios and Supplemental Data: | | | | | | | | | | | | | | | | | | | | | |
| Net assets, end of period (in thousands) | | $ | 9,914 | | | $ | 9,341 | | | $ | 7,263 | | | $ | 12,569 | | | $ | 7,272 | | |
| Ratios to average net assets: | | | | | | | | | | | | | | | | | | | | | |
| Net expenses | | | 1.44 | % | | | 1.46 | % | | | 1.51 | % | | | 1.58 | % | | | 1.60 | %^ | |
| Gross expenses | | | 1.53 | % | | | 1.55 | % | | | 1.51 | % | | | 1.58 | % | | | 1.65 | % | |
| Net investment income (loss) | | | 0.04 | % | | | 0.36 | % | | | 0.42 | % | | | –0.17 | % | | | 0.06 | %^ | |
| Portfolio turnover rate | | | 57 | % | | | 55 | % | | | 63 | % | | | 46 | % | | | 56 | % | |
| ^ | Refer to Note 3 in the Notes to Financial Statements for discussion of prior period custodian out-of-pocket expenses that were reimbursed to the Portfolio in the period. The amount of the reimbursement was less than $0.005 per share. There was no impact on the total return of the Portfolio. For Institutional Shares, the impact on net expenses and net investment income (loss) ratios of the Portfolio was less than 0.005%. For Open Shares, the net expenses and net investment income (loss) ratios of the Portfolio would be unchanged as the change to the period custodian fees was offset against the period expense waivers/reimbursements with no impact to net expenses or net investment income (loss). |
| # | The Portfolio received settlement proceeds from a foreign exchange trading class action lawsuit. The proceeds from the settlement represented a realized gain and were recorded in the period received. There was a 0.07% impact on the total return of the Portfolio’s Open Shares. |
| (a) | Net investment income (loss) has been computed using the average shares method. |
| (b) | Amount is less than $0.01 per share. |
| (c) | Total returns reflect reinvestment of all dividends and distributions, if any. Certain expenses of the Portfolio may have been waived or reimbursed by the Investment Manager, State Street or DST; without such waiver/reimbursement of expenses, the Portfolio’s returns would have been lower. |
The accompanying notes are an integral part of these financial statements.
214 Annual Report
LAZARD EMERGING MARKETS CORE EQUITY PORTFOLIO
Selected data for a share
of capital stock outstanding | | Year Ended | |
| throughout each period | | 12/31/20 | | | 12/31/19 | | | 12/31/18 | | | 12/31/17 | | | 12/31/16 | | |
| Institutional Shares | | | | | | | | | | | | | | | | | | | | | |
| Net asset value, beginning of period | | $ | 11.79 | | | $ | 9.89 | | | $ | 12.30 | | | $ | 8.83 | | | $ | 8.60 | | |
| Income (Loss) from investment operations: | | | | | | | | | | | | | | | | | | | | | |
| Net investment income (loss) (a) | | | 0.08 | | | | 0.20 | | | | 0.16 | | | | 0.11 | | | | 0.08 | | |
| Net realized and unrealized gain (loss) | | | 1.33 | | | | 1.93 | | | | (2.39 | ) | | | 3.45 | | | | 0.22 | | |
| Total from investment operations | | | 1.41 | | | | 2.13 | | | | (2.23 | ) | | | 3.56 | | | | 0.30 | | |
| Less distributions from: | | | | | | | | | | | | | | | | | | | | | |
| Net investment income | | | (0.08 | ) | | | (0.23 | ) | | | (0.18 | ) | | | (0.09 | ) | | | (0.07 | ) | |
| Total distributions | | | (0.08 | ) | | | (0.23 | ) | | | (0.18 | ) | | | (0.09 | ) | | | (0.07 | ) | |
| Redemption fees | | | — | | | | — | | | | — | | | | — | | | | — | (b) | |
| Net asset value, end of period | | $ | 13.12 | | | $ | 11.79 | | | $ | 9.89 | | | $ | 12.30 | | | $ | 8.83 | | |
| Total Return (c) | | | 11.98 | % | | | 21.59 | % | | | –18.12 | % | | | 40.35 | % | | | 3.47 | % | |
| | | | | | | | | | | | | | | | | | | | | | |
| Ratios and Supplemental Data: | | | | | | | | | | | | | | | | | | | | | |
| Net assets, end of period (in thousands) | | $ | 209,503 | | | $ | 197,213 | | | $ | 207,955 | | | $ | 230,343 | | | $ | 122,995 | | |
| Ratios to average net assets: | | | | | | | | | | | | | | | | | | | | | |
| Net expenses | | | 1.20 | % | | | 1.18 | % | | | 1.18 | % | | | 1.20 | % | | | 1.30 | % | |
| Gross expenses | | | 1.20 | % | | | 1.18 | % | | | 1.18 | % | | | 1.20 | % | | | 1.31 | % | |
| Net investment income (loss) | | | 0.70 | % | | | 1.83 | % | | | 1.44 | % | | | 0.98 | % | | | 0.89 | % | |
| Portfolio turnover rate | | | 23 | % | | | 19 | % | | | 30 | % | | | 15 | % | | | 62 | % | |
The accompanying notes are an integral part of these financial statements.
Annual Report 215
Selected data for a share
of capital stock outstanding | | Year Ended | |
| throughout each period | | 12/31/20 | | | 12/31/19 | | | 12/31/18 | | | 12/31/17 | | | 12/31/16 | | |
| Open Shares | | | | | | | | | | | | | | | | | | | | | |
| Net asset value, beginning of period | | $ | 11.76 | | | $ | 9.87 | | | $ | 12.27 | | | $ | 8.81 | | | $ | 8.58 | | |
| Income (Loss) from investment operations: | | | | | | | | | | | | | | | | | | | | | |
| Net investment income (loss) (a) | | | 0.04 | | | | 0.16 | | | | 0.11 | | | | 0.06 | | | | 0.07 | | |
| Net realized and unrealized gain (loss) | | | 1.33 | | | | 1.92 | | | | (2.37 | ) | | | 3.45 | | | | 0.20 | | |
| Total from investment operations | | | 1.37 | | | | 2.08 | | | | (2.26 | ) | | | 3.51 | | | | 0.27 | | |
| Less distributions from: | | | | | | | | | | | | | | | | | | | | | |
| Net investment income | | | (0.04 | ) | | | (0.19 | ) | | | (0.14 | ) | | | (0.05 | ) | | | (0.04 | ) | |
| Total distributions | | | (0.04 | ) | | | (0.19 | ) | | | (0.14 | ) | | | (0.05 | ) | | | (0.04 | ) | |
| Net asset value, end of period | | $ | 13.09 | | | $ | 11.76 | | | $ | 9.87 | | | $ | 12.27 | | | $ | 8.81 | | |
| Total Return (c) | | | 11.66 | % | | | 21.08 | % | | | –18.43 | % | | | 39.80 | % | | | 3.17 | % | |
| | | | | | | | | | | | | | | | | | | | | | |
| Ratios and Supplemental Data: | | | | | | | | | | | | | | | | | | | | | |
| Net assets, end of period (in thousands) | | $ | 2,544 | | | $ | 2,425 | | | $ | 1,853 | | | $ | 1,828 | | | $ | 729 | | |
| Ratios to average net assets: | | | | | | | | | | | | | | | | | | | | | |
| Net expenses | | | 1.50 | % | | | 1.55 | % | | | 1.58 | % | | | 1.60 | % | | | 1.60 | % | |
| Gross expenses | | | 1.62 | % | | | 1.90 | % | | | 2.00 | % | | | 2.45 | % | | | 2.14 | % | |
| Net investment income (loss) | | | 0.35 | % | | | 1.48 | % | | | 1.00 | % | | | 0.56 | % | | | 0.85 | % | |
| Portfolio turnover rate | | | 23 | % | | | 19 | % | | | 30 | % | | | 15 | % | | | 62 | % | |
The accompanying notes are an integral part of these financial statements.
216 Annual Report
Selected data for a share
of capital stock outstanding | | Year Ended | | | For the Period
4/6/18* to | | |
| throughout each period | | 12/31/20 | | | 12/31/19 | | | 12/31/18 | | |
| R6 Shares | | | | | | | | | | | | | |
| Net asset value, beginning of period | | $ | 11.80 | | | $ | 9.89 | | | $ | 12.21 | | |
| Income (Loss) from investment operations: | | | | | | | | | | | | | |
| Net investment income (loss) (a) | | | 0.07 | | | | 0.20 | | | | 0.14 | | |
| Net realized and unrealized gain (loss) | | | 1.34 | | | | 1.94 | | | | (2.28 | ) | |
| Total from investment operations | | | 1.41 | | | | 2.14 | | | | (2.14 | ) | |
| Less distributions from: | | | | | | | | | | | | | |
| Net investment income | | | (0.08 | ) | | | (0.23 | ) | | | (0.18 | ) | |
| Total distributions | | | (0.08 | ) | | | (0.23 | ) | | | (0.18 | ) | |
| Net asset value, end of period | | $ | 13.13 | | | $ | 11.80 | | | $ | 9.89 | | |
| Total Return (c) | | | 11.97 | % | | | 21.69 | % | | | –17.52 | % | |
| | | | | | | | | | | | | | |
| Ratios and Supplemental Data: | | | | | | | | | | | | | |
| Net assets, end of period (in thousands) | | $ | 544 | | | $ | 597 | | | $ | 494 | | |
| Ratios to average net assets (d): | | | | | | | | | | | | | |
| Net expenses | | | 1.20 | % | | | 1.18 | % | | | 1.16 | % | |
| Gross expenses | | | 1.87 | % | | | 3.23 | % | | | 7.68 | % | |
| Net investment income (loss) | | | 0.63 | % | | | 1.80 | % | | | 1.71 | % | |
| Portfolio turnover rate | | | 23 | % | | | 19 | % | | | 30 | % | |
| * | The inception date for the R6 Shares was April 6, 2018. |
| (a) | Net investment income (loss) has been computed using the average shares method. |
| (b) | Amount is less than $0.01 per share. |
| (c) | Total returns reflect reinvestment of all dividends and distributions, if any. Certain expenses of the Portfolio may have been waived or reimbursed by the Investment Manager, State Street or DST; without such waiver/reimbursement of expenses, the Portfolio’s returns would have been lower. Returns for a period of less than one year are not annualized. |
| (d) | Annualized for a period of less than one year except for non-recurring expenses. |
The accompanying notes are an integral part of these financial statements.
Annual Report 217
LAZARD EMERGING MARKETS EQUITY ADVANTAGE PORTFOLIO
Selected data for a share
of capital stock outstanding | | Year Ended | |
| throughout each period | | 12/31/20 | | | 12/31/19 | | | 12/31/18 | | | 12/31/17 | | | 12/31/16 | | |
| Institutional Shares | | | | | | | | | | | | | | | | | | | | | |
| Net asset value, beginning of period | | $ | 11.84 | | | $ | 10.03 | | | $ | 12.27 | | | $ | 8.71 | | | $ | 8.06 | | |
| Income (Loss) from investment operations: | | | | | | | | | | | | | | | | | | | | | |
| Net investment income (loss) (a) | | | 0.10 | | | | 0.24 | | | | 0.19 | | | | 0.12 | | | | 0.12 | | |
| Net realized and unrealized gain (loss) | | | 1.97 | | | | 1.80 | | | | (2.19 | ) | | | 3.58 | | | | 0.67 | | |
| Total from investment operations | | | 2.07 | | | | 2.04 | | | | (2.00 | ) | | | 3.70 | | | | 0.79 | | |
| Less distributions from: | | | | | | | | | | | | | | | | | | | | | |
| Net investment income | | | (0.10 | ) | | | (0.23 | ) | | | (0.22 | ) | | | (0.13 | ) | | | (0.13 | ) | |
| Net realized gains | | | (0.02 | ) | | | — | | | | — | (b) | | | — | | | | — | | |
| Return of capital | | | — | | | | — | | | | (0.02 | ) | | | (0.01 | ) | | | (0.01 | ) | |
| Total distributions | | | (0.12 | ) | | | (0.23 | ) | | | (0.24 | ) | | | (0.14 | ) | | | (0.14 | ) | |
| Net asset value, end of period | | $ | 13.79 | | | $ | 11.84 | | | $ | 10.03 | | | $ | 12.27 | | | $ | 8.71 | | |
| Total Return (c) | | | 17.50 | % | | | 20.34 | % | | –16.23 | % | | | 42.52 | % | | | 9.83 | % | |
| | | | | | | | | | | | | | | | | | | | | | |
| Ratios and Supplemental Data: | | | | | | | | | | | | | | | | | | | | | |
| Net assets, end of period (in thousands) | | $ | 27,898 | | | $ | 9,190 | | | $ | 3,107 | | | $ | 4,191 | | | $ | 2,896 | | |
| Ratios to average net assets: | | | | | | | | | | | | | | | | | | | | | |
| Net expenses | | | 1.10 | % | | | 1.10 | % | | | 1.10 | % | | | 1.10 | % | | | 1.10 | % | |
| Gross expenses | | | 1.97 | % | | | 3.19 | % | | | 5.60 | % | | | 6.29 | % | | | 9.57 | % | |
| Net investment income (loss) | | | 0.87 | % | | | 2.15 | % | | | 1.59 | % | | | 1.15 | % | | | 1.41 | % | |
| Portfolio turnover rate | | | 91 | % | | | 59 | % | | | 61 | % | | | 52 | % | | | 57 | % | |
The accompanying notes are an integral part of these financial statements.
218 Annual Report
Selected data for a share
of capital stock outstanding | | Year Ended | |
| throughout each period | | 12/31/20 | | | 12/31/19 | | | 12/31/18 | | | 12/31/17 | | | 12/31/16 | | |
| Open Shares | | | | | | | | | | | | | | | | | | | | | |
| Net asset value, beginning of period | | $ | 11.85 | | | $ | 10.04 | | | $ | 12.27 | | | $ | 8.71 | | | $ | 8.06 | | |
| Income (Loss) from investment operations: | | | | | | | | | | | | | | | | | | | | | |
| Net investment income (loss) (a) | | | 0.09 | | | | 0.21 | | | | 0.16 | | | | 0.08 | | | | 0.09 | | |
| Net realized and unrealized gain (loss) | | | 1.93 | | | | 1.79 | | | | (2.18 | ) | | | 3.58 | | | | 0.68 | | |
| Total from investment operations | | | 2.02 | | | | 2.00 | | | | (2.02 | ) | | | 3.66 | | | | 0.77 | | |
| Less distributions from: | | | | | | | | | | | | | | | | | | | | | |
| Net investment income | | | (0.06 | ) | | | (0.19 | ) | | | (0.19 | ) | | | (0.09 | ) | | | (0.11 | ) | |
| Net realized gains | | | (0.02 | ) | | | — | | | | — | (b) | | | — | | | | — | | |
| Return of capital | | | — | | | | — | | | | (0.02 | ) | | | (0.01 | ) | | | (0.01 | ) | |
| Total distributions | | | (0.08 | ) | | | (0.19 | ) | | | (0.21 | ) | | | (0.10 | ) | | | (0.12 | ) | |
| Net asset value, end of period | | $ | 13.79 | | | $ | 11.85 | | | $ | 10.04 | | | $ | 12.27 | | | $ | 8.71 | | |
| Total Return (c) | | | 17.10 | % | | | 19.97 | % | | –16.40 | % | | | 42.09 | % | | | 9.51 | % | |
| | | | | | | | | | | | | | | | | | | | | | |
| Ratios and Supplemental Data: | | | | | | | | | | | | | | | | | | | | | |
| Net assets, end of period (in thousands) | | $ | 876 | | | $ | 1,162 | | | $ | 476 | | | $ | 356 | | | $ | 120 | | |
| Ratios to average net assets: | | | | | | | | | | | | | | | | | | | | | |
| Net expenses | | | 1.35 | % | | | 1.38 | % | | | 1.40 | % | | | 1.40 | % | | | 1.40 | % | |
| Gross expenses | | | 2.68 | % | | | 4.32 | % | | | 8.09 | % | | | 12.17 | % | | | 20.02 | % | |
| Net investment income (loss) | | | 0.76 | % | | | 1.87 | % | | | 1.35 | % | | | 0.72 | % | | | 1.06 | % | |
| Portfolio turnover rate | | | 91 | % | | | 59 | % | | | 61 | % | | | 52 | % | | | 57 | % | |
| (a) | Net investment income (loss) has been computed using the average shares method. |
| (b) | Amount is less than $0.01 per share. |
| (c) | Total returns reflect reinvestment of all dividends and distributions, if any. Certain expenses of the Portfolio may have been waived or reimbursed by the Investment Manager, State Street or DST; without such waiver/reimbursement of expenses, the Portfolio’s returns would have been lower. |
The accompanying notes are an integral part of these financial statements.
Annual Report 219
LAZARD EMERGING MARKETS EQUITY BLEND PORTFOLIO
Selected data for a share
of capital stock outstanding | | Year Ended | |
| throughout each period | | 12/31/20 | | | 12/31/19 | | | 12/31/18 | | | 12/31/17 | | | 12/31/16 | | |
| Institutional Shares | | | | | | | | | | | | | | | | | | | | | |
| Net asset value, beginning of period | | $ | 12.18 | | | $ | 10.02 | | | $ | 12.93 | | | $ | 9.60 | | | $ | 8.53 | | |
| Income (Loss) from investment operations: | | | | | | | | | | | | | | | | | | | | | |
| Net investment income (loss) (a) | | | 0.13 | | | | 0.13 | | | | 0.17 | | | | 0.10 | | | | 0.08 | ^ | |
| Net realized and unrealized gain (loss) | | | 1.66 | | | | 2.29 | | | | (2.89 | ) | | | 3.35 | | | | 1.04 | | |
| Total from investment operations | | | 1.79 | | | | 2.42 | | | | (2.72 | ) | | | 3.45 | | | | 1.12 | | |
| Less distributions from: | | | | | | | | | | | | | | | | | | | | | |
| Net investment income | | | (0.17 | ) | | | (0.26 | ) | | | (0.19 | ) | | | (0.12 | ) | | | (0.05 | ) | |
| Total distributions | | | (0.17 | ) | | | (0.26 | ) | | | (0.19 | ) | | | (0.12 | ) | | | (0.05 | ) | |
| Redemption fees | | | — | | | | — | | | | — | | | | — | | | | — | (b) | |
| Net asset value, end of period | | $ | 13.80 | | | $ | 12.18 | | | $ | 10.02 | | | $ | 12.93 | | | $ | 9.60 | | |
| Total Return (c) | | | 14.74 | % | | | 24.21 | % | | | –21.05 | % | | | 35.98 | % | | | 13.12 | %^ | |
| | | | | | | | | | | | | | | | | | | | | | |
| Ratios and Supplemental Data: | | | | | | | | | | | | | | | | | | | | | |
| Net assets, end of period (in thousands) | | $ | 74,406 | | | $ | 96,399 | | | $ | 291,404 | | | $ | 385,492 | | | $ | 282,473 | | |
| Ratios to average net assets: | | | | | | | | | | | | | | | | | | | | | |
| Net expenses | | | 1.22 | % | | | 1.26 | % | | | 1.15 | % | | | 1.21 | % | | | 1.25 | %^ | |
| Gross expenses | | | 1.46 | % | | | 1.26 | % | | | 1.15 | % | | | 1.21 | % | | | 1.26 | % | |
| Net investment income (loss) | | | 1.18 | % | | | 1.16 | % | | | 1.39 | % | | | 0.90 | % | | | 0.88 | %^ | |
| Portfolio turnover rate | | | 53 | % | | | 56 | % | | | 61 | % | | | 57 | % | | | 47 | % | |
The accompanying notes are an integral part of these financial statements.
220 Annual Report
Selected data for a share
of capital stock outstanding | | Year Ended | |
| throughout each period | | 12/31/20 | | | 12/31/19 | | | 12/31/18 | | | 12/31/17 | | | 12/31/16 | | |
| Open Shares | | | | | | | | | | | | | | | | | | | | | |
| Net asset value, beginning of period | | $ | 12.23 | | | $ | 10.03 | | | $ | 12.95 | | | $ | 9.62 | | | $ | 8.55 | | |
| Income (Loss) from investment operations: | | | | | | | | | | | | | | | | | | | | | |
| Net investment income (loss) (a) | | | 0.10 | | | | 0.14 | | | | 0.12 | | | | 0.06 | | | | 0.05 | ^ | |
| Net realized and unrealized gain (loss) | | | 1.65 | | | | 2.29 | | | | (2.89 | ) | | | 3.34 | | | | 1.04 | | |
| Total from investment operations | | | 1.75 | | | | 2.43 | | | | (2.77 | ) | | | 3.40 | | | | 1.09 | | |
| Less distributions from: | | | | | | | | | | | | | | | | | | | | | |
| Net investment income | | | (0.13 | ) | | | (0.23 | ) | | | (0.15 | ) | | | (0.07 | ) | | | (0.02 | ) | |
| Return of capital | | | — | | | | — | | | | — | | | | — | | | | — | (b) | |
| Total distributions | | | (0.13 | ) | | | (0.23 | ) | | | (0.15 | ) | | | (0.07 | ) | | | (0.02 | ) | |
| Redemption fees | | | — | | | | — | | | | — | | | | — | (b) | | | — | (b) | |
| Net asset value, end of period | | $ | 13.85 | | | $ | 12.23 | | | $ | 10.03 | | | $ | 12.95 | | | $ | 9.62 | | |
| Total Return (c) | | | 14.39 | % | | | 24.21 | % | | –21.39 | % | | | 35.38 | % | | | 12.74 | %^ | |
| | | | | | | | | | | | | | | | | | | | | | |
| Ratios and Supplemental Data: | | | | | | | | | | | | | | | | | | | | | |
| Net assets, end of period (in thousands) | | $ | 4,019 | | | $ | 5,977 | | | $ | 6,200 | | | $ | 9,728 | | | $ | 6,804 | | |
| Ratios to average net assets: | | | | | | | | | | | | | | | | | | | | | |
| Net expenses | | | 1.48 | % | | | 1.52 | % | | | 1.53 | % | | | 1.60 | % | | | 1.60 | %^ | |
| Gross expenses | | | 1.83 | % | | | 1.77 | % | | | 1.53 | % | | | 1.61 | % | | | 1.89 | % | |
| Net investment income (loss) | | | 0.88 | % | | | 1.27 | % | | | 1.01 | % | | | 0.50 | % | | | 0.54 | %^ | |
| Portfolio turnover rate | | | 53 | % | | | 56 | % | | | 61 | % | | | 57 | % | | | 47 | % | |
| ^ | Refer to Note 3 in the Notes to Financial Statements for discussion of prior period custodian out-of-pocket expenses that were reimbursed to the Portfolio in the period. The amount of the reimbursement was less than $0.005 per share. There was no impact on the total return of the Portfolio. The impact on net expenses and net investment income (loss) ratios of the Portfolio was less than 0.005%. |
| (a) | Net investment income (loss) has been computed using the average shares method. |
| (b) | Amount is less than $0.01 per share. |
| (c) | Total returns reflect reinvestment of all dividends and distributions, if any. Certain expenses of the Portfolio may have been waived or reimbursed by the Investment Manager, State Street or DST; without such waiver/reimbursement of expenses, the Portfolio’s returns would have been lower. |
The accompanying notes are an integral part of these financial statements.
Annual Report 221
LAZARD EMERGING MARKETS EQUITY PORTFOLIO
Selected data for a share
of capital stock outstanding | | Year Ended | |
| throughout each period | | 12/31/20 | | 12/31/19 | | 12/31/18 | | 12/31/17 | | 12/31/16 | |
| Institutional Shares | | | | | | | | | | | | | | | | | | | | | |
| Net asset value, beginning of period | | $ | 18.48 | | | $ | 16.06 | | | $ | 20.02 | | | $ | 15.96 | | | $ | 13.44 | | |
| Income (Loss) from investment operations: | | | | | | | | | | | | | | | | | | | | | |
| Net investment income (loss) (a) | | | 0.37 | | | | 0.42 | | | | 0.39 | | | | 0.33 | | | | 0.24 | ^ | |
| Net realized and unrealized gain (loss) | | | (0.44 | ) | | | 2.45 | | | | (4.01 | ) | | | 4.13 | | | | 2.52 | | |
| Total from investment operations | | | (0.07 | ) | | | 2.87 | | | | (3.62 | ) | | | 4.46 | | | | 2.76 | | |
| Less distributions from: | | | | | | | | | | | | | | | | | | | | | |
| Net investment income | | | (0.38 | ) | | | (0.45 | ) | | | (0.34 | ) | | | (0.40 | ) | | | (0.24 | ) | |
| Total distributions | | | (0.38 | ) | | | (0.45 | ) | | | (0.34 | ) | | | (0.40 | ) | | | (0.24 | ) | |
| Redemption fees | | | — | | | | — | | | | — | | | | — | | | | — | (b) | |
| Net asset value, end of period | | $ | 18.03 | | | $ | 18.48 | | | $ | 16.06 | | | $ | 20.02 | | | $ | 15.96 | | |
| Total Return (c) | | | –0.10 | % | | | 18.04 | % | | | –18.09 | % | | | 28.02 | % | | | 20.52 | %^ | |
| | | | | | | | | | | | | | | | | | | | | | |
| Ratios and Supplemental Data: | | | | | | | | | | | | | | | | | | | | | |
| Net assets, end of period (in thousands) | | $ | 3,923,878 | | | $ | 6,645,429 | | | $ | 7,573,861 | | | $ | 11,285,358 | | | $ | 9,311,693 | | |
| Ratios to average net assets: | | | | | | | | | | | | | | | | | | | | | |
| Net expenses | | | 1.09 | % | | | 1.08 | % | | | 1.07 | % | | | 1.08 | % | | | 1.09 | %^ | |
| Gross expenses | | | 1.09 | % | | | 1.08 | % | | | 1.07 | % | | | 1.08 | % | | | 1.09 | % | |
| Net investment income (loss) | | | 2.36 | % | | | 2.42 | % | | | 2.12 | % | | | 1.82 | % | | | 1.59 | %^ | |
| Portfolio turnover rate | | | 39 | % | | | 20 | % | | | 16 | % | | | 14 | % | | | 12 | % | |
The accompanying notes are an integral part of these financial statements.
222 Annual Report
Selected data for a share
of capital stock outstanding | | Year Ended | |
| throughout each period | | 12/31/20 | | 12/31/19 | | 12/31/18 | | 12/31/17 | | 12/31/16 | |
| Open Shares | | | | | | | | | | | | | | | | | | | | | |
| Net asset value, beginning of period | | $ | 19.03 | | | $ | 16.53 | | | $ | 20.60 | | | $ | 16.41 | | | $ | 13.82 | | |
| Income (Loss) from investment operations: | | | | | | | | | | | | | | | | | | | | | |
| Net investment income (loss) (a) | | | 0.34 | | | | 0.39 | | | | 0.35 | | | | 0.29 | | | | 0.21 | ^ | |
| Net realized and unrealized gain (loss) | | | (0.45 | ) | | | 2.52 | | | | (4.12 | ) | | | 4.25 | | | | 2.58 | | |
| Total from investment operations | | | (0.11 | ) | | | 2.91 | | | | (3.77 | ) | | | 4.54 | | | | 2.79 | | |
| Less distributions from: | | | | | | | | | | | | | | | | | | | | | |
| Net investment income | | | (0.34 | ) | | | (0.41 | ) | | | (0.30 | ) | | | (0.35 | ) | | | (0.20 | ) | |
| Total distributions | | | (0.34 | ) | | | (0.41 | ) | | | (0.30 | ) | | | (0.35 | ) | | | (0.20 | ) | |
| Redemption fees | | | — | | | | — | | | | — | | | | — | | | | — | (b) | |
| Net asset value, end of period | | $ | 18.58 | | | $ | 19.03 | | | $ | 16.53 | | | $ | 20.60 | | | $ | 16.41 | | |
| Total Return (c) | | | –0.34 | % | | | 17.73 | % | | | –18.32 | % | | | 27.73 | % | | | 20.17 | %^ | |
| | | | | | | | | | | | | | | | | | | | | | |
| Ratios and Supplemental Data: | | | | | | | | | | | | | | | | | | | | | |
| Net assets, end of period (in thousands) | | $ | 421,990 | | | $ | 969,347 | | | $ | 1,004,569 | | | $ | 1,515,715 | | | $ | 1,287,552 | | |
| Ratios to average net assets: | | | | | | | | | | | | | | | | | | | | | |
| Net expenses | | | 1.34 | % | | | 1.34 | % | | | 1.32 | % | | | 1.34 | % | | | 1.35 | %^ | |
| Gross expenses | | | 1.34 | % | | | 1.34 | % | | | 1.32 | % | | | 1.34 | % | | | 1.35 | % | |
| Net investment income (loss) | | | 2.08 | % | | | 2.19 | % | | | 1.85 | % | | | 1.55 | % | | | 1.35 | %^ | |
| Portfolio turnover rate | | | 39 | % | | | 20 | % | | | 16 | % | | | 14 | % | | | 12 | % | |
The accompanying notes are an integral part of these financial statements.
Annual Report 223
Selected data for a share
of capital stock outstanding | | Year Ended | |
| throughout the period | | 12/31/20 | | 12/31/19 | | 12/31/18 | | 12/31/17 | | 12/31/16 | |
| R6 Shares | | | | | | | | | | | | | | | | | | | | | |
| Net asset value, beginning of period | | $ | 18.47 | | | $ | 16.06 | | | $ | 20.02 | | | $ | 15.96 | | | $ | 13.44 | | |
| Income (Loss) from investment operations: | | | | | | | | | | | | | | | | | | | | | |
| Net investment income (loss) (a) | | | 0.40 | | | | 0.40 | | | | 0.40 | | | | 0.35 | | | | 0.23 | ^ | |
| Net realized and unrealized gain (loss) | | | (0.45 | ) | | | 2.46 | | | | (4.02 | ) | | | 4.11 | | | | 2.53 | | |
| Total from investment operations | | | (0.05 | ) | | | 2.86 | | | | (3.62 | ) | | | 4.46 | | | | 2.76 | | |
| Less distributions from: | | | | | | | | | | | | | | | | | | | | | |
| Net investment income | | | (0.38 | ) | | | (0.45 | ) | | | (0.34 | ) | | | (0.40 | ) | | | (0.24 | ) | |
| Total distributions | | | (0.38 | ) | | | (0.45 | ) | | | (0.34 | ) | | | (0.40 | ) | | | (0.24 | ) | |
| Net asset value, end of period | | $ | 18.04 | | | $ | 18.47 | | | $ | 16.06 | | | $ | 20.02 | | | $ | 15.96 | | |
| Total Return (c) | | | 0.01 | % | | | 17.98 | % | | | –18.09 | % | | | 28.02 | % | | | 20.52 | %^ | |
| | | | | | | | | | | | | | | | | | | | | | |
| Ratios and Supplemental Data: | | | | | | | | | | | | | | | | | | | | | |
| Net assets, end of period (in thousands) | | $ | 23,631 | | | $ | 184,337 | | | $ | 232,507 | | | $ | 372,568 | | | $ | 197,959 | | |
| Ratios to average net assets: | | | | | | | | | | | | | | | | | | | | | |
| Net expenses | | | 1.08 | % | | | 1.08 | % | | | 1.07 | % | | | 1.08 | % | | | 1.09 | %^ | |
| Gross expenses | | | 1.09 | % | | | 1.08 | % | | | 1.07 | % | | | 1.08 | % | | | 1.10 | % | |
| Net investment income (loss) | | | 2.52 | % | | | 2.30 | % | | | 2.15 | % | | | 1.91 | % | | | 1.54 | %^ | |
| Portfolio turnover rate | | | 39 | % | | | 20 | % | | | 16 | % | | | 14 | % | | | 12 | % | |
| ^ | Refer to Note 3 in the Notes to Financial Statements for discussion of prior period custodian out-of-pocket expenses that were reimbursed to the Portfolio in the period. The amount of the reimbursement was less than $0.005 per share. There was no impact on the total return of the Portfolio. The impact on net expenses and net investment income (loss) ratios of the Portfolio was less than 0.005%. |
| (a) | Net investment income (loss) has been computed using the average shares method. |
| (b) | Amount is less than $0.01 per share. |
| (c) | Total returns reflect reinvestment of all dividends and distributions, if any. Certain expenses of the Portfolio may have been waived or reimbursed by the Investment Manager, State Street or DST; without such waiver/reimbursement of expenses, the Portfolio’s returns would have been lower. |
The accompanying notes are an integral part of these financial statements.
224 Annual Report
LAZARD EQUITY FRANCHISE PORTFOLIO
Selected data for a share
of capital stock outstanding | | Year Ended | | For the Period
9/29/17* to | |
| throughout each period | | 12/31/20 | | 12/31/19 | | 12/31/18 | | 12/31/17 | |
| Institutional Shares | | | | | | | | | | | | | | | | | | |
| Net asset value, beginning of period | | $ | 10.17 | | | $ | 8.84 | | | $ | 10.38 | | | | $ | 10.00 | | |
| Income (Loss) from investment operations: | | | | | | | | | | | | | | | | | | |
| Net investment income (loss) (a) | | | 0.10 | | | | 0.19 | | | | 0.20 | | | | | 0.03 | | |
| Net realized and unrealized gain (loss) | | | 0.02 | | | | 1.73 | | | | (0.75 | ) | | | | 0.40 | | |
| Total from investment operations | | | 0.12 | | | | 1.92 | | | | (0.55 | ) | | | | 0.43 | | |
| Less distributions from: | | | | | | | | | | | | | | | | | | |
| Net investment income | | | (0.07 | ) | | | (0.15 | ) | | | (0.21 | ) | | | | (0.03 | ) | |
| Net realized gains | | | (0.05 | ) | | | (0.44 | ) | | | (0.78 | ) | | | | (0.02 | ) | |
| Total distributions | | | (0.12 | ) | | | (0.59 | ) | | | (0.99 | ) | | | | (0.05 | ) | |
| Net asset value, end of period | | $ | 10.17 | | | $ | 10.17 | | | $ | 8.84 | | | | $ | 10.38 | | |
| Total Return (b) | | | 1.15 | % | | | 21.70 | % | | | –5.10 | % | | | | 4.25 | % | |
| | | | | | | | | | | | | | | | | | | |
| Ratios and Supplemental Data: | | | | | | | | | | | | | | | | | | |
| Net assets, end of period (in thousands) | | $ | 91,720 | | | $ | 39,878 | | | $ | 8,341 | | | | $ | 5,566 | | |
| Ratios to average net assets (c): | | | | | | | | | | | | | | | | | | |
| Net expenses | | | 0.95 | % | | | 0.95 | % | | | 0.95 | % | | | | 0.95 | % | |
| Gross expenses | | | 1.11 | % | | | 1.36 | % | | | 3.42 | % | | | | 3.21 | % | |
| Net investment income (loss) | | | 1.09 | % | | | 1.95 | % | | | 1.94 | % | | | | 1.26 | % | |
| Portfolio turnover rate | | | 79 | % | | | 95 | % | | | 97 | % | | | | 10 | % | |
The accompanying notes are an integral part of these financial statements.
Annual Report 225
Selected data for a share
of capital stock outstanding | | Year Ended | | For the Period
9/29/17* to | |
| throughout each period | | 12/31/20 | | 12/31/19 | | 12/31/18 | | 12/31/17 | |
| Open Shares | | | | | | | | | | | | | | | | | | |
| Net asset value, beginning of period | | $ | 10.17 | | | | $ 8.84 | | | | $10.38 | | | | | $10.00 | | |
| Income (Loss) from investment operations: | | | | | | | | | | | | | | | | | | |
| Net investment income (loss) (a) | | | 0.09 | | | | 0.16 | | | | 0.19 | | | | | 0.03 | | |
| Net realized and unrealized gain (loss) | | | — | (d) | | | 1.73 | | | | (0.77 | ) | | | | 0.39 | | |
| Total from investment operations | | | 0.09 | | | | 1.89 | | | | (0.58 | ) | | | | 0.42 | | |
| Less distributions from: | | | | | | | | | | | | | | | | | | |
| Net investment income | | | (0.04 | ) | | | (0.12 | ) | | | (0.18 | ) | | | | (0.02 | ) | |
| Net realized gains | | | (0.05 | ) | | | (0.44 | ) | | | (0.78 | ) | | | | (0.02 | ) | |
| Total distributions | | | (0.09 | ) | | | (0.56 | ) | | | (0.96 | ) | | | | (0.04 | ) | |
| Net asset value, end of period | | $ | 10.17 | | | | $10.17 | | | | $ 8.84 | | | | | $10.38 | | |
| Total Return (b) | | | 0.90 | % | | | 21.40 | % | | | –5.34 | % | | | | 4.18 | % | |
| | | | | | | | | | | | | | | | | | | |
| Ratios and Supplemental Data: | | | | | | | | | | | | | | | | | | |
| Net assets, end of period (in thousands) | | | $ 129 | | | | $ 312 | | | | $ 190 | | | | | $ 111 | | |
| Ratios to average net assets (c): | | | | | | | | | | | | | | | | | | |
| Net expenses | | | 1.20 | % | | | 1.18 | % | | | 1.20 | % | | | | 1.20 | % | |
| Gross expenses | | | 3.64 | % | | | 5.78 | % | | | 10.19 | % | | | | 23.62 | % | |
| Net investment income (loss) | | | 1.00 | % | | | 1.64 | % | | | 1.75 | % | | | | 1.14 | % | |
| Portfolio turnover rate | | | 79 | % | | | 95 | % | | | 97 | % | | | | 10 | % | |
| * | The Portfolio commenced operations on September 29, 2017. |
| (a) | Net investment income (loss) has been computed using the average shares method. |
| (b) | Total returns reflect reinvestment of all dividends and distributions, if any. Certain expenses of the Portfolio may have been waived or reimbursed by the Investment Manager, State Street or DST; without such waiver/reimbursement of expenses, the Portfolio’s returns would have been lower. Returns for a period of less than one year are not annualized. |
| (c) | Annualized for a period of less than one year except for non-recurring expenses. |
| (d) | Amount is less than $0.01 per share. |
The accompanying notes are an integral part of these financial statements.
226 Annual Report
LAZARD GLOBAL EQUITY SELECT PORTFOLIO
Selected data for a share
of capital stock outstanding | | Year Ended | |
| throughout each period | | 12/31/20 | | 12/31/19 | | 12/31/18 | | 12/31/17 | | 12/31/16 | |
| Institutional Shares | | | | | | | | | | | | | | | | | | | | | |
| Net asset value, beginning of period | | $ | 14.56 | | | $ | 11.72 | | | $ | 13.04 | | | $ | 10.53 | | | $ | 10.33 | | |
| Income (Loss) from investment operations: | | | | | | | | | | | | | | | | | | | | | |
| Net investment income (loss) (a) | | | 0.07 | | | | 0.11 | | | | 0.09 | | | | 0.07 | | | | 0.09 | | |
| Net realized and unrealized gain (loss) | | | 2.24 | | | | 2.84 | | | | (1.02 | ) | | | 2.93 | | | | 0.18 | | |
| Total from investment operations | | | 2.31 | | | | 2.95 | | | | (0.93 | ) | | | 3.00 | | | | 0.27 | | |
| Less distributions from: | | | | | | | | | | | | | | | | | | | | | |
| Net investment income | | | (0.05 | ) | | | (0.10 | ) | | | (0.06 | ) | | | (0.10 | ) | | | (0.07 | ) | |
| Net realized gains | | | (0.50 | ) | | | — | | | | (0.32 | ) | | | (0.39 | ) | | | — | | |
| Return of capital | | | — | | | | (0.01 | ) | | | (0.01 | ) | | | — | | | | — | | |
| Total distributions | | | (0.55 | ) | | | (0.11 | ) | | | (0.39 | ) | | | (0.49 | ) | | | (0.07 | ) | |
| Redemption fees | | | — | | | | — | | | | — | | | | — | | | | — | (b) | |
| Net asset value, end of period | | $ | 16.32 | | | $ | 14.56 | | | $ | 11.72 | | | $ | 13.04 | | | $ | 10.53 | | |
| Total Return (c) | | | 15.97 | % | | | 25.20 | % | | | –7.12 | % | | | 28.52 | % | | | 2.66 | % | |
| | | | | | | | | | | | | | | | | | | | | | |
| Ratios and Supplemental Data: | | | | | | | | | | | | | | | | | | | | | |
| Net assets, end of period (in thousands) | | $ | 92,418 | | | $ | 82,057 | | | $ | 65,382 | | | $ | 58,201 | | | $ | 31,197 | | |
| Ratios to average net assets: | | | | | | | | | | | | | | | | | | | | | |
| Net expenses | | | 0.90 | % | | | 1.01 | % | | | 1.05 | % | | | 1.05 | % | | | 1.07 | % | |
| Gross expenses | | | 0.95 | % | | | 1.08 | % | | | 1.08 | % | | | 1.30 | % | | | 1.75 | % | |
| Net investment income (loss) | | | 0.46 | % | | | 0.85 | % | | | 0.70 | % | | | 0.60 | % | | | 0.86 | % | |
| Portfolio turnover rate | | | 90 | % | | | 25 | % | | | 34 | % | | | 34 | % | | | 40 | % | |
The accompanying notes are an integral part of these financial statements.
Annual Report 227
Selected data for a share
of capital stock outstanding | | Year Ended | |
| throughout each period | | 12/31/20 | | 12/31/19 | | 12/31/18 | | 12/31/17 | | 12/31/16 | |
| Open Shares | | | | | | | | | | | | | | | | | | | | | |
| Net asset value, beginning of period | | $ | 14.57 | | | $ | 11.73 | | | $ | 13.04 | | | $ | 10.54 | | | $ | 10.34 | | |
| Income (Loss) from investment operations: | | | | | | | | | | | | | | | | | | | | | |
| Net investment income (loss) (a) | | | 0.05 | | | | 0.08 | | | | 0.05 | | | | 0.04 | | | | 0.06 | | |
| Net realized and unrealized gain (loss) | | | 2.22 | | | | 2.83 | | | | (1.01 | ) | | | 2.91 | | | | 0.18 | | |
| Total from investment operations | | | 2.27 | | | | 2.91 | | | | (0.96 | ) | | | 2.95 | | | | 0.24 | | |
| Less distributions from: | | | | | | | | | | | | | | | | | | | | | |
| Net investment income | | | (0.01 | ) | | | (0.07 | ) | | | (0.02 | ) | | | (0.06 | ) | | | (0.04 | ) | |
| Net realized gains | | | (0.50 | ) | | | — | | | | (0.32 | ) | | | (0.39 | ) | | | — | | |
| Return of capital | | | — | | | | — | (b) | | | (0.01 | ) | | | — | | | | — | | |
| Total distributions | | | (0.51 | ) | | | (0.07 | ) | | | (0.35 | ) | | | (0.45 | ) | | | (0.04 | ) | |
| Net asset value, end of period | | $ | 16.33 | | | $ | 14.57 | | | $ | 11.73 | | | $ | 13.04 | | | $ | 10.54 | | |
| Total Return (c) | | | 15.67 | % | | | 24.82 | % | | | –7.33 | % | | | 28.01 | % | | | 2.35 | % | |
| | | | | | | | | | | | | | | | | | | | | | |
| Ratios and Supplemental Data: | | | | | | | | | | | | | | | | | | | | | |
| Net assets, end of period (in thousands) | | $ | 1,158 | | | $ | 933 | | | $ | 763 | | | $ | 711 | | | $ | 515 | | |
| Ratios to average net assets: | | | | | | | | | | | | | | | | | | | | | |
| Net expenses | | | 1.15 | % | | | 1.30 | % | | | 1.35 | % | | | 1.35 | % | | | 1.37 | % | |
| Gross expenses | | | 1.74 | % | | | 2.36 | % | | | 2.80 | % | | | 3.70 | % | | | 5.38 | % | |
| Net investment income (loss) | | | 0.35 | % | | | 0.56 | % | | | 0.41 | % | | | 0.32 | % | | | 0.56 | % | |
| Portfolio turnover rate | | | 90 | % | | | 25 | % | | | 34 | % | | | 34 | % | | | 40 | % | |
| (a) | Net investment income (loss) has been computed using the average shares method. |
| (b) | Amount is less than $0.01 per share. |
| (c) | Total returns reflect reinvestment of all dividends and distributions, if any. Certain expenses of the Portfolio may have been waived or reimbursed by the Investment Manager, State Street or DST; without such waiver/reimbursement of expenses, the Portfolio’s returns would have been lower. |
The accompanying notes are an integral part of these financial statements.
228 Annual Report
LAZARD GLOBAL LISTED INFRASTRUCTURE PORTFOLIO
Selected data for a share
of capital stock outstanding | | Year Ended | |
| throughout each period | | 12/31/20 | | 12/31/19 | | 12/31/18 | | 12/31/17 | | 12/31/16 | |
| Institutional Shares | | | | | | | | | | | | | | | | | | | | | |
| Net asset value, beginning of period | | $ | 15.78 | | | $ | 13.51 | | | $ | 15.99 | | | $ | 14.17 | | | $ | 13.42 | | |
| Income (Loss) from investment operations: | | | | | | | | | | | | | | | | | | | | | |
| Net investment income (loss) (a) | | | 0.27 | | | | 0.40 | | | | 0.41 | | | | 0.39 | | | | 0.31 | ^ | |
| Net realized and unrealized gain (loss) | | | (1.02 | ) | | | 2.57 | | | | (0.96 | ) | | | 2.54 | | | | 0.92 | | |
| Total from investment operations | | | (0.75 | ) | | | 2.97 | | | | (0.55 | ) | | | 2.93 | | | | 1.23 | | |
| Less distributions from: | | | | | | | | | | | | | | | | | | | | | |
| Net investment income | | | (0.04 | ) | | | (0.70 | ) | | | (0.72 | ) | | | (0.29 | ) | | | (0.34 | ) | |
| Net realized gains | | | (0.27 | ) | | | — | | | | (1.21 | ) | | | (0.82 | ) | | | (0.14 | ) | |
| Return of capital | | | (0.07 | ) | | | — | | | | — | | | | — | | | | — | | |
| Total distributions | | | (0.38 | ) | | | (0.70 | ) | | | (1.93 | ) | | | (1.11 | ) | | | (0.48 | ) | |
| Redemption fees | | | — | | | | — | | | | — | | | | — | | | | — | (b) | |
| Net asset value, end of period | | $ | 14.65 | | | $ | 15.78 | | | $ | 13.51 | | | $ | 15.99 | | | $ | 14.17 | | |
| Total Return (c) | | | –4.48 | % | | | 22.26 | % | | | –3.68 | % | | | 20.73 | % | | | 9.30 | %^ | |
| | | | | | | | | | | | | | | | | | | | | | |
| Ratios and Supplemental Data: | | | | | | | | | | | | | | | | | | | | | |
| Net assets, end of period (in thousands) | | $ | 7,289,680 | | | $ | 7,277,512 | | | $ | 4,924,359 | | | $ | 4,778,042 | | | $ | 2,931,161 | | |
| Ratios to average net assets: | | | | | | | | | | | | | | | | | | | | | |
| Net expenses | | | 0.96 | % | | | 0.95 | % | | | 0.95 | % | | | 0.95 | % | | | 0.96 | %^ | |
| Gross expenses | | | 0.96 | % | | | 0.95 | % | | | 0.95 | % | | | 0.95 | % | | | 0.96 | % | |
| Net investment income (loss) | | | 1.87 | % | | | 2.63 | % | | | 2.65 | % | | | 2.44 | % | | | 2.29 | %^ | |
| Portfolio turnover rate | | | 42 | % | | | 33 | % | | | 49 | % | | | 33 | % | | | 35 | % | |
The accompanying notes are an integral part of these financial statements.
Annual Report 229
Selected data for a share
of capital stock outstanding | | Year Ended | |
| throughout each period | | 12/31/20 | | 12/31/19 | | 12/31/18 | | 12/31/17 | | 12/31/16 | |
| Open Shares | | | | | | | | | | | | | | | | | | | | | |
| Net asset value, beginning of period | | $ | 15.79 | | | $ | 13.52 | | | $ | 16.01 | | | $ | 14.20 | | | $ | 13.45 | | |
| Income (Loss) from investment operations: | | | | | | | | | | | | | | | | | | | | | |
| Net investment income (loss) (a) | | | 0.23 | | | | 0.36 | | | | 0.37 | | | | 0.35 | | | | 0.29 | ^ | |
| Net realized and unrealized gain (loss) | | | (1.01 | ) | | | 2.57 | | | | (0.97 | ) | | | 2.55 | | | | 0.91 | | |
| Total from investment operations | | | (0.78 | ) | | | 2.93 | | | | (0.60 | ) | | | 2.90 | | | | 1.20 | | |
| Less distributions from: | | | | | | | | | | | | | | | | | | | | | |
| Net investment income | | | (0.03 | ) | | | (0.66 | ) | | | (0.68 | ) | | | (0.27 | ) | | | (0.31 | ) | |
| Net realized gains | | | (0.25 | ) | | | — | | | | (1.21 | ) | | | (0.82 | ) | | | (0.14 | ) | |
| Return of capital | | | (0.07 | ) | | | — | | | | — | | | | — | | | | — | | |
| Total distributions | | | (0.35 | ) | | | (0.66 | ) | | | (1.89 | ) | | | (1.09 | ) | | | (0.45 | ) | |
| Redemption fees | | | — | | | | — | | | | — | | | | — | | | | — | (b) | |
| Net asset value, end of period | | $ | 14.66 | | | $ | 15.79 | | | $ | 13.52 | | | $ | 16.01 | | | $ | 14.20 | | |
| Total Return (c) | | | –4.68 | % | | | 21.94 | % | | | –3.98 | % | | | 20.47 | % | | | 9.01 | %^ | |
| | | | | | | | | | | | | | | | | | | | | | |
| Ratios and Supplemental Data: | | | | | | | | | | | | | | | | | | | | | |
| Net assets, end of period (in thousands) | | $ | 307,757 | | | $ | 448,387 | | | $ | 426,749 | | | $ | 633,243 | | | $ | 462,613 | | |
| Ratios to average net assets: | | | | | | | | | | | | | | | | | | | | | |
| Net expenses | | | 1.21 | % | | | 1.20 | % | | | 1.20 | % | | | 1.21 | % | | | 1.22 | %^ | |
| Gross expenses | | | 1.21 | % | | | 1.20 | % | | | 1.20 | % | | | 1.21 | % | | | 1.22 | % | |
| Net investment income (loss) | | | 1.57 | % | | | 2.39 | % | | | 2.36 | % | | | 2.16 | % | | | 2.09 | %^ | |
| Portfolio turnover rate | | | 42 | % | | | 33 | % | | | 49 | % | | | 33 | % | | | 35 | % | |
| ^ | Refer to Note 3 in the Notes to Financial Statements for discussion of prior period custodian out-of-pocket expenses that were reimbursed to the Portfolio in the period. The amount of the reimbursement was less than $0.005 per share. There was no impact on the total return of the Portfolio. The impact on net expenses and net investment income (loss) ratios of the Portfolio was less than 0.005%. |
| (a) | Net investment income (loss) has been computed using the average shares method. |
| (b) | Amount is less than $0.01 per share. |
| (c) | Total returns reflect reinvestment of all dividends and distributions, if any. |
The accompanying notes are an integral part of these financial statements.
230 Annual Report
LAZARD GLOBAL STRATEGIC EQUITY PORTFOLIO
Selected data for a share
of capital stock outstanding | | Year Ended | |
| throughout each period | | 12/31/20* | | 12/31/19* | | 12/31/18* | | 12/31/17* | | 12/31/16* | |
| Institutional Shares | | | | | | | | | | | | | | | | | | | | | |
| Net asset value, beginning of period | | $ | 10.30 | | | $ | 8.20 | | | $ | 11.55 | | | $ | 47.95 | | | $ | 48.35 | | |
| Income (Loss) from investment operations: | | | | | | | | | | | | | | | | | | | | | |
| Net investment income (loss) (a) | | | 0.02 | | | | 0.10 | | | | 0.05 | | | | 0.40 | | | | 0.35 | | |
| Net realized and unrealized gain (loss) | | | 2.17 | | | | 2.30 | | | | (0.90 | ) | | | 11.20 | | | | (0.40 | ) | |
| Total from investment operations | | | 2.19 | | | | 2.40 | | | | (0.85 | ) | | | 11.60 | | | | (0.05 | ) | |
| Less distributions from: | | | | | | | | | | | | | | | | | | | | | |
| Net investment income | | | (0.01 | ) | | | (0.10 | ) | | | (0.05 | ) | | | (1.00 | ) | | | (0.35 | ) | |
| Net realized gains | | | (0.36 | ) | | | (0.20 | ) | | | (2.45 | ) | | | (47.00 | ) | | | — | | |
| Total distributions | | | (0.37 | ) | | | (0.30 | ) | | | (2.50 | ) | | | (48.00 | ) | | | (0.35 | ) | |
| Net asset value, end of period | | $ | 12.12 | | | $ | 10.30 | | | $ | 8.20 | | | $ | 11.55 | | | $ | 47.95 | | |
| Total Return (b) | | | 21.48 | % | | | 29.19 | % | | | –9.16 | % | | | 24.20 | % | | | –0.15 | % | |
| | | | | | | | | | | | | | | | | | | | | | |
| Ratios and Supplemental Data: | | | | | | | | | | | | | | | | | | | | | |
| Net assets, end of period (in thousands) | | $ | 4,076 | | | $ | 3,185 | | | $ | 2,505 | | | $ | 2,750 | | | $ | 19,816 | | |
| Ratios to average net assets: | | | | | | | | | | | | | | | | | | | | | |
| Net expenses | | | 0.97 | % | | | 1.00 | % | | | 1.05 | % | | | 1.10 | % | | | 1.10 | % | |
| Gross expenses | | | 5.74 | % | | | 6.07 | % | | | 6.41 | % | | | 2.06 | % | | | 2.03 | % | |
| Net investment income (loss) | | | 0.23 | % | | | 1.01 | % | | | 0.60 | % | | | 0.76 | % | | | 0.76 | % | |
| Portfolio turnover rate | | | 59 | % | | | 49 | % | | | 46 | % | | | 65 | % | | | 67 | % | |
The accompanying notes are an integral part of these financial statements.
Annual Report 231
Selected data for a share
of capital stock outstanding | | Year Ended | |
| throughout each period | | 12/31/20* | | 12/31/19* | | 12/31/18* | | 12/31/17* | | 12/31/16* | |
| Open Shares | | | | | | | | | | | | | | | | | | | | | |
| Net asset value, beginning of period | | $ | 10.25 | | | $ | 8.15 | | | $ | 11.50 | | | $ | 47.95 | | | $ | 48.35 | | |
| Income (Loss) from investment operations: | | | | | | | | | | | | | | | | | | | | | |
| Net investment income (loss) (a) | | | — | (c) | | | 0.05 | | | | 0.05 | | | | 0.15 | | | | 0.20 | | |
| Net realized and unrealized gain (loss) | | | 2.13 | | | | 2.30 | | | | (0.95 | ) | | | 11.25 | | | | (0.40 | ) | |
| Total from investment operations | | | 2.13 | | | | 2.35 | | | | (0.90 | ) | | | 11.40 | | | | (0.20 | ) | |
| Less distributions from: | | | | | | | | | | | | | | | | | | | | | |
| Net investment income | | | — | (c) | | | (0.05 | ) | | | — | (c) | | | (0.85 | ) | | | (0.20 | ) | |
| Net realized gains | | | (0.36 | ) | | | (0.20 | ) | | | (2.45 | ) | | | (47.00 | ) | | | — | | |
| Total distributions | | | (0.36 | ) | | | (0.25 | ) | | | (2.45 | ) | | | (47.85 | ) | | | (0.20 | ) | |
| Net asset value, end of period | | $ | 12.02 | | | $ | 10.25 | | | $ | 8.15 | | | $ | 11.50 | | | $ | 47.95 | | |
| Total Return (b) | | | 20.96 | % | | | 29.01 | % | | | –9.39 | % | | | 23.72 | % | | | –0.45 | % | |
| | | | | | | | | | | | | | | | | | | | | | |
| Ratios and Supplemental Data: | | | | | | | | | | | | | | | | | | | | | |
| Net assets, end of period (in thousands) | | $ | 184 | | | $ | 144 | | | $ | 131 | | | $ | 149 | | | $ | 114 | | |
| Ratios to average net assets: | | | | | | | | | | | | | | | | | | | | | |
| Net expenses | | | 1.22 | % | | | 1.29 | % | | | 1.35 | % | | | 1.41 | % | | | 1.40 | % | |
| Gross expenses | | | 8.76 | % | | | 13.26 | % | | | 14.05 | % | | | 12.33 | % | | | 13.31 | % | |
| Net investment income (loss) | | | –0.01 | % | | | 0.72 | % | | | 0.29 | % | | | 0.34 | % | | | 0.39 | % | |
| Portfolio turnover rate | | | 59 | % | | | 49 | % | | | 46 | % | | | 65 | % | | | 67 | % | |
| * | On December 17, 2020, the Fund effected a 1:5 reverse share split. All per share data prior to December 17, 2020 has been adjusted to reflect the reverse share split. |
| (a) | Net investment income (loss) has been computed using the average shares method. |
| (b) | Total returns reflect reinvestment of all dividends and distributions, if any. Certain expenses of the Portfolio may have been waived or reimbursed by the Investment Manager, State Street or DST; without such waiver/reimbursement of expenses, the Portfolio’s returns would have been lower. |
| (c) | Amount is less than $0.01 per share. |
The accompanying notes are an integral part of these financial statements.
232 Annual Report
LAZARD INTERNATIONAL EQUITY ADVANTAGE PORTFOLIO
Selected data for a share
of capital stock outstanding | | Year Ended | |
| throughout each period | | 12/31/20 | | | 12/31/19 | | | 12/31/18 | | | 12/31/17 | | | 12/31/16 | | |
| Institutional Shares | | | | | | | | | | | | | | | | | | | | | |
| Net asset value, beginning of period | | $ | 9.99 | | | $ | 8.70 | | | $ | 10.92 | | | $ | 8.91 | | | $ | 9.21 | | |
| Income (Loss) from investment operations: | | | | | | | | | | | | | | | | | | | | | |
| Net investment income (loss) (a) | | | 0.20 | | | | 0.22 | | | | 0.24 | | | | 0.19 | | | | 0.18 | | |
| Net realized and unrealized gain (loss) | | | 0.33 | | | | 1.29 | | | | (2.01 | ) | | | 2.03 | | | | (0.28 | ) | |
| Total from investment operations | | | 0.53 | | | | 1.51 | | | | (1.77 | ) | | | 2.22 | | | | (0.10 | ) | |
| Less distributions from: | | | | | | | | | | | | | | | | | | | | | |
| Net investment income | | | (0.20 | ) | | | (0.22 | ) | | | (0.33 | ) | | | (0.21 | ) | | | (0.20 | ) | |
| Net realized gains | | | — | | | | — | | | | (0.12 | ) | | | — | | | | — | | |
| Total distributions | | | (0.20 | ) | | | (0.22 | ) | | | (0.45 | ) | | | (0.21 | ) | | | (0.20 | ) | |
| Net asset value, end of period | | $ | 10.32 | | | $ | 9.99 | | | $ | 8.70 | | | $ | 10.92 | | | $ | 8.91 | | |
| Total Return (b) | | | 5.41 | % | | | 17.37 | % | | | –16.26 | % | | | 24.98 | % | | | –1.13 | % | |
| | | | | | | | | | | | | | | | | | | | | | |
| Ratios and Supplemental Data: | | | | | | | | | | | | | | | | | | | | | |
| Net assets, end of period (in thousands) | | $ | 2,472 | | | $ | 2,408 | | | $ | 2,051 | | | $ | 2,508 | | | $ | 1,969 | | |
| Ratios to average net assets: | | | | | | | | | | | | | | | | | | | | | |
| Net expenses | | | 0.90 | % | | | 0.90 | % | | | 0.90 | % | | | 0.90 | % | | | 0.90 | % | |
| Gross expenses | | | 8.57 | % | | | 8.40 | % | | | 7.60 | % | | | 8.91 | % | | | 13.12 | % | |
| Net investment income (loss) | | | 2.24 | % | | | 2.30 | % | | | 2.29 | % | | | 1.89 | % | | | 2.08 | % | |
| Portfolio turnover rate | | | 109 | % | | | 66 | % | | | 72 | % | | | 88 | % | | | 92 | % | |
The accompanying notes are an integral part of these financial statements.
Annual Report 233
Selected data for a share
of capital stock outstanding | | Year Ended | |
| throughout each period | | 12/31/20 | | | 12/31/19 | | | 12/31/18 | | | 12/31/17 | | | 12/31/16 | | |
| Open Shares | | | | | | | | | | | | | | | | | | | | | |
| Net asset value, beginning of period | | $ | 9.99 | | | $ | 8.70 | | | $ | 10.92 | | | $ | 8.91 | | | $ | 9.21 | | |
| Income (Loss) from investment operations: | | | | | | | | | | | | | | | | | | | | | |
| Net investment income (loss) (a) | | | 0.18 | | | | 0.19 | | | | 0.21 | | | | 0.16 | | | | 0.15 | | |
| Net realized and unrealized gain (loss) | | | 0.33 | | | | 1.29 | | | | (2.01 | ) | | | 2.03 | | | | (0.28 | ) | |
| Total from investment operations | | | 0.51 | | | | 1.48 | | | | (1.80 | ) | | | 2.19 | | | | (0.13 | ) | |
| Less distributions from: | | | | | | | | | | | | | | | | | | | | | |
| Net investment income | | | (0.18 | ) | | | (0.19 | ) | | | (0.30 | ) | | | (0.18 | ) | | | (0.17 | ) | |
| Net realized gains | | | — | | | | — | | | | (0.12 | ) | | | — | | | | — | | |
| Total distributions | | | (0.18 | ) | | | (0.19 | ) | | | (0.42 | ) | | | (0.18 | ) | | | (0.17 | ) | |
| Net asset value, end of period | | $ | 10.32 | | | $ | 9.99 | | | $ | 8.70 | | | $ | 10.92 | | | $ | 8.91 | | |
| Total Return (b) | | | 5.14 | % | | | 17.03 | % | | | –16.52 | % | | | 24.60 | % | | | –1.42 | % | |
| | | | | | | | | | | | | | | | | | | | | | |
| Ratios and Supplemental Data: | | | | | | | | | | | | | | | | | | | | | |
| Net assets, end of period (in thousands) | | $ | 119 | | | $ | 113 | | | $ | 97 | | | $ | 116 | | | $ | 93 | | |
| Ratios to average net assets: | | | | | | | | | | | | | | | | | | | | | |
| Net expenses | | | 1.15 | % | | | 1.18 | % | | | 1.20 | % | | | 1.20 | % | | | 1.20 | % | |
| Gross expenses | | | 12.55 | % | | | 17.72 | % | | | 17.67 | % | | | 20.85 | % | | | 25.85 | % | |
| Net investment income (loss) | | | 1.99 | % | | | 2.02 | % | | | 1.99 | % | | | 1.58 | % | | | 1.74 | % | |
| Portfolio turnover rate | | | 109 | % | | | 66 | % | | | 72 | % | | | 88 | % | | | 92 | % | |
| (a) | Net investment income (loss) has been computed using the average shares method. |
| (b) | Total returns reflect reinvestment of all dividends and distributions, if any. Certain expenses of the Portfolio may have been waived or reimbursed by the Investment Manager, State Street or DST; without such waiver/reimbursement of expenses, the Portfolio’s returns would have been lower. |
The accompanying notes are an integral part of these financial statements.
234 Annual Report
LAZARD INTERNATIONAL EQUITY CONCENTRATED PORTFOLIO
Selected data for a share
of capital stock outstanding | | Year Ended | |
| throughout each period | | 12/31/20 | | | 12/31/19 | | | 12/31/18 | | | 12/31/17 | | | 12/31/16 | | |
| Institutional Shares | | | | | | | | | | | | | | | | | | | | | |
| Net asset value, beginning of period | | $ | 10.30 | | | $ | 8.34 | | | $ | 10.43 | | | $ | 8.54 | | | $ | 8.27 | | |
| Income (Loss) from investment operations: | | | | | | | | | | | | | | | | | | | | | |
| Net investment income (loss) (a) | | | 0.09 | | | | 0.19 | | | | 0.14 | | | | 0.13 | | | | 0.14 | | |
| Net realized and unrealized gain (loss) | | | (0.05 | ) | | | 1.94 | | | | (1.84 | ) | | | 1.86 | | | | 0.25 | | |
| Total from investment operations | | | 0.04 | | | | 2.13 | | | | (1.70 | ) | | | 1.99 | | | | 0.39 | | |
| Less distributions from: | | | | | | | | | | | | | | | | | | | | | |
| Net investment income | | | (0.33 | ) | | | (0.17 | ) | | | (0.17 | ) | | | (0.10 | ) | | | (0.12 | ) | |
| Net realized gains | | | — | | | | — | | | | (0.22 | ) | | | — | | | | — | | |
| Total distributions | | | (0.33 | ) | | | (0.17 | ) | | | (0.39 | ) | | | (0.10 | ) | | | (0.12 | ) | |
| Net asset value, end of period | | $ | 10.01 | | | $ | 10.30 | | | $ | 8.34 | | | $ | 10.43 | | | $ | 8.54 | | |
| Total Return (b) | | | 0.47 | % | | | 25.56 | % | | | –16.20 | % | | | 23.29 | % | | | 4.74 | % | |
| | | | | | | | | | | | | | | | | | | | | | |
| Ratios and Supplemental Data: | | | | | | | | | | | | | | | | | | | | | |
| Net assets, end of period (in thousands) | | $ | 13,648 | | | $ | 97,815 | | | $ | 49,105 | | | $ | 69,440 | | | $ | 15,473 | | |
| Ratios to average net assets: | | | | | | | | | | | | | | | | | | | | | |
| Net expenses | | | 0.94 | % | | | 0.95 | % | | | 1.00 | % | | | 1.05 | % | | | 1.05 | % | |
| Gross expenses | | | 1.17 | % | | | 1.05 | % | | | 1.13 | % | | | 1.34 | % | | | 2.29 | % | |
| Net investment income (loss) | | | 0.95 | % | | | 2.00 | % | | | 1.45 | % | | | 1.35 | % | | | 1.64 | % | |
| Portfolio turnover rate | | | 93 | % | | | 72 | % | | | 76 | % | | | 81 | % | | | 92 | % | |
The accompanying notes are an integral part of these financial statements.
Annual Report 235
Selected data for a share
of capital stock outstanding | | Year Ended | |
| throughout each period | | 12/31/20 | | | 12/31/19 | | | 12/31/18 | | | 12/31/17 | | | 12/31/16 | | |
| Open Shares | | | | | | | | | | | | | | | | | | | | | |
| Net asset value, beginning of period | | $ | 10.32 | | | $ | 8.35 | | | $ | 10.45 | | | $ | 8.56 | | | $ | 8.29 | | |
| Income (Loss) from investment operations: | | | | | | | | | | | | | | | | | | | | | |
| Net investment income (loss) (a) | | | 0.07 | | | | 0.18 | | | | 0.09 | | | | 0.10 | | | | 0.11 | | |
| Net realized and unrealized gain (loss) | | | (0.05 | ) | | | 1.93 | | | | (1.82 | ) | | | 1.86 | | | | 0.26 | | |
| Total from investment operations | | | 0.02 | | | | 2.11 | | | | (1.73 | ) | | | 1.96 | | | | 0.37 | | |
| Less distributions from: | | | | | | | | | | | | | | | | | | | | | |
| Net investment income | | | (0.30 | ) | | | (0.14 | ) | | | (0.15 | ) | | | (0.07 | ) | | | (0.10 | ) | |
| Net realized gains | | | — | | | | — | | | | (0.22 | ) | | | — | | | | — | | |
| Total distributions | | | (0.30 | ) | | | (0.14 | ) | | | (0.37 | ) | | | (0.07 | ) | | | (0.10 | ) | |
| Net asset value, end of period | | $ | 10.04 | | | $ | 10.32 | | | $ | 8.35 | | | $ | 10.45 | | | $ | 8.56 | | |
| Total Return (b) | | | 0.33 | % | | | 25.28 | % | | | –16.47 | % | | | 22.87 | % | | | 4.41 | % | |
| | | | | | | | | | | | | | | | | | | | | | |
| Ratios and Supplemental Data: | | | | | | | | | | | | | | | | | | | | | |
| Net assets, end of period (in thousands) | | $ | 413 | | | $ | 430 | | | $ | 399 | | | $ | 220 | | | $ | 114 | | |
| Ratios to average net assets: | | | | | | | | | | | | | | | | | | | | | |
| Net expenses | | | 1.02 | % | | | 1.24 | % | | | 1.29 | % | | | 1.35 | % | | | 1.35 | % | |
| Gross expenses | | | 2.54 | % | | | 3.67 | % | | | 5.24 | % | | | 8.15 | % | | | 11.98 | % | |
| Net investment income (loss) | | | 0.76 | % | | | 1.87 | % | | | 0.96 | % | | | 1.04 | % | | | 1.32 | % | |
| Portfolio turnover rate | | | 93 | % | | | 72 | % | | | 76 | % | | | 81 | % | | | 92 | % | |
| (a) | Net investment income (loss) has been computed using the average shares method. |
| (b) | Total returns reflect reinvestment of all dividends and distributions, if any. Certain expenses of the Portfolio may have been waived or reimbursed by the Investment Manager, State Street or DST; without such waiver/reimbursement of expenses, the Portfolio’s returns would have been lower. |
The accompanying notes are an integral part of these financial statements.
236 Annual Report
LAZARD INTERNATIONAL EQUITY PORTFOLIO
Selected data for a share
of capital stock outstanding | | Year Ended | |
| throughout each period | | 12/31/20 | | | 12/31/19 | | | 12/31/18 | | | 12/31/17 | | | 12/31/16 | | |
| Institutional Shares | | | | | | | | | | | | | | | | | | | | | |
| Net asset value, beginning of period | | $ | 18.61 | | | $ | 15.68 | | | $ | 19.61 | | | $ | 16.20 | | | $ | 17.08 | | |
| Income (Loss) from investment operations: | | | | | | | | | | | | | | | | | | | | | |
| Net investment income (loss) (a) | | | 0.21 | | | | 0.37 | | | | 0.37 | | | | 0.26 | | | | 0.27 | ^ | |
| Net realized and unrealized gain (loss) | | | 1.41 | | | | 2.95 | | | | (3.06 | ) | | | 3.43 | | | | (0.98 | ) | |
| Total from investment operations | | | 1.62 | | | | 3.32 | | | | (2.69 | ) | | | 3.69 | | | | (0.71 | ) | |
| Less distributions from: | | | | | | | | | | | | | | | | | | | | | |
| Net investment income | | | (0.21 | ) | | | (0.39 | ) | | | (0.42 | ) | | | (0.28 | ) | | | (0.17 | ) | |
| Net realized gains | | | — | | | | — | | | | (0.82 | ) | | | — | | | | — | | |
| Total distributions | | | (0.21 | ) | | | (0.39 | ) | | | (1.24 | ) | | | (0.28 | ) | | | (0.17 | ) | |
| Redemption fees | | | — | | | | — | | | | — | | | | — | | | | — | (b) | |
| Net asset value, end of period | | $ | 20.02 | | | $ | 18.61 | | | $ | 15.68 | | | $ | 19.61 | | | $ | 16.20 | | |
| Total Return (c) | | | 8.76 | % | | | 21.19 | % | | | –13.61 | %# | | | 22.81 | % | | | –4.18 | %^ | |
| | | | | | | | | | | | | | | | | | | | | | |
| Ratios and Supplemental Data: | | | | | | | | | | | | | | | | | | | | | |
| Net assets, end of period (in thousands) | | $ | 2,812,450 | | | $ | 2,495,021 | | | $ | 2,102,735 | | | $ | 2,835,262 | | | $ | 1,511,516 | | |
| Ratios to average net assets: | | | | | | | | | | | | | | | | | | | | | |
| Net expenses | | | 0.82 | % | | | 0.82 | % | | | 0.81 | % | | | 0.81 | % | | | 0.82 | %^ | |
| Gross expenses | | | 0.82 | % | | | 0.82 | % | | | 0.81 | % | | | 0.81 | % | | | 0.84 | % | |
| Net investment income (loss) | | | 1.21 | % | | | 2.13 | % | | | 1.94 | % | | | 1.44 | % | | | 1.62 | %^ | |
| Portfolio turnover rate | | | 38 | % | | | 37 | % | | | 36 | % | | | 31 | % | | | 25 | % | |
The accompanying notes are an integral part of these financial statements.
Annual Report 237
Selected data for a share
of capital stock outstanding | | Year Ended | |
| throughout each period | | 12/31/20 | | | 12/31/19 | | | 12/31/18 | | | 12/31/17 | | | 12/31/16 | | |
| Open Shares | | | | | | | | | | | | | | | | | | | | | |
| Net asset value, beginning of period | | $ | 18.84 | | | $ | 15.87 | | | $ | 19.83 | | | $ | 16.38 | | | $ | 17.23 | | |
| Income (Loss) from investment operations: | | | | | | | | | | | | | | | | | | | | | |
| Net investment income (loss) (a) | | | 0.17 | | | | 0.33 | | | | 0.32 | | | | 0.30 | | | | 0.13 | ^ | |
| Net realized and unrealized gain (loss) | | | 1.41 | | | | 2.98 | | | | (3.08 | ) | | | 3.38 | | | | (0.90 | ) | |
| Total from investment operations | | | 1.58 | | | | 3.31 | | | | (2.76 | ) | | | 3.68 | | | | (0.77 | ) | |
| Less distributions from: | | | | | | | | | | | | | | | | | | | | | |
| Net investment income | | | (0.16 | ) | | | (0.34 | ) | | | (0.38 | ) | | | (0.23 | ) | | | (0.08 | ) | |
| Net realized gains | | | — | | | | — | | | | (0.82 | ) | | | — | | | | — | | |
| Total distributions | | | (0.16 | ) | | | (0.34 | ) | | | (1.20 | ) | | | (0.23 | ) | | | (0.08 | ) | |
| Redemption fees | | | — | | | | — | | | | — | | | | — | | | | — | (b) | |
| Net asset value, end of period | | $ | 20.26 | | | $ | 18.84 | | | $ | 15.87 | | | $ | 19.83 | | | $ | 16.38 | | |
| Total Return (c) | | | 8.43 | % | | | 20.89 | % | | | –13.83 | %# | | | 22.50 | % | | | –4.46 | %^ | |
| | | | | | | | | | | | | | | | | | | | | | |
| Ratios and Supplemental Data: | | | | | | | | | | | | | | | | | | | | | |
| Net assets, end of period (in thousands) | | $ | 120,781 | | | $ | 257,308 | | | $ | 227,483 | | | $ | 275,014 | | | $ | 1,073,486 | | |
| Ratios to average net assets: | | | | | | | | | | | | | | | | | | | | | |
| Net expenses | | | 1.08 | % | | | 1.07 | % | | | 1.06 | % | | | 1.06 | % | | | 1.07 | %^ | |
| Gross expenses | | | 1.08 | % | | | 1.07 | % | | | 1.06 | % | | | 1.06 | % | | | 1.10 | % | |
| Net investment income (loss) | | | 0.97 | % | | | 1.84 | % | | | 1.67 | % | | | 1.69 | % | | | 0.80 | %^ | |
| Portfolio turnover rate | | | 38 | % | | | 37 | % | | | 36 | % | | | 31 | % | | | 25 | % | |
The accompanying notes are an integral part of these financial statements.
238 Annual Report
Selected data for a share
of capital stock outstanding | | Year Ended | |
| throughout the period | | 12/31/20 | | | 12/31/19 | | | 12/31/18 | | | 12/31/17 | | | 12/31/16 | | |
| R6 Shares | | | | | | | | | | | | | | | | | | | | | |
| Net asset value, beginning of period | | $ | 18.58 | | | $ | 15.66 | | | $ | 19.59 | | | $ | 16.18 | | | $ | 17.07 | | |
| Income (Loss) from investment operations: | | | | | | | | | | | | | | | | | | | | | |
| Net investment income (loss) (a) | | | 0.21 | | | | 0.38 | | | | 0.36 | | | | 0.31 | | | | 0.31 | ^ | |
| Net realized and unrealized gain (loss) | | | 1.41 | | | | 2.93 | | | | (3.05 | ) | | | 3.38 | | | | (1.02 | ) | |
| Total from investment operations | | | 1.62 | | | | 3.31 | | | | (2.69 | ) | | | 3.69 | | | | (0.71 | ) | |
| Less distributions from: | | | | | | | | | | | | | | | | | | | | | |
| Net investment income | | | (0.21 | ) | | | (0.39 | ) | | | (0.42 | ) | | | (0.28 | ) | | | (0.18 | ) | |
| Net realized gains | | | — | | | | — | | | | (0.82 | ) | | | — | | | | — | | |
| Total distributions | | | (0.21 | ) | | | (0.39 | ) | | | (1.24 | ) | | | (0.28 | ) | | | (0.18 | ) | |
| Net asset value, end of period | | $ | 19.99 | | | $ | 18.58 | | | $ | 15.66 | | | $ | 19.59 | | | $ | 16.18 | | |
| Total Return (c) | | | 8.79 | % | | | 21.17 | % | | | –13.62 | %# | | | 22.85 | % | | | –4.17 | %^ | |
| | | | | | | | | | | | | | | | | | | | | | |
| Ratios and Supplemental Data: | | | | | | | | | | | | | | | | | | | | | |
| Net assets, end of period (in thousands) | | $ | 129,419 | | | $ | 107,574 | | | $ | 106,516 | | | $ | 693,744 | | | $ | 79,119 | | |
| Ratios to average net assets: | | | | | | | | | | | | | | | | | | | | | |
| Net expenses | | | 0.81 | % | | | 0.80 | % | | | 0.80 | % | | | 0.80 | % | | | 0.80 | %^ | |
| Gross expenses | | | 0.83 | % | | | 0.82 | % | | | 0.81 | % | | | 0.81 | % | | | 0.86 | % | |
| Net investment income (loss) | | | 1.21 | % | | | 2.19 | % | | | 1.84 | % | | | 1.68 | % | | | 1.88 | %^ | |
| Portfolio turnover rate | | | 38 | % | | | 37 | % | | | 36 | % | | | 31 | % | | | 25 | % | |
| ^ | Refer to Note 3 in the Notes to Financial Statements for discussion of prior period custodian out-of-pocket expenses that were reimbursed to the Portfolio in the period. The amount of the reimbursement was less than $0.005 per share. There was no impact on the total return of the Portfolio. There was a 0.02%, 0.03% and 0.02% impact on the net expenses and net investment income (loss) ratios of the Portfolio’s Institutional, Open and R6 Shares, respectively. |
| # | The Portfolio received settlement proceeds from a foreign exchange trading class action lawsuit. The proceeds from the settlement represent a realized gain and were recorded in the period received. There was a 0.16%, 0.16% and 0.33% impact on the total return of the Portfolio’s Institutional, Open and R6 Shares, respectively. |
| (a) | Net investment income (loss) has been computed using the average shares method. |
| (b) | Amount is less than $0.01 per share. |
| (c) | Total returns reflect reinvestment of all dividends and distributions, if any. Certain expenses of the Portfolio may have been waived or reimbursed by the Investment Manager, State Street or DST; without such waiver/reimbursement of expenses, the Portfolio’s returns would have been lower. |
The accompanying notes are an integral part of these financial statements.
Annual Report 239
LAZARD INTERNATIONAL EQUITY SELECT PORTFOLIO
Selected data for a share
of capital stock outstanding | | Year Ended | |
| throughout each period | | 12/31/20 | | | 12/31/19 | | | 12/31/18 | | | 12/31/17 | | | 12/31/16 | | |
| Institutional Shares | | | | | | | | | | | | | | | | | | | | | |
| Net asset value, beginning of period | | $ | 10.75 | | | $ | 9.13 | | | $ | 11.02 | | | $ | 8.65 | | | $ | 8.80 | | |
| Income (Loss) from investment operations: | | | | | | | | | | | | | | | | | | | | | |
| Net investment income (loss) (a) | | | 0.11 | | | | 0.23 | | | | 0.18 | | | | 0.13 | | | | 0.12 | | |
| Net realized and unrealized gain (loss) | | | 0.78 | | | | 1.62 | | | | (1.82 | ) | | | 2.31 | | | | (0.17 | ) | |
| Total from investment operations | | | 0.89 | | | | 1.85 | | | | (1.64 | ) | | | 2.44 | | | | (0.05 | ) | |
| Less distributions from: | | | | | | | | | | | | | | | | | | | | | |
| Net investment income | | | (0.11 | ) | | | (0.23 | ) | | | (0.25 | ) | | | (0.07 | ) | | | (0.10 | ) | |
| Total distributions | | | (0.11 | ) | | | (0.23 | ) | | | (0.25 | ) | | | (0.07 | ) | | | (0.10 | ) | |
| Net asset value, end of period | | $ | 11.53 | | | $ | 10.75 | | | $ | 9.13 | | | $ | 11.02 | | | $ | 8.65 | | |
| Total Return (b) | | | 8.33 | % | | | 20.32 | % | | | –14.90 | % | | | 28.31 | % | | | –0.63 | % | |
| | | | | | | | | | | | | | | | | | | | | | |
| Ratios and Supplemental Data: | | | | | | | | | | | | | | | | | | | | | |
| Net assets, end of period (in thousands) | | $ | 92,121 | | | $ | 93,586 | | | $ | 74,582 | | | $ | 53,929 | | | $ | 28,299 | | |
| Ratios to average net assets: | | | | | | | | | | | | | | | | | | | | | |
| Net expenses | | | 0.90 | % | | | 0.97 | % | | | 1.05 | % | | | 1.05 | % | | | 1.05 | % | |
| Gross expenses | | | 0.95 | % | | | 0.99 | % | | | 1.05 | % | | | 1.31 | % | | | 1.79 | % | |
| Net investment income (loss) | | | 1.10 | % | | | 2.29 | % | | | 1.73 | % | | | 1.27 | % | | | 1.36 | % | |
| Portfolio turnover rate | | | 34 | % | | | 42 | % | | | 32 | % | | | 30 | % | | | 42 | % | |
The accompanying notes are an integral part of these financial statements.
240 Annual Report
Selected data for a share
of capital stock outstanding | | Year Ended | |
| throughout each period | | 12/31/20 | | | 12/31/19 | | | 12/31/18 | | | 12/31/17 | | | 12/31/16 | | |
| Open Shares | | | | | | | | | | | | | | | | | | | | | |
| Net asset value, beginning of period | | $ | 10.80 | | | $ | 9.17 | | | $ | 11.03 | | | $ | 8.66 | | | $ | 8.82 | | |
| Income (Loss) from investment operations: | | | | | | | | | | | | | | | | | | | | | |
| Net investment income (loss) (a) | | | 0.08 | | | | 0.19 | | | | 0.15 | | | | 0.10 | | | | 0.10 | | |
| Net realized and unrealized gain (loss) | | | 0.78 | | | | 1.64 | | | | (1.82 | ) | | | 2.31 | | | | (0.19 | ) | |
| Total from investment operations | | | 0.86 | | | | 1.83 | | | | (1.67 | ) | | | 2.41 | | | | (0.09 | ) | |
| Less distributions from: | | | | | | | | | | | | | | | | | | | | | |
| Net investment income | | | (0.08 | ) | | | (0.20 | ) | | | (0.19 | ) | | | (0.04 | ) | | | (0.07 | ) | |
| Total distributions | | | (0.08 | ) | | | (0.20 | ) | | | (0.19 | ) | | | (0.04 | ) | | | (0.07 | ) | |
| Net asset value, end of period | | $ | 11.58 | | | $ | 10.80 | | | $ | 9.17 | | | $ | 11.03 | | | $ | 8.66 | | |
| Total Return (b) | | | 8.02 | % | | | 19.97 | % | | | –15.16 | % | | | 27.89 | % | | | –1.03 | % | |
| | | | | | | | | | | | | | | | | | | | | | |
| Ratios and Supplemental Data: | | | | | | | | | | | | | | | | | | | | | |
| Net assets, end of period (in thousands) | | $ | 2,868 | | | $ | 2,502 | | | $ | 1,502 | | | $ | 2,831 | | | $ | 2,092 | | |
| Ratios to average net assets: | | | | | | | | | | | | | | | | | | | | | |
| Net expenses | | | 1.15 | % | | | 1.28 | % | | | 1.35 | % | | | 1.35 | % | | | 1.35 | % | |
| Gross expenses | | | 1.38 | % | | | 1.74 | % | | | 1.83 | % | | | 2.07 | % | | | 2.59 | % | |
| Net investment income (loss) | | | 0.80 | % | | | 1.87 | % | | | 1.42 | % | | | 1.01 | % | | | 1.13 | % | |
| Portfolio turnover rate | | | 34 | % | | | 42 | % | | | 32 | % | | | 30 | % | | | 42 | % | |
| (a) | Net investment income (loss) has been computed using the average shares method. |
| (b) | Total returns reflect reinvestment of all dividends and distributions, if any. Certain expenses of the Portfolio may have been waived or reimbursed by the Investment Manager, State Street or DST; without such waiver/reimbursement of expenses, the Portfolio’s returns would have been lower. |
The accompanying notes are an integral part of these financial statements.
Annual Report 241
LAZARD INTERNATIONAL EQUITY VALUE PORTFOLIO
Selected data for a share
of capital stock outstanding | | Year Ended | | For the Period
10/31/18* | |
| throughout each period | | 12/31/20 | | | 12/31/19 | | | to 12/31/18 | |
| Institutional Shares | | | | | | | | | | | | | |
| Net asset value, beginning of period | | $ | 9.95 | | | $ | 9.14 | | | $ | 10.00 | | |
| Income (Loss) from investment operations: | | | | | | | | | | | | | |
| Net investment income (loss) (a) | | | 0.15 | | | | 0.28 | | | | 0.01 | | |
| Net realized and unrealized gain (loss) | | | (0.54 | ) | | | 1.01 | | | | (0.86 | ) | |
| Total from investment operations | | | (0.39 | ) | | | 1.29 | | | | (0.85 | ) | |
| Less distributions from: | | | | | | | | | | | | | |
| Net investment income | | | (0.20 | ) | | | (0.48 | ) | | | (0.01 | ) | |
| Total distributions | | | (0.20 | ) | | | (0.48 | ) | | | (0.01 | ) | |
| Net asset value, end of period | | $ | 9.36 | | | $ | 9.95 | | | $ | 9.14 | | |
| Total Return (b)(c) | | | –3.81 | % | | | 14.14 | % | | | –8.49 | % | |
| | | | | | | | | | | | | | |
| Ratios and Supplemental Data: | | | | | | | | | | | | | |
| Net assets, end of period (in thousands) | | $ | 2,711 | | | $ | 13,132 | | | $ | 22,945 | | |
| Ratios to average net assets (d): | | | | | | | | | | | | | |
| Net expenses | | | 0.95 | % | | | 0.95 | % | | | 0.95 | % | |
| Gross expenses | | | 6.59 | % | | | 2.01 | % | | | 1.34 | % | |
| Net investment income (loss) | | | 1.75 | % | | | 2.87 | % | | | 0.72 | % | |
| Portfolio turnover rate | | | 86 | % | | | 104 | % | | | 37 | % | |
The accompanying notes are an integral part of these financial statements.
242 Annual Report
Selected data for a share
of capital stock outstanding | | Year Ended | | For the Period
10/31/18* | |
| throughout each period | | 12/31/20 | | | 12/31/19 | | | to 12/31/18 | |
| Open Shares | | | | | | | | | | | | | |
| Net asset value, beginning of period | | $ | 9.95 | | | $ | 9.13 | | | $ | 10.00 | | |
| Income (Loss) from investment operations: | | | | | | | | | | | | | |
| Net investment income (loss) (a) | | | 0.15 | | | | 0.21 | | | | — | (e) | |
| Net realized and unrealized gain (loss) | | | (0.56 | ) | | | 1.06 | | | | (0.86 | ) | |
| Total from investment operations | | | (0.41 | ) | | | 1.27 | | | | (0.86 | ) | |
| Less distributions from: | | | | | | | | | | | | | |
| Net investment income | | | (0.18 | ) | | | (0.45 | ) | | | (0.01 | ) | |
| Total distributions | | | (0.18 | ) | | | (0.45 | ) | | | (0.01 | ) | |
| Net asset value, end of period | | $ | 9.36 | | | $ | 9.95 | | | $ | 9.13 | | |
| Total Return (b)(c) | | | –4.06 | % | | | 13.98 | % | | | –8.63 | % | |
| | | | | | | | | | | | | | |
| Ratios and Supplemental Data: | | | | | | | | | | | | | |
| Net assets, end of period (in thousands) | | $ | 40 | | | $ | 141 | | | $ | 38 | | |
| Ratios to average net assets (d): | | | | | | | | | | | | | |
| Net expenses | | | 1.21 | % | | | 1.13 | % | | | 1.20 | % | |
| Gross expenses | | | 14.84 | % | | | 15.82 | % | | | 7.91 | % | |
| Net investment income (loss) | | | 1.71 | % | | | 2.15 | % | | | 0.03 | % | |
| Portfolio turnover rate | | | 86 | % | | | 104 | % | | | 37 | % | |
| * | The Portfolio commenced operations on October 31, 2018. |
| (a) | Net investment income (loss) has been computed using the average shares method. |
| (b) | Total returns reflect reinvestment of all dividends and distributions, if any. Certain expenses of the Portfolio may have been waived or reimbursed by the Investment Manager, State Street or DST; without such waiver/reimbursement of expenses, the Portfolio’s returns would have been lower. Returns for a period of less than one year are not annualized. |
| (c) | In 2020, the Portfolio’s total return includes a payment by an affiliate of 2.83% for Institutional Shares and 2.71% for Open Shares. Excluding this voluntary reimbursement payment, total return would have been –6.64% for Institutional Shares and –6.77% for Open Shares. |
| (d) | Annualized for a period of less than one year except for non-recurring expenses. |
| (e) | Amount is less than $0.01 per share. |
The accompanying notes are an integral part of these financial statements.
Annual Report 243
LAZARD INTERNATIONAL QUALITY GROWTH PORTFOLIO
Selected data for a share
of capital stock outstanding | | | Year Ended | | For the Period
12/31/18* | |
| throughout each period | | | 12/31/20 | | | 12/31/19 | | | to 12/31/18 | |
| Institutional Shares | | | | | | | | | | | | | | |
| Net asset value, beginning of period | | | $ | 12.69 | | | $ | 9.98 | | | $ | 10.00 | | |
| Income (Loss) from investment operations: | | | | | | | | | | | | | | |
| Net investment income (loss) (a) | | | | 0.03 | | | | 0.08 | | | | — | | |
| Net realized and unrealized gain (loss) | | | | 3.01 | | | | 2.95 | | | | (0.02 | ) | |
| Total from investment operations | | | | 3.04 | | | | 3.03 | | | | (0.02 | ) | |
| Less distributions from: | | | | | | | | | | | | | | |
| Net investment income | | | | (0.01 | ) | | | (0.27 | ) | | | — | | |
| Net realized gains | | | | (0.13 | ) | | | (0.05 | ) | | | — | | |
| Total distributions | | | | (0.14 | ) | | | (0.32 | ) | | | — | | |
| Net asset value, end of period | | | $ | 15.59 | | | $ | 12.69 | | | $ | 9.98 | | |
| Total Return (b) | | | | 23.95 | % | | | 30.32 | % | | | –0.20 | % | |
| | | | | | | | | | | | | | | |
| Ratios and Supplemental Data: | | | | | | | | | | | | | | |
| Net assets, end of period (in thousands) | | | $ | 10,473 | | | $ | 3,958 | | | $ | 149 | | |
| Ratios to average net assets (c): | | | | | | | | | | | | | | |
| Net expenses | | | | 0.85 | % | | | 0.85 | % | | | 0.00 | % | |
| Gross expenses | | | | 3.58 | % | | | 8.16 | % | | | 8.45 | % | |
| Net investment income (loss) | | | | 0.24 | % | | | 0.65 | % | | | 0.00 | % | |
| Portfolio turnover rate | | | | 12 | % | | | 20 | % | | | 0 | % | |
The accompanying notes are an integral part of these financial statements.
244 Annual Report
Selected data for a share
of capital stock outstanding | | | Year Ended | | For the Period
12/31/18* | |
| throughout each period | | | 12/31/20 | | | 12/31/19 | | | to 12/31/18 | |
| Open Shares | | | | | | | | | | | | | | |
| Net asset value, beginning of period | | | $ | 12.65 | | | $ | 10.00 | | | $ | 10.00 | | |
| Income (Loss) from investment operations: | | | | | | | | | | | | | | |
| Net investment income (loss) (a) | | | | (0.02 | ) | | | 0.07 | | | | — | | |
| Net realized and unrealized gain (loss) | | | | 3.01 | | | | 2.90 | | | | — | (d) | |
| Total from investment operations | | | | 2.99 | | | | 2.97 | | | | — | (d) | |
| Less distributions from: | | | | | | | | | | | | | | |
| Net investment income | | | | — | | | | (0.27 | ) | | | — | | |
| Net realized gains | | | | (0.13 | ) | | | (0.05 | ) | | | — | | |
| Total distributions | | | | (0.13 | ) | | | (0.32 | ) | | | — | | |
| Net asset value, end of period | | | $ | 15.51 | | | $ | 12.65 | | | $ | 10.00 | | |
| Total Return (b) | | | | 23.63 | % | | | 29.66 | % | | | 0.00 | % | |
| | | | | | | | | | | | | | | |
| Ratios and Supplemental Data: | | | | | | | | | | | | | | |
| Net assets, end of period (in thousands) | | | $ | 291 | | | $ | 10 | | | $ | 1 | | |
| Ratios to average net assets (c): | | | | | | | | | | | | | | |
| Net expenses | | | | 1.10 | % | | | 1.10 | % | | | 0.00 | % | |
| Gross expenses | | | | 9.57 | % | | | 142.50 | % | | | 0.40 | % | |
| Net investment income (loss) | | | | (0.15 | )% | | | 0.60 | % | | | 0.00 | % | |
| Portfolio turnover rate | | | | 12 | % | | | 20 | % | | | 0 | % | |
| * | The Portfolio commenced operations on December 31, 2018. |
| (a) | Net investment income (loss) has been computed using the average shares method. |
| (b) | Total returns reflect reinvestment of all dividends and distributions, if any. Certain expenses of the Portfolio may have been waived or reimbursed by the Investment Manager, State Street or DST; without such waiver/reimbursement of expenses, the Portfolio’s returns would have been lower. Returns for a period of less than one year are not annualized. |
| (c) | Annualized for a period of less than one year except for non-recurring expenses. |
| (d) | Amount is less than $0.01 per share. |
The accompanying notes are an integral part of these financial statements.
Annual Report 245
LAZARD INTERNATIONAL SMALL CAP EQUITY PORTFOLIO
Selected data for a share
of capital stock outstanding | | Year Ended | |
| throughout each period | | 12/31/20 | | | 12/31/19 | | | 12/31/18 | | | 12/31/17 | | | 12/31/16 | | |
| Institutional Shares | | | | | | | | | | | | | | | | | | | | | |
| Net asset value, beginning of period | | $ | 12.19 | | | $ | 9.95 | | | $ | 13.79 | | | $ | 10.10 | | | $ | 10.90 | | |
| Income (Loss) from investment operations: | | | | | | | | | | | | | | | | | | | | | |
| Net investment income (loss) (a) | | | 0.06 | | | | 0.13 | | | | 0.12 | | | | 0.10 | | | | 0.12 | ^ | |
| Net realized and unrealized gain (loss) | | | 1.53 | | | | 2.42 | | | | (3.51 | ) | | | 3.59 | | | | (0.62 | ) | |
| Total from investment operations | | | 1.59 | | | | 2.55 | | | | (3.39 | ) | | | 3.69 | | | | (0.50 | ) | |
| Less distributions from: | | | | | | | | | | | | | | | | | | | | | |
| Net investment income | | | (0.28 | ) | | | (0.05 | ) | | | (0.27 | ) | | | — | | | | (0.30 | ) | |
| Net realized gains | | | — | | | | (0.26 | ) | | | (0.18 | ) | | | — | | | | — | | |
| Total distributions | | | (0.28 | ) | | | (0.31 | ) | | | (0.45 | ) | | | — | | | | (0.30 | ) | |
| Redemption fees | | | — | | | | — | | | | — | | | | — | | | | — | | |
| Net asset value, end of period | | $ | 13.50 | | | $ | 12.19 | | | $ | 9.95 | | | $ | 13.79 | | | $ | 10.10 | | |
| Total Return (b) | | | 13.44 | % | | | 26.01 | % | | | –24.88 | %# | | | 36.53 | % | | | –4.64 | %^ | |
| | | | | | | | | | | | | | | | | | | | | | |
| Ratios and Supplemental Data: | | | | | | | | | | | | | | | | | | | | | |
| Net assets, end of period (in thousands) | | $ | 29,374 | | | $ | 37,677 | | | $ | 35,121 | | | $ | 41,267 | | | $ | 37,049 | | |
| Ratios to average net assets: | | | | | | | | | | | | | | | | | | | | | |
| Net expenses | | | 1.15 | % | | | 1.14 | % | | | 1.08 | % | | | 1.09 | % | | | 0.96 | %^ | |
| Gross expenses | | | 1.29 | % | | | 1.15 | % | | | 1.08 | % | | | 1.09 | % | | | 1.06 | % | |
| Net investment income (loss) | | | 0.57 | % | | | 1.14 | % | | | 0.96 | % | | | 0.85 | % | | | 1.14 | %^ | |
| Portfolio turnover rate | | | 50 | % | | | 37 | % | | | 59 | % | | | 35 | % | | | 63 | % | |
The accompanying notes are an integral part of these financial statements.
246 Annual Report
Selected data for a share
of capital stock outstanding | | Year Ended | |
| throughout each period | | 12/31/20 | | | 12/31/19 | | | 12/31/18 | | | 12/31/17 | | | 12/31/16 | | |
| Open Shares | | | | | | | | | | | | | | | | | | | | | |
| Net asset value, beginning of period | | $ | 12.19 | | | $ | 9.97 | | | $ | 13.82 | | | $ | 10.15 | | | $ | 10.93 | | |
| Income (Loss) from investment operations: | | | | | | | | | | | | | | | | | | | | | |
| Net investment income (loss) (a) | | | 0.04 | | | | 0.10 | | | | 0.11 | | | | 0.07 | | | | 0.10 | ^ | |
| Net realized and unrealized gain (loss) | | | 1.52 | | | | 2.43 | | | | (3.54 | ) | | | 3.60 | | | | (0.63 | ) | |
| Total from investment operations | | | 1.56 | | | | 2.53 | | | | (3.43 | ) | | | 3.67 | | | | (0.53 | ) | |
| Less distributions from: | | | | | | | | | | | | | | | | | | | | | |
| Net investment income | | | (0.25 | ) | | | (0.05 | ) | | | (0.24 | ) | | | — | | | | (0.25 | ) | |
| Net realized gains | | | — | | | | (0.26 | ) | | | (0.18 | ) | | | — | | | | — | | |
| Total distributions | | | (0.25 | ) | | | (0.31 | ) | | | (0.42 | ) | | | — | | | | (0.25 | ) | |
| Redemption fees | | | — | | | | — | | | | — | | | | — | | | | — | (c) | |
| Net asset value, end of period | | $ | 13.50 | | | $ | 12.19 | | | $ | 9.97 | | | $ | 13.82 | | | $ | 10.15 | | |
| Total Return (b) | | | 13.15 | % | | | 25.76 | % | | | –25.09 | %# | | | 36.16 | % | | | –4.92 | %^ | |
| | | | | | | | | | | | | | | | | | | | | | |
| Ratios and Supplemental Data: | | | | | | | | | | | | | | | | | | | | | |
| Net assets, end of period (in thousands) | | $ | 12,581 | | | $ | 19,780 | | | $ | 20,265 | | | $ | 42,362 | | | $ | 44,523 | | |
| Ratios to average net assets: | | | | | | | | | | | | | | | | | | | | | |
| Net expenses | | | 1.40 | % | | | 1.39 | % | | | 1.34 | % | | | 1.34 | % | | | 1.21 | %^ | |
| Gross expenses | | | 1.56 | % | | | 1.43 | % | | | 1.34 | % | | | 1.34 | % | | | 1.30 | % | |
| Net investment income (loss) | | | 0.33 | % | | | 0.86 | % | | | 0.83 | % | | | 0.61 | % | | | 0.91 | %^ | |
| Portfolio turnover rate | | | 50 | % | | | 37 | % | | | 59 | % | | | 35 | % | | | 63 | % | |
| ^ | Refer to Note 3 in the Notes to Financial Statements for discussion of prior period custodian out-of-pocket expenses that were reimbursed to the Portfolio in the period. The impact on the net investment income per share amount was $0.01 per share. There was a 0.10% and 0.09% impact on the total return of the Institutional and Open Shares classes, respectively, of the Portfolio. There was a 0.10% and 0.09% impact on the net expenses and net investment income (loss) ratios of the Portfolio’s Institutional and Open Shares, respectively. |
| # | The Portfolio received settlement proceeds from a foreign exchange trading classaction lawsuit. The proceeds from the settlement represented a realized gain and were recorded in the period received. There was a 0.46% and 0.53% impact on the total return of the Portfolio’s Institutional and Open Shares, respectively. |
| (a) | Net investment income (loss) has been computed using the average shares method. |
| (b) | Total returns reflect reinvestment of all dividends and distributions, if any. Certain expenses of the Portfolio may have been waived or reimbursed by the Investment Manager, State Street or DST; without such waiver/reimbursement of expenses, the Portfolio’s returns would have been lower. |
| (c) | Amount is less than $0.01 per share. |
The accompanying notes are an integral part of these financial statements.
Annual Report 247
LAZARD INTERNATIONAL STRATEGIC EQUITY PORTFOLIO
Selected data for a share
of capital stock outstanding | | Year Ended | |
| throughout each period | | 12/31/20 | | | 12/31/19 | | | 12/31/18 | | | 12/31/17 | | | 12/31/16 | | |
| Institutional Shares | | | | | | | | | | | | | | | | | | | | | |
| Net asset value, beginning of period | | $ | 15.38 | | | $ | 12.89 | | | $ | 15.70 | | | $ | 12.44 | | | $ | 13.33 | | |
| Income (Loss) from investment operations: | | | | | | | | | | | | | | | | | | | | | |
| Net investment income (loss) (a) | | | 0.17 | | | | 0.24 | | | | 0.21 | | | | 0.17 | | | | 0.20 | ^ | |
| Net realized and unrealized gain (loss) | | | 1.45 | | | | 2.53 | | | | (1.85 | ) | | | 3.29 | | | | (0.89 | ) | |
| Total from investment operations | | | 1.62 | | | | 2.77 | | | | (1.64 | ) | | | 3.46 | | | | (0.69 | ) | |
| Less distributions from: | | | | | | | | | | | | | | | | | | | | | |
| Net investment income | | | (0.17 | ) | | | (0.28 | ) | | | (0.21 | ) | | | (0.20 | ) | | | (0.20 | ) | |
| Net realized gains | | | — | | | | — | | | | (0.96 | ) | | | — | | | | — | | |
| Total distributions | | | (0.17 | ) | | | (0.28 | ) | | | (1.17 | ) | | | (0.20 | ) | | | (0.20 | ) | |
| Redemption fees | | | — | | | | — | | | | — | | | | — | | | | — | (b) | |
| Net asset value, end of period | | $ | 16.83 | | | $ | 15.38 | | | $ | 12.89 | | | $ | 15.70 | | | $ | 12.44 | | |
| Total Return (c) | | | 10.58 | % | | | 21.55 | % | | | –10.35 | % | | | 27.85 | % | | | –5.17 | %^ | |
| | | | | | | | | | | | | | | | | | | | | | |
| Ratios and Supplemental Data: | | | | | | | | | | | | | | | | | | | | | |
| Net assets, end of period (in thousands) | | $ | 5,270,611 | | | $ | 5,505,271 | | | $ | 4,630,334 | | | $ | 5,911,184 | | | $ | 5,114,357 | | |
| Ratios to average net assets: | | | | | | | | | | | | | | | | | | | | | |
| Net expenses | | | 0.81 | % | | | 0.80 | % | | | 0.80 | % | | | 0.80 | % | | | 0.81 | %^ | |
| Gross expenses | | | 0.81 | % | | | 0.80 | % | | | 0.80 | % | | | 0.80 | % | | | 0.81 | % | |
| Net investment income (loss) | | | 1.18 | % | | | 1.66 | % | | | 1.36 | % | | | 1.20 | % | | | 1.56 | %^ | |
| Portfolio turnover rate | | | 37 | % | | | 36 | % | | | 40 | % | | | 44 | % | | | 47 | % | |
The accompanying notes are an integral part of these financial statements.
248 Annual Report
Selected data for a share
of capital stock outstanding | | Year Ended | |
| throughout each period | | 12/31/20 | | | 12/31/19 | | | 12/31/18 | | | 12/31/17 | | | 12/31/16 | | |
| Open Shares | | | | | | | | | | | | | | | | | | | | | |
| Net asset value, beginning of period | | $ | 15.52 | | | $ | 13.01 | | | $ | 15.83 | | | $ | 12.55 | | | $ | 13.44 | | |
| Income (Loss) from investment operations: | | | | | | | | | | | | | | | | | | | | | |
| Net investment income (loss) (a) | | | 0.14 | | | | 0.21 | | | | 0.17 | | | | 0.14 | | | | 0.18 | ^ | |
| Net realized and unrealized gain (loss) | | | 1.46 | | | | 2.55 | | | | (1.86 | ) | | | 3.30 | | | | (0.90 | ) | |
| Total from investment operations | | | 1.60 | | | | 2.76 | | | | (1.69 | ) | | | 3.44 | | | | (0.72 | ) | |
| Less distributions from: | | | | | | | | | | | | | | | | | | | | | |
| Net investment income | | | (0.13 | ) | | | (0.25 | ) | | | (0.17 | ) | | | (0.16 | ) | | | (0.17 | ) | |
| Net realized gains | | | — | | | | — | | | | (0.96 | ) | | | — | | | | — | | |
| Total distributions | | | (0.13 | ) | | | (0.25 | ) | | | (1.13 | ) | | | (0.16 | ) | | | (0.17 | ) | |
| Redemption fees | | | — | | | | — | | | | — | | | | — | | | | — | (b) | |
| Net asset value, end of period | | $ | 16.99 | | | $ | 15.52 | | | $ | 13.01 | | | $ | 15.83 | | | $ | 12.55 | | |
| Total Return (c) | | | 10.34 | % | | | 21.21 | % | | | –10.55 | % | | | 27.44 | % | | | –5.37 | %^ | |
| | | | | | | | | | | | | | | | | | | | | | |
| Ratios and Supplemental Data: | | | | | | | | | | | | | | | | | | | | | |
| Net assets, end of period (in thousands) | | $ | 535,285 | | | $ | 682,035 | | | $ | 832,548 | | | $ | 1,216,861 | | | $ | 1,591,016 | | |
| Ratios to average net assets: | | | | | | | | | | | | | | | | | | | | | |
| Net expenses | | | 1.06 | % | | | 1.06 | % | | | 1.05 | % | | | 1.06 | % | | | 1.06 | %^ | |
| Gross expenses | | | 1.06 | % | | | 1.06 | % | | | 1.05 | % | | | 1.06 | % | | | 1.06 | % | |
| Net investment income (loss) | | | 0.94 | % | | | 1.47 | % | | | 1.10 | % | | | 0.97 | % | | | 1.34 | %^ | |
| Portfolio turnover rate | | | 37 | % | | | 36 | % | | | 40 | % | | | 44 | % | | | 47 | % | |
The accompanying notes are an integral part of these financial statements.
Annual Report 249
Selected data for a share
of capital stock outstanding | | Year Ended | |
| throughout the period | | 12/31/20 | | | 12/31/19 | | | 12/31/18 | | | 12/31/17 | | | 12/31/16 | | |
| R6 Shares | | | | | | | | | | | | | | | | | | | | | |
| Net asset value, beginning of period | | $ | 15.39 | | | $ | 12.90 | | | $ | 15.71 | | | $ | 12.45 | | | $ | 13.34 | | |
| Income (Loss) from investment operations: | | | | | | | | | | | | | | | | | | | | | |
| Net investment income (loss) (a) | | | 0.17 | | | | 0.23 | | | | 0.21 | | | | 0.16 | | | | 0.19 | ^ | |
| Net realized and unrealized gain (loss) | | | 1.46 | | | | 2.54 | | | | (1.85 | ) | | | 3.30 | | | | (0.88 | ) | |
| Total from investment operations | | | 1.63 | | | | 2.77 | | | | (1.64 | ) | | | 3.46 | | | | (0.69 | ) | |
| Less distributions from: | | | | | | | | | | | | | | | | | | | | | |
| Net investment income | | | (0.17 | ) | | | (0.28 | ) | | | (0.21 | ) | | | (0.20 | ) | | | (0.20 | ) | |
| Net realized gains | | | — | | | | — | | | | (0.96 | ) | | | — | | | | — | | |
| Total distributions | | | (0.17 | ) | | | (0.28 | ) | | | (1.17 | ) | | | (0.20 | ) | | | (0.20 | ) | |
| Redemption fees | | | — | | | | — | | | | — | | | | — | | | | — | (b) | |
| Net asset value, end of period | | $ | 16.85 | | | $ | 15.39 | | | $ | 12.90 | | | $ | 15.71 | | | $ | 12.45 | | |
| Total Return (c) | | | 10.64 | % | | | 21.54 | % | | | –10.35 | % | | | 27.82 | % | | | –5.17 | %^ | |
| | | | | | | | | | | | | | | | | | | | | | |
| Ratios and Supplemental Data: | | | | | | | | | | | | | | | | | | | | | |
| Net assets, end of period (in thousands) | | $ | 118,678 | | | $ | 120,118 | | | $ | 97,394 | | | $ | 110,383 | | | $ | 96,284 | | |
| Ratios to average net assets: | | | | | | | | | | | | | | | | | | | | | |
| Net expenses | | | 0.81 | % | | | 0.80 | % | | | 0.80 | % | | | 0.80 | % | | | 0.81 | %^ | |
| Gross expenses | | | 0.82 | % | | | 0.81 | % | | | 0.81 | % | | | 0.82 | % | | | 0.82 | % | |
| Net investment income (loss) | | | 1.16 | % | | | 1.61 | % | | | 1.34 | % | | | 1.15 | % | | | 1.46 | %^ | |
| Portfolio turnover rate | | | 37 | % | | | 36 | % | | | 40 | % | | | 44 | % | | | 47 | % | |
| ^ | Refer to Note 3 in the Notes to Financial Statements for discussion of prior period custodian out-of-pocket expenses that were reimbursed to the Portfolio in the period. The amount of the reimbursement was less than $0.005 per share. There was no impact on the total return of the Portfolio. The impact on net expenses and net investment income (loss) ratios of the Portfolio was less than 0.005%. |
| (a) | Net investment income (loss) has been computed using the average shares method. |
| (b) | Amount is less than $0.01 per share. |
| (c) | Total returns reflect reinvestment of all dividends and distributions, if any. Certain expenses of the Portfolio may have been waived or reimbursed by the Investment Manager, State Street or DST; without such waiver/reimbursement of expenses, the Portfolio’s returns would have been lower. |
The accompanying notes are an integral part of these financial statements.
250 Annual Report
LAZARD MANAGED EQUITY VOLATILITY PORTFOLIO
Selected data for a share
of capital stock outstanding | | Year Ended | |
| throughout each period | | 12/31/20 | | | 12/31/19 | | | 12/31/18 | | | 12/31/17 | | | 12/31/16 | | |
| Institutional Shares | | | | | | | | | | | | | | | | | | | | | |
| Net asset value, beginning of period | | $ | 12.66 | | | $ | 10.55 | | | $ | 11.57 | | | $ | 9.99 | | | $ | 9.59 | | |
| Income (Loss) from investment operations: | | | | | | | | | | | | | | | | | | | | | |
| Net investment income (loss) (a) | | | 0.21 | | | | 0.21 | | | | 0.19 | | | | 0.19 | | | | 0.18 | | |
| Net realized and unrealized gain (loss) | | | (0.87 | ) | | | 2.08 | | | | (1.03 | ) | | | 1.87 | | | | 0.44 | | |
| Total from investment operations | | | (0.66 | ) | | | 2.29 | | | | (0.84 | ) | | | 2.06 | | | | 0.62 | | |
| Less distributions from: | | | | | | | | | | | | | | | | | | | | | |
| Net investment income | | | (0.09 | ) | | | (0.18 | ) | | | (0.16 | ) | | | (0.17 | ) | | | (0.22 | ) | |
| Net realized gains | | | (0.13 | ) | | | — | (b) | | | (0.02 | ) | | | (0.31 | ) | | | — | | |
| Total distributions | | | (0.22 | ) | | | (0.18 | ) | | | (0.18 | ) | | | (0.48 | ) | | | (0.22 | ) | |
| Net asset value, end of period | | $ | 11.78 | | | $ | 12.66 | | | $ | 10.55 | | | $ | 11.57 | | | $ | 9.99 | | |
| Total Return (c) | | | –5.18 | % | | | 21.69 | % | | | –7.21 | % | | | 20.57 | % | | | 6.45 | % | |
| |
| Ratios and Supplemental Data: | | | | | | | | | | | | | | | | | | | | | |
| Net assets, end of period (in thousands) | | $ | 25,737 | | | $ | 34,354 | | | $ | 20,709 | | | $ | 4,180 | | | $ | 2,431 | | |
| Ratios to average net assets: | | | | | | | | | | | | | | | | | | | | | |
| Net expenses | | | 0.75 | % | | | 0.75 | % | | | 0.75 | % | | | 0.75 | % | | | 0.75 | % | |
| Gross expenses | | | 1.23 | % | | | 1.36 | % | | | 1.64 | % | | | 6.51 | % | | | 10.42 | % | |
| Net investment income (loss) | | | 1.83 | % | | | 1.72 | % | | | 1.66 | % | | | 1.71 | % | | | 1.82 | % | |
| Portfolio turnover rate | | | 138 | % | | | 103 | % | | | 122 | % | | | 87 | % | | | 91 | % | |
The accompanying notes are an integral part of these financial statements.
Annual Report 251
Selected data for a share
of capital stock outstanding | | Year Ended | |
| throughout each period | | 12/31/20 | | | 12/31/19 | | | 12/31/18 | | | 12/31/17 | | | 12/31/16 | | |
| Open Shares | | | | | | | | | | | | | | | | | | | | | |
| Net asset value, beginning of period | | $ | 12.65 | | | $ | 10.54 | | | $ | 11.56 | | | $ | 9.99 | | | $ | 9.59 | | |
| Income (Loss) from investment operations: | | | | | | | | | | | | | | | | | | | | | |
| Net investment income (loss) (a) | | | 0.19 | | | | 0.17 | | | | 0.15 | | | | 0.16 | | | | 0.15 | | |
| Net realized and unrealized gain (loss) | | | (0.87 | ) | | | 2.08 | | | | (1.02 | ) | | | 1.85 | | | | 0.44 | | |
| Total from investment operations | | | (0.68 | ) | | | 2.25 | | | | (0.87 | ) | | | 2.01 | | | | 0.59 | | |
| Less distributions from: | | | | | | | | | | | | | | | | | | | | | |
| Net investment income | | | (0.06 | ) | | | (0.14 | ) | | | (0.13 | ) | | | (0.13 | ) | | | (0.19 | ) | |
| Net realized gains | | | (0.13 | ) | | | — | (b) | | | (0.02 | ) | | | (0.31 | ) | | | — | | |
| Total distributions | | | (0.19 | ) | | | (0.14 | ) | | | (0.15 | ) | | | (0.44 | ) | | | (0.19 | ) | |
| Net asset value, end of period | | $ | 11.78 | | | $ | 12.65 | | | $ | 10.54 | | | $ | 11.56 | | | $ | 9.99 | | |
| Total Return (c) | | | –5.34 | % | | | 21.36 | % | | | –7.50 | % | | | 20.11 | % | | | 6.14 | % | |
| |
| Ratios and Supplemental Data: | | | | | | | | | | | | | | | | | | | | | |
| Net assets, end of period (in thousands) | | $ | 76 | | | $ | 231 | | | $ | 183 | | | $ | 315 | | | $ | 172 | | |
| Ratios to average net assets: | | | | | | | | | | | | | | | | | | | | | |
| Net expenses | | | 1.00 | % | | | 1.03 | % | | | 1.05 | % | | | 1.05 | % | | | 1.05 | % | |
| Gross expenses | | | 4.39 | % | | | 5.81 | % | | | 5.86 | % | | | 12.07 | % | | | 17.27 | % | |
| Net investment income (loss) | | | 1.63 | % | | | 1.46 | % | | | 1.28 | % | | | 1.42 | % | | | 1.52 | % | |
| Portfolio turnover rate | | | 138 | % | | | 103 | % | | | 122 | % | | | 87 | % | | | 91 | % | |
| (a) | Net investment income (loss) has been computed using the average shares method. |
| (b) | Amount is less than $0.01 per share. |
| (c) | Total returns reflect reinvestment of all dividends and distributions, if any. Certain expenses of the Portfolio may have been waived or reimbursed by the Investment Manager, State Street or DST; without such waiver/reimbursement of expenses, the Portfolio’s returns would have been lower. |
The accompanying notes are an integral part of these financial statements.
252 Annual Report
LAZARD US EQUITY CONCENTRATED PORTFOLIO
Selected data for a share
of capital stock outstanding | | Year Ended | |
| throughout each period | | 12/31/20 | | | 12/31/19 | | | 12/31/18 | | | 12/31/17 | | | 12/31/16 | | |
| Institutional Shares | | | | | | | | | | | | | | | | | | | | | |
| Net asset value, beginning of period | | $ | 16.84 | | | $ | 12.89 | | | $ | 15.31 | | | $ | 14.16 | | | $ | 13.83 | | |
| Income (Loss) from investment operations: | | | | | | | | | | | | | | | | | | | | | |
| Net investment income (loss) (a) | | | 0.12 | | | | 0.13 | | | | 0.18 | | | | 0.14 | | | | 0.06 | ^ | |
| Net realized and unrealized gain (loss) | | | 1.39 | | | | 3.96 | | | | (1.11 | ) | | | 2.05 | | | | 0.97 | | |
| Total from investment operations | | | 1.51 | | | | 4.09 | | | | (0.93 | ) | | | 2.19 | | | | 1.03 | | |
| Less distributions from: | | | | | | | | | | | | | | | | | | | | | |
| Net investment income | | | (0.11 | ) | | | (0.14 | ) | | | (0.20 | ) | | | (0.14 | ) | | | (0.05 | ) | |
| Net realized gains | | | (0.19 | ) | | | — | | | | (1.29 | ) | | | (0.90 | ) | | | (0.65 | ) | |
| Total distributions | | | (0.30 | ) | | | (0.14 | ) | | | (1.49 | ) | | | (1.04 | ) | | | (0.70 | ) | |
| Redemption fees | | | — | | | | — | | | | — | | | | — | | | | — | (b) | |
| Net asset value, end of period | | $ | 18.05 | | | $ | 16.84 | | | $ | 12.89 | | | $ | 15.31 | | | $ | 14.16 | | |
| Total Return (c) | | | 8.98 | % | | | 31.72 | % | | | –6.07 | % | | | 15.49 | % | | | 7.37 | %^ | |
| | | | | | | | | | | | | | | | | | | | | | |
| Ratios and Supplemental Data: | | | | | | | | | | | | | | | | | | | | | |
| Net assets, end of period (in thousands) | | $ | 1,936,367 | | | $ | 1,271,509 | | | $ | 1,040,851 | | | $ | 1,508,581 | | | $ | 1,230,377 | | |
| Ratios to average net assets: | | | | | | | | | | | | | | | | | | | | | |
| Net expenses | | | 0.76 | % | | | 0.76 | % | | | 0.75 | % | | | 0.75 | % | | | 0.77 | %^ | |
| Gross expenses | | | 0.76 | % | | | 0.76 | % | | | 0.75 | % | | | 0.75 | % | | | 0.77 | % | |
| Net investment income (loss) | | | 0.72 | % | | | 0.85 | % | | | 1.14 | % | | | 0.90 | % | | | 0.39 | %^ | |
| Portfolio turnover rate | | | 43 | % | | | 33 | % | | | 69 | % | | | 86 | % | | | 84 | % | |
The accompanying notes are an integral part of these financial statements.
Annual Report 253
Selected data for a share
of capital stock outstanding | | Year Ended | |
| throughout each period | | 12/31/20 | | | 12/31/19 | | | 12/31/18 | | | 12/31/17 | | | 12/31/16 | | |
| Open Shares | | | | | | | | | | | | | | | | | | | | | |
| Net asset value, beginning of period | | $ | 16.98 | | | $ | 12.99 | | | $ | 15.42 | | | $ | 14.25 | | | $ | 13.92 | | |
| Income (Loss) from investment operations: | | | | | | | | | | | | | | | | | | | | | |
| Net investment income (loss) (a) | | | 0.08 | | | | 0.09 | | | | 0.13 | | | | 0.10 | | | | 0.02 | ^ | |
| Net realized and unrealized gain (loss) | | | 1.38 | | | | 3.99 | | | | (1.11 | ) | | | 2.07 | | | | 0.97 | | |
| Total from investment operations | | | 1.46 | | | | 4.08 | | | | (0.98 | ) | | | 2.17 | | | | 0.99 | | |
| Less distributions from: | | | | | | | | | | | | | | | | | | | | | |
| Net investment income | | | (0.06 | ) | | | (0.09 | ) | | | (0.16 | ) | | | (0.10 | ) | | | (0.01 | ) | |
| Net realized gains | | | (0.19 | ) | | | — | | | | (1.29 | ) | | | (0.90 | ) | | | (0.65 | ) | |
| Total distributions | | | (0.25 | ) | | | (0.09 | ) | | | (1.45 | ) | | | (1.00 | ) | | | (0.66 | ) | |
| Redemption fees | | | — | | | | — | | | | — | | | | — | | | | — | (b) | |
| Net asset value, end of period | | $ | 18.19 | | | $ | 16.98 | | | $ | 12.99 | | | $ | 15.42 | | | $ | 14.25 | | |
| Total Return (c) | | | 8.63 | % | | | 31.42 | % | | | –6.35 | % | | | 15.22 | % | | | 7.06 | %^ | |
| |
| Ratios and Supplemental Data: | | | | | | | | | | | | | | | | | | | | | |
| Net assets, end of period (in thousands) | | $ | 34,358 | | | $ | 46,840 | | | $ | 50,981 | | | $ | 87,603 | | | $ | 105,619 | | |
| Ratios to average net assets: | | | | | | | | | | | | | | | | | | | | | |
| Net expenses | | | 1.02 | % | | | 1.04 | % | | | 1.03 | % | | | 1.03 | % | | | 1.03 | %^ | |
| Gross expenses | | | 1.02 | % | | | 1.04 | % | | | 1.03 | % | | | 1.03 | % | | | 1.03 | % | |
| Net investment income (loss) | | | 0.47 | % | | | 0.55 | % | | | 0.85 | % | | | 0.62 | % | | | 0.17 | %^ | |
| Portfolio turnover rate | | | 43 | % | | | 33 | % | | | 69 | % | | | 86 | % | | | 84 | % | |
The accompanying notes are an integral part of these financial statements.
254 Annual Report
Selected data for a share
of capital stock outstanding | | Year Ended | | For the Period
11/15/16* |
| throughout each period | | 12/31/20 | | | 12/31/19 | | | 12/31/18 | | | 12/31/17 | | | to 12/31/16 |
| R6 Shares | | | | | | | | | | | | | | | | | | | | |
| Net asset value, beginning of period | | $ | 16.89 | | | $ | 12.92 | | | $ | 15.34 | | | $ | 14.18 | | | $ | 14.77 | |
| Income (Loss) from investment operations: | | | | | | | | | | | | | | | | | | | | |
| Net investment income (loss) (a) | | | 0.12 | | | | 0.13 | | | | 0.17 | | | | 0.14 | | | | — | ^(b) |
| Net realized and unrealized gain (loss) | | | 1.38 | | | | 3.98 | | | | (1.10 | ) | | | 2.06 | | | | 0.03 | |
| Total from investment operations | | | 1.50 | | | | 4.11 | | | | (0.93 | ) | | | 2.20 | | | | 0.03 | |
| Less distributions from: | | | | | | | | | | | | | | | | | | | | |
| Net investment income | | | (0.11 | ) | | | (0.14 | ) | | | (0.20 | ) | | | (0.14 | ) | | | (0.03 | ) |
| Net realized gains | | | (0.19 | ) | | | — | | | | (1.29 | ) | | | (0.90 | ) | | | (0.59 | ) |
| Total distributions | | | (0.30 | ) | | | (0.14 | ) | | | (1.49 | ) | | | (1.04 | ) | | | (0.62 | ) |
| Net asset value, end of period | | $ | 18.09 | | | $ | 16.89 | | | $ | 12.92 | | | $ | 15.34 | | | $ | 14.18 | |
| Total Return (c) | | | 8.90 | % | | | 31.79 | % | | | –6.08 | % | | | 15.52 | % | | | 0.17 | %^ |
| |
| Ratios and Supplemental Data: | | | | | | | | | | | | | | | | | | | | |
| Net assets, end of period (in thousands) | | $ | 2,177 | | | $ | 2,091 | | | $ | 1,900 | | | $ | 361 | | | $ | 140 | |
| Ratios to average net assets (d): | | | | | | | | | | | | | | | | | | | | |
| Net expenses | | | 0.76 | % | | | 0.76 | % | | | 0.75 | % | | | 0.75 | % | | | 0.77 | %^ |
| Gross expenses | | | 0.92 | % | | | 1.20 | % | | | 2.16 | % | | | 8.34 | % | | | 15.38 | % |
| Net investment income (loss) | | | 0.73 | % | | | 0.83 | % | | | 1.15 | % | | | 0.91 | % | | | 0.19 | %^ |
| Portfolio turnover rate | | | 43 | % | | | 33 | % | | | 69 | % | | | 86 | % | | | 84 | % |
| * | The inception date for the R6 Shares was November 15, 2016. |
| ^ | Refer to Note 3 in the Notes to Financial Statements for discussion of prior period custodian out-of-pocket expenses that were reimbursed to the Portfolio in the period. The amount of the reimbursement was less than $0.005 per share. There was no impact on the total return of the Portfolio. The impact on net expenses and net investment income (loss) ratios of the Portfolio was less than 0.005%. |
| (a) | Net investment income (loss) has been computed using the average shares method. |
| (b) | Amount is less than $0.01 per share. |
| (c) | Total returns reflect reinvestment of all dividends and distributions, if any. Certain expenses of the Portfolio may have been waived or reimbursed by the Investment Manager, State Street or DST; without such waiver/reimbursement of expenses, the Portfolio’s returns would have been lower. Returns for a period of less than one year are not annualized. |
| (d) | Annualized for a period of less than one year except for non-recurring expenses. |
The accompanying notes are an integral part of these financial statements.
Annual Report 255
LAZARD US EQUITY FOCUS PORTFOLIO
Selected data for a share
of capital stock outstanding | | Year Ended | |
| throughout each period | | 12/31/20 | | | 12/31/19 | | | 12/31/18 | | | 12/31/17 | | | 12/31/16 | | |
| Institutional Shares | | | | | | | | | | | | | | | | | | | | | |
| Net asset value, beginning of period | | $ | 12.03 | | | $ | 10.23 | | | $ | 12.43 | | | $ | 11.63 | | | $ | 10.97 | | |
| Income (Loss) from investment operations: | | | | | | | | | | | | | | | | | | | | | |
| Net investment income (loss) (a) | | | 0.11 | | | | 0.13 | | | | 0.14 | | | | 0.14 | | | | 0.12 | | |
| Net realized and unrealized gain (loss) | | | 1.94 | | | | 3.11 | | | | (0.55 | ) | | | 1.94 | | | | 0.94 | | |
| Total from investment operations | | | 2.05 | | | | 3.24 | | | | (0.41 | ) | | | 2.08 | | | | 1.06 | | |
| Less distributions from: | | | | | | | | | | | | | | | | | | | | | |
| Net investment income | | | (0.10 | ) | | | (0.23 | ) | | | (0.29 | ) | | | (0.21 | ) | | | (0.10 | ) | |
| Net realized gains | | | (0.61 | ) | | | (1.21 | ) | | | (1.50 | ) | | | (1.07 | ) | | | (0.30 | ) | |
| Total distributions | | | (0.71 | ) | | | (1.44 | ) | | | (1.79 | ) | | | (1.28 | ) | | | (0.40 | ) | |
| Redemption fees | | | — | | | | — | | | | — | | | | — | | | | — | (b) | |
| Net asset value, end of period | | $ | 13.37 | | | $ | 12.03 | | | $ | 10.23 | | | $ | 12.43 | | | $ | 11.63 | | |
| Total Return (c) | | | 17.29 | % | | | 31.67 | % | | | –3.12 | % | | | 18.17 | % | | | 9.70 | % | |
| |
| Ratios and Supplemental Data: | | | | | | | | | | | | | | | | | | | | | |
| Net assets, end of period (in thousands) | | $ | 31,075 | | | $ | 32,661 | | | $ | 60,629 | | | $ | 72,958 | | | $ | 72,151 | | |
| Ratios to average net assets: | | | | | | | | | | | | | | | | | | | | | |
| Net expenses | | | 0.70 | % | | | 0.75 | % | | | 0.75 | % | | | 0.75 | % | | | 0.75 | % | |
| Gross expenses | | | 1.26 | % | | | 0.92 | % | | | 0.92 | % | | | 0.95 | % | | | 0.94 | % | |
| Net investment income (loss) | | | 0.91 | % | | | 1.07 | % | | | 1.10 | % | | | 1.10 | % | | | 1.08 | % | |
| Portfolio turnover rate | | | 54 | % | | | 45 | % | | | 62 | % | | | 74 | % | | | 68 | % | |
The accompanying notes are an integral part of these financial statements.
256 Annual Report
Selected data for a share
of capital stock outstanding | | Year Ended | | |
| throughout each period | | 12/31/20 | | | 12/31/19 | | | 12/31/18 | | | 12/31/17 | | | 12/31/16 | | |
| Open Shares | | | | | | | | | | | | | | | | | | | | | |
| Net asset value, beginning of period | | $ | 12.09 | | | $ | 10.28 | | | $ | 12.48 | | | $ | 11.68 | | | $ | 11.01 | | |
| Income (Loss) from investment operations: | | | | | | | | | | | | | | | | | | | | | |
| Net investment income (loss) (a) | | | 0.08 | | | | 0.10 | | | | 0.10 | | | | 0.10 | | | | 0.09 | | |
| Net realized and unrealized gain (loss) | | | 1.96 | | | | 3.11 | | | | (0.54 | ) | | | 1.94 | | | | 0.94 | | |
| Total from investment operations | | | 2.04 | | | | 3.21 | | | | (0.44 | ) | | | 2.04 | | | | 1.03 | | |
| Less distributions from: | | | | | | | | | | | | | | | | | | | | | |
| Net investment income | | | (0.07 | ) | | | (0.19 | ) | | | (0.26 | ) | | | (0.17 | ) | | | (0.06 | ) | |
| Net realized gains | | | (0.61 | ) | | | (1.21 | ) | | | (1.50 | ) | | | (1.07 | ) | | | (0.30 | ) | |
| Total distributions | | | (0.68 | ) | | | (1.40 | ) | | | (1.76 | ) | | | (1.24 | ) | | | (0.36 | ) | |
| Net asset value, end of period | | $ | 13.45 | | | $ | 12.09 | | | $ | 10.28 | | | $ | 12.48 | | | $ | 11.68 | | |
| Total Return (c) | | | 17.08 | % | | | 31.25 | % | | | –3.40 | % | | | 17.75 | % | | | 9.46 | % | |
| |
| Ratios and Supplemental Data: | | | | | | | | | | | | | | | | | | | | | |
| Net assets, end of period (in thousands) | | $ | 1,285 | | | $ | 1,117 | | | $ | 881 | | | $ | 1,013 | | | $ | 1,376 | | |
| Ratios to average net assets: | | | | | | | | | | | | | | | | | | | | | |
| Net expenses | | | 0.95 | % | | | 1.03 | % | | | 1.05 | % | | | 1.05 | % | | | 1.05 | % | |
| Gross expenses | | | 1.79 | % | | | 2.14 | % | | | 2.33 | % | | | 2.30 | % | | | 2.13 | % | |
| Net investment income (loss) | | | 0.67 | % | | | 0.79 | % | | | 0.80 | % | | | 0.79 | % | | | 0.80 | % | |
| Portfolio turnover rate | | | 54 | % | | | 45 | % | | | 62 | % | | | 74 | % | | | 68 | % | |
The accompanying notes are an integral part of these financial statements.
Annual Report 257
Selected data for a share
of capital stock outstanding | | Year Ended | | |
| throughout each period | | 12/31/20 | | | 12/31/19 | | | 12/31/18 | | | 12/31/17 | | | 12/31/16 | | |
| R6 Shares | | | | | | | | | | | | | | | | | | | | | |
| Net asset value, beginning of period | | $ | 12.04 | | | $ | 10.23 | | | $ | 12.43 | | | $ | 11.63 | | | $ | 10.96 | | |
| Income (Loss) from investment operations: | | | | | | | | | | | | | | | | | | | | | |
| Net investment income (loss) (a) | | | 0.11 | | | | 0.13 | | | | 0.14 | | | | 0.14 | | | | 0.14 | | |
| Net realized and unrealized gain (loss) | | | 1.94 | | | | 3.12 | | | | (0.55 | ) | | | 1.94 | | | | 0.93 | | |
| Total from investment operations | | | 2.05 | | | | 3.25 | | | | (0.41 | ) | | | 2.08 | | | | 1.07 | | |
| Less distributions from: | | | | | | | | | | | | | | | | | | | | | |
| Net investment income | | | (0.10 | ) | | | (0.23 | ) | | | (0.29 | ) | | | (0.21 | ) | | | (0.10 | ) | |
| Net realized gains | | | (0.61 | ) | | | (1.21 | ) | | | (1.50 | ) | | | (1.07 | ) | | | (0.30 | ) | |
| Total distributions | | | (0.71 | ) | | | (1.44 | ) | | | (1.79 | ) | | | (1.28 | ) | | | (0.40 | ) | |
| Redemption fees | | | — | | | | — | | | | — | | | | — | | | | — | (b) | |
| Net asset value, end of period | | $ | 13.38 | | | $ | 12.04 | | | $ | 10.23 | | | $ | 12.43 | | | $ | 11.63 | | |
| Total Return (c) | | | 17.28 | % | | | 31.76 | % | | | –3.13 | % | | | 18.16 | % | | | 9.81 | % | |
| |
| Ratios and Supplemental Data: | | | | | | | | | | | | | | | | | | | | | |
| Net assets, end of period (in thousands) | | $ | 20,747 | | | $ | 10,609 | | | $ | 10,056 | | | $ | 11,394 | | | $ | 13,297 | | |
| Ratios to average net assets: | | | | | | | | | | | | | | | | | | | | | |
| Net expenses | | | 0.70 | % | | | 0.74 | % | | | 0.75 | % | | | 0.75 | % | | | 0.74 | % | |
| Gross expenses | | | 1.27 | % | | | 1.00 | % | | | 1.01 | % | | | 1.05 | % | | | 1.02 | % | |
| Net investment income (loss) | | | 0.91 | % | | | 1.09 | % | | | 1.10 | % | | | 1.12 | % | | | 1.27 | % | |
| Portfolio turnover rate | | | 54 | % | | | 45 | % | | | 62 | % | | | 74 | % | | | 68 | % | |
| (a) | Net investment income (loss) has been computed using the average shares method. |
| (b) | Amount is less than $0.01 per share. |
| (c) | Total returns reflect reinvestment of all dividends and distributions, if any. Certain expenses of the Portfolio may have been waived or reimbursed by the Investment Manager, State Street or DST; without such waiver/reimbursement of expenses, the Portfolio’s returns would have been lower. |
The accompanying notes are an integral part of these financial statements.
258 Annual Report
LAZARD US SMALL-MID CAP EQUITY PORTFOLIO
Selected data for a share
of capital stock outstanding | | Year Ended | |
| throughout each period | | 12/31/20 | | | 12/31/19 | | | 12/31/18 | | | 12/31/17 | | | 12/31/16 | | |
| Institutional Shares | | | | | | | | | | | | | | | | | | | | | |
| Net asset value, beginning of period | | $ | 13.64 | | | $ | 10.83 | | | $ | 14.65 | | | $ | 14.50 | | | $ | 12.86 | | |
| Income (Loss) from investment operations: | | | | | | | | | | | | | | | | | | | | | |
| Net investment income (loss) (a) | | | 0.04 | | | | 0.06 | | | | 0.05 | | | | 0.06 | | | | 0.11 | ^ | |
| Net realized and unrealized gain (loss) | | | 0.82 | | | | 3.19 | | | | (2.00 | ) | | | 1.95 | | | | 1.96 | | |
| Total from investment operations | | | 0.86 | | | | 3.25 | | | | (1.95 | ) | | | 2.01 | | | | 2.07 | | |
| Less distributions from: | | | | | | | | | | | | | | | | | | | | | |
| Net investment income | | | (0.02 | ) | | | (0.03 | ) | | | (0.04 | ) | | | (0.09 | ) | | | (0.09 | ) | |
| Net realized gains | | | (0.06 | ) | | | (0.41 | ) | | | (1.83 | ) | | | (1.77 | ) | | | (0.34 | ) | |
| Total distributions | | | (0.08 | ) | | | (0.44 | ) | | | (1.87 | ) | | | (1.86 | ) | | | (0.43 | ) | |
| Redemption fees | | | — | | | | — | | | | — | | | | — | | | | — | (b) | |
| Net asset value, end of period | | $ | 14.42 | | | $ | 13.64 | | | $ | 10.83 | | | $ | 14.65 | | | $ | 14.50 | | |
| Total Return (c) | | | 6.44 | % | | | 30.00 | % | | | –13.27 | % | | | 14.12 | % | | | 16.28 | %^ | |
| | | | | | | | | | | | | | | | | | | | | | |
| Ratios and Supplemental Data: | | | | | | | | | | | | | | | | | | | | | |
| Net assets, end of period (in thousands) | | $ | 91,984 | | | $ | 108,112 | | | $ | 113,677 | | | $ | 176,975 | | | $ | 189,593 | | |
| Ratios to average net assets: | | | | | | | | | | | | | | | | | | | | | |
| Net expenses | | | 0.98 | % | | | 0.92 | % | | | 0.87 | % | | | 0.87 | % | | | 0.86 | %^ | |
| Gross expenses | | | 0.98 | % | | | 0.92 | % | | | 0.87 | % | | | 0.87 | % | | | 0.90 | % | |
| Net investment income (loss) | | | 0.31 | % | | | 0.46 | % | | | 0.35 | % | | | 0.39 | % | | | 0.84 | %^ | |
| Portfolio turnover rate | | | 80 | % | | | 90 | % | | | 81 | % | | | 79 | % | | | 91 | % | |
The accompanying notes are an integral part of these financial statements.
Annual Report 259
Selected data for a share
of capital stock outstanding | | Year Ended | | |
| throughout each period | | 12/31/20 | | | 12/31/19 | | | 12/31/18 | | | 12/31/17 | | | 12/31/16 | | |
| Open Shares | | | | | | | | | | | | | | | | | | | | | |
| Net asset value, beginning of period | | $ | 12.58 | | | $ | 10.03 | | | $ | 13.72 | | | $ | 13.68 | | | $ | 12.16 | | |
| Income (Loss) from investment operations: | | | | | | | | | | | | | | | | | | | | | |
| Net investment income (loss) (a) | | | — | (b) | | | 0.01 | | | | 0.01 | | | | 0.01 | | | | 0.06 | ^ | |
| Net realized and unrealized gain (loss) | | | 0.75 | | | | 2.95 | | | | (1.87 | ) | | | 1.84 | | | | 1.85 | | |
| Total from investment operations | | | 0.75 | | | | 2.96 | | | | (1.86 | ) | | | 1.85 | | | | 1.91 | | |
| Less distributions from: | | | | | | | | | | | | | | | | | | | | | |
| Net investment income | | | (0.02 | ) | | | — | | | | — | (b) | | | (0.04 | ) | | | (0.05 | ) | |
| Net realized gains | | | (0.06 | ) | | | (0.41 | ) | | | (1.83 | ) | | | (1.77 | ) | | | (0.34 | ) | |
| Total distributions | | | (0.08 | ) | | | (0.41 | ) | | | (1.83 | ) | | | (1.81 | ) | | | (0.39 | ) | |
| Redemption fees | | | — | | | | — | | | | — | | | | — | | | | — | (b) | |
| Net asset value, end of period | | $ | 13.25 | | | $ | 12.58 | | | $ | 10.03 | | | $ | 13.72 | | | $ | 13.68 | | |
| Total Return (c) | | | 6.10 | % | | | 29.51 | % | | | –13.49 | % | | | 13.82 | % | | | 15.92 | %^ | |
| |
| Ratios and Supplemental Data: | | | | | | | | | | | | | | | | | | | | | |
| Net assets, end of period (in thousands) | | $ | 10,965 | | | $ | 14,643 | | | $ | 13,726 | | | $ | 25,973 | | | $ | 30,332 | | |
| Ratios to average net assets: | | | | | | | | | | | | | | | | | | | | | |
| Net expenses | | | 1.28 | % | | | 1.25 | % | | | 1.18 | % | | | 1.17 | % | | | 1.16 | %^ | |
| Gross expenses | | | 1.28 | % | | | 1.25 | % | | | 1.18 | % | | | 1.17 | % | | | 1.20 | % | |
| Net investment income (loss) | | | — | %(e) | | | 0.11 | % | | | 0.04 | % | | | 0.09 | % | | | 0.51 | %^ | |
| Portfolio turnover rate | | | 80 | % | | | 90 | % | | | 81 | % | | | 79 | % | | | 91 | % | |
The accompanying notes are an integral part of these financial statements.
260 Annual Report
Selected data for a share
of capital stock outstanding
throughout each period | | For the Period
1/8/20*
to 12/31/20 | |
| R6 Shares | | | | | | |
| Net asset value, beginning of period | | | $ | 13.62 | | |
| Income (Loss) from investment operations: | | | | | | |
| Net investment income (loss) (a) | | | | 0.04 | | |
| Net realized and unrealized gain (loss) | | | | 0.84 | | |
| Total from investment operations | | | | 0.88 | | |
| Less distributions from: | | | | | | |
| Net investment income | | | | (0.02 | ) | |
| Net realized gains | | | | (0.06 | ) | |
| Total distributions | | | | (0.08 | ) | |
| Net asset value, end of period | | | $ | 14.42 | | |
| Total Return (c) | | | | 6.59 | % | |
| | | | | | | |
| Ratios and Supplemental Data: | | | | | | |
| Net assets, end of period (in thousands) | | | $ | 684 | | |
| Ratios to average net assets (d): | | | | | | |
| Net expenses | | | | 0.96 | % | |
| Gross expenses | | | | 1.65 | % | |
| Net investment income (loss) | | | | 0.34 | % | |
| Portfolio turnover rate | | | | 80 | % | |
| * | The inception date for the R6 shares was January 8, 2020. |
| ^ | Refer to Note 3 in the Notes to Financial Statements for discussion of prior period custodian out-of-pocket expenses that were reimbursed to the Portfolio in the period. The impact on the net investment income per share amount was $0.01 per share. There was a 0.08% impact on the total return of the Institutional Shares class of the Portfolio. There was a 0.04% impact on the net expenses and net investment income (loss) ratios of the Portfolio. |
| (a) | Net investment income (loss) has been computed using the average shares method. |
| (b) | Amount is less than $0.01 per share. |
| (c) | Total returns reflect reinvestment of all dividends and distributions, if any. Certain expenses of the Portfolio may have been waived or reimbursed by the Investment Manager, State Street or DST; without such waiver/reimbursement of expenses, the Portfolio’s returns would have been lower. Returns for a period of less than one year are not annualized. |
| (d) | Annualized for a period of less than one year except for non-recurring expenses. |
| (e) | Amount is less than 0.005% |
The accompanying notes are an integral part of these financial statements.
Annual Report 261
LAZARD US SUSTAINABLE EQUITY PORTFOLIO
Selected data for a share
of capital stock outstanding
throughout each period | | For the Period
6/30/20*
to 12/31/20 | |
| Institutional Shares | | | | | | |
| Net asset value, beginning of period | | | $ | 10.00 | | |
| Income (Loss) from investment operations: | | | | | | |
| Net investment income (loss) (a) | | | | 0.04 | | |
| Net realized and unrealized gain (loss) | | | | 2.23 | | |
| Total from investment operations | | | | 2.27 | | |
| Less distributions from: | | | | | | |
| Net investment income | | | | (0.04 | ) | |
| Net realized gains | | | | (0.03 | ) | |
| Total distributions | | | | (0.07 | ) | |
| Net asset value, end of period | | | $ | 12.20 | | |
| Total Return (b) | | | | 22.69 | % | |
| |
| Ratios and Supplemental Data: | | | | | | |
| Net assets, end of period (in thousands) | | | $ | 11,490 | | |
| Ratios to average net assets (c): | | | | | | |
| Net expenses | | | | 0.75 | % | |
| Gross expenses | | | | 2.49 | % | |
| Net investment income (loss) | | | | 0.65 | % | |
| Portfolio turnover rate | | | | 5 | % | |
The accompanying notes are an integral part of these financial statements.
262 Annual Report
| Selected data for a share | | For the Period | |
| of capital stock outstanding | | 6/30/20* | |
| throughout each period | | to 12/31/20 | |
| Open Shares | | | | | | |
| Net asset value, beginning of period | | | $ | 10.00 | | |
| Income (Loss) from investment operations: | | | | | | |
| Net investment income (loss) (a) | | | | 0.02 | | |
| Net realized and unrealized gain (loss) | | | | 2.23 | | |
| Total from investment operations | | | | 2.25 | | |
| Less distributions from: | | | | | | |
| Net investment income | | | | (0.01 | ) | |
| Net realized gains | | | | (0.03 | ) | |
| Total distributions | | | | (0.04 | ) | |
| Net asset value, end of period | | | $ | 12.21 | | |
| Total Return (b) | | | | 22.48 | % | |
| |
| Ratios and Supplemental Data: | | | | | | |
| Net assets, end of period (in thousands) | | | $ | 128 | | |
| Ratios to average net assets (c): | | | | | | |
| Net expenses | | | | 1.00 | % | |
| Gross expenses | | | | 5.31 | % | |
| Net investment income (loss) | | | | 0.43 | % | |
| Portfolio turnover rate | | | | 5 | % | |
| * | The Portfolio commenced operations on June 30, 2020. |
| (a) | Net investment income (loss) has been computed using the average shares method. |
| (b) | Total returns reflect reinvestment of all dividends and distributions, if any. Certain expenses of the Portfolio may have been waived or reimbursed by the Investment Manager, State Street or DST; without such waiver/reimbursement of expenses, the Portfolio’s returns would have been lower. Returns for a period of less than one year are not annualized. |
| (c) | Annualized for a period of less than one year except for non-recurring expenses. |
The accompanying notes are an integral part of these financial statements.
Annual Report 263
The Lazard Funds, Inc. Notes to Financial Statements
December 31, 2020
1. Organization
The Lazard Funds, Inc. was incorporated in Maryland on May 17, 1991 and is registered under the Investment Company Act of 1940, as amended (the “1940 Act”), as an open-end management investment company. As of December 31, 2020, the Fund was comprised of thirty no-load portfolios (each referred to as a “Portfolio”).This report includes only the financial statements of the Lazard Developing Markets Equity Portfolio (“Developing Markets Equity”), Lazard Emerging Markets Core Equity Portfolio (“Emerging Markets Core Equity”), Lazard Emerging Markets Equity Advantage Portfolio (“Emerging Markets Equity Advantage”), Lazard Emerging Markets Equity Blend Portfolio (“Emerging Markets Equity Blend”), Lazard Emerging Markets Equity Portfolio (“Emerging Markets Equity”), Lazard Equity Franchise Portfolio (“Equity Franchise”), Lazard Global Equity Select Portfolio (“Global Equity Select”), Lazard Global Listed Infrastructure Portfolio (“Global Listed Infrastructure”), Lazard Global Strategic Equity Portfolio (“Global Strategic Equity”), Lazard International Equity Advantage Portfolio (“International Equity Advantage”), Lazard International Equity Concentrated Portfolio (“International Equity Concentrated”), Lazard International Equity Portfolio (“International Equity”), Lazard International Equity Select Portfolio (“International Equity Select”), Lazard International Equity Value Portfolio (“International Equity Value”), Lazard International Small Cap Equity Portfolio (“International Small Cap Equity”), Lazard International Strategic Equity Portfolio (“International Strategic Equity”), Lazard International Quality Growth Portfolio (“International Quality Growth”), Lazard Managed Equity Volatility Portfolio (“Managed Equity Volatility”), Lazard US Equity Concentrated Porfolio (“US Equity Concentrated”), Lazard US Equity Focus Portfolio (“US Equity Focus”), Lazard US Small-Mid Cap Equity Portfolio (“US Small-Mid Cap Equity”), and Lazard US Sustainable Equity Portfolio (“US Sustainable Equity” which commenced operations on June 30, 2020).The financial statements of the other eight Portfolios are presented separately.
The Portfolios, other than Equity Franchise, International Equity Concentrated, International Equity Value, US Equity Concentrated and US Equity Focus, are operated as “diversified” funds, as defined in the 1940 Act.
264 Annual Report
Each Portfolio currently offers Institutional Shares and Open Shares, and certain Portfolios offer R6 Shares. Each share class is identical except as to minimum investment requirements; eligibility requirements for R6 Shares; the services offered to, and expenses borne by, each class; and the availability of Service Payments (as defined in the Portfolios’ prospectus).
On November 17, 2020, the Lazard Global Strategic Equity Portfolio had a 1-for-5 reverse share split, effective after the market close on November 17, 2020. After the reverse share split, shareholders in the Portfolio held one share for every five Portfolio shares previously held.The reverse share split had no impact on the overall value of a shareholder’s investment.
2. Significant Accounting Policies
The accompanying financial statements are presented in conformity with GAAP. The Fund is an investment company and therefore applies specialized accounting guidance in accordance with Accounting Standards Codification Topic 946. The following is a summary of significant accounting policies consistently followed by the Fund in the preparation of the financial statements:
(a) Valuation of Investments—Equity securities traded on a securities exchange or market, including exchange-traded option contracts, rights and warrants, are valued at the last reported sales price (for US listed equity securities) or the closing price (for non-US listed equity securities) on the exchange or market on which the security is principally traded or, for securities trading on the NASDAQ National Market System (“NASDAQ”), the NASDAQ Official Closing Price. If there is no available closing price for a non-US listed equity security, the last reported sales price is used. If there are no reported sales of a security on the valuation date, the security is valued at the most recent quoted bid price on such date reported by such principal exchange or market. Forward currency contracts generally are valued using quotations from an independent pricing service. Investments in money market funds are valued at the fund’s net asset value (“NAV”) per share.
Calculation of a Portfolio’s NAV may not take place contemporaneously with the determination of the prices of
Annual Report 265
portfolio assets used in such calculation. Trading on certain non-US securities exchanges or markets, such as those in Europe and Asia, ordinarily may be completed before the close of business on each business day in New York (i.e., a day on which the New York Stock Exchange (the “NYSE”) is open). In addition, securities trading in a particular non-US country or countries, may not take place on all business days in New York and on which the NAV of a Portfolio is calculated.
If a significant event materially affecting the value of securities occurs between the close of the exchange or market on which the security is principally traded and the time when a Portfolio’s NAV is calculated, or when current market quotations otherwise are determined not to be readily available or reliable (including restricted or other illiquid securities such as certain derivative instruments), such securities will be valued at their fair value as determined by, or in accordance with procedures approved by, the Fund’s Board of Directors (the “Board”).The fair value of non-US securities may be determined with the assistance of an independent pricing service using correlations between the movement of prices of such securities and indices of US securities and other appropriate indicators, such as closing market prices of relevant ADRs or futures contracts. Certain non-US securities may trade on days when a Portfolio is not open for business, thus affecting the value of the Portfolio’s assets on days when Portfolio shareholders may not be able to buy or sell Portfolio shares.
The Valuation Committee of the Investment Manager, which is subject to the oversight of the Board, may evaluate a variety of factors to determine the fair value of securities for which market quotations are determined not to be readily available or reliable. These factors include, but are not limited to, the type of security, the value of comparable securities, observations from financial institutions and relevant news events. Input from the Investment Manager’s portfolio management team also will be considered.
The effect of using fair value pricing is that the NAV of a Portfolio will reflect the affected securities’ values as determined in the judgment of the Board or its designee instead of being determined by the market. Using a fair value pricing methodology
266 Annual Report
to price securities may result in a value that is different from the most recent closing price of a security and from the prices used by other investment companies to calculate their portfolios’ NAVs.
(b) Portfolio Securities Transactions and Investment Income—Portfolio securities transactions are accounted for on trade date. Realized gain (loss) on sales of investments are recorded on a specific identification basis. Dividend income is recorded on the ex-dividend date except for certain dividends from non-US securities where the dividend rate is not available. In such cases, the dividend is recorded as soon as the information is received by a Portfolio. Interest income, if any, is accrued daily.
A Portfolio may be subject to taxes imposed by non-US countries in which it invests. Such taxes are generally based upon income earned or capital gains (realized and/or unrealized). An affected Portfolio accrues and applies such taxes to net investment income, net realized gains and net unrealized gains concurrent with the recognition of income earned or capital gains (realized and/or unrealized) from the applicable portfolio securities.
As a result of several court cases in certain countries across the European Union, some Portfolios have filed tax reclaims for previously withheld taxes on dividends earned in certain European Union countries.These filings are subject to various administrative proceedings by the local jurisdictions’ tax authorities within the European Union, as well as a number of related judicial proceedings. Uncertainty exists as to the ultimate resolution of these proceedings, the likelihood of receipt of these claims, and the potential timing of payment, and accordingly no amounts are reflected in the financial statements. Such amounts, if and when recorded, could result in an increase in a Portfolio’s NAV per share.
(c) Foreign Currency Translation and Forward Currency Contracts—The accounting records of the Fund are maintained in US dollars. Portfolio securities and other assets and liabilities denominated in a foreign currency are translated daily into US dollars at the prevailing rates of exchange. Purchases and sales of securities, income receipts and expense payments are translated into US dollars at the prevailing exchange rates on the respective transaction dates.
Annual Report 267
The Portfolios do not isolate the portion of operations resulting from changes in foreign exchange rates on investments from the fluctuations arising from changes in their market prices. Such fluctuations are included in net realized and unrealized gain (loss) on investments. A forward currency contract is an agreement between two parties to buy or sell currency at a set price on a future date. Daily fluctuations in the value of forward currency contracts are recorded as unrealized appreciation (depreciation) on forward currency contracts. When the contract is closed, the Portfolio records a realized gain (loss) equal to the difference between the value at the time it was opened and the value at the time it was closed. Net realized gain (loss) on foreign currency transactions and forward currency contracts represent net foreign currency gain (loss) from forward currency contracts, disposition of foreign currencies, currency gain (loss) realized between the trade and settlement dates on securities transactions, and the difference between the amount of dividends, interest and foreign withholding taxes recorded on the Portfolios’ accounting records and the US dollar equivalent amounts actually received or paid. Net change in unrealized appreciation (depreciation) on foreign currency translations reflects the impact of changes in exchange rates on the value of assets and liabilities, other than investments in securities, during the period.
During the year ended December 31, 2020, the Global Listed Infrastructure Portfolio traded in forward currency contracts.
(d) Federal Income Taxes—The Fund’s policy is for each Portfolio to qualify as a regulated investment company under Subchapter M of the Internal Revenue Code of 1986, as amended (the “Code”), and to distribute all of its taxable income, including any net realized capital gains, to shareholders. Therefore, no federal income tax provision is required.
At December 31, 2020, the following Portfolios had unused realized capital loss carryovers which, for federal income tax purposes, could be used to offset future realized capital gains with no expiration date as follows:
268 Annual Report
| Portfolio | | Short-Term | | | Long-Term | |
| | | | | | | |
| Developing Markets Equity | | $ | 52,510,008 | | | $ | 61,511,199 | |
| Emerging Markets Core Equity | | | 6,634,677 | | | | 19,272,369 | |
| Emerging Markets Equity Blend | | | 11,817,368 | | | | 42,655,514 | |
| Emerging Markets Equity | | | 213,155,187 | | | | 1,246,135,039 | |
| International Equity Advantage | | | 142,059 | | | | 132,843 | |
| International Equity Concentrated | | | 9,174,498 | | | | 2,079,978 | |
| International Equity | | | 59,029,777 | | | | 3,993,533 | |
| International Equity Select | | | 1,599,031 | | | | 1,956,530 | |
| International Equity Value | | | 900,479 | | | | — | |
| International Small Cap Equity | | | 1,090,853 | | | | — | |
| International Strategic Equity | | | 68,654,545 | | | | — | |
| Managed Equity Volatility | | | 1,476,490 | | | | — | |
| US Small-Mid Cap Equity | | | 4,135,115 | | | | — | |
During the year ended December 31, 2020, the following Portfolios utilized realized capital loss carryovers from previous years as follows:
| Portfolio | | Amounts | |
| | | | |
| Emerging Markets Equity Advantage | | $ | 184,175 | |
| Global Equity Select | | | 1,427,271 | |
| Global Listed Infrastructure | | | 9,760,289 | |
| International Equity Value Portfolio | | | 3,029 | |
| International Small Cap Equity Portfolio | | | 431,493 | |
| US Equity Concentrated Portfolio | | | 1,193,025 | |
Under current tax law, post-October capital losses or certain late-year ordinary losses, as defined by the Code, within the taxable year may be deferred and treated as occurring on the first day of the following tax year. For the tax year ended December 31, 2020, the following Portfolios elected to defer such losses as follows:
| Portfolio | | Post-October
Capital Loss
Deferral | | Late-Year
Ordinary Loss
Deferral | |
| | | | | | | | |
| Global Listed Infrastructure | | $ | — | | | $ | 186,822,571 | | |
| International Equity Advantage | | | — | | | | 602 | | |
| International Quality Growth | | | — | | | | 105 | | |
For federal income tax purposes, the aggregate cost, aggregate gross unrealized appreciation, aggregate gross unrealized
Annual Report 269
depreciation and the net unrealized appreciation (depreciation) were as follows:
| Portfolio | | Aggregate
Cost | | Aggregate
Gross
Unrealized
Appreciation | | Aggregate
Gross
Unrealized
Depreciation | | Net
Unrealized
Appreciation
(Depreciation) |
| | | | | | | | | |
| Developing Markets Equity | | $ | 142,867,141 | | | $ | 62,077,804 | | | $ | 3,465,243 | | | $ | 58,612,561 | |
| Emerging Markets Core Equity | | | 144,000,035 | | | | 75,000,837 | | | | 6,296,978 | | | | 68,703,859 | |
| Emerging Markets Equity Advantage | | | 22,541,260 | | | | 6,167,432 | | | | 280,170 | | | | 5,887,262 | |
| Emerging Markets Equity Blend | | | 63,248,470 | | | | 17,846,946 | | | | 2,523,861 | | | | 15,323,085 | |
| Emerging Markets Equity | | | 3,536,637,743 | | | | 1,058,316,458 | | | | 238,850,986 | | | | 819,465,472 | |
| Equity Franchise | | | 81,204,844 | | | | 11,385,512 | | | | 770,215 | | | | 10,615,297 | |
| Global Equity Select | | | 67,735,556 | | | | 25,891,417 | | | | 79,605 | | | | 25,811,812 | |
| Global Listed Infrastructure | | | 7,354,628,643 | | | | 731,913,694 | | | | 470,691,859 | | | | 261,221,835 | |
| Global Strategic Equity | | | 3,012,633 | | | | 1,268,268 | | | | 1,243 | | | | 1,267,025 | |
| International Equity Advantage | | | 2,220,292 | | | | 444,774 | | | | 37,302 | | | | 407,472 | |
| International Equity Concentrated | | | 13,021,176 | | | | 1,350,281 | | | | 61,361 | | | | 1,288,920 | |
| International Equity | | | 2,413,313,528 | | | | 695,515,550 | | | | 51,051,684 | | | | 644,463,866 | |
| International Equity Select | | | 78,591,087 | | | | 18,977,061 | | | | 2,736,253 | | | | 16,240,808 | |
| International Equity Value | | | 2,410,429 | | | | 381,224 | | | | 31,937 | | | | 349,287 | |
| International Quality Growth | | | 8,534,859 | | | | 2,447,552 | | | | 8,856 | | | | 2,438,696 | |
| International Small Cap Equity | | | 33,103,661 | | | | 9,193,821 | | | | 447,584 | | | | 8,746,237 | |
| International Strategic Equity | | | 4,441,658,579 | | | | 1,513,303,679 | | | | 35,229,983 | | | | 1,478,073,696 | |
| Managed Equity Volatility | | | 24,172,032 | | | | 2,314,413 | | | | 689,435 | | | | 1,624,978 | |
| US Equity Concentrated | | | 1,405,721,508 | | | | 565,580,429 | | | | — | | | | 565,580,429 | |
| US Equity Focus | | | 36,849,058 | | | | 16,289,729 | | | | — | | | | 16,289,729 | |
| US Small-Mid Cap Equity | | | 78,035,060 | | | | 25,041,409 | | | | 862,795 | | | | 24,178,614 | |
| US Sustainable Equity | | | 9,857,859 | | | | 1,725,938 | | | | 15,004 | | | | 1,710,934 | |
Management has analyzed the Portfolios’ tax positions, and has concluded that no liability for unrecognized tax benefits should be recorded related to uncertain tax positions taken on tax returns filed for any open tax years (or expected to be taken on future tax
270 Annual Report
returns). Open tax years are those that remain subject to examination and are based on each tax jurisdiction’s statute of limitations. Each Portfolio files a US federal income tax return annually after its fiscal year-end, which is subject to examination by the Internal Revenue Service for a period of three years from the date of filing.
(e) Dividends and Distributions—For each Portfolio, income dividends are normally declared each business day and paid monthly during any particular year, except that the Global Listed Infrastructure Portfolio’s dividends from net investment income (if any), will be declared and paid quarterly. During any particular year, net realized gains from investment transactions in excess of available capital loss carryforwards would be taxable to the Portfolios, if not distributed.The Portfolios intend to declare and distribute these amounts, at least annually, to shareholders; but may be distributed more frequently. Differences in per share distributions, by class, are generally due to differences in class specific expenses.
The US Equity Focus, US Equity Concentrated, Global Equity Select, and Equity Franchise Portfolio, intend, on their 2020 tax returns, to treat as a distribution of investment company taxable income and net capital gain the portion of redemption proceeds paid to redeeming shareholders that represents the redeeming shareholders’ portion of the Portfolios’ undistributed investment company taxable income and net capital gain.This practice, which involves the use of equalization accounting, will have the effect of reducing the amount of income and gains that the Portfolios would otherwise be required to distribute as dividends to shareholders in order for the Portfolios to avoid federal income and excise taxes. This practice reduces the amount of distributions required to be made to non-redeeming shareholders and defers the recognition of taxable income by such shareholders. However, since the amount of any undistributed income will be reflected in the value of the Portfolios’ shares, the total return on a shareholder’s investment is not affected by the Portfolios’ use of equalization.
REIT distributions received by a Portfolio are generally comprised of ordinary income, long-term capital gains and a return of REIT
Annual Report 271
capital. However, as the actual character of such distributions received are not known until after the calendar year end, distributions made by a Portfolio during the year are subject to re-characterization that may result in some portion of the distributions being reclassified as a return of capital distribution to Portfolio shareholders.
Income and capital gains distributions are determined in accordance with federal income tax regulations which may differ from GAAP. These book/tax differences, which may result in distribution reclassifications, are primarily due to differing treatments of foreign currency transactions, wash sales, passive foreign investment companies, expiring capital loss carryovers, certain expenses, foreign capital gains taxes, distributions in excess of current earnings, equalization, non-REIT non-taxable dividend adjustment to income, distributions redesignations, adjustments in relation to merger, return of capital distributions, receivable from tax reclaim and distributions from real estate investment trusts and partnerships. The book/tax differences relating to shareholder distributions resulted in reclassifications among certain capital accounts as follows:
| Portfolio | | Paid in
Capital | | Distributable
Earnings
(Accumulated
Loss) | |
| | | | | | |
| Equity Franchise | | $ | 18,210 | | | $ | (18,210 | ) | |
| Global Equity Select | | | 4,945,142 | | | | (4,945,142 | ) | |
| Global Listed Infrastructure | | | (35,977,763 | ) | | | 35,977,763 | | |
| International Equity Select | | | (3,840 | ) | | | 3,840 | | |
| International Quality Growth | | | (79 | ) | | | 79 | | |
| International Strategic Equity | | | (10,649 | ) | | | 10,649 | | |
| US Equity Concentrated | | | 1,164,595 | | | | (1,164,595 | ) | |
| US Equity Focus | | | 132,115 | | | | (132,115 | ) | |
| US Small-Mid Cap Equity | | | (12,877 | ) | | | 12,877 | | |
| US Sustainable Equity | | | (65 | ) | | | 65 | | |
272 Annual Report
The tax character of dividends and distributions paid during the years ended December 31, were as follows:
| | | Ordinary Income | | Long-Term Capital Gain | |
| Portfolio | | 2020 | | 2019 | | 2020 | | 2019 | |
| | | | | | | | | | | | | | | | | |
| Developing Markets Equity | | $ | 524,233 | | | $ | 1,272,077 | | | $ | — | | | $ | — | |
| Emerging Markets Core Equity | | | 1,259,054 | | | | 4,002,107 | | | | — | | | | — | |
| Emerging Markets Equity Advantage | | | 191,129 | | | | 198,987 | | | | 65,751 | | | | — | |
| Emerging Markets Equity Blend | | | 941,700 | | | | 2,137,475 | | | | — | | | | — | |
| Emerging Markets Equity | | | 101,450,892 | | | | 194,889,049 | | | | — | | | | — | |
| Equity Franchise | | | 1,013,518 | | | | 2,037,956 | | | | ��� | | | | 163,734 | |
| Global Equity Select* | | | 898,618 | | | | 595,796 | | | | 2,179,767 | | | | — | |
| Global Listed Infrastructure* | | | 20,285,474 | | | | 317,773,912 | | | | 133,696,404 | | | | — | |
| Global Strategic Equity | | | 24,300 | | | | 27,142 | | | | 104,380 | | | | 63,308 | |
| International Equity Advantage | | | 50,031 | | | | 54,002 | | | | — | | | | — | |
| International Equity Concentrated | | | 514,755 | | | | 1,609,266 | | | | — | | | | — | |
| International Equity | | | 31,285,550 | | | | 57,938,459 | | | | — | | | | — | |
| International Equity Select | | | 918,247 | | | | 2,007,181 | | | | — | | | | — | |
| International Equity Value | | | 58,795 | | | | 639,252 | | | | — | | | | — | |
| International Quality Growth | | | 5,697 | | | | 95,627 | | | | 81,523 | | | | — | |
| International Small Cap Equity | | | 1,004,081 | | | | 234,028 | | | | — | | | | 1,291,922 | |
| International Strategic Equity | | | 58,381,073 | | | | 113,944,544 | | | | — | | | | — | |
| Managed Equity Volatility | | | 190,666 | | | | 480,591 | | | | 373,644 | | | | 2,138 | |
| US Equity Concentrated | | | 11,158,479 | | | | 10,742,527 | | | | 20,817,948 | | | | — | |
| US Equity Focus | | | 450,250 | | | | 1,621,108 | | | | 2,166,659 | | | | 3,133,733 | |
| US Small-Mid Cap Equity | | | 170,438 | | | | 225,556 | | | | 602,919 | | | | 3,647,669 | |
| US Sustainable Equity | | | 63,342 | | | | — | | | | 24 | | | | — | |
| * | Global Equity Select and Global Listed Infrastructure Portfolios had return of capital distributions of $0 and $35,977,763 in 2020 and $42,175 and $0 in 2019, respectively. |
Annual Report 273
At December 31, 2020, the components of distributable earnings (accumulated loss), on a tax basis, were as follows:
| Portfolio | | Undistributed
Ordinary Income
(Deferred
Ordinary
Losses) | | Undistributed
Long-Term
Capital Gain
(Deferred
Capital Losses) | | Net Unrealized
Appreciation
(Depreciation)
Including
Foreign Currency |
| | | | | | | | | | |
| Developing Markets Equity | | $ | 435,490 | | | $ | (114,021,207 | ) | | $ | 58,545,657 | |
| Emerging Markets Core Equity | | | 178,564 | | | | (25,907,046 | ) | | | 68,526,138 | |
| Emerging Markets Equity Advantage | | | — | | | | 675,318 | | | | 5,888,320 | |
| Emerging Markets Equity Blend | | | 33,253 | | | | (54,472,882 | ) | | | 15,197,128 | |
| Emerging Markets Equity | | | 70,354,003 | | | | (1,459,290,226 | ) | | | 815,246,730 | |
| Equity Franchise | | | 333,949 | | | | 16,574 | | | | 10,598,042 | |
| Global Equity Select | | | 498,000 | | | | 359,183 | | | | 25,806,475 | |
| Global Listed Infrastructure | | | (186,822,571 | ) | | | — | | | | 261,845,850 | |
| Global Strategic Equity | | | 33,162 | | | | 35,277 | | | | 1,240,727 | |
| International Equity Advantage | | | (170 | ) | | | (274,902 | ) | | | 407,875 | |
| International Equity Concentrated | | | 3,089 | | | | (11,254,476 | ) | | | 1,262,916 | |
| International Equity | | | 14,630,285 | | | | (63,023,310 | ) | | | 644,946,673 | |
| International Equity Select | | | — | | | | (3,555,561 | ) | | | 16,253,407 | |
| International Equity Value | | | 28,309 | | | | (900,479 | ) | | | 301,341 | |
| International Quality Growth | | | (105 | ) | | | — | | | | 2,382,324 | |
| International Small Cap Equity | | | 336,607 | | | | (1,090,853 | ) | | | 8,741,871 | |
| International Strategic Equity | | | 8,487,423 | | | | (68,654,545 | ) | | | 1,477,197,767 | |
| Managed Equity Volatility | | | 378,376 | | | | (1,476,490 | ) | | | 1,627,042 | |
| US Equity Concentrated | | | — | | | | 21,619,277 | | | | 565,580,428 | |
| US Equity Focus | | | 1,866 | | | | 1,684,259 | | | | 16,289,728 | |
| US Small-Mid Cap Equity | | | 232,603 | | | | (4,135,115 | ) | | | 24,178,614 | |
| US Sustainable Equity | | | 36,877 | | | | 232 | | | | 1,710,934 | |
(f) Offering and Organizational Costs—Costs incurred by the Fund in connection with the offering of shares of a new Portfolio or share class of a Portfolio are deferred and amortized on a straight line basis over a twelve-month period from the date of commencement of operations of the Portfolio or share class. Organizational costs are expensed as incurred.
(g) Allocation of Expenses—Expenses common to the Fund, Lazard Retirement Series, Inc., and Lazard Global Total Return and Income Fund, Inc. (each a “Lazard Fund” and collectively, the “Lazard Fund Complex”), each a registered management investment company advised by the Investment Manager, not
274 Annual Report
directly chargeable to one or more specific Lazard Funds are allocated to the Fund and among its Portfolios primarily on the basis of relative net assets. Expenses of the Fund not directly chargeable to one or more Portfolios are similarly allocated among the Portfolios primarily on the basis of relative net assets. Portfolios accrue distribution and service (12b-1) fees to Open Shares.The Portfolios’ income, expenses (other than class specific expenses) and realized and unrealized gains and losses are allocated proportionally each day between the classes based upon the relative net assets of each class.
(h) Redemption Fee—Until August 15, 2016, the Portfolios imposed a 1.00% redemption fee (short-term trading fee) on Portfolio shares redeemed less than 30 days after such shares were acquired.The fees were retained by the Portfolios and are included as paid in capital on the Statements of Assets and Liabilities. As of August 15, 2016, redemption fees no longer apply to transactions in Portfolio shares.
(i) Estimates—The preparation of financial statements in conformity with GAAP requires management to make estimates and assumptions that affect the reported amounts of assets and liabilities and disclosure of contingent assets and liabilities at the date of the financial statements and the reported amounts of increases and decreases in net assets resulting from operations during the reporting period. Actual results could differ from those estimates.
(j) Net Asset Value—The NAV per share for each class of each Portfolio is determined each day the NYSE is open for trading as of the close of regular trading on the NYSE (generally 4:00 p.m. Eastern time).The Fund will not treat an intraday unscheduled disruption in NYSE trading as a closure of the NYSE, and will price its shares as of 4:00 p.m., if the particular disruption directly affects only the NYSE.The NAV per share of a class is determined by dividing the value of the total assets of the Portfolio represented by such class, less all liabilities, by the total number of Portfolio shares of such class outstanding.
Annual Report 275
3. Investment Management, Administration, Custody, Distribution and Transfer Agency Agreements
The Fund, on behalf of the Portfolios, has entered into a management agreement (the “Management Agreement”) with the Investment Manager. Pursuant to the Management Agreement, the Investment Manager manages the investment operations of the Fund and the assets of the Fund including the purchase, retention and disposition thereof, in accordance with the Fund’s investment objectives, policies, and restrictions, and provides the Portfolios with administrative, operational and compliance assistance services. For its services provided to the Portfolios, the Investment Manager earns a management fee, accrued daily as a percentage of each Portfolio’s average daily net assets and payable by each Portfolio monthly, at the annual rate set forth below:
| Portfolio | | Annual Rate | | |
| | | | | |
| Developing Markets Equity | | | 1.00 | % | |
| Emerging Markets Core Equity | | | 1.00 | | |
| Emerging Markets Equity Advantage | | | 0.85 | | |
| Emerging Markets Equity Blend | | | 1.00 | | |
| Emerging Markets Equity | | | 1.00 | | |
| Equity Franchise | | | 0.80 | | |
| Global Equity Select | | | 0.65 | | |
| Global Listed Infrastructure | | | 0.90 | | |
| Global Strategic Equity | | | 0.75 | | |
| International Equity Advantage | | | 0.65 | | |
| International Equity Concentrated | | | 0.80 | | |
| International Equity | | | 0.75 | | |
| International Equity Select | | | 0.65 | | |
| International Equity Value | | | 0.80 | | |
| International Quality Growth | | | 0.75 | | |
| International Small Cap Equity | | | 0.75 | | |
| International Strategic Equity | | | 0.75 | | |
| Managed Equity Volatility | | | 0.60 | | |
| US Equity Concentrated | | | 0.70 | | |
| US Equity Focus | | | 0.55 | | |
| US Small-Mid Cap Equity | | | 0.75 | | |
| US Sustainable Equity | | | 0.60 | | |
The Investment Manager has voluntarily agreed to waive its fees and, if necessary, reimburse a Portfolio until May 1, 2021 (or such other date as indicated below) the aggregate direct expenses of the Portfolio(s), exclusive of taxes, brokerage, interest on
276 Annual Report
borrowings, fees and expenses of “Acquired Funds” (as defined in Form N-1A), including, for the purposes of the expense limitation agreement only, fees related to filing foreign tax reclaims and extraordinary expenses, exceed the applicable percentage(s) of the value of the Portfolio’s average daily net assets set forth opposite the Portfolio’s name in the table below.The Fund, on behalf of the Portfolio, may deduct from the payment to be made to the Investment Manager under the Management Agreement, or the Investment Manager will bear, such excess expenses.
| Portfolio | | Institutional
Shares | | Open
Shares | | R6
Shares | |
| | | | | | | | |
| Developing Markets Equity | | | 1.15 | % | | | 1.40 | % | | | N/A | % | (a) |
| Emerging Markets Core Equity | | | 1.25 | | | | 1.50 | | | | 1.20 | | |
| Emerging Markets Equity Advantage | | | 1.10 | | | | 1.35 | | | | N/A | | |
| Emerging Markets Equity Blend | | | 1.20 | | | | 1.45 | | | | N/A | (a) | |
| Emerging Markets Equity | | | 1.20 | | | | 1.45 | | | | 1.15 | | |
| Equity Franchise | | | 0.95 | | | | 1.20 | | | | N/A | | |
| Global Equity Select | | | 0.90 | | | | 1.15 | | | | N/A | | |
| Global Listed Infrastructure | | | 1.20 | | | | 1.45 | | | | N/A | (b) | |
| Global Strategic Equity | | | 0.95 | | | | 1.20 | | | | N/A | (c) | |
| International Equity Advantage | | | 0.90 | | | | 1.15 | | | | N/A | | |
| International Equity Concentrated | | | 0.90 | | | | 1.15 | | | | N/A | (d) | |
| International Equity | | | 0.85 | | | | 1.10 | | | | 0.80 | | |
| International Equity Select | | | 0.90 | | | | 1.15 | | | | N/A | (e) | |
| International Equity Value | | | 0.95 | | | | 1.20 | | | | N/A | | |
| International Quality Growth | | | 0.85 | | | | 1.10 | (b) | | | N/A | | |
| International Small Cap Equity | | | 1.13 | | | | 1.38 | | | | N/A | | |
| International Strategic Equity | | | 1.05 | | | | 1.30 | | | | 1.00 | | |
| Managed Equity Volatility | | | 0.75 | | | | 1.00 | | | | N/A | | |
| US Equity Concentrated | | | 0.90 | | | | 1.15 | | | | 0.85 | (f) | |
| US Equity Focus | | | 0.70 | | | | 0.95 | | | | 0.70 | | |
| US Small-Mid Cap Equity | | | 1.15 | | | | 1.40 | | | | 1.10 | | |
| US Sustainable Equity | | | 0.75 | | | | 1.00 | | | | N/A | (g) | |
| (a) | From January 1, 2020 to June 15, 2020, annual rates were 1.25% and 1.50%, respectively. |
| (b) | This agreement will continue in effect until May 1, 2030. |
| (c) | From January 1, 2020 to June 15, 2020, annual rates were 1.00% and 1.25%, respectively. |
| (d) | From January 1, 2020 to June 15, 2020, annual rates were 0.95% and 1.20%, respectively. |
| (e) | This agreement will continue in effect until May 1, 2021 and from May 1, 2021 to May 1, 2030 at levels of 1.15%, 1.40% and 1.10% respectively. |
| (f) | This agreement will continue in effect until May 1, 2021 and from May 1, 2021 to May 1, 2030 at levels of 1.10%, 1.35% and 1.05% respectively. |
| (g) | This agreement will continue in effect until June 30, 2022. |
Annual Report 277
In addition, until May 1, 2021, to the extent the “Total Annual Fund Operating Expenses” (as used in Form N-1A) of the R6 Shares of a Portfolio exceed the Total Annual Fund Operating Expenses of the Portfolio’s Institutional Shares (in each case, not including management fees, custodial fees or other expenses related to the management of the Portfolio’s assets), the Investment Manager will bear the expenses of the R6 Shares in the amount of such excess.
During the year ended December 31, 2020, the Investment Manager waived its management fees and reimbursed the following Portfolios for other expenses as follows:
| | | Institutional Shares | | Open Shares | |
| Portfolio | | Management
Fees Waived | | Expenses
Reimbursed | | Management
Fees Waived | | Expenses
Reimbursed | |
| | | | | | | | | | |
| Developing Markets Equity | | $ | 68,889 | | | $ | — | | | $ | 7,026 | | | $ | — | | |
| Emerging Markets Core Equity | | | — | | | | — | | | | 2,319 | | | | — | | |
| Emerging Markets Equity Advantage | | | 148,929 | | | | 3,257 | | | | 7,470 | | | | 4,189 | | |
| Emerging Markets Equity Blend | | | 175,992 | | | | — | | | | 13,902 | | | | — | | |
| Equity Franchise | | | 89,222 | | | | — | | | | 1,454 | | | | 2,982 | | |
| Global Equity Select | | | 29,225 | | | | — | | | | 5,833 | | | | — | | |
| Global Strategic Equity | | | 24,630 | | | | 132,014 | | | | 1,104 | | | | 9,982 | | |
| International Equity Advantage | | | 14,112 | | | | 152,432 | | | | 670 | | | | 11,073 | | |
| International Equity Concentrated | | | 127,924 | | | | — | | | | 3,001 | | | | 2,700 | | |
| International Equity Select | | | 39,771 | | | | — | | | | 5,547 | | | | — | | |
| International Equity Value | | | 21,487 | | | | 129,969 | | | | 410 | | | | 6,572 | | |
| International Quality Growth | | | 42,057 | | | | 111,213 | | | | 518 | | | | 5,325 | | |
| International Small Cap Equity | | | 42,052 | | | | — | | | | 22,182 | | | | — | | |
| Managed Equity Volatility | | | 145,305 | | | | — | | | | 874 | | | | 4,054 | | |
| US Equity Focus | | | 151,546 | | | | 2,742 | | | | 6,139 | | | | 3,276 | | |
| US Sustainable Equity | | | 27,336 | | | | 97,681 | | | | 337 | | | | 1,970 | | |
| | | R6 Shares | |
| Portfolio | | Management
Fees Waived | | Expenses
Reimbursed | |
| | | | | | | | | | |
| Emerging Markets Core Equity | | $ | 2,972 | | | $ | — | | |
| Emerging Markets Equity | | | 5,235 | | | | — | | |
| International Equity | | | 22,312 | | | | — | | |
| International Strategic Equity | | | 7,162 | | | | — | | |
| US Equity Concentrated | | | 3,142 | | | | — | | |
| US Equity Focus | | | 73,145 | | | | 1,971 | | |
| US Small-Mid Cap Equity | | | 3,325 | | | | — | | |
278 Annual Report
The aforementioned waivers and/or reimbursements are not subject to recoupment by the Investment Manager.
State Street serves as the Fund’s custodian and provides the Fund with certain administrative services.
In December 2015, State Street announced that it had identified inconsistencies in the way in which clients were invoiced for custody out-of-pocket expenses from 1998 until 2015. The difference between what was charged and what should have been charged, plus interest, was recorded as a reimbursement when determined in 2016. Pursuant to the expense limitations described above, certain Portfolios experienced management fee waivers during the year ended December 31, 2016. Accordingly, the reimbursement of out-of-pocket expenses resulted in the reduction in the waiver of management fees for certain Portfolios for the year ended December 31, 2016.
The Fund has a distribution agreement with Lazard Asset Management Securities LLC (the “Distributor”), a wholly-owned subsidiary of the Investment Manager, to serve as the distributor for shares of each Portfolio. The Distributor bears, amongst other things, the cost of preparing and distributing materials used by the Distributor in connection with its offering Portfolio shares and other advertising and promotional expenses.
Under a distribution and servicing plan adopted pursuant to Rule 12b-1 under the 1940 Act, each Portfolio pays a monthly fee to the Distributor, at an annual rate of 0.25% of the average daily net assets of its Open Shares, for certain distribution activities and providing services to holders of the Portfolio’s Open shares. The Distributor may make payments to such as financial institutions, securities dealers and other industry professionals in respect of these services.
DST is the Fund’s transfer agent and dividend disbursing agent. During the year ended December 31, 2020, DST waived $534 and $1,493 of its fees for the US Small-Mid Cap Equity Portfolio and US Sustainable Equity Portfolio respectively.
Annual Report 279
4. Directors’ Compensation
Certain Directors of the Fund are officers of the Investment Manager. For the year ended December 31, 2020, each Director who is not an affiliated person of the Investment Manager or any of its affiliates was paid by all of the funds in the Lazard Fund Complex: (1) an annual retainer of $237,000, (2) an additional annual fee of $33,700 to the lead Independent Director, and (3) an additional annual fee of $23,500 to the Audit Committee Chair. The Independent Directors (an “Independent Director” is a Director who is not an “interested person” (as defined in the 1940 Act) of the Fund) also may be paid additional compensation for participation on ad hoc committees or other work performed on behalf of the Board. The Directors do not receive benefits from the Fund pursuant to any pension, retirement or similar arrangement. The compensation policy (i.e., retainer amounts and any additional fees as described above) for Independent Directors for the Lazard Fund Complex will remain the same in 2021. Independent Directors’ fees are allocated among the active Portfolios in the Lazard Fund Complex at a rate of $5,000 per active portfolio with the remainder allocated based upon each active portfolio’s proportionate share of combined net assets. The Statements of Operations show the Independent Directors’ fees and expenses paid by each Portfolio.
5. Securities Transactions and Transactions with Affiliates
Purchases and sales of portfolio securities (excluding short-term investments) for the year ended December 31, 2020 were as follows:
| Portfolio | | Purchases | | Sales |
| | | | | | | | | |
| Developing Markets Equity | | $ | 101,877,255 | | | $ | 154,585,252 | |
| Emerging Markets Core Equity | | | 41,317,703 | | | | 52,359,654 | |
| Emerging Markets Equity Advantage | | | 28,454,197 | | | | 16,170,467 | |
| Emerging Markets Equity Blend | | | 39,491,384 | | | | 65,261,717 | |
| Emerging Markets Equity | | | 1,959,711,338 | | | | 4,476,296,943 | |
| Equity Franchise | | | 78,319,848 | | | | 42,735,248 | |
| Global Equity Select | | | 60,722,252 | | | | 67,460,794 | |
| Global Listed Infrastructure | | | 2,685,868,769 | | | | 3,207,635,341 | |
| Global Strategic Equity | | | 2,149,499 | | | | 1,997,541 | |
| International Equity Advantage | | | 2,517,771 | | | | 2,488,071 | |
280 Annual Report
| Portfolio | | Purchases | | Sales |
| | | | | | | | | |
| International Equity Concentrated | | $ | 48,415,298 | | | $ | 111,267,230 | |
| International Equity | | | 983,955,819 | | | | 988,216,631 | |
| International Equity Select | | | 28,150,631 | | | | 33,308,268 | |
| International Equity Value | | | 2,765,544 | | | | 12,782,751 | |
| International Quality Growth | | | 5,441,777 | | | | 683,313 | |
| International Small Cap Equity | | | 21,643,840 | | | | 40,244,413 | |
| International Strategic Equity | | | 1,944,955,570 | | | | 2,692,591,169 | |
| Managed Equity Volatility | | | 40,798,118 | | | | 46,987,463 | |
| US Equity Concentrated | | | 1,037,827,468 | | | | 704,813,928 | |
| US Equity Focus | | | 24,676,489 | | | | 22,372,552 | |
| US Small-Mid Cap Equity | | | 83,582,411 | | | | 107,445,525 | |
| US Sustainable Equity | | | 10,074,230 | | | | 475,533 | |
For the year ended December 31, 2020, the Portfolios did not engage in any cross-trades in accordance with Rule 17a-7 under the 1940 Act, and no brokerage commissions were paid to affiliates of the Investment Manager or other affiliates of the Fund for portfolio transactions executed on behalf of the Fund.
At December 31, 2020, the Investment Manager owned 89.87%, 92.18%, 87.37%, 42.89% and 52.80% of the outstanding shares of the Global Strategic Equity, International Equity Advantage, International Equity Value, International Quality Growth and US Sustainable Equity Portfolios, respectively.
Holdings of 5% Voting Securities of Portfolio Companies The 1940 Act defines “affiliated persons” to include a portfolio company in which a Portfolio owns 5% or more of the outstanding voting securities. Investments in “affiliated persons” for the Global Listed Infrastructure Portfolio for the year ended December 31, 2020 were as follows:
| Issue | | Value at
December 31, 2019 | | Purchase
cost | | Sales
proceeds | | Realized
gain (loss) |
| | | | | | | | | |
| Global Listed Infrastructure | | | | | | | | | | | | | | | |
| Atlas Arteria, Ltd. | | $ | 178,635,535 | | | $ | 71,231,023 | | | $ | — | | | $ | — | |
| Pennon Group PLC | | | 248,515,390 | | | | 42,000,457 | | | | — | | | | — | |
| SES SA | | | 255,862,642 | | | | 20,542,754 | | | | (7,442,627 | ) | | | (12,355,921 | ) |
| Total Securities | | $ | 683,013,567 | | | $ | 133,774,234 | | | $ | (7,442,627 | ) | | $ | (12,355,921 | ) |
Annual Report 281
| Issue | | Change in unrealized
appreciation
(depreciation) | | Dividend
income | | Shares at
December 31,
2020 | | Values at
December 31,
2020 |
| | | | | | | | | | | | | | | |
| Global Listed Infrastructure | | | | | | | | | | | | | | |
| Atlas Arteria, Ltd. | | $ | (4,503,295 | ) | | $ | 3,772,596 | | | | 48,907,421 | | | $ | 245,363,263 | |
| Pennon Group PLC | | | (11,424,179 | ) | | | 11,458,588 | | | | 21,423,608 | | | | 279,091,668 | |
| SES SA | | | (62,042,713 | ) | | | 7,569,638 | | | | 20,569,089 | | | | 194,564,135 | |
| Total Securities | | $ | (77,970,187 | ) | | $ | 22,800,822 | | | | 90,900,118 | | | $ | 719,019,066 | |
During the year ended December 31, 2020, the Investment Manager initiated a voluntary reimbursement payment to the International Equity Value Portfolio $88,959 for realized investment losses incurred.
6. Line of Credit
The Fund has a $100 million committed line of credit pursuant to an Amended and Restated Loan Agreement (the “Agreement”) with State Street, primarily for temporary or emergency purposes, including the meeting of redemption requests that otherwise might require the untimely disposition of securities. Interest on borrowings is payable at 1.00% plus the “Applicable Rate,” which is the higher of (a) the Federal Funds Rate plus 10 basis points and (b) the Overnight Bank Funding Rate (OBFR) plus 10 basis points, on an annualized basis. Under the Agreement, the Fund has agreed to pay a 0.20% per annum fee on the unused portion of the commitment, payable quarterly in arrears. The Fund has also agreed to pay an upfront fee of 0.05% of the committed line amount. During the year ended December 31, 2020, the following Portfolios had borrowings under the Agreement as follows:
| Portfolio | | Average
Daily Loan
Balance* | | | Maximum
Daily Loan
Outstanding | | | Weighted
Average
Interest
Rate | | Number
of Days
Borrowings
were Outstanding |
| | | | | | | | | | | | | | | | | |
| Developing Markets Equity | | $ | 747,692 | | | $ | 1,750,000 | | | | 1.84 | % | | | 13 | |
| Emerging Markets Core Equity | | | 771,548 | | | | 3,400,000 | | | | 1.60 | | | | 42 | |
| Emerging Markets Equity Advantage | | | 65,091 | | | | 255,000 | | | | 1.83 | | | | 11 | |
| Emerging Markets Equity Blend | | | 708,250 | | | | 3,425,000 | | | | 1.28 | | | | 20 | |
| Emerging Markets Equity | | | 3,858,333 | | | | 6,255,000 | | | | 1.17 | | | | 3 | |
| Equity Franchise | | | 7,131,000 | | | | 11,375,000 | | | | 1.20 | | | | 5 | |
| Global Equity Select | | | 2,983,333 | | | | 6,490,000 | | | | 1.89 | | | | 6 | |
| International Equity Concentrated | | | 1,239,608 | | | | 13,037,770 | | | | 1.19 | | | | 29 | |
282 Annual Report
| Portfolio | | Average
Daily Loan
Balance* | | | Maximum
Daily Loan
Outstanding | | | Weighted
Average
Interest
Rate | | Number
of Days
Borrowings
were Outstanding |
| | | | | | | | | | | | | | | | | |
| International Equity Value | | $ | 586,667 | | | $ | 3,320,000 | | | | 2.68 | | | | 6 | |
| International Small Cap Equity | | | 352,714 | | | | 3,705,000 | | | | 1.37 | | | | 35 | |
| International Strategic Equity | | | 46,760,000 | | | | 90,405,000 | | | | 1.17 | | | | 5 | |
| Managed Equity Volatility | | | 2,108,000 | | | | 3,600,000 | | | | 1.16 | | | | 10 | |
| US Equity Concentrated | | | 8,725,000 | | | | 11,860,000 | | | | 1.87 | | | | 6 | |
| * | For days borrowings were outstanding. |
Management believes that the fair value of the liabilities under the Agreement is equivalent to the recorded amount based on its short-term maturity and interest rate, which fluctuates with the Applicable rate. A Portfolio’s outstanding balance under the Agreement, if any, would be categorized as Level 2.
7. Investment Risks
Not all risks described below apply to all Portfolios, or may not apply to the same degree for one or more Portfolios compared to one or more other Portfolios. In addition, not all risks applicable to an investment in a Portfolio are described below. Please see the current summary prospectus for the relevant Portfolio(s) or a current Portfolio prospectus for further information regarding a Portfolio’s investment strategy and related risks.
(a) Market Risk—A Portfolio may incur losses due to declines in one or more markets in which it invests. These declines may be the result of, among other things, political, regulatory, market, economic or social developments affecting the relevant market(s). To the extent that such developments impact specific industries, market sectors, countries or geographic regions, a Portfolio’s investments in such industries, market sectors, countries and/or geographic regions can be expected to be particularly affected, especially if such investments are a significant portion of its investment portfolio. In addition, turbulence in financial markets and reduced liquidity in equity, credit and/or fixed income markets may negatively affect many issuers, which could adversely affect a Portfolio. Global economies and financial markets are increasingly interconnected, and conditions and events in one country, region
Annual Report 283
or financial market may adversely impact issuers worldwide. As a result, local, regional or global events such as war, acts of terrorism, the spread of infectious illness or other public health issues, recessions or other events could have a significant negative impact on global economic and market conditions. The coronavirus disease 2019 (COVID-19) global pandemic and the aggressive responses taken by many governments or voluntarily imposed by private parties, including closing borders, restricting travel and imposing prolonged quarantines or similar restrictions, as well as the closure of, or operational changes to, many retail and other businesses, has had negative impacts, and in many cases severe negative impacts, on markets worldwide. It is not known how long such impacts, or any future impacts of other significant events described above, will or would last, but there could be a prolonged period of global economic slowdown, which may be expected to impact a Portfolio and its investments.
(b) Non-US Securities Risk—A Portfolio’s performance will be influenced by political, social and economic factors affecting the non-US countries and companies in which the Portfolio invests. Non-US securities carry special risks, such as less developed or less efficient trading markets, political instability, a lack of company information, differing auditing and legal standards, and, potentially, less liquidity.
(c) Emerging Market Risk—Emerging market countries generally have economic structures that are less diverse and mature, and political systems that are less stable, than those of developed countries. The economies of countries with emerging markets may be based predominantly on only a few industries, may be highly vulnerable to changes in local or global trade conditions, and may suffer from extreme debt burdens or volatile inflation rates. The securities markets of emerging market countries have historically been extremely volatile. These market conditions may continue or worsen. Significant devaluation of emerging market currencies against the US dollar may occur subsequent to acquisition of investments denominated in emerging market currencies.
284 Annual Report
(d) Foreign Currency Risk— Investments denominated in currencies other than US dollars may experience a decline in value, in US dollar terms, due solely to fluctuations in currency exchange rates. A Portfolio’s investments denominated in such currencies (particularly currencies of emerging markets countries), as well as any investments in currencies themselves, could be adversely affected by delays in, or a refusal to grant, repatriation of funds or conversion of currencies. Irrespective of any foreign currency exposure hedging, a Portfolio may experience a decline in the value of its portfolio securities, in US dollar terms, due solely to fluctuations in currency exchange rates.
(e) Forward Currency Contracts and Currency Hedging Risk— Forward currency contracts, including those entered into for hedging purposes (i.e., seeking to protect Portfolio investments), may increase volatility, reduce returns, limit gains or magnify losses, perhaps substantially, particularly since forward currency contracts, like most derivative instruments, have a leverage component that provides investment exposure in excess of the amount invested. Forward currency contacts are subject to the risks of the creditworthiness of and default by the counterparty and consequently may lose all of a portion of their value due solely to the creditworthiness of or default by the counterparty. Forward currency contracts also may be illiquid. Changes in liquidity may result in significant, rapid and unpredictable changes in the value of such contracts. Forward currency contracts are subject to many of the risks of, and can be highly sensitive to changes in the value of, the related currencies. As such, a small investment could have a potentially large impact on a Portfolio’s performance. Forward currency contracts incur costs, which reduce returns, and costs of engaging in such transactions may outweigh any gains or any losses averted from hedging activities. Successful use of forward currency contracts, whether for hedging or for other investment purposes, is subject to the Investment Manager’s ability to accurately predict movements in currency exchange rates and, for hedging transactions, there may be imperfect correlations between movements in exchange rates that could cause a Portfolio to incur significant losses. Use of forward currency contracts, even if entered into for hedging
Annual Report 285
purposes, may cause a Portfolio to experience losses greater than if the Portfolio had not engaged in such transactions.
(f) Country Risk—Implementation of certain Portfolios’ investment strategy may, during certain periods, result in the investment of a significant portion of such Portfolios’ assets in a particular country, such as China or Japan, and a Portfolio would be expected to be affected by political, regulatory, market, economic and social developments affecting that country.
Specific risks associated with investments in China include exposure to currency fluctuations, less liquidity, expropriation, confiscatory taxation, nationalization, exchange control regulations (including currency blockage), trading halts, imposition of tariffs, limitations on repatriation and differing legal standards. Certain Portfolios may invest in eligible renminbi-denominated class A shares of equity securities that are listed and traded on certain Chinese stock exchanges (“China A-Shares”) through Hong Kong Stock Connect Program (“Stock Connect”). While Stock Connect is not subject to individual investment quotas, daily and aggregate investment quotas apply to all Stock Connect participants, which may restrict or preclude a Portfolio’s ability to invest in China A-Shares (although the Portfolio would be permitted to sell China A-Shares regardless of the quota balance). Stock Connect is also subject to trading, clearance, settlement and operational risks.
Over the last few decades, Japan’s economic growth rate had remained relatively low compared to that of its Asian neighbors and other major developed economies mainly due to deflation. Japan has few natural resources and limited land area and is reliant on imports for its commodity needs. Fluctuations or shortages in relevant commodity markets could have a negative impact on Japan’s economy. The Japanese economy also can be adversely affected by trade tariffs, other protectionist measures, competition from emerging economies, and the economic conditions of its trading partners. Japan has a growing economic relationship with China and other Southeast Asian countries, and economic, political or social instability in those countries could have an adverse effect on Japan’s economy. The Japanese yen has
286 Annual Report
fluctuated widely at times, and any increase in the yen’s value may cause a decline in Japan’s exports.
(g) Sector Risk—Implementation of certain Portfolios’ investment strategy may, during certain periods, result in the investment of a significant portion of such Portfolios’ assets in a particular market sector, and a Portfolio would be expected to be affected by developments in that sector.
(h) Franchise Companies Risk—Changes in the worldwide economy, consumer spending, competition, demographics and consumer preferences, government regulation and economic conditions may adversely affect franchise companies individually or across an industry and may negatively impact a Portfolio to a greater extent than if the Portfolio’s assets were invested more broadly in a number of types of companies.
(i) Infrastructure Companies Risk—Securities and instruments of infrastructure companies are more susceptible to adverse economic or regulatory occurrences affecting their industries. Infrastructure companies may be subject to a variety of factors that may adversely affect their business or operations, including high interest costs in connection with capital construction programs, high leverage, costs associated with environmental and other regulations, the effects of economic slowdown, surplus capacity, increased competition from other providers of services, uncertainties concerning the availability of fuel at reasonable prices, the effects of energy conservation policies and other factors. Infrastructure companies also may be affected by or subject to, among other factors, regulation by various government authorities, including rate regulation and service interruption due to environmental, operational or other mishaps.
(j) Sustainable Investing Risk—An investment strategy focused on (a) the financial sustainability of a company as a business—a company whose financial productivity is likely to be supported or enhanced in the future as a result of the move toward a more sustainable world (such as by considering the nature of the products and/or services that the company provides, from the perspective of environmental and social factors that impact
Annual Report 287
financial productivity)—and (b) how the company counters potential risks arising as a result of environmental and social concerns that may be material to the particular companies or the industries or sectors in which they operate (collectively, “Sustainable Companies”) may cause the Investment Manager to forgo investments that the Investment Manager otherwise believes may be attractive but that are not considered to be Sustainable Companies.
(k) Other Equity Securities Risk—Investments in rights and warrants involve certain risks, including the possible lack of a liquid market for resale, price fluctuations and the failure of the price of the underlying security to reach a level at which the right or warrant can be prudently exercised, in which case the right or warrant may expire without being exercised and result in a loss of a Portfolio’s entire investment.
(l) Depositary Receipts Risk—ADRs and similar depositary receipts typically will be subject to certain of the risks associated with direct investments in the securities of non-US companies, because their values depend on the performance of the underlying non-US securities. However, currency fluctuations will impact investments in depositary receipts differently than direct investments in non-US dollar-denominated non-US securities, because a depositary receipt will not appreciate in value solely as a result of appreciation in the currency in which the underlying non-US dollar security is denominated.
(m) REIT Risk—REITs are subject to similar risks as an investment in a realty-related company. The risks related to investments in realty-related companies include, but are not limited to: adverse changes in general economic and local market conditions; adverse developments in employment; changes in supply or demand for similar or competing properties; unfavorable changes in applicable taxes, governmental regulations and interest rates; operating or development expenses; and lack of available financing. Due to certain special considerations that apply to REITs, investments in REITs may carry additional risks not necessarily present in investments in other securities. REIT securities (including those trading on national exchanges) typically have trading volumes that
288 Annual Report
are less than those of other types of stocks traded on national exchanges, which may affect a Portfolio’s ability to trade or liquidate those securities. An investment in REITs may be adversely affected if the REIT fails to comply with applicable laws and regulations, including failing to qualify as a REIT under the Code. Failure to qualify with any of these requirements could jeopardize a company’s status as a REIT. A Portfolio generally will have no control over the operations and policies of a REIT, and the Portfolio generally will have no ability to cause a REIT to take the actions necessary to qualify as a REIT.
(n) ETF Risk—Shares of ETFs may trade at prices that vary from their net asset values, sometimes significantly. The shares of ETFs may trade at prices at, below or above their most recent net asset value. In addition, the performance of an ETF pursuing a passive index-based strategy may diverge from the performance of the index. A Portfolio’s investments in ETFs are subject to the risks of such ETF’s investments, as well as to the general risks of investing in ETFs. A Portfolio investing in ETFs will bear not only the Portfolio’s management fees and operating expenses, but also the Portfolio’s proportional share of the management fees and operating expenses of the ETFs in which the Portfolio invests. A Portfolio may be limited by the 1940 Act in the amount of its assets that may be invested in ETFs unless an ETF has received an exemptive order from the SEC on which the Portfolio may rely or an exemption is available.
(o) Non-Diversification Risk—The net asset value of a Portfolio that is classified as “non-diversified” may be more vulnerable to changes in the market value of a single issuer or group of issuers and may be relatively more susceptible to adverse effects from any single corporate, industry, economic, market, political or regulatory occurrence than if the Portfolio’s investments consisted of securities issued by a larger number of issuers.
(p) Cybersecurity Risk—The Portfolios and their service providers are susceptible to operational and information security and related risks of cybersecurity incidents. Cybersecurity attacks include, but are not limited to, gaining unauthorized access to digital systems (e.g., through “hacking” or malicious software coding) for purposes
Annual Report 289
of misappropriating assets or sensitive information, corrupting data or causing operational disruption. Cybersecurity incidents affecting the Investment Manager, transfer agent or custodian or other service providers such as financial intermediaries have the ability to cause disruptions and impact business operations, potentially resulting in financial losses, including by impediments to a Portfolio’s investment trading; the inability of Portfolio shareholders to purchase and redeem Portfolio shares; interference with a Portfolio’s ability to calculate its NAV; violations of applicable privacy, data security or other laws; regulatory fines and penalties; reputational damage; reimbursement or other compensation or remediation costs; legal fees; or additional compliance costs. Similar adverse consequences could result from cybersecurity incidents affecting issuers of securities in which a Portfolio invests; counterparties with which a Portfolio engages in transactions; governmental and other regulatory authorities, exchange and other financial market operators; and banks, brokers, dealers, insurance companies and other financial institutions and other parties. There are inherent limitations in any cybersecurity risk management systems or business continuity plans, including the possibility that certain risks have not been identified.
(q) Other Risk—On November 12, 2020, the President of the United States issued an Executive Order (the “Order”) to prohibit, beginning January 11, 2021, US persons (which includes the Fund) from transacting in certain securities and derivatives of publicly traded securities of any company designated as a “Communist Chinese military company” (collectively with securities of certain subsidiaries of such companies and related depositary receipts that may be covered by the Order, “CCMC Securities”) by the US Department of Defense or the US Department of the Treasury’s Office of Foreign Assets Control (“OFAC”), unless such transactions are for purposes of divestment and occur through November 11, 2021. In addition, US persons also are prohibited from transacting in CCMC Securities designated as such 60 days after such designation.
OFAC subsequently published, on several occasions, guidance regarding compliance with the Order, including several “Frequently Asked Questions” (FAQs)-style publications addressing the scope of, and interpretive matters regarding, compliance with the Order, as
290 Annual Report
well as the Order’s application to US funds that hold CCMC Securities (i.e., including mutual funds that hold CCMC Securities regardless of the size of the position relative to a fund’s total assets). Certain interpretive issues related to compliance with the Order remain open, including to what extent a US person could be held liable for failing to identify an unlisted entity whose name “closely matches the name” of an entity designated as a Communist Chinese military company.
A Portfolio’s holdings in CCMC Securities may adversely impact the Portfolio’s performance. The extent of any impact will depend on future developments, including the Portfolio’s ability to sell the CCMC Securities, valuation of the CCMC Securities, modifications to the Order, the issuance of additional or different interpretive guidance regarding compliance with the Order, and the duration of the Order, all of which are highly uncertain. Fund management will continue to monitor developments relating to the Order.
8. Contractual Obligations
The Fund enters into contracts in the normal course of business that contain a variety of indemnification provisions. A Portfolio’s maximum exposure under these arrangements is unknown. Management has reviewed the Fund’s existing contracts and expects the risk of loss to be remote.
9. Fair Value Measurements
Fair value is defined as the price that a Portfolio would receive to sell an asset, or would pay to transfer a liability, in an orderly transaction between market participants at the date of measurement. The Fair Value Measurements and Disclosures provisions of GAAP also establish a framework for measuring fair value, and a three-level hierarchy for fair value measurement that is based upon the transparency of inputs to the valuation of an asset or liability. Inputs may be observable or unobservable and refer, broadly, to the assumptions that market participants would use in pricing the asset or liability. Observable inputs reflect the assumptions that market participants would use in pricing the asset or liability based on market data obtained from sources independent of the Fund. Unobservable inputs reflect the Fund’s
Annual Report 291
own assumptions about the assumptions that market participants would use in pricing the asset or liability, developed based on the best information available in the circumstances. The fair value measurement level within the fair value hierarchy for the assets and liabilities of the Fund is based on the lowest level of any input that is significant to the overall fair value measurement. The three-level hierarchy of inputs is summarized below:
| • | Level 1 – unadjusted quoted prices in active markets for identical assets and liabilities |
| • | Level 2 – other significant observable inputs (including unadjusted quoted prices for similar assets and liabilities, interest rates, prepayment speeds, credit risk, etc.) |
| • | Level 3 – significant unobservable inputs (including the Fund’s own assumptions in determining the fair value of assets and liabilities) |
Changes in valuation methodology or input may result in transfers into or out of the current assigned level within the hierarchy.
The inputs or methodology used for valuing securities are not necessarily an indication of the risks associated with investing in these securities.
292 Annual Report
The following table summarizes the valuation of the Portfolios’ assets and liabilities by each fair value hierarchy level as of December 31, 2020:
| Description | Unadjusted
Quoted Prices in
Active Markets for
Identical
Assets
and Liabilities
(Level 1) | | Significant
Other
Observable
Inputs
(Level 2) | | Significant
Unobservable
Inputs
(Level 3) | | Balance as of
December 31, 2020 |
| | | | | | | | | | | | | | | | | |
| Developing Markets Equity Portfolio | | | | | | | | | | | | |
| Common Stocks* | | | | | | | | | | | | | | | | |
| Brazil | | $ | 1,578,648 | | | $ | 9,708,839 | | | $ | — | | | $ | 11,287,487 | |
| Canada | | | 4,243,523 | | | | — | | | | — | | | | 4,243,523 | |
| China | | | 21,011,397 | | | | 35,500,418 | | | | — | | | | 56,511,815 | |
| Colombia | | | 4,211,949 | | | | — | | | | — | | | | 4,211,949 | |
| Hong Kong | | | — | | | | 4,381,958 | | | | — | | | | 4,381,958 | |
| India | | | 10,173,811 | | | | 7,997,185 | | | | — | | | | 18,170,996 | |
| Indonesia | | | — | | | | 6,009,496 | | | | — | | | | 6,009,496 | |
| Macau | | | — | | | | 2,475,927 | | | | — | | | | 2,475,927 | |
| Mexico | | | 4,433,533 | | | | — | | | | — | | | | 4,433,533 | |
| Peru | | | 2,534,765 | | | | — | | | | — | | | | 2,534,765 | |
| Philippines | | | — | | | | 3,724,483 | | | | — | | | | 3,724,483 | |
| Russia | | | 1,310,261 | | | | 7,055,861 | | | | — | | | | 8,366,122 | |
| South Africa | | | — | | | | 7,066,226 | | | | — | | | | 7,066,226 | |
| South Korea | | | — | | | | 29,865,732 | | | | — | | | | 29,865,732 | |
| Taiwan | | | 1,770,813 | | | | 27,133,442 | | | | — | | | | 28,904,255 | |
| United Kingdom | | | — | | | | 2,127,367 | | | | — | | | | 2,127,367 | |
| Preferred Stocks* | | | | | | | | | | | | | | | | |
| Brazil | | | 4,954,683 | | | | — | | | | — | | | | 4,954,683 | |
| Short-Term Investments | | | 2,209,385 | | | | — | | | | — | | | | 2,209,385 | |
| Total | | $ | 58,432,768 | | | $ | 143,046,934 | | | $ | — | | | $ | 201,479,702 | |
Annual Report 293
| Description | Unadjusted
Quoted Prices in
Active Markets for
Identical
Assets
and Liabilities
(Level 1) | | Significant
Other
Observable
Inputs
(Level 2) | | Significant
Unobservable
Inputs
(Level 3) | | Balance as of
December 31, 2020 |
| | | | | | | | | | | | | |
| Emerging Markets Core Equity Portfolio | | | | | | | | | | | | |
| Common Stocks* | | | | | | | | | | | | | | | | |
| Argentina | | $ | 2,320,180 | | | $ | — | | | $ | — | | | $ | 2,320,180 | |
| Brazil | | | 2,345,100 | | | | 10,995,076 | | | | — | | | | 13,340,176 | |
| Canada | | | 1,458,940 | | | | — | | | | — | | | | 1,458,940 | |
| China | | | 25,503,847 | | | | 50,365,561 | | | | — | | | | 75,869,408 | |
| Hong Kong | | | — | | | | 5,308,911 | | | | — | | | | 5,308,911 | |
| India | | | 10,437,072 | | | | 10,605,405 | | | | — | | | | 21,042,477 | |
| Indonesia | | | 1,168,544 | | | | 1,807,066 | | | | — | | | | 2,975,610 | |
| Luxembourg | | | 2,717,497 | | | | — | | | | — | | | | 2,717,497 | |
| Mexico | | | 5,826,574 | | | | — | | | | — | | | | 5,826,574 | |
| Philippines | | | — | | | | 1,948,843 | | | | — | | | | 1,948,843 | |
| Poland | | | — | | | | 4,218,689 | | | | — | | | | 4,218,689 | |
| Russia | | | 778,389 | | | | 7,427,998 | | | | — | | | | 8,206,387 | |
| South Africa | | | — | | | | 5,674,493 | | | | — | | | | 5,674,493 | |
| South Korea | | | — | | | | 25,773,562 | | | | — | | | | 25,773,562 | |
| Taiwan | | | 20,939,823 | | | | 4,932,187 | | | | — | | | | 25,872,010 | |
| Turkey | | | — | | | | 1,758,148 | | | | — | | | | 1,758,148 | |
| United Kingdom | | | 3,291,431 | | | | — | | | | — | | | | 3,291,431 | |
| United States | | | 1,736,449 | | | | — | | | | — | | | | 1,736,449 | |
| Preferred Stocks* | | | | | | | | | | | | | | | | |
| Brazil | | | 1,682,734 | | | | — | | | | — | | | | 1,682,734 | |
| Short-Term Investments | | | 1,681,375 | | | | — | | | | — | | | | 1,681,375 | |
| Total | | $ | 81,887,955 | | | $ | 130,815,939 | | | $ | — | | | $ | 212,703,894 | |
294 Annual Report
| Description | | Unadjusted
Quoted Prices in
Active Markets for
Identical
Assets
and Liabilities
(Level 1) | | Significant
Other
Observable
Inputs
(Level 2) | | Significant
Unobservable
Inputs
(Level 3) | | Balance as of
December 31, 2020 |
| | | | | | | | | | | | | | | | | | |
| Emerging Markets Equity Advantage Portfolio | | | | | | | | | | | | | | | | | |
| Common Stocks* | | | | | | | | | | | | | | | | | |
| Argentina | | | $ | 62,672 | | | $ | — | | | $ | — | | | $ | 62,672 | |
| Brazil | | | | 74,399 | | | | 1,008,175 | | | | — | | | | 1,082,574 | |
| China | | | | 3,252,005 | | | | 7,702,212 | | | | — | | | | 10,954,217 | |
| Greece | | | | — | | | | 168,528 | | | | — | | | | 168,528 | |
| Hong Kong | | | | — | | | | 46,358 | | | | — | | | | 46,358 | |
| Hungary | | | | — | | | | 238,771 | | | | — | | | | 238,771 | |
| India | | | | 1,730,898 | | | | 367,541 | | | | — | | | | 2,098,439 | |
| Indonesia | | | | 73,712 | | | | 367,645 | | | | — | | | | 441,357 | |
| Malaysia | | | | — | | | | 507,658 | | | | — | | | | 507,658 | |
| Mexico | | | | 779,281 | | | | — | | | | — | | | | 779,281 | |
| Philippines | | | | — | | | | 141,422 | | | | — | | | | 141,422 | |
| Poland | | | | — | | | | 457,349 | | | | — | | | | 457,349 | |
| Russia | | | | 51,350 | | | | 952,871 | | | | — | | | | 1,004,221 | |
| South Africa | | | | — | | | | 687,274 | | | | — | | | | 687,274 | |
| South Korea | | | | 197,644 | | | | 4,131,145 | | | | — | | | | 4,328,789 | |
| Taiwan | | | | 2,126,062 | | | | 2,143,215 | | | | — | | | | 4,269,277 | |
| Thailand | | | | — | | | | 588,014 | | | | — | | | | 588,014 | |
| Turkey | | | | — | | | | 238,873 | | | | — | | | | 238,873 | |
| United States | | | | 85,635 | | | | — | | | | — | | | | 85,635 | |
| Preferred Stocks* | | | | | | | | | | | | | | | | | |
| Brazil | | | | 123,516 | | | | — | | | | — | | | | 123,516 | |
| Short-Term Investments | | | | 124,214 | | | | — | | | | — | | | | 124,214 | |
| Total | | | $ | 8,681,388 | | | $ | 19,747,051 | | | $ | — | | | $ | 28,428,439 | |
Annual Report 295
| Description | | Unadjusted
Quoted Prices in
Active Markets for
Identical
Assets
and Liabilities
(Level 1) | | Significant
Other
Observable
Inputs
(Level 2) | | Significant
Unobservable
Inputs
(Level 3) | | Balance as of
December 31, 2020 |
| | | | | | | | | | |
| Emerging Markets Equity Blend | | | | | | | | | | | | | | | | | |
| Common Stocks* | | | | | | | | | | | | | | | | | |
| Brazil | | | $ | 1,040,563 | | | $ | 2,829,766 | | | $ | — | | | $ | 3,870,329 | |
| Canada | | | | 1,786,407 | | | | — | | | | — | | | | 1,786,407 | |
| Chile | | | | 318,554 | | | | — | | | | — | | | | 318,554 | |
| China | | | | 4,856,466 | | | | 12,331,102 | | | | — | | | | 17,187,568 | |
| Colombia | | | | 1,213,757 | | | | — | | | | — | | | | 1,213,757 | |
| Czech Republic | | | | — | | | | 228,889 | | | | — | | | | 228,889 | |
| Egypt | | | | — | | | | 808,996 | | | | — | | | | 808,996 | |
| Estonia | | | | — | | | | 191,549 | | | | — | | | | 191,549 | |
| Georgia | | | | — | | | | 417,998 | | | | — | | | | 417,998 | |
| Greece | | | | — | | | | 267,407 | | | | — | | | | 267,407 | |
| Hong Kong | | | | — | | | | 1,883,213 | | | | — | | | | 1,883,213 | |
| Hungary | | | | — | | | | 982,643 | | | | — | | | | 982,643 | |
| India | | | | 2,764,601 | | | | 5,206,348 | | | | — | | | | 7,970,949 | |
| Indonesia | | | | 598,325 | | | | 2,810,020 | | | | — | | | | 3,408,345 | |
| Kenya | | | | — | | | | 154,692 | | | | — | | | | 154,692 | |
| Kuwait | | | | — | | | | 219,325 | | | | — | | | | 219,325 | |
| Mexico | | | | 4,364,125 | | | | — | | | | — | | | | 4,364,125 | |
| Oman | | | | — | | | | 163,020 | | | | — | | | | 163,020 | |
| Pakistan | | | | — | | | | 194,054 | | | | — | | | | 194,054 | |
| Poland | | | | — | | | | 232,842 | | | | — | | | | 232,842 | |
| Russia | | | | 3,281,832 | | | | 1,118,964 | | | | — | | | | 4,400,796 | |
| South Africa | | | | — | | | | 591,754 | | | | — | | | | 591,754 | |
| South Korea | | | | — | | | | 15,980,966 | | | | — | | | | 15,980,966 | |
| Taiwan | | | | 860,296 | | | | 6,213,245 | | | | — | | | | 7,073,541 | |
| Thailand | | | | — | | | | 167,651 | | | | — | | | | 167,651 | |
| Ukraine | | | | — | | | | 200,575 | | | | — | | | | 200,575 | |
| United Kingdom | | | | 781,170 | | | | — | | | | — | | | | 781,170 | |
| Preferred Stocks* | | | | | | | | | | | | | | | | | |
| Brazil | | | | 898,082 | | | | — | | | | — | | | | 898,082 | |
| Short-Term Investments | | | | 2,612,365 | | | | — | | | | — | | | | 2,612,365 | |
| Total | | | $ | 25,376,543 | | | $ | 53,195,019 | | | $ | — | | | $ | 78,571,562 | |
296 Annual Report
| Description | | Unadjusted
Quoted Prices in
Active Markets for
Identical
Assets
and Liabilities
(Level 1) | | Significant
Other
Observable
Inputs
(Level 2) | | Significant
Unobservable
Inputs
(Level 3) | | Balance as of
December 31, 2020 |
| | | | | | | | | | |
| Emerging Markets Equity Portfolio | | | | | | | | | | | | | | | | | |
| Common Stocks* | | | | | | | | | | | | | | | | | |
| Brazil | | | $ | — | | | $ | 231,820,879 | | | $ | — | | | $ | 231,820,879 | |
| China | | | | 119,265,776 | | | | 672,439,756 | | | | — | | | | 791,705,532 | |
| Egypt | | | | — | | | | 34,417,818 | | | | — | | | | 34,417,818 | |
| Hong Kong | | | | — | | | | 51,847,292 | | | | — | | | | 51,847,292 | |
| Hungary | | | | — | | | | 112,961,769 | | | | — | | | | 112,961,769 | |
| India | | | | 65,982,689 | | | | 418,664,943 | | | | — | | | | 484,647,632 | |
| Indonesia | | | | 61,919,622 | | | | 119,350,092 | | | | — | | | | 181,269,714 | |
| Luxembourg | | | | 38,121,466 | | | | — | | | | — | | | | 38,121,466 | |
| Mexico | | | | 238,764,825 | | | | — | | | | — | | | | 238,764,825 | |
| Portugal | | | | — | | | | 36,252,041 | | | | — | | | | 36,252,041 | |
| Russia | | | | 55,120,275 | | | | 304,767,358 | | | | — | | | | 359,887,633 | |
| South Africa | | | | — | | | | 281,955,684 | | | | — | | | | 281,955,684 | |
| South Korea | | | | — | | | | 706,843,820 | | | | — | | | | 706,843,820 | |
| Taiwan | | | | — | | | | 303,088,612 | | | | — | | | | 303,088,612 | |
| Thailand | | | | — | | | | 73,785,911 | | | | — | | | | 73,785,911 | |
| United Kingdom | | | | 85,724,716 | | | | 48,312,978 | | | | — | | | | 134,037,694 | |
| Exchange-Traded Funds | | | | 216,441,506 | | | | — | | | | — | | | | 216,441,506 | |
| Short-Term Investments | | | | 78,259,363 | | | | — | | | | — | | | | 78,259,363 | |
| Total | | | $ | 959,600,238 | | | $ | 3,396,508,953 | | | $ | — | | | $ | 4,356,109,191 | |
| | | | | | | | | | | | | | | | | | |
| Equity Franchise Portfolio | | | | | | | | | | | | | | | | | |
| Common Stocks* | | | | | | | | | | | | | | | | | |
| Belgium | | | $ | — | | | $ | 1,739,725 | | | $ | — | | | $ | 1,739,725 | |
| France | | | | — | | | | 6,518,912 | | | | — | | | | 6,518,912 | |
| Germany | | | | — | | | | 3,623,951 | | | | — | | | | 3,623,951 | |
| Italy | | | | — | | | | 4,368,373 | | | | — | | | | 4,368,373 | |
| Luxembourg | | | | — | | | | 3,603,607 | | | | — | | | | 3,603,607 | |
| Spain | | | | — | | | | 2,765,141 | | | | — | | | | 2,765,141 | |
| United Kingdom | | | | — | | | | 4,085,005 | | | | — | | | | 4,085,005 | |
| United States | | | | 59,516,529 | | | | — | | | | — | | | | 59,516,529 | |
| Short-Term Investments | | | | 5,598,898 | | | | — | | | | — | | | | 5,598,898 | |
| Total | | | $ | 65,115,427 | | | $ | 26,704,714 | | | $ | — | | | $ | 91,820,141 | |
Annual Report 297
| Description | | Unadjusted
Quoted Prices in
Active Markets for
Identical
Assets
and Liabilities
(Level 1) | | Significant
Other
Observable
Inputs
(Level 2) | | Significant
Unobservable
Inputs
(Level 3) | | Balance as of
December 31, 2020 |
| | | | | | | | | | |
| Global Equity Select Portfolio | | | | | | | | | | | | | | | | | |
| Common Stocks* | | | | | | | | | | | | | | | | | |
| Canada | | | $ | 4,791,788 | | | $ | — | | | $ | — | | | $ | 4,791,788 | |
| China | | | | 1,998,918 | | | | 2,149,857 | | | | — | | | | 4,148,775 | |
| Denmark | | | | — | | | | 1,056,512 | | | | — | | | | 1,056,512 | |
| France | | | | — | | | | 2,154,240 | | | | — | | | | 2,154,240 | |
| Germany | | | | — | | | | 2,744,047 | | | | — | | | | 2,744,047 | |
| Hong Kong | | | | — | | | | 4,326,958 | | | | — | | | | 4,326,958 | |
| Japan | | | | — | | | | 3,356,641 | | | | — | | | | 3,356,641 | |
| Netherlands | | | | 1,149,960 | | | | 2,377,971 | | | | — | | | | 3,527,931 | |
| South Korea | | | | — | | | | 1,272,125 | | | | — | | | | 1,272,125 | |
| Spain | | | | — | | | | 893,293 | | | | — | | | | 893,293 | |
| Sweden | | | | — | | | | 3,692,145 | | | | — | | | | 3,692,145 | |
| Switzerland | | | | — | | | | 2,417,891 | | | | — | | | | 2,417,891 | |
| Taiwan | | | | 2,076,122 | | | | — | | | | — | | | | 2,076,122 | |
| United Kingdom | | | | 1,028,990 | | | | 8,930,603 | | | | — | | | | 9,959,593 | |
| United States | | | | 45,237,993 | | | | — | | | | — | | | | 45,237,993 | |
| Short-Term Investments | | | | 1,891,314 | | | | — | | | | — | | | | 1,891,314 | |
| Total | | | $ | 58,175,085 | | | $ | 35,372,283 | | | $ | — | | | $ | 93,547,368 | |
| | | | | | | | | | | | | | | | | | |
| Global Listed Infrastructure Portfolio | | | | | | | | | | | | | | | | | |
| Assets: | | | | | | | | | | | | | | | | | |
| Common Stocks* | | | | | | | | | | | | | | | | | |
| Australia | | | $ | — | | | $ | 609,822,482 | | | $ | — | | | $ | 609,822,482 | |
| Canada | | | | 54,423,650 | | | | — | | | | — | | | | 54,423,650 | |
| France | | | | — | | | | 482,542,644 | | | | — | | | | 482,542,644 | |
| Hong Kong | | | | — | | | | 248,332,775 | | | | — | | | | 248,332,775 | |
| Italy | | | | — | | | | 1,636,559,784 | | | | — | | | | 1,636,559,784 | |
| Luxembourg | | | | — | | | | 194,564,135 | | | | — | | | | 194,564,135 | |
| Portugal | | | | — | | | | 62,151,022 | | | | — | | | | 62,151,022 | |
| Spain | | | | — | | | | 637,225,157 | | | | — | | | | 637,225,157 | |
| United Kingdom | | | | — | | | | 1,553,421,117 | | | | — | | | | 1,553,421,117 | |
| United States | | | | 994,462,359 | | | | — | | | | — | | | | 994,462,359 | |
| Short-Term Investments | | | | 1,142,375,288 | | | | — | | | | — | | | | 1,142,375,288 | |
| Other Financial Instruments† | | | | | | | | | | | | | | | | | |
| Forward Currency Contracts | | | | — | | | | 1,627,177 | | | | — | | | | 1,627,177 | |
| Total | | | $ | 2,191,261,297 | | | $ | 5,426,246,293 | | | $ | — | | | $ | 7,617,507,590 | |
| Liabilities: | | | | | | | | | | | | | | | | | |
| Other Financial Instruments† | | | | | | | | | | | | | | | | | |
| Forward Currency Contracts | | | $ | — | | | $ | (57,767,779 | ) | | $ | — | | | $ | (57,767,779 | ) |
298 Annual Report
| Description | | Unadjusted
Quoted Prices in
Active Markets for
Identical
Assets
and Liabilities
(Level 1) | | Significant
Other
Observable
Inputs
(Level 2) | | Significant
Unobservable
Inputs
(Level 3) | | Balance as of
December 31, 2020 |
| | | | | | | | | | | | | | | | | | |
| Global Strategic Equity Portfolio | | | | | | | | | | | | | | | | | |
| Common Stocks* | | | | | | | | | | | | | | | | | |
| Brazil | | | $ | — | | | $ | 43,433 | | | $ | — | | | $ | 43,433 | |
| Canada | | | | 157,729 | | | | — | | | | — | | | | 157,729 | |
| China | | | | 83,317 | | | | 65,761 | | | | — | | | | 149,078 | |
| Denmark | | | | — | | | | 80,087 | | | | — | | | | 80,087 | |
| France | | | | — | | | | 121,038 | | | | — | | | | 121,038 | |
| Germany | | | | — | | | | 122,441 | | | | — | | | | 122,441 | |
| Greece | | | | — | | | | 40,726 | | | | — | | | | 40,726 | |
| Hong Kong | | | | — | | | | 71,443 | | | | — | | | | 71,443 | |
| India | | | | 58,386 | | | | — | | | | — | | | | 58,386 | |
| Israel | | | | 55,587 | | | | — | | | | — | | | | 55,587 | |
| Italy | | | | — | | | | 59,267 | | | | — | | | | 59,267 | |
| Japan | | | | — | | | | 180,117 | | | | — | | | | 180,117 | |
| Netherlands | | | | — | | | | 63,222 | | | | — | | | | 63,222 | |
| Portugal | | | | — | | | | 51,470 | | | | — | | | | 51,470 | |
| South Korea | | | | — | | | | 53,933 | | | | — | | | | 53,933 | |
| Spain | | | | — | | | | 101,206 | | | | — | | | | 101,206 | |
| Sweden | | | | 54,919 | | | | — | | | | — | | | | 54,919 | |
| Switzerland | | | | — | | | | 143,717 | | | | — | | | | 143,717 | |
| United Kingdom | | | | 55,261 | | | | 497,806 | | | | — | | | | 553,067 | |
| United States | | | | 1,982,980 | | | | — | | | | — | | | | 1,982,980 | |
| Preferred Stocks* | | | | | | | | | | | | | | | | | |
| Germany | | | | — | | | | 55,148 | | | | — | | | | 55,148 | |
| Short-Term Investments | | | | 80,664 | | | | — | | | | — | | | | 80,664 | |
| Total | | | $ | 2,528,843 | | | $ | 1,750,815 | | | $ | — | | | $ | 4,279,658 | |
Annual Report 299
| Description | | Unadjusted
Quoted Prices in
Active Markets for
Identical
Assets
and Liabilities
(Level 1) | | Significant
Other
Observable
Inputs
(Level 2) | | Significant
Unobservable
Inputs
(Level 3) | | Balance as of
December 31, 2020 |
| | | | | | | | | | |
| International Equity Advantage Portfolio | | | | | | | | | | | | | | | | | |
| Common Stocks* | | | | | | | | | | | | | | | | | |
| Australia | | | $ | — | | | $ | 192,614 | | | $ | — | | | $ | 192,614 | |
| Austria | | | | — | | | | 4,180 | | | | — | | | | 4,180 | |
| China | | | | — | | | | 6,757 | | | | — | | | | 6,757 | |
| Denmark | | | | — | | | | 85,829 | | | | — | | | | 85,829 | |
| Finland | | | | — | | | | 32,493 | | | | — | | | | 32,493 | |
| France | | | | — | | | | 241,108 | | | | — | | | | 241,108 | |
| Germany | | | | — | | | | 222,548 | | | | — | | | | 222,548 | |
| Hong Kong | | | | — | | | | 57,651 | | | | — | | | | 57,651 | |
| Ireland | | | | — | | | | 5,967 | | | | — | | | | 5,967 | |
| Israel | | | | — | | | | 7,339 | | | | — | | | | 7,339 | |
| Italy | | | | — | | | | 36,606 | | | | — | | | | 36,606 | |
| Japan | | | | 102,751 | | | | 565,543 | | | | — | | | | 668,294 | |
| Luxembourg | | | | — | | | | 2,983 | | | | — | | | | 2,983 | |
| Netherlands | | | | — | | | | 127,895 | | | | — | | | | 127,895 | |
| New Zealand | | | | — | | | | 15,887 | | | | — | | | | 15,887 | |
| Norway | | | | — | | | | 42,613 | | | | — | | | | 42,613 | |
| Singapore | | | | — | | | | 37,725 | | | | — | | | | 37,725 | |
| South Africa | | | | — | | | | 1,740 | | | | — | | | | 1,740 | |
| Spain | | | | — | | | | 69,556 | | | | — | | | | 69,556 | |
| Sweden | | | | — | | | | 121,319 | | | | — | | | | 121,319 | |
| Switzerland | | | | — | | | | 251,617 | | | | — | | | | 251,617 | |
| United Kingdom | | | | 10,657 | | | | 348,958 | | | | — | | | | 359,615 | |
| United States | | | | 9,944 | | | | — | | | | — | | | | 9,944 | |
| Preferred Stocks* | | | | | | | | | | | | | | | | | |
| Germany | | | | — | | | | 5,031 | | | | — | | | | 5,031 | |
| Rights* | | | | — | | | | — | | | | — | | | | — | |
| Short-Term Investments | | | | 20,453 | | | | — | | | | — | | | | 20,453 | |
| Total | | | $ | 143,805 | | | $ | 2,483,959 | | | $ | — | | | $ | 2,627,764 | |
300 Annual Report
| Description | | Unadjusted
Quoted Prices in
Active Markets for
Identical
Assets
and Liabilities
(Level 1) | | Significant
Other
Observable
Inputs
(Level 2) | | Significant
Unobservable
Inputs
(Level 3) | | Balance as of
December 31, 2020 |
| | | | | | | | | | |
| International Equity Concentrated Portfolio | | | | | | | | | | | | | | | | | |
| Common Stocks* | | | | | | | | | | | | | | | | | |
| Brazil | | | $ | — | | | $ | 364,259 | | | $ | — | | | $ | 364,259 | |
| Canada | | | | 313,521 | | | | — | | | | — | | | | 313,521 | |
| China | | | | 246,858 | | | | 1,434,451 | | | | — | | | | 1,681,309 | |
| France | | | | — | | | | 2,108,454 | | | | — | | | | 2,108,454 | |
| Germany | | | | — | | | | 1,143,899 | | | | — | | | | 1,143,899 | |
| Hong Kong | | | | — | | | | 937,167 | | | | — | | | | 937,167 | |
| India | | | | 510,898 | | | | — | | | | — | | | | 510,898 | |
| Japan | | | | — | | | | 1,797,599 | | | | — | | | | 1,797,599 | |
| Luxembourg | | | | — | | | | 507,002 | | | | — | | | | 507,002 | |
| Mexico | | | | 823,619 | | | | — | | | | — | | | | 823,619 | |
| South Korea | | | | — | | | | 891,020 | | | | — | | | | 891,020 | |
| Spain | | | | — | | | | 525,963 | | | | — | | | | 525,963 | |
| United Kingdom | | | | — | | | | 1,564,950 | | | | — | | | | 1,564,950 | |
| United States | | | | 698,135 | | | | — | | | | — | | | | 698,135 | |
| Preferred Stocks* | | | | | | | | | | | | | | | | | |
| Germany | | | | — | | | | 442,301 | | | | — | | | | 442,301 | |
| Total | | | $ | 2,593,031 | | | $ | 11,717,065 | | | $ | — | | | $ | 14,310,096 | |
Annual Report 301
| Description | | Unadjusted
Quoted Prices in
Active Markets for
Identical
Assets
and Liabilities
(Level 1) | | Significant
Other
Observable
Inputs
(Level 2) | | Significant
Unobservable
Inputs
(Level 3) | | Balance as of
December 31, 2020 |
| | | | | | | | | | |
| International Equity Portfolio | | | | | | | | | | | | | | | | | |
| Common Stocks* | | | | | | | | | | | | | | | | | |
| Australia | | | $ | — | | | $ | 41,427,705 | | | $ | — | | | $ | 41,427,705 | |
| Canada | | | | 100,765,066 | | | | — | | | | — | | | | 100,765,066 | |
| China | | | | 30,341,961 | | | | 75,203,912 | | | | — | | | | 105,545,873 | |
| Denmark | | | | — | | | | 114,153,646 | | | | — | | | | 114,153,646 | |
| Finland | | | | — | | | | 68,689,647 | | | | — | | | | 68,689,647 | |
| France | | | | — | | | | 486,780,217 | | | | — | | | | 486,780,217 | |
| Germany | | | | — | | | | 210,574,700 | | | | — | | | | 210,574,700 | |
| Hong Kong | | | | — | | | | 33,308,898 | | | | — | | | | 33,308,898 | |
| Ireland | | | | 34,385,467 | | | | — | | | | — | | | | 34,385,467 | |
| Israel | | | | — | | | | 31,338,537 | | | | — | | | | 31,338,537 | |
| Italy | | | | — | | | | 70,223,686 | | | | — | | | | 70,223,686 | |
| Japan | | | | — | | | | 485,687,596 | | | | — | | | | 485,687,596 | |
| Luxembourg | | | | — | | | | 36,048,550 | | | | — | | | | 36,048,550 | |
| Mexico | | | | 21,223,280 | | | | — | | | | — | | | | 21,223,280 | |
| Netherlands | | | | — | | | | 150,765,207 | | | | — | | | | 150,765,207 | |
| Norway | | | | — | | | | 69,362,693 | | | | — | | | | 69,362,693 | |
| Portugal | | | | — | | | | 46,251,997 | | | | — | | | | 46,251,997 | |
| Singapore | | | | — | | | | 32,872,550 | | | | — | | | | 32,872,550 | |
| South Korea | | | | — | | | | 61,728,560 | | | | — | | | | 61,728,560 | |
| Spain | | | | — | | | | 39,582,055 | | | | — | | | | 39,582,055 | |
| Sweden | | | | — | | | | 66,455,296 | | | | — | | | | 66,455,296 | |
| Switzerland | | | | — | | | | 177,398,931 | | | | — | | | | 177,398,931 | |
| United Kingdom | | | | — | | | | 294,403,460 | | | | — | | | | 294,403,460 | |
| United States | | | | 145,822,496 | | | | 47,141,648 | | | | — | | | | 192,964,144 | |
| Preferred Stocks* | | | | | | | | | | | | | | | | | |
| Germany | | | | — | | | | 52,183,445 | | | | — | | | | 52,183,445 | |
| Short-Term Investments | | | | 33,605,219 | | | | — | | | | — | | | | 33,605,219 | |
| Total | | | $ | 366,143,489 | | | $ | 2,691,582,936 | | | $ | — | | | $ | 3,057,726,425 | |
302 Annual Report
| Description | | Unadjusted
Quoted Prices in
Active Markets for
Identical
Assets
and Liabilities
(Level 1) | | Significant
Other
Observable
Inputs
(Level 2) | | Significant
Unobservable
Inputs
(Level 3) | | Balance as of
December 31, 2020 |
| | | | | | | | | | |
| International Equity Select Portfolio | | | | | | | | | | | | | | | | | |
| Common Stocks* | | | | | | | | | | | | | | | | | |
| Australia | | | $ | — | | | $ | 1,284,162 | | | $ | — | | | $ | 1,284,162 | |
| Brazil | | | | — | | | | 2,286,192 | | | | — | | | | 2,286,192 | |
| Canada | | | | 1,917,343 | | | | — | | | | — | | | | 1,917,343 | |
| China | | | | 1,159,776 | | | | 7,073,467 | | | | — | | | | 8,233,243 | |
| Denmark | | | | — | | | | 2,803,049 | | | | — | | | | 2,803,049 | |
| Finland | | | | — | | | | 1,993,566 | | | | — | | | | 1,993,566 | |
| France | | | | — | | | | 13,618,978 | | | | — | | | | 13,618,978 | |
| Germany | | | | — | | | | 4,026,129 | | | | — | | | | 4,026,129 | |
| Hong Kong | | | | — | | | | 1,843,683 | | | | — | | | | 1,843,683 | |
| India | | | | 1,544,102 | | | | 491,036 | | | | — | | | | 2,035,138 | |
| Indonesia | | | | 632,335 | | | | 377,713 | | | | — | | | | 1,010,048 | |
| Ireland | | | | 1,306,452 | | | | — | | | | — | | | | 1,306,452 | |
| Italy | | | | — | | | | 1,840,568 | | | | — | | | | 1,840,568 | |
| Japan | | | | — | | | | 12,025,183 | | | | — | | | | 12,025,183 | |
| Mexico | | | | 1,483,816 | | | | — | | | | — | | | | 1,483,816 | |
| Netherlands | | | | — | | | | 3,200,080 | | | | — | | | | 3,200,080 | |
| Norway | | | | — | | | | 1,861,781 | | | | — | | | | 1,861,781 | |
| Singapore | | | | — | | | | 921,155 | | | | — | | | | 921,155 | |
| South Africa | | | | — | | | | 843,004 | | | | — | | | | 843,004 | |
| South Korea | | | | — | | | | 4,304,437 | | | | — | | | | 4,304,437 | |
| Spain | | | | — | | | | 478,329 | | | | — | | | | 478,329 | |
| Sweden | | | | — | | | | 2,292,116 | | | | — | | | | 2,292,116 | |
| Switzerland | | | | — | | | | 5,527,555 | | | | — | | | | 5,527,555 | |
| United Kingdom | | | | — | | | | 7,340,692 | | | | — | | | | 7,340,692 | |
| United States | | | | 5,167,663 | | | | 1,207,597 | | | | — | | | | 6,375,260 | |
| Preferred Stocks* | | | | | | | | | | | | | | | | | |
| Germany | | | | — | | | | 1,875,585 | | | | — | | | | 1,875,585 | |
| Short-Term Investments | | | | 2,104,351 | | | | — | | | | — | | | | 2,104,351 | |
| Total | | | $ | 15,315,838 | | | $ | 79,516,057 | | | $ | — | | | $ | 94,831,895 | |
Annual Report 303
| Description | | Unadjusted
Quoted Prices in
Active Markets for
Identical
Assets
and Liabilities
(Level 1) | | Significant
Other
Observable
Inputs
(Level 2) | | Significant
Unobservable
Inputs
(Level 3) | | Balance as of
December 31, 2020 |
| | | | | | | | | | |
| International Equity Value Portfolio | | | | | | | | | | | | | | | | | |
| Common Stocks* | | | | | | | | | | | | | | | | | |
| Austria | | | $ | — | | | $ | 54,376 | | | $ | — | | | $ | 54,376 | |
| France | | | | — | | | | 622,710 | | | | — | | | | 622,710 | |
| Germany | | | | — | | | | 275,839 | | | | — | | | | 275,839 | |
| Italy | | | | — | | | | 56,989 | | | | — | | | | 56,989 | |
| Japan | | | | 84,722 | | | | 467,839 | | | | — | | | | 552,561 | |
| Macau | | | | — | | | | 81,006 | | | | — | | | | 81,006 | |
| Mexico | | | | 141,933 | | | | — | | | | — | | | | 141,933 | |
| Netherlands | | | | — | | | | 97,752 | | | | — | | | | 97,752 | |
| South Korea | | | | — | | | | 192,766 | | | | — | | | | 192,766 | |
| Spain | | | | — | | | | 68,245 | | | | — | | | | 68,245 | |
| Sweden | | | | — | | | | 90,150 | | | | — | | | | 90,150 | |
| Switzerland | | | | — | | | | 308,448 | | | | — | | | | 308,448 | |
| United Kingdom | | | | — | | | | 155,825 | | | | — | | | | 155,825 | |
| Short-Term Investments | | | | 60,990 | | | | — | | | | — | | | | 60,990 | |
| Total | | | $ | 287,645 | | | $ | 2,471,945 | | | $ | — | | | $ | 2,759,590 | |
| | | | | | | | | | | | | | | | | | |
| International Quality Growth Portfolio | | | | | | | | | | | | | | | | | |
| Common Stocks* | | | | | | | | | | | | | | | | | |
| Canada | | | $ | 969,861 | | | $ | — | | | $ | — | | | $ | 969,861 | |
| China | | | | 314,651 | | | | 401,870 | | | | — | | | | 716,521 | |
| Denmark | | | | — | | | | 703,196 | | | | — | | | | 703,196 | |
| France | | | | — | | | | 501,095 | | | | — | | | | 501,095 | |
| Germany | | | | — | | | | 939,081 | | | | — | | | | 939,081 | |
| Hong Kong | | | | — | | | | 246,353 | | | | — | | | | 246,353 | |
| India | | | | 381,316 | | | | — | | | | — | | | | 381,316 | |
| Israel | | | | 178,631 | | | | — | | | | — | | | | 178,631 | |
| Japan | | | | — | | | | 1,211,030 | | | | — | | | | 1,211,030 | |
| Netherlands | | | | — | | | | 552,757 | | | | — | | | | 552,757 | |
| Norway | | | | — | | | | 161,895 | | | | — | | | | 161,895 | |
| South Africa | | | | — | | | | 222,221 | | | | — | | | | 222,221 | |
| South Korea | | | | — | | | | 223,703 | | | | — | | | | 223,703 | |
| Spain | | | | — | | | | 127,145 | | | | — | | | | 127,145 | |
| Sweden | | | | — | | | | 495,904 | | | | — | | | | 495,904 | |
| Switzerland | | | | — | | | | 549,599 | | | | — | | | | 549,599 | |
| Taiwan | | | | 547,926 | | | | — | | | | — | | | | 547,926 | |
| United Kingdom | | | | — | | | | 1,250,696 | | | | — | | | | 1,250,696 | |
| United States | | | | 284,158 | | | | — | | | | — | | | | 284,158 | |
| Short-Term Investments | | | | 710,467 | | | | — | | | | — | | | | 710,467 | |
| Total | | | $ | 3,387,010 | | | $ | 7,586,545 | | | $ | — | | | $ | 10,973,555 | |
304 Annual Report
| Description | | Unadjusted
Quoted Prices in
Active Markets for
Identical
Assets
and Liabilities
(Level 1) | | Significant
Other
Observable
Inputs
(Level 2) | | Significant
Unobservable
Inputs
(Level 3) | | Balance as of
December 31, 2020 |
| | | | | | | | | | |
| International Small Cap Equity Portfolio | | | | | | | | | | | | | | | | | |
| Common Stocks* | | | | | | | | | | | | | | | | | |
| Australia | | | $ | — | | | $ | 1,006,382 | | | $ | — | | | $ | 1,006,382 | |
| Austria | | | | — | | | | 545,679 | | | | — | | | | 545,679 | |
| Belgium | | | | — | | | | 1,209,701 | | | | — | | | | 1,209,701 | |
| Canada | | | | 1,408,818 | | | | — | | | | — | | | | 1,408,818 | |
| Denmark | | | | — | | | | 605,666 | | | | — | | | | 605,666 | |
| Finland | | | | — | | | | 1,412,328 | | | | — | | | | 1,412,328 | |
| France | | | | — | | | | 625,733 | | | | — | | | | 625,733 | |
| Germany | | | | — | | | | 5,517,490 | | | | — | | | | 5,517,490 | |
| Greece | | | | — | | | | 595,869 | | | | — | | | | 595,869 | |
| Hong Kong | | | | — | | | | 403,971 | | | | — | | | | 403,971 | |
| India | | | | — | | | | 293,641 | | | | — | | | | 293,641 | |
| Ireland | | | | — | | | | 493,382 | | | | — | | | | 493,382 | |
| Italy | | | | — | | | | 1,468,538 | | | | — | | | | 1,468,538 | |
| Japan | | | | 442,352 | | | | 9,820,738 | | | | — | | | | 10,263,090 | |
| Jersey | | | | — | | | | 640,423 | | | | — | | | | 640,423 | |
| Luxembourg | | | | — | | | | 444,884 | | | | — | | | | 444,884 | |
| Netherlands | | | | 139,349 | | | | 2,532,043 | | | | — | | | | 2,671,392 | |
| New Zealand | | | | — | | | | 464,775 | | | | — | | | | 464,775 | |
| Norway | | | | — | | | | 373,432 | | | | — | | | | 373,432 | |
| Singapore | | | | — | | | | 421,756 | | | | — | | | | 421,756 | |
| Spain | | | | — | | | | 703,307 | | | | — | | | | 703,307 | |
| Sweden | | | | 213,116 | | | | 2,210,806 | | | | — | | | | 2,423,922 | |
| Switzerland | | | | — | | | | 395,273 | | | | — | | | | 395,273 | |
| United Kingdom | | | | 241,412 | | | | 6,103,041 | | | | — | | | | 6,344,453 | |
| United States | | | | — | | | | 426,629 | | | | — | | | | 426,629 | |
| Short-Term Investments | | | | 689,364 | | | | — | | | | — | | | | 689,364 | |
| Total | | | $ | 3,134,411 | | | $ | 38,715,487 | | | $ | — | | | $ | 41,849,898 | |
Annual Report 305
| Description | | Unadjusted
Quoted Prices in
Active Markets for
Identical
Assets
and Liabilities
(Level 1) | | Significant
Other
Observable
Inputs
(Level 2) | | Significant
Unobservable
Inputs
(Level 3) | | Balance as of
December 31, 2020 |
| | | | | | | | | | |
| International Strategic Equity Portfolio | | | | | | | | | | | | | | | | | |
| Common Stocks* | | | | | | | | | | | | | | | | | |
| Brazil | | | $ | — | | | $ | 49,371,448 | | | $ | — | | | $ | 49,371,448 | |
| Canada | | | | 395,559,720 | | | | — | | | | — | | | | 395,559,720 | |
| China | | | | 142,692,812 | | | | 159,832,168 | | | | — | | | | 302,524,980 | |
| Denmark | | | | — | | | | 180,593,408 | | | | — | | | | 180,593,408 | |
| Finland | | | | — | | | | 96,190,110 | | | | — | | | | 96,190,110 | |
| France | | | | — | | | | 722,426,183 | | | | — | | | | 722,426,183 | |
| Germany | | | | — | | | | 286,189,050 | | | | — | | | | 286,189,050 | |
| Hong Kong | | | | — | | | | 148,663,011 | | | | — | | | | 148,663,011 | |
| India | | | | — | | | | 73,515,802 | | | | — | | | | 73,515,802 | |
| Ireland | | | | 99,164,677 | | | | — | | | | — | | | | 99,164,677 | |
| Israel | | | | — | | | | 92,674,328 | | | | — | | | | 92,674,328 | |
| Italy | | | | — | | | | 138,693,689 | | | | — | | | | 138,693,689 | |
| Japan | | | | — | | | | 731,453,969 | | | | — | | | | 731,453,969 | |
| Mexico | | | | 57,367,131 | | | | — | | | | — | | | | 57,367,131 | |
| Netherlands | | | | — | | | | 68,651,729 | | | | — | | | | 68,651,729 | |
| Portugal | | | | — | | | | 53,374,796 | | | | — | | | | 53,374,796 | |
| Spain | | | | — | | | | 338,916,952 | | | | — | | | | 338,916,952 | |
| Sweden | | | | — | | | | 60,876,848 | | | | — | | | | 60,876,848 | |
| Switzerland | | | | — | | | | 335,435,421 | | | | — | | | | 335,435,421 | |
| United Kingdom | | | | — | | | | 1,028,287,494 | | | | — | | | | 1,028,287,494 | |
| United States | | | | 408,596,442 | | | | — | | | | — | | | | 408,596,442 | |
| Preferred Stocks* | | | | | | | | | | | | | | | | | |
| Germany | | | | — | | | | 165,087,256 | | | | — | | | | 165,087,256 | |
| Short-Term Investments | | | | 86,117,830 | | | | — | | | | — | | | | 86,117,830 | |
| Total | | | $ | 1,189,498,612 | | | $ | 4,730,233,662 | | | $ | — | | | $ | 5,919,732,274 | |
306 Annual Report
| Description | | Unadjusted
Quoted Prices in
Active Markets for
Identical
Assets
and Liabilities
(Level 1) | | Significant
Other
Observable
Inputs
(Level 2) | | Significant
Unobservable
Inputs
(Level 3) | | Balance as of
December 31, 2020 |
| | | | | | | | | | |
| Managed Equity Volatility Portfolio | | | | | | | | | | | | | | | | | |
| Common Stocks* | | | | | | | | | | | | | | | | | |
| Australia | | | $ | — | | | $ | 368,814 | | | $ | — | | | $ | 368,814 | |
| Belgium | | | | — | | | | 141,320 | | | | — | | | | 141,320 | |
| Canada | | | | 653,377 | | | | — | | | | — | | | | 653,377 | |
| Denmark | | | | — | | | | 514,992 | | | | — | | | | 514,992 | |
| Finland | | | | — | | | | 127,882 | | | | — | | | | 127,882 | |
| France | | | | — | | | | 340,136 | | | | — | | | | 340,136 | |
| Hong Kong | | | | — | | | | 649,106 | | | | — | | | | 649,106 | |
| Israel | | | | — | | | | 94,303 | | | | — | | | | 94,303 | |
| Japan | | | | — | | | | 4,019,415 | | | | — | | | | 4,019,415 | |
| Netherlands | | | | — | | | | 489,832 | | | | — | | | | 489,832 | |
| New Zealand | | | | — | | | | 154,214 | | | | — | | | | 154,214 | |
| Norway | | | | — | | | | 495,595 | | | | — | | | | 495,595 | |
| Singapore | | | | — | | | | 143,579 | | | | — | | | | 143,579 | |
| Spain | | | | — | | | | 177,285 | | | | — | | | | 177,285 | |
| Sweden | | | | — | | | | 289,605 | | | | — | | | | 289,605 | |
| Switzerland | | | | — | | | | 1,011,223 | | | | — | | | | 1,011,223 | |
| United Kingdom | | | | — | | | | 792,226 | | | | — | | | | 792,226 | |
| United States | | | | 15,174,066 | | | | — | | | | — | | | | 15,174,066 | |
| Short-Term Investments | | | | 160,040 | | | | — | | | | — | | | | 160,040 | |
| Total | | | $ | 15,987,483 | | | $ | 9,809,527 | | | $ | — | | | $ | 25,797,010 | |
| | | | | | | | | | | | | | | | | | |
| US Equity Concentrated Portfolio | | | | | | | | | | | | | | | | | |
| Common Stocks* | | | $ | 1,922,765,653 | | | $ | — | | | $ | — | | | $ | 1,922,765,653 | |
| Short-Term Investments | | | | 48,536,284 | | | | — | | | | — | | | | 48,536,284 | |
| Total | | | $ | 1,971,301,937 | | | $ | — | | | $ | — | | | $ | 1,971,301,937 | |
| | | | | | | | | | | | | | | | | | |
| US Equity Focus Portfolio | | | | | | | | | | | | | | | | | |
| Common Stocks* | | | $ | 52,503,662 | | | $ | — | | | $ | — | | | $ | 52,503,662 | |
| Short-Term Investments | | | | 635,125 | | | | — | | | | — | | | | 635,125 | |
| Total | | | $ | 53,138,787 | | | $ | — | | | $ | — | | | $ | 53,138,787 | |
| | | | | | | | | | | | | | | | | | |
| US Small-Mid Cap Equity Portfolio | | | | | | | | | | | | | | | | | |
| Common Stocks* | | | $ | 102,213,674 | | | $ | — | | | $ | — | | | $ | 102,213,674 | |
| | | | | | | | | | | | | | | | | | |
| US Sustainable Equity Portfolio | | | | | | | | | | | | | | | | | |
| Common Stocks* | | | $ | 11,379,977 | | | $ | — | | | $ | — | | | $ | 11,379,977 | |
| Short-Term Investments | | | | 188,816 | | | | — | | | | — | | | | 188,816 | |
| Total | | | $ | 11,568,793 | | | $ | — | | | $ | — | | | $ | 11,568,793 | |
| * | Please refer to Portfolios of Investments and Notes to Portfolios of Investments for portfolio holdings by country and industry. |
| † | Other financial instruments are derivative instruments which are valued at their respective unrealized appreciation (depreciation). |
Annual Report 307
10. Derivative Instruments
The Global Listed Infrastructure Portfolio used derivative instruments, including forward currency contracts.
Forward currency contracts may be used for hedging purposes or to seek to increase returns.
During the year ended December 31, 2020, the approximate average monthly notional exposure for derivative instruments was as follows:
| Forward currency contracts: | | | | |
| Average amounts purchased | | $ | 177,000,000 | # |
| Average amounts sold | | $ | 5,232,700,000 | |
| # | Represents average monthly notional exposure for the ten months the derivative instrument was open during the period. |
The following table summarizes the fair value of derivative instruments on the Statement of Assets and Liabilities as of December 31, 2020:
| Assets – Derivative Financial Instruments | | | Total | |
| Forward currency contracts | | Unrealized appreciation on forward currency contracts | | $ | 1,627,177 | |
| | | | | | | |
| Liabilities – Derivative Financial Instruments | | | Total | |
| Forward currency contracts | | Unrealized depreciation on forward currency contracts | | $ | 57,767,779 | |
The effect of derivative instruments on the Statement of Operations for the period ended December 31, 2020 was:
| Net Realized Gain (Loss) from: | | Total | |
| Forward currency contracts | | $ | (342,450,293 | ) |
| | | | | |
| Net Change in Unrealized Appreciation (Depreciation) on: | | Total | |
| Forward currency contracts | | $ | 3,106,193 | |
None of the other Portfolios presented traded in derivative instruments during the year ended December 31, 2020.
308 Annual Report
As of December 31, 2020, the Global Listed Infrastructure Portfolio held derivative instruments that are eligible for offset in the Statement of Assets and Liabilities and are subject to master netting arrangements. A master netting arrangement is an agreement between two counterparties who have multiple contracts with each other that provides for the net settlement of all contracts, as well as any cash collateral, through a single payment in the event of default on, or termination of, any one contract.
The required information for the affected Portfolio is presented in the below table, as of December 31, 2020:
Global Listed Infrastructure Portfolio
| Description | Gross Amounts
of Recognized
Assets | | Gross Amounts
Offset in the
Statement of
Assets and
Liabilities | | Net Amounts of
Assets Presented
in the Statement
of Assets and
Liabilities | |
| Forward Currency Contracts | | $ | 1,627,177 | | | | $ | — | | | | $ | 1,627,177 | | |
| | | | | | | Amounts Not Offset in the
Statement of Assets and Liabilities | | | | |
| Counterparty | | Net Amounts of
Assets Presented
in the Statement of
Assets and Liabilities | | Financial
Instruments | Collateral
Received | | Net Amounts
of Derivative
Assets | |
| BNP Paribas SA | | | $ | 1,560,894 | | | | $ | (1,560,894 | ) | $ | — | | | | | $ | — | | |
| Royal Bank of Canada | | | | 66,283 | | | | | (66,283 | ) | | — | | | | | | — | | |
| Total | | | $ | 1,627,177 | | | | $ | (1,627,177 | ) | $ | — | | | | | $ | — | | |
| Description | Gross Amounts
of Recognized
Liabilities | | Gross Amounts
Offset in the
Statement of
Assets and
Liabilities | | Net Amounts of
Liabilities Presented
in the Statement
of Assets and
Liabilities | |
| Forward Currency Contracts | | $ | 57,767,779 | | | | $ | — | | | | $ | 57,767,779 | | |
Annual Report 309
| | | | | | | Amounts Not Offset in the
Statement of Assets and Liabilities | | | | | |
| Counterparty | | Net Amounts of
Liabilities Presented
in the Statement of
Assets and Liabilities | | Financial
Instruments | | Collateral
Pledged | | Net Amounts
of Derivative
Liabilities | |
| BNP Paribas SA | | | $ | 5,071,296 | | | | $ | (1,560,894 | ) | | $ | — | | | | $ | 3,510,402 | | |
| Canadian Imperial Bank of Commerce | | | | 9,122,989 | | | | | — | | | | — | | | | | 9,122,989 | | |
| Citibank NA | | | | 4,605,989 | | | | | — | | | | — | | | | | 4,605,989 | | |
| HSBC Bank USA NA | | | | 12,061,223 | | | | | — | | | | — | | | | | 12,061,223 | | |
| Royal Bank of Canada | | | | 8,907,463 | | | | | (66,283 | ) | | | — | | | | | 8,841,180 | | |
| Standard Chartered Bank | | | | 2,751,566 | | | | | — | | | | — | | | | | 2,751,566 | | |
| State Street Bank and Trust Co. | | | | 13,203,919 | | | | | — | | | | — | | | | | 13,203,919 | | |
| The Bank of New York Mellon Corp. | | | | 2,043,334 | | | | | — | | | | — | | | | | 2,043,334 | | |
| Total | | | $ | 57,767,779 | | | | $ | (1,627,177 | ) | | $ | — | | | | $ | 56,140,602 | | |
11. Accounting Pronouncements
In March 2017, the Financial Accounting Standards Board issued Accounting Standards Update No. 2017-08, Receivables - Nonrefundable Fees and Other Costs (Subtopic 310-20): Premium Amortization on Purchased Callable Debt Securities (“ASU No. 2017-08”). ASU No. 2017-08 shortened the amortization period for certain purchased callable debt securities held at a premium to the earliest call date. Management has implemented the applicable changes, and they did not have a material impact on the Portfolios’ financial statements. In October 2020, ASU No. 2017-08 was amended by the Financial Accounting Standards Board’s issuance of Accounting Standards Update (No. 2020-08), Codification Improvements to Subtopic 310-20, Receivables-Nonrefundable Fees and Other Costs (“ASU No. 2020-08”).This amendment requires that entities re-evaluate whether callable debt securities fall within the scope of ASU No. 2017-08 for each reporting period. ASU No. 2020-08 also amends ASU No. 2017-08 to require premiums be amortized to the “next call date” rather than the “earliest call date” and further clarifies the definition of “next call date.” ASU No. 2020-08 is effective for fiscal years, and interim periods within those fiscal years, beginning after December 15, 2020. Early adoption of ASU No. 2020-08 is not permitted. Management is currently evaluating the impact, if any, of applying ASU No. 2020-08.
310 Annual Report
On March 12, 2020, the Financial Accounting Standards Board concluded its reference rate reform project with the issuance of Accounting Standards Update No. 2020-04, Reference Rate Reform (Topic 848) - Facilitation of the Effects of Reference Rate Reform on Financial Reporting (“ASU No. 2020-04”). ASU No. 2020-04 provides elective temporary financial reporting relief from the effect of certain types of contract modifications due to the planned discontinuation of the London Interbank Offered Rate (LIBOR) and other interbank offered based reference rates as of the end of 2021. ASU No. 2020-04 is effective for certain reference rate-related contract modifications that occur during the period March 12, 2020 through December 31, 2022. Management is currently evaluating the impact, if any, of applying ASU No. 2020-04.
12. Subsequent Events
Management has evaluated subsequent events potentially affecting the Portfolios through the issuance of the financial statements and has determined that there were no subsequent events that required adjustment or disclosure other than the following.
On March 2, 2021 the Lazard Emerging Markets Equity Blend Portfolio will change its name to the Lazard Emerging Markets Strategic Equity Portfolio.The name change will be accompanied by a change to the Portfolio’s investment strategy to invest primarily in equity securities of non-US companies whose principal activities are located in emerging market countries which the Investment Manager believes are undervalued based on their earnings, cash flow, or asset values. Under normal circumstances, the Portfolio invests at least 80% of its assets in equity securities of companies whose principal business activities are located in countries represented by the MSCI Emerging Markets Index.
Annual Report 311
The Lazard Funds, Inc.
Report of Independent Registered Public Accounting Firm
To the Board of Directors of The Lazard Funds, Inc. and Shareholders of Lazard Developing Markets Equity Portfolio, Lazard Emerging Markets Core Equity Portfolio, Lazard Emerging Markets Equity Advantage Portfolio, Lazard Emerging Markets Equity Blend Portfolio, Lazard Emerging Markets Equity Portfolio, Lazard Equity Franchise Portfolio, Lazard Global Equity Select Portfolio, Lazard Global Listed Infrastructure Portfolio, Lazard Global Strategic Equity Portfolio, Lazard International Equity Advantage Portfolio, Lazard International Equity Concentrated Portfolio, Lazard International Equity Portfolio, Lazard International Equity Select Portfolio, Lazard International Equity Value Portfolio, Lazard International Quality Growth Portfolio, Lazard International Small Cap Equity Portfolio, Lazard International Strategic Equity Portfolio, Lazard Managed Equity Volatility Portfolio, Lazard US Equity Concentrated Portfolio, Lazard US Equity Focus Portfolio, Lazard US Small-Mid Cap Equity Portfolio and Lazard US Sustainable Equity Portfolio:
Opinion on the Financial Statements and Financial Highlights
We have audited the accompanying statements of assets and liabilities of Lazard Developing Markets Equity Portfolio, Lazard Emerging Markets Core Equity Portfolio, Lazard Emerging Markets Equity Advantage Portfolio, Lazard Emerging Markets Equity Blend Portfolio, Lazard Emerging Markets Equity Portfolio, Lazard Equity Franchise Portfolio, Lazard Global Equity Select Portfolio, Lazard Global Listed Infrastructure Portfolio, Lazard Global Strategic Equity Portfolio, Lazard International Equity Advantage Portfolio, Lazard International Equity Concentrated Portfolio, Lazard International Equity Portfolio, Lazard International Equity Select Portfolio, Lazard International Equity Value Portfolio, Lazard International Quality Growth Portfolio, Lazard International Small Cap Equity Portfolio, Lazard International Strategic Equity Portfolio, Lazard Managed Equity Volatility Portfolio, Lazard US Equity Concentrated Portfolio, Lazard US Equity Focus Portfolio, Lazard US Small-Mid Cap
312 Annual Report
Equity Portfolio and Lazard US Sustainable Equity Portfolio (collectively the “Portfolios”), twenty-two of the portfolios constituting The Lazard Funds, Inc. (the “Fund”), including the portfolios of investments, as of December 31, 2020, the related statements of operations for the year then ended, the statements of changes in net assets for each of the two years in the period then ended, the financial highlights for each of the five years in the period then ended for the Portfolios except for Lazard International Quality Growth Portfolio, Lazard International Equity Value Portfolio, Lazard Equity Franchise Portfolio, and Lazard US Sustainable Equity Portfolio where the financial statements and periods audited are included in the table below, and the related notes. In our opinion, the financial statements and financial highlights present fairly, in all material respects, the financial position of each of the Portfolios, as of December 31, 2020, and the results of their operations for the year then ended (or for the period listed in the table below), the changes in their net assets for each of the two years in the period then ended (or for the period listed in the table below), and the financial highlights for each of the five years in the period then ended (or for the period listed in the table below), in conformity with accounting principles generally accepted in the United States of America.
| Portfolio Name | Statements of
Operations | Statements of
Changes in
Net Assets | Financial Highlights |
| Lazard International Quality Growth Portfolio | For the year ended December 31, 2020 | For the years ended December 31, 2020 and 2019 | For the years ended December 31, 2020 and 2019 and for the period from December 31, 2018 (commencement of operations) through December 31, 2018 |
| Lazard International Equity Value Portfolio | For the year ended December 31, 2020 | For the years ended December 31, 2020 and 2019 | For the years ended December 31, 2020 and 2019 and for the period from October 31, 2018 (commencement of operations) through December 31, 2018 |
| Lazard Equity Franchise Portfolio | For the year ended December 31, 2020 | For the years ended December 31, 2020 and 2019 | For the years ended December 31, 2020, 2019, and 2018 and for the period from September 29, 2017 (commencement of operations) through December 31, 2017 |
| Lazard US Sustainable Equity Portfolio | For the period from June 30, 2020 (commencement of operations) through December 31, 2020 |
Annual Report 313
Basis for Opinion
These financial statements and financial highlights are the responsibility of the Portfolios’ management. Our responsibility is to express an opinion on the Portfolios’ financial statements and financial highlights based on our audits. We are a public accounting firm registered with the Public Company Accounting Oversight Board (United States) (PCAOB) and are required to be independent with respect to the Portfolios in accordance with the U.S. federal securities laws and the applicable rules and regulations of the Securities and Exchange Commission and the PCAOB.
We conducted our audits in accordance with the standards of the PCAOB. Those standards require that we plan and perform the audit to obtain reasonable assurance about whether the financial statements and financial highlights are free of material misstatement, whether due to error or fraud. The Portfolios are not required to have, nor were we engaged to perform, an audit of their internal control over financial reporting. As part of our audits we are required to obtain an understanding of internal control over financial reporting but not for the purpose of expressing an opinion on the effectiveness of the Portfolios’ internal control over financial reporting. Accordingly, we express no such opinion.
Our audits included performing procedures to assess the risks of material misstatement of the financial statements and financial highlights, whether due to error or fraud, and performing procedures that respond to those risks. Such procedures included examining, on a test basis, evidence regarding the amounts and disclosures in the financial statements and financial highlights. Our audits also included evaluating the accounting principles used and significant estimates made by management, as well as evaluating the overall presentation of the financial statements and financial highlights. Our procedures included confirmation of securities owned as of December 31, 2020, by correspondence with the custodian and brokers; when replies were not received from brokers, we performed other auditing procedures. We believe that our audits provide a reasonable basis for our opinion.
/s/ DELOITTE & TOUCHE LLP
New York, New York
February 24, 2021
We have served as the auditor of one or more of the investment companies in the Lazard Fund Complex since 2004.
314 Annual Report
The Lazard Funds, Inc.
Board of Directors and Officers Information (unaudited)
Name (Year of Birth)
Address(1) | | Position(s) with the
Fund (Since) and Term(2) | | Principal Occupation(s) and Other Public
Company Directorships Held During the
Past Five Years(2) |
| | | | | |
| Independent Directors(3): | |
| | | | | |
| Franci J. Blassberg (1953) | | Director
(August 2014) | | Debevoise & Plimpton LLP, a law firm, Of Counsel (2013 – present) |
| | | | | |
| | | | | Cornell Law School, Adjunct Professor (2013 – present) |
| | | | | |
| | | | | The Buchmann Faculty of Law, Tel Aviv University, Visiting Professor (2019) |
| | | | | |
| | | | | University of California, Berkeley School of Law, Adjunct Professor (Spring 2017) |
| | | | | |
| Kenneth S. Davidson (1945) | | Director
(August 1995) | | Davidson Capital Management Corporation, an investment manager, President (1978 – present) |
| | | | | |
| Nancy A. Eckl (1962) | | Director
(April 2007) | | College Retirement Equities Fund (eight accounts), Trustee (2007 – present) |
| | | | | |
| | | | | TIAA-CREF Funds (68 funds) and TIAA-CREF Life Funds (11 funds), Trustee (2007 – present) |
| | | | | |
| | | | | TIAA Separate Account VA-1, Member of the Management Committee (2007 – present) |
| | | | | |
| Trevor W. Morrison (1971) | | Director
(April 2014) | | New York University School of Law, Dean and Eric M. and Laurie B. Roth Professor of Law (2013 – present) |
| | | | | |
| Richard Reiss, Jr. (1944) | | Director
(May 1991) | | Georgica Advisors LLC, an investment manager, Chairman (1997 – present) |
| | | | | |
| | | | | Resource America, Inc., a real estate asset management company, Director (2016 – 2018) |
| | | | | |
| | | | | Osprey Technology Acquisition Corp., a special purpose acquisition company, Director (2019 – present) |
Annual Report 315
Name (Year of Birth)
Address(1) | | Position(s) with the
Fund (Since) and Term(2) | | Principal Occupation(s) and Other Public
Company Directorships Held During the
Past Five Years(2) |
| | | | | |
| Robert M. Solmson (1947) | | Director
(September 2004) | | Fairwood Capital, LLC, a private investment corporation engaged primarily in real estate and hotel investments, Co-Managing Partner and Managing Director (2008 – present) |
| | | | | |
| Interested Directors(4): | |
| | | | | |
| Ashish Bhutani (1960) | | Director
(July 2005) | | Investment Manager, Chief Executive Officer (2004 – present) |
| | | | | |
| | | | | Lazard Ltd, Vice Chairman and Director (2010 – present) |
| | | | | |
| Nathan A. Paul (1973) | | Director
(October 2017), Chief Executive Officer and President (February 2017) | | Investment Manager, Chief Business Officer (April 2017 – present) and Managing Director (2003 – present) |
| | | | | |
| | | | | Investment Manager, General Counsel (2002 – April 2017) |
| (1) | The address of each Director of the Fund is Lazard Asset Management LLC, 30 Rockefeller Plaza, New York, New York 10112-6300. |
| (2) | Each Director serves as a Director for each of the funds in the Lazard Fund Complex comprised of, as of January 31, 2021, 35 active investment portfolios. Each Director serves an indefinite term, until his or her successor is elected and qualifies or until his or her earlier resignation. |
| (3) | “Independent Directors” are not “interested persons” (as defined in the 1940 Act) of the Fund. |
| (4) | Messrs. Bhutani and Paul are “interested persons” (as defined in the 1940 Act) of the Fund because of their positions with the Investment Manager. |
| | The Fund’s Statement of Additional Information contains further information about the Directors and is available without charge by calling 800-823-6300, or online, at www.lazardassetmanagement.com. |
316 Annual Report
Name (Year of Birth)
Address(1) | | Position(s) with the Fund
(Since) and Term(2) | | Principal Occupation(s)
During the Past Five Years |
| | | | | |
| Officers(3): | | | | |
| | | | | |
| Mark R. Anderson (1970) | | Vice President and Secretary (February 2017) | | Managing Director (since February 2017), General Counsel (since April 2017) and Chief Compliance Officer of the Investment Manager |
| | | | | |
| Nargis Hilal ( 1984) | | Chief Compliance Officer (July 2020) | | Senior Vice President and Counsel of the Investment Manager (since August 2017) |
| | | | | |
| | | | | Chief Compliance Officer of KLS Diversified Asset Management LP (March 2016 – August 2017) |
| | | | | |
| | | | | Deputy Chief Compliance Office KLS Diversified Asset Management LP (January 2015 – March 2016) |
| | | | | |
| Christopher Snively (1984) | | Chief Financial Officer (March 2016) and Treasurer (September 2019) | | Senior Vice President of the Investment Manager |
| | | | | |
| Shari L. Soloway (1981) | | Assistant Secretary
(November 2015) | | Head of Legal, North America (since January 2019, previously Senior Vice President, Legal and Compliance) of the Investment Manager |
| | | | | |
| Jessica A. Falzone (1989) | | Assistant Secretary
(January 2019) | | Vice President, Legal and Compliance, of the Investment Manager (since March 2018) |
| | | | | |
| | | | | Associate at Schulte Roth & Zabel LLP (October 2014 – March 2018) |
| | | | | |
| Christina Kennedy (1990) | | Assistant Treasurer
(May 2020) | | Vice President of the Investment Manager (since July 2019) |
| | | | | |
| | | | | Senior Fund Accountant, Gates Capital Management Inc. (July 2016 – July 2019) |
| | | | | |
| | | | | Assurance Senior Associate at PricewaterhouseCoopers LLP (August 2013 – July 2016) |
| | | | | |
| Cesar A. Trelles (1975) | | Assistant Treasurer
(December 2004) | | Vice President of the Investment Manager |
| (1) | The address of each officer of the Fund is Lazard Asset Management LLC, 30 Rockefeller Plaza, New York, New York 10112-6300. |
| (2) | Each officer serves for an indefinite term, until his or her successor is elected and qualifies or until his or her earlier resignation or removal. Each officer serves in the same capacity for the other funds in the Lazard Fund Complex. |
| (3) | In addition to Nathan A. Paul, Chief Executive Officer and President (since February 2017; previously, Vice President and Secretary), whose information is included in the Interested Directors section above. |
Annual Report 317
The Lazard Funds, Inc. Tax and Other Information (unaudited)
Tax Information
Year Ended December 31, 2020
The following tax information represents year end disclosures of the tax benefits passed through to shareholders for 2020:
Of the dividends paid by the Portfolios, the corresponding percentage shown below is qualified dividend income.
| Portfolio | | Percentage | | |
| | | | | | |
| Developing Markets Equity | | | 100.00 | % | |
| Emerging Markets Core Equity | | | 100.00 | | |
| Emerging Markets Equity Advantage | | | 100.00 | | |
| Emerging Markets Equity Blend | | | 100.00 | | |
| Emerging Markets Equity | | | 100.00 | | |
| Equity Franchise | | | 100.00 | | |
| Global Equity Select | | | 100.00 | | |
| Global Listed Infrastructure | | | — | | |
| Global Strategic Equity | | | 100.00 | | |
| International Equity Advantage | | | 100.00 | | |
| International Equity Concentrated | | | 100.00 | | |
| International Equity | | | 100.00 | | |
| International Equity Select | | | 100.00 | | |
| International Equity Value | | | 100.00 | | |
| International Quality Growth | | | 100.00 | | |
| International Small Cap Equity | | | 100.00 | | |
| International Strategic Equity | | | 100.00 | | |
| Managed Equity Volatility | | | 100.00 | | |
| US Equity Concentrated | | | 100.00 | | |
| US Equity Focus | | | 83.70 | | |
| US Small-Mid Cap Equity | | | 100.00 | | |
| US Sustainable Equity | | | 100.00 | | |
318 Annual Report
Of the dividends paid by the Portfolios, the corresponding percentage represents the amount of each dividend that qualifies for the dividends received deduction available to corporate shareholders.
| Portfolio | | Percentage | | |
| | | | | | |
| Developing Markets Equity | | | — | % | |
| Emerging Markets Core Equity | | | 0.19 | | |
| Emerging Markets Equity Advantage | | | 0.13 | | |
| Emerging Markets Equity Blend | | | — | | |
| Emerging Markets Equity | | | — | | |
| Equity Franchise | | | 50.04 | | |
| Global Equity Select | | | 26.05 | | |
| Global Listed Infrastructure | | | 9.43 | | |
| Global Strategic Equity | | | 23.21 | | |
| International Equity Advantage | | | — | | |
| International Equity Concentrated | | | — | | |
| International Equity | | | — | | |
| International Equity Select | | | — | | |
| International Equity Value | | | — | | |
| International Quality Growth | | | — | | |
| International Small Cap Equity | | | — | | |
| International Strategic Equity | | | — | | |
| Managed Equity Volatility | | | 58.73 | | |
| US Equity Concentrated | | | 100.00 | | |
| US Equity Focus | | | 94.55 | | |
| US Small-Mid Cap Equity | | | 100.00 | | |
| US Sustainable Equity | | | 55.56 | | |
Pursuant to Section 871 of the Code, the Portfolios have no designated qualified short-term gains for purposes of exempting withholding of tax on such distributions to US nonresident shareholders.
Annual Report 319
The Portfolios intend to pass through to shareholders foreign source income and foreign taxes paid, or up to the maximum amount allowable, as a foreign tax credit.
| Portfolio | | Foreign
Source Income | | | Foreign Tax
Paid/Credit | |
| | | | | | | | | |
| Developing Markets Equity | | $ | 3,027,358 | | | $ | 395,903 | |
| Emerging Markets Core Equity | | | 3,905,756 | | | | 511,556 | |
| Emerging Markets Equity Advantage | | | 415,616 | | | | 52,548 | |
| Emerging Markets Equity Blend | | | 2,091,425 | | | | 235,375 | |
| Emerging Markets Equity | | | 193,621,417 | | | | 29,046,492 | |
| Equity Franchise | | | — | | | | — | |
| Global Equity Select | | | 606,714 | | | | 46,020 | |
| Global Listed Infrastructure | | | 191,921,095 | | | | 14,242,009 | |
| Global Strategic Equity Portfolio | | | 30,030 | | | | 2,878 | |
| International Equity Advantage Portfolio | | | 79,807 | | | | 8,446 | |
| International Equity Concentrated Portfolio | | | 1,130,816 | | | | 106,196 | |
| International Equity Portfolio | | | 61,033,493 | | | | 6,693,402 | |
| International Equity Select Portfolio | | | 1,910,274 | | | | 204,446 | |
| International Equity Value Portfolio | | | 82,408 | | | | 8,771 | |
| International Quality Growth Portfolio | | | 71,237 | | | | 9,578 | |
| International Small Cap Equity Portfolio | | | 768,885 | | | | 73,230 | |
| International Strategic Equity Portfolio | | | 116,376,892 | | | | 11,331,503 | |
| Managed Equity Volatility Portfolio | | | — | | | | —- | |
| US Equity Concentrated Portfolio | | | — | | | | — | |
| US Equity Focus Portfolio | | | — | | | | — | |
| US Small-Mid Cap Equity Portfolio | | | — | | | | — | |
| US Sustainable Equity | | | — | | | | — | |
320 Annual Report
Of the dividends paid by the Portfolios, the corresponding amount represents the long-term capital gains paid to shareholders.
| Portfolio | | Long-Term
Capital Gains | |
| | | | | |
| Developing Markets Equity | | $ | — | |
| Emerging Markets Core Equity | | | — | |
| Emerging Markets Equity Advantage | | | 65,751 | |
| Emerging Markets Equity Blend | | | — | |
| Emerging Markets Equity | | | — | |
| Equity Franchise | | | 18,209 | |
| Global Equity Select | | | 7,134,923 | |
| Global Listed Infrastructure | | | 133,696,404 | |
| Global Strategic Equity Portfolio | | | 104,380 | |
| International Equity Advantage Portfolio | | | — | |
| International Equity Concentrated Portfolio | | | — | |
| International Equity Portfolio | | | — | |
| International Equity Select Portfolio | | | — | |
| International Equity Value Portfolio | | | — | |
| International Quality Growth Portfolio | | | 81,523 | |
| International Small Cap Equity Portfolio | | | — | |
| International Strategic Equity Portfolio | | | — | |
| Managed Equity Volatility Portfolio | | | 373,644 | |
| US Equity Concentrated Portfolio | | | 21,982,543 | |
| US Equity Focus Portfolio | | | 2,312,928 | |
| US Small-Mid Cap Equity Portfolio | | | 602,919 | |
| US Sustainable Equity | | | 24 | |
Annual Report 321
Proxy Voting
A description of the policies and procedures used to determine how proxies relating to Fund portfolio securities are voted is available (1) without charge, upon request, by calling (800) 823-6300 or (2) on the Securities and Exchange Commission (the “SEC”) website at https://www.sec.gov.
The Fund’s proxy voting record for the most recent 12-month period ended June 30 is available (1) without charge, upon request, by calling (800) 823-6300 or (2) on the SEC’s website at https://www.sec.gov. Information as of June 30 each year will generally be available by the following August 31.
Schedule of Portfolio Holdings
The Fund files the complete schedule of each Portfolio’s holdings with the SEC for the first and third quarters of each fiscal year as an exhibit to its reports on Form N-PORT.The Fund’s Form N-PORT reports are available on the SEC’s website at https://www.sec.gov.
322 Annual Report
NOTES
NOTES
NOTES
NOTES
NOTES
NOTES
The Lazard Funds, Inc.
30 Rockefeller Plaza
New York, New York 10112-6300
Telephone: 800-823-6300
www.lazardassetmanagement.com
Investment Manager
Lazard Asset Management LLC
30 Rockefeller Plaza
New York, New York 10112-6300
Telephone: 800-823-6300
Distributor
Lazard Asset Management Securities LLC
30 Rockefeller Plaza
New York, New York 10112-6300
Custodian
State Street Bank and Trust Company
One Iron Street
Boston, Massachusetts 02210-1641
Transfer Agent and Dividend Disbursing Agent
DST Asset Manager Solutions, Inc.
2000 Crown Colony Drive
Quincy, Massachusetts 02169-0953
Telephone: 617-483-7000
Independent Registered Public Accounting Firm
Deloitte & Touche LLP
30 Rockefeller Plaza
New York, New York 10112-0015
Legal Counsel
Proskauer Rose LLP
Eleven Times Square
New York, New York 10036-8299
www.proskauer.com

 | |
| | |
| | |
| Lazard Asset Management LLC • 30 Rockefeller Plaza • New York, NY 10112 • www.lazardassetmanagement.com | |
| | |
Performance information as of the most recent month end is available online at www.lazardassetmanagement.com. LZDPS020 |  |

Lazard Funds
Annual Report
December 31, 2020
Fixed Income Funds
Lazard Emerging Markets Debt Portfolio
Lazard Global Fixed Income Portfolio
Lazard US Corporate Income Portfolio
Lazard US Short Duration Fixed Income Portfolio
The Lazard Funds, Inc. Table of Contents
Please consider a Portfolio’s investment objective, risks, charges and expenses carefully before investing. For more complete information about The Lazard Funds, Inc. (the “Fund”), you may obtain a prospectus or a Portfolio’s summary prospectus by calling 800-823-6300, or online, at www.lazardassetmanagement.com. Read the prospectus or the Portfolio’s summary prospectus carefully before you invest. The prospectus and a Portfolio’s summary prospectus contain the investment objective, risks, charges, expenses and other information about the Portfolio, which are not detailed in this report.
Distributed by Lazard Asset Management Securities LLC.
Annual Report 1
The Lazard Funds, Inc. A Message from Lazard (unaudited)
Dear Shareholder,
As 2020 began, the outbreak of a novel coronavirus (“COVID-19”) turned into a fast-spreading pandemic, rattling global markets. Worldwide lockdowns led to a severe equity market sell-off in February and March, as well as a sharp decline in oil markets. By the conclusion of the year, COVID-19 continued to wreak havoc across much of the world, but many global equity markets closed 2020 near all-time highs. Markets generally rose steadily after the selloff on the back of unprecedented support from global central banks and government treasuries and the introduction of several promising vaccines.
In the United States, Democrats won control of the White House and Congress in November elections. The US equity market closed 2020 near an all-time peak, and nominal yields in various US fixed income market segments closed at or near all-time lows, fueled by trillions of dollars in monetary and fiscal stimulus.
COVID-19 also severely debilitated economic activity in the emerging markets, but the recovery in emerging markets equities that began in late March picked up steam in the fourth quarter thanks to vaccine breakthroughs and the US election outcome. As a result, the MSCI Emerging Markets® Index outperformed global developed markets equities in 2020.
In Europe, interest rates have never been as low, and central bank balance sheets have never been as inflated, as they were at year-end. With an agreement now in place for the exit of the United Kingdom from the European Union, the years-long “Brexit” saga may be one less uncertainty the market has to grapple with in the year ahead.
As we write, many countries are facing record levels of new COVID-19 infections, spurring renewed economic lockdowns and increasing the risk that many companies, particularly small businesses, might not make it to the other side of this pandemic. Were that to happen, it could send a negative signal to markets
2 Annual Report
equal and opposite to the positive news of the vaccines toward the end of the last year. Investors face a timing conundrum, but it could well be darkest before the dawn.
Despite these challenges, we are optimistic for 2021 and believe that as the world does eventually return to something like the pre-pandemic days, fundamental analysis and stock selection will be crucial drivers for performance. We are privileged that you have turned to Lazard for your investment needs and value your continued confidence in our investment management capabilities. We continue to strive for the long-term patterns of performance pursued by the various investment strategies employed.
Sincerely,
Lazard Asset Management LLC
Annual Report 3
The Lazard Funds, Inc. Investment Overviews (unaudited)
Emerging Markets Debt
For the year ended December 31, 2020, emerging markets debt climbed 4.02% (measured in US dollar terms), as hard currency debt advanced 5.26%, while local currency debt gained 2.69%. Sovereign credit spreads peaked in 2020 at over 700 basis points (bps) in March but ended only 60 bps wider than where they began the year. Despite outperforming investment grade bonds by nearly 15% over the eight months ended December 31, 2020, high yield lagged investment grade by 8% on the year because of investment grade’s resilience during the first quarter sell-off. In local debt, emerging markets currencies absorbed much of the first quarter shock—falling 15%—and have been slower to rebound than other parts of the asset class. This does not come as a surprise as currencies are highly cyclical and therefore tend to be the last part of the asset class to rebound following periods of dislocation. Meanwhile, local yields, which are measured as a weighted average of each country’s yield in local currency terms (i.e. unhedged), dropped precipitously in the year, matching the 100 bps rally in the yield of the benchmark 10-year US Treasury note to end the year at an all-time low of 4.22%. After briefly spiking above 6% in mid-March, local currency emerging markets debt yields came down sharply as nearly all central banks in the local currency investment universe cut rates and a number announced quantitative easing programs.
Global Fixed Income
For the year ended December 31, 2020, global bond markets rose sharply despite seesawing risk sentiment amid mixed news flow and formidable macro challenges.
Risk assets began the year positively, thanks to the truce in the US-China trade war, greater clarity on Brexit, and a global monetary easing cycle. However, market optimism gave way to panic selling in mid-February thru the latter part of March, as the coronavirus epidemic that began in China metastasized into a full-scale pandemic and investors worried about the threat it posed to the global economy.
4 Annual Report
With the US Federal Reserve (the “Fed”) taking the lead, central banks worldwide and government fiscal policymakers initiated aggressive stimulus measures to contain the economic fallout from the intensifying viral outbreak. Despite stiffening headwinds, which included severe economic downturns in several countries and regions of the world, these actions buoyed market confidence that central banks and governments would continue to act when necessary to support risk assets and backstop the world economy.
Investor confidence wavered in the latter part of the year amid growing anxiety about the spike in cases across the US, Europe, and elsewhere, as well as the emergence of a new, more infectious strain of the virus. However, news of the development of coronavirus vaccines was greeted enthusiastically by investors, who believed that their successful, widespread deployment would provide a pathway for the world economy to normalize in 2021.
Against this backdrop, most global interest rate markets performed positively in local currency terms across both developed and emerging markets. In addition, global credit indices spanning both investment grade and high yield performed positively for the year, as credit spreads narrowed post the pandemic fueled sell off. Moreover, the new issue market remained strong and issuers took advantage of low yields to repair balance sheets and extend the maturity profile of their debt. Importantly, issuance was met with firm demand from investors with many issues oversubscribed. Currency markets were active but showed wide dispersion. Versus the US dollar in 2020, the Swedish krona was the best performing currency, gaining 13.8%, while the Argentine peso was the worst, losing 28.9% for the year. Major currencies such as the euro and Japanese yen appreciated 8.9% and 5.2%, respectively, for the year. As 2020 came to a close, the US dollar weakened and the US yield curve steepened on the prospect that the new US administration would provide additional fiscal stimulus and the coronavirus vaccines would pave the way for economic growth. In Europe, optimism on a recovery from the pandemic coupled with a resolution on Brexit and weakening of the US dollar provided firmness to the euro.
Annual Report 5
US Corporate Income
Financial markets continued to perform remarkably well in the wake of pandemic-induced volatility experienced earlier in the year. In 2020, the S&P 500 Index was up about 18%, real yields (i.e., interest rates adjusted to remove the effect of inflation) on US investment grade credit were approaching zero and nominal yields (i.e., interest rates before taking inflation into account) on various US high yield indices were at or near all-time lows. The primary market has been similarly robust and record setting- a record $449.9 billion in U.S. high yield issues came to market in 2020. Importantly, this record- breaking supply has been met with healthy demand. In fact, spreads for a large contingent of issuers have retraced most or all of the pandemic- induced widening.
Broad US high yield indices performed well over the year, rebounding from the markdowns suffered earlier in the year. The ICE BofA US Cash Pay High Yield Index finished the year up 6.20%. The option-adjusted spread (OAS) continued to tighten and finished 2020 at 379 bps. After seeing higher quality credits perform well at in the first half of the year, lower quality credits outperformed in the second half. However, for the year ended December 31, 2020, higher quality did lead the performance tables with the BB index’s gain of 8.73% outpacing both the B Index (+3.59%) and the CCC Index (+2.78%), per ICE.
High yield issuance for 2020 was record breaking with the second quarter ($145.5 billion) and third quarter ($131.9 billion) the top two quarters for issuance on record. Inflows in 2020 totals were $449.9 billion (gross), a 57% increase over 2019’s $286.6 billion, and eclipsing the previous yearly record of $398.5 billion in 2013. For the year, refinancing (66%) was the leading use of proceeds, followed by general corporate purposes (25%), and acquisition financing (9%).
Fund flows were marked by strong outflows experienced during the initial days of the pandemic but reversed strongly the balance
6 Annual Report
of the year. Year-to-date inflows totaled $44 billion, which outpaced 2019’s yearly total of $18.8 billion.
Defaults increased in the year. At the end of December, the US high yield par-weighted default rate, including distressed exchanges, was 6.67%, a 3.90% increase year over year. However, most of the defaults were in energy sector and, excluding energy, the US high yield par-weighted default rate, including distressed exchanges was 4.46%.
US Short Duration Fixed Income
The Fed was swift in lowering benchmark rates, providing backstop facilities and engaging in quantitative easing in the wake of the pandemic-induced fall in asset prices and tightening of liquidity. This caused interest rates to fall across the curve, risk assets to recover, and primary markets to be robust with activity. Importantly, the Fed has indicated that interest rate policy is likely to remain zero bound until it is clear employment and growth have recovered. In fact, they have indicated they are willing to let inflation run higher than their 2% target. Moreover, the accommodative monetary policy and the prospect for increased fiscal stimulus should continue to lead to a steepening of the yield curve and an increase in inflation expectations, which may encourage risk taking as investors look for yield.
Effective monetary and fiscal programs enabled a wide variety of assets to performed positively for the year, including equities, investment grade credit, high yield credit, and US Treasuries securities of all durations. This positive performance occurred despite remaining uncertainties that certain areas of the economy will recover and not be scarred by the pandemic.
Annual Report 7
Lazard Emerging Markets Debt Portfolio
For the year ended December 31, 2020, the Lazard Emerging Markets Debt Portfolio’s Institutional Shares posted a total return of 3.19%, while Open Shares posted a total return of 3.11% and R6 Shares posted a total return of 3.30%, as compared with the 4.02% return for the Global Diversified Index.
Relative performance for the year was driven almost entirely by bottom-up decisions. Local interest rate and local currency selection both contributed positively to performance but were partially offset by negative attribution in hard currency sovereign debt. We were relatively conservatively positioned coming into the year with a local duration overweight and very little active exposure to high yield currencies, which helped during the first quarter sell-off. Following the market sell-off, we repositioned the Portfolio and added currency risk in Asian and European currencies on the view that these regions would lead the rebound in global growth and later began rotating into the higher yielding currencies that we favor currently. The underperformance in hard currency debt occurred mainly during the first quarter sell-off, though we maintained conviction in our bottom-up picks and recouped a portion of these losses throughout the remainder of the year. We began the year with limited exposure to high yield credits and a focus on short-dated debt in B-rated countries on an improving structural reform trajectory (e.g., Ukraine) and countries trading at distressed levels where we saw significant upside potential in restructuring (e.g., Argentina, Lebanon, and Venezuela). The distressed countries were the main detractors from performance as they sold-off more than the broader market of emerging markets debt. Our decision to increase high yield exposure following the sell-off proved beneficial, as a number of BB and B rated credits such as Mexican state-owned oil company PEMEX and Angola’s sovereign debt boosted returns.
The Portfolio management team uses currency forwards and interest rates swaps, both opportunistically, for direct currency and interest rates exposure, and defensively, for hedging purposes. For the year, the use of derivatives contributed positively to the Portfolio’s relative performance.
8 Annual Report
Lazard Global Fixed Income Portfolio
For the year ended December 31, 2020, the Lazard Global Fixed Income Portfolio’s Institutional Shares posted a total return of 9.51%, while Open Shares posted a total return of 9.23%, as compared with the 9.20% return for the Bloomberg Barclays Global Aggregate® Index.
The Portfolio’s performance was helped by country allocations, with its diversified market value and duration overweight exposures to the United States, Australia, New Zealand, Canada, Eastern Europe, Norway, and Peru, as well as its underweight interest rate exposure to Japan. Conversely, the portfolio’s underweight exposure to core Europe detracted from returns. The Portfolio’s euro proxy hedges (underweight to the euro and overweight to a diversified basket of correlated European currencies) detracted from returns; however, this was partially offset by the enhanced yield/carry from that positioning. Modest exposure to the Mexican peso earlier in the year also detracted from performance. Security selection contributed positively in many global regions, including the United States, Canada, Australia, and Norway. However, in the euro zone, it detracted from performance given the underweight exposure to debt from peripheral countries in the bloc and spread product in that region.
The Portfolio management team utilizes forward currency contracts, both opportunistically and defensively, for hedging purposes. In aggregate, currency positioning (defined as the net currency exposure of underlying bonds plus currency hedges) produced a modestly negative contribution to the relative performance during the year.
Lazard US Corporate Income Portfolio
For the year ended December 31, 2020, the Lazard US Corporate Income Portfolio’s Institutional Shares posted a total return of 4.96%, while Open Shares posted a total return of 4.80%, and R6 Shares posted a total return of 4.89%, as compared with the 6.19% return for the ICE BofAML BB-B US Cash Pay Non-Distressed High Yield® Index (the “Cash Pay Index”).
Annual Report 9
Relative underperformance versus the benchmark index was driven by the Portfolio’s higher credit quality and shorter duration. Most industry sectors continued their recovery from the lows and posted positive returns for the year. On a relative basis, overweights to the capital goods and technology sectors, and an underweight to the energy sector, contributed to performance. Conversely, overweights to the automotive and consumer goods sectors detracted from relative performance. At a security level, the Delphi 5% due 2025 advanced after the gear maker was purchased by its rival, BorgWarner, which has an investment grade rating. Southwestern Energy (SWN) 4.95% due 2025 performed well, as energy prices continued their recovery and stabilization from the pandemic lows. Among the securities that had a negative absolute return to the Portfolio, the position in Hertz 5.5% due 2024 was negatively affected by the pandemic’s impact on travel and the car rental company’s airport focused business model. Also, the position in PBF Energy (PBFENE) 6% due 2028 was marginally lower due to a drop in fuel demand, especially from the aviation industry.
The Portfolio maintains an overweight to BBB credits, and an underweight to BB and B credits versus the index. The Portfolio’s OAS of 281 bps; continues to be lower than the Cash Pay Index’s 318 bp OAS. Yields continued to move lower, with the Portfolio now yielding 3.25% versus 3.59% for the index. The Portfolio’s effective duration as of December 31, 2020 of 2.89 years remains below the index’s 3.85.
Lazard US Short Duration Fixed Income Portfolio
For the year ended December 31, 2020, the Lazard US Short Duration Fixed Income Portfolio’s Institutional Shares posted a total return of 2.46%, while Open Shares posted a total return of 2.20%, as compared with the 3.10% return for the ICE BofAML 1-3 Year US Treasury® Index.
An underweight allocation to securities with a 2 to 3 year duration hurt relative performance as the Fed cut interest rates and rates across the curve moved lower. However, the Portfolio was overweight in spread products, such as corporate credit and consumer asset-backed securities (“ABS”), which helped relative performance.
10 Annual Report
The Portfolio continues to maintain a shorter duration than its relative index, by continuing to be underweight in securities with 2 to 3 year durations. It is also underweight in US treasury securities relative to the index. Additionally, the Portfolio maintains an overweight position in US corporate bonds and consumer ABS relative to the index. We continue to favor the financial and consumer discretionary sectors and convexity of the Portfolio remains positive.
Annual Report 11
The Lazard Funds, Inc. Performance Overviews (unaudited)
Lazard Emerging Markets Debt Portfolio
Comparison of Changes in Value of $10,000 Investment in the Institutional Shares of Lazard Emerging Markets Debt Portfolio, the JPMorgan EMBI Global Diversified® Index, the JPMorgan GBI-EM Global Diversified® Index and the Global Diversified Index*
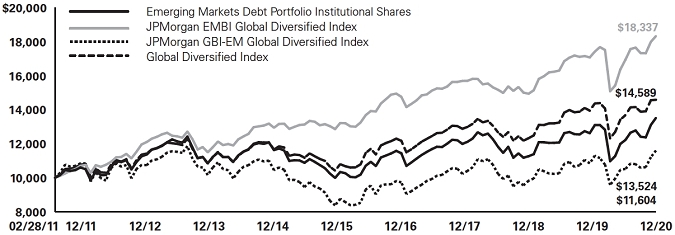
Average Annual Total Returns*
Periods Ended December 31, 2020
| | | One
Year | | Five
Years | | Since
Inception† | |
| Institutional Shares** | | 3.19% | | 6.11% | | 3.11% | |
| Open Shares** | | 3.11% | | 5.85% | | 2.85% | |
| R6 Shares** | | 3.30% | | N/A | | 4.34% | |
| JPMorgan EMBI Global Diversified Index | | 5.26% | | 7.08% | | 6.36% | |
| | | | | | | (Institutional
and Open
Shares)
5.26%
(R6 Shares) | |
| JPMorgan GBI-EM Global Diversified Index | | 2.69% | | 6.72% | | 1.52% | |
| | | | | | | (Institutional
and Open
Shares)
4.57%
(R6 Shares) | |
| Global Diversified Index | | 4.02% | | 6.97% | | 3.99% | |
| | | | | | | (Institutional
and Open
Shares)
4.97%
(R6 Shares) | |
| † | The inception date for the Institutional and Open Shares was February 28, 2011 and for the R6 Shares was July 28, 2016. |
12 Annual Report
Lazard Global Fixed Income Portfolio
Comparison of Changes in Value of $10,000 Investment in the Institutional Shares of Lazard Global Fixed Income Portfolio and the Bloomberg Barclays Global Aggregate® Index*

Average Annual Total Returns*
Periods Ended December 31, 2020
| | | One
Year | | Five
Years | | Since
Inception† | |
| Institutional Shares** | | 9.51% | | 4.46% | | 1.94% | |
| Open Shares** | | 9.23% | | 4.17% | | 1.65% | |
| Bloomberg Barclays Global Aggregate Index | | 9.20% | | 4.79% | | 2.49% | |
| † | The inception date for the Portfolio was March 30, 2012. |
Annual Report 13
Lazard US Corporate Income Portfolio
Comparison of Changes in Value of $10,000 Investment in the Institutional Shares of Lazard US Corporate Income Portfolio and Cash Pay Index*
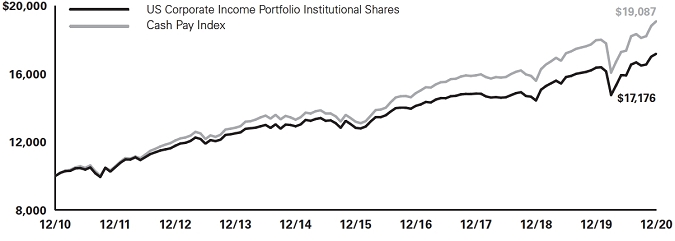
Average Annual Total Returns*
Periods Ended December 31, 2020
| | | One
Year | | Five
Years | | Ten
Years | | Since
Inception† | |
| Institutional Shares** | | 4.96% | | 6.01% | | 5.56% | | 4.46% | |
| Open Shares** | | 4.80% | | 5.72% | | 5.26% | | 3.98% | |
| R6 Shares** | | 4.89% | | N/A | | N/A | | 4.61% | |
| Cash Pay Index | | 6.19% | | 7.68% | | 6.68% | | 6.51% | |
| | | | | | | | | (Institutional
Shares)
6.46%
(Open Shares)
6.66%
(R6 Shares) | |
| † | The inception date for the Institutional Shares was January 2, 1998, for the Open Shares was February 24, 1998 and for the R6 Shares was November 3, 2016. |
14 Annual Report
Lazard US Short Duration Fixed Income Portfolio
Comparison of Changes in Value of $10,000 Investment in the Institutional Shares of Lazard US Short Duration Fixed Income Portfolio and the ICE BofAML 1-3 Year US Treasury® Index*

Average Annual Total Returns*
Periods Ended December 31, 2020
| | | One
Year | | Five
Years | | Since
Inception | † |
| Institutional Shares** | | 2.46% | | 1.63% | | 1.44% | |
| Open Shares** | | 2.20% | | 1.34% | | 1.27% | |
| ICE BofAML 1-3 Year US Treasury Index | | 3.10% | | 1.90% | | 1.31% | |
| † | The inception date for the Portfolio was February 28, 2011. |
Notes to Performance Overviews:
| * | Total returns reflect reinvestment of all dividends and distributions, if any. Certain expenses of the Portfolio may have been waived or reimbursed by Lazard Asset Management LLC, the Fund’s investment manager (the “Investment Manager”), State Street Bank and Trust Company, the Fund’s administrator (“State Street”), or DST Asset Manager Solutions, Inc., the Fund’s transfer agent and dividend disbursing agent (“DST”); without such waiver/reimbursement of expenses, the Portfolio’s returns would have been lower. |
| | |
| | Performance results do not include adjustments made for financial reporting purposes in accordance with US Generally Accepted Accounting Principles (“GAAP”), if any, and also exclude one-time adjustments related to reimbursed custodian out-of-pocket expenses (Note 3 in the Notes to Financial Statements) for The Emerging Markets Debt Portfolio and settlement proceeds received from a class action lawsuit by The US Corporate Income Portfolio which impacted the total return of R6 Shares but did not impact that of Institutional or Open; amounts may differ from amounts reported in the financial highlights. |
| | |
| | The performance quoted represents past performance. Current performance may be lower or higher than the performance quoted. Past performance is not indicative, or a guarantee, of future results; the investment return and principal value of the Portfolio will fluctuate, so that Portfolio shares, when redeemed, may be worth more or less than their original cost. Within the longer periods illustrated there may have been short-term fluctuations, counter to the overall trend of investment results, and no single period of any length may be taken as typical of what may be expected in future periods. The graph and table above do not reflect the deduction of taxes that a shareholder would pay on the Portfolio’s distributions or the redemption of Portfolio shares. |
Annual Report 15
| | The performance data of the indices have been prepared from sources and data that the Investment Manager believes to be reliable, but no representation is made as to their accuracy. The indices are unmanaged, have no fees or costs and are not available for investment. |
| | |
| | The JPMorgan Emerging Markets Bond index (“EMBI”) Global Diversified Index is an unmanaged index of debt instruments of 31 emerging countries. The JPMorgan Government Bond Index-Emerging Markets (“GBI-EM”) Global Diversified Index is a comprehensive Emerging Markets index that consists of regularly traded, liquid, fixed-rate, domestic currency government bonds to which international investors can gain exposure. These indices limit the weights of those index countries with larger debt stocks by only including specified portions of these countries’ eligible current face amounts of debt outstanding. The same countries are covered in both indices. |
| | |
| | The Global Diversified Index is an unmanaged index created by the Investment Manager and is a 50/50 blend of the JPMorgan EMBI Global Diversified Index and the JPMorgan GBI-EM Global Diversified Index. |
| | |
| | The government-related debt, corporate debt, and securitized debt provides a broad-based measure of global investment-grade fixed-income debt markets, including government-related debt, corporate debt and securitized debt. |
| | |
| | The Cash Pay Index is The ICE Bank of America Merrill Lynch High Yield (“BofAML”) BB-B US Cash Pay Non-Distressed High Yield® Index. It is constructed to mirror the BB-B non-distressed sector of the public high yield corporate debt market and is a subset of the ICE BofAML High Yield Cash Pay® Index. |
| | |
| | The ICE BofAML 1-3 Year US Treasury Index tracks the performance of the direct sovereign debt of the US government having a maturity of at least one year and less than three years. |
| | |
| ** | The performance of Institutional Shares, Open Shares and R6 Shares may vary, primarily based on the differences in fees borne by shareholders investing in different classes. |
16 Annual Report
The Lazard Funds, Inc.
Information About Your Portfolio’s Expenses (unaudited)
Expense Example
As a shareholder in a Portfolio, you incur ongoing costs, including management fees, distribution and service (12b-1) fees (Open Shares only), and other expenses. This Example is intended to help you understand your ongoing costs (in dollars) of investing in a Portfolio and to compare these costs with the ongoing costs of investing in other mutual funds. The Example is based on an investment of $1,000 invested at the beginning of the six month period from July 1, 2020 through December 31, 2020 and held for the entire period.
Actual Expenses
For each share class of the Portfolios, the first line of the accompanying table provides information about actual account values and actual expenses. You may use the information in this line, together with the amount you invested, to estimate the expenses that you paid over the period. Simply divide your account value by $1,000 (for example, an $8,600 account value divided by $1,000=8.6), then multiply the result by the number in the first line under the heading entitled “Expenses Paid During Period” to estimate the expenses you paid on your account during this period.
Hypothetical Example for Comparison Purposes
For each share class of the Portfolios, the second line of the accompanying table provides information about hypothetical account values and hypothetical expenses based on the class’ actual expense ratio and an assumed rate of return of 5% per year before expenses, which is not the Portfolio’s actual return. The hypothetical account values and expenses may not be used to estimate the actual ending account balance or expenses you paid for the period. You may use this information to compare the ongoing costs of investing in the Portfolio and other mutual funds. To do so, compare this 5% hypothetical example with the 5% hypothetical examples that appear in the shareholder reports of other mutual funds.
Annual Report 17
| Portfolio | | Beginning
Account
Value
7/1/20 | | | Ending
Account
Value
12/31/20 | | | Expenses
Paid During
Period*
7/1/20 -
12/31/20 | | | Annualized
Expense Ratio
During Period
7/1/20 -
12/31/20 | | |
| | | | | | | | | | | | | | | | | | |
| Emerging Markets Debt | | | | | | | | | | | | | | | | | |
| Institutional Shares | | | | | | | | | | | | | | | | | |
| Actual | | $ | 1,000.00 | | | $ | 1,106.10 | | | $ | 4.55 | | | | 0.86% | | |
| Hypothetical (5% Return Before Expenses) | | $ | 1,000.00 | | | $ | 1,020.81 | | | $ | 4.37 | | | | 0.86% | | |
| Open Shares | | | | | | | | | | | | | | | | | |
| Actual | | $ | 1,000.00 | | | $ | 1,105.10 | | | $ | 4.55 | | | | 0.86% | | |
| Hypothetical (5% Return Before Expenses) | | $ | 1,000.00 | | | $ | 1,020.81 | | | $ | 4.37 | | | | 0.86% | | |
| R6 Shares | | | | | | | | | | | | | | | | | |
| Actual | | $ | 1,000.00 | | | $ | 1,105.40 | | | $ | 4.34 | | | | 0.82% | | |
| Hypothetical (5% Return Before Expenses) | | $ | 1,000.00 | | | $ | 1,021.01 | | | $ | 4.17 | | | | 0.82% | | |
| | | | | | | | | | | | | | | | | | |
| Global Fixed Income | | | | | | | | | | | | | | | | | |
| Institutional Shares | | | | | | | | | | | | | | | | | |
| Actual | | $ | 1,000.00 | | | $ | 1,063.40 | | | $ | 3.63 | | | | 0.70% | | |
| Hypothetical (5% Return Before Expenses) | | $ | 1,000.00 | | | $ | 1,021.62 | | | $ | 3.56 | | | | 0.70% | | |
| Open Shares | | | | | | | | | | | | | | | | | |
| Actual | | $ | 1,000.00 | | | $ | 1,061.90 | | | $ | 4.92 | | | | 0.95% | | |
| Hypothetical (5% Return Before Expenses) | | $ | 1,000.00 | | | $ | 1,020.36 | | | $ | 4.82 | | | | 0.95% | | |
| | | | | | | | | | | | | | | | | | |
| US Corporate Income | | | | | | | | | | | | | | | | | |
| Institutional Shares | | | | | | | | | | | | | | | | | |
| Actual | | $ | 1,000.00 | | | $ | 1,079.40 | | | $ | 2.87 | | | | 0.55% | | |
| Hypothetical (5% Return Before Expenses) | | $ | 1,000.00 | | | $ | 1,022.37 | | | $ | 2.80 | | | | 0.55% | | |
| Open Shares | | | | | | | | | | | | | | | | | |
| Actual | | $ | 1,000.00 | | | $ | 1,078.80 | | | $ | 4.18 | | | | 0.80% | | |
| Hypothetical (5% Return Before Expenses) | | $ | 1,000.00 | | | $ | 1,021.11 | | | $ | 4.06 | | | | 0.80% | | |
| R6 Shares | | | | | | | | | | | | | | | | | |
| Actual | | $ | 1,000.00 | | | $ | 1,078.50 | | | $ | 2.87 | | | | 0.55% | | |
| Hypothetical (5% Return Before Expenses) | | $ | 1,000.00 | | | $ | 1,022.37 | | | $ | 2.80 | | | | 0.55% | | |
18 Annual Report
| Portfolio | | Beginning
Account
Value
7/1/20 | | | Ending
Account
Value
12/31/20 | | | Expenses
Paid During
Period*
7/1/20 -
12/31/20 | | | Annualized
Expense Ratio
During Period
7/1/20 -
12/31/20 | | |
| | | | | | | | | | | | | | |
| US Short Duration Fixed Income | | | | | | | | | | | | | | | | | |
| Institutional Shares | | | | | | | | | | | | | | | | | |
| Actual | | $ | 1,000.00 | | | $ | 999.50 | | | $ | 2.01 | | | | 0.40% | | |
| Hypothetical (5% Return Before Expenses) | | $ | 1,000.00 | | | $ | 1,023.13 | | | $ | 2.03 | | | | 0.40% | | |
| Open Shares | | | | | | | | | | | | | | | | | |
| Actual | | $ | 1,000.00 | | | $ | 999.20 | | | $ | 3.27 | | | | 0.65% | | |
| Hypothetical (5% Return Before Expenses) | | $ | 1,000.00 | | | $ | 1,021.87 | | | $ | 3.30 | | | | 0.65% | | |
| * | Expenses are equal to the annualized expense ratio, net of expenses waivers and reimbursements, of each share class multiplied by the average account value over the period, multiplied by 184/366 (to reflect one-half year period). |
Annual Report 19
The Lazard Funds, Inc. Portfolio Holdings Presented by
Asset Class/Credit Rating and Region December 31, 2020
| Asset Class/S&P Credit Rating* | | Lazard
Global Fixed
Income
Portfolio | | | Lazard US
Corporate
Income
Portfolio | | | Lazard US
Short Duration
Fixed Income
Portfolio | | |
| | | | | | | | | | | |
| Fixed Income | | | | | | | | | | | | | |
| AAA | | | 23.7 | % | | | — | % | | | 76.4 | % | |
| AA+ | | | 6.6 | | | | — | | | | — | | |
| AA- | | | 6.7 | | | | — | | | | — | | |
| A+ | | | 7.6 | | | | — | | | | — | | |
| A | | | 6.1 | | | | — | | | | — | | |
| A- | | | 7.0 | | | | — | | | | 3.2 | | |
| BBB+ | | | 13.0 | | | | — | | | | 17.5 | | |
| BBB | | | 4.1 | | | | 1.4 | | | | 1.8 | | |
| BBB- | | | 5.7 | | | | 7.8 | | | | — | | |
| BB+ | | | 0.5 | | | | 12.2 | | | | — | | |
| BB | | | 0.5 | | | | 17.3 | | | | — | | |
| BB- | | | 1.8 | | | | 20.5 | | | | — | | |
| B+ | | | — | | | | 8.8 | | | | — | | |
| B | | | — | | | | 9.0 | | | | — | | |
| B- | | | — | | | | 4.6 | | | | — | | |
| CCC+ | | | — | | | | 1.1 | | | | — | | |
| CCC- | | | — | | | | 0.2 | | | | — | | |
| CC | | | — | | | | 1.7 | | | | — | | |
| Not Applicable | | | 12.0 | | | | 9.6 | | | | 0.9 | | |
| No Rating | | | 0.8 | | | | — | | | | — | | |
| Short-Term Investments | | | 3.9 | | | | 5.8 | | | | 0.2 | | |
| Total Investments | | | 100.0 | % | | | 100.0 | % | | | 100.0 | % | |
| | | | | | | | | | | | | |
| Asset Class/Region* | | Lazard
Emerging
Markets Debt
Portfolio | | | | | | | | | | |
| | | | | | | | | | | | | | |
| Fixed Income | | | | | | | | | | | | | |
| Africa | | | 12.8 | % | | | | | | | | | |
| Asia | | | 29.0 | | | | | | | | | | |
| Europe | | | 19.0 | | | | | | | | | | |
| North America | | | 12.8 | | | | | | | | | | |
| South America | | | 14.9 | | | | | | | | | | |
| Short-Term Investments | | | 11.5 | | | | | | | | | | |
| Total Investments | | | 100.0 | % | | | | | | | | | |
| * | Represents percentage of total investments. |
20 Annual Report
The Lazard Funds, Inc. Portfolios of Investments
December 31, 2020
| Description | | Security
Currency | | Principal
Amount
(000) | | | Fair
Value | |
| | | | | | | | | | | |
| Lazard Emerging Markets Debt Portfolio | | | | | | | | | | |
| | | | | | | | | | | |
| Corporate Bonds | 6.5% | | | | | | | | | | |
| | | | | | | | | | | |
| Brazil | 0.9% | | | | | | | | | | |
MV24 Capital BV,
6.748%, 06/01/34 | | USD | | | 189 | | | $ | 207,483 | |
| | | | | | | | | | | |
| India | 1.0% | | | | | | | | | | |
Adani Ports & Special Economic Zone, Ltd.,
4.200%, 08/04/27 | | USD | | | 200 | | | | 214,562 | |
| | | | | | | | | | | |
| Kuwait | 0.9% | | | | | | | | | | |
NBK Tier 1 Financing 2, Ltd.,
4.500% (USD Swap 6 Year + 2.832%),
08/27/25 (§), (¶) | | USD | | | 200 | | | | 203,687 | |
| | | | | | | | | | | |
| Mexico | 2.0% | | | | | | | | | | |
| Petroleos Mexicanos: | | | | | | | | | | |
| 6.875%, 10/16/25 (#) | | USD | | | 60 | | | | 65,619 | |
| 5.350%, 02/12/28 | | USD | | | 130 | | | | 128,375 | |
| 6.500%, 01/23/29 | | USD | | | 85 | | | | 87,709 | |
| 7.690%, 01/23/50 | | USD | | | 35 | | | | 35,289 | |
| 6.950%, 01/28/60 | | USD | | | 135 | | | | 126,779 | |
| | | | | | | | | | 443,771 | |
| Peru | 1.7% | | | | | | | | | | |
Banco de Credito del Peru,
3.125% (CMT 5 Year + 3.000%),
07/01/30 (#), (§) | | USD | | | 100 | | | | 102,750 | |
Fondo MIVIVIENDA SA,
7.000%, 02/14/24 | | PEN | | | 180 | | | | 56,903 | |
Hunt Oil Co. of Peru LLC Sucursal Del Peru,
6.375%, 06/01/28 | | USD | | | 200 | | | | 217,750 | |
| | | | | | | | | | 377,403 | |
Total Corporate Bonds
(Cost $1,398,536) | | | | | | | | | 1,446,906 | |
The accompanying notes are an integral part of these financial statements.
Annual Report 21
| Description | | Security
Currency | | Principal
Amount
(000) | | | Fair
Value | |
| | | | | | | | | | | |
| Lazard Emerging Markets Debt Portfolio (continued) | | | | | | | | | | |
| | | | | | | | | | | |
| Foreign Government Obligations | 79.6% | | | | | | | | | | |
| | | | | | | | | | | |
| Angola | 1.5% | | | | | | | | | | |
Republic of Angola,
8.000%, 11/26/29 | | USD | | | 360 | | | $ | 338,512 | |
| | | | | | | | | | | |
| Argentina | 0.9% | | | | | | | | | | |
| Republic of Argentina: | | | | | | | | | | |
| 1.000%, 07/09/29 | | USD | | | 33 | | | | 14,518 | |
| 0.125%, 07/09/30 (Ø) | | USD | | | 109 | | | | 44,421 | |
| 0.125%, 07/09/35 (Ø) | | USD | | | 286 | | | | 104,632 | |
| 0.125%, 01/09/38 (Ø) | | USD | | | 64 | | | | 26,271 | |
| | | | | | | | | | 189,842 | |
| Azerbaijan | 1.0% | | | | | | | | | | |
Republic of Azerbaijan,
3.500%, 09/01/32 | | USD | | | 200 | | | | 211,125 | |
| | | | | | | | | | | |
| Bahamas | 0.5% | | | | | | | | | | |
Commonwealth of Bahamas,
8.950%, 10/15/32 | | USD | | | 100 | | | | 108,875 | |
| | | | | | | | | | | |
| Bahrain | 1.2% | | | | | | | | | | |
Bahrain Government International Bond,
6.750%, 09/20/29 | | USD | | | 230 | | | | 263,781 | |
| | | | | | | | | | | |
| Barbados | 0.0% | | | | | | | | | | |
Barbados Government International Bonds,
6.500%, 10/01/29 (#) | | USD | | | 10 | | | | 10,106 | |
| | | | | | | | | | | |
| Belarus | 0.9% | | | | | | | | | | |
Republic of Belarus,
5.875%, 02/24/26 | | USD | | | 200 | | | | 205,000 | |
| | | | | | | | | | | |
| Belize | 0.0% | | | | | | | | | | |
Republic of Belize,
4.938%, 02/20/34 | | USD | | | 16 | | | | 7,090 | |
The accompanying notes are an integral part of these financial statements.
22 Annual Report
| Description | | Security
Currency | | Principal
Amount
(000) | | | Fair
Value | |
| | | | | | | | | | | |
| Lazard Emerging Markets Debt Portfolio (continued) | | | | | | | | | | |
| | | | | | | | | | | |
| Brazil | 4.2% | | | | | | | | | | |
Brazil Letras do Tesouro Nacional,
0.000%, 01/01/24 | | BRL | | | 2,800 | | | $ | 461,157 | |
Brazil NTN-F,
10.000%, 01/01/25 | | BRL | | | 690 | | | | 153,570 | |
| Federal Republic of Brazil: | | | | | | | | | | |
| 2.875%, 06/06/25 | | USD | | | 25 | | | | 26,050 | |
| 4.500%, 05/30/29 | | USD | | | 115 | | | | 127,794 | |
| 3.875%, 06/12/30 | | USD | | | 100 | | | | 105,500 | |
| 5.625%, 02/21/47 | | USD | | | 25 | | | | 29,805 | |
| 4.750%, 01/14/50 | | USD | | | 30 | | | | 32,006 | |
| | | | | | | | | | 935,882 | |
| Chile | 0.7% | | | | | | | | | | |
| Bonos de la Tesoreria de la Republica en pesos: | | | | | | | | | | |
| 4.500%, 03/01/26 | | CLP | | | 40,000 | | | | 64,549 | |
| 2.300%, 10/01/28 | | CLP | | | 25,000 | | | | 35,020 | |
| 2.800%, 10/01/33 | | CLP | | | 25,000 | | | | 33,785 | |
| 6.000%, 01/01/43 | | CLP | | | 10,000 | | | | 19,041 | |
| | | | | | | | | | 152,395 | |
| China | 6.0% | | | | | | | | | | |
| China Development Bank: | | | | | | | | | | |
| 1.860%, 04/09/23 | | CNY | | | 2,890 | | | | 429,349 | |
| 3.500%, 08/13/26 | | CNY | | | 3,050 | | | | 468,539 | |
| 3.450%, 09/20/29 | | CNY | | | 390 | | | | 58,561 | |
| China Government Bonds: | | | | | | | | | | |
| 2.360%, 07/02/23 | | CNY | | | 700 | | | | 105,748 | |
| 3.120%, 12/05/26 | | CNY | | | 1,340 | | | | 204,789 | |
| 2.680%, 05/21/30 | | CNY | | | 460 | | | | 67,401 | |
| | | | | | | | | | 1,334,387 | |
| Colombia | 4.4% | | | | | | | | | | |
| Colombia Government International Bond: | | | | | | | | | | |
| 3.000%, 01/30/30 | | USD | | | 60 | | | | 63,037 | |
| 5.200%, 05/15/49 | | USD | | | 40 | | | | 50,563 | |
| Colombian Titulos De Tesoreria: | | | | | | | | | | |
| 6.250%, 11/26/25 | | COP | | | 768,300 | | | | 246,234 | |
| 7.500%, 08/26/26 | | COP | | | 757,000 | | | | 255,421 | |
The accompanying notes are an integral part of these financial statements.
Annual Report 23
| Description | | Security
Currency | | Principal
Amount
(000) | | | Fair
Value | |
| | | | | | | | | | | |
| Lazard Emerging Markets Debt Portfolio (continued) | | | | | | | | | | |
| | | | | | | | | | | |
| 6.000%, 04/28/28 | | COP | | | 289,800 | | | $ | 90,559 | |
| 7.000%, 06/30/32 | | COP | | | 224,000 | | | | 72,138 | |
| Republic of Colombia: | | | | | | | | | | |
| 4.500%, 01/28/26 | | USD | | | 65 | | | | 73,714 | |
| 3.875%, 04/25/27 | | USD | | | 65 | | | | 72,247 | |
| 4.500%, 03/15/29 | | USD | | | 30 | | | | 34,650 | |
| 3.125%, 04/15/31 | | USD | | | 30 | | | | 31,845 | |
| | | | | | | | | | 990,408 | |
| Costa Rica | 0.4% | | | | | | | | | | |
| Republic of Costa Rica: | | | | | | | | | | |
| 4.250%, 01/26/23 | | USD | | | 25 | | | | 24,000 | |
| 4.375%, 04/30/25 | | USD | | | 25 | | | | 23,266 | |
| 7.158%, 03/12/45 | | USD | | | 40 | | | | 36,987 | |
| | | | | | | | | | 84,253 | |
| Czech Republic | 1.3% | | | | | | | | | | |
| Czech Republic: | | | | | | | | | | |
| 2.500%, 08/25/28 | | CZK | | | 1,120 | | | | 57,650 | |
| 1.200%, 03/13/31 | | CZK | | | 1,890 | | | | 87,165 | |
| 4.200%, 12/04/36 | | CZK | | | 2,080 | | | | 135,202 | |
| | | | | | | | | | 280,017 | |
| Dominican Republic | 1.3% | | | | | | | | | | |
| Dominican Republic: | | | | | | | | | | |
| 5.500%, 01/27/25 | | USD | | | 40 | | | | 45,112 | |
| 5.950%, 01/25/27 | | USD | | | 55 | | | | 64,161 | |
| 4.500%, 01/30/30 | | USD | | | 35 | | | | 37,877 | |
| 7.450%, 04/30/44 | | USD | | | 15 | | | | 19,341 | |
| 6.400%, 06/05/49 | | USD | | | 70 | | | | 82,184 | |
| 5.875%, 01/30/60 | | USD | | | 40 | | | | 43,850 | |
| | | | | | | | | | 292,525 | |
| Ecuador | 0.5% | | | | | | | | | | |
| Republic of Ecuador: | | | | | | | | | | |
| 0.000%, 07/31/30 (#) | | USD | | | 13 | | | | 6,038 | |
| 0.500%, 07/31/30 (#), (Ø) | | USD | | | 54 | | | | 34,631 | |
| 0.500%, 07/31/35 (#), (Ø) | | USD | | | 73 | | | | 39,762 | |
| 0.500%, 07/31/40 (#), (Ø) | | USD | | | 47 | | | | 23,754 | |
| | | | | | | | | | 104,185 | |
The accompanying notes are an integral part of these financial statements.
24 Annual Report
| Description | | Security
Currency | | Principal
Amount
(000) | | | Fair
Value | |
| | | | | | | | | | | |
| Lazard Emerging Markets Debt Portfolio (continued) | | | | | | | | | | |
| | | | | | | | | | | |
| Egypt | 1.0% | | | | | | | | | | |
Arab Republic of Egypt,
5.577%, 02/21/23 | | USD | | | 200 | | | $ | 211,250 | |
| | | | | | | | | | | |
| El Salvador | 0.5% | | | | | | | | | | |
| Republic of El Salvador: | | | | | | | | | | |
| 5.875%, 01/30/25 | | USD | | | 25 | | | | 23,547 | |
| 7.650%, 06/15/35 | | USD | | | 20 | | | | 18,825 | |
| 7.125%, 01/20/50 | | USD | | | 75 | | | | 66,797 | |
| | | | | | | | | | 109,169 | |
| Ghana | 1.1% | | | | | | | | | | |
Republic of Ghana,
7.625%, 05/16/29 | | USD | | | 225 | | | | 238,570 | |
| | | | | | | | | | | |
| Guatemala | 0.6% | | | | | | | | | | |
Guatemala Government Bonds,
5.375%, 04/24/32 | | USD | | | 10 | | | | 12,163 | |
| Republic of Guatemala: | | | | | | | | | | |
| 4.875%, 02/13/28 | | USD | | | 25 | | | | 28,625 | |
| 5.375%, 04/24/32 (#) | | USD | | | 50 | | | | 60,812 | |
| 6.125%, 06/01/50 (#) | | USD | | | 30 | | | | 39,563 | |
| | | | | | | | | | 141,163 | |
| Honduras | 0.2% | | | | | | | | | | |
Republic of Honduras,
6.250%, 01/19/27 | | USD | | | 35 | | | | 40,447 | |
| | | | | | | | | | | |
| Hungary | 1.3% | | | | | | | | | | |
| Hungary Government Bonds: | | | | | | | | | | |
| 2.500%, 10/24/24 | | HUF | | | 46,110 | | | | 164,124 | |
| 3.000%, 10/27/27 | | HUF | | | 34,330 | | | | 126,557 | |
| | | | | | | | | | 290,681 | |
| Indonesia | 5.4% | | | | | | | | | | |
| Indonesia Government Bonds: | | | | | | | | | | |
| 8.375%, 09/15/26 | | IDR | | | 1,711,000 | | | | 138,524 | |
| 7.000%, 05/15/27 | | IDR | | | 1,184,000 | | | | 89,790 | |
| 9.000%, 03/15/29 | | IDR | | | 1,275,000 | | | | 107,354 | |
The accompanying notes are an integral part of these financial statements.
Annual Report 25
| Description | | Security
Currency | | Principal
Amount
(000) | | | Fair
Value | |
| | | | | | | | | | | |
| Lazard Emerging Markets Debt Portfolio (continued) | | | | | | | | | | |
| | | | | | | | | | | |
| 8.250%, 05/15/29 | | IDR | | | 1,545,000 | | | $ | 125,524 | |
| 7.000%, 09/15/30 | | IDR | | | 1,032,000 | | | | 78,594 | |
| 6.500%, 02/15/31 | | IDR | | | 497,000 | | | | 36,771 | |
| 8.750%, 05/15/31 | | IDR | | | 1,150,000 | | | | 96,584 | |
| 8.375%, 03/15/34 | | IDR | | | 1,165,000 | | | | 96,185 | |
| 8.250%, 05/15/36 | | IDR | | | 622,000 | | | | 51,132 | |
| 8.375%, 04/15/39 | | IDR | | | 920,000 | | | | 76,612 | |
| Republic of Indonesia: | | | | | | | | | | |
| 5.875%, 01/15/24 | | USD | | | 60 | | | | 69,000 | |
| 4.125%, 01/15/25 | | USD | | | 75 | | | | 83,930 | |
| 4.750%, 01/08/26 | | USD | | | 55 | | | | 64,230 | |
| 4.350%, 01/11/48 | | USD | | | 20 | | | | 23,837 | |
| 3.700%, 10/30/49 | | USD | | | 10 | | | | 10,938 | |
| 3.500%, 02/14/50 | | USD | | | 40 | | | | 43,337 | |
| | | | | | | | | | 1,192,342 | |
| Iraq | 1.0% | | | | | | | | | | |
Republic of Iraq,
5.800%, 01/15/28 | | USD | | | 234 | | | | 217,676 | |
| | | | | | | | | | | |
| Ivory Coast | 1.0% | | | | | | | | | | |
Ivory Coast,
6.125%, 06/15/33 | | USD | | | 200 | | | | 225,313 | |
| | | | | | | | | | | |
| Jamaica | 0.4% | | | | | | | | | | |
| Government of Jamaica: | | | | | | | | | | |
| 6.750%, 04/28/28 | | USD | | | 25 | | | | 30,414 | |
| 8.000%, 03/15/39 | | USD | | | 15 | | | | 21,829 | |
| 7.875%, 07/28/45 | | USD | | | 20 | | | | 28,594 | |
| | | | | | | | | | 80,837 | |
| Kenya | 1.3% | | | | | | | | | | |
Republic of Kenya,
8.000%, 05/22/32 | | USD | | | 250 | | | | 291,328 | |
The accompanying notes are an integral part of these financial statements.
26 Annual Report
| Description | | Security
Currency | | Principal
Amount
(000) | | | Fair
Value | |
| | | | | | | | | |
| Lazard Emerging Markets Debt Portfolio (continued) | | | | | | | | |
| | | | | | | | | | | |
| Lebanon | 0.8% | | | | | | | | | | |
| Lebanese Republic: | | | | | | | | | | |
| 6.375%, 03/09/20 («) | | USD | | | 107 | | | $ | 13,375 | |
| 8.250%, 04/12/21 («) | | USD | | | 211 | | | | 25,320 | |
| 6.100%, 10/04/22 («) | | USD | | | 227 | | | | 27,240 | |
| 6.000%, 01/27/23 («) | | USD | | | 191 | | | | 22,920 | |
| 6.650%, 04/22/24 («) | | USD | | | 87 | | | | 10,440 | |
| 6.250%, 11/04/24 («) | | USD | | | 116 | | | | 13,920 | |
| 6.200%, 02/26/25 («) | | USD | | | 37 | | | | 4,440 | |
| 6.600%, 11/27/26 («) | | USD | | | 104 | | | | 12,480 | |
| 6.850%, 03/23/27 («) | | USD | | | 124 | | | | 14,880 | |
| 6.750%, 11/29/27 («) | | USD | | | 52 | | | | 6,240 | |
| 6.650%, 02/26/30 («) | | USD | | | 109 | | | | 13,080 | |
| 7.000%, 03/23/32 («) | | USD | | | 59 | | | | 7,080 | |
| 7.050%, 11/02/35 («) | | USD | | | 60 | | | | 7,200 | |
| 7.250%, 03/23/37 («) | | USD | | | 55 | | | | 6,600 | |
| | | | | | | | | | 185,215 | |
| Malaysia | 4.1% | | | | | | | | | | |
| Malaysia Government Bonds: | | | | | | | | | | |
| 3.441%, 02/15/21 | | MYR | | | 120 | | | | 29,890 | |
| 4.160%, 07/15/21 | | MYR | | | 70 | | | | 17,609 | |
| 3.882%, 03/10/22 | | MYR | | | 706 | | | | 179,637 | |
| 3.800%, 08/17/23 | | MYR | | | 760 | | | | 197,853 | |
| 3.478%, 06/14/24 | | MYR | | | 91 | | | | 23,697 | |
| 3.955%, 09/15/25 | | MYR | | | 610 | | | | 163,873 | |
| 3.899%, 11/16/27 | | MYR | | | 240 | | | | 65,127 | |
| 3.844%, 04/15/33 | | MYR | | | 590 | | | | 155,339 | |
| 4.893%, 06/08/38 | | MYR | | | 310 | | | | 90,573 | |
| | | | | | | | | | 923,598 | |
| Mexico | 5.9% | | | | | | | | | | |
| Mexican Bonos: | | | | | | | | | | |
| 10.000%, 12/05/24 | | MXN | | | 361 | | | | 21,684 | |
| 5.750%, 03/05/26 | | MXN | | | 7,660 | | | | 402,738 | |
| 8.500%, 05/31/29 | | MXN | | | 7,598 | | | | 464,983 | |
| 10.000%, 11/20/36 | | MXN | | | 1,600 | | | | 112,616 | |
| 7.750%, 11/13/42 | | MXN | | | 670 | | | | 38,741 | |
The accompanying notes are an integral part of these financial statements.
Annual Report 27
| Description | | Security
Currency | | Principal
Amount
(000) | | | Fair
Value | |
| | | | | | | | | | | |
| Lazard Emerging Markets Debt Portfolio (continued) | | | | | | | | | | |
| | | | | | | | | | | |
Mexico Government International Bonds,
2.659%, 05/24/31 | | USD | | | 25 | | | $ | 25,712 | |
| United Mexican States: | | | | | | | | | | |
| 4.125%, 01/21/26 | | USD | | | 80 | | | | 92,000 | |
| 4.500%, 04/22/29 | | USD | | | 45 | | | | 52,762 | |
| 4.500%, 01/31/50 | | USD | | | 15 | | | | 17,541 | |
| 5.000%, 04/27/51 | | USD | | | 60 | | | | 74,805 | |
| | | | | | | | | | 1,303,582 | |
| Mongolia | 0.3% | | | | | | | | | | |
| Mongolia International Bonds: | | | | | | | | | | |
| 10.875%, 04/06/21 | | USD | | | 25 | | | | 25,625 | |
| 5.125%, 12/05/22 | | USD | | | 35 | | | | 36,323 | |
| | | | | | | | | | 61,948 | |
| Mozambique | 0.8% | | | | | | | | | | |
Republic of Mozambique,
5.000%, 09/15/31 (Ø) | | USD | | | 200 | | | | 181,438 | |
| | | | | | | | | | | |
| Oman | 2.0% | | | | | | | | | | |
| Oman Government International Bonds: | | | | | | | | | | |
| 4.750%, 06/15/26 | | USD | | | 245 | | | | 244,464 | |
| 5.625%, 01/17/28 | | USD | | | 200 | | | | 203,790 | |
| | | | | | | | | | 448,254 | |
| Panama | 0.2% | | | | | | | | | | |
Republic of Panama,
3.750%, 03/16/25 | | USD | | | 40 | | | | 44,175 | |
| | | | | | | | | | | |
| Paraguay | 0.5% | | | | | | | | | | |
| Republic of Paraguay: | | | | | | | | | | |
| 4.950%, 04/28/31 (#) | | USD | | | 45 | | | | 54,337 | |
| 5.400%, 03/30/50 | | USD | | | 40 | | | | 50,488 | |
| | | | | | | | | | 104,825 | |
| Peru | 1.3% | | | | | | | | | | |
| Peruvian Government International Bonds: | | | | | | | | | | |
| 5.940%, 02/12/29 | | PEN | | | 140 | | | | 48,174 | |
| 3.230%, 07/28/21 | | USD | | | 25 | | | | 24,937 | |
The accompanying notes are an integral part of these financial statements.
28 Annual Report
| Description | | Security
Currency | | Principal
Amount
(000) | | | Fair
Value | |
| | | | | | | | | | | |
| Lazard Emerging Markets Debt Portfolio (continued) | | | | | | | | | | |
| | | | | | | | | | | |
| Republic of Peru: | | | | | | | | | | |
| 6.950%, 08/12/31 | | PEN | | | 415 | | | $ | 148,728 | |
| 6.900%, 08/12/37 | | PEN | | | 170 | | | | 57,836 | |
| 5.350%, 08/12/40 | | PEN | | | 55 | | | | 15,753 | |
| | | | | | | | | | 295,428 | |
| Philippines | 0.6% | | | | | | | | | | |
| Republic of Philippines: | | | | | | | | | | |
| 3.625%, 09/09/25 | | PHP | | | 2,865 | | | | 62,307 | |
| 3.700%, 03/01/41 | | USD | | | 60 | | | | 69,356 | |
| | | | | | | | | | 131,663 | |
| Qatar | 1.3% | | | | | | | | | | |
Qatar Government International Bonds,
5.750%, 01/20/42 | | USD | | | 200 | | | | 298,813 | |
| | | | | | | | | | | |
| Romania | 2.6% | | | | | | | | | | |
| Romanian Government Bonds: | | | | | | | | | | |
| 4.250%, 06/28/23 | | RON | | | 710 | | | | 185,317 | |
| 4.750%, 02/24/25 | | RON | | | 320 | | | | 86,427 | |
| 4.850%, 04/22/26 | | RON | | | 320 | | | | 88,498 | |
| 5.800%, 07/26/27 | | RON | | | 160 | | | | 47,239 | |
| Romanian Government Bonds: | | | | | | | | | | |
| 4.375%, 08/22/23 | | USD | | | 48 | | | | 52,395 | |
| 3.000%, 02/14/31 | | USD | | | 46 | | | | 49,234 | |
| 4.000%, 02/14/51 (#) | | USD | | | 62 | | | | 67,425 | |
| | | | | | | | | | 576,535 | |
| Russia | 3.2% | | | | | | | | | | |
| Russia Government Bonds - OFZ: | | | | | | | | | | |
| 7.100%, 10/16/24 | | RUB | | | 190 | | | | 2,739 | |
| 7.950%, 10/07/26 | | RUB | | | 20,830 | | | | 314,753 | |
| 7.050%, 01/19/28 | | RUB | | | 7,443 | | | | 108,474 | |
| 6.900%, 05/23/29 | | RUB | | | 6,980 | | | | 101,295 | |
| 7.650%, 04/10/30 | | RUB | | | 5,550 | | | | 84,441 | |
| 8.500%, 09/17/31 | | RUB | | | 6,800 | | | | 110,120 | |
| | | | | | | | | | 721,822 | |
The accompanying notes are an integral part of these financial statements.
Annual Report 29
| Description | | Security
Currency | | Principal
Amount
(000) | | | Fair
Value | |
| | | | | | | | | | | |
| Lazard Emerging Markets Debt Portfolio (continued) | | | | | | | | | | |
| | | | | | | | | | | |
| South Africa | 5.9% | | | | | | | | | | |
| Republic of South Africa: | | | | | | | | | | |
| 10.500%, 12/21/26 | | ZAR | | | 4,790 | | | $ | 386,365 | |
| 4.850%, 09/30/29 | | USD | | | 10 | | | | 10,594 | |
| 8.000%, 01/31/30 | | ZAR | | | 2,370 | | | | 153,781 | |
| 5.875%, 06/22/30 | | USD | | | 85 | | | | 96,077 | |
| 8.250%, 03/31/32 | | ZAR | | | 1,360 | | | | 83,431 | |
| 8.500%, 01/31/37 | | ZAR | | | 3,720 | | | | 210,121 | |
| 8.750%, 02/28/48 | | ZAR | | | 1,445 | | | | 80,548 | |
| 6.300%, 06/22/48 | | USD | | | 150 | | | | 159,750 | |
Republic of South Africa Government Bonds,
8.875%, 02/28/35 | | ZAR | | | 1,050 | | | | 62,939 | |
Republic of South Africa Government International Bonds,
4.850%, 09/27/27 | | USD | | | 60 | | | | 64,800 | |
| | | | | | | | | | 1,308,406 | |
| Sri Lanka | 1.4% | | | | | | | | | | |
| Republic of Sri Lanka: | | | | | | | | | | |
| 5.750%, 01/18/22 | | USD | | | 60 | | | | 46,331 | |
| 5.750%, 04/18/23 | | USD | | | 45 | | | | 28,561 | |
| 6.850%, 03/14/24 | | USD | | | 65 | | | | 39,345 | |
| 6.350%, 06/28/24 | | USD | | | 40 | | | | 24,137 | |
| 6.125%, 06/03/25 | | USD | | | 10 | | | | 5,913 | |
| 6.850%, 11/03/25 | | USD | | | 100 | | | | 59,094 | |
| 6.825%, 07/18/26 | | USD | | | 5 | | | | 2,839 | |
| 6.200%, 05/11/27 | | USD | | | 70 | | | | 39,572 | |
| 6.750%, 04/18/28 | | USD | | | 35 | | | | 19,863 | |
| 7.550%, 03/28/30 | | USD | | | 90 | | | | 51,075 | |
| | | | | | | | | | 316,730 | |
| Suriname | 0.0% | | | | | | | | | | |
Republic of Suriname,
9.250%, 10/26/26 | | USD | | | 10 | | | | 6,400 | |
The accompanying notes are an integral part of these financial statements.
30 Annual Report
| Description | | Security
Currency | | Principal
Amount
(000) | | | Fair
Value | |
| | | | | | | | | | | |
| Lazard Emerging Markets Debt Portfolio (continued) | | | | | | | | | | |
| | | | | | | | | | | |
| Thailand | 2.6% | | | | | | | | | | |
| Thailand Government Bonds: | | | | | | | | | | |
| 3.650%, 06/20/31 | | THB | | | 3,630 | | | $ | 147,990 | |
| 3.775%, 06/25/32 | | THB | | | 4,700 | | | | 195,711 | |
| 3.400%, 06/17/36 | | THB | | | 3,390 | | | | 140,584 | |
| 3.300%, 06/17/38 | | THB | | | 2,190 | | | | 90,277 | |
| | | | | | | | | | 574,562 | |
| Turkey | 3.2% | | | | | | | | | | |
| Republic of Turkey: | | | | | | | | | | |
| 7.375%, 02/05/25 | | USD | | | 95 | | | | 105,925 | |
| 4.875%, 10/09/26 | | USD | | | 55 | | | | 55,584 | |
| 6.625%, 02/17/45 | | USD | | | 20 | | | | 20,900 | |
| 5.750%, 05/11/47 | | USD | | | 130 | | | | 123,500 | |
| Turkey Government Bonds: | | | | | | | | | | |
| 10.700%, 08/17/22 | | TRY | | | 820 | | | | 104,030 | |
| 8.000%, 03/12/25 | | TRY | | | 600 | | | | 68,048 | |
| 10.500%, 08/11/27 | | TRY | | | 410 | | | | 50,416 | |
| Turkey Government International Bonds: | | | | | | | | | | |
| 6.375%, 10/14/25 | | USD | | | 125 | | | | 134,961 | |
| 5.250%, 03/13/30 | | USD | | | 45 | | | | 45,155 | |
| | | | | | | | | | 708,519 | |
| Ukraine | 1.4% | | | | | | | | | | |
Ukraine Government Bonds,
9.750%, 11/01/28 | | USD | | | 260 | | | | 319,800 | |
| | | | | | | | | | | |
| United Arab Emirates | 1.6% | | | | | | | | | | |
Emirate of Dubai Government International Bonds,
5.250%, 01/30/43 | | USD | | | 310 | | | | 362,119 | |
| | | | | | | | | | | |
| Venezuela | 0.4% | | | | | | | | | | |
| Republic of Venezuela: | | | | | | | | | | |
| 8.250%, 10/13/24 («) | | USD | | | 1,038 | | | | 93,420 | |
| 7.000%, 03/31/38 («) | | USD | | | 58 | | | | 5,220 | |
| | | | | | | | | | 98,640 | |
The accompanying notes are an integral part of these financial statements.
Annual Report 31
| Description | | Security
Currency | | Principal
Amount
(000) | | | Fair
Value | |
| | | | | | | | | | | |
| Lazard Emerging Markets Debt Portfolio (continued) | | | | | | | | | | |
| | | | | | | | | | | |
| Zambia | 0.9% | | | | | | | | | | |
| Republic of Zambia: | | | | | | | | | | |
| 5.375%, 09/20/22 | | USD | | | 200 | | | $ | 103,125 | |
| 8.970%, 07/30/27 | | USD | | | 200 | | | | 103,063 | |
| | | | | | | | | | 206,188 | |
Total Foreign Government Obligations
(Cost $17,139,110) | | | | | | | | | 17,725,819 | |
| | | | | | | | | | | |
| Quasi Government Bonds | 1.1% | | | | | | | | | | |
| | | | | | | | | | | |
| Mexico | 0.6% | | | | | | | | | | |
Petroleos Mexicanos,
6.750%, 09/21/47 | | USD | | | 140 | | | | 131,250 | |
| | | | | | | | | | | |
| Turkey | 0.4% | | | | | | | | | | |
Export Credit Bank of Turkey,
5.375%, 02/08/21 | | USD | | | 105 | | | | 105,197 | |
| | | | | | | | | | | |
| Venezuela | 0.1% | | | | | | | | | | |
| Petroleos de Venezuela SA: | | | | | | | | | | |
| 12.750%, 02/17/22 («) | | USD | | | 273 | | | | 8,736 | |
| 6.000%, 11/15/26 («) | | USD | | | 124 | | | | 4,030 | |
| 5.500%, 04/12/37 («) | | USD | | | 100 | | | | 3,200 | |
| | | | | | | | | | 15,966 | |
Total Quasi Government Bonds
(Cost $447,869) | | | | | | | | | 252,413 | |
| | | | | | | | | | | |
| Supranational Bonds | 0.1% | | | | | | | | | | |
International Finance Corp.,
8.000%, 10/09/23
(Cost $14,330) | | IDR | | | 200,000 | | | | 15,481 | |
The accompanying notes are an integral part of these financial statements.
32 Annual Report
| Description | | | | Shares | | | Fair
Value | |
| | | | | | | | | | | |
| Lazard Emerging Markets Debt Portfolio (continued) | | | | | | | | | | |
| | | | | | | | | | | |
| Short-Term Investments | 11.3% | | | | | | | | | | |
State Street Institutional Treasury
Money Market Fund, Premier Class,
0.01% (7 day yield)
(Cost $2,516,617) | | | | | 2,516,617 | | | $ | 2,516,617 | |
| | | | | | | | | | | |
Total Investments | 98.6%
(Cost $21,516,462) (») | | | | | | | | $ | 21,957,236 | |
| | | | | | | | | | | |
| Cash and Other Assets in Excess of Liabilities | 1.4% | | | | | | | | | 321,418 | |
| | | | | | | | | | | |
| Net Assets | 100.0% | | | | | | | | $ | 22,278,654 | |
The accompanying notes are an integral part of these financial statements.
Annual Report 33
Lazard Emerging Markets Debt Portfolio (continued)
Forward Currency Contracts open at December 31, 2020:
Currency
Purchased | | Quantity | | | Currency
Sold | | Quantity | | | | Counterparty | | | Settlement
Date | | Unrealized
Appreciation | | Unrealized
Depreciation | |
| | | | | | | | | | | | | | | | | | | | | | | | | | | |
| BRL | | | 58,145 | | | USD | | | 10,954 | | | | BOA | | | 02/02/21 | | | $ | 237 | | | | $ | — | |
| BRL | | | 75,589 | | | USD | | | 14,246 | | | | BOA | | | 02/02/21 | | | | 302 | | | | | — | |
| BRL | | | 34,817 | | | USD | | | 6,559 | | | | CIT | | | 02/02/21 | | | | 142 | | | | | — | |
| BRL | | | 2,164,471 | | | USD | | | 401,400 | | | | SSB | | | 02/02/21 | | | | 15,174 | | | | | — | |
| CLP | | | 56,035,371 | | | USD | | | 75,736 | | | | BRC | | | 02/11/21 | | | | 3,123 | | | | | — | |
| CLP | | | 56,035,371 | | | USD | | | 75,723 | | | | SCB | | | 02/11/21 | | | | 3,135 | | | | | — | |
| CNH | | | 39,909 | | | USD | | | 6,091 | | | | BRC | | | 01/19/21 | | | | 41 | | | | | — | |
| CNH | | | 131,890 | | | USD | | | 20,000 | | | | BRC | | | 01/19/21 | | | | 263 | | | | | — | |
| COP | | | 28,116,794 | | | USD | | | 7,698 | | | | BOA | | | 01/25/21 | | | | 535 | | | | | — | |
| COP | | | 34,220,000 | | | USD | | | 10,000 | | | | BOA | | | 01/25/21 | | | | 19 | | | | | — | |
| COP | | | 26,710,954 | | | USD | | | 7,310 | | | | SCB | | | 01/25/21 | | | | 511 | | | | | — | |
| CZK | | | 1,658,820 | | | USD | | | 73,799 | | | | BRC | | | 01/19/21 | | | | 3,439 | | | | | — | |
| CZK | | | 3,411,077 | | | USD | | | 152,261 | | | | BRC | | | 01/19/21 | | | | 6,566 | | | | | — | |
| CZK | | | 2,173,726 | | | USD | | | 97,016 | | | | UBS | | | 01/19/21 | | | | 4,196 | | | | | — | |
| HUF | | | 6,003,524 | | | USD | | | 20,000 | | | | BRC | | | 01/25/21 | | | | 224 | | | | | — | |
| HUF | | | 15,996,668 | | | USD | | | 52,700 | | | | BRC | | | 01/25/21 | | | | 1,189 | | | | | — | |
| HUF | | | 22,192,450 | | | USD | | | 72,862 | | | | BRC | | | 01/25/21 | | | | 1,899 | | | | | — | |
| HUF | | | 15,237,000 | | | USD | | | 50,000 | | | | CIT | | | 01/25/21 | | | | 1,330 | | | | | — | |
| HUF | | | 16,386,831 | | | USD | | | 54,007 | | | | UBS | | | 01/25/21 | | | | 1,196 | | | | | — | |
| IDR | | | 390,766,960 | | | USD | | | 27,610 | | | | JPM | | | 01/19/21 | | | | 166 | | | | | — | |
| IDR | | | 152,770,100 | | | USD | | | 10,764 | | | | SCB | | | 01/19/21 | | | | 95 | | | | | — | |
| IDR | | | 2,409,060,800 | | | USD | | | 170,095 | | | | SCB | | | 01/19/21 | | | | 1,145 | | | | | — | |
| INR | | | 4,486,200 | | | USD | | | 60,161 | | | | CIT | | | 01/27/21 | | | | 1,084 | | | | | — | |
| INR | | | 9,230,824 | | | USD | | | 123,213 | | | | HSB | | | 01/27/21 | | | | 2,805 | | | | | — | |
| INR | | | 1,890,651 | | | USD | | | 25,213 | | | | SCB | | | 01/27/21 | | | | 598 | | | | | — | |
| MXN | | | 1,034,100 | | | USD | | | 50,000 | | | | CIT | | | 01/19/21 | | | | 1,881 | | | | | — | |
| MXN | | | 3,012,415 | | | USD | | | 150,886 | | | | HSB | | | 01/19/21 | | | | 249 | | | | | — | |
| MXN | | | 1,411,533 | | | USD | | | 68,727 | | | | UBS | | | 01/19/21 | | | | 2,090 | | | | | — | |
| MYR | | | 246,630 | | | USD | | | 60,000 | | | | BOA | | | 01/25/21 | | | | 1,263 | | | | | — | |
| PEN | | | 11,530 | | | USD | | | 3,210 | | | | BOA | | | 02/22/21 | | | | — | | | | | 24 | |
| PEN | | | 11,530 | | | USD | | | 3,215 | | | | BRC | | | 02/22/21 | | | | — | | | | | 29 | |
| PLN | | | 825,640 | | | USD | | | 216,499 | | | | BOA | | | 01/19/21 | | | | 4,539 | | | | | — | |
| PLN | | | 454,406 | | | USD | | | 120,000 | | | | CIT | | | 01/19/21 | | | | 1,653 | | | | | — | |
| PLN | | | 802,050 | | | USD | | | 210,313 | | | | CIT | | | 01/19/21 | | | | 4,410 | | | | | — | |
| PLN | | | 463,945 | | | USD | | | 121,531 | | | | HSB | | | 01/19/21 | | | | 2,675 | | | | | — | |
| PLN | | | 802,050 | | | USD | | | 210,089 | | | | HSB | | | 01/19/21 | | | | 4,634 | | | | | — | |
| PLN | | | 37,252 | | | USD | | | 10,000 | | | | SCB | | | 01/19/21 | | | | — | | | | | 27 | |
The accompanying notes are an integral part of these financial statements.
34 Annual Report
Lazard Emerging Markets Debt Portfolio (continued)
Currency
Purchased | | Quantity | | | Currency
Sold | | Quantity | | | | Counterparty | | | Settlement
Date | | Unrealized
Appreciation | | Unrealized
Depreciation | |
| | | | | | | | | | | | | | | | | | | | | | | | | | | |
| PLN | | | 408,890 | | | USD | | | 107,230 | | | | UBS | | | 01/19/21 | | | $ | 2,237 | | | | $ | — | |
| RUB | | | 576,983 | | | USD | | | 7,538 | | | | BRC | | | 01/22/21 | | | | 256 | | | | | — | |
| RUB | | | 10,665,858 | | | USD | | | 139,935 | | | | BRC | | | 01/22/21 | | | | 4,138 | | | | | — | |
| RUB | | | 6,772,558 | | | USD | | | 90,828 | | | | HSB | | | 01/22/21 | | | | 656 | | | | | — | |
| THB | | | 4,240,121 | | | USD | | | 140,529 | | | | CIT | | | 02/22/21 | | | | 1,008 | | | | | — | |
| THB | | | 6,814,481 | | | USD | | | 225,213 | | | | CIT | | | 02/22/21 | | | | 2,259 | | | | | — | |
| THB | | | 299,210 | | | USD | | | 10,000 | | | | SCB | | | 02/22/21 | | | | — | | | | | 12 | |
| THB | | | 2,725,792 | | | USD | | | 90,055 | | | | SCB | | | 02/22/21 | | | | 933 | | | | | — | |
| TRY | | | 158,802 | | | USD | | | 20,000 | | | | BRC | | | 01/14/21 | | | | 1,300 | | | | | — | |
| TRY | | | 826,980 | | | USD | | | 107,468 | | | | BRC | | | 01/14/21 | | | | 3,455 | | | | | — | |
| TRY | | | 864,570 | | | USD | | | 112,396 | | | | SCB | | | 01/14/21 | | | | 3,569 | | | | | — | |
| TRY | | | 411,880 | | | USD | | | 53,460 | | | | UBS | | | 01/14/21 | | | | 1,786 | | | | | — | |
| USD | | | 40,000 | | | BRL | | | 203,920 | | | | BRC | | | 02/02/21 | | | | 754 | | | | | — | |
| USD | | | 50,000 | | | BRL | | | 253,325 | | | | BRC | | | 02/02/21 | | | | 1,245 | | | | | — | |
| USD | | | 50,736 | | | CNH | | | 330,250 | | | | HSB | | | 01/19/21 | | | | — | | | | | 2 | |
| USD | | | 109,284 | | | CNH | | | 726,752 | | | | SCB | | | 01/19/21 | | | | — | | | | | 2,371 | |
| USD | | | 110,000 | | | CNH | | | 720,984 | | | | SCB | | | 01/19/21 | | | | — | | | | | 769 | |
| USD | | | 10,000 | | | COP | | | 35,940,000 | | | | BOA | | | 01/25/21 | | | | — | | | | | 523 | |
| USD | | | 60,000 | | | COP | | | 208,350,000 | | | | SCB | | | 01/25/21 | | | | — | | | | | 1,004 | |
| USD | | | 50,000 | | | CZK | | | 1,083,750 | | | | BOA | | | 01/19/21 | | | | — | | | | | 461 | |
| USD | | | 21,529 | | | CZK | | | 471,275 | | | | BRC | | | 01/19/21 | | | | — | | | | | 414 | |
| USD | | | 110,000 | | | CZK | | | 2,384,800 | | | | BRC | | | 01/19/21 | | | | — | | | | | 1,041 | |
| USD | | | 50,000 | | | HUF | | | 14,645,000 | | | | BOA | | | 01/25/21 | | | | 664 | | | | | — | |
| USD | | | 60,000 | | | HUF | | | 17,574,000 | | | | BOA | | | 01/25/21 | | | | 797 | | | | | — | |
| USD | | | 120,504 | | | IDR | | | 1,707,421,534 | | | | JPM | | | 01/19/21 | | | | — | | | | | 863 | |
| USD | | | 105,000 | | | INR | | | 7,777,875 | | | | BRC | | | 01/27/21 | | | | — | | | | | 1,183 | |
| USD | | | 105,000 | | | INR | | | 7,776,300 | | | | CIT | | | 01/27/21 | | | | — | | | | | 1,162 | |
| USD | | | 30,000 | | | MXN | | | 607,814 | | | | BRC | | | 01/19/21 | | | | — | | | | | 494 | |
| USD | | | 110,000 | | | MXN | | | 2,205,082 | | | | BRC | | | 01/19/21 | | | | — | | | | | 630 | |
| USD | | | 110,000 | | | MXN | | | 2,205,797 | | | | UBS | | | 01/19/21 | | | | — | | | | | 666 | |
| USD | | | 210,000 | | | MYR | | | 854,490 | | | | BOA | | | 01/25/21 | | | | — | | | | | 2,257 | |
| USD | | | 10,000 | | | MYR | | | 40,770 | | | | SCB | | | 01/25/21 | | | | — | | | | | 127 | |
| USD | | | 10,371 | | | MYR | | | 42,308 | | | | SCB | | | 01/25/21 | | | | — | | | | | 138 | |
| USD | | | 20,715 | | | PEN | | | 74,437 | | | | CIT | | | 02/22/21 | | | | 147 | | | | | — | |
| USD | | | 43,080 | | | PHP | | | 2,074,576 | | | | SCB | | | 02/11/21 | | | | — | | | | | 83 | |
| USD | | | 50,000 | | | PLN | | | 182,484 | | | | CIT | | | 01/19/21 | | | | 1,146 | | | | | — | |
| USD | | | 70,000 | | | PLN | | | 255,309 | | | | CIT | | | 01/19/21 | | | | 1,649 | | | | | — | |
The accompanying notes are an integral part of these financial statements.
Annual Report 35
Lazard Emerging Markets Debt Portfolio (continued)
Currency
Purchased | | Quantity | | | Currency
Sold | | Quantity | | | | Counterparty | | | Settlement
Date | | Unrealized
Appreciation | | Unrealized
Depreciation | |
| | | | | | | | | | | | | | | | | | | | | | | | | | | |
| USD | | | 36,435 | | | RON | | | 150,509 | | | | CIT | | | 01/19/21 | | | $ | — | | | | $ | 1,315 | |
| USD | | | 36,394 | | | RON | | | 150,509 | | | | UBS | | | 01/19/21 | | | | — | | | | | 1,357 | |
| USD | | | 90,000 | | | RUB | | | 6,602,400 | | | | BOA | | | 01/22/21 | | | | 815 | | | | | — | |
| USD | | | 60,000 | | | RUB | | | 4,412,490 | | | | BRC | | | 01/22/21 | | | | 396 | | | | | — | |
| USD | | | 90,000 | | | THB | | | 2,705,400 | | | | SCB | | | 02/22/21 | | | | — | | | | | 308 | |
| USD | | | 212,415 | | | TRY | | | 1,685,936 | | | | BOA | | | 01/14/21 | | | | — | | | | | 13,720 | |
| USD | | | 80,000 | | | TRY | | | 641,776 | | | | BRC | | | 01/14/21 | | | | — | | | | | 6,082 | |
| USD | | | 85,339 | | | ZAR | | | 1,347,310 | | | | BOA | | | 01/19/21 | | | | — | | | | | 6,149 | |
| USD | | | 30,000 | | | ZAR | | | 467,452 | | | | BRC | | | 01/19/21 | | | | — | | | | | 1,742 | |
| USD | | | 85,444 | | | ZAR | | | 1,347,310 | | | | BRC | | | 01/19/21 | | | | — | | | | | 6,044 | |
| USD | | | 170,778 | | | ZAR | | | 2,694,620 | | | | CIT | | | 01/19/21 | | | | — | | | | | 12,198 | |
| USD | | | 50,000 | | | ZAR | | | 754,840 | | | | SCB | | | 01/19/21 | | | | — | | | | | 1,257 | |
| USD | | | 85,498 | | | ZAR | | | 1,347,310 | | | | SCB | | | 01/19/21 | | | | — | | | | | 5,990 | |
| USD | | | 110,000 | | | ZAR | | | 1,659,273 | | | | SCB | | | 01/19/21 | | | | — | | | | | 2,671 | |
| ZAR | | | 2,119,140 | | | USD | | | 144,320 | | | | BRC | | | 01/19/21 | | | | — | | | | | 422 | |
| ZAR | | | 1,405,773 | | | USD | | | 90,000 | | | | CIT | | | 01/19/21 | | | | 5,458 | | | | | — | |
| ZAR | | | 1,639,577 | | | USD | | | 105,869 | | | | CIT | | | 01/19/21 | | | | 5,465 | | | | | — | |
| ZAR | | | 2,196,759 | | | USD | | | 145,265 | | | | HSB | | | 01/19/21 | | | | 3,904 | | | | | — | |
| Total gross unrealized appreciation/depreciation on Forward Currency Contracts | | | | | | $ | 116,845 | | | | $ | 73,535 | |
The accompanying notes are an integral part of these financial statements.
36 Annual Report
Lazard Emerging Markets Debt Portfolio (concluded)
Centrally Cleared Interest Rate Swap Agreements open at December 31, 2020:
| Currency | | Notional
Amount | | | Expiration
Date | | Receive/
(Pay)
Rate | | Payment
Frequency
Paid/Received | | Variable
Rate | | Unrealized
Appreciation |
| | | | | | | | | | | | | | | | | | | | |
| BRL | | 838,319 | | | 01/02/24 | | | 5.84 | % | | Maturity | | 1 month Brazilian Interbank Deposit Average | | | $ | 4,610 | |
| BRL | | 680,190 | | | 01/02/24 | | | 4.84 | | | Maturity | | 1 month Brazilian Interbank Deposit Average | | | | 1,126 | |
| Total gross unrealized appreciation on Centrally Cleared Interest Rate Swap Agreements | | | $ | 5,736 | |
The accompanying notes are an integral part of these financial statements.
Annual Report 37
| Description | | Security
Currency | | Principal
Amount
(000) | | | Fair
Value | |
| | | | | | | | | | | |
| Lazard Global Fixed Income Portfolio | | | | | | | | | | |
| | | | | | | | | | | |
| Corporate Bonds | 36.6% | | | | | | | | | | |
| | | | | | | | | | | |
| Australia | 1.2% | | | | | | | | | | |
Telstra Corp., Ltd.,
4.000%, 09/16/22 | | AUD | | | 140 | | | $ | 114,528 | |
| | | | | | | | | | | |
| Canada | 2.5% | | | | | | | | | | |
Canadian Imperial Bank of Commerce,
0.950%, 10/23/25 | | USD | | | 135 | | | | 136,838 | |
Rogers Communications, Inc.,
3.250%, 05/01/29 | | CAD | | | 120 | | | | 104,515 | |
| | | | | | | | | | 241,353 | |
| France | 1.2% | | | | | | | | | | |
Schneider Electric SE,
2.950%, 09/27/22 | | USD | | | 110 | | | | 114,760 | |
| | | | | | | | | | | |
| Germany | 1.8% | | | | | | | | | | |
BMW Finance NV,
0.875%, 08/16/22 | | GBP | | | 35 | | | | 48,378 | |
Daimler AG,
0.000% (Euribor 3 Month + 0.450%), 07/03/24 (§) | | EUR | | | 100 | | | | 121,909 | |
| | | | | | | | | | 170,287 | |
| Switzerland | 0.1% | | | | | | | | | | |
ABB Finance USA, Inc.,
4.375%, 05/08/42 | | USD | | | 7 | | | | 9,232 | |
| | | | | | | | | | | |
| United Kingdom | 2.7% | | | | | | | | | | |
Tesco Corporate Treasury Services PLC MTN,
2.750%, 04/27/30 | | GBP | | | 100 | | | | 151,430 | |
Unilever Capital Corp.,
3.250%, 03/07/24 | | USD | | | 100 | | | | 108,578 | |
| | | | | | | | | | 260,008 | |
The accompanying notes are an integral part of these financial statements.
38 Annual Report
| Description | | Security
Currency | | Principal
Amount
(000) | | | Fair
Value | |
| | | | | | | | | | | |
| Lazard Global Fixed Income Portfolio (continued) | | | | | | | | | | |
| | | | | | | | | | | |
| United States | 27.1% | | | | | | | | | | |
Adobe, Inc.,
2.300%, 02/01/30 | | USD | | | 90 | | | $ | 97,362 | |
Alphabet, Inc.,
1.100%, 08/15/30 | | USD | | | 95 | | | | 93,591 | |
Amazon.com, Inc.,
3.150%, 08/22/27 | | USD | | | 85 | | | | 96,839 | |
American Express Co.,
3.000%, 10/30/24 | | USD | | | 100 | | | | 109,199 | |
Apple, Inc.,
3.000%, 06/20/27 | | USD | | | 80 | | | | 89,582 | |
| Bank of America Corp.: | | | | | | | | | | |
| 3.499% (USD LIBOR 3 Month + 0.630%), 05/17/22 (§) | | USD | | | 100 | | | | 101,184 | |
| 1.486% (SOFR + 1.460%), 05/19/24 (§) | | USD | | | 50 | | | | 51,166 | |
Citigroup, Inc.,
1.579% (BBSW 3 Month + 1.550%), 05/04/21 (§) | | AUD | | | 175 | | | | 135,460 | |
Constellation Brands, Inc.,
4.250%, 05/01/23 | | USD | | | 70 | | | | 76,298 | |
Dell International LLC,
5.300%, 10/01/29 | | USD | | | 60 | | | | 73,480 | |
HCA, Inc.,
5.000%, 03/15/24 | | USD | | | 40 | | | | 44,992 | |
John Deere Financial, Inc.,
2.410%, 01/14/25 | | CAD | | | 110 | | | | 91,790 | |
Johnson & Johnson,
3.625%, 03/03/37 | | USD | | | 75 | | | | 91,583 | |
JPMorgan Chase & Co.,
3.540% (USD LIBOR 3 Month + 1.380%), 05/01/28 (§) | | USD | | | 100 | | | | 114,256 | |
Kimberly-Clark Corp.,
3.200%, 04/25/29 | | USD | | | 45 | | | | 51,841 | |
McDonald’s Corp.,
3.125%, 03/04/25 | | CAD | | | 125 | | | | 106,462 | |
The accompanying notes are an integral part of these financial statements.
Annual Report 39
| Description | | Security
Currency | | Principal
Amount
(000) | | | Fair
Value | |
| | | | | | | | | | | |
| Lazard Global Fixed Income Portfolio (continued) | | | | | | | | | | |
| | | | | | | | | | | |
Microsoft Corp.,
3.500%, 11/15/42 | | USD | | | 75 | | | $ | 92,286 | |
Morgan Stanley,
3.625%, 01/20/27 | | USD | | | 80 | | | | 91,790 | |
PepsiCo, Inc.,
2.875%, 10/15/49 | | USD | | | 85 | | | | 95,025 | |
Pfizer, Inc.,
2.625%, 04/01/30 | | USD | | | 65 | | | | 72,505 | |
Prologis LP,
1.250%, 10/15/30 | | USD | | | 70 | | | | 69,274 | |
Sealed Air Corp.,
4.875%, 12/01/22 | | USD | | | 45 | | | | 47,194 | |
Service Corp. International,
4.625%, 12/15/27 | | USD | | | 50 | | | | 53,250 | |
Starbucks Corp.,
4.450%, 08/15/49 | | USD | | | 90 | | | | 118,520 | |
The Goldman Sachs Group, Inc.,
3.625%, 01/22/23 | | USD | | | 100 | | | | 106,708 | |
The Home Depot, Inc.,
5.875%, 12/16/36 | | USD | | | 65 | | | | 98,439 | |
The Procter & Gamble Co.,
1.200%, 10/29/30 | | USD | | | 50 | | | | 50,036 | |
Toyota Motor Credit Corp.,
2.150%, 02/13/30 | | USD | | | 90 | | | | 96,636 | |
United Rentals North America, Inc.,
4.875%, 01/15/28 | | USD | | | 50 | | | | 53,250 | |
Verizon Communications, Inc.,
3.875%, 02/08/29 | | USD | | | 100 | | | | 117,656 | |
| | | | | | | | | | 2,587,654 | |
Total Corporate Bonds
(Cost $3,278,390) | | | | | | | | | 3,497,822 | |
The accompanying notes are an integral part of these financial statements.
40 Annual Report
| Description | | Security
Currency | | Principal
Amount
(000) | | | Fair
Value | |
| | | | | | | | | | | |
| Lazard Global Fixed Income Portfolio (continued) | | | | | | | | | | |
| | | | | | | | | | | |
| Foreign Government Obligations | 43.7% | | | | | | | | | | |
| | | | | | | | | | | |
| Australia | 2.5% | | | | | | | | | | |
| New South Wales Treasury Corp.: | | | | | | | | | | |
| 1.250%, 11/20/30 | | AUD | | | 125 | | | $ | 96,771 | |
| 2.000%, 03/08/33 | | AUD | | | 60 | | | | 48,943 | |
Queensland Treasury Corp.,
1.250%, 03/10/31 | | AUD | | | 125 | | | | 96,575 | |
| | | | | | | | | | 242,289 | |
| Bahamas | 1.3% | | | | | | | | | | |
Bahamas Government International Bonds,
6.950%, 11/20/29 | | USD | | | 5 | | | | 4,961 | |
Commonwealth of Bahamas,
6.950%, 11/20/29 | | USD | | | 118 | | | | 117,078 | |
| | | | | | | | | | 122,039 | |
| Bermuda | 2.3% | | | | | | | | | | |
Government of Bermuda,
3.717%, 01/25/27 | | USD | | | 200 | | | | 223,750 | |
| | | | | | | | | | | |
| Canada | 4.9% | | | | | | | | | | |
City of Vancouver,
2.900%, 11/20/25 | | CAD | | | 90 | | | | 77,567 | |
Province of British Columbia,
4.700%, 06/18/37 | | CAD | | | 125 | | | | 139,658 | |
| Province of Quebec: | | | | | | | | | | |
| 2.500%, 04/20/26 | | USD | | | 100 | | | | 109,799 | |
| 1.850%, 02/13/27 | | CAD | | | 170 | | | | 141,436 | |
| | | | | | | | | | 468,460 | |
| Chile | 3.5% | | | | | | | | | | |
| Bonos de la Tesoreria de la Republica en pesos: | | | | | | | | | | |
| 4.500%, 03/01/26 | | CLP | | | 65,000 | | | | 104,891 | |
| 2.300%, 10/01/28 | | CLP | | | 75,000 | | | | 105,060 | |
Republic of Chile,
0.830%, 07/02/31 | | EUR | | | 100 | | | | 127,586 | |
| | | | | | | | | | 337,537 | |
The accompanying notes are an integral part of these financial statements.
Annual Report 41
| Description | | Security
Currency | | Principal
Amount
(000) | | | Fair
Value | |
| | | | | | | | | | | |
| Lazard Global Fixed Income Portfolio (continued) | | | | | | | | | | |
| | | | | | | | | | | |
| Colombia | 0.6% | | | | | | | | | | |
Republic of Colombia,
9.850%, 06/28/27 | | COP | | | 148,000 | | | $ | 56,115 | |
| | | | | | | | | | | |
| Czech Republic | 2.9% | | | | | | | | | | |
Czech Republic,
2.000%, 10/13/33 | | CZK | | | 5,590 | | | | 279,803 | |
| | | | | | | | | | | |
| Hungary | 3.7% | | | | | | | | | | |
| Hungary Government Bonds: | | | | | | | | | | |
| 2.500%, 10/24/24 | | HUF | | | 27,890 | | | | 99,271 | |
| 2.750%, 12/22/26 | | HUF | | | 25,790 | | | | 93,387 | |
| 3.000%, 10/27/27 | | HUF | | | 30,670 | | | | 113,065 | |
Hungary Government International Bonds,
1.750%, 06/05/35 | | EUR | | | 35 | | | | 47,482 | |
| | | | | | | | | | 353,205 | |
| Italy | 1.8% | | | | | | | | | | |
Italy Buoni Poliennali Del Tesoro,
1.450%, 03/01/36 | | EUR | | | 75 | | | | 98,377 | |
Italy Government International Bonds,
6.875%, 09/27/23 | | USD | | | 65 | | | | 75,471 | |
| | | | | | | | | | 173,848 | |
| Mexico | 1.6% | | | | | | | | | | |
Mexican Bonos,
7.500%, 06/03/27 | | MXN | | | 1,640 | | | | 93,772 | |
United Mexican States,
6.750%, 02/06/24 | | GBP | | | 35 | | | | 56,178 | |
| | | | | | | | | | 149,950 | |
| Morocco | 1.2% | | | | | | | | | | |
Morocco Government International Bonds,
1.500%, 11/27/31 | | EUR | | | 100 | | | | 118,882 | |
| | | | | | | | | | | |
| Netherlands | 2.1% | | | | | | | | | | |
Nederlandse Waterschapsbank NV,
0.500%, 12/02/25 (#) | | USD | | | 200 | | | | 199,986 | |
The accompanying notes are an integral part of these financial statements.
42 Annual Report
| Description | | Security
Currency | | Principal
Amount
(000) | | | Fair
Value | |
| | | | | | | | | | | |
| Lazard Global Fixed Income Portfolio (continued) | | | | | | | | | | |
| | | | | | | | | | | |
| New Zealand | 2.2% | | | | | | | | | | |
New Zealand Government Bonds,
4.500%, 04/15/27 | | NZD | | | 235 | | | $ | 206,134 | |
| | | | | | | | | | | |
| Norway | 2.6% | | | | | | | | | | |
| Oslo Kommune: | | | | | | | | | | |
| 2.300%, 03/14/24 | | NOK | | | 1,000 | | | | 121,515 | |
| 2.350%, 09/04/24 | | NOK | | | 1,000 | | | | 122,356 | |
| | | | | | | | | | 243,871 | |
| Peru | 1.0% | | | | | | | | | | |
Peru Government Bonds,
6.150%, 08/12/32 (#) | | PEN | | | 270 | | | | 90,752 | |
| | | | | | | | | | | |
| Poland | 2.0% | | | | | | | | | | |
| Poland Government Bonds: | | | | | | | | | | |
| 2.500%, 07/25/27 | | PLN | | | 325 | | | | 96,545 | |
| 2.750%, 10/25/29 | | PLN | | | 310 | | | | 94,391 | |
| | | | | | | | | | 190,936 | |
| Romania | 3.7% | | | | | | | | | | |
| Romanian Government Bonds: | | | | | | | | | | |
| 4.000%, 10/27/21 | | RON | | | 400 | | | | 101,221 | |
| 4.750%, 02/24/25 | | RON | | | 545 | | | | 147,196 | |
Romanian Government International Bonds,
2.375%, 04/19/27 | | EUR | | | 77 | | | | 102,680 | |
| | | | | | | | | | 351,097 | |
| Singapore | 1.0% | | | | | | | | | | |
Singapore Government Bonds,
3.375%, 09/01/33 | | SGD | | | 100 | | | | 96,548 | |
| | | | | | | | | | | |
| Spain | 1.1% | | | | | | | | | | |
Spain Government Bonds,
1.200%, 10/31/40 | | EUR | | | 75 | | | | 101,446 | |
The accompanying notes are an integral part of these financial statements.
Annual Report 43
| Description | | Security
Currency | | Principal
Amount
(000) | | | Fair
Value | |
| | | | | | | | | | | |
| Lazard Global Fixed Income Portfolio (continued) | | | | | | | | | | |
| | | | | | | | | | | |
| United Kingdom | 1.7% | | | | | | | | | | |
| United Kingdom Gilt: | | | | | | | | | | |
| 1.750%, 09/07/37 | | GBP | | | 72 | | | $ | 116,811 | |
| 1.500%, 07/22/47 | | GBP | | | 27 | | | | 43,684 | |
| | | | | | | | | | 160,495 | |
Total Foreign Government Obligations
(Cost $3,894,206) | | | | | | | | | 4,167,143 | |
| | | | | | | | | | | |
| Quasi Government Bonds | 1.0% | | | | | | | | | | |
| | | | | | | | | | | |
| Canada | 1.0% | | | | | | | | | | |
Export Development Canada,
1.800%, 09/01/22
(Cost $87,866) | | CAD | | | 120 | | | | 96,707 | |
| | | | | | | | | | | |
| Supranational Bonds | 10.4% | | | | | | | | | | |
African Development Bank,
0.750%, 04/03/23 | | USD | | | 120 | | | | 121,419 | |
Asian Development Bank,
2.125%, 03/19/25 | | USD | | | 107 | | | | 114,618 | |
European Bank for Reconstruction & Development,
1.625%, 09/27/24 | | USD | | | 55 | | | | 57,653 | |
European Investment Bank,
1.125%, 09/16/21 (#) | | CAD | | | 90 | | | | 71,067 | |
Inter-American Development Bank,
7.875%, 03/14/23 | | IDR | | | 1,160,000 | | | | 88,598 | |
| International Bank for Reconstruction & Development: | | | | | | | | | | |
| 2.500%, 08/03/23 | | CAD | | | 210 | | | | 174,176 | |
| 1.900%, 01/16/25 | | CAD | | | 70 | | | | 57,988 | |
| 2.900%, 11/26/25 | | AUD | | | 110 | | | | 94,437 | |
| International Finance Corp.: | | | | | | | | | | |
| 2.700%, 03/15/23 | | AUD | | | 130 | | | | 105,629 | |
| 2.125%, 04/07/26 | | USD | | | 100 | | | | 108,502 | |
Total Supranational Bonds
(Cost $924,496) | | | | | | | | | 994,087 | |
The accompanying notes are an integral part of these financial statements.
44 Annual Report
| Description | | Security
Currency | | Principal
Amount
(000) | | | Fair
Value | |
| | | | | | | | | | | |
| Lazard Global Fixed Income Portfolio (continued) | | | | | | | | | | |
| | | | | | | | | | | |
| US Municipal Bonds | 1.5% | | | | | | | | | | |
| | | | | | | | | | | |
| California | 1.5% | | | | | | | | | | |
| State of California: | | | | | | | | | | |
| 7.500%, 04/01/34 | | USD | | | 20 | | | $ | 33,333 | |
| 4.500%, 04/01/33 | | USD | | | 45 | | | | 54,393 | |
| 7.550%, 04/01/39 | | USD | | | 30 | | | | 52,674 | |
| | | | | | | | | | 140,400 | |
Total US Municipal Bonds
(Cost $124,805) | | | | | | | | | 140,400 | |
| | | | | | | | | | | |
| US Treasury Securities | 3.0% | | | | | | | | | | |
| US Treasury Notes: | | | | | | | | | | |
| 2.125%, 05/15/25 | | USD | | | 85 | | | | 91,727 | |
| 2.875%, 08/15/28 | | USD | | | 171 | | | | 198,540 | |
| | | | | | | | | | | |
Total US Treasury Securities
(Cost $280,721) | | | | | | | | | 290,267 | |
| | | | | | | | | |
| Description | | | | Shares | | | Fair
Value | |
| | | | | | | | | |
| Short-Term Investments | 3.9% | | | | | | | | |
State Street Institutional Treasury
Money Market Fund, Premier Class,
0.01% (7 day yield)
(Cost $368,885) | | | | | 368,885 | | | $ | 368,885 | |
| | | | | | | | | | | |
Total Investments | 100.1%
(Cost $8,959,369) (») | | | | | | | | $ | 9,555,311 | |
| | | | | | | | | | | |
| Liabilities in Excess of Cash and Other Assets | (0.1)% | | | | | | | | | (9,148 | ) |
| | | | | | | | | | | |
| Net Assets | 100.0% | | | | | | | | $ | 9,546,163 | |
The accompanying notes are an integral part of these financial statements.
Annual Report 45
Lazard Global Fixed Income Portfolio (continued)
Forward Currency Contracts open at December 31, 2020:
Currency
Purchased | | Quantity | | | Currency
Sold | | Quantity | | | | Counterparty | | | Settlement
Date | | Unrealized
Appreciation | | Unrealized
Depreciation | |
| | | | | | | | | | | | | | | | | | | | | | | | | | | |
| AUD | | | 8,193 | | | USD | | | 6,000 | | | | JPM | | | 01/20/21 | | | $ | 317 | | | | $ | — | |
| AUD | | | 9,473 | | | USD | | | 7,212 | | | | JPM | | | 01/20/21 | | | | 93 | | | | | — | |
| CAD | | | 18,294 | | | USD | | | 14,000 | | | | HSB | | | 01/20/21 | | | | 373 | | | | | — | |
| CAD | | | 96,090 | | | USD | | | 74,460 | | | | JPM | | | 01/20/21 | | | | 1,035 | | | | | — | |
| CAD | | | 135,489 | | | USD | | | 103,813 | | | | JPM | | | 01/20/21 | | | | 2,636 | | | | | — | |
| CAD | | | 158,753 | | | USD | | | 118,517 | | | | JPM | | | 01/20/21 | | | | 6,210 | | | | | — | |
| CHF | | | 24,165 | | | USD | | | 26,715 | | | | HSB | | | 01/20/21 | | | | 594 | | | | | — | |
| CHF | | | 46,212 | | | USD | | | 52,000 | | | | JPM | | | 01/20/21 | | | | 224 | | | | | — | |
| CHF | | | 52,247 | | | USD | | | 57,300 | | | | JPM | | | 01/20/21 | | | | 1,745 | | | | | — | |
| CHF | | | 86,443 | | | USD | | | 95,565 | | | | JPM | | | 01/20/21 | | | | 2,124 | | | | | — | |
| CNH | | | 803,760 | | | USD | | | 118,200 | | | | HSB | | | 01/20/21 | | | | 5,279 | | | | | — | |
| CNH | | | 1,361,959 | | | USD | | | 199,821 | | | | HSB | | | 01/20/21 | | | | 9,412 | | | | | — | |
| CNH | | | 198,820 | | | USD | | | 30,000 | | | | HSB | | | 03/04/21 | | | | 456 | | | | | — | |
| CNH | | | 228,863 | | | USD | | | 34,300 | | | | HSB | | | 03/04/21 | | | | 758 | | | | | — | |
| CNH | | | 1,361,959 | | | USD | | | 199,096 | | | | HSB | | | 03/04/21 | | | | 9,532 | | | | | — | |
| COP | | | 68,074,800 | | | USD | | | 18,800 | | | | CIT | | | 02/16/21 | | | | 1,123 | | | | | — | |
| EUR | | | 64,671 | | | RON | | | 317,527 | | | | HSB | | | 01/22/21 | | | | — | | | | | 590 | |
| EUR | | | 71,274 | | | USD | | | 84,379 | | | | CIT | | | 01/20/21 | | | | 2,726 | | | | | — | |
| EUR | | | 16,651 | | | USD | | | 19,900 | | | | HSB | | | 01/20/21 | | | | 450 | | | | | — | |
| EUR | | | 75,900 | | | USD | | | 90,000 | | | | HSB | | | 01/20/21 | | | | 2,759 | | | | | — | |
| EUR | | | 78,323 | | | USD | | | 94,700 | | | | HSB | | | 01/20/21 | | | | 1,020 | | | | | — | |
| EUR | | | 119,864 | | | USD | | | 142,930 | | | | HSB | | | 01/20/21 | | | | 3,558 | | | | | — | |
| EUR | | | 881,145 | | | USD | | | 1,042,641 | | | | HSB | | | 01/20/21 | | | | 34,224 | | | | | — | |
| EUR | | | 16,349 | | | USD | | | 19,200 | | | | JPM | | | 01/20/21 | | | | 781 | | | | | — | |
| EUR | | | 64,774 | | | USD | | | 76,600 | | | | JPM | | | 01/20/21 | | | | 2,561 | | | | | — | |
| GBP | | | 17,420 | | | USD | | | 23,000 | | | | JPM | | | 01/20/21 | | | | 825 | | | | | — | |
| GBP | | | 30,394 | | | USD | | | 40,490 | | | | JPM | | | 01/20/21 | | | | 1,080 | | | | | — | |
| GBP | | | 37,590 | | | USD | | | 48,865 | | | | JPM | | | 01/20/21 | | | | 2,547 | | | | | — | |
| GBP | | | 82,116 | | | USD | | | 104,536 | | | | JPM | | | 01/20/21 | | | | 7,772 | | | | | — | |
| IDR | | | 475,168,000 | | | USD | | | 31,880 | | | | JPM | | | 01/15/21 | | | | 1,909 | | | | | — | |
| INR | | | 3,498,117 | | | USD | | | 47,100 | | | | JPM | | | 01/29/21 | | | | 646 | | | | | — | |
| JPY | | | 44,497,629 | | | USD | | | 424,624 | | | | CIT | | | 01/20/21 | | | | 6,407 | | | | | — | |
| JPY | | | 85,119,655 | | | USD | | | 812,513 | | | | HSB | | | 01/20/21 | | | | 12,008 | | | | | — | |
| JPY | | | 1,104,572 | | | USD | | | 10,500 | | | | JPM | | | 01/20/21 | | | | 200 | | | | | — | |
| JPY | | | 6,894,604 | | | USD | | | 66,000 | | | | JPM | | | 01/20/21 | | | | 785 | | | | | — | |
The accompanying notes are an integral part of these financial statements.
46 Annual Report
Lazard Global Fixed Income Portfolio (continued)
Currency
Purchased | | Quantity | | | Currency
Sold | | Quantity | | | | Counterparty | | | Settlement
Date | | Unrealized
Appreciation | | Unrealized
Depreciation | |
| | | | | | | | | | | | | | | | | | | | | | | | | | | |
| JPY | | | 12,991,927 | | | USD | | | 123,995 | | | | JPM | | | 01/20/21 | | | $ | 1,853 | | | | $ | — | |
| KRW | | | 118,308,720 | | | USD | | | 105,928 | | | | JPM | | | 02/25/21 | | | | 3,019 | | | | | — | |
| MXN | | | 535,448 | | | USD | | | 24,513 | | | | JPM | | | 01/20/21 | | | | 2,348 | | | | | — | |
| NOK | | | 349,488 | | | USD | | | 37,499 | | | | HSB | | | 01/22/21 | | | | 3,261 | | | | | — | |
| PHP | | | 2,245,608 | | | USD | | | 45,819 | | | | HSB | | | 01/15/21 | | | | 934 | | | | | — | |
| PLN | | | 42,779 | | | USD | | | 11,375 | | | | HSB | | | 01/20/21 | | | | 77 | | | | | — | |
| PLN | | | 357,739 | | | USD | | | 97,236 | | | | HSB | | | 01/20/21 | | | | — | | | | | 1,463 | |
| RON | | | 16,500 | | | USD | | | 4,000 | | | | HSB | | | 01/22/21 | | | | 138 | | | | | — | |
| RUB | | | 781,013 | | | USD | | | 10,300 | | | | JPM | | | 01/20/21 | | | | 252 | | | | | — | |
| RUB | | | 1,118,958 | | | USD | | | 14,475 | | | | JPM | | | 01/20/21 | | | | 643 | | | | | — | |
| SEK | | | 250,376 | | | USD | | | 28,347 | | | | JPM | | | 01/20/21 | | | | 2,090 | | | | | — | |
| SGD | | | 138,385 | | | USD | | | 102,013 | | | | JPM | | | 01/20/21 | | | | 2,699 | | | | | — | |
| THB | | | 885,374 | | | USD | | | 28,275 | | | | HSB | | | 01/20/21 | | | | 1,277 | | | | | — | |
| USD | | | 9,830 | | | AUD | | | 13,442 | | | | CIT | | | 01/20/21 | | | | — | | | | | 535 | |
| USD | | | 11,735 | | | AUD | | | 16,037 | | | | CIT | | | 01/20/21 | | | | — | | | | | 630 | |
| USD | | | 70,584 | | | AUD | | | 96,649 | | | | CIT | | | 01/20/21 | | | | — | | | | | 3,941 | |
| USD | | | 37,849 | | | AUD | | | 50,063 | | | | HSB | | | 01/20/21 | | | | — | | | | | 754 | |
| USD | | | 40,594 | | | AUD | | | 56,493 | | | | HSB | | | 01/20/21 | | | | — | | | | | 2,967 | |
| USD | | | 91,657 | | | AUD | | | 125,455 | | | | HSB | | | 01/20/21 | | | | — | | | | | 5,080 | |
| USD | | | 41,278 | | | AUD | | | 58,034 | | | | JPM | | | 01/20/21 | | | | — | | | | | 3,472 | |
| USD | | | 238,095 | | | AUD | | | 325,906 | | | | JPM | | | 01/20/21 | | | | — | | | | | 13,208 | |
| USD | | | 16,056 | | | CAD | | | 20,975 | | | | CIT | | | 01/20/21 | | | | — | | | | | 424 | |
| USD | | | 38,048 | | | CAD | | | 49,845 | | | | CIT | | | 01/20/21 | | | | — | | | | | 1,114 | |
| USD | | | 153,741 | | | CAD | | | 202,899 | | | | CIT | | | 01/20/21 | | | | — | | | | | 5,671 | |
| USD | | | 64,100 | | | CAD | | | 85,219 | | | | HSB | | | 01/20/21 | | | | — | | | | | 2,854 | |
| USD | | | 310,506 | | | CAD | | | 409,656 | | | | HSB | | | 01/20/21 | | | | — | | | | | 11,348 | |
| USD | | | 38,008 | | | CAD | | | 50,716 | | | | JPM | | | 01/20/21 | | | | — | | | | | 1,838 | |
| USD | | | 339,430 | | | CAD | | | 447,786 | | | | JPM | | | 01/20/21 | | | | — | | | | | 12,381 | |
| USD | | | 44,085 | | | CAD | | | 58,468 | | | | MSC | | | 01/20/21 | | | | — | | | | | 1,851 | |
| USD | | | 58,448 | | | CAD | | | 77,121 | | | | MSC | | | 01/20/21 | | | | — | | | | | 2,144 | |
| USD | | | 135,000 | | | CHF | | | 122,905 | | | | JPM | | | 01/20/21 | | | | — | | | | | 3,894 | |
| USD | | | 82,481 | | | CLP | | | 65,729,298 | | | | CIT | | | 02/16/21 | | | | — | | | | | 10,021 | |
| USD | | | 97,126 | | | CLP | | | 74,010,000 | | | | CIT | | | 02/16/21 | | | | — | | | | | 7,030 | |
| USD | | | 51,832 | | | COP | | | 194,179,641 | | | | CIT | | | 02/16/21 | | | | — | | | | | 4,996 | |
| USD | | | 13,240 | | | CZK | | | 294,847 | | | | JPM | | | 01/22/21 | | | | — | | | | | 489 | |
The accompanying notes are an integral part of these financial statements.
Annual Report 47
Lazard Global Fixed Income Portfolio (concluded)
Currency
Purchased | | Quantity | | | Currency
Sold | | Quantity | | | | Counterparty | | | Settlement
Date | | Unrealized
Appreciation | | Unrealized
Depreciation | |
| | | | | | | | | | | | | | | | | | | | | | | | | | | |
| USD | | | 203,208 | | | CZK | | | 4,693,955 | | | | JPM | | | 01/22/21 | | | $ | — | | | | $ | 15,350 | |
| USD | | | 32,829 | | | EUR | | | 27,731 | | | | CIT | | | 01/20/21 | | | | — | | | | | 1,061 | |
| USD | | | 28,933 | | | EUR | | | 24,299 | | | | HSB | | | 01/20/21 | | | | — | | | | | 764 | |
| USD | | | 269,891 | | | EUR | | | 228,087 | | | | HSB | | | 01/20/21 | | | | — | | | | | 8,859 | |
| USD | | | 2,049 | | | EUR | | | 1,720 | | | | JPM | | | 01/20/21 | | | | — | | | | | 53 | |
| USD | | | 44,139 | | | EUR | | | 37,238 | | | | JPM | | | 01/20/21 | | | | — | | | | | 1,371 | |
| USD | | | 6,712 | | | GBP | | | 5,057 | | | | JPM | | | 01/20/21 | | | | — | | | | | 204 | |
| USD | | | 10,709 | | | GBP | | | 8,069 | | | | JPM | | | 01/20/21 | | | | — | | | | | 326 | |
| USD | | | 152,966 | | | GBP | | | 112,999 | | | | JPM | | | 01/20/21 | | | | — | | | | | 1,580 | |
| USD | | | 14,564 | | | HUF | | | 4,431,201 | | | | JPM | | | 01/20/21 | | | | — | | | | | 364 | |
| USD | | | 232,727 | | | HUF | | | 72,163,989 | | | | JPM | | | 01/22/21 | | | | — | | | | | 10,378 | |
| USD | | | 129,700 | | | JPY | | | 13,590,238 | | | | JPM | | | 01/20/21 | | | | — | | | | | 1,943 | |
| USD | | | 47,359 | | | MXN | | | 952,619 | | | | HSB | | | 01/20/21 | | | | — | | | | | 430 | |
| USD | | | 43,400 | | | NOK | | | 392,807 | | | | JPM | | | 01/22/21 | | | | — | | | | | 2,412 | |
| USD | | | 215,346 | | | NOK | | | 2,006,974 | | | | JPM | | | 01/22/21 | | | | — | | | | | 18,724 | |
| USD | | | 78,052 | | | NZD | | | 116,322 | | | | CIT | | | 01/20/21 | | | | — | | | | | 5,650 | |
| USD | | | 73,270 | | | NZD | | | 109,222 | | | | HSB | | | 01/20/21 | | | | — | | | | | 5,323 | |
| USD | | | 8,538 | | | NZD | | | 12,393 | | | | JPM | | | 01/20/21 | | | | — | | | | | 379 | |
| USD | | | 25,340 | | | NZD | | | 37,764 | | | | JPM | | | 01/20/21 | | | | — | | | | | 1,834 | |
| USD | | | 82,920 | | | PEN | | | 298,306 | | | | JPM | | | 02/16/21 | | | | 492 | | | | | — | |
| USD | | | 3,502 | | | PLN | | | 13,642 | | | | HSB | | | 01/20/21 | | | | — | | | | | 151 | |
| USD | | | 14,280 | | | PLN | | | 53,963 | | | | HSB | | | 01/20/21 | | | | — | | | | | 167 | |
| USD | | | 43,200 | | | PLN | | | 165,538 | | | | HSB | | | 01/20/21 | | | | — | | | | | 1,118 | |
| USD | | | 44,000 | | | PLN | | | 171,267 | | | | HSB | | | 01/20/21 | | | | — | | | | | 1,851 | |
| USD | | | 128,293 | | | PLN | | | 482,469 | | | | HSB | | | 01/20/21 | | | | — | | | | | 873 | |
| USD | | | 11,718 | | | RON | | | 48,175 | | | | HSB | | | 01/20/21 | | | | — | | | | | 364 | |
| USD | | | 62,029 | | | RON | | | 266,022 | | | | HSB | | | 01/22/21 | | | | — | | | | | 4,684 | |
| USD | | | 48,118 | | | SGD | | | 64,337 | | | | JPM | | | 01/20/21 | | | | — | | | | | 564 | |
| USD | | | 48,119 | | | SGD | | | 64,279 | | | | JPM | | | 01/20/21 | | | | — | | | | | 519 | |
| USD | | | 82,400 | | | SGD | | | 112,871 | | | | JPM | | | 01/20/21 | | | | — | | | | | 3,006 | |
| Total gross unrealized appreciation/depreciation on Forward Currency Contracts | | | | | | | | | $ | 143,252 | | | | $ | 188,997 | |
The accompanying notes are an integral part of these financial statements.
48 Annual Report
| Description | | Principal
Amount
(000) | | | Fair
Value | |
| | | | | |
| Lazard US Corporate Income Portfolio | | | | | | | | |
| | | | | | | | | |
| Corporate Bonds | 85.5% | | | | | | | | |
| | | | | | | | | |
| Aerospace & Defense | 0.7% | | | | | | | | |
The Boeing Co.,
4.875%, 05/01/25 | | $ | 1,500 | | | $ | 1,709,542 | |
Triumph Group, Inc.,
6.250%, 09/15/24 (#) | | | 500 | | | | 495,000 | |
| | | | | | | | 2,204,542 | |
| Airlines | 0.4% | | | | | | | | |
Continental Airlines Pass Through Trust,
4.150%, 04/11/24 | | | 1,262 | | | | 1,269,788 | |
| | | | | | | | | |
| Auto Components | 2.6% | | | | | | | | |
BorgWarner, Inc.,
5.000%, 10/01/25 (#) | | | 1,925 | | | | 2,263,001 | |
Dana, Inc.,
5.500%, 12/15/24 | | | 1,800 | | | | 1,836,000 | |
Tenneco, Inc.,
5.000%, 07/15/26 | | | 2,100 | | | | 1,932,000 | |
| The Goodyear Tire & Rubber Co.: | | | | | | | | |
| 5.125%, 11/15/23 | | | 1,550 | | | | 1,551,937 | |
| 5.000%, 05/31/26 | | | 250 | | | | 255,625 | |
| | | | | | | | 7,838,563 | |
| Automobiles | 1.0% | | | | | | | | |
Fiat Chrysler Automobiles NV,
5.250%, 04/15/23 | | | 2,000 | | | | 2,145,000 | |
Jaguar Land Rover Automotive PLC,
4.500%, 10/01/27 (#) | | | 1,000 | | | | 930,000 | |
| | | | | | | | 3,075,000 | |
| Building Products | 0.6% | | | | | | | | |
Griffon Corp.,
5.750%, 03/01/28 | | | 1,750 | | | | 1,851,395 | |
| | | | | | | | | |
| Capital Markets | 0.7% | | | | | | | | |
Icahn Enterprises LP,
6.250%, 05/15/26 | | | 1,500 | | | | 1,588,350 | |
The accompanying notes are an integral part of these financial statements.
Annual Report 49
| Description | | Principal
Amount
(000) | | | Fair
Value | |
| | | | | |
| Lazard US Corporate Income Portfolio (continued) | | | | | | | | |
| | | | | | | | | |
MPT Operating Partnership LP,
3.500%, 03/15/31 | | $ | 500 | | | $ | 516,250 | |
| | | | | | | | 2,104,600 | |
| Chemicals | 2.7% | | | | | | | | |
CF Industries, Inc.,
3.450%, 06/01/23 | | | 1,725 | | | | 1,798,313 | |
Methanex Corp.,
5.125%, 10/15/27 | | | 1,000 | | | | 1,086,880 | |
Mosaic Global Holdings, Inc.,
7.300%, 01/15/28 | | | 775 | | | | 994,981 | |
NOVA Chemicals Corp.,
5.250%, 08/01/23 (#) | | | 1,550 | | | | 1,557,750 | |
Valvoline, Inc.,
4.375%, 08/15/25 | | | 1,500 | | | | 1,549,155 | |
WR Grace & Co-Conn,
4.875%, 06/15/27 (#) | | | 1,000 | | | | 1,060,520 | |
| | | | | | | | 8,047,599 | |
| Commercial Services & Supplies | 4.0% | | | | | | | | |
ACCO Brands Corp.,
5.250%, 12/15/24 (#) | | | 1,800 | | | | 1,849,500 | |
Aramark Services, Inc.,
5.000%, 04/01/25 (#) | | | 2,000 | | | | 2,060,000 | |
Ashtead Capital, Inc.,
4.375%, 08/15/27 (#) | | | 1,900 | | | | 2,006,875 | |
Clean Harbors, Inc.,
4.875%, 07/15/27 (#) | | | 2,000 | | | | 2,086,620 | |
GFL Environmental, Inc.,
3.500%, 09/01/28 (#) | | | 250 | | | | 255,052 | |
KAR Auction Services, Inc.,
5.125%, 06/01/25 (#) | | | 1,800 | | | | 1,852,254 | |
Prime Security Services Borrower LLC,
3.375%, 08/31/27 (#) | | | 1,500 | | | | 1,488,750 | |
The ADT Security Corp.,
4.125%, 06/15/23 | | | 500 | | | | 533,075 | |
| | | | | | | | 12,132,126 | |
The accompanying notes are an integral part of these financial statements.
50 Annual Report
| Description | | Principal
Amount
(000) | | | Fair
Value | |
| | | | | |
| Lazard US Corporate Income Portfolio (continued) | | | | | | | | |
| | | | | | | | | |
| Communications Equipment | 0.6% | | | | | | | | |
Plantronics, Inc.,
5.500%, 05/31/23 (#) | | $ | 1,750 | | | $ | 1,754,375 | |
| | | | | | | | | |
| Construction Materials | 0.6% | | | | | | | | |
James Hardie International Finance DAC,
5.000%, 01/15/28 (#) | | | 1,760 | | | | 1,865,600 | |
| | | | | | | | | |
| Consumer Finance | 0.4% | | | | | | | | |
Ford Motor Credit Co. LLC,
4.125%, 08/17/27 | | | 1,000 | | | | 1,047,500 | |
| | | | | | | | | |
| Containers & Packaging | 3.4% | | | | | | | | |
Ardagh Packaging Finance PLC,
4.125%, 08/15/26 (#) | | | 1,200 | | | | 1,254,000 | |
Ball Corp.,
4.000%, 11/15/23 | | | 2,100 | | | | 2,236,500 | |
| Crown Americas LLC: | | | | | | | | |
| 4.500%, 01/15/23 | | | 1,550 | | | | 1,635,451 | |
| 4.250%, 09/30/26 | | | 500 | | | | 551,075 | |
Graphic Packaging International LLC,
3.500%, 03/15/28 (#) | | | 1,600 | | | | 1,658,000 | |
Sealed Air Corp.,
4.875%, 12/01/22 (#) | | | 1,700 | | | | 1,782,875 | |
Silgan Holdings, Inc.,
4.125%, 02/01/28 | | | 100 | | | | 103,875 | |
Smurfit Kappa Treasury Funding DAC,
7.500%, 11/20/25 | | | 750 | | | | 929,063 | |
| | | | | | | | 10,150,839 | |
| Diversified Consumer Services | 0.7% | | | | | | | | |
Service Corp. International,
4.625%, 12/15/27 | | | 2,000 | | | | 2,130,000 | |
| | | | | | | | | |
| Diversified Financial Services | 1.2% | | | | | | | | |
INEOS Group Holdings SA,
5.625%, 08/01/24 (#) | | | 1,700 | | | | 1,723,460 | |
The accompanying notes are an integral part of these financial statements.
Annual Report 51
| Description | | Principal
Amount
(000) | | | Fair
Value | |
| | | | | |
| Lazard US Corporate Income Portfolio (continued) | | | | | | | | |
| | | | | | | | | |
| Level 3 Financing, Inc.: | | | | | | | | |
| 4.250%, 07/01/28 (#) | | $ | 1,000 | | | $ | 1,027,500 | |
| 3.625%, 01/15/29 (#) | | | 1,000 | | | | 997,500 | |
| | | | | | | | 3,748,460 | |
| Diversified Telecommunication Services | 2.7% | | | | | | | | |
CenturyLink, Inc.,
4.000%, 02/15/27 (#) | | | 1,100 | | | | 1,135,750 | |
Connect Finco Sarl,
6.750%, 10/01/26 (#) | | | 1,500 | | | | 1,615,530 | |
Hughes Satellite Systems Corp.,
5.250%, 08/01/26 | | | 2,091 | | | | 2,307,941 | |
SBA Communications Corp.,
4.875%, 09/01/24 | | | 2,000 | | | | 2,051,460 | |
Zayo Group Holdings, Inc.,
4.000%, 03/01/27 (#) | | | 1,000 | | | | 1,002,500 | |
| | | | | | | | 8,113,181 | |
| Electric Utilities | 0.2% | | | | | | | | |
NRG Energy, Inc.,
3.625%, 02/15/31 (#) | | | 500 | | | | 514,400 | |
| | | | | | | | | |
| Electrical Equipment | 0.5% | | | | | | | | |
Sensata Tech, Inc.,
4.375%, 02/15/30 (#) | | | 1,100 | | | | 1,183,875 | |
Sensata Technologies, Inc.,
3.750%, 02/15/31 (#) | | | 250 | | | | 259,145 | |
| | | | | | | | 1,443,020 | |
| Energy Equipment & Services | 0.3% | | | | | | | | |
Precision Drilling Corp.,
5.250%, 11/15/24 | | | 1,000 | | | | 865,000 | |
| | | | | | | | | |
| Entertainment | 1.4% | | | | | | | | |
| Live Nation Entertainment, Inc.: | | | | | | | | |
| 4.875%, 11/01/24 (#) | | | 1,550 | | | | 1,569,375 | |
| 3.750%, 01/15/28 (#) | | | 500 | | | | 505,200 | |
The accompanying notes are an integral part of these financial statements.
52 Annual Report
| Description | | Principal
Amount
(000) | | | Fair
Value | |
| | | | | |
| Lazard US Corporate Income Portfolio (continued) | | | | | | | | |
| | | | | | | | | |
| Netflix, Inc.: | | | | | | | | |
| 5.375%, 02/01/21 | | $ | 1,550 | | | $ | 1,555,813 | |
| 4.375%, 11/15/26 | | | 500 | | | | 554,375 | |
| | | | | | | | 4,184,763 | |
| Equity Real Estate Investment Trusts (REITs) | 4.3% | | | | | | | | |
Equinix, Inc.,
5.375%, 05/15/27 | | | 2,200 | | | | 2,397,910 | |
ESH Hospitality, Inc.,
5.250%, 05/01/25 (#) | | | 2,000 | | | | 2,050,000 | |
| Iron Mountain, Inc.: | | | | | | | | |
| 4.875%, 09/15/29 (#) | | | 500 | | | | 527,500 | |
| 4.500%, 02/15/31 (#) | | | 1,250 | | | | 1,309,375 | |
MGM Growth Properties Operating Partnership LP,
4.500%, 09/01/26 | | | 1,800 | | | | 1,936,620 | |
RHP Hotel Properties LP,
5.000%, 04/15/23 | | | 1,525 | | | | 1,528,812 | |
Uniti Group LP,
6.000%, 04/15/23 (#) | | | 1,700 | | | | 1,734,000 | |
VICI Properties LP,
4.250%, 12/01/26 (#) | | | 1,500 | | | | 1,555,725 | |
| | | | | | | | 13,039,942 | |
| Food & Staples Retailing | 1.3% | | | | | | | | |
Albertsons Cos, Inc.,
3.500%, 03/15/29 (#) | | | 1,500 | | | | 1,515,000 | |
Ingles Markets, Inc.,
5.750%, 06/15/23 | | | 633 | | | | 639,330 | |
Performance Food Group, Inc.,
5.500%, 06/01/24 (#) | | | 1,805 | | | | 1,814,025 | |
| | | | | | | | 3,968,355 | |
| Food Products | 2.0% | | | | | | | | |
B&G Foods, Inc.,
5.250%, 04/01/25 | | | 1,500 | | | | 1,548,750 | |
Lamb Weston Holdings, Inc.,
4.625%, 11/01/24 (#) | | | 2,000 | | | | 2,085,000 | |
Post Holdings, Inc.,
5.000%, 08/15/26 (#) | | | 1,800 | | | | 1,858,500 | |
The accompanying notes are an integral part of these financial statements.
Annual Report 53
| Description | | Principal
Amount
(000) | | | Fair
Value | |
| | | | | |
| Lazard US Corporate Income Portfolio (continued) | | | | | | | | |
| | | | | | | | | |
TreeHouse Foods, Inc.,
4.000%, 09/01/28 | | $ | 500 | | | $ | 517,187 | |
| | | | | | | | 6,009,437 | |
| Gas Utilities | 1.2% | | | | | | | | |
AmeriGas Partners LP,
5.625%, 05/20/24 | | | 1,550 | | | | 1,670,125 | |
Suburban Propane Partners LP,
5.500%, 06/01/24 | | | 1,800 | | | | 1,838,250 | |
| | | | | | | | 3,508,375 | |
| Health Care Equipment & Supplies | 1.3% | | | | | | | | |
Hill-Rom Holdings, Inc.,
4.375%, 09/15/27 (#) | | | 1,800 | | | | 1,901,601 | |
Hologic, Inc.,
4.625%, 02/01/28 (#) | | | 2,000 | | | | 2,122,500 | |
| | | | | | | | 4,024,101 | |
| Health Care Providers & Services | 4.2% | | | | | | | | |
| Centene Corp.: | | | | | | | | |
| 4.750%, 01/15/25 | | | 500 | | | | 513,115 | |
| 3.375%, 02/15/30 | | | 1,500 | | | | 1,578,135 | |
DaVita, Inc.,
4.625%, 06/01/30 (#) | | | 2,000 | | | | 2,120,000 | |
Encompass Health Corp.,
5.125%, 03/15/23 | | | 1,551 | | | | 1,553,265 | |
HCA, Inc.,
3.500%, 09/01/30 | | | 2,000 | | | | 2,124,042 | |
Legacy LifePoint Health LLC,
4.375%, 02/15/27 (#) | | | 1,250 | | | | 1,268,750 | |
Molina Healthcare, Inc.,
5.375%, 11/15/22 | | | 1,700 | | | | 1,799,875 | |
| Tenet Healthcare Corp.: | | | | | | | | |
| 4.625%, 07/15/24 | | | 750 | | | | 768,765 | |
| 4.875%, 01/01/26 (#) | | | 1,000 | | | | 1,046,110 | |
| | | | | | | | 12,772,057 | |
| Hotels, Restaurants & Leisure | 8.1% | | | | | | | | |
1011778 BC ULC,
3.875%, 01/15/28 (#) | | | 2,100 | | | | 2,133,117 | |
The accompanying notes are an integral part of these financial statements.
54 Annual Report
| Description | | Principal
Amount
(000) | | | Fair
Value | |
| | | | | |
| Lazard US Corporate Income Portfolio (continued) | | | | | | | | |
| | | | | | | | | |
| Boyd Gaming Corp.: | | | | | | | | |
| 6.375%, 04/01/26 | | $ | 750 | | | $ | 779,108 | |
| 4.750%, 12/01/27 | | | 850 | | | | 882,938 | |
Brinker International, Inc.,
5.000%, 10/01/24 (#) | | | 2,000 | | | | 2,085,000 | |
Cedar Fair LP,
5.375%, 04/15/27 | | | 1,550 | | | | 1,584,875 | |
Cinemark USA, Inc.,
4.875%, 06/01/23 | | | 1,550 | | | | 1,472,500 | |
Diamond Resorts International, Inc.,
7.750%, 09/01/23 (#) | | | 1,500 | | | | 1,539,855 | |
Golden Nugget, Inc.,
6.750%, 10/15/24 (#) | | | 1,622 | | | | 1,610,354 | |
International Game Technology PLC,
6.250%, 02/15/22 (#) | | | 1,450 | | | | 1,497,111 | |
KFC Holding Co.,
5.250%, 06/01/26 (#) | | | 2,400 | | | | 2,490,000 | |
MGM Resorts International,
4.625%, 09/01/26 | | | 800 | | | | 846,560 | |
Scientific Games International, Inc.,
5.000%, 10/15/25 (#) | | | 1,750 | | | | 1,805,807 | |
Six Flags Entertainment Corp.,
4.875%, 07/31/24 (#) | | | 1,850 | | | | 1,855,346 | |
Station Casinos LLC,
5.000%, 10/01/25 (#) | | | 1,700 | | | | 1,719,635 | |
Wyndham Destinations, Inc.,
6.625%, 07/31/26 (#) | | | 100 | | | | 114,500 | |
Wynn Las Vegas LLC,
5.500%, 03/01/25 (#) | | | 2,000 | | | | 2,090,840 | |
| | | | | | | | 24,507,546 | |
| Household Durables | 0.3% | | | | | | | | |
Tempur Sealy International, Inc.,
5.625%, 10/15/23 | | | 972 | | | | 987,795 | |
The accompanying notes are an integral part of these financial statements.
Annual Report 55
| Description | | Principal
Amount
(000) | | | Fair
Value | |
| | | | | |
| Lazard US Corporate Income Portfolio (continued) | | | | | | | | |
| | | | | | | | | |
| Household Products | 1.0% | | | | | | | | |
Energizer Holdings, Inc.,
4.750%, 06/15/28 (#) | | $ | 1,200 | | | $ | 1,263,000 | |
Spectrum Brands, Inc.,
5.750%, 07/15/25 | | | 1,800 | | | | 1,858,680 | |
| | | | | | | | 3,121,680 | |
| Independent Power & Renewable Electricity Producers | 1.2% | | | | | | | | |
Calpine Corp.,
4.500%, 02/15/28 (#) | | | 1,500 | | | | 1,560,000 | |
NextEra Energy Operating Partners LP,
4.500%, 09/15/27 (#) | | | 1,750 | | | | 1,958,723 | |
| | | | | | | | 3,518,723 | |
| Interactive Media & Services | 0.4% | | | | | | | | |
Twitter, Inc.,
3.875%, 12/15/27 (#) | | | 1,250 | | | | 1,331,250 | |
| | | | | | | | | |
| IT Services | 0.5% | | | | | | | | |
VeriSign, Inc.,
4.625%, 05/01/23 | | | 1,550 | | | | 1,563,563 | |
| | | | | | | | | |
| Machinery | 2.7% | | | | | | | | |
Allison Transmission, Inc.,
4.750%, 10/01/27 (#) | | | 1,795 | | | | 1,880,262 | |
| Amsted Industries, Inc.: | | | | | | | | |
| 5.625%, 07/01/27 (#) | | | 750 | | | | 796,875 | |
| 4.625%, 05/15/30 (#) | | | 1,000 | | | | 1,047,500 | |
Meritor, Inc.,
6.250%, 02/15/24 | | | 661 | | | | 674,564 | |
Mueller Water Products, Inc.,
5.500%, 06/15/26 (#) | | | 1,750 | | | | 1,813,437 | |
Terex Corp.,
5.625%, 02/01/25 (#) | | | 1,790 | | | | 1,843,924 | |
| | | | | | | | 8,056,562 | |
| Media | 10.4% | | | | | | | | |
AMC Networks, Inc.,
4.750%, 12/15/22 | | | 1,000 | | | | 1,001,250 | |
The accompanying notes are an integral part of these financial statements.
56 Annual Report
| Description | | Principal
Amount
(000) | | | Fair
Value | |
| | | | | |
| Lazard US Corporate Income Portfolio (continued) | | | | | | | | |
| | | | | | | | | |
| CCO Holdings LLC: | | | | | | | | |
| 5.125%, 05/01/27 (#) | | $ | 500 | | | $ | 530,595 | |
| 4.750%, 03/01/30 (#) | | | 1,500 | | | | 1,618,500 | |
Clear Channel Worldwide Holdings, Inc.,
5.125%, 08/15/27 (#) | | | 2,000 | | | | 2,020,000 | |
| CSC Holdings LLC: | | | | | | | | |
| 5.500%, 05/15/26 (#) | | | 1,000 | | | | 1,040,000 | |
| 7.500%, 04/01/28 (#) | | | 1,690 | | | | 1,900,540 | |
Diamond Sports Group LLC,
5.375%, 08/15/26 (#) | | | 1,500 | | | | 1,218,750 | |
Entercom Media Corp.,
7.250%, 11/01/24 (#) | | | 1,500 | | | | 1,496,250 | |
GCI LLC,
4.750%, 10/15/28 (#) | | | 250 | | | | 266,638 | |
Lamar Media Corp.,
5.750%, 02/01/26 | | | 1,726 | | | | 1,779,938 | |
Meredith Corp.,
6.875%, 02/01/26 | | | 1,950 | | | | 1,901,250 | |
Nexstar Broadcasting, Inc.,
5.625%, 07/15/27 (#) | | | 1,500 | | | | 1,606,875 | |
Outfront Media Capital LLC,
5.000%, 08/15/27 (#) | | | 2,300 | | | | 2,340,250 | |
| Sinclair Television Group, Inc.: | | | | | | | | |
| 5.125%, 02/15/27 (#) | | | 1,750 | | | | 1,780,625 | |
| 4.125%, 12/01/30 (#) | | | 1,000 | | | | 1,024,130 | |
Sirius XM Radio, Inc.,
5.000%, 08/01/27 (#) | | | 1,750 | | | | 1,859,392 | |
TEGNA, Inc.,
5.000%, 09/15/29 | | | 250 | | | | 264,104 | |
The EW Scripps Co.,
5.125%, 05/15/25 (#) | | | 1,800 | | | | 1,837,323 | |
Univision Communications, Inc.,
5.125%, 02/15/25 (#) | | | 2,000 | | | | 2,015,000 | |
| Videotron, Ltd.: | | | | | | | | |
| 5.000%, 07/15/22 | | | 1,558 | | | | 1,637,863 | |
| 5.125%, 04/15/27 (#) | | | 500 | | | | 530,625 | |
The accompanying notes are an integral part of these financial statements.
Annual Report 57
| Description | | Principal
Amount
(000) | | | Fair
Value | |
| | | | | |
| Lazard US Corporate Income Portfolio (continued) | | | | | | | | |
| | | | | | | | | |
Virgin Media Secured Finance PLC,
5.500%, 08/15/26 (#) | | $ | 1,750 | | | $ | 1,817,813 | |
| | | | | | | | 31,487,711 | |
| Metals & Mining | 3.8% | | | | | | | | |
Alcoa Nederland Holding BV,
6.750%, 09/30/24 (#) | | | 1,800 | | | | 1,874,790 | |
Anglo American Capital PLC,
4.875%, 05/14/25 (#) | | | 1,650 | | | | 1,908,282 | |
FMG Resources August 2006 Pty, Ltd.,
4.500%, 09/15/27 (#) | | | 1,750 | | | | 1,944,232 | |
Freeport-McMoRan, Inc.,
4.550%, 11/14/24 | | | 2,200 | | | | 2,403,500 | |
Novelis Corp.,
4.750%, 01/30/30 (#) | | | 1,500 | | | | 1,616,048 | |
Steel Dynamics, Inc.,
5.000%, 12/15/26 | | | 1,550 | | | | 1,652,985 | |
| | | | | | | | 11,399,837 | |
| Oil, Gas & Consumable Fuels | 6.2% | | | | | | | | |
Buckeye Partners LP,
4.500%, 03/01/28 (#) | | | 1,500 | | | | 1,545,000 | |
Cheniere Energy Partners LP,
5.250%, 10/01/25 | | | 1,250 | | | | 1,282,812 | |
Energy Transfer Operating LP,
5.875%, 01/15/24 | | | 750 | | | | 842,827 | |
Holly Energy Partners LP,
5.000%, 02/01/28 (#) | | | 500 | | | | 503,750 | |
Murphy Oil Corp.,
6.875%, 08/15/24 | | | 1,500 | | | | 1,526,550 | |
Occidental Petroleum Corp.,
3.400%, 04/15/26 | | | 1,750 | | | | 1,668,459 | |
Ovintiv Exploration, Inc.,
5.625%, 07/01/24 | | | 1,600 | | | | 1,717,184 | |
Parsley Energy LLC,
5.625%, 10/15/27 (#) | | | 1,700 | | | | 1,860,650 | |
Range Resources Corp.,
5.000%, 08/15/22 | | | 950 | | | | 940,500 | |
The accompanying notes are an integral part of these financial statements.
58 Annual Report
| Description | | Principal
Amount
(000) | | | Fair
Value | |
| | | | | |
| Lazard US Corporate Income Portfolio (continued) | | | | | | | | |
| | | | | | | | | |
Southwestern Energy Co.,
6.450%, 01/23/25 | | $ | 1,800 | | | $ | 1,867,500 | |
Sunoco LP,
5.500%, 02/15/26 | | | 1,700 | | | | 1,742,500 | |
Tallgrass Energy Partners LP,
5.500%, 01/15/28 (#) | | | 1,250 | | | | 1,276,563 | |
| WPX Energy, Inc.: | | | | | | | | |
| 6.000%, 01/15/22 | | | 900 | | | | 913,509 | |
| 5.750%, 06/01/26 | | | 1,000 | | | | 1,051,250 | |
| 5.250%, 10/15/27 | | | 100 | | | | 105,962 | |
| | | | | | | | 18,845,016 | |
| Pharmaceuticals | 0.5% | | | | | | | | |
| Bausch Health Cos., Inc.: | | | | | | | | |
| 5.000%, 02/15/29 (#) | | | 1,500 | | | | 1,542,300 | |
| 5.250%, 02/15/31 (#) | | | 100 | | | | 104,472 | |
| | | | | | | | 1,646,772 | |
| Professional Services | 1.5% | | | | | | | | |
IHS Markit, Ltd.,
5.000%, 11/01/22 (#) | | | 1,500 | | | | 1,603,840 | |
| Nielsen Finance LLC: | | | | | | | | |
| 5.000%, 04/15/22 (#) | | | 556 | | | | 557,462 | |
| 5.625%, 10/01/28 (#) | | | 1,000 | | | | 1,086,550 | |
| 5.875%, 10/01/30 (#) | | | 1,000 | | | | 1,131,250 | |
| | | | | | | | 4,379,102 | |
| Software | 1.1% | | | | | | | | |
J2 Global, Inc.,
4.625%, 10/15/30 (#) | | | 1,500 | | | | 1,582,500 | |
Nuance Communications, Inc.,
5.625%, 12/15/26 | | | 1,500 | | | | 1,587,180 | |
| | | | | | | | 3,169,680 | |
| Specialty Retail | 1.7% | | | | | | | | |
Asbury Automotive Group, Inc.,
4.500%, 03/01/28 | | | 987 | | | | 1,028,947 | |
Group 1 Automotive, Inc.,
4.000%, 08/15/28 (#) | | | 1,000 | | | | 1,030,780 | |
The accompanying notes are an integral part of these financial statements.
Annual Report 59
| Description | | Principal
Amount
(000) | | | Fair
Value | |
| | | | | |
| Lazard US Corporate Income Portfolio (continued) | | | | | | | | |
| | | | | | | | | |
Penske Automotive Group, Inc.,
5.500%, 05/15/26 | | $ | 1,800 | | | $ | 1,869,750 | |
QVC, Inc.,
4.750%, 02/15/27 | | | 1,250 | | | | 1,340,625 | |
| | | | | | | | 5,270,102 | |
| Technology Hardware, Storage & Peripherals | 2.3% | | | | | | | | |
Dell International LLC,
7.125%, 06/15/24 (#) | | | 1,525 | | | | 1,581,615 | |
NCR Corp.,
5.750%, 09/01/27 (#) | | | 1,000 | | | | 1,062,500 | |
Seagate HDD Cayman,
4.091%, 06/01/29 (#) | | | 2,083 | | | | 2,224,915 | |
Western Digital Corp.,
4.750%, 02/15/26 | | | 2,000 | | | | 2,210,000 | |
| | | | | | | | 7,079,030 | |
| Textiles, Apparel & Luxury Goods | 0.6% | | | | | | | | |
Hanesbrands, Inc.,
4.625%, 05/15/24 (#) | | | 1,750 | | | | 1,833,125 | |
| | | | | | | | | |
| Trading Companies & Distributors | 3.3% | | | | | | | | |
American Builders & Contractors Supply Co., Inc.,
4.000%, 01/15/28 (#) | | | 1,100 | | | | 1,138,500 | |
Avis Budget Car Rental LLC,
5.750%, 07/15/27 (#) | | | 1,500 | | | | 1,515,000 | |
Herc Holdings, Inc.,
5.500%, 07/15/27 (#) | | | 1,500 | | | | 1,590,000 | |
Standard Industries, Inc.,
3.375%, 01/15/31 (#) | | | 2,000 | | | | 2,010,000 | |
| United Rentals North America, Inc.: | | | | | | | | |
| 5.500%, 05/15/27 | | | 1,000 | | | | 1,071,250 | |
| 3.875%, 11/15/27 | | | 1,100 | | | | 1,152,250 | |
WESCO Distribution, Inc.,
5.375%, 12/15/21 | | | 1,600 | | | | 1,600,960 | |
| | | | | | | | 10,077,960 | |
The accompanying notes are an integral part of these financial statements.
60 Annual Report
| Description | | Principal
Amount
(000) | | | Fair
Value | |
| | | | | |
| Lazard US Corporate Income Portfolio (concluded) | | | | | | | | |
| | | | | | | | | |
| Wireless Telecommunication Services | 0.9% | | | | | | | | |
Sprint Corp.,
7.125%, 06/15/24 | | $ | 500 | | | $ | 584,695 | |
T-Mobile USA, Inc.,
6.500%, 01/15/26 | | | 2,000 | | | | 2,070,000 | |
| | | | | | | | 2,654,695 | |
Total Corporate Bonds
(Cost $249,846,663) | | | | | | | 258,593,167 | |
| Description | | Shares | | |
Fair
Value | |
| | | | | |
| Exchange-Traded Funds | 7.8% | | | | | | | | |
Invesco Fundamental High Yield Corporate Bond ETF
(Cost $23,042,937) | | | 1,222,805 | | | $ | 23,771,329 | |
| | | | | | | | | |
| Short-Term Investments | 5.8% | | | | | | | | |
State Street Institutional Treasury Money Market Fund, Premier Class,
0.01% (7 day yield)
(Cost $17,406,307) | | | 17,406,307 | | | | 17,406,307 | |
| | | | | | | | | |
Total Investments | 99.1%
(Cost $290,295,907) | | | | | | $ | 299,770,803 | |
| | | | | | | | | |
| Cash and Other Assets in Excess of Liabilities | 0.9% | | | | | | | 2,598,788 | |
| | | | | | | | | |
| Net Assets | 100.0% | | | | | | $ | 302,369,591 | |
The accompanying notes are an integral part of these financial statements.
Annual Report 61
| Description | | Principal
Amount
(000) | | | Fair
Value | |
| | | | | | | | | |
| Lazard US Short Duration Fixed Income Portfolio | | | | | | | | |
| | | | | | | | | |
| Asset-Backed Securities | 6.4% | | | | | | | | |
| | | | | | | | | |
| Automobiles | 4.8% | | | | | | | | |
World Omni Automobile Lease Securitization Trust,
3.190%, 12/15/21 | | $ | 633 | | | $ | 634,825 | |
Mercedes-Benz Auto Lease Trust,
3.100%, 11/15/21 | | | 1,009 | | | | 1,013,393 | |
Nissan Auto Lease Trust,
2.270%, 07/15/22 | | | 2,550 | | | | 2,571,260 | |
| | | | | | | | 4,219,478 | |
| Specialty Retail | 1.6% | | | | | | | | |
Daimler Trucks Retail Trust,
1.220%, 09/15/23 | | | 1,400 | | | | 1,413,050 | |
| | | | | | | | | |
Total Asset-Backed Securities
(Cost $5,591,724) | | | | | | | 5,632,528 | |
| | | | | | | | | |
| Corporate Bonds | 22.4% | | | | | | | | |
| | | | | | | | | |
| Banks | 7.4% | | | | | | | | |
Bank of America Corp.,
3.300%, 01/11/23 | | | 2,650 | | | | 2,809,410 | |
Wells Fargo & Co.,
2.625%, 07/22/22 | | | 3,575 | | | | 3,700,433 | |
| | | | | | | | 6,509,843 | |
| Biotechnology | 2.9% | | | | | | | | |
AbbVie, Inc.,
2.300%, 05/14/21 | | | 2,497 | | | | 2,510,815 | |
| | | | | | | | | |
| Capital Markets | 8.4% | | | | | | | | |
| Morgan Stanley: | | | | | | | | |
| 5.500%, 07/28/21 | | | 2,875 | | | | 2,959,520 | |
| 2.750%, 05/19/22 | | | 800 | | | | 826,156 | |
The Goldman Sachs Group, Inc.,
5.250%, 07/27/21 | | | 3,488 | | | | 3,585,922 | |
| | | | | | | | 7,371,598 | |
The accompanying notes are an integral part of these financial statements.
62 Annual Report
| Description | | Principal
Amount
(000) | | | Fair
Value | |
| | | | | | | | | |
| Lazard US Short Duration Fixed Income Portfolio (continued) | | | | | | | | |
| | | | | | | | | |
| Food & Staples Retailing | 1.8% | | | | | | | | |
The Kroger Co.,
3.300%, 01/15/21 | | $ | 1,584 | | | $ | 1,585,260 | |
| | | | | | | | | |
| Internet & Direct Marketing Retail | 1.9% | | | | | | | | |
eBay, Inc.,
2.750%, 01/30/23 | | | 1,545 | | | | 1,617,996 | |
| | | | | | | | | |
Total Corporate Bonds
(Cost $19,347,404) | | | | | | | 19,595,512 | |
| | | | | | | | | |
| US Government Securities | 0.9% | | | | | | | | |
| | | | | | | | | |
| Mortgage-Backed Securities | 0.9% | | | | | | | | |
| Federal National Mortgage Association: | | | | | | | | |
| Pool# AE0315, 4.500%, 02/01/21 | | | — | (‡‡) | | | 1 | |
| Pool# FM1033, 4.500%, 01/01/27 | | | 733 | | | | 775,628 | |
| | | | | | | | | |
Total US Government Securities
(Cost $760,044) | | | | | | | 775,629 | |
| | | | | | | | | |
| US Treasury Securities | 69.6% | | | | | | | | |
| U.S. Treasury Notes: | | | | | | | | |
| 1.125%, 09/30/21 | | | 7,775 | | | | 7,833,616 | |
| 2.000%, 10/31/21 | | | 17,810 | | | | 18,086,194 | |
| 1.500%, 01/31/22 | | | 9,725 | | | | 9,869,355 | |
| 1.875%, 01/31/22 | | | 12,515 | | | | 12,751,612 | |
| 1.875%, 10/31/22 | | | 12,160 | | | | 12,548,075 | |
| | | | | | | | | |
Total US Treasury Securities
(Cost $60,768,567) | | | | | | | 61,088,852 | |
The accompanying notes are an integral part of these financial statements.
Annual Report 63
| Description | | Shares | | |
Fair
Value | |
| | | | | | | |
| Lazard US Short Duration Fixed Income Portfolio (concluded) | | | | | | |
| | | | | | | |
| Short-Term Investments | 0.2% | | | | | | |
State Street Institutional Treasury Money Market Fund, Premier Class,
0.01% (7 day yield)
(Cost $204,322) | | | 204,322 | | | $ | 204,322 | |
| | | | | | | | | |
Total Investments | 99.5%
(Cost $86,672,061) | | | | | | $ | 87,296,843 | |
| | | | | | | | | |
| Cash and Other Assets in Excess of Liabilities | 0.5% | | | | | | | 478,065 | |
| | | | | | | | | |
| Net Assets | 100.0% | | | | | | $ | 87,774,908 | |
The accompanying notes are an integral part of these financial statements.
64 Annual Report
The Lazard Funds, Inc. Notes to Portfolios of Investments
December 31, 2020
| (§) | Variable and floating rate securities are securities for which interest rate changes are based on changes in a designated base rate. The rates shown are those in effect on December 31, 2020. |
| (¶) | Date shown is the next perpetual call date. |
| (#) | Pursuant to Rule 144A under the Securities Act of 1933, these securities may only be traded among “qualified institutional buyers.” At December 31, 2020, the percentage of net assets for each Portfolio was as follows:. |
| Portfolio | | Percentage of
Net Assets | |
| | | | | | |
| Emerging Markets Debt | | | 2.3 | % | |
| Global Fixed Income | | | 3.8 | % | |
| US Corporate Income | | | 50.3 | % | |
| (Ø) | Step up bonds are securities which increase the interest payment rate at a specified point in time. Rate shown reflects rate in effect at December 31, 2020 which may step up at a future date. |
| («) | Issue in default. |
| (») | The Portfolio, at all times, maintains portfolio securities in sufficient amount to cover its obligations related to investments in forward currency contracts. |
| (‡‡) | Amount is less than $1,000. |
Security Abbreviations:
| BBSW | — | Bank Bill Swap Reference Rate |
| EURIBOR | — | Euro Interbank Offered Rate |
| LIBOR | — | London Interbank Offered Rate |
| NTN-F | — | Brazil Sovereign “Nota do Tesouro Nacional” Series F |
| SOFR | — | Secured Overnight Financing Rate |
Currency Abbreviations:
| AUD | — | Australian Dollar | MXN | — | Mexican New Peso |
| BRL | — | Brazilian Real | MYR | — | Malaysian Ringgit |
| CAD | — | Canadian Dollar | NGN | — | Nigerian Naira |
| CHF | — | Swiss Franc | NOK | — | Norwegian Krone |
| CLP | — | Chilean Peso | NZD | — | New Zealand Dollar |
| CMT | — | Constant Maturity Treasury | PEN | — | Peruvian Nuevo Sol |
| CNH | — | Chinese Yuan Renminbi | PHP | — | Philippine Peso |
| CNY | — | Chinese Yuan | PLN | — | Polish Zloty |
| COP | — | Colombian Peso | RON | — | New Romanian Leu |
| CZK | — | Czech Koruna | RSD | — | Serbian Dinar |
| DOP | — | Dominican Republic Peso | RUB | — | Russian Ruble |
| EUR | — | Euro | SEK | — | Swedish Krona |
| GBP | — | British Pound Sterling | SGD | — | Singapore Dollar |
| GHS | — | Ghanaian Cedi | THB | — | Thai Baht |
| HUF | — | Hungarian Forint | TRY | — | New Turkish Lira |
| IDR | — | Indonesian Rupiah | UAH | — | Ukrainian Hryvnia |
| INR | — | Indian Rupee | USD | — | United States Dollar |
| JPY | — | Japanese Yen | UYU | — | Uruguayan Peso |
| KES | — | Kenyan Shilling | ZAR | — | South African Rand |
| KRW | — | South Korean Won | | | |
Counterparty Abbreviations:
| BOA | — | Bank of America NA | JPM | — | JPMorgan Chase Bank NA |
| BRC | — | Barclays Bank PLC | MSC | — | Morgan Stanley & Co. |
| CIT | — | Citibank NA | SCB | — | Standard Chartered Bank |
| HSB | — | HSBC Bank USA NA | UBS | — | UBS AG |
The accompanying notes are an integral part of these financial statements.
Annual Report 65
Portfolio holdings by industry (as a percentage of net assets), for the Portfolio previously presented by country:
| Industry† | | Lazard
Emerging
Markets Debt
Portfolio | | | Lazard
Global Fixed
Income
Portfolio | | |
| | | | | | | | | | | |
| Corporate & Quasi Government Bonds | | | | | | | | | | |
| Automobiles | | | | — | % | | | 2.8 | % | |
| Banks | | | | 1.8 | | | | 5.6 | | |
| Beverages | | | | — | | | | 1.8 | | |
| Capital Markets | | | | — | | | | 2.1 | | |
| Construction & Engineering | | | | — | | | | 0.1 | | |
| Consumer Finance | | | | — | | | | 1.1 | | |
| Containers & Packaging | | | | — | | | | 0.5 | | |
| Diversified Consumer Services | | | | — | | | | 0.6 | | |
| Diversified Financial Services | | | | 0.3 | | | | 1.0 | | |
| Diversified Telecommunication Services | | | | — | | | | 2.4 | | |
| Electrical Equipment | | | | — | | | | 1.2 | | |
| Equity Real Estate Investment Trusts (REITs) | | | | — | | | | 0.7 | | |
| Food & Staples Retailing | | | | — | | | | 1.6 | | |
| Health Care Providers & Services | | | | — | | | | 0.5 | | |
| Hotels, Restaurants & Leisure | | | | — | | | | 2.4 | | |
| Household Products | | | | — | | | | 1.1 | | |
| Interactive Media & Services | | | | — | | | | 1.0 | | |
| Internet & Direct Marketing Retail | | | | — | | | | 1.0 | | |
| Machinery | | | | — | | | | 1.0 | | |
| Oil, Gas & Consumable Fuels | | | | 4.5 | | | | — | | |
| Personal Products | | | | — | | | | 1.1 | | |
| Pharmaceuticals | | | | — | | | | 1.7 | | |
| Software | | | | — | | | | 2.0 | | |
| Specialty Retail | | | | — | | | | 1.0 | | |
| Technology Hardware, Storage & Peripherals | | | | — | | | | 1.7 | | |
| Trading Companies & Distributors | | | | — | | | | 0.5 | | |
| Transportation & Infrastructure | | | | 1.0 | | | | — | | |
| Wireless Telecommunication Services | | | | — | | | | 1.1 | | |
| Subtotal | | | | 7.6 | | | | 37.6 | | |
| Foreign Government Obligations | | | | 79.6 | | | | 43.7 | | |
| Supranational Bonds | | | | 0.1 | | | | 10.4 | | |
| US Municipal Bonds | | | | — | | | | 1.5 | | |
| US Treasury Securities | | | | — | | | | 3.0 | | |
| Short-Term Investments | | | | 11.3 | | | | 3.9 | | |
| Total Investments | | | | 98.6 | % | | | 100.1 | % | |
| † | Industry classifications may be different than those used for compliance monitoring purposes. |
The accompanying notes are an integral part of these financial statements.
66 Annual Report
[This page intentionally left blank]
The Lazard Funds, Inc. Statements of Assets and Liabilities
| | | | | | | |
| December 31, 2020 | | Lazard
Emerging Markets
Debt Portfolio | | | Lazard
Global Fixed
Income Portfolio | |
| ASSETS | | | | | | | | | | |
| Investments in securities, at fair value | | | $ | 21,957,236 | | | | $ | 9,555,311 | |
| Cash | | | | 27,488 | | | | | — | |
| Foreign currency, at fair value | | | | 280,739 | | | | | 9 | |
| Receivables for: | | | | | | | | | | |
| Dividends and interest | | | | 290,277 | | | | | 80,693 | |
| Capital stock sold | | | | 230 | | | | | 4 | |
| Investments sold | | | | 6 | | | | | — | |
| Amount due from Investment Manager (Note 3) | | | | 12,753 | | | | | 15,391 | |
| Cash collateral due from broker on swaps | | | | 14,362 | | | | | — | |
| Gross unrealized appreciation on forward currency contracts | | | | 116,845 | | | | | 143,252 | |
| Total assets | | | | 22,699,936 | | | | | 9,794,660 | |
| LIABILITIES | | | | | | | | | | |
| Payables for: | | | | | | | | | | |
| Management fees | | | | — | | | | | — | |
| Accrued custodian fees | | | | 58,032 | | | | | 20,477 | |
| Accrued professional services | | | | 52,057 | | | | | 31,805 | |
| Accrued directors’ fees | | | | 3,367 | | | | | 15 | |
| Accrued registration fees | | | | 974 | | | | | 1,450 | |
| Accrued distribution fees | | | | 94 | | | | | 10 | |
| Investments purchased | | | | 199,917 | | | | | — | |
| Capital stock redeemed | | | | — | | | | | 59 | |
| Dividends | | | | — | | | | | — | |
| Capital gains distributions | | | | — | | | | | 393 | |
| Variation margin on centrally cleared swap | | | | 281 | | | | | — | |
| Gross unrealized depreciation on forward currency contracts | | | | 73,535 | | | | | 188,997 | |
| Other accrued expenses and payables | | | | 33,025 | | | | | 5,291 | |
| Total liabilities | | | | 421,282 | | | | | 248,497 | |
| Net assets | | | $ | 22,278,654 | | | | $ | 9,546,163 | |
| NET ASSETS | | | | | | | | | | |
| Paid in capital | | | $ | 61,634,146 | | | | $ | 8,893,202 | |
| Distributable earnings (Accumulated loss) | | | | (39,355,492 | ) | | | | 652,961 | |
| Net assets | | | $ | 22,278,654 | | | | $ | 9,546,163 | |
The accompanying notes are an integral part of these financial statements.
68 Annual Report
Lazard
US Corporate
Income Portfolio | | | Lazard US
Short Duration
Fixed Income
Portfolio | |
| | | | | | | | | |
| | $ | 299,770,803 | | | | $ | 87,296,843 | |
| | | — | | | | | — | |
| | | — | | | | | — | |
| | | | | | | | | |
| | | 3,334,849 | | | | | 570,290 | |
| | | 18,630 | | | | | — | |
| | | — | | | | | — | |
| | | — | | | | | — | |
| | | — | | | | | — | |
| | | | | | | | | |
| | | — | | | | | — | |
| | | 303,124,282 | | | | | 87,867,133 | |
| | | | | | | | | |
| | | 89,665 | | | | | 7,301 | |
| | | 35,736 | | | | | 14,428 | |
| | | 30,632 | | | | | 27,056 | |
| | | 2,071 | | | | | 877 | |
| | | 1,974 | | | | | 4,739 | |
| | | 800 | | | | | 7 | |
| | | 500,000 | | | | | — | |
| | | 57,853 | | | | | 25,773 | |
| | | 25,855 | | | | | 4,587 | |
| | | — | | | | | — | |
| | | — | | | | | — | |
| | | | | | | | | |
| | | — | | | | | — | |
| | | 10,105 | | | | | 7,457 | |
| | | 754,691 | | | | | 92,225 | |
| | $ | 302,369,591 | | | | $ | 87,774,908 | |
| | | | | | | | | |
| | $ | 302,067,153 | | | | $ | 87,577,305 | |
| | | 302,438 | | | | | 197,603 | |
| | $ | 302,369,591 | | | | $ | 87,774,908 | |
Annual Report 69
| | | | | | | |
| December 31, 2020 | | Lazard
Emerging Markets
Debt Portfolio | | | Lazard
Global Fixed
Income Portfolio | |
| Institutional Shares | | | | | | | | | | |
| Net assets | | | $ | 21,880,017 | | | | $ | 9,497,865 | |
| Shares of capital stock outstanding* | | | | 1,364,341 | | | | | 989,793 | |
| Net asset value, offering and redemption price per share | | | $ | 16.04 | | | | $ | 9.60 | |
| | | | | | | | | | | |
| Open Shares | | | | | | | | | | |
| Net assets | | | $ | 397,412 | | | | $ | 48,298 | |
| Shares of capital stock outstanding* | | | | 24,524 | | | | | 5,032 | |
| Net asset value, offering and redemption price per share | | | $ | 16.21 | | | | $ | 9.60 | |
| | | | | | | | | | | |
| R6 Shares | | | | | | | | | | |
| Net assets | | | $ | 1,225 | | | | | — | |
| Shares of capital stock outstanding* | | | | 71 | † | | | | — | |
| Net asset value, offering and redemption price per share* | | | $ | 17.19 | | | | | — | |
| | | | | | | | | | | |
| Cost of investments in securities | | | $ | 21,516,462 | | | | $ | 8,959,369 | |
| Cost of foreign currency | | | $ | 276,470 | | | | $ | 9 | |
| | | | | | | | | | | |
| * $0.001 par value, 6,900,000,000 shares authorized for the Portfolios in total. | | | | | | | | | | |
| † Shares values are rounded for presentation purposes. | | | | | | | | | | |
The accompanying notes are an integral part of these financial statements.
70 Annual Report
Lazard
US Corporate
Income Portfolio | | | Lazard US
Short Duration
Fixed Income
Portfolio | |
| | | | | | | | | |
| | $ | 298,635,591 | | | | $ | 87,745,563 | |
| | | 15,080,446 | | | | | 8,867,736 | |
| | | | | | | | | |
| | $ | 19.80 | | | | $ | 9.89 | |
| | | | | | | | | |
| | $ | 3,732,793 | | | | $ | 29,345 | |
| | | 187,617 | | | | | 2,964 | |
| | | | | | | | | |
| | $ | 19.90 | | | | $ | 9.90 | |
| | | | | | | | | |
| | $ | 1,207 | | | | | — | |
| | | 61 | † | | | | — | |
| | | | | | | | | |
| | $ | 19.88 | | | | | — | |
| | | | | | | | | |
| | $ | 290,295,907 | | | | $ | 86,672,061 | |
| | $ | — | | | | $ | — | |
Annual Report 71
The Lazard Funds, Inc. Statements of Operations
| | | | | | | |
| For the Year Ended December 31, 2020 | | Lazard
Emerging Markets
Debt Portfolio | | | Lazard
Global Fixed
Income Portfolio | |
| Investment Income (Loss) | | | | | | | | | | |
| Income | | | | | | | | | | |
| Interest | | | $ | 2,097,425 | | | | $ | 184,549 | |
| Dividends | | | | — | | | | | — | |
| Total investment income* | | | | 2,097,425 | | | | | 184,549 | |
| Expenses | | | | | | | | | | |
| Management fees (Note 3) | | | | 297,656 | | | | | 41,378 | |
| Custodian fees | | | | 151,552 | | | | | 52,610 | |
| Professional services | | | | 70,962 | | | | | 48,359 | |
| Administration fees | | | | 32,051 | | | | | 25,362 | |
| Registration fees | | | | 39,818 | | | | | 34,246 | |
| Shareholders’ services | | | | 12,234 | | | | | 9,426 | |
| Directors’ fees and expenses | | | | 11,033 | | | | | 5,352 | |
| Shareholders’ reports | | | | 13,302 | | | | | 6,709 | |
| Distribution fees (Open Shares) | | | | 1,079 | | | | | 143 | |
| Other^ | | | | 13,987 | | | | | 6,476 | |
| Total gross expenses | | | | 643,674 | | | | | 230,061 | |
| Management fees waived and expenses reimbursed | | | | (268,067 | ) | | | | (171,880 | ) |
| Total net expenses | | | | 375,607 | | | | | 58,181 | |
| Net investment income (loss) | | | | 1,721,818 | | | | | 126,368 | |
| Net Realized and Unrealized Gain (Loss) | | | | | | | | | | |
| Net realized gain (loss) on: | | | | | | | | | | |
| Investments** | | | | (2,844,914 | ) | | | | 241,207 | |
| Foreign currency transactions | | | | (87,879 | ) | | | | 15,727 | |
| Forward currency contracts | | | | (360,484 | ) | | | | 66,683 | |
| Swap agreements | | | | (201,935 | ) | | | | — | |
| Total net realized gain (loss) | | | | (3,495,212 | ) | | | | 323,617 | |
| Net change in unrealized appreciation (depreciation) on: | | | | | | | | | | |
| Investments† | | | | (1,112,377 | ) | | | | 471,082 | |
| Foreign currency translations | | | | (2,657 | ) | | | | 1,592 | |
| Forward currency contracts | | | | (259,956 | ) | | | | (42,062 | ) |
| Swap agreements | | | | (22,986 | ) | | | | — | |
| Total net change in unrealized appreciation (depreciation) | | | | (1,397,976 | ) | | | | 430,612 | |
| Net realized and unrealized gain (loss) | | | | (4,893,188 | ) | | | | 754,229 | |
| Net increase (decrease) in net assets resulting from operations | | | $ | (3,171,370 | ) | | | $ | 880,597 | |
| * Net of foreign withholding taxes of | | | $ | 47,587 | | | | $ | 499 | |
| ** Net of foreign capital gains taxes of | | | $ | 64,447 | | | | $ | — | |
| † Includes net change in unrealized appreciation (depreciation) of foreign capital gains taxes of | | | $ | 33,226 | | | | $ | — | |
| ^ Includes interest on line of credit of | | | $ | 2,657 | | | | $ | 32 | |
The accompanying notes are an integral part of these financial statements.
72 Annual Report
Lazard
US Corporate
Income Portfolio | | | Lazard US
Short Duration
Fixed Income
Portfolio | |
| | | | | | | | | |
| | $ | 13,190,299 | | | | $ | 1,536,858 | |
| | | 495,728 | | | | | — | |
| | | 13,686,027 | | | | | 1,536,858 | |
| | | | | | | | | |
| | | 1,593,022 | | | | | 238,801 | |
| | | 100,412 | | | | | 39,257 | |
| | | 76,823 | | | | | 48,669 | |
| | | 60,287 | | | | | 35,456 | |
| | | 37,596 | | | | | 43,653 | |
| | | 21,772 | | | | | 12,255 | |
| | | 20,718 | | | | | 10,413 | |
| | | 13,566 | | | | | 15,272 | |
| | | 9,442 | | | | | 74 | |
| | | 16,765 | | | | | 8,024 | |
| | | 1,950,403 | | | | | 451,874 | |
| | | (345,334 | ) | | | | (68,881 | ) |
| | | 1,605,069 | | | | | 382,993 | |
| | | 12,080,958 | | | | | 1,153,865 | |
| | | | | | | | | |
| | | (1,161,985 | ) | | | | 720,754 | |
| | | — | | | | | — | |
| | | — | | | | | — | |
| | | — | | | | | — | |
| | | (1,161,985 | ) | | | | 720,754 | |
| | | | | | | | | |
| | | 2,196,558 | | | | | 455,774 | |
| | | — | | | | | — | |
| | | — | | | | | — | |
| | | — | | | | | — | |
| | | 2,196,558 | | | | | 455,774 | |
| | | 1,034,573 | | | | | 1,176,528 | |
| | | | | | | | | |
| | $ | 13,115,531 | | | | $ | 2,330,393 | |
| | $ | — | | | | $ | — | |
| | $ | — | | | | $ | — | |
| | | | | | | | | |
| | $ | — | | | | $ | — | |
| | $ | — | | | | $ | — | |
Annual Report 73
The Lazard Funds, Inc. Statements of Changes in Net Assets
| | | Lazard
Emerging Markets Debt Portfolio | |
| | | Year Ended
December 31,
2020 | | | Year Ended
December 31,
2019 | |
| | | | | | | | | | | |
| Increase (Decrease) in Net Assets | | | | | | | | | | |
| | | | | | | | | | | |
| Operations | | | | | | | | | | |
| Net investment income (loss) | | | $ | 1,721,818 | | | | $ | 7,816,357 | |
| Net realized gain (loss) | | | | (3,495,212 | ) | | | | (1,235,720 | ) |
| Net change in unrealized appreciation (depreciation) | | | | (1,397,976 | ) | | | | 19,422,686 | |
| Net increase (decrease) in net assets resulting from operations | | | | (3,171,370 | ) | | | | 26,003,323 | |
| Distributions to shareholders (Note 2(e)) | | | | | | | | | | |
| Net investment income and net realized gains | | | | | | | | | | |
| Institutional Shares | | | | — | | | | | (2,820,563 | ) |
| Open Shares | | | | — | | | | | (15,060 | ) |
| R6 Shares | | | | — | | | | | (1,054,209 | ) |
| Return of capital | | | | | | | | | | |
| Institutional Shares | | | | (1,538,228 | ) | | | | (2,828,484 | ) |
| Open Shares | | | | (14,630 | ) | | | | (15,103 | ) |
| R6 Shares | | | | (41 | ) | | | | (1,057,170 | ) |
| Net decrease in net assets resulting from distributions | | | | (1,552,899 | ) | | | | (7,790,589 | ) |
| Capital stock transactions | | | | | | | | | | |
| Net proceeds from sales | | | | | | | | | | |
| Institutional Shares | | | | 6,071,916 | | | | | 5,519,820 | |
| Open Shares | | | | 138,222 | | | | | 25,565 | |
| R6 Shares | | | | — | | | | | 3,000,000 | |
| Net proceeds from reinvestment of distributions | | | | | | | | | | |
| Institutional Shares | | | | 1,412,389 | | | | | 5,597,352 | |
| Open Shares | | | | 12,838 | | | | | 27,508 | |
| R6 Shares | | | | 41 | | | | | 1,895,822 | |
| Cost of shares redeemed | | | | | | | | | | |
| Institutional Shares | | | | (71,755,710 | ) | | | | (74,178,361 | ) |
| Open Shares | | | | (268,240 | ) | | | | (249,403 | ) |
| R6 Shares | | | | — | | | | | (112,096,412 | ) |
| Net increase (decrease) in net assets from capital stock transactions | | | | (64,388,544 | ) | | | | (170,458,109 | ) |
| Total increase (decrease) in net assets | | | | (69,112,813 | ) | | | | (152,245,375 | ) |
| Net assets at beginning of period | | | | 91,391,467 | | | | | 243,636,842 | |
| Net assets at end of period | | | $ | 22,278,654 | | | | $ | 91,391,467 | |
The accompanying notes are an integral part of these financial statements.
74 Annual Report
| Lazard
Global Fixed Income Portfolio | | | Lazard
US Corporate Income Portfolio | |
| | Year Ended
December 31,
2020 | | | Year Ended
December 31,
2019 | | | Year Ended
December 31,
2020 | | | Year Ended
December 31,
2019 | |
| | | | | | | | | | | | | | | | | | | |
| | $ | 126,368 | | | | $ | 129,365 | | | | $ | 12,080,958 | | | | $ | 13,384,169 | |
| | | 323,617 | | | | | (26,320 | ) | | | | (1,161,985 | ) | | | | (1,270,563 | ) |
| | | 430,612 | | | | | 311,848 | | | | | 2,196,558 | | | | | 25,490,941 | |
| | | | | | | | | | | | | | | | | | | |
| | | 880,597 | | | | | 414,893 | | | | | 13,115,531 | | | | | 37,604,547 | |
| | | | | | | | | | | | | | | | | | | |
| | | (309,020 | ) | | | | (41,983 | ) | | | | (12,087,050 | ) | | | | (13,329,897 | ) |
| | | (1,683 | ) | | | | (258 | ) | | | | (150,720 | ) | | | | (164,448 | ) |
| | | — | | | | | — | | | | | (47 | ) | | | | (50 | ) |
| | | | | | | | | | | | | | | | | | | |
| | | — | | | | | (86,802 | ) | | | | — | | | | | — | |
| | | — | | | | | (534 | ) | | | | — | | | | | — | |
| | | — | | | | | — | | | | | — | | | | | — | |
| | | | | | | | | | | | | | | | | | | |
| | | (310,703 | ) | | | | (129,577 | ) | | | | (12,237,817 | ) | | | | (13,494,395 | ) |
| | | | | | | | | | | | | | | | | | | |
| | | 5,232,553 | | | | | 1,731,974 | | | | | 45,657,501 | | | | | 43,405,036 | |
| | | 6,239 | | | | | 28,292 | | | | | 1,472,978 | | | | | 793,277 | |
| | | — | | | | | — | | | | | — | | | | | — | |
| | | | | | | | | | | | | | | | | | | |
| | | 308,584 | | | | | 128,783 | | | | | 11,769,610 | | | | | 12,992,902 | |
| | | 1,683 | | | | | 792 | | | | | 115,990 | | | | | 123,455 | |
| | | — | | | | | — | | | | | 47 | | | | | 50 | |
| | | | | | | | | | | | | | | | | | | |
| | | (3,065,810 | ) | | | | (1,183,895 | ) | | | | (56,900,578 | ) | | | | (91,253,438 | ) |
| | | (21,740 | ) | | | | (4,575 | ) | | | | (2,013,457 | ) | | | | (1,381,443 | ) |
| | | — | | | | | — | | | | | — | | | | | — | |
| | | | | | | | | | | | | | | | | | | |
| | | 2,461,509 | | | | | 701,371 | | | | | 102,091 | | | | | (35,320,161 | ) |
| | | 3,031,403 | | | | | 986,687 | | | | | 979,805 | | | | | (11,210,009 | ) |
| | | 6,514,760 | | | | | 5,528,073 | | | | | 301,389,786 | | | | | 312,599,795 | |
| | $ | 9,546,163 | | | | $ | 6,514,760 | | | | $ | 302,369,591 | | | | $ | 301,389,786 | |
Annual Report 75
| | | Lazard
Emerging Markets Debt Portfolio | |
| | | Year Ended
December 31,
2020 | | | Year Ended
December 31,
2019 | |
| | | | | | | | | | | |
| Shares issued and redeemed | | | | | | | | | | |
| | | | | | | | | | | |
| Institutional Shares | | | | | | | | | | |
| Shares outstanding at beginning of period | | | | 5,641,531 | * | | | | 9,714,050 | * |
| Shares sold | | | | 427,424 | * | | | | 354,428 | * |
| Shares issued to shareholders from reinvestment of distributions | | | | 94,410 | * | | | | 358,899 | * |
| Shares redeemed | | | | (4,799,024 | )* | | | | (4,785,846 | )* |
| Net increase (decrease) | | | | (4,277,190 | )* | | | | (4,072,519 | )* |
| Shares outstanding at end of period | | | | 1,364,341 | | | | | 5,641,531 | * |
| Open Shares | | | | | | | | | | |
| Shares outstanding at beginning of period | | | | 32,702 | * | | | | 45,074 | * |
| Shares sold | | | | 9,412 | * | | | | 1,632 | * |
| Shares issued to shareholders from reinvestment of distributions | | | | 859 | * | | | | 1,747 | * |
| Shares redeemed | | | | (18,449 | )* | | | | (15,751 | )* |
| Net increase (decrease) | | | | (8,178 | )* | | | | (12,372 | )* |
| Shares outstanding at end of period | | | | 24,524 | | | | | 32,702 | * |
| R6 Shares | | | | | | | | | | |
| Shares outstanding at beginning of period | | | | 69 | * | | | | 6,341,794 | * |
| Shares sold | | | | — | * | | | | 190,114 | * |
| Shares issued to shareholders from reinvestment of distributions | | | | 2 | * | | | | 114,318 | * |
| Shares redeemed | | | | — | * | | | | (6,646,157 | )* |
| Net increase (decrease) | | | | 2 | * | | | | (6,341,725 | )* |
| Shares outstanding at end of period | | | | 71 | | | | | 69 | * |
| * | Shares and share transactions of Lazard Emerging Markets Debt Portfolio were adjusted to reflect a 1:2 reverse share split and of Lazard US Corporate Income were adjusted to reflect a 1:4 reverse share split, effective November 17, 2020. |
The accompanying notes are an integral part of these financial statements.
76 Annual Report
| | Lazard
Global Fixed Income Portfolio | | | Lazard
US Corporate Income Portfolio | |
| | Year Ended
December 31,
2020 | | | Year Ended
December 31,
2019 | | | Year Ended
December 31,
2020 | | | Year Ended
December 31,
2019 | |
| | | | | | | | | | | | | | | | | | | |
| | | 710,971 | | | | | 635,449 | | | | | 15,103,284 | * | | | | 16,959,746 | * |
| | | 577,637 | | | | | 194,459 | | | | | 2,383,359 | * | | | | 2,259,754 | * |
| | | | | | | | | | | | | | | | | | | |
| | | 32,641 | | | | | 14,404 | | | | | 617,982 | * | | | | 671,838 | * |
| | | (331,456 | ) | | | | (133,341 | ) | | | | (3,024,179 | )* | | | | (4,788,054 | )* |
| | | 278,822 | | | | | 75,522 | | | | | (22,838 | )* | | | | (1,856,462 | )* |
| | | 989,793 | | | | | 710,971 | | | | | 15,080,446 | | | | | 15,103,284 | * |
| | | | | | | | | | | | | | | | | | | |
| | | 6,518 | | | | | 3,789 | | | | | 210,905 | * | | | | 236,187 | * |
| | | 684 | | | | | 3,164 | | | | | 75,398 | * | | | | 40,753 | * |
| | | | | | | | | | | | | | | | | | | |
| | | 178 | | | | | 88 | | | | | 6,070 | * | | | | 6,349 | * |
| | | (2,348 | ) | | | | (523 | ) | | | | (104,756 | )* | | | | (72,384 | )* |
| | | (1,486 | ) | | | | 2,729 | | | | | (23,288 | )* | | | | (25,282 | )* |
| | | 5,032 | | | | | 6,518 | | | | | 187,617 | | | | | 210,905 | * |
| | | | | | | | | | | | | | | | | | | |
| | | — | | | | | — | | | | | 58 | * | | | | 55 | * |
| | | — | | | | | — | | | | | — | * | | | | — | * |
| | | | | | | | | | | | | | | | | | | |
| | | — | | | | | — | | | | | 3 | * | | | | 3 | *– |
| | | — | | | | | — | | | | | — | * | | | | — | * |
| | | — | | | | | — | | | | | 3 | * | | | | 3 | * |
| | | — | | | | | — | | | | | 61 | | | | | 58 | * |
Annual Report 77
| | | Lazard US Short
Duration Fixed Income Portfolio | |
| | | Year Ended
December 31,
2020 | | | Year Ended
December 31,
2019 | |
| | | | | | | | | | | |
| Increase in Net Assets | | | | | | | | | | |
| | | | | | | | | | | |
| Operations | | | | | | | | | | |
| Net investment income (loss) | | | $ | 1,153,865 | | | | $ | 2,236,971 | |
| Net realized gain (loss) | | | | 720,754 | | | | | 357,354 | |
| Net change in unrealized appreciation (depreciation) | | | | 455,774 | | | | | 397,651 | |
| Net increase (decrease) in net assets resulting from operations | | | | 2,330,393 | | | | | 2,991,976 | |
| Distributions to shareholders (Note 2(e)) | | | | | | | | | | |
| Net investment income and net realized gains | | | | | | | | | | |
| Institutional Shares | | | | (1,153,515 | ) | | | | (2,093,618 | ) |
| Open Shares | | | | (282 | ) | | | | (356 | ) |
| Return of capital | | | | | | | | | | |
| Institutional Shares | | | | — | | | | | (144,024 | ) |
| Open Shares | | | | — | | | | | (25 | ) |
| Net decrease in net assets resulting from distributions | | | | (1,153,797 | ) | | | | (2,238,023 | ) |
| Capital stock transactions | | | | | | | | | | |
| Net proceeds from sales | | | | | | | | | | |
| Institutional Shares | | | | 25,806,667 | | | | | 10,221,674 | |
| Open Shares | | | | 56,978 | | | | | 71 | |
| Net proceeds from reinvestment of distributions | | | | | | | | | | |
| Institutional Shares | | | | 1,072,523 | | | | | 2,113,226 | |
| Open Shares | | | | 273 | | | | | 381 | |
| Cost of shares redeemed | | | | | | | | | | |
| Institutional Shares | | | | (36,405,739 | ) | | | | (33,268,726 | ) |
| Open Shares | | | | (43,603 | ) | | | | (21,871 | ) |
| Net increase (decrease) in net assets from capital stock transactions | | | | (9,512,901 | ) | | | | (20,955,245 | ) |
| Total increase (decrease) in net assets | | | | (8,336,305 | ) | | | | (20,201,292 | ) |
| Net assets at beginning of period | | | | 96,111,213 | | | | | 116,312,505 | |
| Net assets at end of period | | | $ | 87,774,908 | | | | $ | 96,111,213 | |
The accompanying notes are an integral part of these financial statements.
78 Annual Report
| | | Lazard US Short
Duration Fixed Income Portfolio | |
| | | Year Ended
December 31,
2020 | | | Year Ended
December 31,
2019 | |
| | | | | | | | | | | |
| Shares issued and redeemed | | | | | | | | | | |
| | | | | | | | | | | |
| Institutional Shares | | | | | | | | | | |
| Shares outstanding at beginning of period | | | | 9,832,361 | | | | | 11,984,211 | |
| Shares sold | | | | 2,607,117 | | | | | 1,048,374 | |
| Shares issued to shareholders from reinvestment of distributions | | | | 108,370 | | | | | 216,771 | |
| Shares redeemed | | | | (3,680,112 | ) | | | | (3,416,995 | ) |
| Net increase (decrease) | | | | (964,625 | ) | | | | (2,151,850 | ) |
| Shares outstanding at end of period | | | | 8,867,736 | | | | | 9,832,361 | |
| Open Shares | | | | | | | | | | |
| Shares outstanding at beginning of period | | | | 1,587 | | | | | 3,789 | |
| Shares sold | | | | 5,762 | | | | | 7 | |
| Shares issued to shareholders from reinvestment of distributions | | | | 28 | | | | | 39 | |
| Shares redeemed | | | | (4,413 | ) | | | | (2,248 | ) |
| Net increase (decrease) | | | | 1,377 | | | | | (2,202 | ) |
| Shares outstanding at end of period | | | | 2,964 | | | | | 1,587 | |
Annual Report 79
The Lazard Funds, Inc. Financial Highlights
LAZARD EMERGING MARKETS DEBT PORTFOLIO
Selected data for a
share of capital stock
outstanding throughout | | Year Ended | |
| each period | | 12/31/20 | * | | 12/31/19 | * | | 12/31/18 | * | | 12/31/17 | * | | 12/31/16 | * | |
| Institutional Shares | | | | | | | | | | | | | | | | | | | | | |
| Net asset value, beginning of period | | $ | 16.10 | | | $ | 14.72 | | | $ | 16.86 | | | $ | 15.80 | | | $ | 15.42 | | |
| Income (Loss) from investment operations: | | | | | | | | | | | | | | | | | | | | | |
| Net investment income (loss) (a) | | | 0.64 | | | | 0.80 | | | | 0.92 | | | | 0.92 | | | | 0.96 | ^ | |
| Net realized and unrealized gain (loss) | | | (0.18 | ) | | | 1.36 | | | | (2.14 | ) | | | 1.06 | | | | 0.38 | | |
| Total from investment operations | | | 0.46 | | | | 2.16 | | | | (1.22 | ) | | | 1.98 | | | | 1.34 | | |
| Less distributions from: | | | | | | | | | | | | | | | | | | | | | |
| Net investment income | | | — | | | | (0.38 | ) | | | (0.44 | ) | | | (0.86 | ) | | | (0.38 | ) | |
| Return of capital | | | (0.52 | ) | | | (0.40 | ) | | | (0.48 | ) | | | (0.06 | ) | | | (0.58 | ) | |
| Total distributions | | | (0.52 | ) | | | (0.78 | ) | | | (0.92 | ) | | | (0.92 | ) | | | (0.96 | ) | |
| Redemption fees | | | — | | | | — | | | | — | | | | — | | | | — | (b) | |
| Net asset value, end of period | | $ | 16.04 | | | $ | 16.10 | | | $ | 14.72 | | | $ | 16.86 | | | $ | 15.80 | | |
| Total Return (c) | | | 3.19 | % | | | 15.03 | % | | | –7.45 | % | | | 12.69 | % | | | 8.64 | %^ | |
| | | | | | | | | | | | | | | | | | | | | | |
| Ratios and Supplemental Data: | | | | | | | | | | | | | | | | | | | | | |
| Net assets, end of period (in thousands) | | $ | 21,880 | | | $ | 90,858 | | | $ | 143,015 | | | $ | 280,808 | | | $ | 240,833 | | |
| Ratios to average net assets: | | | | | | | | | | | | | | | | | | | | | |
| Net expenses | | | 0.92 | % | | | 0.98 | % | | | 0.93 | % | | | 0.93 | % | | | 0.96 | %^ | |
| Gross expenses | | | 1.57 | % | | | 1.08 | % | | | 0.93 | % | | | 0.93 | % | | | 0.96 | % | |
| Net investment income (loss) | | | 4.24 | % | | | 5.15 | % | | | 5.78 | % | | | 5.52 | % | | | 5.90 | %^ | |
| Portfolio turnover rate | | | 133 | % | | | 106 | % | | | 97 | % | | | 88 | % | | | 118 | % | |
The accompanying notes are an integral part of these financial statements.
80 Annual Report
Selected data for a
share of capital stock
outstanding throughout | | Year Ended | |
| each period | | 12/31/20 | * | | 12/31/19 | * | | 12/31/18 | * | | 12/31/17 | * | | 12/31/16 | * | |
| Open Shares | | | | | | | | | | | | | | | | | | | | | |
| Net asset value, beginning of period | | $ | 16.26 | | | $ | 14.86 | | | $ | 17.00 | | | $ | 15.96 | | | $ | 15.58 | | |
| Income (Loss) from investment operations: | | | | | | | | | | | | | | | | | | | | | |
| Net investment income (loss) (a) | | | 0.61 | | | | 0.78 | | | | 0.94 | | | | 0.88 | | | | 0.92 | ^ | |
| Net realized and unrealized gain (loss) | | | (0.15 | ) | | | 1.38 | | | | (2.20 | ) | | | 1.02 | | | | 0.38 | | |
| Total from investment operations | | | 0.46 | | | | 2.16 | | | | (1.26 | ) | | | 1.90 | | | | 1.30 | | |
| Less distributions from: | | | | | | | | | | | | | | | | | | | | | |
| Net investment income | | | — | | | | (0.38 | ) | | | (0.40 | ) | | | (0.80 | ) | | | (0.36 | ) | |
| Return of capital | | | (0.51 | ) | | | (0.38 | ) | | | (0.48 | ) | | | (0.06 | ) | | | (0.56 | ) | |
| Total distributions | | | (0.51 | ) | | | (0.76 | ) | | | (0.88 | ) | | | (0.86 | ) | | | (0.92 | ) | |
| Redemption fees | | | — | | | | — | | | | — | | | | — | | | | — | | |
| Net asset value, end of period | | $ | 16.21 | | | $ | 16.26 | | | $ | 14.86 | | | $ | 17.00 | | | $ | 15.96 | | |
| Total Return (c) | | | 3.11 | % | | | 14.85 | % | | | –7.59 | % | | | 12.16 | % | | | 8.27 | %^ | |
| | | | | | | | | | | | | | | | | | | | | | |
| Ratios and Supplemental Data: | | | | | | | | | | | | | | | | | | | | | |
| Net assets, end of period (in thousands) | | $ | 397 | | | $ | 532 | | | $ | 670 | | | $ | 6,520 | | | $ | 6,801 | | |
| Ratios to average net assets: | | | | | | | | | | | | | | | | | | | | | |
| Net expenses | | | 1.02 | % | | | 1.18 | % | | | 1.20 | % | | | 1.22 | % | | | 1.28 | %^ | |
| Gross expenses | | | 2.59 | % | | | 2.91 | % | | | 1.62 | % | | | 1.36 | % | | | 1.40 | % | |
| Net investment income (loss) | | | 4.05 | % | | | 4.91 | % | | | 5.49 | % | | | 5.21 | % | | | 5.59 | %^ | |
| Portfolio turnover rate | | | 133 | % | | | 106 | % | | | 97 | % | | | 88 | % | | | 118 | % | |
The accompanying notes are an integral part of these financial statements.
Annual Report 81
Selected data for a
share of capital stock
outstanding throughout | | Year Ended | | For the Period
7/28/16# to | |
| each period | | 12/31/20 | * | | 12/31/19 | * | | 12/31/18 | * | | 12/31/17 | * | | | 12/31/16 | |
| R6 Shares | | | | | | | | | | | | | | | | | | | | | |
| Net asset value, beginning of period | | $ | 17.28 | | | $ | 15.76 | | | $ | 17.76 | | | $ | 15.80 | | | | $ | 16.68 | |
| Income (Loss) from investment operations: | | | | | | | | | | | | | | | | | | | | | |
| Net investment income (loss) (a) | | | 0.41 | | | | 0.86 | | | | 0.96 | | | | 0.90 | | | | | 0.40 | ^ |
| Net realized and unrealized gain (loss) | | | 0.09 | | | | 1.50 | | | | (2.24 | ) | | | 1.08 | | | | | (0.88 | ) |
| Total from investment operations | | | 0.50 | | | | 2.36 | | | | (1.28 | ) | | | 1.98 | | | | | (0.48 | ) |
| Less distributions from: | | | | | | | | | | | | | | | | | | | | | |
| Net investment income | | | — | | | | (0.40 | ) | | | (0.22 | ) | | | (0.02 | ) | | | | (0.16 | ) |
| Return of capital | | | (0.59 | ) | | | (0.44 | ) | | | (0.50 | ) | | | — | (b) | | | | (0.24 | ) |
| Total distributions | | | (0.59 | ) | | | (0.84 | ) | | | (0.72 | ) | | | (0.02 | ) | | | | (0.40 | ) |
| Net asset value, end of period | | $ | 17.19 | | | $ | 17.28 | | | $ | 15.76 | | | $ | 17.76 | | | | $ | 15.80 | |
| Total Return (c) | | | 3.30 | % | | | 15.22 | % | | | –7.24 | % | | | 12.61 | % | | | | –2.93 | %^ |
| Ratios and Supplemental Data: | | | | | | | | | | | | | | | | | | | | | |
| Net assets, end of period (in thousands) | | $ | 1 | | | $ | 1 | | | $ | 99,952 | | | $ | 1 | | | | $ | 1,145 | |
| Ratios to average net assets (d): | | | | | | | | | | | | | | | | | | | | | |
| Net expenses | | | 0.86 | % | | | 0.93 | % | | | 0.90 | % | | | 0.90 | % | | | | 0.90 | %^ |
| Gross expenses | | | 265.72 | % | | | 1.09 | % | | | 0.94 | % | | | 43.88 | % | | | | 2.21 | % |
| Net investment income (loss) | | | 2.60 | % | | | 5.18 | % | | | 5.97 | % | | | 5.71 | % | | | | 5.73 | %^ |
| Portfolio turnover rate | | | 133 | % | | | 106 | % | | | 97 | % | | | 88 | % | | | | 118 | % |
| * | On November 17, 2020, the Portfolio effected a 1:2 reverse share split. All per share data prior to November 17, 2020 has been adjusted to reflect the reverse share split. |
| ^ | Refer to Note 3 in the Notes to Financial Statements for discussion of prior period custodian out-of-pocket expenses that were reimbursed to the Portfolio in the period. The amount of the reimbursement was less than $0.005 per share. For Institutional Shares, there was a 0.14% impact on the total return and the impact on net expenses and net investment income (loss) ratios of the Portfolio was less than 0.005%. For Open and R6 Shares, there was no impact on the total return and the net expenses and net investment income (loss) ratios of the Portfolio would be unchanged as the change to the period custodian fees was offset against the period expense waivers/reimbursements with no impact to net expenses or net investment income (loss). |
| # | The inception date for the R6 Shares was July 28, 2016. |
| (a) | Net investment income (loss) has been computed using the average shares method. |
| (b) | Amount is less than $0.01 per share. |
| (c) | Total returns reflect reinvestment of all dividends and distributions, if any. Certain expenses of the Portfolio may have been waived or reimbursed by the Investment Manager, State Street or DST; without such waiver/reimbursement of expenses, the Portfolio’s returns would have been lower. Returns for a period of less than one year are not annualized. |
| (d) | Annualized for a period of less than one year except for non-recurring expenses. |
The accompanying notes are an integral part of these financial statements.
82 Annual Report
LAZARD GLOBAL FIXED INCOME PORTFOLIO
Selected data for a
share of capital stock
outstanding throughout | | Year Ended | |
| each period | | 12/31/20 | | | 12/31/19 | | | 12/31/18 | | | 12/31/17 | | | 12/31/16 | | |
| Institutional Shares | | | | | | | | | | | | | | | | | | | | | |
| Net asset value, beginning of period | | $ | 9.08 | | | $ | 8.65 | | | $ | 9.04 | | | $ | 8.57 | | | $ | 8.74 | | |
| Income (Loss) from investment operations: | | | | | | | | | | | | | | | | | | | | | |
| Net investment income (loss) (a) | | | 0.14 | | | | 0.19 | | | | 0.20 | | | | 0.20 | | | | 0.20 | | |
| Net realized and unrealized gain (loss) | | | 0.72 | | | | 0.43 | | | | (0.38 | ) | | | 0.47 | | | | (0.17 | ) | |
| Total from investment operations | | | 0.86 | | | | 0.62 | | | | (0.18 | ) | | | 0.67 | | | | 0.03 | | |
| Less distributions from: | | | | | | | | | | | | | | | | | | | | | |
| Net investment income | | | (0.15 | ) | | | (0.06 | ) | | | (0.10 | ) | | | — | | | | (0.12 | ) | |
| Net realized gains | | | (0.19 | ) | | | — | | | | — | | | | — | | | | — | | |
| Return of capital | | | — | | | | (0.13 | ) | | | (0.11 | ) | | | (0.20 | ) | | | (0.08 | ) | |
| Total distributions | | | (0.34 | ) | | | (0.19 | ) | | | (0.21 | ) | | | (0.20 | ) | | | (0.20 | ) | |
| Net asset value, end of period | | $ | 9.60 | | | $ | 9.08 | | | $ | 8.65 | | | $ | 9.04 | | | $ | 8.57 | | |
| Total Return (b) | | | 9.51 | % | | | 7.25 | % | | | –2.06 | % | | | 7.87 | % | | | 0.22 | % | |
| | | | | | | | | | | | | | | | | | | | | | |
| Ratios and Supplemental Data: | | | | | | | | | | | | | | | | | | | | | |
| Net assets, end of period (in thousands) | | $ | 9,498 | | | $ | 6,456 | | | $ | 5,495 | | | $ | 4,705 | | | $ | 4,266 | | |
| Ratios to average net assets: | | | | | | | | | | | | | | | | | | | | | |
| Net expenses | | | 0.70 | % | | | 0.70 | % | | | 0.70 | % | | | 0.72 | % | | | 0.75 | % | |
| Gross expenses | | | 2.73 | % | | | 3.51 | % | | | 3.61 | % | | | 4.39 | % | | | 4.70 | % | |
| Net investment income (loss) | | | 1.53 | % | | | 2.14 | % | | | 2.33 | % | | | 2.23 | % | | | 2.18 | % | |
| Portfolio turnover rate | | | 65 | % | | | 65 | % | | | 60 | % | | | 42 | % | | | 47 | % | |
The accompanying notes are an integral part of these financial statements.
Annual Report 83
Selected data for a
share of capital stock
outstanding throughout | | Year Ended | |
| each period | | 12/31/20 | | | 12/31/19 | | | 12/31/18 | | | 12/31/17 | | | 12/31/16 | | |
| Open Shares | | | | | | | | | | | | | | | | | | | | | |
| Net asset value, beginning of period | | $ | 9.08 | | | $ | 8.65 | | | $ | 9.04 | | | $ | 8.57 | | | $ | 8.74 | | |
| Income (Loss) from investment operations: | | | | | | | | | | | | | | | | | | | | | |
| Net investment income (loss) (a) | | | 0.12 | | | | 0.17 | | | | 0.18 | | | | 0.17 | | | | 0.17 | | |
| Net realized and unrealized gain (loss) | | | 0.71 | | | | 0.43 | | | | (0.39 | ) | | | 0.47 | | | | (0.17 | ) | |
| Total from investment operations | | | 0.83 | | | | 0.60 | | | | (0.21 | ) | | | 0.64 | | | | — | (c) | |
| Less distributions from: | | | | | | | | | | | | | | | | | | | | | |
| Net investment income | | | (0.12 | ) | | | (0.06 | ) | | | (0.08 | ) | | | — | | | | (0.10 | ) | |
| Net realized gains | | | (0.19 | ) | | | — | | | | — | | | | — | | | | — | | |
| Return of capital | | | — | | | | (0.11 | ) | | | (0.10 | ) | | | (0.17 | ) | | | (0.07 | ) | |
| Total distributions | | | (0.31 | ) | | | (0.17 | ) | | | (0.18 | ) | | | (0.17 | ) | | | (0.17 | ) | |
| Net asset value, end of period | | $ | 9.60 | | | $ | 9.08 | | | $ | 8.65 | | | $ | 9.04 | | | $ | 8.57 | | |
| Total Return (b) | | | 9.23 | % | | | 6.98 | % | | | –2.31 | % | | | 7.55 | % | | | –0.07 | % | |
| | | | | | | | | | | | | | | | | | | | | | |
| Ratios and Supplemental Data: | | | | | | | | | | | | | | | | | | | | | |
| Net assets, end of period (in thousands) | | $ | 48 | | | $ | 59 | | | $ | 33 | | | $ | 34 | | | $ | 34 | | |
| Ratios to average net assets: | | | | | | | | | | | | | | | | | | | | | |
| Net expenses | | | 0.95 | % | | | 0.95 | % | | | 0.98 | % | | | 1.02 | % | | | 1.05 | % | |
| Gross expenses | | | 10.32 | % | | | 27.52 | % | | | 38.42 | % | | | 42.88 | % | | | 27.52 | % | |
| Net investment income (loss) | | | 1.31 | % | | | 1.88 | % | | | 2.08 | % | | | 1.95 | % | | | 1.88 | % | |
| Portfolio turnover rate | | | 65 | % | | | 65 | % | | | 60 | % | | | 42 | % | | | 47 | % | |
| Portfolio turnover rate: | | | | | | | | | | | | | | | | | | | | | |
| (a) | Net investment income (loss) has been computed using the average shares method. |
| (b) | Total returns reflect reinvestment of all dividends and distributions, if any. Certain expenses of the Portfolio may have been waived or reimbursed by the Investment Manager, State Street or DST; without such waiver/reimbursement of expenses, the Portfolio’s returns would have been lower. |
| (c) | Amount is less than $0.01 per share. |
The accompanying notes are an integral part of these financial statements.
84 Annual Report
LAZARD US CORPORATE INCOME PORTFOLIO
Selected data for a
share of capital stock
outstanding throughout | | Year Ended | |
| each period | | 12/31/20 | * | | 12/31/19 | * | | 12/31/18 | * | | 12/31/17 | * | | 12/31/16 | * | |
| Institutional Shares | | | | | | | | | | | | | | | | | | | | | |
| Net asset value, beginning of period | | $ | 19.68 | | | $ | 18.16 | | | $ | 19.56 | | | $ | 19.48 | | | $ | 18.56 | | |
| Income (Loss) from investment operations: | | | | | | | | | | | | | | | | | | | | | |
| Net investment income (loss) (a) | | | 0.80 | | | | 0.88 | | | | 0.88 | | | | 0.88 | | | | 0.92 | | |
| Net realized and unrealized gain (loss) | | | 0.13 | | | | 1.52 | | | | (1.40 | ) | | | 0.08 | | | | 0.92 | | |
| Total from investment operations | | | 0.93 | | | | 2.40 | | | | (0.52 | ) | | | 0.96 | | | | 1.84 | | |
| Less distributions from: | | | | | | | | | | | | | | | | | | | | | |
| Net investment income | | | (0.81 | ) | | | (0.88 | ) | | | (0.88 | ) | | | (0.88 | ) | | | (0.92 | ) | |
| Total distributions | | | (0.81 | ) | | | (0.88 | ) | | | (0.88 | ) | | | (0.88 | ) | | | (0.92 | ) | |
| Redemption fees | | | — | | | | — | | | | — | | | | — | | | | — | (b) | |
| Net asset value, end of period | | $ | 19.80 | | | $ | 19.68 | | | $ | 18.16 | | | $ | 19.56 | | | $ | 19.48 | | |
| Total Return (c) | | | 4.96 | % | | | 13.34 | % | | | –2.73 | % | | | 5.09 | % | | | 10.09 | % | |
| | | | | | | | | | | | | | | | | | | | | | |
| Ratios and Supplemental Data: | | | | | | | | | | | | | | | | | | | | | |
| Net assets, end of period (in thousands) | | $ | 298,636 | | | $ | 297,219 | | | $ | 308,285 | | | $ | 344,508 | | | $ | 302,997 | | |
| Ratios to average net assets: | | | | | | | | | | | | | | | | | | | | | |
| Net expenses | | | 0.55 | % | | | 0.55 | % | | | 0.55 | % | | | 0.55 | % | | | 0.55 | % | |
| Gross expenses | | | 0.67 | % | | | 0.67 | % | | | 0.64 | % | | | 0.67 | % | | | 0.69 | % | |
| Net investment income (loss) | | | 4.17 | % | | | 4.47 | % | | | 4.65 | % | | | 4.57 | % | | | 4.78 | % | |
| Portfolio turnover rate | | | 26 | % | | | 21 | % | | | 16 | % | | | 21 | % | | | 14 | % | |
The accompanying notes are an integral part of these financial statements.
Annual Report 85
Selected data for a
share of capital stock
outstanding throughout | | Year Ended | |
| each period | | 12/31/20 | * | | 12/31/19 | * | | 12/31/18 | * | | 12/31/17 | * | | 12/31/16 | * | |
| Open Shares | | | | | | | | | | | | | | | | | | | | | |
| Net asset value, beginning of period | | $ | 19.76 | | | $ | 18.28 | | | $ | 19.64 | | | $ | 19.56 | | | $ | 18.64 | | |
| Income (Loss) from investment operations: | | | | | | | | | | | | | | | | | | | | | |
| Net investment income (loss) (a) | | | 0.75 | | | | 0.80 | | | | 0.84 | | | | 0.84 | | | | 0.84 | | |
| Net realized and unrealized gain (loss) | | | 0.15 | | | | 1.48 | | | | (1.36 | ) | | | 0.08 | | | | 0.96 | | |
| Total from investment operations | | | 0.90 | | | | 2.28 | | | | (0.52 | ) | | | 0.92 | | | | 1.80 | | |
| Less distributions from: | | | | | | | | | | | | | | | | | | | | | |
| Net investment income | | | (0.76 | ) | | | (0.80 | ) | | | (0.84 | ) | | | (0.84 | ) | | | (0.88 | ) | |
| Total distributions | | | (0.76 | ) | | | (0.80 | ) | | | (0.84 | ) | | | (0.84 | ) | | | (0.88 | ) | |
| Redemption fees | | | — | | | | — | | | | — | | | | — | | | | — | (b) | |
| Net asset value, end of period | | $ | 19.90 | | | $ | 19.76 | | | $ | 18.28 | | | $ | 19.64 | | | $ | 19.56 | | |
| Total Return (c) | | | 4.80 | % | | | 12.74 | % | | | –2.78 | % | | | 4.77 | % | | | 9.74 | % | |
| | | | | | | | | | | | | | | | | | | | | | |
| Ratios and Supplemental Data: | | | | | | | | | | | | | | | | | | | | | |
| Net assets, end of period (in thousands) | | $ | 3,733 | | | $ | 4,170 | | | $ | 4,314 | | | $ | 5,708 | | | $ | 7,618 | | |
| Ratios to average net assets: | | | | | | | | | | | | | | | | | | | | | |
| Net expenses | | | 0.80 | % | | | 0.83 | % | | | 0.85 | % | | | 0.85 | % | | | 0.85 | % | |
| Gross expenses | | | 1.03 | % | | | 1.19 | % | | | 1.11 | % | | | 1.13 | % | | | 1.18 | % | |
| Net investment income (loss) | | | 3.94 | % | | | 4.18 | % | | | 4.34 | % | | | 4.28 | % | | | 4.44 | % | |
| Portfolio turnover rate | | | 26 | % | | | 21 | % | | | 16 | % | | | 21 | % | | | 14 | % | |
The accompanying notes are an integral part of these financial statements.
86 Annual Report
Selected data for a
share of capital stock
outstanding throughout | | Year Ended | | For the Period 11/13/16# to | |
| each period | | 12/31/20 | * | | 12/31/19 | * | | 12/31/18 | * | | 12/31/17 | * | | | 12/31/16 | |
| R6 Shares | | | | | | | | | | | | | | | | | | | | | |
| Net asset value, beginning of period | | $ | 19.76 | | | $ | 18.68 | | | $ | 19.56 | | | $ | 19.48 | | | | $ | 19.36 | |
| Income (Loss) from investment operations: | | | | | | | | | | | | | | | | | | | | | |
| Net investment income (loss) (a) | | | 0.81 | | | | 0.92 | | | | 0.92 | | | | 0.88 | | | | | 0.16 | |
| Net realized and unrealized gain (loss) | | | 0.11 | | | | 1.04 | | | | (1.40 | ) | | | 0.08 | | | | | 0.12 | |
| Total from investment operations | | | 0.92 | | | | 1.96 | | | | (0.48 | ) | | | 0.96 | | | | | 0.28 | |
| Less distributions from: | | | | | | | | | | | | | | | | | | | | | |
| Net investment income | | | (0.80 | ) | | | (0.88 | ) | | | (0.40 | ) | | | (0.88 | ) | | | | (0.16 | ) |
| Total distributions | | | (0.80 | ) | | | (0.88 | ) | | | (0.40 | ) | | | (0.88 | ) | | | | (0.16 | ) |
| Net asset value, end of period | | $ | 19.88 | | | $ | 19.76 | | | $ | 18.68 | | | $ | 19.56 | | | | $ | 19.48 | |
| Total Return (c) | | | 4.89 | % | | | 10.67 | % | | | –2.43 | %(d) | | | 5.09 | % | | | | 1.37 | % |
| | | | | | | | | | | | | | | | | | | | | | |
| Ratios and Supplemental Data: | | | | | | | | | | | | | | | | | | | | | |
| Net assets, end of period (in thousands) | | $ | 1 | | | $ | 1 | | | $ | 1 | | | $ | 1,783 | | | | $ | 1,697 | |
| Ratios to average net assets(e): | | | | | | | | | | | | | | | | | | | | | |
| Net expenses | | | 0.55 | % | | | 0.55 | % | | | 0.55 | % | | | 0.55 | % | | | | 0.55 | % |
| Gross expenses | | | 256.05 | % | | | 858.55 | % | | | 4.62 | % | | | 1.69 | % | | | | 1.73 | % |
| Net investment income (loss) | | | 4.22 | % | | | 4.55 | % | | | 4.61 | % | | | 4.58 | % | | | | 4.71 | % |
| Portfolio turnover rate | | | 26 | % | | | 21 | % | | | 16 | % | | | 21 | % | | | | 14 | % |
| * | On November 17, 2020, the Portfolio effected a 1:4 reverse share split. All per share data prior to November 17, 2020 has been adjusted to reflect the reverse share split. |
| # | The inception date for the R6 Shares was November 3, 2016. |
| (a) | Net investment income (loss) has been computed using the average shares method. |
| (b) | Amount is less than $0.01 per share. |
| (c) | Total returns reflect reinvestment of all dividends and distributions, if any. Certain expenses of the Portfolio may have been waived or reimbursed by the Investment Manager, State Street or DST; without such waiver/reimbursement of expenses, the Portfolio’s returns would have been lower. Returns for a period of less than one year are not annualized. |
| (d) | The Portfolio received settlement proceeds from a foreign exchange trading class action lawsuit. The proceeds from the settlement represented a realized gain and were recorded in the period received. There was a 0.62% impact on the total return of the Portfolio’s R6 Shares. |
| (e) | Annualized for a period of less than one year except for non-recurring expenses. |
The accompanying notes are an integral part of these financial statements.
Annual Report 87
LAZARD US SHORT DURATION FIXED INCOME PORTFOLIO
Selected data for a
share of capital stock
outstanding throughout | | Year Ended | |
| each period | | 12/31/20 | | | 12/31/19 | | | 12/31/18 | | | 12/31/17 | | | 12/31/16 | | |
| Institutional Shares | | | | | | | | | | | | | | | | | | | | | |
| Net asset value, beginning of period | | $ | 9.77 | | | $ | 9.70 | | | $ | 9.79 | | | $ | 9.86 | | | $ | 9.89 | | |
| Income (Loss) from investment operations: | | | | | | | | | | | | | | | | | | | | | |
| Net investment income (loss) (a) | | | 0.12 | | | | 0.21 | | | | 0.19 | | | | 0.14 | | | | 0.13 | | |
| Net realized and unrealized gain (loss) | | | 0.12 | | | | 0.07 | | | | (0.09 | ) | | | (0.07 | ) | | | (0.03 | ) | |
| Total from investment operations | | | 0.24 | | | | 0.28 | | | | 0.10 | | | | 0.07 | | | | 0.10 | | |
| Less distributions from: | | | | | | | | | | | | | | | | | | | | | |
| Net investment income | | | (0.12 | ) | | | (0.20 | ) | | | (0.17 | ) | | | (0.11 | ) | | | (0.09 | ) | |
| Return of capital | | | — | | | | (0.01 | ) | | | (0.02 | ) | | | (0.03 | ) | | | (0.04 | ) | |
| Total distributions | | | (0.12 | ) | | | (0.21 | ) | | | (0.19 | ) | | | (0.14 | ) | | | (0.13 | ) | |
| Net asset value, end of period | | $ | 9.89 | | | $ | 9.77 | | | $ | 9.70 | | | $ | 9.79 | | | $ | 9.86 | | |
| Total Return (b) | | | 2.46 | % | | | 2.93 | % | | | 1.08 | % | | | 0.72 | % | | | 1.00 | % | |
| | | | | | | | | | | | | | | | | | | | | | |
| Ratios and Supplemental Data: | | | | | | | | | | | | | | | | | | | | | |
| Net assets, end of period (in thousands) | | $ | 87,746 | | | $ | 96,096 | | | $ | 116,276 | | | $ | 100,390 | | | $ | 103,175 | | |
| Ratios to average net assets: | | | | | | | | | | | | | | | | | | | | | |
| Net expenses | | | 0.40 | % | | | 0.40 | % | | | 0.40 | % | | | 0.40 | % | | | 0.40 | % | |
| Gross expenses | | | 0.47 | % | | | 0.45 | % | | | 0.43 | % | | | 0.43 | % | | | 0.50 | % | |
| Net investment income (loss) | | | 1.21 | % | | | 2.18 | % | | | 2.00 | % | | | 1.43 | % | | | 1.30 | % | |
| Portfolio turnover rate | | | 97 | % | | | 175 | % | | | 170 | % | | | 108 | % | | | 157 | % | |
The accompanying notes are an integral part of these financial statements.
88 Annual Report
Selected data for a
share of capital stock
outstanding throughout | | Year Ended | |
| each period | | 12/31/20 | | | 12/31/19 | | | 12/31/18 | | | 12/31/17 | | | 12/31/16 | | |
| Open Shares | | | | | | | | | | | | | | | | | | | | | |
| Net asset value, beginning of period | | $ | 9.78 | | | $ | 9.71 | | | $ | 9.79 | | | $ | 9.87 | | | $ | 9.90 | | |
| Income (Loss) from investment operations: | | | | | | | | | | | | | | | | | | | | | |
| Net investment income (loss) (a) | | | 0.09 | | | | 0.19 | | | | 0.16 | | | | 0.11 | | | | 0.10 | | |
| Net realized and unrealized gain (loss) | | | 0.12 | | | | 0.06 | | | | (0.08 | ) | | | (0.08 | ) | | | (0.03 | ) | |
| Total from investment operations | | | 0.21 | | | | 0.25 | | | | 0.08 | | | | 0.03 | | | | 0.07 | | |
| Less distributions from: | | | | | | | | | | | | | | | | | | | | | |
| Net investment income | | | (0.09 | ) | | | (0.17 | ) | | | (0.14 | ) | | | (0.09 | ) | | | (0.07 | ) | |
| Return of capital | | | — | | | | (0.01 | ) | | | (0.02 | ) | | | (0.02 | ) | | | (0.03 | ) | |
| Total distributions | | | (0.09 | ) | | | (0.18 | ) | | | (0.16 | ) | | | (0.11 | ) | | | (0.10 | ) | |
| Net asset value, end of period | | $ | 9.90 | | | $ | 9.78 | | | $ | 9.71 | | | $ | 9.79 | | | $ | 9.87 | | |
| Total Return (b) | | | 2.20 | % | | | 2.64 | % | | | 0.88 | % | | | 0.32 | % | | | 0.70 | % | |
| | | | | | | | | | | | | | | | | | | | | | |
| Ratios and Supplemental Data: | | | | | | | | | | | | | | | | | | | | | |
| Net assets, end of period (in thousands) | | $ | 29 | | | $ | 16 | | | $ | 37 | | | $ | 25 | | | $ | 44 | | |
| Ratios to average net assets: | | | | | | | | | | | | | | | | | | | | | |
| Net expenses | | | 0.65 | % | | | 0.69 | % | | | 0.70 | % | | | 0.70 | % | | | 0.70 | % | |
| Gross expenses | | | 14.74 | % | | | 51.53 | % | | | 38.00 | % | | | 33.88 | % | | | 31.22 | % | |
| Net investment income (loss) | | | 0.96 | % | | | 1.91 | % | | | 1.68 | % | | | 1.13 | % | | | 1.00 | % | |
| Portfolio turnover rate | | | 97 | % | | | 175 | % | | | 170 | % | | | 108 | % | | | 157 | % | |
| (a) | Net investment income (loss) has been computed using the average shares method. |
| (b) | Total returns reflect reinvestment of all dividends and distributions, if any. Certain expenses of the Portfolio may have been waived or reimbursed by the Investment Manager, State Street or DST; without such waiver/reimbursement of expenses, the Portfolio’s returns would have been lower. |
The accompanying notes are an integral part of these financial statements.
Annual Report 89
The Lazard Funds, Inc. Notes to Financial Statements
December 31, 2020
1. Organization
The Lazard Funds, Inc. was incorporated in Maryland on May 17, 1991 and is registered under the Investment Company Act of 1940, as amended (the “1940 Act”), as an open-end management investment company. As of December 31, 2020, the Fund was comprised of thirty no-load portfolios (each referred to as a “Portfolio”). This report includes only the financial statements of the Lazard Emerging Markets Debt Portfolio (“Emerging Markets Debt”), the Lazard Global Fixed Income Portfolio (“Global Fixed Income”), the Lazard US Corporate Income Portfolio (“US Corporate Income”), and the Lazard US Short Duration Fixed Income Portfolio (“US Short Duration Fixed Income”). The financial statements of the other twenty-six Portfolios are presented separately.
The Portfolios, other than the Emerging Markets Debt Portfolio, are operated as “diversified” funds, as defined in the 1940 Act.
Each Portfolio currently offers Institutional Shares and Open Shares, and certain Portfolios offer R6 Shares. Each share class is identical except as to minimum investment requirements; eligibility requirements for R6 Shares; the services offered to, and expenses borne by, each class; and the availability of Service Payments (as defined in the Fund’s prospectus).
On November 17, 2020, the Emerging Markets Debt Portfolio and the US Corporate Income Portfolio had a 1-for-2 reverse share split and a 1-for-4 reverse share split, respectively, effective after the market close on November 17, 2020. After the reverse share split, shareholders in the Emerging Markets Debt Portfolio held one share for every two Portfolio shares previously held, and shareholders in the US Corporate Income Portfolio held one share for every four Portfolio shares previously held. The reverse share splits had no impact on the overall value of a shareholder’s investment.
2. Significant Accounting Policies
The accompanying financial statements are presented in conformity with GAAP. The Fund is an investment company and therefore applies specialized accounting guidance in accordance with Accounting Standards Codification Topic 946. The following is a
90 Annual Report
summary of significant accounting policies consistently followed by the Fund in the preparation of the financial statements:
(a) Valuation of Investments—Bonds and other fixed-income securities that are not exchange-traded are valued on the basis of prices provided by independent pricing services which are based on, among other things, trading in securities with similar characteristics, brokers’ quotations and/or a matrix system which considers such factors as other security prices, yields and maturities. Over the counter swap agreements are valued by an independent pricing service and centrally cleared swaps are valued at the last reported sale on the clearing exchange. Forward currency contracts generally are valued using quotations from an independent pricing service. Investments in money market funds are valued at the fund’s net asset value (“NAV”) per share.
Calculation of a Portfolio’s NAV may not take place contemporaneously with the determination of the prices of portfolio assets used in such calculation. Trading on certain non-US securities exchanges or markets, such as those in Europe and Asia, may ordinarily be completed before the close of business on each business day in New York (i.e., a day on which the New York Stock Exchange (the “NYSE”) is open). In addition, securities trading in a particular non-US country or countries, may not take place on all business days in New York and on which the NAV of a Portfolio is calculated.
If a significant event materially affecting the value of securities occurs between the close of the exchange or market on which the security is principally traded and the time when a Portfolio’s NAV is calculated, or when current market quotations otherwise are determined not to be readily available or reliable (including restricted or other illiquid securities such as certain derivative instruments), such securities will be valued at their fair value as determined by, or in accordance with procedures approved by, the Board of Directors (“Board”). Certain non-US securities may trade on days when a Portfolio is not open for business, thus affecting the value of the Portfolio’s assets on days when Portfolio shareholders may not be able to buy or sell Portfolio shares.
Annual Report 91
The Valuation Committee of the Investment Manager, which is subject to the oversight of the Board of Directors, may evaluate a variety of factors to determine the fair value of securities for which market quotations are determined not to be readily available or reliable. These factors include, but are not limited to, the type of security, the value of comparable securities, observations from financial institutions and relevant news events. Input from the Investment Manager’s portfolio management team also will be considered.
The effect of using fair value pricing is that the NAV of a Portfolio will reflect the affected securities’ values as determined in the judgment of the Board or its designee instead of being determined by the market. Using a fair value pricing methodology to price securities may result in a value that is different from the most recent closing price of a security and from the prices used by other investment companies to calculate their portfolios’ NAVs.
(b) Portfolio Securities Transactions and Investment Income—Portfolio securities transactions are accounted for on trade date. Realized gain (loss) on sales of investments are recorded on a specific identification basis. Interest income is accrued daily. A Portfolio amortizes premiums and accretes discounts on fixed-income securities using the effective yield method and mortgage-backed securities using the level yield method.
A Portfolio may be subject to taxes imposed by non-US countries in which it invests. Such taxes are generally based upon income earned or capital gains (realized and/or unrealized). An affected Portfolio accrues and applies such taxes to net investment income, net realized gains and net unrealized gains concurrent with the recognition of income earned or capital gains (realized and/or unrealized) from the applicable portfolio securities.
(c) Foreign Currency Translation and Forward Currency Contracts—The accounting records of the Fund are maintained in US dollars. Portfolio securities and other assets and liabilities denominated in a foreign currency are translated daily into US dollars at the prevailing rates of exchange. Purchases and sales of securities, income receipts and expense payments are translated into
92 Annual Report
US dollars at the prevailing exchange rates on the respective transaction dates.
The Portfolios do not isolate the portion of operations resulting from changes in foreign exchange rates on investments from the fluctuations arising from changes in their market prices. Such fluctuations are included in net realized and unrealized gain (loss) on investments.
A forward currency contract is an agreement between two parties to buy or sell currency at a set price on a future date. Daily fluctuations in the value of forward currency contracts are recorded as unrealized appreciation (depreciation) on forward currency contracts. When the contract is closed, the Portfolio records a realized gain (loss) equal to the difference between the value at the time it was opened and the value at the time it was closed. Net realized gain (loss) on foreign currency transactions and forward currency contracts represent net foreign currency gain (loss) from forward currency contracts, disposition of foreign currencies, currency gain (loss) realized between the trade and settlement dates on securities transactions, and the difference between the amount of interest and foreign withholding taxes recorded on the Portfolios’ accounting records and the US dollar equivalent amounts actually received or paid. Net change in unrealized appreciation (depreciation) on foreign currency translations reflects the impact of changes in exchange rates on the value of assets and liabilities, other than investments in securities, during the period.
During the year ended December 31, 2020, the Emerging Markets Debt and Global Fixed Income Portfolios traded in forward currency contracts.
(d) Swap Agreements—Interest rate swap agreements involve the exchange by a Portfolio with another party of their respective commitments to pay or receive interest with respect to the notional amount of principal. Certain forms of interest rate swap agreements may include: (i) interest rate caps, under which, in return for a premium, one party agrees to make payments to the other to the extent that interest rates exceed a specified rate, or “cap,” (ii) interest rate floors, under which, in return for a pre-
Annual Report 93
mium, one party agrees to make payments to the other to the extent that interest rates fall below a specified rate, or “floor,” (iii) interest rate collars, under which a party sells a cap and purchases a floor or vice versa in an attempt to protect itself against interest rate movements exceeding given minimum or maximum levels, (iv) callable interest rate swaps, under which the counterparty may terminate the swap transaction in whole at zero cost by a predetermined date and time prior to the maturity date, (v) spread locks, which allow the interest rate swap users to lock in the forward differential (or spread) between the interest rate swap rate and specified benchmark, or (vi) basis swaps, under which two parties can exchange variable interest rates based on different money markets. The change in value, if any, on swap agreements is recorded as unrealized appreciation (depreciation) on swap agreements in a Portfolio’s accompanying Statement of Assets and Liabilities. Once the interim payments are settled in cash, the net amount is recorded as realized gain (loss) on swap agreements in a Portfolio’s accompanying Statement of Operations, in addition to any realized gain (loss) recorded upon the termination of swap agreements.
Upon entering into a centrally cleared swap, the Portfolio is required to deposit initial margin with the broker in the form of cash or securities in an amount that varies depending on the size and risk profile of the particular swap. Securities deposited as initial margin are designated in the Portfolio of Investments and cash deposited is shown as cash collateral for swaps in the Statement of Assets and Liabilities. On these transactions, the Portfolio agrees to receive from or pay to the broker variation margin. Variation margin is recorded as unrealized appreciation (depreciation) and shown as variation margin receivable (or payable) on swaps in the Statement of Assets and Liabilities. Payments received from (paid to) the counterparty, including at termination, are recorded as realized gains (losses) in the Statement of Operations.
During the year ended December 31, 2020, the Emerging Markets Debt Portfolio traded in swap agreements.
94 Annual Report
(e) Federal Income Taxes—The Fund’s policy is for the Portfolio to qualify as a regulated investment company under Subchapter M of the Internal Revenue Code of 1986 as amended (the “Code”) and to distribute all of its taxable income, including any net realized capital gains, to shareholders. Therefore, no federal income tax provision is required.
At December 31, 2020, the following Portfolios had unused realized capital loss carryovers which, for federal income tax purposes, could be used to offset future realized capital gains with no expiration date as follows:
| Portfolio | | Short-Term | | | Long-Term | |
| | | | | | | | | |
| Emerging Markets Debt | | $ | 18,881,060 | | | $ | 19,327,250 | |
| US Corporate Income | | | 4,145,042 | | | | 4,820,238 | |
| US Short Duration Fixed Income | | | 57,364 | | | | 343,499 | |
During the year ended December 31, 2020, the following Portfolios utilized realized capital loss carryovers from previous years as follows:
| Portfolio | | Amount | |
| | | | | |
| US Short Duration Fixed Income | | $ | 734,766 | |
Under current tax law, post-October capital losses or certain late-year ordinary losses, as defined by the Code, within the taxable year may be deferred and treated as occurring on the first day of the following tax year. For the tax year ended December 31, 2020, the following Portfolios elected to defer such losses as follows:
| Portfolio | | Post-October
Capital Loss
Deferral | | | Late-Year
Ordinary Loss
Deferral | |
| | | | | | | | | |
| US Short Duration Fixed Income | | $ | — | | | $ | 2,182 | |
Annual Report 95
For federal income tax purposes, the aggregate cost, aggregate gross unrealized appreciation, aggregate gross unrealized depreciation and the net unrealized appreciation (depreciation) were as follows:
| Portfolio | | Aggregate
Cost | | | Aggregate
Gross
Unrealized
Appreciation | | | Aggregate
Gross
Unrealized
Depreciation | | | Net
Unrealized
Appreciation
(Depreciation) | |
| | | | | | | | | | | | | | | | | |
| Emerging Markets Debt | | $ | 23,087,438 | | | $ | 1,152,292 | | | $ | 2,281,990 | | | $ | (1,129,698 | ) |
| Global Fixed Income | | | 8,964,959 | | | | 397,901 | | | | 25,897 | | | | 372,004 | |
| US Corporate Income | | | 290,512,652 | | | | 10,359,562 | | | | 1,101,411 | | | | 9,258,151 | |
| US Short Duration Fixed Income | | | 86,673,987 | | | | 622,856 | | | | – | | | | 622,856 | |
Management has analyzed the Portfolios’ tax positions, and has concluded that no liability for unrecognized tax benefits should be recorded related to uncertain tax positions taken on tax returns filed for any open tax years (or expected to be taken on future tax returns). Open tax years are those that remain subject to examination and are based on each tax jurisdiction’s statute of limitations. Each Portfolio files a US federal income tax return annually after its fiscal year-end, which is subject to examination by the Internal Revenue Service for a period of three years from the date of filing.
(f) Dividends and Distributions—For each Portfolio, income dividends are normally declared each business day and paid monthly. During any particular year, net realized gains from investment transactions in excess of available capital loss carryforwards would be taxable to the Portfolios, if not distributed. The Portfolios intend to declare and distribute these amounts, at least annually, to shareholders, but may be distributed more frequently. Differences in per share distributions, by class, are generally due to differences in class specific expenses.
Income and capital gains distributions are determined in accordance with federal income tax regulations which may differ from GAAP. These book/tax differences, which may result in distribution reclassifications, are primarily due to differing treatments of foreign currency and fixed-income transactions, distribution redesignations, certain fixed-income securities and expenses, derivatives, wash sales, return
96 Annual Report
of capital distributions, currency straddles and paydown gain/loss. The book/tax differences relating to shareholder distributions resulted in reclassifications among certain capital accounts as follows:
| Portfolio | | Paid in
Capital | | | Distributable
Earnings
(Accumulated Loss) | |
| | | | | | | | | |
| Emerging Markets Debt | | $ | (5,375,179 | ) | | $ | 5,375,179 | |
| US Short Duration Fixed Income | | | (19,358 | ) | | | 19,358 | |
The tax character of dividends and distributions paid during the years ended December 31, were as follows:
| | | Ordinary Income | | | Long-Term Capital Gain | |
| Portfolio | | 2020 | | | 2019 | | | 2020 | | | 2019 | |
| | | | | | | | | | | | | | | | | |
| Emerging Markets Debt* | | $ | — | | | $ | 3,889,832 | | | $ | — | | | $ | — | |
| Global Fixed Income* | | | 227,749 | | | | 29,864 | | | | 82,954 | | | | 12,377 | |
| US Corporate Income | | | 12,265,481 | | | | 13,494,395 | | | | — | | | | — | |
| US Short Duration Fixed Income* | | | 1,153,797 | | | | 2,093,974 | | | | — | | | | — | |
| * | Emerging Markets Debt, Global Fixed Income and US Short Duration Fixed Income Portfolios had return of capital distributions of $1,552,899, $0 and $0 in 2020, and $3,900,757, $87,336 and $144,049 in 2019, respectively. |
At December 31, 2020, the components of distributable earnings (accumulated loss), on a tax basis, were as follows:
| Portfolio | | Undistributed
Ordinary Income
(Deferred Ordinary
Losses) | | | Undistributed
Long-Term
Capital Gain
(Deferred Capital
Losses) | | | Net Unrealized
Appreciation
(Depreciation)
Including Foreign
Currency | |
| | | | | | | | | | | | | |
| Emerging Markets Debt | | $ | — | | | $ | (38,208,310 | ) | | $ | (1,147,182 | ) |
| Global Fixed Income | | | 233,100 | | | | 52,952 | | | | 366,909 | |
| US Corporate Income | | | 9,567 | | | | (8,965,280 | ) | | | 9,258,151 | |
| US Short Duration Fixed Income | | | (2,182 | ) | | | (400,863 | ) | | | 600,648 | |
(g) Allocation of Expenses—Expenses common to the Fund, Lazard Retirement Series, Inc., and Lazard Global Total Return and Income Fund, Inc. (each a “Lazard Fund” and collectively, the “Lazard Fund Complex”), each a registered management investment company advised by the Investment Manager, not directly chargeable to one or more specific Lazard Funds are allocated to
Annual Report 97
the Fund and among its Portfolios primarily on the basis of relative net assets. Expenses of the Fund not directly chargeable to one or more Portfolios are similarly allocated among the Portfolios primarily on the basis of relative net assets. The Portfolios accrue distribution and service (12b-1) fees in the Open Share class. The Portfolios’ income, expenses (other than class specific expenses) and realized and unrealized gains and losses are allocated proportionally each day between the classes based upon the relative net assets of each class.
(h) Redemption Fee—Until August 15, 2016, the Portfolios, other than the US Short Duration Fixed Income Portfolio, imposed a 1.00% redemption fee (short-term trading fee) on Portfolio shares redeemed less than 30 days after such shares were acquired. The fees were retained by the Portfolios and are included as paid in capital on the Statements of Assets and Liabilities. As of August 15, 2016, redemption fees no longer apply to transactions in Portfolio shares.
(i) Estimates—The preparation of financial statements in conformity with GAAP requires management to make estimates and assumptions that affect the reported amounts of assets and liabilities and disclosure of contingent assets and liabilities at the date of the financial statements and the reported amounts of increases and decreases in net assets resulting from operations during the reporting period. Actual results could differ from those estimates.
(j) Net Asset Value—The NAV per share for each class of each Portfolio is determined each day the NYSE is open for trading as of the close of regular trading on the NYSE (generally 4:00 p.m. Eastern time). The Fund will not treat an intraday unscheduled disruption in NYSE trading as a closure of the NYSE, and will price its shares as of 4:00 p.m., if the particular disruption directly affects only the NYSE. The NAV per share of a class is determined by dividing the value of the total assets of the Portfolio represented by such class, less all liabilities, by the total number of Portfolio shares of such class outstanding.
98 Annual Report
3. Investment Management, Administration, Custody, Distribution and Transfer Agency Agreements
The Fund, on behalf of the Portfolios, has entered into a management agreement (the “Management Agreement”) with the Investment Manager. Pursuant to the Management Agreement, the Investment Manager manages the investment operations of the Portfolio and the assets of the Portfolio including the purchase, retention and disposition thereof, in accordance with the Portfolio’s investment objectives, policies, and restrictions, and provides the Portfolios with administrative, operational and compliance assistance services. For its services provided to the Portfolios, the Investment Manager earns a management fee, accrued daily as a percentage of each Portfolio’s average daily net assets and payable by each Portfolio monthly, at the annual rate set forth below:
| Portfolio | | Annual Rate | |
| | | | | |
| Emerging Markets Debt | | | 0.70 | %(a) |
| Global Fixed Income | | | 0.50 | |
| US Corporate Income | | | 0.55 | |
| US Short Duration Fixed Income | | | 0.25 | |
| (a) | From January 1, 2020 to June 15, 2020, the annual rate was 0.75%. |
The Investment Manager has voluntarily agreed to waive its fees and, if necessary, reimburse the Portfolio until May 1, 2021 (or such other date as indicated below) if the aggregate direct expenses of each Portfolio, exclusive of taxes, brokerage, interest on borrowings, fees and expenses of “Acquired Funds” (as defined in Form N-1A), fees and expenses related to filing foreign tax reclaims, and extraordinary expenses, on behalf of the Portfolio, exceed the percentages of the value of the Portfolio’s average daily net assets set forth opposite the Portfolio’s name in the table below. The Fund, on behalf of the Portfolio, may deduct from the payment to be made to the Investment Manager under the Management Agreement, or the Investment Manager will bear, such excess expenses.
Annual Report 99
| Portfolio | | Institutional
Shares | | | Open
Shares | | | R6
Shares | |
| | | | | | | | | | | | | |
| Emerging Markets Debt | | | 0.85 | % | | | 1.05 | % | | | 0.80 | %(a) |
| Global Fixed Income | | | 0.70 | | | | 0.95 | | | | N/A | |
| US Corporate Income | | | 0.55 | | | | 0.80 | | | | 0.55 | (b) |
| US Short Duration Fixed Income | | | 0.40 | | | | 0.65 | (c) | | | N/A | |
| (a) | From January 1, 2020 to June 15, 2020, annual rates were 0.95%, 1.15% and 0.90%, respectively. From May 1, 2021 to May 30, 2030, the annual rates are 1.10%, 1.35%, and 1.05%, respectively. |
| (b) | This agreement will continue in effect through May 1, 2030 for the R6 Shares. |
| (c) | This agreement will continue in effect until May 1, 2030 for Open Shares. |
In addition, until May 1, 2021, to the extent the “Total Annual Fund Operating Expenses” (as used in Form N-1A) of the R6 Shares of a Portfolio exceed the Total Annual Fund Operating Expenses of the Portfolio’s Institutional Shares (in each case, not including management fees, custodial fees or other expenses related to the management of the Portfolio’s assets), the Investment Manager will bear the expenses of the R6 Shares in the amount of such excess.
During the year ended December 31, 2020, the Investment Manager waived its management fees and reimbursed the following Portfolios for other expenses as follows:
| | | Institutional Shares | | | Open Shares | |
| Portfolio | | Management
Fees Waived | | | Expenses
Reimbursed | | | Management
Fees Waived | | | Expenses
Reimbursed | | |
| | | | | | | | | | | | | | | | | | |
| Emerging Markets Debt | | $ | 258,276 | | | $ | — | | | $ | 3,161 | | | $ | 3,645 | | |
| Global Fixed Income | | | 41,092 | | | | 125,425 | | | | 286 | | | | 5,077 | | |
| US Corporate Income | | | 333,779 | | | | — | | | | 8,652 | | | | — | | |
| US Short Duration Fixed Income | | | 64,730 | | | | — | | | | 74 | | | | 4,077 | | |
| | | R6 Shares | |
| Portfolio | | Management
Fees Waived | | | Expenses
Reimbursed | | |
| | | | | | | | | | |
| Emerging Markets Debt | | | $8 | | | | $2,977 | | |
| US Corporate Income | | | $6 | | | | $2,897 | | |
The aforementioned waivers and/or reimbursements are not subject to recoupment by the Investment Manager.
100 Annual Report
State Street serves as the Fund’s custodian and provides the Fund with certain administrative services.
In December 2015, State Street announced that it had identified inconsistencies in the way in which clients were invoiced for custody out-of-pocket expenses from 1998 until 2015. The difference between what was charged and what should have been charged, plus interest, was recorded as a reimbursement when determined in 2016. Pursuant to the expense limitations described above, the US Short Duration Fixed Income Portfolio experienced management fee waivers during the year ended December 31, 2016. Accordingly, the reimbursement of out-of-pocket expenses resulted in the reduction in the waiver of management fees for certain Portfolios for the year ended December 31, 2016.
The Fund has a distribution agreement with Lazard Asset Management Securities LLC (the “Distributor”), a wholly-owned subsidiary of the Investment Manager, to serve as the distributor for shares of Portfolios. The Distributor bears, amongst other things, the cost of preparing and distributing materials used by the Distributor in connection with its offering Portfolio shares and other advertising and promotional expenses.
Under a distribution and servicing plan adopted pursuant to Rule 12b-1 under the 1940 Act, each Portfolio pays a monthly fee to the Distributor, at an annual rate of 0.25% of the average daily net assets of its Open Shares, for certain distribution activities and providing services to holders of the Portfolio’s Open shares. The Distributor may make payments to such as financial institutions, securities dealers and other industry professionals in respect of these services.
DST is the Fund’s transfer agent and dividend disbursing agent.
4. Directors’ Compensation
Certain Directors of the Fund are officers of the Investment Manager. For the year ended December 31, 2020, each Director who is not an affiliated person of the Investment Manager or any of its affiliates was paid by all of the funds in the Lazard Fund Complex: (1) an annual retainer of $237,000, (2) an additional
Annual Report 101
annual retainer of $33,700 to the lead Independent Director, and (3) an additional annual retainer of $23,500 to the Audit Committee Chair. The Independent Directors (an “Independent Director” is a Director who is not an “interested person” (as defined in the 1940 Act) of the Fund) also may be paid additional compensation for participation on ad hoc committees or other work performed on behalf of the Board. The aggregate retainers for Independent Directors for the Lazard Fund Complex will remain the same in 2021. The Independent Directors are reimbursed for travel and other out-of-pocket expenses for attending Board and committee meetings or incurred in connection with work performed on behalf of Board. The Directors do not receive benefits from the Fund pursuant to any pension, retirement or similar arrangement. Independent Directors’ fees are allocated among the funds in the Lazard Fund Complex at a rate of $5,000 per active portfolio with the remainder allocated among the active portfolios on the basis of relative net assets. The Statements of Operations show the Independent Directors’ fees and expenses paid by each Portfolio.
5. Securities Transactions and Transactions with Affiliates
Purchases and sales of portfolio securities (excluding short-term investments) for the year ended December 31, 2020 were as follows:
| Portfolio | | Purchases | | | Sales | |
| | | | | | | | | |
| Emerging Markets Debt | | $ | 49,462,140 | | | $ | 111,547,888 | |
| Global Fixed Income | | | 6,621,201 | | | | 3,795,873 | |
| US Corporate Income | | | 72,696,723 | | | | 71,629,057 | |
| US Short Duration Fixed Income | | | 18,941,466 | | | | 29,600,600 | |
| | | US Government and Treasury Securities | |
| Portfolio | | Purchases | | | Sales | |
| | | | | | | | | |
| Global Fixed Income | | | 1,020,935 | | | | 1,368,826 | |
| US Short Duration Fixed Income | | | 69,538,024 | | | | 64,429,563 | |
102 Annual Report
For the year ended December 31, 2020, the Portfolios did not engage in any cross-trades in accordance with Rule 17a-7 under the 1940 Act, and no brokerage commissions were paid to affiliates of the Investment Manager or other affiliates of the Fund for portfolio transactions executed on behalf of the Fund.
6. Line of Credit
The Fund has a $100 million committed line of credit pursuant to an Amended and Restated Loan Agreement (the “Agreement”) with State Street, primarily for temporary or emergency purposes, including the meeting of redemption requests that otherwise might require the untimely disposition of securities. Interest on borrowings is payable at 1.00% plus the “Applicable Rate,” which is the higher of (a) the Federal Funds Rate plus 10 basis points and (b) the Overnight Bank Funding Rate (OBFR) plus 10 basis points, on an annualized basis. Under the Agreement, the Fund has agreed to pay a 0.20% per annum fee on the unused portion of the commitment, payable quarterly in arrears. The Fund has also agreed to pay an upfront fee of 0.05% of the committed line amount. During the year ended December 31, 2020, the following Portfolios had borrowings under the Agreement as follows:
| Portfolio | | Average
Daily Loan
Balance | * | | Maximum
Daily Loan
Outstanding | | | Weighted
Average
Interest
Rate | | | Number of
Days Borrowings
were Outstanding | |
| | | | | | | | | | | | | | | | | |
| Emerging Markets Debt | | | $3,343,929 | | | | $5,440,000 | | | | 1.27 | % | | | 14 | |
| Global Fixed Income | | | 175,000 | | | | 340,000 | | | | 2.20 | | | | 3 | |
| * | For days borrowings were outstanding. |
Management believes that the fair value of the liabilities under the Agreement is equivalent to the recorded amount based on its short-term maturity and interest rate, which fluctuates with the Applicable rate. A Portfolio’s outstanding balance under the Agreement, if any, would be categorized as Level 2.
7. Investment Risks
Not all risks described below apply to all Portfolios, or may not apply to the same degree for one or more Portfolios compared to one or more other Portfolios. In addition, not all risks applicable to
Annual Report 103
an investment in a Portfolio are described below. Please see the current summary prospectus for the relevant Portfolio(s) or a current Portfolio prospectus for further information regarding a Portfolio’s investment strategy and related risks.
(a) Market Risk—A Portfolio may incur losses due to declines in one or more markets in which it invests. These declines may be the result of, among other things, political, regulatory, market, economic or social developments affecting the relevant market(s). To the extent that such developments impact specific industries, market sectors, countries or geographic regions, a Portfolio’s investments in such industries, market sectors, countries and/or geographic regions can be expected to be particularly affected, especially if such investments are a significant portion of its investment portfolio. In addition, turbulence in financial markets and reduced liquidity in equity, credit and/or fixed income markets may negatively affect many issuers, which could adversely affect a Portfolio. Global economies and financial markets are increasingly interconnected, and conditions and events in one country, region or financial market may adversely impact issuers worldwide. As a result, local, regional or global events such as war, acts of terrorism, the spread of infectious illness or other public health issues, recessions or other events could have a significant negative impact on global economic and market conditions. The coronavirus disease 2019 (COVID-19) global pandemic and the aggressive responses taken by many governments or voluntarily imposed by private parties, including closing borders, restricting travel and imposing prolonged quarantines or similar restrictions, as well as the closure of, or operational changes to, many retail and other businesses, has had negative impacts, and in many cases severe negative impacts, on markets worldwide. It is not known how long such impacts, or any future impacts of other significant events described above, will or would last, but there could be a prolonged period of global economic slowdown, which may be expected to impact a Portfolio and its investments.
(b) Fixed-Income and Debt Securities Risk—The market value of a debt security may decline due to general market conditions that are not specifically related to a particular company, such as real or
104 Annual Report
perceived adverse economic conditions, changes in the outlook for corporate earnings, changes in interest or currency rates or adverse investor sentiment generally. The debt securities market can be susceptible to increases in volatility and decreases in liquidity. Liquidity can decline unpredictably in response to overall economic conditions or credit tightening.
Prices of bonds and other debt securities tend to move inversely with changes in interest rates. Interest rate risk is usually greater for fixed-income securities with longer maturities or durations. A rise in interest rates (or the expectation of a rise in interest rates) may result in periods of volatility, decreased liquidity and increased redemptions, and, as a result, a Portfolio may have to liquidate portfolio securities at disadvantageous prices.
A Portfolio’s investments in lower-rated, higher-yielding securities (“junk bonds”) are subject to greater credit risk than its higher rated investments. Credit risk is the risk that the issuer will not make interest or principal payments, or will not make payments on a timely basis. Non-investment grade securities tend to be more volatile, less liquid and are considered speculative. If there is a decline, or perceived decline, in the credit quality of a debt security (or any guarantor of payment on such security), the security’s value could fall, potentially lowering a Portfolio’s share price. The prices of non-investment grade securities, unlike investment grade debt securities, may fluctuate unpredictably and not necessarily inversely with changes in interest rates. The market for these securities may be less liquid and therefore these securities may be harder to value or sell at an acceptable price, especially during times of market volatility or decline.
Some debt securities may give the issuer the option to call, or redeem, the securities before their maturity, and, during a time of declining interest rates, a Portfolio may have to reinvest the proceeds of called or redeemed securities in an investment offering a lower yield (and the Portfolio may not fully benefit from any increase in the value of its portfolio holdings as a result of declining interest rates).
Annual Report 105
Adjustable rate securities provide a Portfolio with a certain degree of protection against rises in interest rates, although adjustable rate securities will participate in any declines in interest rates. Certain adjustable rate securities, such as those with interest rates that fluctuate directly or indirectly based on multiples of a stated index, are designed to be highly sensitive to changes in interest rates and can subject the holders thereof to extreme reductions of yield and possibly loss of principal. Certain fixed-income securities may be issued at a discount from their face value (such as zero coupon securities) or purchased at a price less than their stated face amount or at a price less than their issue price plus the portion of “original issue discount” previously accrued thereon, i.e., purchased at a “market discount.” The amount of original issue discount and/or market discount on certain obligations may be significant, and accretion of market discount together with original issue discount will cause a Portfolio to realize income prior to the receipt of cash payments with respect to these securities.
(c) Non-US Securities Risk—A Portfolio’s performance will be influenced by political, social and economic factors affecting the non-US countries and companies in which the Portfolio invests. Non-US securities carry special risks, such as less developed or less efficient trading markets, political instability, a lack of company information, differing auditing and legal standards, and, potentially, less liquidity.
(d) Emerging Market Risk—Emerging market countries generally have economic structures that are less diverse and mature, and political systems that are less stable, than those of developed countries. The economies of countries with emerging markets may be based predominantly on only a few industries, may be highly vulnerable to changes in local or global trade conditions, and may suffer from extreme debt burdens or volatile inflation rates. The securities markets of emerging market countries have historically been extremely volatile. These market conditions may continue or worsen. Significant devaluation of emerging market currencies against the US dollar may occur subsequent to acquisition of investments denominated in emerging market currencies.
106 Annual Report
(e) Foreign Currency Risk—Investments denominated in currencies other than US dollars may experience a decline in value, in US dollar terms, due solely to fluctuations in currency exchange rates. A Portfolio’s investments could be adversely affected by delays in, or a refusal to grant, repatriation of funds or conversion of emerging market currencies.
(f) Derivatives and Hedging Risk—Derivatives transactions, including those entered into for hedging purposes (i.e., seeking to protect Portfolio investments), may increase volatility, reduce returns, limit gains or magnify losses, perhaps substantially, particularly since most derivatives have a leverage component that provides investment exposure in excess of the amount invested. Swap agreements; forward currency contracts; structured products; over-the-counter options on currencies and swap agreements; and other over-the-counter derivatives transactions are subject to the risks of the creditworthiness of, and default, by the counterparty and consequently may lose all or a portion of their value due solely to the creditworthiness of, or default by, the counterparty. Over-the-counter derivatives frequently may be illiquid and difficult to value. Changes in liquidity may result in significant, rapid and unpredictable changes in the prices for derivatives. These derivatives transactions, as well as the exchange-traded futures and options in which a Portfolio may invest, are subject to many of the risks of, and can be highly sensitive to changes in the value of, the related reference asset, index or rate. As such, a small investment could have a potentially large impact on a Portfolio’s performance. In fact, many derivatives may be subject to greater risks than those associated with investing directly in the underlying or other reference asset. Derivatives transactions incur costs, either explicitly or implicitly, which reduce returns, and costs of engaging in such transactions may outweigh any gains or any losses averted from hedging activities. Successful use of derivatives, whether for hedging or for other investment purposes, is subject to the Investment Manager’s ability to predict correctly movements in the direction of the relevant reference asset or market and, for hedging activities, correlation of the derivative instruments used with the investments seeking to be hedged. Use of derivatives transactions, even if entered into for hedging purposes, may cause
Annual Report 107
a Portfolio to experience losses greater than if the Portfolio had not engaged in such transactions.
(g) Structured Products Risk—Structured notes and other structured products are privately negotiated debt instruments where the principal and/or interest is determined by reference to a specified asset, market or rate, or the differential performance of two assets or markets. Structured products can have risks of both fixed-income securities and derivatives transactions. Derivatives transactions may increase volatility or reduce returns, perhaps substantially, particularly since most derivatives have a leverage component that provides investment exposure in excess of the amount invested, and they are subject to many of the risks of, and can be highly sensitive to changes in the value of, the related reference asset, market or rate. As such, a small investment could have a potentially large impact on a Portfolio’s performance. Use of derivatives transactions may cause a Portfolio to experience losses greater than if the Portfolio had not engaged in such transactions.
(h) Mortgage-Related and Asset-Backed Securities Risk—Mortgage-related securities are complex instruments, subject to both credit and prepayment risk, and may be more volatile and less liquid, and more difficult to price accurately, than more traditional debt securities. Mortgage-related securities generally are subject to credit risks associated with the performance of the underlying mortgage properties. Prepayment risk can lead to fluctuations in value of the mortgage-related security which may be pronounced. As with other interest-bearing securities, the prices of certain mortgage-related securities are inversely affected by changes in interest rates. However, although the value of a mortgage-related security may decline when interest rates rise, the converse is not necessarily true, since during periods of declining interest rates the mortgages underlying the security are more likely to be prepaid.
The risks of asset-backed securities are similar to those of mortgage-related securities. However, asset-backed securities present certain risks that are not presented by mortgage-related
108 Annual Report
securities. Primarily, these securities may provide a Portfolio with a less effective security interest in the related collateral than do mortgage-related securities.
(i) Preferred Securities Risk—There are various risks associated with investing in preferred securities. In addition, unlike common stock, participation in the growth of an issuer may be limited.
| • | Credit risk is the risk that a security held by the Portfolio will decline in price or the issuer of the security will fail to make dividend, interest or principal payments when due because the issuer experiences a decline in its financial status. |
| | |
| • | Interest rate risk is the risk that securities will decline in value because of changes in market interest rates. When market interest rates rise, the market value of such securities generally will fall. |
| | |
| • | Preferred securities may include provisions that permit the issuer, at its discretion, to defer or omit distributions for a stated period without any adverse consequences to the issuer. |
| | |
| • | Preferred securities are generally subordinated to bonds and other debt instruments in an issuer’s capital structure in terms of having priority to corporate income, claims to corporate assets and liquidation payments, and therefore will be subject to greater credit risk than more senior debt instruments. |
| | |
| • | During periods of declining interest rates, an issuer may be able to exercise an option to call, or redeem its issue at par earlier than the scheduled maturity. If this occurs during a time of lower or declining interest rates, the Portfolio may have to reinvest the proceeds in lower yielding securities (and the Portfolio may not benefit from any increase in the value of its portfolio holdings as a result of declining interest rates). |
| | |
| • | Certain preferred securities may be substantially less liquid than many other securities, such as common stocks or US government securities. Illiquid securities involve the risk that the securities will not be able to be sold at the time desired by the Portfolio |
Annual Report 109
| | or at prices approximating the value at which the Portfolio is carrying the securities on its books. |
(j) Non-Diversification Risk—A Portfolio that is classified as “non-diversified” may be more vulnerable to changes in the market value of a single issuer or group of issuers and may be relatively more susceptible to adverse effects from any single corporate, industry, economic, market, political or regulatory occurrence than if the Portfolio’s investments consisted of securities issued by a larger number of issuers.
(k) Government Securities Risk—Not all obligations of the US government, its agencies and instrumentalities are backed by the full faith and credit of the US Treasury. Some obligations are backed only by the credit of the issuing agency or instrumentality, and in some cases there may be some risk of default by the issuer. Any guarantee by the US government or its agencies or instrumentalities of a security held by a Portfolio does not apply to the market value of such security or to shares of the Portfolio itself. A security backed by the US Treasury or the full faith and credit of the United States is guaranteed only as to the timely payment of interest and principal when held to maturity.
(l) Cybersecurity Risk—The Portfolios and their service providers are susceptible to operational and information security and related risks of cybersecurity incidents. Cybersecurity attacks include, but are not limited to, gaining unauthorized access to digital systems (e.g., through “hacking” or malicious software coding) for purposes of misappropriating assets or sensitive information, corrupting data or causing operational disruption. Cybersecurity incidents affecting the Investment Manager, transfer agent or custodian or other service providers such as financial intermediaries have the ability to cause disruptions and impact business operations, potentially resulting in financial losses, including by impediments to a Portfolio’s investment trading; the inability of Portfolio shareholders to purchase and redeem Portfolio shares; interference with a Portfolio’s ability to calculate its NAV; violations of applicable privacy, data security or other laws; regulatory fines and penalties; reputational
110 Annual Report
damage; reimbursement or other compensation or remediation costs; legal fees; or additional compliance costs. Similar adverse consequences could result from cybersecurity incidents affecting issuers of securities in which a Portfolio invests; counterparties with which a Portfolio engages in transactions; governmental and other regulatory authorities, exchange and other financial market operators; and banks, brokers, dealers, insurance companies and other financial institutions and other parties. There are inherent limitations in any cybersecurity risk management systems or business continuity plans, including the possibility that certain risks have not been identified.
8. Contractual Obligations
The Fund enters into contracts in the normal course of business that contain a variety of indemnification provisions. A Portfolio’s maximum exposure under these arrangements is unknown. Management has reviewed the Fund’s existing contracts and expects the risk of loss to be remote.
9. Fair Value Measurements
Fair value is defined as the price that a Portfolio would receive to sell an asset, or would pay to transfer a liability, in an orderly transaction between market participants at the date of measurement. The Fair Value Measurements and Disclosures provisions of GAAP also establish a framework for measuring fair value, and a three-level hierarchy for fair value measurement that is based upon the transparency of inputs to the valuation of an asset or liability. Inputs may be observable or unobservable and refer, broadly, to the assumptions that market participants would use in pricing the asset or liability. Observable inputs reflect the assumptions that market participants would use in pricing the asset or liability based on market data obtained from sources independent of the Fund. Unobservable inputs reflect the Fund’s own assumptions about the assumptions that market participants would use in pricing the asset or liability, developed based on the best information
Annual Report 111
available in the circumstances. The fair value measurement level within the fair value hierarchy for the assets and liabilities of the Fund is based on the lowest level of any input that is significant to the overall fair value measurement. The three-level hierarchy of inputs is summarized below:
| • | Level 1 – unadjusted quoted prices in active markets for identical assets and liabilities |
| | |
| • | Level 2 – other significant observable inputs (including unadjusted quoted prices for similar assets and liabilities, interest rates, prepayment speeds, credit risk, etc.) |
| | |
| • | Level 3 – significant unobservable inputs (including the Fund’s own assumptions in determining the fair value of assets and liabilities) |
Changes in valuation methodology or inputs may result in transfers into or out of the current assigned level within the hierarchy.
The inputs or methodology used for valuing securities are not necessarily an indication of the risks associated with investing in these securities.
The following table summarizes the valuation of the Portfolios’ assets and liabilities by each fair value hierarchy level as of December 31, 2020:
112 Annual Report
| Description | | Unadjusted
Quoted Prices in
Active Markets
for Identical
Assets
and Liabilities
(Level 1) | | | Significant
Other
Observable
Inputs
(Level 2) | | | Significant
Unobservable
Inputs
(Level 3) | | Balance as of
December 31, 2020 | |
| Emerging Markets Debt Portfolio | | | | | | | | | | | | | | | | | |
| Assets: | | | | | | | | | | | | | | | | | |
| Corporate Bonds* | | | $ | — | | | $ | 1,446,906 | | | $ | — | | | $ | 1,446,906 | |
| Foreign Government Obligations* | | | | — | | | | 17,725,819 | | | | — | | | | 17,725,819 | |
| Quasi Government Bonds* | | | | — | | | | 252,413 | | | | — | | | | 252,413 | |
| Supranational Bonds | | | | — | | | | 15,481 | | | | — | | | | 15,481 | |
| Short-Term Investments | | | | 2,516,617 | | | | — | | | | — | | | | 2,516,617 | |
| Other Financial Instruments† | | | | | | | | | | | | | | | | | |
| Forward Currency Contracts | | | | — | | | | 116,845 | | | | — | | | | 116,845 | |
| Interest Rate Swaps | | | | | | | | 5,736 | | | | | | | | 5,736 | |
| Total | | | $ | 2,516,617 | | | $ | 19,563,200 | | | $ | — | | | $ | 22,079,817 | |
| Liabilities: | | | | | | | | | | | | | | | | | |
| Other Financial Instruments† | | | | | | | | | | | | | | | | | |
| Forward Currency Contracts | | | $ | — | | | $ | (73,535 | ) | | $ | — | | | $ | (73,535 | ) |
| Global Fixed Income Portfolio | | | | | | | | | | | | | | | | | |
| Assets: | | | | | | | | | | | | | | | | | |
| Corporate Bonds* | | | $ | — | | | $ | 3,497,822 | | | $ | — | | | $ | 3,497,822 | |
| Foreign Government Obligations* | | | | — | | | | 4,167,143 | | | | — | | | | 4,167,143 | |
| Quasi Government Bonds* | | | | — | | | | 96,707 | | | | — | | | | 96,707 | |
| Supranational Bonds | | | | — | | | | 994,087 | | | | — | | | | 994,087 | |
| US Municipal Bonds | | | | — | | | | 140,400 | | | | — | | | | 140,400 | |
| US Treasury Securities | | | | — | | | | 290,267 | | | | — | | | | 290,267 | |
| Short-Term Investments | | | | 368,885 | | | | — | | | | — | | | | 368,885 | |
| Other Financial Instruments† | | | | | | | | | | | | | | | | | |
| Forward Currency Contracts | | | | — | | | | 143,252 | | | | — | | | | 143,252 | |
| Total | | | $ | 368,885 | | | $ | 9,329,678 | | | $ | — | | | $ | 9,698,563 | |
| Liabilities: | | | | | | | | | | | | | | | | | |
| Other Financial Instruments† | | | | | | | | | | | | | | | | | |
| Forward Currency Contracts | | | $ | — | | | $ | (188,997 | ) | | $ | — | | | $ | (188,997 | ) |
Annual Report 113
| Description | | Unadjusted
Quoted Prices in
Active Markets
for Identical
Assets
and Liabilities
(Level 1) | | | Significant
Other
Observable
Inputs
(Level 2) | | | Significant
Unobservable
Inputs
(Level 3) | | Balance as of
December 31, 2020 | |
| US Corporate Income Portfolio | | | | | | | | | | | | | | | | | |
| Corporate Bonds* | | | $ | — | | | $ | 258,593,167 | | | $ | — | | | $ | 258,593,167 | |
| Exchange-Traded Funds | | | | 23,771,329 | | | | — | | | | — | | | | 23,771,329 | |
| Short-Term Investments | | | | 17,406,307 | | | | — | | | | — | | | | 17,406,307 | |
| Total | | | $ | 41,177,636 | | | $ | 258,593,167 | | | $ | — | | | $ | 299,770,803 | |
| US Short Duration Fixed Income Portfolio | | | | | | | | | | | | | | | | | |
| Asset-Backed Securities | | | $ | — | | | $ | 5,632,528 | | | $ | — | | | $ | 5,632,528 | |
| Corporate Bonds* | | | | — | | | | 19,595,512 | | | | — | | | | 19,595,512 | |
| US Government Securities | | | | — | | | | 775,629 | | | | — | | | | 775,629 | |
| US Treasury Securities | | | | — | | | | 61,088,852 | | | | — | | | | 61,088,852 | |
| Short-Term Investments | | | | 204,322 | | | | — | | | | — | | | | 204,322 | |
| Total | | | $ | 204,322 | | | $ | 87,092,521 | | | $ | — | | | $ | 87,296,843 | |
| * | Please refer to Portfolios of Investments and Notes to Portfolios of Investments for portfolio holdings by country and industry. |
| † | Other financial instruments are derivative instruments which are valued at their respective unrealized appreciation (depreciation). |
10. Derivative Instruments
Certain Portfolios may use derivative instruments, including forward currency contracts or swap agreements.
Forward currency contracts may be used for hedging purposes or to seek to increase returns.
A Portfolio enters into swap agreements in an attempt to obtain a particular exposure when it is considered desirable to do so, possibly at a lower cost to such Portfolio than if it had invested directly in the asset that yielded the desired exposure.
114 Annual Report
During the year ended December 31, 2020, the approximate average monthly notional exposure for derivative instruments was as follows:
| Derivative Instruments | | Emerging
Markets
Debt
Portfolio | | | Global
Fixed
Income
Portfolio | |
| Forward currency contracts: | | | | | | | | |
| Average amounts purchased | | $ | 12,900,000 | | | $ | 3,600,000 | |
| Average amounts sold | | $ | 9,400,000 | | | $ | 3,000,000 | |
| Interest rate swap agreements: | | | | | | | | |
| Average notional value – receives fixed rate on centrally cleared | | $ | 500,000 | | | | — | |
| Average notional value – receives fixed rate on OTC | | $ | 300,000 | * | | | — | |
| * | Represents average monthly notional exposure for the seven months the derivative instrument was open during the period. |
The following table summarizes the fair value of derivative instruments on the Statement of Assets and Liabilities as of December 31, 2020:
Emerging Markets Debt Portfolio
| Assets – Derivative Financial Instruments | | | | Total | |
| | | | | | | |
| Forward currency contracts | | Unrealized appreciation on forward currency contracts | | $ | 116,845 | |
| | | | | | | |
| | Foreign | | | Interest | | | | | |
| | Currency | | | Rate | | | | | |
| Liabilities – Derivative Financial Instruments | Contracts | | | Contracts | | | | Total | |
| Forward currency contracts | | | | | | | | | | | | |
| Unrealized depreciation on forward currency contracts | | $ | 73,535 | | | $ | — | | | $ | 73,535 | |
| Swaps | | | | | | | | | | | | |
| Variation margin payable on centrally cleared swaps (a) | | | — | | | $ | 281 | | | $ | 281 | |
| Total | | $ | 73,535 | | | $ | 281 | | | $ | 73,816 | |
| (a) | Net cumulative unrealized appreciation (depreciation) on centrally cleared swap agreements, if any, are reported in the Schedule of Investments. In the Statements of Assets and Liabilities, only current day’s variation margin is reported in receivables or payables and the net cumulative unrealized appreciation (depreciation) is included in accumulated earnings (loss). |
Annual Report 115
Global Fixed Income Portfolio
| Assets – Derivative Financial Instruments | | | | Total | |
| Forward currency contracts | | Unrealized appreciation on forward currency contracts | | $ | 143,252 | |
| | | | | | | |
| Liabilities – Derivative Financial Instruments | | | | | | |
| Forward currency contracts | | Unrealized depreciation on forward currency contracts | | $ | 188,997 | |
Emerging Markets Debt Portfolio
The effect of derivative instruments on the Statement of Operations for the year ended December 31, 2020 was:
| | | Foreign | | | Interest | | | | |
| | | Currency | | | Rate | | | | |
| Net Realized Gain (Loss) from: | | Contracts | | | Contracts | | | Total | |
| Forward currency contracts | | $ | (360,484 | ) | | $ | — | | | $ | (360,484 | ) |
| Swap agreements | | | — | | | | (201,935 | ) | | | (201,935 | ) |
| Total | | $ | (360,484 | ) | | $ | (201,935 | ) | | $ | (562,419 | ) |
| | | | | | | | | | |
| | | Foreign | | | Interest | | | | |
| Net Change in Unrealized Appreciation | | Currency | | | Rate | | | | |
| (Depreciation) on: | | Contracts | | | Contracts | | | Total | |
| Forward currency contracts | | $ | (259,956 | ) | | $ | — | | | $ | (259,956 | ) |
| Swap agreements | | | — | | | | (22,986 | ) | | | (22,986 | ) |
| Total | | $ | (259,956 | ) | | $ | (22,986 | ) | | $ | (282,942 | ) |
Global Fixed Income Portfolio
The effect of derivative instruments on the Statement of Operations for the year ended December 31, 2019 was:
| Net Realized Gain (Loss) from: | | Total | |
| Forward currency contracts | | $ | 66,683 | |
| | | | |
| Net Change in Unrealized Appreciation (Depreciation) on: | | | | |
| Forward currency contracts | | $ | (42,062 | ) |
116 Annual Report
As of December 31, 2020, the Emerging Markets Debt and Global Fixed Income Portfolios held derivative instruments that are eligible for offset in the Statements of Assets and Liabilities and are subject to master netting arrangements. A master netting arrangement is an agreement between two counterparties who have multiple contracts with each other that provides for the net settlement of all contracts, as well as any cash collateral, through a single payment in the event of default on, or termination of, any one contract.
The required information for the affected Portfolios are presented in the below table, as of December 31, 2020:
Emerging Markets Debt Portfolio
| | | | | | | | | | Net Amounts of | |
| | | | | | Gross Amounts Offset | | Assets Presented | |
| | Gross Amounts of | | in the Statement of | | in the Statement of | |
| Description | Recognized Assets | | Assets and Liabilities | | Assets and Liabilities | |
| Forward Currency Contracts | | $ | 116,845 | | | | $ | — | | | | $ | 116,845 | | | |
| | | | | | | Amounts Not Offset
in the Statement of
Assets and Liabilities | | | | | |
| Counterparty | | Net Amounts of
Assets Presented
in the Statement of
Assets and Liabilities | | Financial
Instruments | Collateral
Received | | Net Amounts of
Derivative Assets | |
| Bank of America NA | | | $ | 9,171 | | | | $ | (9,171 | ) | | $ | — | | | | $ | — | | |
| Barclays Bank PLC | | | | 28,288 | | | | | (18,081 | ) | | | — | | | | | 10,207 | | |
| Citibank NA | | | | 27,632 | | | | | (14,675 | ) | | | — | | | | | 12,957 | | |
| HSBC Bank USA NA | | | | 14,923 | | | | | (2 | ) | | | — | | | | | 14,921 | | |
| JPMorgan Chase Bank NA | | | | 166 | | | | | (166 | ) | | | — | | | | | — | | |
| Standard Chartered Bank | | | | 9,986 | | | | | (9,986 | ) | | | — | | | | | — | | |
| State Street Bank and Trust Co. | | | | 15,174 | | | | | — | | | | — | | | | | 15,174 | | |
| UBS AG | | | | 11,505 | | | | | (2,023 | ) | | | — | | | | | 9,482 | | |
| Total | | | $ | 116,845 | | | | $ | (54,104 | ) | | $ | — | | | | $ | 62,741 | | |
| | | | | | | | | | Net Amounts of | |
| | | | | | Gross Amounts Offset | | Liabilities Presented | |
| | Gross Amounts of | | in the Statement of | | in the Statement of | |
| Description | Recognized Liabilities | | Assets and Liabilities | | Assets and Liabilities | |
| Forward Currency Contracts | | $ | 73,535 | | | | $ | — | | | | $ | 73,535 | | |
Annual Report 117
| | | | | | | Amounts Not Offset
in the Statement of
Assets and Liabilities | | | | | |
| Counterparty | | Net Amounts of
Liabilities Presented
in the Statement of
Assets and Liabilities | | Financial
Instruments | Collateral
Pledged | | Net Amounts of
Derivative Liabilities | |
| Bank of America NA | | | $ | 23,134 | | | | $ | (9,171 | ) | | $ | — | | | | $ | 13,963 | | |
| Barclays Bank PLC | | | | 18,081 | | | | | (18,081 | ) | | | — | | | | | — | | |
| Citibank NA | | | | 14,675 | | | | | (14,675 | ) | | | — | | | | | — | | |
| HSBC Bank USA NA | | | | 2 | | | | | (2 | ) | | | — | | | | | — | | |
| JPMorgan Chase Bank NA | | | | 863 | | | | | (166 | ) | | | — | | | | | 697 | | |
| Standard Chartered Bank | | | | 14,757 | | | | | (9,986 | ) | | | — | | | | | 4,771 | | |
| UBS AG | | | | 2,023 | | | | | (2,023 | ) | | | — | | | | | — | | |
| Total | | | $ | 73,535 | | | | $ | (54,104 | ) | | $ | — | | | | $ | 19,431 | | |
Global Fixed Income Portfolio
| | | | | | | | | | Net Amounts of | |
| | | | | | Gross Amounts Offset | | Assets Presented | |
| | Gross Amounts of | | in the Statement of | | in the Statement of | |
| Description | Recognized Assets | | Assets and Liabilities | | Assets and Liabilities | |
| Forward Currency Contracts | | $ | 143,252 | | | | $ | — | | | | $ | 143,252 | | |
| | | | | | | Amounts Not Offset
in the Statement of
Assets and Liabilities | | | | | | |
| Counterparty | | Net Amounts of
Assets Presented
in the Statement of
Assets and Liabilities | | Financial
Instruments | Collateral
Received | | | Net Amounts of
Derivative Assets | |
| Citibank NA | | | $ | 10,256 | | | | $ | (10,256 | ) | | $ | — | | | | $ | — | | |
| HSBC Bank USA NA | | | | 86,110 | | | | | (49,640 | ) | | | — | | | | | 36,470 | | |
| JPMorgan Chase Bank NA | | | | 46,886 | | | | | (46,886 | ) | | | — | | | | | — | | |
| Total | | | $ | 143,252 | | | | $ | (106,782 | ) | | $ | — | | | | $ | 36,470 | | |
| | | | | | | | | | Net Amounts of | |
| | | | | | Gross Amounts Offset | | Liabilities Presented | |
| | Gross Amounts of | | in the Statement of | | in the Statement of | |
| Description | Recognized Liabilities | | Assets and Liabilities | | Assets and Liabilities | |
| Forward Currency Contracts | | $ | 188,997 | | | | $ | — | | | | $ | 188,997 | | |
118 Annual Report
| | | | | | Amounts Not Offset
in the Statement of
Assets and Liabilities | | | | |
| Counterparty | | Net Amounts of
Liabilities Presented
in the Statement of
Assets and Liabilities | | Financial
Instruments | Collateral
Pledged | | Net Amounts of
Derivative Liabilities | |
| Citibank NA | | | $ | 41,073 | | | | $ | (10,256 | ) | | $ | — | | | | $ | 30,817 | | |
| HSBC Bank USA NA | | | | 49,640 | | | | | (49,640 | ) | | | — | | | | | — | | |
| JPMorgan Chase Bank NA | | | | 94,289 | | | | | (46,886 | ) | | | — | | | | | 47,403 | | |
| Morgan Stanley Capital Services LLC. | | | | 3,995 | | | | | — | | | | — | | | | | 3,995 | | |
| Total | | | $ | 188,997 | | | | $ | (106,782 | ) | | $ | — | | | | $ | 82,215 | | |
11. Accounting Pronouncements
In March 2017, the Financial Accounting Standards Board issued Accounting Standards Update ASU No. 2017-08, Receivables - Nonrefundable Fees and Other Costs (Subtopic 310-20): Premium Amortization on Purchased Callable Debt Securities (“ASU No. 2017-08”). ASU No. 2017-08 shortened the amortization period for certain purchased callable debt securities held at a premium to the earliest call date. Management has implemented the applicable changes, and they did not have a material impact on the Portfolio’s financial statements. In October 2020, ASU No. 2017-08 was amended by the Financial Accounting Standards Board’s issuance of Accounting Standards Update No. 2020-08, Codification Improvements to Subtopic 310-20, Receivables-Non-refundable Fees and Other Costs (“ASU No. 2020-08”). This amendment requires that entities re-evaluate whether callable debt securities fall within the scope of ASU No. 2017-08 for each reporting period. ASU No. 2020-08 also amends ASU No. 2017-08 to require premiums be amortized to the “next call date” rather than the “earliest call date” and further clarifies the definition of “next call date.” ASU No. 2020-08 is effective for fiscal years, and interim periods within those fiscal years, beginning after December 15, 2020. Early adoption of ASU No. 2020-08 is not permitted. Management is currently evaluating the impact, if any, of applying ASU No. 2020-08.
Annual Report 119
On March 12, 2020, the Financial Accounting Standards Board concluded its reference rate reform project with the issuance of Accounting Standards Update No. 2020-04, Reference Rate Reform (Topic 848) - Facilitation of the Effects of Reference Rate Reform on Financial Reporting (“ASU No. 2020-04”). ASU No. 2020-04 provides elective temporary financial reporting relief from the effect of certain types of contract modifications due to the planned discontinuation of the London Interbank Offered Rate (LIBOR) and other interbank offered based reference rates as of the end of 2021. ASU No. 2020-04 is effective for certain reference rate-related contract modifications that occur during the period March 12, 2020 through December 31, 2022. Management is currently evaluating the impact, if any, of applying ASU No. 2020-04.
12. Subsequent Events
Management has evaluated subsequent events affecting the Portfolios through the issuance of the financial statements and has determined that there were no subsequent events that required adjustment or disclosure.
120 Annual Report
The Lazard Funds, Inc.
Report of Independent Registered Public Accounting Firm
To the Board of Directors of The Lazard Funds, Inc. and Shareholders of Lazard Emerging Markets Debt Portfolio, Lazard Global Fixed Income Portfolio, Lazard US Corporate Income Portfolio and Lazard US Short Duration Fixed Income Portfolio:
Opinion on the Financial Statements and Financial Highlights
We have audited the accompanying statements of assets and liabilities of Lazard Emerging Markets Debt Portfolio, Lazard Global Fixed Income Portfolio, Lazard US Corporate Income Portfolio and Lazard US Short Duration Fixed Income Portfolio (collectively the “Portfolios”), four of the portfolios constituting The Lazard Funds, Inc. (the “Fund”), including the portfolios of investments, as of December 31, 2020, the related statements of operations for the year then ended, the statements of changes in net assets for each of the two years in the period then ended, the financial highlights for each of the five years in the period then ended, and the related notes. In our opinion, the financial statements and financial highlights present fairly, in all material respects, the financial position of each of the Portfolios listed above, as of December 31, 2020, and the results of their operations for the year then ended, the changes in their net assets for each of the two years in the period then ended, and the financial highlights for each of the five years in the period then ended, in conformity with accounting principles generally accepted in the United States of America.
Basis for Opinion
These financial statements and financial highlights are the responsibility of the Portfolios’ management. Our responsibility is to express an opinion on the Portfolios’ financial statements and financial highlights based on our audits. We are a public accounting firm registered with the Public Company Accounting Oversight Board (United States) (PCAOB) and are required to be independent with respect to the Portfolios in accordance with the U.S. federal securities laws and the applicable rules and regulations of the Securities and Exchange Commission and the PCAOB.
Annual Report 121
We conducted our audits in accordance with the standards of the PCAOB. Those standards require that we plan and perform the audit to obtain reasonable assurance about whether the financial statements and financial highlights are free of material misstatement, whether due to error or fraud. The Portfolios are not required to have, nor were we engaged to perform, an audit of their internal control over financial reporting. As part of our audits we are required to obtain an understanding of internal control over financial reporting but not for the purpose of expressing an opinion on the effectiveness of the Portfolios’ internal control over financial reporting. Accordingly, we express no such opinion.
Our audits included performing procedures to assess the risks of material misstatement of the financial statements and financial highlights, whether due to error or fraud, and performing procedures that respond to those risks. Such procedures included examining, on a test basis, evidence regarding the amounts and disclosures in the financial statements and financial highlights. Our audits also included evaluating the accounting principles used and significant estimates made by management, as well as evaluating the overall presentation of the financial statements and financial highlights. Our procedures included confirmation of securities owned as of December 31, 2020, by correspondence with the custodian and brokers; when replies were not received from brokers, we performed other auditing procedures. We believe that our audits provide a reasonable basis for our opinion.
/s/ DELOITTE & TOUCHE LLP
New York, New York
February 24, 2021
We have served as the auditor of one or more of the investment companies in the Lazard Fund Complex since 2004.
122 Annual Report
The Lazard Funds, Inc.
Board of Directors and Officers Information (unaudited)
Name (Year of Birth)
Address(1) | | Position(s) with the
Fund (Since) and Term(2) | | Principal Occupation(s) and Other Public
Company Directorships Held During the
Past Five Years(2) |
| | | | | |
| Independent Directors(3): | |
| | | | | |
| Franci J. Blassberg (1953) | | Director
(August 2014) | | Debevoise & Plimpton LLP, a law firm, Of Counsel (2013 – present) |
| | | | | Cornell Law School, Adjunct Professor (2013 – present) |
| | | | | |
| | | | | The Buchmann Faculty of Law, Tel Aviv University, Visiting Professor (2019) |
| | | | | |
| | | | | University of California, Berkeley School of Law, Adjunct Professor (Spring 2017) |
| | | | | |
| Kenneth S. Davidson (1945) | | Director
(August 1995) | | Davidson Capital Management Corporation, an investment manager, President (1978 – present) |
| | | | | |
| Nancy A. Eckl (1962) | | Director
(April 2007) | | College Retirement Equities Fund (eight accounts), Trustee (2007 – present) |
| | | | | TIAA-CREF Funds (68 funds) and TIAA-CREF Life Funds (11 funds), Trustee (2007 – present) |
| | | | | |
| | | | | TIAA Separate Account VA-1, Member of the Management Committee (2007 – present) |
| | | | | |
| Trevor W. Morrison (1971) | | Director
(April 2014) | | New York University School of Law, Dean and Eric M. and Laurie B. Roth Professor of Law (2013 – present) |
| | | | | |
| Richard Reiss, Jr. (1944) | | Director
(May 1991) | | Georgica Advisors LLC, an investment manager, Chairman (1997 – present) |
| | | | | Resource America, Inc., a real estate asset management company, Director (2016 – 2018) |
| | | | | |
| | | | | Osprey Technology Acquisition Corp, a special purpose acquisition company, Director (2019 – present) |
Annual Report 123
Name (Year of Birth)
Address(1) | | Position(s) with the
Fund (Since) and Term(2) | | Principal Occupation(s) and Other Public
Company Directorships Held During the
Past Five Years(2) |
| | | | | |
| Robert M. Solmson (1947) | | Director
(September 2004) | | Fairwood Capital, LLC, a private investment corporation engaged primarily in real estate and hotel investments, Co-Managing Partner and Managing Director (2008 – present) |
| | | | | |
| Interested Directors(4): | |
| | | | | |
| Ashish Bhutani (1960) | | Director
(July 2005) | | Investment Manager, Chief Executive Officer (2004 – present) |
| | | | | Lazard Ltd, Vice Chairman and Director (2010 – present) |
| | | | | |
| Nathan A. Paul (1973) | | Director
(October 2017), Chief Executive
Officer and President
(February 2017) | | Investment Manager, Chief Business Officer (April 2017 – present) and Managing Director (2003 – present) |
| | | | |
| | | | Investment Manager, General Counsel (2002 – April 2017) |
| (1) | The address of each Director of the Fund is Lazard Asset Management LLC, 30 Rockefeller Plaza, New York, New York 10112-6300. |
| (2) | Each Director serves as a Director for each of the funds in the Lazard Fund Complex comprised of, as of January 31, 2021, 35 active investment portfolios. Each Director serves an indefinite term, until his or her successor is elected and qualifies or until his or her earlier resignation. |
| (3) | “Independent Directors” are not “interested persons” (as defined in the 1940 Act) of the Fund. |
| (4) | Messrs. Bhutani and Paul are “interested persons” (as defined in the 1940 Act) of the Fund because of their positions with the Investment Manager. |
| | The Fund’s Statement of Additional Information contains further information about the Directors and is available without charge by calling 800-823-6300, or online, at www.lazardassetmanagement.com. |
124 Annual Report
Name (Year of Birth)
Address(1) | | Position(s) with the
Fund (Since) and Term(2) | | Principal Occupation(s) During the
Past Five Years |
| | | | | |
| Officers(3): | | | | |
| Mark R. Anderson (1970) | | Vice President and Secretary (February 2017) | | Managing Director (since February 2017), General Counsel (since April 2017) and Chief Compliance Officer (since September 2014) of the Investment Manager |
| | | | | |
| Nargis Hilal ( 1984) | | Chief Compliance Officer (July 2020) | | Senior Vice President and Counsel of the Investment Manager (since August 2017) |
| | | | | |
| | | | | Chief Compliance Officer of KLS Diversified Asset Management LP (March 2016 – August 2017) |
| | | | | |
| | | | | Deputy Chief Compliance Office KLS Diversified Asset Management LP (January 2015 – March 2016) |
| | | | | |
| Christopher Snively (1984) | | Chief Financial Officer (March 2016) and Treasurer (September 2019) | | Senior Vice President of the Investment Manager |
| Shari L. Soloway (1981) | | Assistant Secretary
(November 2015) | | Head of Legal, North America (since January 2019, previously Senior Vice President, Legal and Compliance) of the Investment Manager |
| | | | | |
| Jessica A. Falzone (1989) | | Assistant Secretary
(January 2019) | | Vice President, Legal and Compliance, of the Investment Manager (since March 2018) |
| | | | | |
| | | | | Associate at Schulte Roth & Zabel LLP (October 2014 – March 2018) |
| | | | | |
| Christina Kennedy (1990) | | Assistant Treasurer
(May 2020) | | Vice President of the Investment Manager (since July 2019) |
| | | | | |
| | | | | Senior Fund Accountant, Gates Capital Management Inc. (July 2016 – July 2019) |
| | | | | |
| | | | | Assurance Senior Associate at PricewaterhouseCoopers LLP (August 2013 – July 2016) |
| | | | | |
| Cesar A. Trelles (1975) | | Assistant Treasurer
(December 2004) | | Vice President of the Investment Manager |
| (1) | The address of each officer of the Fund is Lazard Asset Management LLC, 30 Rockefeller Plaza, New York, New York 10112-6300. |
| (2) | Each officer serves for an indefinite term, until his or her successor is elected and qualifies or until his or her earlier resignation or removal. Each officer serves in the same capacity for the other funds in the Lazard Fund Complex. |
| (3) | In addition to Nathan A. Paul, Chief Executive Officer and President (since February 2017; previously, Vice President and Secretary), whose information is included in the Interested Directors section above. |
Annual Report 125
The Lazard Funds, Inc. Tax and Other Information (unaudited)
Tax Information
Year Ended December 31, 2020
The following tax information represents year end disclosures of the tax benefits passed through to shareholders for 2020:
Of the dividends paid by the Portfolios, none are qualified dividend income.
Of the dividends paid by the Portfolios, no dividends qualify for the dividends received deduction available to corporate shareholders.
Of the dividends paid by the Portfolios, the corresponding percentage represents the long-term capital gains paid to shareholders.
| Portfolio | | Long-Term
Capital Gains | |
| Emerging Markets Debt | | | $ — | |
| Global Fixed Income | | | 82,954 | |
| US Corporate Income | | | — | |
| US Short Duration Fixed Income | | | — | |
Pursuant to Section 871 of the Code, the Portfolios have no designated qualified short-term gains for purposes of exempting withholding of tax on such distributions to US nonresident shareholders.
Proxy Voting
A description of the policies and procedures used to determine how proxies relating to Fund portfolio securities are voted is available (1) without charge, upon request, by calling (800) 823-6300 or (2) on the Securities and Exchange Commission (the “SEC”) website at https://www.sec.gov.
The Fund’s proxy voting record for the most recent 12-month period ended June 30 is available (1) without charge, upon request, by calling (800) 823-6300 or (2) on the SEC’s website at https://www.sec.gov. Information as of June 30 each year will generally be available by the following August 31.
126 Annual Report
Schedule of Portfolio Holdings
The Fund files the complete schedule of each Portfolio’s holdings with the SEC for the first and third quarters of each fiscal year as an exhibit to its reports on Form N-PORT. The Fund’s Form N-PORT reports are available on the SEC’s website at https://www.sec.gov.
Annual Report 127
Board Consideration of Management Agreements
At meetings of the Board held on June 2, 2020 and June 16, 2020, the Board considered the approval, for an additional annual period, of the Management Agreement between the Fund, on behalf of the Portfolios, and the Investment Manager. The Independent Directors were assisted in their review by independent legal counsel, who advised the Board on relevant legal standards and met with the Independent Directors in executive sessions separate from representatives of the Investment Manager.
Representatives of the Investment Manager discussed with the Board the Investment Manager’s written materials provided in advance of the meetings, including, at the June 16, 2020 meeting, additional information requested by the Independent Directors at the June 2, 2020 meeting.
Services Provided
The Investment Manager’s materials addressed, among other matters, the nature, extent and quality of services that the Investment Manager provides the Fund, including a discussion of the Investment Manager and its clients (of which the Lazard Funds complex of 35 active funds comprised approximately $22 billion of the approximately $193 billion of total assets under the management of the Investment Manager and its global affiliates as of March 31, 2020).
The Board considered the various services provided by the Investment Manager including the Investment Manager’s research, portfolio management and trading capabilities and oversight of day-to-day operations, including supervision of fund accounting and administration-related services and assistance in meeting legal and regulatory requirements, as well as regular reporting to, and support of, the Board. The Investment Manager’s representatives stated that the Investment Manager believes that the Fund
| 2 | The Strategic Insight materials outlined the process for constructing the Expense Peer Groups, as well the Expense Categories, Performance Peer Groups and Performance Categories (all as defined herein). Representatives of the Investment Manager and independent legal counsel had previously discussed with the Board in further detail the methodologies used by Strategic Insight in constructing the Expense Peer Groups, Expense Categories, Performance Peer Groups and Performance Categories, including how the methodologies could affect the results of the comparisons. |
128 Annual Report
and its shareholders continue to be able to obtain significant benefits as a result of the resources and support of the Investment Manager’s global research, portfolio management, trading, operations, risk management, technology and legal and compliance infrastructure. The Board also considered information provided by the Investment Manager regarding its personnel, resources, financial condition and experience; the Fund’s distribution channels and the relationships with various intermediaries; marketing and shareholder servicing activities on behalf of the Portfolios; and Portfolio asset flows and the growth or decline in asset levels. The Board accepted the assertion of representatives of the Investment Manager that the Fund benefits from the services and infrastructure provided by the Investment Manager and that such services and infrastructure are greater than those typically provided to a $22 billion fund complex not managed by a large, global firm such as the Investment Manager.
Comparative Fee, Expense Ratio and Performance Information
Strategic Insight Advisory Fee and Expense Ratio Comparisons. The Board reviewed, for each Portfolio, information prepared by Strategic Insight, an independent provider of investment company data, including, among other information, each Portfolio’s contractual advisory fee (i.e., without giving effect to any fee waivers) and net expense ratio (i.e., after giving effect to the Portfolio’s expense limitation agreed to by the Investment Manager) to those of:
| • | a group of funds not advised by the Investment Manager selected by Strategic Insight as comparable, for expense comparison purposes, to the Portfolio in terms of relevant criteria as appropriate (the “Expense Peer Group”2); and |
| | |
| • | the funds within the broad category of funds to which the Portfolio has been assigned by Morningstar, Inc., an independent third party service that ranks and rates funds (“Morningstar”), with certain exclusions as specified by Strategic Insight (the “Expense Category”). |
Representatives of the Investment Manager discussed the results of the Strategic Insight advisory fee and net expense ratio compar-
Annual Report 129
isons with the Board. For the Emerging Markets Debt Portfolio, the Investment Manager proposed to lower the fee in the Management Agreement by 0.05%, with no diminution in services thereunder, and to lower the current expense limitation by 0.10%. After giving effect to the proposed advisory fee and expense limitation reductions, the results of the Strategic Insight comparisons showed that the advisory fees and net expense ratios of the Portfolios were generally competitive within each Portfolio’s respective Expense Peer Group. The Board considered the comparisons, additional perspectives in information prepared by, and in discussions with, representatives of the Investment Manager and that the Investment Manager continues to voluntarily enter into expense limitation agreements for all of the Portfolios, pursuant to which the Investment Manager was currently waiving advisory fees and/or reimbursing expenses.
Other Accounts Advisory Fee Comparisons. The Board also considered the actual advisory fees paid to the Investment Manager by other accounts of the Investment Manager that are comparable to each Portfolio in terms of investment objectives, strategies and policies, if any (including other investment companies and other pooled investment vehicles, “Other Accounts”). Representatives of the Investment Manager discussed the nature of the Other Accounts and the significant differences in services provided by the Investment Manager to the different types of Other Accounts as compared to the services provided to the Portfolios. The Board considered the relevance of the fee information provided for Other Accounts, in light of the Investment Manager’s discussion of the significant differences in services provided, to evaluate the advisory fees of the relevant Portfolios.
Strategic Insight Performance Comparisons. The Board reviewed information prepared by Strategic Insight including, among other information, each Portfolio’s performance for the one-, three-, five- and ten-year periods ended March 31, 2020, as applicable, compared to performance for the same time periods of:
| • | a group of funds not advised by the Investment Manager selected by Strategic Insight as comparable, for performance |
130 Annual Report
| | comparison purposes, to the Portfolio in terms of relevant criteria as appropriate (the “Performance Peer Group”); |
| | |
| • | the funds within the broad category of funds to which the Portfolio has been assigned by Morningstar (the “Performance Category”); and |
| | |
| • | the Portfolio’s benchmark index. |
When evaluating the performance of each Portfolio, the Board considered Strategic Insight’s performance analysis along with other information provided by the Investment Manager, including additional information regarding performance expectations, as well as additional perspectives in information prepared by, and in discussions with, representatives of the Investment Manager. The Board also received and would continue to receive regular updates and/or additional information from the Investment Manager in respect of Portfolios with relative underperformance or Portfolios which otherwise are not performing in accordance with expectations, as well as any other Portfolios for which the Board requested additional information.
Investment Manager Profitability and Economies of Scale
The Board reviewed information prepared by the Investment Manager for each Portfolio concerning the estimated profitability percentage of the Management Agreement to the Investment Manager and its affiliates for the calendar year ended December 31, 2019 and the Investment Manager’s cost allocation methodology to compute an estimate of each Portfolio’s costs to the Investment Manager. The Investment Manager’s representatives stated that neither the Investment Manager nor its affiliates receive any significant benefits from the Investment Manager acting as investment manager to the Portfolios. The representatives of the Investment Manager reminded the Board that the Investment Manager is continuing to support distribution relationships through direct payments from its or its affiliates’ own resources to third parties in connection with distribution and shareholder servicing and/or administrative and recordkeeping services, and noted that the Fund does not bear any related costs other than the 0.25% 12b-1
Annual Report 131
fee pursuant to the Distribution and Servicing Plan adopted for the Portfolios’ Open Shares.
The profitability percentages were within ranges determined by relevant court cases not to be so disproportionately large that they bore no reasonable relationship to the services rendered. The Board (1) considered the Investment Manager’s estimated profitability with respect to each Portfolio as part of their evaluation of the Portfolio’s fee under the Management Agreement, considered in relation to the mix of services provided by the Investment Manager (including the nature, extent and quality of such services), and (2) evaluated the profitability in light of the relevant circumstances for each Portfolio. Representatives of the Investment Manager and the Board discussed ways economies of scale could be realized and how they could be shared, including the Investment Manager’s reinvestment of profits back into its business, waiving or reducing Portfolio management fees and/or reimbursing expenses, adding discounts to a Portfolio’s management fee schedule as a Portfolio’s assets increase or by instituting management fees at inception that account for future scale. As the assets of each Portfolio were either generally stable or decreasing over the past calendar year, or had not reached a significant size, the potential that the Investment Manager may have realized any material economies of scale was reduced.
Conclusions and Determinations
At the conclusion of these discussions, the Board expressed the opinion that it had been furnished with such information as may reasonably be necessary to make an informed business decision with respect to evaluation of the renewal of the Management Agreement. Based on its discussions and considerations as described above, with the assistance of independent legal counsel and in the exercise of its business judgment, the Board made the following conclusions and determinations.
| • | The Board concluded that the nature, extent and quality of the services provided by the Investment Manager are adequate and appropriate, noting the benefits of the significant services and |
132 Annual Report
| | infrastructure associated with an approximately $193 billion global asset management business. |
| | |
| • | The Board concluded that each Portfolio’s fee paid to the Investment Manager was appropriate under the circumstances and in light of the factors and the totality of the services provided. |
| | |
| • | The Board, after considering the information provided and the totality of the relevant circumstances for each Portfolio, concluded that the investment performance of each Portfolio was acceptable or that, for any Portfolios that were not performing in accordance with expectations, the Board accepted that the Investment Manager was taking steps intended to improve performance and the Board would continue to monitor performance. |
| | |
| • | The Board recognized that economies of scale may be realized, particularly as the assets of the Portfolios increase and determined that it would continue to consider potential material economies of scale. |
In evaluating the Management Agreement, the Board relied on the information described above, in addition to information provided by the Investment Manager throughout the year relating to the operations of the Fund and the investment management and other services provided under the Management Agreement, including information on the investment performance of the Portfolios in comparison to similar mutual funds and benchmark performance indices over various time periods; general market outlook as applicable to the Portfolios; and compliance reports. The Board also relied on its previous knowledge, gained through meetings and other interactions with the Investment Manager, of the Investment Manager and the services provided to the Fund by the Investment Manager. The Board considered these conclusions and determinations in their totality and determined to approve the Fund’s Management Agreement (as proposed to be revised, as applicable) for each Portfolio. In deciding whether to vote to approve the Management Agreement for each Portfolio, each Director may have accorded different weights to different factors so that each Director may have had a different basis for his or her decision.
Annual Report 133
Statement Regarding Liquidity Risk Management Program
The Fund has adopted a liquidity risk management program (the “LRMP”) pursuant to the requirements of Rule 22e-4 under the 1940 Act, which requires registered open-end funds (other than money market funds) to adopt and implement a written liquidity risk management program that is reasonably designed to assess and manage fund liquidity risk. The rule is designed to promote effective liquidity risk management throughout the open-end fund industry, thereby reducing liquidity risk—i.e., the risk that a fund could not meet requests to redeem shares issued by the fund without significant dilution of remaining investors’ interests in the fund.
Pursuant to the requirements of Rule 22e-4, the LRMP is required to include policies and procedures reasonably designed to incorporate the following elements, and the LRMP complies with these requirements: (1) assessment, management and periodic review of liquidity risk; (2) classification of each Portfolio’s investments into one of the four liquidity categories in Rule 22e-4; (3) if the Portfolio does not primarily hold assets that are considered highly liquid investments (cash and other investments reasonably expected to be convertible into cash in current market conditions in three business days or less without the conversion into cash significantly changing the market value of the investment), determination of a “highly liquid investment minimum” (as defined in Rule 22e-4 and in the LRMP, the “HLIM”) and compliance with additional related requirements; (4) prohibition on the acquisition of any “illiquid investment” (as defined in Rule 22e-4) if immediately after the acquisition the Portfolio would have invested more than 15% of its net assets in illiquid investments (or such lower percentage that may have been adopted by a Portfolio); and (5) if the Portfolios reserve the right to engage in redemptions in-kind, establishment of policies and procedures regarding how and when the Portfolios will engage in such redemptions in-kind. There have been no material changes to the LRMP since it was initially approved by the Board.
The Board has approved the Investment Manager to administer the LRMP (the “Program Administrator”). As Program Administrator, the Investment Manager delegates the day-to-day activities required by the LRMP to a Liquidity Committee comprised of
134 Annual Report
various Fund officers and groups within the Investment Manager (the “Liquidity Committee”), and the Liquidity Committee seeks assistance from and works together with other groups within the Investment Manager in effectuating the requirements of the LRMP as necessary. In addition, the Fund has contracted with a third party liquidity assessment vendor to support the classification of Portfolio investments.
Pursuant to the requirements of Rule 22e-4, the Board must review, no less frequently than annually, a written report prepared by the Program Administrator that addresses the operation of the program and assesses its adequacy and effectiveness of implementation, including, if applicable, the operation of the HLIM, and any material changes to the program. The Board received a written report in June 2020 (the “Annual Report”).
The Annual Report states that the Investment Manager, as the Program Administrator, acting primarily through the Liquidity Committee, has assessed the operation of the LRMP and believes that the LRMP is reasonably designed to assess and manage the Portfolios’ liquidity risk and is adequate and effective in its implementation. The Program Administrator and the Liquidity Committee initially determined that each Portfolio primarily holds assets that are highly liquid investments, and the Annual Report states that this determination continues to be maintained so that no Portfolio needs to maintain a HLIM. In addition, the Annual Report states that, since the LRMP was implemented, no Portfolio has breached its limit on illiquid investments.
Annual Report 135
NOTES
The Lazard Funds, Inc.
30 Rockefeller Plaza
New York, New York 10112-6300
Telephone: 800-823-6300
www.lazardassetmanagement.com
Investment Manager
Lazard Asset Management LLC
30 Rockefeller Plaza
New York, New York 10112-6300
Telephone: 800-823-6300
Distributor
Lazard Asset Management Securities LLC
30 Rockefeller Plaza
New York, New York 10112-6300
Custodian
State Street Bank and Trust Company
One Iron Street
Boston, Massachusetts 02210-1641
Transfer Agent and Dividend Disbursing Agent
DST Asset Manager Solutions, Inc.
2000 Crown Colony Drive
Quincy, Massachusetts 02169-0953
Telephone: 617-483-7000
Independent Registered Public Accounting Firm
Deloitte & Touche LLP
30 Rockefeller Plaza
New York, New York 10112-0015
Legal Counsel
Proskauer Rose LLP
Eleven Times Square
New York, New York 10036-8299
www.proskauer.com

 | |
| | |
| | |
| Lazard Asset Management LLC • 30 Rockefeller Plaza • New York, NY 10112 • www.lazardassetmanagement.com | |
| | |
Performance information as of the most recent month end is available online at www.lazardassetmanagement.com. LZDPS026 |  |

Lazard Funds
Annual Report
December 31, 2020
Multi-Asset Funds
Lazard Global Dynamic Multi-Asset Portfolio
Lazard Opportunistic Strategies Portfolio
Lazard Real Assets Portfolio
The Lazard Funds, Inc. Table of Contents
Please consider a Portfolio’s investment objective, risks, charges and expenses carefully before investing. For more complete information about The Lazard Funds, Inc. (the “Fund”), you may obtain a prospectus or a Portfolio’s summary prospectus by calling 800-823-6300, or online, at www.lazardassetmanagement.com. Read the prospectus or the Portfolio’s summary prospectus carefully before you invest. The prospectus and a Portfolio’s summary prospectus contain the investment objective, risks, charges, expenses and other information about the Portfolio, which are not detailed in this report.
Distributed by Lazard Asset Management Securities LLC.
Annual Report 1
The Lazard Funds, Inc. A Message from Lazard (unaudited)
Dear Shareholder,
As 2020 began, the outbreak of a novel coronavirus (“COVID-19”) turned into a fast-spreading pandemic, rattling global markets. Worldwide lockdowns led to a severe equity market sell-off in February and March, as well as a sharp decline in oil markets. By the conclusion of the year, COVID-19 continued to wreak havoc across much of the world, but many global equity markets closed 2020 near all-time highs. Markets generally rose steadily after the selloff on the back of unprecedented support from global central banks and government treasuries and the introduction of several promising vaccines.
In the United States, Democrats won control of the White House and Congress in November elections. The US equity market closed 2020 near an all-time peak, and nominal yields in various US fixed income market segments closed at or near all-time lows, fueled by trillions of dollars in monetary and fiscal stimulus.
COVID-19 also severely debilitated economic activity in the emerging markets, but the recovery in emerging markets equities that began in late March picked up steam in the fourth quarter thanks to vaccine breakthroughs and the US election outcome. As a result, the MSCI Emerging Markets® Index outperformed global developed markets equities in 2020.
In Europe, interest rates have never been as low, and central bank balance sheets have never been as inflated, as they were at year-end. With an agreement now in place for the exit of the United Kingdom from the European Union, the years-long “Brexit” saga may be one less uncertainty the market has to grapple with in the year ahead.
As we write, many countries are facing record levels of new COVID-19 infections, spurring renewed economic lockdowns and increasing the risk that many companies, particularly small businesses, might not make it to the other side of this pandemic. Were that to happen, it could send a negative signal to markets
2 Annual Report
equal and opposite to the positive news of the vaccines toward the end of the last year. Investors face a timing conundrum, but it could well be darkest before the dawn.
Despite these challenges, we are optimistic for 2021 and believe that as the world does eventually return to something like the pre-pandemic days, fundamental analysis and stock selection will be crucial drivers for performance. We are privileged that you have turned to Lazard for your investment needs and value your continued confidence in our investment management capabilities. We continue to strive for the long-term patterns of performance pursued by the various investment strategies employed.
Sincerely,
Lazard Asset Management LLC
Annual Report 3
Lazard Retirement Series, Inc. Investment Overviews (unaudited)
Multi-Asset
As 2020 began, our concern for the developing global health emergency was the new uncertainty it generated, causing immediate, substantial declines in economic activity in China and across Asia. This would potentially wreak havoc among many companies’ supply and distribution chains. We added to defensive positioning across strategies as the World Health Organization declared COVID-19 a pandemic in March, coincident as it was with the spat between Russia and Saudi Arabia that sent oil and the commodity complex severely negative. Prospects for a recession increased dramatically, and the spike in volatility forced many multi-asset strategies into very defensive configurations, including the deployment into cash in some instances.
We began to view markets in the context of three points of a risk-reward triangle: the behavior of the virus; monetary actions to provide liquidity and support for certain market segments; and fiscal actions to support household and business sectors. After peak market volatility in March, portfolios unwound extreme defensive positions to lessen tracking error in a potential recovery. This came faster than expected for risk markets in April, driven largely by US retail investor buying of equities and specifically technology and other companies that were perceived as being “COVID beneficiaries.” Credit spreads also tightened after the Fed took the unprecedented step of extending its quantitative easing buying program to non-investment grade corporate bonds.
Differentiation in regional performance became a feature in the second quarter, as Asia (in particular China,Taiwan and South Korea) appeared to have had a more effective policy response to the virus than other countries, thus avoiding prolonged lockdowns. China was also assisted by an explosion of exports of locally manufactured personal protective equipment to all countries. More value-added electronics exports from North Asia also grew on the back of new equipment sales as workforces isolated and worked from home.
Equity markets suffered volatility in September as volatility increased and retail investors were disappointed that Tesla was not
4 Annual Report
included in the S&P 500 Index. Nervousness ahead of the US election then turned into optimism when a Democratic president was elected and the Democrats effectively took control of the Senate. The announcement of the first successful vaccine a week after the election prompted a seismic factor rotation from momentum to deep value investments as previously out-of-favor industries like transport and hospitality rallied from distressed levels. Multi-asset portfolios layered-in more equity beta and commodities exposure in September and around the US presidential election, due to the increased probability of a rally in cyclical markets and stocks. High yield and emerging markets debt spreads also tightened dramatically. Industrial metals and agricultural commodities rose on China demand and El-Nino-driven supply constraints, respectively, to also finish the year with strong rallies.
Lazard Global Dynamic Multi-Asset Portfolio
For the year ended December 31, 2020, the Lazard Global Dynamic Multi-Asset Portfolio’s Institutional Shares posted a total return of 1.00%, while Open Shares posted a total return of 0.84%, as compared with the 15.90% return for the MSCI World Index and 13.21% return of its blended benchmark, which is a 50/50 blend of the MSCI World Index and Bloomberg Barclays Global Aggregate® Index (the “GDMA Index”).
In terms of asset allocation, the Portfolio’s average overweight in fixed income as opposed to equities, when compared with the GDMA Index, detracted from performance for the year.
Specifically, as a targeted volatility strategy, the sustained high market volatility environment throughout the second quarter forced the strategy to maintain a 60% weighting to fixed income. In addition, a 20% cash allocation that had protected capital well in March was only gradually unwound in April for the same reason, providing a drag on performance as equity markets rallied strongly that month. Quantitative and managed volatility equity strategies also generally underperformed equity benchmarks over the year, in particular during the strong momentum rallies of April and August, and also in the deep value rally of November. The investment
Annual Report 5
process of these diversified strategies is not designed to take positions in stocks with these characteristics.
Stock selection in the materials and health care sectors added value, as did an overweight exposure to the healthcare sector and underweight exposure to energy and financials. By country, stock selection in Australia, Sweden, Switzerland, and Denmark helped performance, as did underweight exposure to France. In contrast, stock selection in the consumer discretionary, communication services, information technology, and real estate sectors hurt performance. Underweight exposure to the information technology and consumer discretionary sectors and overweight exposure to consumer staples also detracted. Country detractors were driven by stock selection in the United States, Japan, Netherlands, Israel, and Canada, as well as by overweight exposure to Canada.
Within fixed income, overweight duration contributions in Australia, Canada, Norway, New Zealand, Chile, and the United States and underweight duration contribution in China and Japan helped. Also contributing were overweight exposures to Canadian Provincials, Australian and New Zealand semi-governments, Norwegian government related bonds and the Portfolio’s addition of US dollar-denominated investment grade corporate bonds during the second and third quarter. An overweight exposure to the information technology sector, open exposures in Australian dollars and Japanese yen and an underweight to the Russian ruble also boosted performance. In contrast, underweight duration contributions in the eurozone and overweight to the Czech Republic and Hungary detracted from performance, as did the Portfolio’s underweight positioning to the euro and overweight to Swiss franc, Czech koruna, Hungarian forint, and Polish zloty.
Lazard Opportunistic Strategies Portfolio
For the year ended December 31, 2020, the Lazard Opportunistic Strategies Portfolio’s Institutional Shares posted a total return of 9.47%, while Open Shares posted a total return of 9.25%, as compared with the 15.90% return for the MSCI World Index and
| [1] | The Global Asset Allocation Blended Index is a blended index constructed by the Portfolio’s Investment Manager, composed 60% MSCI World Index and 40% Barclays Capital US Aggregate Bond® Index, rebalanced quarterly. |
6 Annual Report
14.02% return for the Global Asset Allocation Blended Index.[1] The Portfolio’s investments generally are categorized by the Investment Manager as falling within the following three categories: trending, diversifying assets, and contrarian assets.
Trending investments, which represented 44% of the Portfolio at year end, outperformed both the Global Asset Allocation Blended Index and the MSCI World Index. Positions in US large cap companies, and investments in the technology and healthcare sectors were the largest contributors, while exposures to the emerging markets and industrials sectors detracted during the period.
Diversifying investments, which represented 41% of the Portfolio at the end of the year, underperformed US fixed income, as represented by the Bloomberg Barclays US Aggregate Bond Index and underperformed the Global Asset Allocation Blended Index. Exposure to intermediate-term Treasuries and US consumer staples were most additive to performance, while exposures to intermediate-term corporate bonds detracted.
Contrarian investments, which represented 15% of the Portfolio at year end, underperformed both the Global Asset Allocation Blended Index and the MSCI World Index. Exposure to US large cap value and European equities contributed, while exposure to small and mid-cap value detracted from performance.
Lazard Real Assets Portfolio
For the year ended December 31, 2020, the Lazard Real Assets Portfolio’s Institutional Shares posted a total return of 0.61%, while Open Shares posted a total return of 0.33%, as compared with the -4.19% return for the Real Assets Index and 15.90% return for the MSCI World Index.
Stocks in the ‘Pricing Power Equity’ asset class, which are companies that we believe can pass through input costs directly to customers, detracted from performance. Favorable contributions from consumer staples and healthcare sectors were offset by weaker performances from the industrial, consumer discretionary, and financial sectors.
Annual Report 7
Listed infrastructure stocks contributed positively to the Portfolio. US freight railroads CSX and Norfolk Southern were among the top contributors. By contrast, Italian toll road and airport operator Atlantia, along with German airport operator Fraport, hurt performance as the pandemic impacted travel and transportation.
Real estate equities had a slightly negative impact in the aggregate. Retail and hotel REITs were negatively impacted by the pandemic, while warehouse and storage REITs were beneficiaries.
Global inflation-linked bonds contributed positively to performance. Overweight exposure to bonds in New Zealand and Canada added value, as did currency exposure to the Australian and New Zealand dollar and the euro. In contrast, duration underweight on the USD curve and underweight country exposure to Germany and the UK hurt performance.
Commodities exposure slightly added value during the period. Exposure to gold, silver, and soybeans contributed positively. On the other hand, exposure to crude oil held back returns. Commodity-related equities hurt performance in aggregate. Canadian minerTeck Resources and US oil refiner Marathon Petroleum were among the largest detractors, while US-based agribusiness Bunge was among the top contributors within commodity-related equities.
The Portfolio uses forward currency contracts opportunistically and for hedging purposes. The impact of these instruments was negative during the period. Within commodities, the Portfolio uses futures and total return swaps to gain exposure to these assets. The combined impact of these instruments was slightly negative during the period.
8 Annual Report
The Lazard Funds, Inc. Performance Overviews (unaudited)
Lazard Global Dynamic Multi-Asset Portfolio
Comparison of Changes in Value of $10,000 Investment in the Institutional Shares of Lazard Global Dynamic Multi-Asset Portfolio, the MSCI® World Index and the GDMA Index*

Average Annual Total Returns*
Periods Ended December 31, 2020
| | | One | | Since | |
| | | Year | | Inception | † |
| Institutional Shares** | | | 1.00 | % | | | 6.77 | % | |
| Open Shares** | | | 0.84 | % | | | 6.49 | % | |
| MSCI World Index | | | 15.90 | % | | | 12.88 | % | |
| GDMA Index | | | 13.21 | % | | | 8.61 | % | |
| | |
| † | The inception date for the Portfolio was May 27, 2016. |
Lazard Opportunistic Strategies Portfolio
Comparison of Changes in Value of $10,000 Investment in the Institutional Shares of Lazard Opportunistic Strategies Portfolio, the MSCI World Index and the Global Asset Allocation Blended Index*

Average Annual Total Returns*
Periods Ended December 31, 2020
| | | One | | Five | | Ten | |
| | | Year | | Years | | Years | |
| Institutional Shares** | | | 9.47 | % | | | 6.42 | % | | | 4.97 | % | |
| Open Shares** | | | 9.25 | % | | | 6.15 | % | | | 4.61 | % | |
| MSCI World Index | | | 15.90 | % | | | 12.19 | % | | | 9.87 | % | |
| Global Asset Allocation Blended Index | | | 14.02 | % | | | 9.47 | % | | | 7.78 | % | |
Annual Report 9
Lazard Real Assets Portfolio
Comparison of Changes in Value of $10,000 Investment in the Institutional Shares of Lazard Real Assets Portfolio, the MSCI World Index, the Real Assets Index*, the Real Assets Custom Index* and the Real Assets Linked Custom Index*

Average Annual Total Returns*
Periods Ended December 31, 2020
| | | One | | Since | | |
| | | Year | | Inception | † | |
| Institutional Shares** | | | 0.61 | % | | | 4.36% | | |
| Open Shares** | | | 0.33 | % | | | 4.04% | | |
| MSCI World Index | | | 15.90 | % | | | 13.40% | | |
| | | | | | | | (Institutional | | |
| | | | | | | | Shares) | | |
| | | | | | | | 13.05% | | |
| | | | | | | | (Open Shares) | | |
| Real Assets Index | | | –4.19 | % | | | 4.52% | | |
| Real Assets Custom Index | | | 2.25 | % | | | 6.35% | | |
| | | | | | | | (Institutional | | |
| | | | | | | | Shares) | | |
| | | | | | | | 6.27% | | |
| | | | | | | | (Open Shares) | | |
| Real Assets Linked Custom Index | | | 1.92 | % | | | 6.26% | | |
| | | | | | | | (Institutional | | |
| | | | | | | | Shares) | | |
| | | | | | | | 6.18% | | |
| | | | | | | | (Open Shares) | | |
| | |
| † | The inception date for the Institutional Shares was December 30, 2016 and for the Open Shares was January 9, 2017. |
Notes to Performance Overviews:
| * | Total returns reflect reinvestment of all dividends and distributions, if any. Certain expenses of the Portfolio may have been waived or reimbursed by Lazard Asset Management LLC, the Fund’s investment manager (the “Investment Manager”), State Street Bank and Trust Company, the Fund’s administrator (“State Street”), or DST Asset Manager Solutions, Inc., the Fund’s transfer agent and dividend disbursing agent (“DST”); without such waiver/reimbursement of expenses, the Portfolio’s returns would have been lower. |
10 Annual Report
Performance results do not include adjustments made for financial reporting purposes in accordance with US Generally Accepted Accounting Principles (“GAAP”), if any, and may differ from amounts reported in the financial highlights.
The performance quoted represents past performance. Current performance may be lower or higher than the performance quoted. Past performance is not indicative, or a guarantee, of future results; the investment return and principal value of the Portfolio will fluctuate, so that Portfolio shares, when redeemed, may be worth more or less than their original cost. Within the longer periods illustrated, there may have been short-term fluctuations, counter to the overall trend of investment results, and no single period of any length may be taken as typical of what may be expected in future periods. The graph and table above do not reflect the deduction of taxes that a shareholder would pay on the Portfolio’s distributions or the redemption of Portfolio shares.
The performance data of the indices have been prepared from sources and data that the Investment Manager believes to be reliable, but no representation is made as to their accuracy. The indices are unmanaged, have no fees or costs and are not available for investment.
The MSCI World Index is a free-float-adjusted market capitalization index that is designed to measure global developed markets equity performance. The MSCI World Index consists of 23 developed markets country indices.
The GDMA Index is a blended index constructed by the Investment Manager that is comprised of 50% MSCI World Index and 50% Bloomberg Barclays Global Aggregate® Index and is rebalanced monthly. The Bloomberg Barclays Global Aggregate Index provides a broad-based measure of global investment-grade fixed-income debt markets, including government-related debt, corporate debt, securitized debt and global Treasury.
The Global Asset Allocation Blended Index is a blended index constructed by the Investment Manager that is comprised of 60% MSCI World Index and 40% Bloomberg Barclays US Aggregate Index and is rebalanced quarterly. The Bloomberg Barclays US Aggregate Index covers the investment-grade, US dollar-denominated, fixed-rate taxable bond market, including Treasuries, government-related and corporate securities, mortgage-backed securities, asset-backed securities, and commercial mortgage-backed securities, with maturities of no less than one year.
The Real Assets Index is an index constructed by the Investment Manager that is comprised of 33.3% MSCI World Core Infrastructure USD Hedged Index, 33.3% MSCI ACWI IMI Core Real Estate Index, and 33.3% Bloomberg Barclays Commodity Total Return Index. The Real Assets Index was constructed by the Investment Manager for comparison to the performance of the Lazard Real Assets Portfolio pursuant to its investment strategy effective September 1, 2020. The Real Assets Index will replace the Real Assets Custom Index, which was created by the Investment Manager for comparison to the Portfolio’s performance pursuant to its investment strategy prior to September 1, 2020.
The Real Assets Custom Index is an unmanaged index created by the Investment Manager, and is comprised of 20% MSCI World Index, 20% MSCI World Core Infrastructure USD Hedged Index (the “Infrastructure Index”), 20% MSCI ACWI IMI Core Real Estate Index, 20% Bloomberg Commodity Total Return Index and 20% Bloomberg Barclays World Government Inflation-Linked 1–10 Year USD Hedged Index. The Infrastructure Index captures large and mid-cap securities across the 23 developed
Annual Report 11
market countries of the MSCI World Index and is designed to represent the performance of listed companies within the developed markets that are engaged in core industrial infrastructure activities. Note that the Investment Manager invests in a range of companies globally, not specifically developed markets countries. The MSCI ACWI IMI Core Real Estate Index is a free float-adjusted market capitalization index that consists of large, mid and small-cap stocks across 23 developed markets and 26 emerging markets countries engaged in the ownership, development and management of specific core property type real estate. The index excludes companies, such as real estate services and real estate financing companies, that do not own properties. The Bloomberg Commodity Total Return index is composed of futures contracts and reflects the returns on a fully collateralized investment in the Bloomberg Commodity Indices (the “BCOM”). This combines the returns of the BCOM with the returns on cash collateral invested in 13 week (3 Month) U.S. Treasury Bills. The Bloomberg Barclays World Government Inflation-Linked Bond 1–10 Year Index measures the performance of investment grade, government inflation-linked debt from 12 different developed market countries.
The Real Assets Linked Custom Index shown in the table is an unmanaged index created by the Investment Manager, which links the performance of the Real Assets Custom Index for periods through August 31, 2020 (after which the Portfolio’s investment strategy changed) and the Real Assets Index for periods thereafter.
| ** | The performance of Institutional Shares and Open Shares may vary, primarily based on the differences in fees borne by shareholders investing in different classes. |
12 Annual Report
The Lazard Funds, Inc.
Information About Your Portfolio’s Expenses (unaudited)
Expense Example
As a shareholder in a Portfolio, you incur ongoing costs, including management fees, distribution and service (12b-1) fees (Open Shares only), and other expenses. This Example is intended to help you understand your ongoing costs (in dollars) of investing in a Portfolio and to compare these costs with the ongoing costs of investing in other mutual funds. The Example is based on an investment of $1,000 invested at the beginning of the six month period from July 1, 2020 through December 31, 2020 and held for the entire period.
Actual Expenses
For each share class of the Portfolios, the first line of the accompanying table provides information about actual account values and actual expenses. You may use the information in this line, together with the amount you invested, to estimate the expenses that you paid over the period. Simply divide your account value by $1,000 (for example, an $8,600 account value divided by $1,000=8.6), then multiply the result by the number in the first line under the heading entitled “Expenses Paid During Period” to estimate the expenses you paid on your account during this period.
Hypothetical Example for Comparison Purposes
For each share class of the Portfolios, the second line of the accompanying table provides information about hypothetical account values and hypothetical expenses based on the class’ actual expense ratio and an assumed rate of return of 5% per year before expenses, which is not the Portfolio’s actual return. The hypothetical account values and expenses may not be used to estimate the actual ending account balance or expenses you paid for the period. You may use this information to compare the ongoing costs of investing in the Portfolio and other mutual funds. To do so, compare this 5% hypothetical example with the 5% hypothetical examples that appear in the shareholder reports of other mutual funds.
Annual Report 13
| Portfolio | | Beginning
Account Value
7/1/20 | | | Ending
Account
Value
12/31/20 | | | Expenses
Paid During
Period*
7/1/20 -
12/31/20 | | | Annualized
Expense Ratio
During Period
7/1/20 -
12/31/20 | |
| | | | | | | | | | | | | | | | | | |
| Global Dynamic Multi-Asset | | | | | | | | | | | | | | | |
| Institutional Shares | | | | | | | | | | | | | | | | | |
| Actual | | $ | 1,000.00 | | | $ | 1,123.60 | | | $ | 4.80 | | | | | 0.90% | |
| Hypothetical (5% Return Before Expenses) | | $ | 1,000.00 | | | $ | 1,020.61 | | | $ | 4.57 | | | | | 0.90% | |
| Open Shares | | | | | | | | | | | | | | | | | |
| Actual | | $ | 1,000.00 | | | $ | 1,123.00 | | | $ | 6.14 | | | | | 1.15% | |
| Hypothetical (5% Return Before Expenses) | | $ | 1,000.00 | | | $ | 1,019.36 | | | $ | 5.84 | | | | | 1.15% | |
| | | | | | | | | | | | | | | | | | |
| Opportunistic Strategies† | | | | | | | | | | | | | | | | | |
| Institutional Shares | | | | | | | | | | | | | | | | | |
| Actual | | $ | 1,000.00 | | | $ | 1,094.70 | | | $ | 5.42 | | | | | 1.03% | |
| Hypothetical (5% Return Before Expenses) | | $ | 1,000.00 | | | $ | 1,019.96 | | | $ | 5.23 | | | | | 1.03% | |
| Open Shares | | | | | | | | | | | | | | | | | |
| Actual | | $ | 1,000.00 | | | $ | 1,094.70 | | | $ | 6.74 | | | | | 1.28% | |
| Hypothetical (5% Return Before Expenses) | | $ | 1,000.00 | | | $ | 1,018.70 | | | $ | 6.50 | | | | | 1.28% | |
| | | | | | | | | | | | | | | | | | |
| Real Assets | | | | | | | | | | | | | | | | | |
| Institutional Shares | | | | | | | | | | | | | | | | | |
| Actual | | $ | 1,000.00 | | | $ | 1,106.50 | | | $ | 4.39 | | | | | 0.83% | |
| Hypothetical (5% Return Before Expenses) | | $ | 1,000.00 | | | $ | 1,020.96 | | | $ | 4.22 | | | | | 0.83% | |
| Open Shares | | | | | | | | | | | | | | | | | |
| Actual | | $ | 1,000.00 | | | $ | 1,105.00 | | | $ | 5.71 | | | | | 1.08% | |
| Hypothetical (5% Return Before Expenses) | | $ | 1,000.00 | | | $ | 1,019.71 | | | $ | 5.48 | | | | | 1.08% | |
| * | Expenses are equal to the annualized expense ratio, net of expenses waivers and reimbursements, of each share class multiplied by the average account value over the period, multiplied by 184/366 (to reflect one-half year period). |
| † | The expense ratios include broker expense and dividend expense on securities sold short. |
14 Annual Report
The Lazard Funds, Inc.
Portfolio Holdings Presented by Asset Class/Sector December 31, 2020
| Asset Class/Sector* | | Lazard
Global
Dynamic
Multi-Asset
Portfolio | | | Lazard
Real Assets
Portfolio | |
| | | | | | | |
| Equity | | | | | | |
| Communication Services | | | 6.6 | % | | | 1.5 | % |
| Consumer Discretionary | | | 10.8 | | | | 1.0 | |
| Consumer Staples | | | 8.0 | | | | 0.4 | |
| Energy | | | 0.9 | | | | — | |
| Financials | | | 10.5 | | | | — | |
| Health Care | | | 9.0 | | | | — | |
| Industrials | | | 8.2 | | | | 15.4 | |
| Information Technology | | | 12.2 | | | | — | |
| Materials | | | 2.0 | | | | 1.4 | |
| Real Estate | | | 1.3 | | | | 31.8 | |
| Utilities | | | 1.2 | | | | 17.7 | |
| Exchange Traded Funds | | | — | | | | 5.9 | |
| Sovereign Debt | | | 27.5 | | | | — | |
| US Municipal Bonds | | | 0.7 | | | | — | |
| US Treasury Securities | | | 0.5 | | | | — | |
| Short-Term Investments | | | 0.6 | | | | 24.9 | |
| Total Investments | | | 100.0 | % | | | 100.0 | % |
| Asset Class/Sector* | | Lazard
Opportunistic
Strategies
Portfolio | | |
| | | | | | |
| Equity† | | | | | |
| Communication Services | | | 3.8 | % | |
| Consumer Discretionary | | | 4.9 | | |
| Consumer Staples | | | 7.4 | | |
| Energy | | | 1.0 | | |
| Financials | | | 5.3 | | |
| Health Care | | | 11.5 | | |
| Industrials | | | 10.3 | | |
| Information Technology | | | 15.2 | | |
| Materials | | | 1.7 | | |
| Real Estate | | | 1.1 | | |
| Utilities | | | 1.5 | | |
| Fixed Income | | | 30.1 | | |
| Short-Term Investments | | | 6.2 | | |
| Total Investments | | | 100.0 | % | |
| * | Represents percentage of total investments. |
| † | Equity sector breakdown is based upon the underlying holdings of exchange-traded funds held by the Portfolio. |
Annual Report 15
The Lazard Funds, Inc. Portfolios of Investments
December 31, 2020
| | | | | | | |
| Description | | Shares | | | Fair
Value | |
| | | | | | | |
| Lazard Global Dynamic Multi-Asset Portfolio | | | | | | | | |
| | | | | | | | | |
| Common Stocks | 48.2% | | | | | | | | |
| | | | | | | | | |
| Australia | 0.9% | | | | | | | | |
| AGL Energy, Ltd. | | | 2,587 | | | $ | 23,853 | |
| Ansell, Ltd. | | | 367 | | | | 9,859 | |
| Charter Hall Group REIT | | | 3,088 | | | | 35,049 | |
| CSL, Ltd. | | | 52 | | | | 11,362 | |
| Fortescue Metals Group, Ltd. | | | 11,590 | | | | 209,551 | |
| Goodman Group REIT | | | 2,026 | | | | 29,554 | |
| Nine Entertainment Co. Holdings, Ltd. | | | 28,647 | | | | 51,281 | |
| Santos, Ltd. | | | 7,102 | | | | 34,347 | |
| Stockland REIT | | | 26,988 | | | | 87,055 | |
| | | | | | | | 491,911 | |
| Belgium | 0.0% | | | | | | | | |
| Etablissements Franz Colruyt NV | | | 210 | | | | 12,442 | |
| Telenet Group Holding NV | | | 249 | | | | 10,681 | |
| | | | | | | | 23,123 | |
| Canada | 1.7% | | | | | | | | |
| CAE, Inc. | | | 9,188 | | | | 254,875 | |
| Canadian National Railway Co. | | | 1,701 | | | | 186,855 | |
| Constellation Software, Inc. | | | 9 | | | | 11,687 | |
| Dollarama, Inc. | | | 796 | | | | 32,443 | |
| Empire Co., Ltd., Class A | | | 782 | | | | 21,373 | |
| George Weston, Ltd. | | | 108 | | | | 8,067 | |
| Linamar Corp. | | | 1,537 | | | | 81,408 | |
| Magna International, Inc. | | | 909 | | | | 64,349 | |
| Quebecor, Inc., Class B | | | 1,242 | | | | 31,965 | |
| Rogers Communications, Inc., Class B | | | 663 | | | | 30,866 | |
| TFI International, Inc. | | | 1,783 | | | | 91,790 | |
| The Toronto-Dominion Bank | | | 3,006 | | | | 169,599 | |
| Topicus.com, Inc. (*) | | | 16 | | | | 60 | |
| | | | | | | | 985,337 | |
| Denmark | 0.4% | | | | | | | | |
| Coloplast A/S, Class B | | | 247 | | | | 37,732 | |
| Novo Nordisk A/S, Class B | | | 809 | | | | 56,586 | |
| Vestas Wind Systems AS ADR | | | 1,993 | | | | 155,913 | |
| | | | | | | | 250,231 | |
The accompanying notes are an integral part of these financial statements.
16 Annual Report
| | | | | | | |
| Description | | Shares | | | Fair
Value | |
| | | | | | | |
| Lazard Global Dynamic Multi-Asset Portfolio (continued) | | | | | | | | |
| | | | | | | | | |
| Finland | 0.2% | | | | | | | | |
| Elisa Oyj | | | 196 | | | $ | 10,699 | |
| Neste Oyj | | | 233 | | | | 16,832 | |
| Valmet Oyj | | | 2,396 | | | | 68,499 | |
| | | | | | | | 96,030 | |
| France | 1.2% | | | | | | | | |
| Carrefour SA | | | 157 | | | | 2,692 | |
| Cie de Saint-Gobain (*) | | | 1,176 | | | | 53,923 | |
| Cie Generale des Etablissements Michelin SCA | | | 561 | | | | $71,998 | |
| LVMH Moet Hennessy Louis Vuitton SA ADR | | | 1,156 | | | | 144,188 | |
| Orange SA | | | 1,947 | | | | 23,172 | |
| Pernod Ricard SA ADR | | | 3,574 | | | | 137,063 | |
| Peugeot SA (*) | | | 890 | | | | 24,357 | |
| Schneider Electric SE | | | 1,046 | | | | 151,299 | |
| Societe Generale SA (*) | | | 2,864 | | | | 59,664 | |
| Veolia Environnement SA | | | 1,234 | | | | 30,190 | |
| | | | | | | | 698,546 | |
| Germany | 0.9% | | | | | | | | |
| Daimler AG | | | 174 | | | | 12,286 | |
| Deutsche Bank AG (*) | | | 5,791 | | | | 63,047 | |
| Merck KGaA Sponsored ADR | | | 3,982 | | | | 136,861 | |
| Symrise AG ADR | | | 4,202 | | | | 139,780 | |
| TeamViewer AG ADR (*) | | | 5,503 | | | | 152,708 | |
| | | | | | | | 504,682 | |
| Hong Kong | 0.6% | | | | | | | | |
| AIA Group, Ltd. Sponsored ADR | | | 5,245 | | | | 257,687 | |
| CK Hutchison Holdings, Ltd. | | | 4,000 | | | | 27,933 | |
| CLP Holdings, Ltd. | | | 1,500 | | | | 13,886 | |
| Hysan Development Co., Ltd. | | | 3,000 | | | | 11,034 | |
| Jardine Matheson Holdings, Ltd. | | | 200 | | | | 11,201 | |
| Sun Hung Kai Properties, Ltd. | | | 3,000 | | | | 38,731 | |
| | | | | | | | 360,472 | |
| Israel | 0.0% | | | | | | | | |
| Bezeq The Israeli Telecommunication Corp., Ltd. (*) | | | 6,013 | | | | 6,039 | |
| Plus500, Ltd. | | | 486 | | | | 9,640 | |
| | | | | | | | 15,679 | |
The accompanying notes are an integral part of these financial statements.
Annual Report 17
| | | | | | | |
| Description | | Shares | | | Fair
Value | |
| | | | | | | |
| Lazard Global Dynamic Multi-Asset Portfolio (continued) | | | | | | | | |
| | | | | | | | | |
| Japan | 3.9% | | | | | | | �� | |
| AGC, Inc. | | | 300 | | | $ | 10,477 | |
| Ajinomoto Co., Inc. | | | 1,100 | | | | 24,928 | |
| Chubu Electric Power Co., Inc. | | | 1,400 | | | | 16,857 | |
| Credit Saison Co., Ltd. | | | 4,300 | | | | 49,936 | |
| Dai-ichi Life Holdings, Inc. | | | 4,400 | | | | 66,836 | |
| Daito Trust Construction Co., Ltd. | | | 155 | | | | 14,497 | |
| Daiwa Securities Group, Inc. | | | 4,900 | | | | 22,348 | |
| DCM Holdings Co., Ltd. | | | 2,100 | | | | 23,938 | |
| Dip Corp. | | | 800 | | | | 21,409 | |
| East Japan Railway Co. | | | 500 | | | | 33,470 | |
| Electric Power Development Co., Ltd. | | | 4,500 | | | | 62,406 | |
| ENEOS Holdings, Inc. | | | 6,900 | | | | 24,806 | |
| Fuji Media Holdings, Inc. | | | 700 | | | | 7,472 | |
| FUJIFILM Holdings Corp. | | | 200 | | | | 10,548 | |
| Hokkaido Electric Power Co., Inc. | | | 9,700 | | | | 35,285 | |
| Hokuriku Electric Power Co. | | | 4,200 | | | | 27,571 | |
| Inpex Corp. | | | 8,500 | | | | 45,934 | |
| ITOCHU Corp. | | | 600 | | | | 17,281 | |
| Japan Logistics Fund, Inc. REIT | | | 6 | | | | 17,695 | |
| Japan Petroleum Exploration Co., Ltd. | | | 1,400 | | | | 25,454 | |
| Japan Post Bank Co., Ltd. | | | 4,600 | | | | 38,001 | |
| Japan Post Holdings Co., Ltd. | | | 2,200 | | | | 17,139 | |
| K’s Holdings Corp. | | | 800 | | | | 11,127 | |
| KDDI Corp. | | | 1,400 | | | | 41,576 | |
| Kureha Corp. | | | 300 | | | | 21,171 | |
| Kyudenko Corp. | | | 300 | | | | 9,688 | |
| McDonald’s Holdings Co. Japan, Ltd. | | | 800 | | | | 38,742 | |
| Mizuho Financial Group, Inc. | | | 15,980 | | | | 203,699 | |
| MS&AD Insurance Group Holdings, Inc. | | | 700 | | | | 21,344 | |
| NEC Corp. | | | 200 | | | | 10,709 | |
| Nintendo Co., Ltd. ADR | | | 3,028 | | | | 243,815 | |
| Nippon Yusen KK | | | 1,900 | | | | 44,327 | |
| Nishi-Nippon Financial Holdings, Inc. | | | 3,700 | | | | 23,854 | |
| Nitto Denko Corp. | | | 500 | | | | 44,897 | |
| Nomura Real Estate Holdings, Inc. | | | 3,800 | | | | 84,526 | |
The accompanying notes are an integral part of these financial statements.
18 Annual Report
| | | | | | | |
| Description | | Shares | | | Fair
Value | |
| | | | | | | |
| Lazard Global Dynamic Multi-Asset Portfolio (continued) | | | | | | | | |
| | | | | | | | | |
| Obayashi Corp. | | | 1,200 | | | $ | 10,395 | |
| Ono Pharmaceutical Co., Ltd. | | | 1,100 | | | | 33,151 | |
| Osaka Gas Co., Ltd. | | | 1,200 | | | | 24,582 | |
| Rengo Co., Ltd. | | | 1,200 | | | | 10,052 | |
| Sankyo Co., Ltd. | | | 400 | | | | 10,822 | |
| Secom Co., Ltd. | | | 200 | | | | 18,466 | |
| Sekisui House, Ltd. | | | 1,300 | | | | 26,486 | |
| Seven & I Holdings Co., Ltd. | | | 4,400 | | | | 156,251 | |
| Shikoku Electric Power Co., Inc. | | | 4,600 | | | | 30,116 | |
| Shimano, Inc. ADR | | | 6,413 | | | | 150,897 | |
| Softbank Corp. | | | 2,100 | | | | 26,327 | |
| Sumitomo Mitsui Trust Holdings, Inc. | | | 300 | | | | 9,302 | |
| Sumitomo Osaka Cement Co., Ltd. | | | 900 | | | | 26,417 | |
| Sumitomo Realty & Development Co., Ltd. | | | 900 | | | | 27,809 | |
| Taiheiyo Cement Corp. | | | 2,200 | | | | 55,349 | |
| Teijin, Ltd. | | | 700 | | | | 13,199 | |
| The Chiba Bank, Ltd. | | | 2,100 | | | | 11,581 | |
| The Gunma Bank, Ltd. | | | 10,100 | | | | 31,329 | |
| The Hachijuni Bank, Ltd. | | | 3,300 | | | | 11,047 | |
| The Kansai Electric Power Co., Inc. | | | 4,700 | | | | 44,692 | |
| The Shizuoka Bank, Ltd. | | | 1,500 | | | | 11,049 | |
| Tohoku Electric Power Co., Inc. | | | 8,500 | | | | 70,445 | |
| Trend Micro, Inc. (*) | | | 200 | | | | 11,514 | |
| Yamaha Motor Co., Ltd. | | | 1,200 | | | | 24,538 | |
| | | | | | | | 2,259,579 | |
| Macau | 0.3% | | | | | | | | |
| Sands China, Ltd. ADR | | | 3,713 | | | | 161,998 | |
| | | | | | | | | |
| Netherlands | 1.1% | | | | | | | | |
| Flow Traders | | | 435 | | | | 14,380 | |
| Koninklijke Ahold Delhaize NV | | | 1,307 | | | | 36,910 | |
| Koninklijke KPN NV | | | 4,177 | | | | 12,664 | |
| NN Group NV | | | 916 | | | | 40,073 | |
| NXP Semiconductors NV | | | 1,110 | | | | 176,501 | |
| Wolters Kluwer NV Sponsored ADR | | | 4,276 | | | | 358,927 | |
| | | | | | | | 639,455 | |
The accompanying notes are an integral part of these financial statements.
Annual Report 19
| | | | | | | |
| Description | | Shares | | | Fair
Value | |
| | | | | | | |
| Lazard Global Dynamic Multi-Asset Portfolio (continued) | | | | | | | | |
| | | | | | | | | |
| New Zealand | 0.0% | | | | | | | | |
| Fisher & Paykel Healthcare Corp., Ltd. Class C | | | 1,061 | | | $ | 25,196 | |
| | | | | | | | | |
| Norway | 0.1% | | | | | | | | |
| Orkla ASA | | | 5,657 | | | | 57,394 | |
| Telenor ASA | | | 735 | | | | 12,448 | |
| Yara International ASA | | | 238 | | | | 9,880 | |
| | | | | | | | 79,722 | |
| Singapore | 0.1% | | | | | | | | |
| AEM Holdings, Ltd. | | | 15,400 | | | | 40,364 | |
| Singapore Exchange, Ltd. | | | 3,300 | | | | 23,226 | |
| | | | | | | | 63,590 | |
| Spain | 0.3% | | | | | | | | |
| Corporacion Financiera Alba SA | | | 66 | | | | 3,142 | |
| Iberdrola SA | | | 1,752 | | | | 25,056 | |
| Industria de Diseno Textil SA ADR | | | 8,288 | | | | 132,940 | |
| | | | | | | | 161,138 | |
| Sweden | 1.1% | | | | | | | | |
| Assa Abloy AB ADR | | | 9,660 | | | | 118,818 | |
| Axfood AB | | | 969 | | | | 22,586 | |
| Epiroc AB ADR | | | 13,588 | | | | 247,030 | |
| Hexagon AB ADR | | | 2,501 | | | | 226,716 | |
| Husqvarna AB, B Shares | | | 879 | | | | 11,371 | |
| Lundin Energy AB | | | 904 | | | | 24,411 | |
| Swedish Match AB | | | 172 | | | | 13,361 | |
| | | | | | | | 664,293 | |
| Switzerland | 0.8% | | | | | | | | |
| ABB, Ltd. Sponsored ADR | | | 6,527 | | | | 182,495 | |
| Credit Suisse Group AG | | | 7,969 | | | | 102,518 | |
| Novartis AG | | | 231 | | | | 21,818 | |
| Roche Holding AG | | | 200 | | | | 69,782 | |
| Swisscom AG | | | 55 | | | | 29,628 | |
| Tecan Group AG | | | 41 | | | | 20,132 | |
| UBS Group AG | | | 660 | | | | 9,231 | |
| | | | | | | | 435,604 | |
The accompanying notes are an integral part of these financial statements.
20 Annual Report
| | | | | | | |
| Description | | Shares | | | Fair
Value | |
| | | | | | | |
| Lazard Global Dynamic Multi-Asset Portfolio (continued) | | | | | | | | |
| | | | | | | | | |
| United Kingdom | 3.5% | | | | | | | | |
| Barclays PLC (*) | | | 31,156 | | | $ | 62,530 | |
| Coca-Cola European Partners PLC | | | 3,123 | | | | 155,619 | |
| Diageo PLC Sponsored ADR | | | 2,053 | | | | 326,037 | |
| GlaxoSmithKline PLC | | | 699 | | | | 12,808 | |
| J Sainsbury PLC | | | 13,513 | | | | 41,687 | |
| John Wood Group PLC (*) | | | 5,635 | | | | 23,924 | |
| National Grid PLC | | | 1,703 | | | | 20,284 | |
| Prudential PLC ADR | | | 6,039 | | | | 223,020 | |
| RELX PLC Sponsored ADR | | | 9,650 | | | | 237,969 | |
| Rio Tinto PLC Sponsored ADR | | | 1,832 | | | | 137,803 | |
| Rio Tinto, Ltd. | | | 266 | | | | 23,364 | |
| Standard Chartered PLC (*) | | | 24,425 | | | | 156,621 | |
| Tesco PLC Sponsored ADR | | | 27,395 | | | | 264,907 | |
| Unilever PLC Sponsored ADR | | | 5,295 | | | | 319,606 | |
| Vodafone Group PLC | | | 10,031 | | | | 16,508 | |
| | | | | | | | 2,022,687 | |
| United States | 31.1% | | | | | | | | |
| 3M Co. | | | 72 | | | | 12,585 | |
| AbbVie, Inc. | | | 1,199 | | | | 128,473 | |
| Accenture PLC, Class A | | | 1,422 | | | | 371,441 | |
| Activision Blizzard, Inc. | | | 118 | | | | 10,956 | |
| Adobe, Inc. (*) | | | 192 | | | | 96,023 | |
| Advanced Micro Devices, Inc. (*) | | | 423 | | | | 38,793 | |
| AGCO Corp. | | | 532 | | | | 54,844 | |
| Agilent Technologies, Inc. | | | 100 | | | | 11,849 | |
| Align Technology, Inc. (*) | | | 52 | | | | 27,788 | |
| Allegion PLC | | | 214 | | | | 24,905 | |
| Ally Financial, Inc. | | | 1,026 | | | | 36,587 | |
| Alphabet, Inc., Class A (*) | | | 225 | | | | 394,344 | |
| Alphabet, Inc., Class C (*) | | | 80 | | | | 140,150 | |
| Altria Group, Inc. | | | 308 | | | | 12,628 | |
| Amazon.com, Inc. (*) | | | 167 | | | | 543,907 | |
| Amdocs, Ltd. | | | 218 | | | | 15,463 | |
| American Tower Corp. REIT | | | 38 | | | | 8,529 | |
| American Water Works Co., Inc. | | | 64 | | | | 9,822 | |
The accompanying notes are an integral part of these financial statements.
Annual Report 21
| | | | | | | |
| Description | | Shares | | | Fair
Value | |
| | | | | | | |
| Lazard Global Dynamic Multi-Asset Portfolio (continued) | | | | | | | | |
| | | | | | | | | |
| AmerisourceBergen Corp. | | | 2,596 | | | $ | 253,785 | |
| Anthem, Inc. | | | 41 | | | | 13,165 | |
| Aon PLC, Class A | | | 1,561 | | | | 329,792 | |
| Apache Corp. | | | 2,170 | | | | 30,792 | |
| Apple, Inc. | | | 6,890 | | | | 914,234 | |
| Applied Materials, Inc. | | | 1,102 | | | | 95,103 | |
| AptarGroup, Inc. | | | 232 | | | | 31,758 | |
| AT&T, Inc. | | | 615 | | | | 17,687 | |
| Atmos Energy Corp. | | | 95 | | | | $9,066 | |
| AutoZone, Inc. (*) | | | 8 | | | | 9,484 | |
| Bank of America Corp. | | | 2,479 | | | | 75,139 | |
| Best Buy Co., Inc. | | | 394 | | | | 39,317 | |
| Booz Allen Hamilton Holding Corp. | | | 448 | | | | 39,057 | |
| Boston Scientific Corp. (*) | | | 4,460 | | | | 160,337 | |
| Bristol-Myers Squibb Co. | | | 144 | | | | 8,932 | |
| Broadridge Financial Solutions, Inc. | | | 67 | | | | 10,264 | |
| Cabot Oil & Gas Corp. | | | 1,130 | | | | 18,396 | |
| Cadence Design Systems, Inc. (*) | | | 499 | | | | 68,079 | |
| California Water Service Group | | | 188 | | | | 10,158 | |
| Campbell Soup Co. | | | 323 | | | | 15,617 | |
| Cardinal Health, Inc. | | | 1,324 | | | | 70,913 | |
| Cboe Global Markets, Inc. | | | 108 | | | | 10,057 | |
| CBRE Group, Inc., Class A (*) | | | 785 | | | | 49,235 | |
| CDW Corp. | | | 178 | | | | 23,459 | |
| Charter Communications, Inc., Class A (*) | | | 47 | | | | 31,093 | |
| Cisco Systems, Inc. | | | 637 | | | | 28,506 | |
| Citizens Financial Group, Inc. | | | 399 | | | | 14,268 | |
| CMS Energy Corp. | | | 153 | | | | 9,335 | |
| Cognizant Technology Solutions Corp., Class A | | | 654 | | | | 53,595 | |
| Colgate-Palmolive Co. | | | 535 | | | | 45,748 | |
| Comcast Corp., Class A | | | 2,354 | | | | 123,350 | |
| ConocoPhillips | | | 1,161 | | | | 46,428 | |
| Costco Wholesale Corp. | | | 63 | | | | 23,737 | |
| Cummins, Inc. | | | 819 | | | | 185,995 | |
| CVS Health Corp. | | | 1,736 | | | | 118,569 | |
| D.R. Horton, Inc. | | | 343 | | | | 23,640 | |
The accompanying notes are an integral part of these financial statements.
22 Annual Report
| | | | | | | |
| Description | | Shares | | | Fair
Value | |
| | | | | | | |
| Lazard Global Dynamic Multi-Asset Portfolio (continued) | | | | | | | | |
| | | | | | | | | |
| Darden Restaurants, Inc. | | | 359 | | | $ | 42,764 | |
| DaVita, Inc. (*) | | | 166 | | | | 19,488 | |
| Deere & Co. | | | 214 | | | | 57,577 | |
| Devon Energy Corp. | | | 3,974 | | | | 62,829 | |
| Dolby Laboratories, Inc., Class A | | | 88 | | | | 8,547 | |
| Dollar General Corp. | | | 1,401 | | | | 294,630 | |
| Domino’s Pizza, Inc. | | | 72 | | | | 27,609 | |
| Dover Corp. | | | 195 | | | | 24,619 | |
| DTE Energy Co. | | | 77 | | | | 9,349 | |
| Easterly Government Properties, Inc. REIT | | | 817 | | | | 18,505 | |
| Eastman Chemical Co. | | | 455 | | | | 45,627 | |
| Eaton Corp. PLC | | | 256 | | | | 30,756 | |
| Electronic Arts, Inc. | | | 144 | | | | 20,678 | |
| Eli Lilly & Co. | | | 997 | | | | 168,334 | |
| Entergy Corp. | | | 141 | | | | 14,077 | |
| Equity Lifestyle Properties, Inc. REIT | | | 159 | | | | 10,074 | |
| Evergy, Inc. | | | 194 | | | | 10,769 | |
| Exlservice Holdings, Inc. (*) | | | 119 | | | | 10,130 | |
| Facebook, Inc., Class A (*) | | | 1,363 | | | | 372,317 | |
| Fifth Third Bancorp | | | 1,664 | | | | 45,876 | |
| Flowers Foods, Inc. | | | 400 | | | | 9,052 | |
| FOX Corp., Class B (*) | | | 1,196 | | | | 34,540 | |
| Gaming and Leisure Properties, Inc. REIT | | | 661 | | | | 28,026 | |
| General Mills, Inc. | | | 331 | | | | 19,463 | |
| Gilead Sciences, Inc. | | | 270 | | | | 15,730 | |
| Graco, Inc. | | | 265 | | | | 19,173 | |
| HCA Healthcare, Inc. | | | 350 | | | | 57,561 | |
| Honeywell International, Inc. | | | 873 | | | | 185,687 | |
| Hormel Foods Corp. | | | 525 | | | | 24,470 | |
| Humana, Inc. | | | 249 | | | | 102,157 | |
| Huntington Ingalls Industries, Inc. | | | 55 | | | | 9,376 | |
| IDEXX Laboratories, Inc. (*) | | | 102 | | | | 50,987 | |
| Intel Corp. | | | 492 | | | | 24,511 | |
| Intercontinental Exchange, Inc. | | | 2,812 | | | | 324,196 | |
| Intuit, Inc. | | | 436 | | | | 165,615 | |
| IQVIA Holdings, Inc. (*) | | | 1,985 | | | | 355,652 | |
The accompanying notes are an integral part of these financial statements.
Annual Report 23
| | | | | | | |
| Description | | Shares | | | Fair
Value | |
| | | | | | | |
| Lazard Global Dynamic Multi-Asset Portfolio (continued) | | | | | | | | |
| | | | | | | | | |
| Jack Henry & Associates, Inc. | | | 143 | | | $ | 23,165 | |
| J.B. Hunt Transport Services, Inc. | | | 97 | | | | 13,255 | |
| Johnson & Johnson | | | 2,762 | | | | 434,684 | |
| Kellogg Co. | | | 460 | | | | 28,626 | |
| Kimberly-Clark Corp. | | | 2,132 | | | | 287,458 | |
| La-Z-Boy, Inc. | | | 249 | | | | 9,920 | |
| Laboratory Corp. of America Holdings (*) | | | 49 | | | | 9,974 | |
| Lennox International, Inc. | | | 66 | | | | 18,082 | |
| LHC Group, Inc. (*) | | | 68 | | | | 14,506 | |
| Lockheed Martin Corp. | | | 387 | | | | 137,377 | |
| Lowe’s Cos., Inc. | | | 1,629 | | | | 261,471 | |
| Lululemon Athletica, Inc. (*) | | | 38 | | | | 13,225 | |
| MasterCard, Inc., Class A | | | 86 | | | | 30,697 | |
| McDonald’s Corp. | | | 1,279 | | | | 274,448 | |
| McKesson Corp. | | | 709 | | | | 123,309 | |
| MDU Resources Group, Inc. | | | 1,486 | | | | 39,141 | |
| Medtronic PLC | | | 721 | | | | 84,458 | |
| Merck & Co., Inc. | | | 3,070 | | | | 251,126 | |
| MetLife, Inc. | | | 666 | | | | 31,269 | |
| Mettler-Toledo International, Inc. (*) | | | 83 | | | | 94,593 | |
| Microsoft Corp. | | | 3,982 | | | | 885,676 | |
| Mid-America Apartment Communities, Inc. REIT | | | 76 | | | | 9,628 | |
| Moody’s Corp. | | | 571 | | | | 165,727 | |
| Motorola Solutions, Inc. | | | 1,650 | | | | 280,599 | |
| National Fuel Gas Co. | | | 239 | | | | 9,830 | |
| Newmont Corp. | | | 265 | | | | 15,871 | |
| Northrop Grumman Corp. | | | 203 | | | | 61,858 | |
| NVIDIA Corp. | | | 246 | | | | 128,461 | |
| O’Reilly Automotive, Inc. (*) | | | 39 | | | | 17,650 | |
| Old Dominion Freight Line, Inc. | | | 349 | | | | 68,118 | |
| Old Republic International Corp. | | | 736 | | | | 14,507 | |
| Palo Alto Networks, Inc. (*) | | | 437 | | | | 155,305 | |
| Paycom Software, Inc. (*) | | | 55 | | | | 24,874 | |
| PayPal Holdings, Inc. (*) | | | 59 | | | | 13,818 | |
| PennyMac Financial Services, Inc. | | | 178 | | | | 11,680 | |
| PepsiCo, Inc. | | | 1,129 | | | | 167,431 | |
The accompanying notes are an integral part of these financial statements.
24 Annual Report
| | | | | | | |
| Description | | Shares | | | Fair
Value | |
| | | | | | | |
| Lazard Global Dynamic Multi-Asset Portfolio (continued) | | | | | | | | |
| | | | | | | | | |
| Pfizer, Inc. | | | 312 | | | $ | 11,485 | |
| Philip Morris International, Inc. | | | 138 | | | | 11,425 | |
| Phillips 66 | | | 312 | | | | 21,821 | |
| Pioneer Natural Resources Co. | | | 117 | | | | 13,325 | |
| Pool Corp. | | | 45 | | | | 16,763 | |
| ProPetro Holding Corp. (*) | | | 3,172 | | | | 23,441 | |
| PTC, Inc. (*) | | | 1,684 | | | | 201,423 | |
| PulteGroup, Inc. | | | 538 | | | | 23,199 | |
| PVH Corp. | | | 259 | | | | 24,318 | |
| QUALCOMM, Inc. | | | 840 | | | | 127,966 | |
| Quest Diagnostics, Inc. | | | 120 | | | | 14,300 | |
| Regeneron Pharmaceuticals, Inc. (*) | | | 17 | | | | 8,213 | |
| Regions Financial Corp. | | | 6,865 | | | | 110,664 | |
| Republic Services, Inc. | | | 559 | | | | 53,832 | |
| Rockwell Automation, Inc. | | | 682 | | | | 171,052 | |
| Ross Stores, Inc. | | | 393 | | | | 48,264 | |
| RPM International, Inc. | | | 257 | | | | 23,330 | |
| S&P Global, Inc. | | | 793 | | | | 260,683 | |
| SBA Communications Corp. REIT | | | 67 | | | | 18,903 | |
| Sempra Energy | | | 79 | | | | 10,065 | |
| Service Corp. International | | | 660 | | | | 32,406 | |
| ServiceNow, Inc. (*) | | | 148 | | | | 81,464 | |
| Silgan Holdings, Inc. | | | 657 | | | | 24,362 | |
| Sirius XM Holdings, Inc. | | | 13,917 | | | | 88,651 | |
| Southwest Gas Holdings, Inc. | | | 512 | | | | 31,104 | |
| Square, Inc., Class A (*) | | | 189 | | | | 41,134 | |
| Starbucks Corp. | | | 1,221 | | | | 130,623 | |
| Stepan Co. | | | 80 | | | | 9,546 | |
| STERIS PLC | | | 52 | | | | 9,856 | |
| Sturm Ruger & Co., Inc. | | | 153 | | | | 9,956 | |
| Synopsys, Inc. (*) | | | 1,000 | | | | 259,240 | |
| Synovus Financial Corp. | | | 768 | | | | 24,860 | |
| Targa Resources Corp. | | | 1,101 | | | | 29,044 | |
| Target Corp. | | | 826 | | | | 145,814 | |
| Teradyne, Inc. | | | 586 | | | | 70,256 | |
| Terminix Global Holdings, Inc. (*) | | | 209 | | | | 10,661 | |
The accompanying notes are an integral part of these financial statements.
Annual Report 25
| | | | | | | |
| Description | | Shares | | | Fair
Value | |
| | | | | | | |
| Lazard Global Dynamic Multi-Asset Portfolio (continued) | | | | | | | | |
| | | | | | | | | |
| Tesla, Inc. (*) | | | 321 | | | $ | 226,520 | |
| Texas Instruments, Inc. | | | 1,423 | | | | 233,557 | |
| Texas Roadhouse, Inc. | | | 498 | | | | 38,924 | |
| The Bank of New York Mellon Corp. | | | 363 | | | | 15,406 | |
| The Charles Schwab Corp. | | | 2,963 | | | | 157,158 | |
| The Clorox Co. | | | 249 | | | | 50,278 | |
| The Coca-Cola Co. | | | 6,660 | | | | 365,234 | |
| The Hanover Insurance Group, Inc. | | | 125 | | | | 14,615 | |
| The Hershey Co. | | | 180 | | | | 27,419 | |
| The Home Depot, Inc. | | | 599 | | | | 159,106 | |
| The J.M. Smucker Co. | | | 93 | | | | 10,751 | |
| The Kroger Co. | | | 580 | | | | 18,421 | |
| The New York Times Co. | | | 214 | | | | 11,079 | |
| The Procter & Gamble Co. | | | 2,564 | | | | 356,755 | |
| The Sherwin-Williams Co. | | | 82 | | | | 60,263 | |
| Thermo Fisher Scientific, Inc. | | | 953 | | | | 443,888 | |
| Tractor Supply Co. | | | 144 | | | | 20,244 | |
| Union Pacific Corp. | | | 160 | | | | 33,315 | |
| United Parcel Service, Inc., Class B | | | 781 | | | | 131,520 | |
| UnitedHealth Group, Inc. | | | 632 | | | | 221,630 | |
| Universal Health Services, Inc., Class B | | | 174 | | | | 23,925 | |
| Verizon Communications, Inc. | | | 6,330 | | | | 371,888 | |
| Vertex Pharmaceuticals, Inc. (*) | | | 36 | | | | 8,508 | |
| Viatris, Inc. (*) | | | 455 | | | | 8,527 | |
| Visa, Inc., Class A | | | 1,345 | | | | 294,192 | |
| Vistra Corp. | | | 1,739 | | | | 34,189 | |
| Walmart, Inc. | | | 951 | | | | 137,087 | |
| Warner Music Group Corp., Class A | | | 2,650 | | | | 100,674 | |
| Waste Management, Inc. | | | 189 | | | | 22,289 | |
| WEC Energy Group, Inc. | | | 178 | | | | 16,381 | |
| Weis Markets, Inc. | | | 157 | | | | 7,506 | |
| Werner Enterprises, Inc. | | | 215 | | | | 8,432 | |
| West Pharmaceutical Services, Inc. | | | 59 | | | | 16,715 | |
| WW Grainger, Inc. | | | 101 | | | | 41,242 | |
| Xcel Energy, Inc. | | | 168 | | | | 11,201 | |
| Zoetis, Inc. | | | 1,884 | | | | 311,802 | |
| | | | | | | | 18,083,835 | |
| | | | | | | | | |
Total Common Stocks
(Cost $23,117,132) | | | | | | $ | 28,023,108 | |
The accompanying notes are an integral part of these financial statements.
26 Annual Report
| | | | | | | | | |
| Description | | Security
Currency | | Principal
Amount
(000) | | | Fair
Value | |
| | | | | | | | | |
| Lazard Global Dynamic Multi-Asset Portfolio (continued) | | | | | | | | | | |
| | | | | | | | | | | |
| Corporate Bonds | 17.1% | | | | | | | | | | |
| | | | | | | | | | | |
| Australia | 0.5% | | | | | | | | | | |
Telstra Corp., Ltd.,
4.000%, 09/16/22 | | AUD | | | 360 | | | $ | 294,500 | |
| | | | | | | | | | | |
| Canada | 1.4% | | | | | | | | | | |
Canadian Imperial Bank of Commerce,
0.950%, 10/23/25 | | USD | | | 415 | | | | 420,650 | |
Rogers Communications, Inc.,
3.250%, 05/01/29 | | CAD | | | 425 | | | | 370,156 | |
| | | | | | | | | | 790,806 | |
| France | 0.5% | | | | | | | | | | |
Schneider Electric SE, 2.950%, 09/27/22 | | USD | | | 285 | | | | 297,334 | |
| | | | | | | | | | | |
| Germany | 0.9% | | | | | | | | | | |
BMW Finance NV,
0.875%, 08/16/22 | | GBP | | | 95 | | | | 131,310 | |
Daimler AG,
0.000% (Euribor 3 Month + 0.450%), 07/03/24 (§) | | EUR | | | 300 | | | | 365,728 | |
| | | | | | | | | | 497,038 | |
| Switzerland | 0.0% | | | | | | | | | | |
ABB Finance USA, Inc.,
4.375%, 05/08/42 | | USD | | | 17 | | | | 22,420 | |
| | | | | | | | | | | |
| United Kingdom | 0.8% | | | | | | | | | | |
Tesco Corporate Treasury Services PLC MTN,
2.750%, 04/27/30 | | GBP | | | 135 | | | | 204,431 | |
Unilever Capital Corp.,
3.250%, 03/07/24 | | USD | | | 220 | | | | 238,872 | |
| | | | | | | | | | 443,303 | |
The accompanying notes are an integral part of these financial statements.
Annual Report 27
| | | | | | | | | |
| Description | | Security
Currency | | Principal
Amount
(000) | | | Fair
Value | |
| | | | | | | | | |
| Lazard Global Dynamic Multi-Asset Portfolio (continued) | | | | | | | | | | |
| | | | | | | | | | | |
| United States | 13.0% | | | | | | | | | | |
Adobe, Inc.,
2.300%, 02/01/30 | | USD | | | 240 | | | $ | 259,633 | |
Alphabet, Inc.,
1.100%, 08/15/30 | | USD | | | 265 | | | | 261,071 | |
Amazon.com, Inc.,
3.150%, 08/22/27 | | USD | | | 285 | | | | 324,697 | |
American Express Co.,
3.000%, 10/30/24 | | USD | | | 295 | | | | 322,138 | |
Apple, Inc.,
3.000%, 06/20/27 | | USD | | | 230 | | | | 257,547 | |
| Bank of America Corp.: | | | | | | | | | | |
| 3.499% (USD LIBOR 3 Month + 0.630%), 05/17/22 (§) | | USD | | | 329 | | | | 332,896 | |
| 1.486% (SOFR + 1.460%), 05/19/24 (§) | | USD | | | 125 | | | | 127,916 | |
Citigroup, Inc.,
1.579% (BBSW 3 Month + 1.550%), 05/04/21 (§) | | AUD | | | 328 | | | | 253,891 | |
Dell International LLC,
5.300%, 10/01/29 | | USD | | | 180 | | | | 220,441 | |
HCA, Inc.,
5.000%, 03/15/24 | | USD | | | 120 | | | | 134,977 | |
John Deere Financial, Inc.,
2.410%, 01/14/25 | | CAD | | | 300 | | | | 250,337 | |
Johnson & Johnson,
3.625%, 03/03/37 | | USD | | | 263 | | | | 321,150 | |
JPMorgan Chase & Co.,
3.540% (USD LIBOR 3 Month + 1.380%), 05/01/28 (§) | | USD | | | 285 | | | | 325,630 | |
Kimberly-Clark Corp.,
3.200%, 04/25/29 | | USD | | | 188 | | | | 216,581 | |
McDonald’s Corp.,
3.125%, 03/04/25 | | CAD | | | 555 | | | | 472,690 | |
Microsoft Corp.,
3.500%, 11/15/42 | | USD | | | 220 | | | | 270,705 | |
The accompanying notes are an integral part of these financial statements.
28 Annual Report
| | | | | | | | | |
| Description | | Security
Currency | | Principal
Amount
(000) | | | Fair
Value | |
| | | | | | | | | |
| Lazard Global Dynamic Multi-Asset Portfolio (continued) | | | | | | | | | | |
| | | | | | | | | | | |
Morgan Stanley,
3.625%, 01/20/27 | | USD | | | 285 | | | $ | 327,000 | |
PepsiCo, Inc.,
2.875%, 10/15/49 | | USD | | | 235 | | | | 262,715 | |
Pfizer, Inc.,
2.625%, 04/01/30 | | USD | | | 230 | | | | 256,555 | |
Prologis LP,
1.250%, 10/15/30 | | USD | | | 210 | | | | 207,822 | |
Sealed Air Corp.,
4.875%, 12/01/22 | | USD | | | 130 | | | | 136,337 | |
Service Corp. International,
4.625%, 12/15/27 | | USD | | | 125 | | | | 133,125 | |
Starbucks Corp.,
4.450%, 08/15/49 | | USD | | | 250 | | | | 329,221 | |
The Goldman Sachs Group, Inc.,
3.625%, 01/22/23 | | USD | | | 293 | | | | 312,653 | |
The Home Depot, Inc.,
5.875%, 12/16/36 | | USD | | | 230 | | | | 348,322 | |
The Procter & Gamble Co.,
1.200%, 10/29/30 | | USD | | | 135 | | | | 135,098 | |
Toyota Motor Credit Corp.,
2.150%, 02/13/30 | | USD | | | 285 | | | | 306,014 | |
United Rentals North America, Inc.,
4.875%, 01/15/28 | | USD | | | 125 | | | | 133,125 | |
Verizon Communications, Inc.,
3.875%, 02/08/29 | | USD | | | 289 | | | | 340,026 | |
| | | | | | | | | | 7,580,313 | |
Total Corporate Bonds
(Cost $9,303,736) | | | | | | | | | 9,925,714 | |
| | | | | | | | | | | |
| | | | | | | | | | | |
| Description | | | | Shares
(000) | | | Fair
Value | |
| | | | | | | | | | | |
| Exchange-Traded Funds | 5.3% | | | | | | | | | | |
iShares MSCI World ETF
(Cost $2,339,474) | | | | | 27,760 | | | $ | 3,120,502 | |
The accompanying notes are an integral part of these financial statements.
Annual Report 29
| | | | | | | | | |
| Description | | Security
Currency | | Principal
Amount
(000) | | | Fair
Value | |
| | | | | | | | | |
| Lazard Global Dynamic Multi-Asset Portfolio (continued) | | | | | | | | | | |
| | | | | | | | | | | |
| Foreign Government Obligations | 23.2% | | | | | | | | | | |
| | | | | | | | | | | |
| Australia | 0.9% | | | | | | | | | | |
New South Wales Treasury Corp.,
1.250%, 11/20/30 | | AUD | | | 350 | | | $ | 270,959 | |
Queensland Treasury Corp.,
1.250%, 03/10/31 | | AUD | | | 350 | | | | 270,410 | |
| | | | | | | | | | 541,369 | |
| Bahamas | 0.7% | | | | | | | | | | |
Commonwealth of Bahamas,
6.950%, 11/20/29 | | USD | | | 435 | | | | 431,602 | |
| | | | | | | | | | | |
| Bermuda | 1.3% | | | | | | | | | | |
| Government of Bermuda: | | | | | | | | | | |
| 3.717%, 01/25/27 | | USD | | | 200 | | | | 223,750 | |
| 2.375%, 08/20/30 (#) | | USD | | | 500 | | | | 524,500 | |
| | | | | | | | | | 748,250 | |
| Canada | 2.2% | | | | | | | | | | |
City of Vancouver,
2.900%, 11/20/25 | | CAD | | | 188 | | | | 162,028 | |
Province of British Columbia,
4.700%, 06/18/37 | | CAD | | | 389 | | | | 434,617 | |
| Province of Quebec: | | | | | | | | | | |
| 2.500%, 04/20/26 | | USD | | | 230 | | | | 252,538 | |
| 1.850%, 02/13/27 | | CAD | | | 485 | | | | 403,507 | |
| | | | | | | | | | 1,252,690 | |
| Chile | 1.4% | | | | | | | | | | |
| Bonos de la Tesoreria de la Republica en pesos: | | | | | | | | | | |
| 4.500%, 03/01/26 | | CLP | | | 130,000 | | | | 209,782 | |
| 2.300%, 10/01/28 | | CLP | | | 220,000 | | | | 308,174 | |
Republic of Chile,
0.830%, 07/02/31 | | EUR | | | 250 | | | | 318,965 | |
| | | | | | | | | | 836,921 | |
| Colombia | 0.4% | | | | | | | | | | |
Republic of Colombia,
9.850%, 06/28/27 | | COP | | | 615,000 | | | | 233,183 | |
The accompanying notes are an integral part of these financial statements.
30 Annual Report
| | | | | | | | | |
| Description | | Security
Currency | | Principal
Amount
(000) | | | Fair
Value | |
| | | | | | | | | |
| Lazard Global Dynamic Multi-Asset Portfolio (continued) | | | | | | | | | | |
| | | | | | | | | | | |
| Croatia | 0.5% | | | | | | | | | | |
Croatia,
5.500%, 04/04/23 | | USD | | | 260 | | | $ | 286,487 | |
| | | | | | | | | | | |
| Czech Republic | 1.5% | | | | | | | | | | |
Czech Republic,
2.000%, 10/13/33 | | CZK | | | 16,860 | | | | 843,915 | |
| | | | | | | | | | | |
| Hungary | 1.8% | | | | | | | | | | |
| Hungary Government Bonds: | | | | | | | | | | |
| 2.500%, 10/24/24 | | HUF | | | 83,620 | | | | 297,636 | |
| 2.750%, 12/22/26 | | HUF | | | 83,020 | | | | 300,621 | |
| 3.000%, 10/27/27 | | HUF | | | 86,120 | | | | 317,481 | |
Hungary Government International Bonds,
1.750%, 06/05/35 | | EUR | | | 100 | | | | 135,662 | |
| | | | | | | | | | 1,051,400 | |
| Italy | 0.9% | | | | | | | | | | |
Italy Buoni Poliennali Del Tesoro,
1.450%, 03/01/36 | | EUR | | | 205 | | | | 268,897 | |
Italy Government International Bonds,
6.875%, 09/27/23 | | USD | | | 235 | | | | 272,857 | |
| | | | | | | | | | 541,754 | |
| | | | | | | | | | | |
| Japan | 0.7% | | | | | | | | | | |
Japan Bank for International Cooperation,
0.625%, 05/22/23 | | USD | | | 200 | | | | 201,301 | |
Japan International Cooperation Agency,
2.125%, 10/20/26 | | USD | | | 200 | | | | 214,798 | |
| | | | | | | | | | 416,099 | |
| Mexico | 0.5% | | | | | | | | | | |
Mexican Bonos,
7.500%, 06/03/27 | | MXN | | | 4,660 | | | | 266,449 | |
United Mexican States,
6.750%, 02/06/24 | | GBP | | | 30 | | | | 48,153 | |
| | | | | | | | | | 314,602 | |
The accompanying notes are an integral part of these financial statements.
Annual Report 31
| | | | | | | | | |
| Description | | Security
Currency | | Principal
Amount
(000) | | | Fair
Value | |
| | | | | | | | | |
| Lazard Global Dynamic Multi-Asset Portfolio (continued) | | | | | | | | | | |
| | | | | | | | | | | |
| Morocco | 0.5% | | | | | | | | | | |
Morocco Government International Bonds,
1.500%, 11/27/31 | | EUR | | | 260 | | | $ | 309,093 | |
| | | | | | | | | | | |
| Netherlands | 0.7% | | | | | | | | | | |
Nederlandse Waterschapsbank NV,
0.500%, 12/02/25 (#) | | USD | | | 400 | | | | 399,971 | |
| | | | | | | | | | | |
| New Zealand | 1.0% | | | | | | | | | | |
New Zealand Government Bonds,
4.500%, 04/15/27 | | NZD | | | 640 | | | | 561,386 | |
| | | | | | | | | | | |
| Norway | 0.8% | | | | | | | | | | |
| Oslo Kommune: | | | | | | | | | | |
| 2.350%, 09/04/24 | | NOK | | | 2,000 | | | | 244,713 | |
| 0.910% (NIBOR 3 Month + 0.460%), 05/06/26 (§) | | NOK | | | 2,000 | | | | 234,540 | |
| | | | | | | | | | 479,253 | |
| Panama | 0.8% | | | | | | | | | | |
Republic of Panama,
4.000%, 09/22/24 | | USD | | | 400 | | | | 441,875 | |
| | | | | | | | | | | |
| Peru | 0.7% | | | | | | | | | | |
Peru Government Bonds,
6.150%, 08/12/32 | | PEN | | | 1,275 | | | | 428,553 | |
| | | | | | | | | | | |
| Philippines | 0.7% | | | | | | | | | | |
Republic of Philippines,
3.900%, 11/26/22 | | PHP | | | 20,000 | | | | 423,434 | |
| | | | | | | | | | | |
| Poland | 1.0% | | | | | | | | | | |
| Poland Government Bonds: | | | | | | | | | | |
| 2.500%, 07/25/27 | | PLN | | | 980 | | | | 291,119 | |
| 2.750%, 10/25/29 | | PLN | | | 945 | | | | 287,740 | |
| | | | | | | | | | 578,859 | |
The accompanying notes are an integral part of these financial statements.
32 Annual Report
| | | | | | | | | |
| Description | | Security
Currency | | Principal
Amount
(000) | | | Fair
Value | |
| | | | | | | | | |
| Lazard Global Dynamic Multi-Asset Portfolio (continued) | | | | | | | | | | |
| | | | | | | | | | | |
| Romania | 1.9% | | | | | | | | | | |
| Romanian Government Bonds: | | | | | | | | | | |
| 4.000%, 10/27/21 | | RON | | | 1,130 | | | $ | 285,949 | |
| 4.750%, 02/24/25 | | RON | | | 2,080 | | | | 561,775 | |
Romanian Government International Bonds,
2.375%, 04/19/27 | | EUR | | | 215 | | | | 286,704 | |
| | | | | | | | | | 1,134,428 | |
| Singapore | 0.5% | | | | | | | | | | |
Singapore Government Bonds,
3.375%, 09/01/33 | | SGD | | | 280 | | | | 270,333 | |
| | | | | | | | | | | |
| Spain | 0.5% | | | | | | | | | | |
Spain Government Bonds,
1.200%, 10/31/40 | | EUR | | | 199 | | | | 269,171 | |
| | | | | | | | | | | |
| United Kingdom | 0.8% | | | | | | | | | | |
| United Kingdom Gilt: | | | | | | | | | | |
| 1.750%, 09/07/37 | | GBP | | | 175 | | | | 283,915 | |
| 1.500%, 07/22/47 | | GBP | | | 95 | | | | 153,705 | |
| | | | | | | | | | 437,620 | |
| Vietnam | 0.5% | | | | | | | | | | |
Socialist Republic of Vietnam,
4.800%, 11/19/24 | | USD | | | 255 | | | | 285,998 | |
| | | | | | | | | | | |
Total Foreign Government Obligations
(Cost $12,660,891) | | | | | | | | | 13,518,246 | |
| | | | | | | | | | | |
| Quasi Government Bonds | 0.5% | | | | | | | | | | |
| | | | | | | | | | | |
| Canada | 0.5% | | | | | | | | | | |
Export Development Canada,
1.800%, 09/01/22
(Cost $261,627) | | CAD | | | 360 | | | | 290,121 | |
| | | | | | | | | | | |
| Supranational Bonds | 3.7% | | | | | | | | | | |
African Development Bank,
0.750%, 04/03/23 | | USD | | | 190 | | | | 192,246 | |
The accompanying notes are an integral part of these financial statements.
Annual Report 33
| | | | | | | | | |
| Description | | Security
Currency | | Principal
Amount
(000) | | | Fair
Value | |
| | | | | | | | | |
| Lazard Global Dynamic Multi-Asset Portfolio (continued) | | | | | | | | | | |
| | | | | | | | | | | |
Asian Development Bank,
2.125%, 03/19/25 | | USD | | | 303 | | | $ | 324,572 | |
European Bank for Reconstruction & Development,
1.625%, 09/27/24 | | USD | | | 140 | | | | 146,754 | |
European Investment Bank,
1.125%, 09/16/21 (#) | | CAD | | | 130 | | | | 102,653 | |
Inter-American Development Bank,
7.875%, 03/14/23 | | IDR | | | 3,830,000 | | | | 292,525 | |
| International Bank for Reconstruction & Development: | | | | | | | | | | |
| 2.500%, 08/03/23 | | CAD | | | 290 | | | | 240,530 | |
| 1.900%, 01/16/25 | | CAD | | | 185 | | | | 153,254 | |
| 2.900%, 11/26/25 | | AUD | | | 330 | | | | 283,312 | |
| International Finance Corp.: | | | | | | | | | | |
| 2.700%, 03/15/23 | | AUD | | | 322 | | | | 261,634 | |
| 2.125%, 04/07/26 | | USD | | | 125 | | | | 135,627 | |
| | | | | | | | | | | |
Total Supranational Bonds
(Cost $1,985,269) | | | | | | | | | 2,133,107 | |
| | | | | | | | | | | |
| US Municipal Bonds | 0.7% | | | | | | | | | | |
| | | | | | | | | | | |
| California | 0.6% | | | | | | | | | | |
California State Build America Bonds,
7.500%, 04/01/34 | | USD | | | 35 | | | | 58,333 | |
| State of California: | | | | | | | | | | |
| 4.500%, 04/01/33 | | USD | | | 100 | | | | 120,872 | |
| 7.550%, 04/01/39 | | USD | | | 105 | | | | 184,359 | |
| | | | | | | | | | 363,564 | |
| New York | 0.1% | | | | | | | | | | |
New York State Urban Development Corp.,
Series B,
3.900%, 03/15/33 | | USD | | | 40 | | | | 45,951 | |
| | | | | | | | | | | |
Total US Municipal Bonds
(Cost $371,485) | | | | | | | | | 409,515 | |
The accompanying notes are an integral part of these financial statements.
34 Annual Report
| | | | | | | | | |
| Description | | Security
Currency | | Principal
Amount
(000) | | | Fair
Value | |
| | | | | | | | | |
| Lazard Global Dynamic Multi-Asset Portfolio (continued) | | | | | | | | | | |
| | | | | | | | | | | |
| | | | | | | | | | | |
| US Treasury Securities | 0.5% | | | | | | | | | | |
US Treasury Note,
2.875%, 08/15/28
(Cost $273,239) | | USD | | | 235 | | | $ | 272,848 | |
| | | | | | | | | | | |
| | | | | | | | | | | |
| Description | | | | | Shares | | | | Fair
Value | |
| | | | | | | | | | | |
| Short-Term Investments | 0.6% | | | | | | | | | | |
State Street Institutional Treasury Money Market Fund, Premier Class,
0.01% (7 day yield)
(Cost $375,514) | | | | | 375,514 | | | $ | 375,514 | |
| | | | | | | | | | | |
Total Investments | 99.8%
(Cost $50,688,367) (») | | | | | | | | $ | 58,068,675 | |
| | | | | | | | | | | |
| Cash and Other Assets in Excess of Liabilities | 0.2% | | | | | | | | | 92,360 | |
| | | | | | | | | | | |
| Net Assets | 100.0% | | | | | | | | $ | 58,161,035 | |
The accompanying notes are an integral part of these financial statements.
Annual Report 35
Lazard Global Dynamic Multi-Asset Portfolio (continued)
Forward Currency Contracts open at December 31, 2020:
| | | | | | | | | | | | | | | | | | | | | |
Currency
Purchased | | | Quantity | | | Currency
Sold | | | Quantity | | | Counterparty | | Settlement
Date | | Unrealized
Appreciation | | Unrealized
Depreciation | |
| | | | | | | | | | | | | | | | | | | | | | | |
| AUD | | | 125,413 | | | USD | | | 91,807 | | | HSB | | 01/20/21 | | $ | 4,898 | | | $ | — | |
| AUD | | | 6,521 | | | USD | | | 4,964 | | | JPM | | 01/20/21 | | | 64 | | | | — | |
| AUD | | | 586,161 | | | USD | | | 413,545 | | | JPM | | 01/20/21 | | | 38,440 | | | | — | |
| AUD | | | 23,322 | | | USD | | | 17,964 | | | SSB | | 03/25/21 | | | 28 | | | | — | |
| CAD | | | 187,441 | | | USD | | | 141,368 | | | HSB | | 01/20/21 | | | 5,899 | | | | — | |
| CAD | | | 222,373 | | | USD | | | 170,277 | | | HSB | | 01/20/21 | | | 4,434 | | | | — | |
| CAD | | | 33,477 | | | USD | | | 25,941 | | | JPM | | 01/20/21 | | | 361 | | | | — | |
| CAD | | | 600,693 | | | USD | | | 448,446 | | | JPM | | 01/20/21 | | | 23,499 | | | | — | |
| CAD | | | 2,278,804 | | | USD | | | 1,713,431 | | | MSC | | 01/20/21 | | | 76,951 | | | | — | |
| CAD | | | 31,891 | | | USD | | | 24,961 | | | SSB | | 03/25/21 | | | 98 | | | | — | |
| CHF | | | 117,159 | | | USD | | | 129,522 | | | HSB | | 01/20/21 | | | 2,879 | | | | — | |
| CHF | | | 111,975 | | | USD | | | 126,000 | | | JPM | | 01/20/21 | | | 543 | | | | — | |
| CHF | | | 151,454 | | | USD | | | 166,100 | | | JPM | | 01/20/21 | | | 5,057 | | | | — | |
| CHF | | | 287,406 | | | USD | | | 317,736 | | | JPM | | 01/20/21 | | | 7,061 | | | | — | |
| CHF | | | 29,187 | | | USD | | | 33,058 | | | SSB | | 03/25/21 | | | — | | | | 12 | |
| CNH | | | 2,613,240 | | | USD | | | 384,300 | | | HSB | | 01/20/21 | | | 17,162 | | | | — | |
| CNH | | | 4,557,766 | | | USD | | | 668,696 | | | HSB | | 01/20/21 | | | 31,497 | | | | — | |
| CNH | | | 1,126,298 | | | USD | | | 168,800 | | | HSB | | 03/04/21 | | | 3,729 | | | | — | |
| CNH | | | 4,557,766 | | | USD | | | 666,272 | | | HSB | | 03/04/21 | | | 31,900 | | | | — | |
| COP | | | 194,085,600 | | | USD | | | 53,600 | | | CIT | | 02/16/21 | | | 3,201 | | | | — | |
| CZK | | | 1,077,913 | | | USD | | | 48,868 | | | HSB | | 01/22/21 | | | 1,322 | | | | — | |
| EUR | | | 703,541 | | | USD | | | 832,901 | | | CIT | | 01/20/21 | | | 26,910 | | | | — | |
| EUR | | | 27,688 | | | USD | | | 33,259 | | | HSB | | 01/20/21 | | | 579 | | | | — | |
| EUR | | | 59,753 | | | USD | | | 71,204 | | | HSB | | 01/20/21 | | | 1,821 | | | | — | |
| EUR | | | 110,999 | | | USD | | | 134,700 | | | HSB | | 01/20/21 | | | 955 | | | | — | |
| EUR | | | 222,812 | | | USD | | | 269,400 | | | HSB | | 01/20/21 | | | 2,903 | | | | — | |
| EUR | | | 233,069 | | | USD | | | 277,920 | | | HSB | | 01/20/21 | | | 6,919 | | | | — | |
| EUR | | | 2,647,892 | | | USD | | | 3,133,198 | | | HSB | | 01/20/21 | | | 102,844 | | | | — | |
| EUR | | | 1,607 | | | USD | | | 1,915 | | | JPM | | 01/20/21 | | | 49 | | | | — | |
| EUR | | | 33,379 | | | USD | | | 39,200 | | | JPM | | 01/20/21 | | | 1,594 | | | | — | |
| EUR | | | 144,302 | | | USD | | | 169,368 | | | JPM | | 01/20/21 | | | 6,987 | | | | — | |
| EUR | | | 175,689 | | | USD | | | 209,000 | | | JPM | | 01/20/21 | | | 5,713 | | | | — | |
| EUR | | | 206,921 | | | USD | | | 244,700 | | | JPM | | 01/20/21 | | | 8,182 | | | | — | |
| EUR | | | 511,946 | | | USD | | | 605,840 | | | JPM | | 01/20/21 | | | 19,820 | | | | — | |
| EUR | | | 163,263 | | | USD | | | 200,337 | | | SSB | | 03/25/21 | | | — | | | | 527 | |
| GBP | | | 27,492 | | | USD | | | 36,827 | | | HSB | | 01/20/21 | | | 773 | | | | — | |
The accompanying notes are an integral part of these financial statements.
36 Annual Report
Lazard Global Dynamic Multi-Asset Portfolio (continued)
Forward Currency Contracts open at December 31, 2020:
| | | | | | | | | | | | | | | | | | | |
Currency
Purchased | | Quantity | | | Currency
Sold | | Quantity | | | Counterparty | | Settlement
Date | | Unrealized
Appreciation | | Unrealized
Depreciation | |
| | | | | | | | | | | | | | | | | | | | | | | |
| GBP | | | 44,101 | | | USD | | | 58,000 | | | HSB | | 01/20/21 | | $ | 2,317 | | | $ | — | |
| GBP | | | 47,169 | | | USD | | | 60,879 | | | HSB | | 01/20/21 | | | 3,633 | | | | — | |
| GBP | | | 56,777 | | | USD | | | 73,829 | | | HSB | | 01/20/21 | | | 3,824 | | | | — | |
| GBP | | | 121,578 | | | USD | | | 161,962 | | | JPM | | 01/20/21 | | | 4,318 | | | | — | |
| GBP | | | 128,306 | | | USD | | | 163,338 | | | JPM | | 01/20/21 | | | 12,144 | | | | — | |
| GBP | | | 264,355 | | | USD | | | 343,646 | | | JPM | | 01/20/21 | | | 17,908 | | | | — | |
| GBP | | | 45,075 | | | USD | | | 60,933 | | | SSB | | 03/25/21 | | | 738 | | | | — | |
| HUF | | | 32,493,300 | | | USD | | | 107,174 | | | HSB | | 01/20/21 | | | 2,290 | | | | — | |
| IDR | | | 1,376,400,000 | | | USD | | | 92,500 | | | JPM | | 01/15/21 | | | 6,358 | | | | — | |
| INR | | | 9,952,180 | | | USD | | | 134,000 | | | JPM | | 01/29/21 | | | 1,943 | | | | — | |
| JPY | | | 41,588,686 | | | USD | | | 396,865 | | | CIT | | 01/20/21 | | | 5,988 | | | | — | |
| JPY | | | 401,259,085 | | | USD | | | 3,830,233 | | | HSB | | 01/20/21 | | | 56,606 | | | | — | |
| JPY | | | 5,901,569 | | | USD | | | 56,100 | | | JPM | | 01/20/21 | | | 1,066 | | | | — | |
| JPY | | | 15,136,506 | | | USD | | | 145,000 | | | JPM | | 01/20/21 | | | 1,621 | | | | — | |
| JPY | | | 34,800,832 | | | USD | | | 332,140 | | | JPM | | 01/20/21 | | | 4,962 | | | | — | |
| KRW | | | 354,314,288 | | | USD | | | 317,236 | | | JPM | | 02/25/21 | | | 8,416 | | | | — | |
| MXN | | | 574,902 | | | USD | | | 26,324 | | | HSB | | 01/20/21 | | | 2,516 | | | | — | |
| MXN | | | 852,102 | | | USD | | | 39,009 | | | JPM | | 01/20/21 | | | 3,737 | | | | — | |
| NOK | | | 441,148 | | | USD | | | 47,335 | | | JPM | | 01/22/21 | | | 4,116 | | | | — | |
| NZD | | | 49,587 | | | USD | | | 34,494 | | | HSB | | 01/20/21 | | | 1,187 | | | | — | |
| NZD | | | 207,567 | | | USD | | | 138,101 | | | JPM | | 01/20/21 | | | 11,258 | | | | — | |
| PEN | | | 89,102 | | | USD | | | 24,871 | | | CIT | | 02/16/21 | | | — | | | | 251 | |
| PLN | | | 352,105 | | | USD | | | 93,701 | | | HSB | | 01/20/21 | | | 564 | | | | — | |
| PLN | | | 1,073,218 | | | USD | | | 291,708 | | | HSB | | 01/20/21 | | | — | | | | 4,388 | |
| PLN | | | 418,565 | | | USD | | | 107,395 | | | JPM | | 01/20/21 | | | 4,663 | | | | — | |
| RON | | | 200,168 | | | USD | | | 48,737 | | | HSB | | 01/20/21 | | | 1,466 | | | | — | |
| RON | | | 1,297,624 | | | USD | | | 309,400 | | | HSB | | 01/22/21 | | | 16,017 | | | | — | |
| RUB | | | 5,285,107 | | | USD | | | 69,700 | | | JPM | | 01/20/21 | | | 1,693 | | | | — | |
| SEK | | | 485,220 | | | USD | | | 54,942 | | | HSB | | 01/20/21 | | | 4,045 | | | | — | |
| SEK | | | 306,575 | | | USD | | | 34,710 | | | JPM | | 01/20/21 | | | 2,559 | | | | — | |
| SGD | | | 524,963 | | | USD | | | 386,987 | | | JPM | | 01/20/21 | | | 10,237 | | | | — | |
| SGD | | | 13,162 | | | USD | | | 9,911 | | | SSB | | 03/25/21 | | | 49 | | | | — | |
| THB | | | 3,235,757 | | | USD | | | 103,336 | | | HSB | | 01/20/21 | | | 4,666 | | | | — | |
| USD | | | 102,179 | | | AUD | | | 139,911 | | | CIT | | 01/20/21 | | | — | | | | 5,705 | |
| USD | | | 83,753 | | | AUD | | | 110,780 | | | HSB | | 01/20/21 | | | — | | | | 1,668 | |
| USD | | | 125,842 | | | AUD | | | 175,128 | | | HSB | | 01/20/21 | | | — | | | | 9,198 | |
The accompanying notes are an integral part of these financial statements.
Annual Report 37
Lazard Global Dynamic Multi-Asset Portfolio (continued)
| | | | | | | | | | | | | | | | | | | |
Currency
Purchased | | Quantity | | | Currency
Sold | | Quantity | | | Counterparty | | Settlement
Date | | Unrealized
Appreciation | | Unrealized
Depreciation | |
| | | | | | | | | | | | | | | | | | | | | | | |
| USD | | | 290,179 | | | AUD | | | 397,179 | | | HSB | | 01/20/21 | | $ | — | | | $ | 16,083 | |
| USD | | | 18,100 | | | AUD | | | 25,734 | | | JPM | | 01/20/21 | | | — | | | | 1,743 | |
| USD | | | 928,864 | | | AUD | | | 1,271,433 | | | JPM | | 01/20/21 | | | — | | | | 51,529 | |
| USD | | | 20,000 | | | AUD | | | 27,368 | | | MSC | | 01/20/21 | | | — | | | | 1,103 | |
| USD | | | 150,303 | | | AUD | | | 205,737 | | | MSC | | 01/20/21 | | | — | | | | 8,339 | |
| USD | | | 17,767 | | | AUD | | | 23,322 | | | SSB | | 03/25/21 | | | — | | | | 224 | |
| USD | | | 478,698 | | | CAD | | | 631,761 | | | CIT | | 01/20/21 | | | — | | | | 17,656 | |
| USD | | | 140,218 | | | CAD | | | 186,416 | | | HSB | | 01/20/21 | | | — | | | | 6,243 | |
| USD | | | 937,446 | | | CAD | | | 1,236,791 | | | HSB | | 01/20/21 | | | — | | | | 34,261 | |
| USD | | | 37,600 | | | CAD | | | 50,294 | | | JPM | | 01/20/21 | | | — | | | | 1,915 | |
| USD | | | 119,454 | | | CAD | | | 159,392 | | | JPM | | 01/20/21 | | | — | | | | 5,775 | |
| USD | | | 1,248,549 | | | CAD | | | 1,647,121 | | | JPM | | 01/20/21 | | | — | | | | 45,541 | |
| USD | | | 534 | | | CAD | | | 705 | | | MSC | | 01/20/21 | | | — | | | | 20 | |
| USD | | | 42,000 | | | CAD | | | 54,979 | | | MSC | | 01/20/21 | | | — | | | | 1,195 | |
| USD | | | 1,577,440 | | | CAD | | | 2,081,414 | | | MSC | | 01/20/21 | | | — | | | | 57,860 | |
| USD | | | 20,900 | | | CHF | | | 19,343 | | | JPM | | 01/20/21 | | | — | | | | 960 | |
| USD | | | 443,500 | | | CHF | | | 403,765 | | | JPM | | 01/20/21 | | | — | | | | 12,794 | |
| USD | | | 74,136 | | | CHF | | | 65,333 | | | SSB | | 03/25/21 | | | 166 | | | | — | |
| USD | | | 171,697 | | | CLP | | | 136,825,112 | | | CIT | | 02/16/21 | | | — | | | | 20,861 | |
| USD | | | 284,903 | | | CLP | | | 217,096,000 | | | CIT | | 02/16/21 | | | — | | | | 20,621 | |
| USD | | | 62,800 | | | CNH | | | 432,255 | | | HSB | | 01/20/21 | | | — | | | | 3,606 | |
| USD | | | 83,000 | | | CNH | | | 540,272 | | | HSB | | 01/20/21 | | | — | | | | — | |
| USD | | | 102,000 | | | CNH | | | 671,062 | | | HSB | | 01/20/21 | | | — | | | | 1,093 | |
| USD | | | 212,697 | | | COP | | | 817,658,247 | | | CIT | | 02/16/21 | | | — | | | | 26,599 | |
| USD | | | 688,842 | | | CZK | | | 15,918,658 | | | HSB | | 01/22/21 | | | — | | | | 52,354 | |
| USD | | | 3,284 | | | CZK | | | 75,852 | | | JPM | | 01/22/21 | | | — | | | | 248 | |
| USD | | | 66,467 | | | DKK | | | 403,051 | | | SSB | | 03/25/21 | | | 194 | | | | — | |
| USD | | | 101,800 | | | EUR | | | 83,201 | | | HSB | | 01/20/21 | | | 119 | | | | — | |
| USD | | | 118,300 | | | EUR | | | 101,532 | | | HSB | | 01/20/21 | | | — | | | | 5,784 | |
| USD | | | 134,583 | | | EUR | | | 110,638 | | | HSB | | 01/20/21 | | | — | | | | 630 | |
| USD | | | 167,000 | | | EUR | | | 139,737 | | | HSB | | 01/20/21 | | | — | | | | 3,776 | |
| USD | | | 284,407 | | | EUR | | | 240,355 | | | HSB | | 01/20/21 | | | — | | | | 9,335 | |
| USD | | | 313,000 | | | EUR | | | 263,497 | | | HSB | | 01/20/21 | | | — | | | | 9,025 | |
| USD | | | 582,152 | | | EUR | | | 497,326 | | | HSB | | 01/20/21 | | | — | | | | 25,640 | |
| USD | | | 147,663 | | | EUR | | | 124,577 | | | JPM | | 01/20/21 | | | — | | | | 4,585 | |
The accompanying notes are an integral part of these financial statements.
38 Annual Report
Lazard Global Dynamic Multi-Asset Portfolio (continued)
| | | | | | | | | | | | | | | | | | | |
Currency
Purchased | | Quantity | | | Currency
Sold | | Quantity | | | Counterparty | | Settlement
Date | | Unrealized
Appreciation | | Unrealized
Depreciation | |
| | | | | | | | | | | | | | | | | | | | | | | |
| USD | | | 266,600 | | | EUR | | | 228,642 | | | JPM | | 01/20/21 | | $ | — | | | $ | 12,828 | |
| USD | | | 303,600 | | | EUR | | | 259,676 | | | JPM | | 01/20/21 | | | — | | | | 13,755 | |
| USD | | | 50,900 | | | GBP | | | 37,312 | | | HSB | | 01/20/21 | | | — | | | | 131 | |
| USD | | | 67,000 | | | GBP | | | 52,544 | | | JPM | | 01/20/21 | | | — | | | | 4,864 | |
| USD | | | 79,000 | | | GBP | | | 59,436 | | | JPM | | 01/20/21 | | | — | | | | 2,289 | |
| USD | | | 206,504 | | | GBP | | | 152,548 | | | JPM | | 01/20/21 | | | — | | | | 2,134 | |
| USD | | | 55,661 | | | HKD | | | 431,445 | | | SSB | | 03/25/21 | | | — | | | | 1 | |
| USD | | | 7,000 | | | HUF | | | 2,129,218 | | | HSB | | 01/22/21 | | | — | | | | 173 | |
| USD | | | 397,261 | | | HUF | | | 123,163,455 | | | HSB | | 01/22/21 | | | — | | | | 17,651 | |
| USD | | | 443,316 | | | HUF | | | 137,463,470 | | | JPM | | 01/22/21 | | | — | | | | 19,770 | |
| USD | | | 187,600 | | | JPY | | | 19,371,763 | | | HSB | | 01/20/21 | | | — | | | | 47 | |
| USD | | | 229,000 | | | JPY | | | 23,750,506 | | | HSB | | 01/20/21 | | | — | | | | 1,062 | |
| USD | | | 216,300 | | | JPY | | | 22,806,196 | | | JPM | | 01/20/21 | | | — | | | | 4,615 | |
| USD | | | 434,700 | | | JPY | | | 45,548,779 | | | JPM | | 01/20/21 | | | — | | | | 6,513 | |
| USD | | | 325,107 | | | JPY | | | 33,531,010 | | | SSB | | 03/25/21 | | | 64 | | | | — | |
| USD | | | 134,568 | | | MXN | | | 2,706,833 | | | HSB | | 01/20/21 | | | — | | | | 1,221 | |
| USD | | | 16,700 | | | NOK | | | 159,909 | | | JPM | | 01/20/21 | | | — | | | | 1,950 | |
| USD | | | 9,000 | | | NOK | | | 81,056 | | | JPM | | 01/22/21 | | | — | | | | 453 | |
| USD | | | 128,400 | | | NOK | | | 1,162,129 | | | JPM | | 01/22/21 | | | — | | | | 7,137 | |
| USD | | | 308,022 | | | NOK | | | 2,870,693 | | | JPM | | 01/22/21 | | | — | | | | 26,781 | |
| USD | | | 75,581 | | | NOK | | | 650,210 | | | SSB | | 03/25/21 | | | — | | | | 230 | |
| USD | | | 180,219 | | | NZD | | | 268,582 | | | CIT | | 01/20/21 | | | — | | | | 13,045 | |
| USD | | | 138,582 | | | NZD | | | 206,581 | | | HSB | | 01/20/21 | | | — | | | | 10,067 | |
| USD | | | 347,211 | | | NZD | | | 517,452 | | | JPM | | 01/20/21 | | | — | | | | 25,133 | |
| USD | | | 417,299 | | | PEN | | | 1,509,787 | | | CIT | | 02/16/21 | | | 113 | | | | — | |
| USD | | | 283,832 | | | PHP | | | 13,774,368 | | | HSB | | 01/15/21 | | | — | | | | 2,724 | |
| USD | | | 15,300 | | | PLN | | | 59,845 | | | HSB | | 01/20/21 | | | — | | | | 722 | |
| USD | | | 137,000 | | | PLN | | | 533,262 | | | HSB | | 01/20/21 | | | — | | | | 5,764 | |
| USD | | | 178,000 | | | PLN | | | 682,078 | | | HSB | | 01/20/21 | | | — | | | | 4,605 | |
| USD | | | 485,351 | | | PLN | | | 1,825,245 | | | HSB | | 01/20/21 | | | — | | | | 3,301 | |
| USD | | | 11,000 | | | PLN | | | 41,487 | | | JPM | | 01/20/21 | | | — | | | | 107 | |
| USD | | | 40,960 | | | PLN | | | 154,040 | | | JPM | | 01/20/21 | | | — | | | | 280 | |
| USD | | | 17,000 | | | RON | | | 70,087 | | | HSB | | 01/22/21 | | | — | | | | 576 | |
| USD | | | 40,200 | | | RON | | | 160,284 | | | HSB | | 01/22/21 | | | 4 | | | | — | |
| USD | | | 866,425 | | | RON | | | 3,632,088 | | | HSB | | 01/22/21 | | | — | | | | 44,428 | |
| USD | | | 17,652 | | | SGD | | | 23,945 | | | JPM | | 01/20/21 | | | — | | | | 467 | |
The accompanying notes are an integral part of these financial statements.
Annual Report 39
Lazard Global Dynamic Multi-Asset Portfolio (concluded)
| | | | | | | | | | | | | | | | | | | | | |
Currency
Purchased | | | Quantity | | | Currency
Sold | | | Quantity | | | Counterparty | | Settlement
Date | | Unrealized
Appreciation | | Unrealized
Depreciation |
| | | | | | | | | | | | | | | | | | | | | | | | | |
| USD | | | 134,731 | | | SGD | | | 180,143 | | | JPM | | 01/20/21 | | | $ | — | | | | $ | 1,578 | |
| USD | | | 134,733 | | | SGD | | | 179,980 | | | JPM | | 01/20/21 | | | | — | | | | | 1,452 | |
| USD | | | 303,600 | | | SGD | | | 415,871 | | | JPM | | 01/20/21 | | | | — | | | | | 11,077 | |
| USD | | | 9,958 | | | SGD | | | 13,162 | | | SSB | | 03/25/21 | | | | — | | | | | 2 | |
| Total gross unrealized appreciation/depreciation on | | | | | | | | | | |
| Forward Currency Contracts | | | $ | 648,637 | | | | $ | 718,080 | |
The accompanying notes are an integral part of these financial statements.
40 Annual Report
| | | | | | | |
| | | | | | Fair | |
| Description | | Shares | | | Value | |
| | | | | | | | | |
| Lazard Opportunistic Strategies Portfolio | | | | | | | | |
| | | | | | | | | |
| Exchange-Traded Funds | 93.9% | | | | | | | | |
| | | | | | | | | |
| Equity Funds | 63.7% | | | | | | | | |
| First Trust NASDAQ Cybersecurity ETF | | | 51,985 | | | $ | 2,307,094 | |
| Franklin FTSE Japan ETF | | | 77,950 | | | | 2,321,351 | |
| Health Care Select Sector SPDR Fund | | | 39,455 | | | | 4,475,775 | |
| iShares Core Dividend Growth ETF | | | 51,900 | | | | 2,326,158 | |
| iShares Core MSCI EAFE ETF | | | 27,760 | | | | 1,917,938 | |
| iShares Core MSCI Europe ETF | | | 36,925 | | | | 1,893,514 | |
| iShares Expanded Tech Sector ETF | | | 7,932 | | | | 2,774,852 | |
| iShares Expanded Tech-Software Sector ETF | | | 6,424 | | | | 2,274,739 | |
| iShares MSCI Eurozone ETF | | | 44,995 | | | | 1,983,380 | |
| iShares Russell 2000 ETF | | | 20,588 | | | | 4,036,483 | |
| Vanguard Consumer Staples ETF | | | 19,900 | | | | 3,461,008 | |
| Vanguard Industrials ETF | | | 24,931 | | | | 4,238,021 | |
| Vanguard S&P 500 ETF | | | 35,993 | | | | 12,370,434 | |
| Vanguard S&P 500 Value ETF | | | 28,419 | | | | 3,515,146 | |
| | | | | | | | 49,895,893 | |
| Fixed-Income Funds | 30.2% | | | | | | | | |
| Goldman Sachs Access Treasury 0-1 Year ETF | | | 25,980 | | | | 2,601,117 | |
| iShares 1-3 Year Treasury Bond ETF | | | 89,400 | | | | 7,722,372 | |
| Vanguard Intermediate-Term Corporate Bond ETF | | | 40,215 | | | | 3,906,485 | |
| Vanguard Intermediate-Term Treasury ETF | | | 135,300 | | | | 9,392,526 | |
| | | | | | | | 23,622,500 | |
Total Exchange-Traded Funds
(Cost $62,810,628) | | | | | | | 73,518,393 | |
| | | | | | | | | |
| Short-Term Investments | 6.2% | | | | | | | | |
State Street Institutional Treasury Money Market Fund, Premier Class,
0.01% (7 day yield)
(Cost $4,860,004) | | | 4,860,004 | | | | 4,860,004 | |
The accompanying notes are an integral part of these financial statements.
Annual Report 41
| | | | | | | |
| | | | | | Fair | |
| Description | | Shares | | | Value | |
| | | | | | | | | |
| Lazard Opportunistic Strategies Portfolio (concluded) | | | | | | | | |
| | | | | | | | | |
Total Investments | 100.1%
(Cost $67,670,632) | | | | | | $ | 78,378,397 | |
| | | | | | | | | |
| Liabilities in Excess of Cash and Other Assets | (0.1)% | | | | | | | (108,516 | ) |
| | | | | | | | | |
| Net Assets | 100.0% | | | | | | $ | 78,269,881 | |
The accompanying notes are an integral part of these financial statements.
42 Annual Report
| | | | | | | |
| | | | | | Fair | |
| Description | | Shares | | | Value | |
| | | | | | | |
| Lazard Real Assets Portfolio (•) | | | | | | | | |
| | | | | | | | | |
| Common Stocks | 65.9% | | | | | | | | |
| | | | | | | | | |
| Australia | 5.2% | | | | | | | | |
| Abacus Property Group REIT | | | 7,619 | | | $ | 16,871 | |
| Atlas Arteria, Ltd. | | | 54,839 | | | | 275,121 | |
| Aventus Group REIT | | | 11,687 | | | | 24,698 | |
| BWP Trust REIT | | | 6,656 | | | | 22,692 | |
| Charter Hall Group REIT | | | 9,003 | | | | 102,186 | |
| Charter Hall Long Wale REIT | | | 7,978 | | | | 28,620 | |
| Dexus | | | 4,029 | | | | 29,354 | |
| Goodman Group REIT | | | 7,536 | | | | 109,930 | |
| Growthpoint Properties Australia, Ltd. REIT | | | 6,558 | | | | 17,657 | |
| Ingenia Communities Group REIT | | | 10,501 | | | | 39,853 | |
| Scentre Group REIT | | | 35,408 | | | | 75,994 | |
| Stockland REIT | | | 9,088 | | | | 29,315 | |
| Transurban Group | | | 45,078 | | | | 475,170 | |
| | | | | | | | 1,247,461 | |
| Belgium | 0.2% | | | | | | | | |
| Shurgard Self Storage SA | | | 409 | | | | 17,743 | |
| Warehouses De Pauw CVA REIT | | | 934 | | | | 32,323 | |
| | | | | | | | 50,066 | |
| Brazil | 0.1% | | | | | | | | |
| JHSF Participacoes SA | | | 12,100 | | | | 18,321 | |
| | | | | | | | | |
| Canada | 1.0% | | | | | | | | |
| Agnico Eagle Mines, Ltd. | | | 1,148 | | | | 80,945 | |
| Altus Group, Ltd. | | | 809 | | | | 31,231 | |
| Atco, Ltd., Class I | | | 1,493 | | | | 42,800 | |
| Granite Real Estate Investment Trust | | | 809 | | | | 49,510 | |
| True North Commercial Real Estate Investment Trust | | | 5,440 | | | | 26,967 | |
| | | | | | | | 231,453 | |
| China | 2.2% | | | | | | | | |
| Agile Group Holdings, Ltd. | | | 22,000 | | | | 29,352 | |
| Central China Real Estate, Ltd. | | | 38,000 | | | | 17,655 | |
| China Resources Land, Ltd. | | | 8,000 | | | | 33,148 | |
| CIFI Holdings Group Co., Ltd. | | | 46,000 | | | | 39,006 | |
The accompanying notes are an integral part of these financial statements.
Annual Report 43
| | | | | | | |
| | | | | | Fair | |
| Description | | Shares | | | Value | |
| | | | | | | |
| Lazard Real Assets Portfolio (•) (continued) | | | | | | | | |
| | | | | | | | | |
| Country Garden Holdings Co., Ltd. | | | 19,000 | | | $ | 26,290 | |
| Gemdale Properties & Investment Corp., Ltd. | | | 128,000 | | | | 18,331 | |
| Gree Real Estate Co., Ltd., Class A (*) | | | 18,100 | | | | 17,889 | |
| KWG Group Holdings, Ltd. | | | 26,000 | | | | 35,635 | |
| Logan Group Co., Ltd. | | | 39,000 | | | | 63,915 | |
| Longfor Group Holdings, Ltd. | | | 12,000 | | | | 70,476 | |
| Powerlong Commercial Management Holdings, Ltd. | | | 7,500 | | | | 24,031 | |
| Powerlong Real Estate Holdings, Ltd. | | | 81,000 | | | | 56,006 | |
| Shanghai Wanye Enterprises Co., Ltd., Class A (*) | | | 5,300 | | | | 16,401 | |
| Sichuan Languang Justbon Services Group Co., Ltd., Class H | | | 2,600 | | | | 11,798 | |
| Sunac China Holdings, Ltd. | | | 6,000 | | | | 22,188 | |
| Sunac Services Holdings, Ltd. | | | 193 | | | | 427 | |
| Times China Holdings, Ltd. | | | 11,000 | | | | 15,306 | |
| Yuexiu Property Co., Ltd. | | | 104,000 | | | | 20,970 | |
| Zhongliang Holdings Group Co., Ltd. | | | 24,000 | | | | 16,019 | |
| | | | | | | | 534,843 | |
| Finland | 0.1% | | | | | | | | |
| Citycon Oyj | | | 2,339 | | | | 22,695 | |
| | | | | | | | | |
| France | 3.6% | | | | | | | | |
| Eutelsat Communications SA | | | 12,123 | | | | 137,203 | |
| Gecina SA REIT | | | 164 | | | | 25,325 | |
| Klepierre SA REIT | | | 758 | | | | 17,054 | |
| Unibail-Rodamco-Westfield REIT | | | 317 | | | | 25,015 | |
| Vinci SA | | | 6,736 | | | | 670,241 | |
| | | | | | | | 874,838 | |
| Germany | 1.3% | | | | | | | | |
| Aroundtown SA | | | 3,080 | | | | 23,032 | |
| Deutsche EuroShop AG (*) | | | 1,230 | | | | 27,729 | |
| Deutsche Wohnen SE | | | 1,516 | | | | 80,928 | |
| Sirius Real Estate, Ltd. | | | 19,688 | | | | 25,054 | |
| TAG Immobilien AG | | | 1,092 | | | | 34,521 | |
| Vonovia SE | | | 1,785 | | | | 130,166 | |
| | | | | | | | 321,430 | |
The accompanying notes are an integral part of these financial statements.
44 Annual Report
| | | | | | | |
| | | | | | Fair | |
| Description | | Shares | | | Value | |
| | | | | | | |
| Lazard Real Assets Portfolio (•) (continued) | | | | | | | | |
| | | | | | | | | |
| Hong Kong | 2.7% | | | | | | | | |
| CK Infrastructure Holdings, Ltd. | | | 11,500 | | | $ | 61,808 | |
| ESR Cayman, Ltd. (*) | | | 7,000 | | | | 25,158 | |
| Fortune Real Estate Investment Trust | | | 17,000 | | | | 16,197 | |
| Hang Lung Properties, Ltd. | | | 13,000 | | | | 34,407 | |
| Henderson Land Development Co., Ltd. | | | 11,000 | | | | 42,945 | |
| Hopson Development Holdings, Ltd. | | | 14,000 | | | | 35,681 | |
| Link Real Estate Investment Trust | | | 3,600 | | | | 32,801 | |
| Power Assets Holdings, Ltd. | | | 39,500 | | | | 214,261 | |
| Shimao Group Holdings, Ltd. | | | 10,500 | | | | 33,569 | |
| Shoucheng Holdings, Ltd. | | | 58,000 | | | | 16,474 | |
| Sun Hung Kai Properties, Ltd. | | | 8,000 | | | | 103,282 | |
| Wharf Real Estate Investment Co., Ltd. | | | 8,000 | | | | 41,713 | |
| | | | | | | | 658,296 | |
| Israel | 0.1% | | | | | | | | |
| Adgar Investment and Development, Ltd. | | | 5,837 | | | | 10,752 | |
| Property & Building Corp., Ltd. | | | 122 | | | | 12,034 | |
| | | | | | | | 22,786 | |
| Italy | 9.3% | | | | | | | | |
| ASTM SpA (*) | | | 3,512 | | | | 88,306 | |
| Atlantia SpA (*) | | | 30,575 | | | | 548,919 | |
| Hera SpA | | | 50,648 | | | | 185,372 | |
| Italgas SpA | | | 32,162 | | | | 205,236 | |
| Snam SpA | | | 122,004 | | | | 685,125 | |
| Terna Rete Elettrica Nazionale SpA | | | 69,773 | | | | 532,348 | |
| | | | | | | | 2,245,306 | |
| Japan | 3.1% | | | | | | | | |
| Daito Trust Construction Co., Ltd. | | | 400 | | | | 37,411 | |
| Daiwa House Industry Co., Ltd. | | | 1,700 | | | | 50,744 | |
| Daiwa House REIT Investment Corp. | | | 10 | | | | 24,735 | |
| GLP J-Reit | | | 37 | | | | 58,343 | |
| Industrial & Infrastructure Fund Investment Corp. REIT | | | 13 | | | | 24,001 | |
| Japan Logistics Fund, Inc. REIT | | | 8 | | | | 23,593 | |
| Japan Real Estate Investment Corp. | | | 6 | | | | 34,650 | |
| Katitas Co., Ltd. | | | 1,000 | | | | 32,268 | |
| Keihanshin Building Co., Ltd. | | | 1,900 | | | | 34,358 | |
The accompanying notes are an integral part of these financial statements.
Annual Report 45
| | | | | | | |
| | | | | | Fair | |
| Description | | Shares | | | Value | |
| | | | | | | |
| Lazard Real Assets Portfolio (•) (continued) | | | | | | | | |
| | | | | | | | | |
| Kenedix, Inc. | | | 3,900 | | | $ | 28,326 | |
| LaSalle Logiport REIT | | | 23 | | | | 37,061 | |
| MCUBS MidCity Investment Corp. REIT | | | 47 | | | | 42,793 | |
| Mitsubishi Estate Co., Ltd. | | | 5,000 | | | | 80,747 | |
| Mitsui Fudosan Co., Ltd. | | | 1,700 | | | | 35,832 | |
| Nippon Accommodations Fund, Inc. REIT | | | 2 | | | | 11,239 | |
| Nippon Building Fund, Inc. REIT | | | 5 | | | | 28,959 | |
| NIPPON REIT Investment Corp. | | | 10 | | | | 35,917 | |
| Open House Co., Ltd. | | | 600 | | | | 22,069 | |
| Orix JREIT, Inc. | | | 15 | | | | 24,800 | |
| SRE Holdings Corp. (*) | | | 1,800 | | | | 72,258 | |
| | | | | | | | 740,104 | |
| Luxembourg | 0.8% | | | | | | | | |
| SES SA | | | 21,299 | | | | 201,468 | |
| | | | | | | | | |
| Mexico | 0.3% | | | | | | | | |
| Corp Inmobiliaria Vesta SAB de CV | | | 19,000 | | | | 37,036 | |
| Fibra Uno Administracion SA de CV REIT | | | 19,100 | | | | 21,606 | |
| | | | | | | | 58,642 | |
| Netherlands | 0.1% | | | | | | | | |
| Eurocommercial Properties NV (*) | | | 1,775 | | | | 33,379 | |
| | | | | | | | | |
| Norway | 0.1% | | | | | | | | |
| Entra ASA | | | 1,342 | | | | 30,437 | |
| | | | | | | | | |
| Singapore | 0.8% | | | | | | | | |
| Keppel DC REIT | | | 19,800 | | | | 42,148 | |
| Manulife US Real Estate Investment Trust | | | 49,600 | | | | 36,984 | |
| Mapletree Commercial Trust REIT | | | 10,500 | | | | 16,901 | |
| Mapletree Industrial Trust REIT | | | 29,200 | | | | 63,894 | |
| Sasseur Real Estate Investment Trust | | | 30,900 | | | | 19,170 | |
| | | | | | | | 179,097 | |
| Spain | 3.0% | | | | | | | | |
| Ferrovial SA | | | 25,786 | | | | 712,528 | |
The accompanying notes are an integral part of these financial statements.
46 Annual Report
| | | | | | | |
| | | | | | Fair | |
| Description | | Shares | | | Value | |
| | | | | | | |
| Lazard Real Assets Portfolio (•) (continued) | | | | | | | | |
| | | | | | | | | |
| Sweden | 0.7% | | | | | | | | |
| Castellum AB | | | 2,109 | | | $ | 53,474 | |
| Catena AB | | | 561 | | | | 26,264 | |
| Fabege AB | | | 1,359 | | | | 21,354 | |
| Fastighets AB Balder, B Shares (*) | | | 401 | | | | 20,951 | |
| Nyfosa AB (*) | | | 3,638 | | | | 36,223 | |
| Sagax AB, Class D | | | 3,205 | | | | 12,483 | |
| | | | | | | | 170,749 | |
| Switzerland | 0.1% | | | | | | | | |
| Allreal Holding AG | | | 75 | | | | 17,236 | |
| | | | | | | | | |
| United Arab Emirates | 0.2% | | | | | | | | |
| Aldar Properties PJSC | | | 65,549 | | | | 56,264 | |
| | | | | | | | | |
| United Kingdom | 7.8% | | | | | | | | |
| Anglo American PLC | | | 1,800 | | | | 59,953 | |
| Big Yellow Group PLC REIT | | | 1,183 | | | | 17,753 | |
| Civitas Social Housing PLC REIT | | | 26,383 | | | | 37,825 | |
| Great Portland Estates PLC REIT | | | 2,576 | | | | 23,552 | |
| Linde PLC | | | 180 | | | | 47,432 | |
| National Grid PLC | | | 57,341 | | | | 682,965 | |
| Pennon Group PLC | | | 18,176 | | | | 236,784 | |
| Segro PLC REIT | | | 11,971 | | | | 155,197 | |
| Severn Trent PLC | | | 10,504 | | | | 328,983 | |
| United Utilities Group PLC | | | 23,606 | | | | 290,346 | |
| | | | | | | | 1,880,790 | |
| United States | 23.1% | | | | | | | | |
| Agree Realty Corp. REIT | | | 377 | | | | 25,101 | |
| Alexandria Real Estate Equities, Inc., REIT | | | 446 | | | | 79,486 | |
| American Tower Corp. REIT | | | 1,661 | | | | 372,828 | |
| Americold Realty Trust REIT | | | 1,252 | | | | 46,737 | |
| Apple Hospitality REIT, Inc. | | | 2,148 | | | | 27,731 | |
| AvalonBay Communities, Inc. REIT | | | 224 | | | | 35,936 | |
| Boston Properties, Inc. REIT | | | 554 | | | | 52,370 | |
| Brandywine Realty Trust REIT | | | 2,266 | | | | 26,988 | |
| Brixmor Property Group, Inc. REIT | | | 1,908 | | | | 31,577 | |
The accompanying notes are an integral part of these financial statements.
Annual Report 47
| | | | | | | |
| | | | | | Fair | |
| Description | | Shares | | | Value | |
| | | | | | | |
| Lazard Real Assets Portfolio (•) (continued) | | | | | | | | |
| | | | | | | | | |
| Brookfield Property REIT, Inc., Class A | | | 1,570 | | | $ | 23,456 | |
| Bunge, Ltd. | | | 1,014 | | | | 66,498 | |
| Camden Property Trust REIT | | | 561 | | | | 56,055 | |
| CareTrust REIT, Inc. REIT | | | 900 | | | | 19,962 | |
| CBRE Group, Inc., Class A (*) | | | 1,041 | | | | 65,292 | |
| Community Healthcare Trust, Inc. REIT | | | 561 | | | | 26,429 | |
| Consolidated Edison, Inc. | | | 5,840 | | | | 422,057 | |
| CoreSite Realty Corp. REIT | | | 446 | | | | $55,875 | |
| Crown Castle International Corp., REIT | | | 1,598 | | | | 254,386 | |
| CSX Corp. | | | 5,655 | | | | 513,191 | |
| Digital Realty Trust, Inc. REIT | | | 782 | | | | 109,097 | |
| Easterly Government Properties, Inc. REIT | | | 2,146 | | | | 48,607 | |
| Equinix, Inc. REIT | | | 269 | | | | 192,114 | |
| Equity Lifestyle Properties, Inc. REIT | | | 1,167 | | | | 73,941 | |
| Equity Residential REIT | | | 1,022 | | | | 60,584 | |
| Essex Property Trust, Inc. REIT | | | 152 | | | | 36,088 | |
| Extra Space Storage, Inc. REIT | | | 411 | | | | 47,618 | |
| Gaming and Leisure Properties, Inc. REIT | | | 1,550 | | | | 65,720 | |
| Getty Realty Corp. REIT | | | 920 | | | | 25,337 | |
| Healthcare Trust of America, Inc., Class A REIT | | | 1,228 | | | | 33,819 | |
| Healthpeak Properties, Inc. REIT | | | 1,815 | | | | 54,867 | |
| Highwoods Properties, Inc. REIT | | | 809 | | | | 32,061 | |
| Hilton Worldwide Holdings, Inc. | | | 1,971 | | | | 219,293 | |
| Host Hotels & Resorts, Inc. REIT | | | 2,015 | | | | 29,479 | |
| Innovative Industrial Properties, Inc. REIT | | | 162 | | | | 29,667 | |
| Invitation Homes, Inc., REIT | | | 1,343 | | | | 39,887 | |
| Iron Mountain, Inc. REIT | | | 1,122 | | | | 33,077 | |
| Lamar Advertising Co., Class A REIT | | | 371 | | | | 30,875 | |
| Life Storage, Inc. REIT | | | 282 | | | | 33,668 | |
| Medical Properties Trust, Inc. REIT | | | 3,088 | | | | 67,288 | |
| Mid-America Apartment Communities, Inc. REIT | | | 738 | | | | 93,497 | |
| National Retail Properties, Inc. REIT | | | 942 | | | | 38,547 | |
| Newmont Corp. | | | 1,542 | | | | 92,350 | |
| Norfolk Southern Corp. | | | 1,055 | | | | 250,679 | |
| Omega Healthcare Investors, Inc. REIT | | | 874 | | | | 31,744 | |
| Pennsylvania Real Estate Investment Trust | | | 3,930 | | | | 3,930 | |
The accompanying notes are an integral part of these financial statements.
48 Annual Report
| | | | | | | |
| | | | | | Fair | |
| Description | | Shares | | | Value | |
| | | | | | | |
| Lazard Real Assets Portfolio (•) (continued) | | | | | | | | |
| | | | | | | | | |
| PotlatchDeltic Corp. REIT | | | 971 | | | $ | 48,569 | |
| Prologis, Inc., REIT | | | 2,693 | | | | 268,384 | |
| PS Business Parks, Inc., REIT | | | 282 | | | | 37,469 | |
| Public Storage REIT | | | 567 | | | | 130,937 | |
| Rayonier, Inc., REIT | | | 1,119 | | | | 32,876 | |
| Realty Income Corp. REIT | | | 1,403 | | | | 87,225 | |
| Redfin Corp. (*) | | | 486 | | | | 33,354 | |
| Regency Centers Corp. REIT | | | 520 | | | | 23,707 | |
| Retail Value, Inc. REIT | | | 561 | | | | $8,342 | |
| Sabra Health Care REIT, Inc. | | | 1,709 | | | | 29,685 | |
| SBA Communications Corp. REIT | | | 282 | | | | 79,561 | |
| Simon Property Group, Inc. REIT | | | 1,127 | | | | 96,111 | |
| Southwest Gas Holdings, Inc. | | | 2,900 | | | | 176,175 | |
| STORE Capital Corp. REIT | | | 876 | | | | 29,766 | |
| Sun Communities, Inc. REIT | | | 224 | | | | 34,037 | |
| Sunstone Hotel Investors, Inc. REIT | | | 2,912 | | | | 32,993 | |
| Tyson Foods, Inc., Class A | | | 428 | | | | 27,580 | |
| Uniti Group, Inc. REIT | | | 1,599 | | | | 18,756 | |
| Ventas, Inc. REIT | | | 1,035 | | | | 50,756 | |
| VEREIT, Inc. REIT | | | 982 | | | | 37,110 | |
| VICI Properties, Inc. REIT | | | 1,220 | | | | 31,110 | |
| Vulcan Materials Co. | | | 338 | | | | 50,129 | |
| Welltower, Inc. REIT | | | 1,246 | | | | 80,517 | |
| Weyerhaeuser Co. REIT | | | 1,585 | | | | 53,145 | |
| WP Carey, Inc. REIT | | | 926 | | | | 65,357 | |
| Xenia Hotels & Resorts, Inc. REIT | | | 1,648 | | | | 25,050 | |
| | | | | | | | 5,564,490 | |
Total Common Stocks
(Cost $14,376,700) | | | | | | | 15,872,679 | |
| | | | | | | | | |
| Exchange-Traded Funds | 5.6% | | | | | | | | |
| Aberdeen Standard Physical Silver Shares ETF (Δ) | | | 5,500 | | | | 140,525 | |
| SPDR Gold Shares (Δ) | | | 6,808 | | | | 1,214,275 | |
| | | | | | | | | |
Total Exchange-Traded Funds
(Cost $1,244,718) | | | | | | | 1,354,800 | |
The accompanying notes are an integral part of these financial statements.
Annual Report 49
| | | | | | | |
| | | | | | Fair | |
| Description | | Shares | | | Value | |
| | | | | | | |
| Lazard Real Assets Portfolio (•) (continued) | | | | | | | | |
| | | | | | | | | |
| Short-Term Investments | 23.8% | | | | | | | | |
State Street Institutional Treasury Money Market Fund, Premier Class,
0.01% (7 day yield) (Δ)
(Cost $5,725,684) | | | 5,725,684 | | | $ | 5,725,684 | |
| | | | | | | | | |
Total Investments | 95.3%
(Cost $21,347,102) (») | | | | | | $ | 22,953,163 | |
| | | | | | | | | |
| Cash and Other Assets in Excess of Liabilities | 4.7% | | | | | | | 1,121,093 | |
| | | | | | | | | |
| Net Assets | 100.0% | | | | | | $ | 24,074,256 | |
The accompanying notes are an integral part of these financial statements.
50 Annual Report
Lazard Real Assets Portfolio (•) (continued)
Forward Currency Contracts open at December 31, 2020:
| | | | | | | | | | | | | | | | | | | |
Currency
Purchased | | Quantity | | | Currency
Sold | | Quantity | | | Counterparty | | Settlement
Date | Unrealized
Appreciation | Unrealized
Depreciation | |
| | | | | | | | | | | | | | | | | | | |
| AUD | | | 54,067 | | | USD | | | 40,924 | | | JPM | | 03/25/21 | | $ | 786 | | | $ | — | |
| CAD | | | 3,970 | | | USD | | | 3,083 | | | SSB | | 03/25/21 | | | 37 | | | | — | |
| EUR | | | 112,510 | | | USD | | | 138,079 | | | JPM | | 03/25/21 | | | — | | | | 384 | |
| USD | | | 215,828 | | | AUD | | | 285,834 | | | CIT | | 03/25/21 | | | — | | | | 4,679 | |
| USD | | | 30,475 | | | AUD | | | 40,377 | | | HSB | | 03/25/21 | | | — | | | | 674 | |
| USD | | | 321,414 | | | AUD | | | 425,772 | | | JPM | | 03/25/21 | | | — | | | | 7,048 | |
| USD | | | 210,326 | | | AUD | | | 278,596 | | | SSB | | 03/25/21 | | | — | | | | 4,597 | |
| USD | | | 31,470 | | | CAD | | | 40,118 | | | CIT | | 03/25/21 | | | — | | | | 54 | |
| USD | | | 14,434 | | | CAD | | | 18,406 | | | JPM | | 03/25/21 | | | — | | | | 29 | |
| USD | | | 922,090 | | | EUR | | | 756,630 | | | CIT | | 03/25/21 | | | — | | | | 3,915 | |
| USD | | | 1,834,793 | | | EUR | | | 1,506,534 | | | HSB | | 03/25/21 | | | — | | | | 8,985 | |
| USD | | | 1,308,212 | | | EUR | | | 1,074,039 | | | SSB | | 03/25/21 | | | — | | | | 6,255 | |
| USD | | | 866,892 | | | GBP | | | 645,208 | | | HSB | | 03/25/21 | | | — | | | | 15,867 | |
| USD | | | 507,313 | | | GBP | | | 377,415 | | | JPM | | 03/25/21 | | | — | | | | 9,058 | |
| USD | | | 133,042 | | | GBP | | | 98,864 | | | SSB | | 03/25/21 | | | — | | | | 2,222 | |
| USD | | | 158,526 | | | HKD | | | 1,228,910 | | | CIT | | 03/25/21 | | | — | | | | 18 | |
| USD | | | 18,648 | | | HKD | | | 144,543 | | | SSB | | 03/25/21 | | | — | | | | — | |
| USD | | | 94,107 | | | HKD | | | 729,547 | | | SSB | | 03/25/21 | | | — | | | | 13 | |
| Total gross unrealized appreciation/depreciation on Forward Currency Contracts | | | | $ | 823 | | | $ | 63,798 | |
Futures Contracts open at December 31, 2020 (Δ):
| | | | | | | | | | | | | | | | | | | | |
| Type | | Number of
Contracts | | Notional
Amount | | | Expiration
Date | | Notional
Cost | | | Fair
Value | | Unrealized
Appreciation | Unrealized
Depreciation | |
| | | | | | | | | | | | | | | | | | | | | | | | | |
| Natural Gas | | 10 | | $ | 100,000 | | | 02/24/2021 | | $ | 256,600 | | | $ | 252,600 | | | $ | — | | | $ | 4,000 | |
| Sugar 11 | | 2 | | | 224,000 | | | 02/26/2021 | | | 28,963 | | | | 34,698 | | | | 5,734 | | | | — | |
| Cotton No. 2 | | 1 | | | 50,000 | | | 03/09/2021 | | | 35,161 | | | | 39,060 | | | | 3,899 | | | | — | |
| Low Sulphur Gasoil | | 1 | | | 100 | | | 03/11/2021 | | | 42,775 | | | | 42,500 | | | | — | | | | 275 | |
| Soybean Oil | | 1 | | | 60,000 | | | 03/12/2021 | | | 24,342 | | | | 25,440 | | | | 1,098 | | | | — | |
| Total gross unrealized appreciation/depreciation on Futures Contracts | | | | | | | | | | $ | 10,731 | | | $ | 4,275 | |
The accompanying notes are an integral part of these financial statements.
Annual Report 51
Lazard Real Assets Portfolio (•) (continued)
Total Return Swap Agreements open at December 31, 2020 (Δ):
| | | | | | | | | | | | | | | | | | | | |
| Currency | | Counterparty | | Notional
Amount | | | Expiration
Date | | Receive | | Pay | | Payable | | Payment
Frequency | Unrealized
Appreciation |
| | | | | | | | | | | | | | | | | | | | | | | |
| USD | | GSC | | $ | 5,594,481 | | | 10/22/21 | | Appreciation, | | | 0.00 | % | | Depreciation, | | Upon | | $ | 407,293 | |
| | | | | | | | | | | and dividends paid, on commodities in a custom momentum basket | | | | | | and dividend expense (if applicable), on commodities in a custom momentum basket | | Maturity(a) | | | | |
| (a) | For swap agreements, the net settlement will occur on the expiration date. |
The accompanying notes are an integral part of these financial statements.
52 Annual Report
Lazard Real Assets Portfolio (•) (concluded)
The following table represents the commodity exposure expressed as a percentage of the notional amount of the individual commodity underlying the custom total return basket swap agreements with GSC, as of December 31, 2020:
| | | | | | | |
| Commodity | | Commodity Index
Ticker Symbol | | Commodity Exposure Expressed as
a Percentage of Notional Amount | | |
| | | | | | | |
| Aluminum | | BCOMAL | | | 4.86 | % | |
| Bean Oil | | BCOMBO | | | 3.61 | | |
| Brent Crude | | BCOMCO | | | 3.18 | | |
| Coffee | | BCOMKC | | | 2.25 | | |
| Copper | | BCOMHG | | | 11.29 | | |
| Corn | | BCOMCN | | | 8.49 | | |
| Cotton | | BCOMCT | | | 0.32 | | |
| Crude Oil | | BCOMCL | | | 3.23 | | |
| Gasoline (RBOB) | | BCOMRB | | | 0.29 | | |
| Gold | | BCOMGC | | | 1.69 | | |
| Heating Oil | | BCOMHO | | | 2.96 | | |
| Kansas Wheat | | BCOMKW | | | 3.13 | | |
| Lean Hogs | | BCOMLH | | | 2.95 | | |
| Live Cattle | | BCOMLC | | | 3.75 | | |
| Natural Gas | | BCOMNG | | | 8.18 | | |
| Nickel | | BCOMNI | | | 3.10 | | |
| Silver | | BCOMSI | | | 5.11 | | |
| Soy Meal | | BCOMSM | | | 7.99 | | |
| Soybeans | | BCOMSY | | | 11.87 | | |
| Sugar | | BCOMSB | | | 2.64 | | |
| Wheat | | BCOMWH | | | 5.14 | | |
| Zinc | | BCOMZS | | | 3.97 | | |
| Total | | | | | 100.00 | % | |
The accompanying notes are an integral part of these financial statements.
Annual Report 53
The Lazard Funds, Inc. Notes to Portfolios of Investments
December 31, 2020
| (*) | Non-income producing security. |
| (§) | Variable and floating rate securities are securities for which interest rate changes are based on changes in a designated base rate. The rates shown are those in effect on December 31, 2020. |
| (#) | Pursuant to Rule 144A under the Securities Act of 1933, these securities may only be traded among “qualified institutional buyers.” At December 31, 2020, these securities amounted to 1.8% of net assets of Lazard Global Dynamic Multi-Asset Portfolio. |
| (») | The portfolio, at all times, maintains portfolio securities in sufficient amount to cover its obligations related to investments in forward currency contracts. |
| (•) | Lazard Real Assets Portfolio’s Portfolio of Investments and accompanying notes are presented on a consolidated basis. |
| (Δ) | The security is owned by Lazard Real Assets Portfolio, Ltd., a wholly-owned subsidiary of the Lazard Real Assets Portfolio. See Note 1 in the Notes to the Financial Statements. |
Security Abbreviations:
| ADR | — | American Depositary Receipt |
| BBSW | — | Bank Bill Swap Reference Rate |
| ETF | — | Exchange-Traded Fund |
| EURIBOR | — | Euro Interbank Offered Rate |
| LIBOR | — | London Interbank Offered Rate |
| NIBOR | — | Norway Interbank Offered Rate |
| PJSC | — | Public Joint Stock Company |
| REIT | — | Real Estate Investment Trust |
| SOFR | — | Secured Overnight Financing Rate |
Currency Abbreviations:
| AUD | — | Australian Dollar | JPY | — | Japanese Yen |
| CAD | — | Canadian Dollar | KRW | — | South Korean Won |
| CHF | — | Swiss Franc | MXN | — | Mexican New Peso |
| CLP | — | Chilean Peso | NOK | — | Norwegian Krone |
| CNH | — | Chinese Yuan Renminbi | NZD | — | New Zealand Dollar |
| CZK | — | Czech Koruna | PEN | — | Peruvian Sol |
| COP | — | Colombian Peso | PHP | — | Philippine Peso |
| DKK | — | Danish Krone | PLN | — | Polish Zloty |
| EUR | — | Euro | RON | — | New Romanian Leu |
| GBP | — | British Pound Sterling | RUB | — | Russian Ruble |
| HKD | — | Hong Kong Dollar | SEK | — | Swedish Krona |
| HUF | — | Hungarian Forint | SGD | — | Singapore Dollar |
| IDR | — | Indonesian Rupiah | THB | — | Thai Baht |
| INR | — | Indian Rupee | USD | — | United States Dollar |
Counterparty Abbreviations:
| CIT | — | Citibank NA |
| GSC | — | Goldman Sachs International |
| HSB | — | HSBC Bank USA NA |
| JPM | — | JPMorgan Chase Bank NA |
| MSC | — | Morgan Stanley & Co. |
| SSB | — | State Street Bank and Trust Co. |
The accompanying notes are an integral part of these financial statements.
54 Annual Report
Portfolio holdings by industry (as a percentage of net assets), for those Portfolios previously presented by country:
| Industry† | | Lazard
Global
Dynamic
Multi-Asset
Portfolio | | | Lazard
Real
Assets
Portfolio | | |
| | | | | | | | |
| Common Stocks and Corporate & Quasi Government Bonds | | | | | | | | | |
| Aerospace & Defense | | | 0.8 | % | | | — | % | |
| Air Freight & Logistics | | | 0.2 | | | | — | | |
| Auto Components | | | 0.4 | | | | — | | |
| Automobiles | | | 1.9 | | | | — | | |
| Banks | | | 4.3 | | | | — | | |
| Beverages | | | 2.4 | | | | — | | |
| Biotechnology | | | 0.3 | | | | — | | |
| Building Products | | | 0.4 | | | | — | | |
| Capital Markets | | | 3.1 | | | | — | | |
| Chemicals | | | 0.6 | | | | 0.2 | | |
| Commercial Services & Suppliers | | | 0.2 | | | | — | | |
| Communications Equipment | | | 0.5 | | | | — | | |
| Construction & Engineering | | | 0.1 | | | | 5.7 | | |
| Construction Materials | | | 0.1 | | | | 0.2 | | |
| Consumer Finance | | | 0.7 | | | | — | | |
| Containers & Packaging | | | 0.4 | | | | — | | |
| Distributors | | | — | | | | — | | |
| Diversified Consumer Services | | | 0.3 | | | | — | | |
| Diversified Financial Services | | | 0.5 | | | | — | | |
| Diversified Telecommunication Services | | | 1.9 | | | | — | | |
| Electric Utilities | | | 0.5 | | | | 3.4 | | |
| Electrical Equipment | | | 1.7 | | | | — | | |
| Electronic Equipment, Instruments & Components | | | 0.4 | | | | — | | |
| Energy Equipment & Services | | | 0.1 | | | | — | | |
| Entertainment | | | 0.7 | | | | — | | |
| Equity Real Estate Investment Trusts (REITs) | | | 0.8 | | | | 21.5 | | |
| Food & Staples Retailing | | | 1.7 | | | | — | | |
| Food Products | | | 0.4 | | | | 0.4 | | |
| Gas Utilities | | | 0.1 | | | | 4.4 | | |
| Health Care Equipment & Supplies | | | 0.7 | | | | — | | |
| Health Care Providers & Services | | | 2.0 | | | | — | | |
| Hotels, Restaurants & Leisure | | | 2.6 | | | | 0.9 | | |
| Household Durables | | | 0.2 | | | | — | | |
| Household Products | | | 1.9 | | | | — | | |
| Independent Power & Renewable Electricity Producers | | | 0.2 | | | | — | | |
| Industrial Conglomerates | | | 0.4 | | | | — | | |
| Insurance | | | 1.8 | | | | — | | |
The accompanying notes are an integral part of these financial statements.
Annual Report 55
| Industry† | | Lazard
Global
Dynamic
Multi-Asset
Portfolio | | | Lazard
Real
Assets
Portfolio | | |
| | | | | | | | |
| Interactive Media & Services | | | 2.0 | % | | | — | % | |
| Internet & Direct Marketing Retail | | | 1.5 | | | | — | | |
| IT Services | | | 1.6 | | | | — | | |
| Leisure Products | | | 0.3 | | | | — | | |
| Life Sciences Tools & Services | | | 1.6 | | | | — | | |
| Machinery | | | 1.6 | | | | — | | |
| Marine | | | 0.1 | | | | — | | |
| Media | | | 0.7 | | | | 1.4 | | |
| Metals & Mining | | | 0.7 | | | | 1.0 | | |
| Multiline Retail | | | 0.8 | | | | — | | |
| MultiUtilities | | | 0.3 | | | | 5.5 | | |
| Oil, Gas & Consumable Fuels | | | 0.7 | | | | — | | |
| Personal Products | | | 1.0 | | | | — | | |
| Pharmaceuticals | | | 3.6 | | | | — | | |
| Professional Services | | | 1.0 | | | | — | | |
| Real Estate Management & Development | | | 0.4 | | | | 8.7 | | |
| Road & Rail | | | 0.8 | | | | 3.2 | | |
| Semiconductors & Semiconductor Equipment | | | 1.6 | | | | — | | |
| Software | | | 4.5 | | | | — | | |
| Specialty Retail | | | 1.8 | | | | — | | |
| Technology Hardware, Storage & Peripherals | | | 2.4 | | | | — | | |
| Textiles, Apparel & Luxury Goods | | | 0.3 | | | | — | | |
| Thrifts & Mortgage Finance | | | — | | | | — | | |
| Tobacco | | | 0.1 | | | | — | | |
| Trading Companies & Distributors | | | 0.3 | | | | — | | |
| Transportation Infrastructure | | | — | | | | 5.8 | | |
| Water Utilities | | | — | | | | 3.6 | | |
| Wireless Telecommunication Services | | | 0.8 | | | | — | | |
| Subtotal | | | 65.8 | | | | 65.9 | | |
| Exchange Traded Funds | | | 5.3 | | | | 5.6 | | |
| Foreign Government Obligations | | | 23.2 | | | | — | | |
| Supranationals | | | 3.7 | | | | — | | |
| US Municipal Bonds | | | 0.7 | | | | — | | |
| US Treasury Securities | | | 0.5 | | | | — | | |
| Short-Term Investments | | | 0.6 | | | | 23.8 | | |
| Total Investments | | | 99.8 | % | | | 95.3 | % | |
| † | Industry classifications may be different than those used for compliance monitoring purposes. |
The accompanying notes are an integral part of these financial statements.
56 Annual Report
[This page intentionally left blank]
The Lazard Funds, Inc. Statements of Assets and Liabilities
| | | Lazard | | | Lazard | | | | | |
| | Global Dynamic | | | Opportunistic | | | | | |
| | | Multi-Asset | | | Strategies | | | | | |
| December 31, 2020 | | Portfolio | | | Portfolio | | | | | |
| | | | | |
| ASSETS | | | | | | | | | | | | |
| Investments in securities, at fair value | | $ | 58,068,675 | | | $ | 78,378,397 | | | | | |
| Cash | | | 200,249 | | | | 1,404 | | | | | |
| Foreign currency, at fair value | | | 26 | | | | — | | | | | |
| Receivables for: | | | | | | | | | | | | |
| Dividends and interest | | | 274,972 | | | | 18,750 | | | | | |
| Capital stock sold | | | 234 | | | | 6 | | | | | |
| Amount due from Investment Manager (Note 3) | | | — | | | | — | | | | | |
| Cash collateral due from broker on futures contracts and swap agreements | | | — | | | | — | | | | | |
| Receivable for variation margin on open futures contracts | | | — | | | | — | | | | | |
| Gross unrealized appreciation on: | | | | | | | | | | | | |
| Swap agreements | | | — | | | | — | | | | | |
| Forward currency contracts | | | 648,637 | | | | — | | | | | |
| Total assets | | | 59,192,793 | | | | 78,398,557 | | | | | |
| | | | | |
| LIABILITIES | | | | | | | | | | | | |
| Payables for: | | | | | | | | | | | | |
| Management fees | | | 22,101 | | | | 43,369 | | | | | |
| Accrued professional services | | | 35,702 | | | | 29,576 | | | | | |
| Accrued shareholders’ reports | | | 1,062 | | | | 18,991 | | | | | |
| Accrued registration fees | | | 1,530 | | | | 16,314 | | | | | |
| Accrued custodian fees | | | 51,428 | | | | 12,332 | | | | | |
| Accrued directors’ fees | | | 25 | | | | 124 | | | | | |
| Accrued distribution fees | | | 52 | | | | 37 | | | | | |
| Capital stock redeemed | | | — | | | | 1,696 | | | | | |
| Investments purchased | | | 200,249 | | | | — | | | | | |
| Gross unrealized depreciation on forward currency contracts | | | 718,080 | | | | — | | | | | |
| Other accrued expenses and payables | | | 1,529 | | | | 6,237 | | | | | |
| Total liabilities | | | 1,031,758 | | | | 128,676 | | | | | |
| Net assets | | $ | 58,161,035 | | | $ | 78,269,881 | | | | | |
| | | | | |
| NET ASSETS | | | | | | | | | | | | |
| Paid in capital | | $ | 52,231,443 | | | $ | 67,882,718 | | | | | |
| Distributable earnings (Accumulated loss) | | | 5,929,592 | | | | 10,387,163 | | | | | |
| Net assets | | $ | 58,161,035 | | | $ | 78,269,881 | | | | | |
| | | | | |
| Institutional Shares | | | | | | | | | | | | |
| Net assets | | $ | 57,925,017 | | | $ | 78,116,079 | | | | | |
| Shares of capital stock outstanding* | | | 5,427,381 | | | | 7,380,473 | | | | | |
| Net asset value, offering and redemption price per share | | $ | 10.67 | | | $ | 10.58 | | | | | |
| | | | | |
| Open Shares | | | | | | | | | | | | |
| Net assets | | $ | 236,018 | | | $ | 153,802 | | | | | |
| Shares of capital stock outstanding* | | | 22,108 | | | | 14,614 | | | | | |
| Net asset value, offering and redemption price per share | | $ | 10.68 | | | $ | 10.52 | | | | | |
| Cost of investments in securities | | $ | 50,688,367 | | | $ | 67,670,632 | | | | | |
| Cost of foreign currency | | $ | 26 | | | $ | — | | | | | |
| | |
| * | $0.001 par value, 6,900,000,000 shares authorized for the Portfolios in total. |
| (a) | Consolidated Statement of Assets and Liabilities. |
The accompanying notes are an integral part of these financial statements.
58 Annual Report
| | Lazard | | |
| | Real Assets | | |
| | Portfolio (a) | | |
| | | | | | |
| | | $ | 22,953,163 | | |
| | | | — | | |
| | | | 1,756 | | |
| | | | | | |
| | | | 58,912 | | |
| | | | 10 | | |
| | | | 20,305 | | |
| | | | | | |
| | | | 774,604 | | |
| | | | | | |
| | | | 13,636 | | |
| | | | | | |
| | | | 407,293 | | |
| | | | 823 | | |
| | | | 24,230,502 | | |
| | | | | | |
| | | | — | | |
| | | | 42,836 | | |
| | | | 659 | | |
| | | | 3,841 | | |
| | | | 41,624 | | |
| | | | 8 | | |
| | | | 16 | | |
| | | | — | | |
| | | | 1 | | |
| | | | | | |
| | | | 63,798 | | |
| | | | 3,463 | | |
| | | | 156,246 | | |
| | | $ | 24,074,256 | | |
| | | | | | |
| | | $ | 22,697,742 | | |
| | | | 1,376,514 | | |
| | | $ | 24,074,256 | | |
| | | | | | |
| | | $ | 23,958,588 | | |
| | | | 2,319,287 | | |
| | | | | | |
| | | $ | 10.33 | | |
| | | | | | |
| | | $ | 115,668 | | |
| | | 11,188 | | |
| | | | | | |
| | | $ | 10.34 | | |
| | | $ | 21,347,102 | | |
| | | $ | 1,740 | | |
Annual Report 59
The Lazard Funds, Inc. Statements of Operations
| | | Lazard | | | Lazard | | | | | |
| | Global Dynamic | | | Opportunistic | | | | | |
| | | Multi-Asset | | | Strategies | | | | | |
| For the Period Ended December 31, 2020 | | Portfolio | | | Portfolio | | | | | |
| | | | | |
| Investment Income (Loss) | | | | | | | | | | | | |
| Income | | | | | | | | | | | | |
| Dividends | | $ | 453,531 | | | $ | 1,169,100 | | | | | |
| Interest | | | 442,083 | | | | 45,617 | | | | | |
| Total investment income* | | | 895,614 | | | | 1,214,717 | | | | | |
| Expenses | | | | | | | | | | | | |
| Management fees (Note 3) | | | 412,167 | | | | 766,045 | | | | | |
| Registration fees | | | 36,752 | | | | 51,563 | | | | | |
| Professional services | | | 43,143 | | | | 49,035 | | | | | |
| Shareholders’ reports | | | 7,564 | | | | 35,773 | | | | | |
| Custodian fees | | | 132,980 | | | | 32,501 | | | | | |
| Administration fees | | | 27,264 | | | | 30,189 | | | | | |
| Shareholders’ services | | | 9,689 | | | | 17,011 | | | | | |
| Directors’ fees and expenses | | | 7,394 | | | | 9,004 | | | | | |
| Distribution fees (Open Shares) | | | 665 | | | | 396 | | | | | |
| Other^ | | | 6,301 | | | | 10,335 | | | | | |
| Total gross expenses before broker expense on securities sold short | | | 683,919 | | | | 1,001,852 | | | | | |
| Broker expense on securities sold short | | | — | | | | 7,179 | | | | | |
| Total gross expenses | | | 683,919 | | | | 1,009,031 | | | | | |
| Management fees waived and expenses reimbursed | | | (218,962 | ) | | | (215,717 | ) | | | | |
| Total net expenses | | | 464,957 | | | | 793,314 | | | | | |
| Net investment income (loss) | | | 430,657 | | | | 421,403 | | | | | |
| Net Realized and Unrealized Gain (Loss) | | | | | | | | | | | | |
| Net realized gain (loss) on: | | | | | | | | | | | | |
| Investments** | | | (538,842 | ) | | | 986,691 | | | | | |
| Securities sold short | | | — | | | | (146,392 | ) | | | | |
| Foreign currency transactions | | | (38,475 | ) | | | — | | | | | |
| Forward currency contracts | | | 409,494 | | | | — | | | | | |
| Futures contracts | | | — | | | | — | | | | | |
| Swap agreements | | | — | | | | — | | | | | |
| Total net realized gain (loss) | | | (167,823 | ) | | | 840,299 | | | | | |
| | | | | |
| Net change in unrealized appreciation (depreciation) on: | | | | | | | | | | | | |
| Investments | | | 1,909,974 | | | | 4,899,229 | | | | | |
| Securities sold short | | | — | | | | 473,033 | | | | | |
| Foreign currency translations | | | 6,562 | | | | — | | | | | |
| Forward currency contracts | | | (66,272 | ) | | | — | | | | | |
| Futures contracts | | | — | | | | — | | | | | |
| Swap agreements | | | — | | | | — | | | | | |
| Total net change in unrealized appreciation (depreciation) | | | 1,850,264 | | | | 5,372,262 | | | | | |
| Net realized and unrealized gain (loss) | | | 1,682,441 | | | | 6,212,561 | | | | | |
| Net increase (decrease) in net assets resulting from operations | | $ | 2,113,098 | | | $ | 6,633,964 | | | | | |
| * Net of foreign withholding taxes of | | $ | 19,346 | | | $ | — | | | | | |
| ** Net of foreign capital gains taxes of | | $ | — | | | $ | — | | | | | |
| ^ Includes interest on line of credit of | | $ | 34 | | | $ | 72 | | | | | |
| (a) | Consolidated Statement of Operations. |
The accompanying notes are an integral part of these financial statements.
60 Annual Report
| | | Lazard | | |
| | | Real Assets | | |
| | | Portfolio (a) | | |
| | | | | | |
| | | $ | 383,823 | | |
| | | | 133,070 | | |
| | | | 516,893 | | |
| | | | | | |
| | | | 135,709 | | |
| | | | 37,858 | | |
| | | | 75,615 | | |
| | | | 5,886 | | |
| | | | 114,596 | | |
| | | | 23,662 | | |
| | | | 8,828 | | |
| | | | 15,868 | | |
| | | | 457 | | |
| | | | 10,886 | | |
| | | | | | |
| | | | 429,365 | | |
| | | — | | |
| | | | 429,365 | | |
| | | | (256,903 | ) | |
| | | | 172,462 | | |
| | | | 344,431 | | |
| | | | | | |
| | | | 490,154 | | |
| | | — | | |
| | | | (1,233 | ) | |
| | | | (413,715 | ) | |
| | | | (117,932 | ) | |
| | | | 2,963 | | |
| | | | (39,763 | ) | |
| | | | | | |
| | | | 136,077 | | |
| | | — | | |
| | | | 802 | | |
| | | | (1,263 | ) | |
| | | | 8,784 | | |
| | | | 393,892 | | |
| | | | 538,292 | | |
| | | | 498,529 | | |
| | | | | | |
| | | $ | 842,960 | | |
| | | $ | 21,495 | | |
| | | $ | 86 | | |
| | | $ | 58 | | |
Annual Report 61
The Lazard Funds, Inc. Statements of Changes in Net Assets
| | | Lazard | | | | | |
| | | Global Dynamic Multi-Asset Portfolio | | | | | |
| | | Year Ended | | | Year Ended | | | | | |
| | | December 31, | | | December 31, | | | | | |
| | | 2020 | | | 2019 | | | | | |
| | | | | |
| Increase (Decrease) in Net Assets | | | | | | | | | | | | |
| | | | | |
| Operations | | | | | | | | | | | | |
| Net investment income (loss) | | $ | 430,657 | | | $ | 647,125 | | | | | |
| Net realized gain (loss) | | | (167,823 | ) | | | (34,410 | ) | | | | |
| Net change in unrealized appreciation (depreciation) | | | 1,850,264 | | | | 6,947,863 | | | | | |
| Net increase (decrease) in net assets resulting from operations | | | 2,113,098 | | | | 7,560,578 | | | | | |
| | | | | |
| Distributions to shareholders (Note 2(h)) | | | | | | | | | | | | |
| Net investment income and net realized gains | | | | | | | | | | | | |
| Institutional Shares | | | (1,164,138 | ) | | | (607,408 | ) | | | | |
| Open Shares | | | (4,081 | ) | | | (2,851 | ) | | | | |
| Net decrease in net assets resulting from distributions | | | (1,168,219 | ) | | | (610,259 | ) | | | | |
| | | | | |
| Capital stock transactions | | | | | | | | | | | | |
| Net proceeds from sales | | | | | | | | | | | | |
| Institutional Shares | | | 13,573,016 | | | | 3,315,020 | | | | | |
| Open Shares | | | 38,391 | | | | 101,513 | | | | | |
| Net proceeds from reinvestment of distributions | | | | | | | | | | | | |
| Institutional Shares | | | 1,164,138 | | | | 607,408 | | | | | |
| Open Shares | | | 4,081 | | | | 2,851 | | | | | |
| Cost of shares redeemed | | | | | | | | | | | | |
| Institutional Shares | | | (5,246,998 | ) | | | (5,930,367 | ) | | | | |
| Open Shares | | | (90,981 | ) | | | (74,979 | ) | | | | |
| Net increase (decrease) in net assets from capital stock transactions | | | 9,441,647 | | | | (1,978,554 | ) | | | | |
| Total increase (decrease) in net assets | | | 10,386,526 | | | | 4,971,765 | | | | | |
| Net assets at beginning of period | | | 47,774,509 | | | | 42,802,744 | | | | | |
| Net assets at end of period | | $ | 58,161,035 | | | $ | 47,774,509 | | | | | |
The accompanying notes are an integral part of these financial statements.
62 Annual Report
| | Lazard | | | Lazard | | |
| | Opportunistic Strategies Portfolio | | | Real Assets Portfolio (a) | | |
| | Year Ended | | | Year Ended | | | Year Ended | | | Year Ended | | |
| | December 31, | | | December 31, | | | December 31, | | | December 31, | | |
| | 2020 | | | 2019 | | | 2020 | | | 2019 | | |
| | | | | | | | | | | | | | | | | |
| | $ | 421,403 | | | $ | 996,030 | | | $ | 344,431 | | | $ | 274,713 | | |
| | | 840,299 | | | | 3,928,159 | | | | (39,763 | ) | | | (29,648 | ) | |
| | | 5,372,262 | | | | 9,164,208 | | | | 538,292 | | | | 2,305,670 | | |
| | | 6,633,964 | | | | 14,088,397 | | | | 842,960 | | | | 2,550,735 | | |
| | | | | | | | | | | | | | | | | |
| | | (1,635,417 | ) | | | (1,640,929 | ) | | | (890,908 | ) | | | (392,070 | ) | |
| | | (2,819 | ) | | | (3,453 | ) | | | (3,741 | ) | | | (1,189 | ) | |
| | | | | | | | | | | | | | | | | |
| | | (1,638,236 | ) | | | (1,644,382 | ) | | | (894,649 | ) | | | (393,259 | ) | |
| | | | | | | | | | | | | | | | | |
| | | 4,433,096 | | | | 7,393,394 | | | | 6,113,393 | | | | 246,555 | | |
| | | 1,947 | | | | 6,169 | | | | 1,056,495 | | | | 15,632 | | |
| | | | | | | | | | | | | | | | | |
| | | 1,561,574 | | | | 1,534,238 | | | | 890,908 | | | | 392,070 | | |
| | | 2,617 | | | | 3,285 | | | | 3,741 | | | | 1,189 | | |
| | | | | | | | | | | | | | | | | |
| | | (16,379,299 | ) | | | (40,611,931 | ) | | | (451,652 | ) | | | (1,438,693 | ) | |
| | | (62,305 | ) | | | (121,466 | ) | | | (1,066,899 | ) | | | (653 | ) | |
| | | | | | | | | | | | | | | | | |
| | | (10,442,370 | ) | | | (31,796,311 | ) | | | 6,545,986 | | | | (783,900 | ) | |
| | | (5,446,642 | ) | | | (19,352,296 | ) | | | 6,494,297 | | | | 1,373,576 | | |
| | | 83,716,523 | | | | 103,068,819 | | | | 17,579,959 | | | | 16,206,383 | | |
| | $ | 78,269,881 | | | $ | 83,716,523 | | | $ | 24,074,256 | | | $ | 17,579,959 | | |
Annual Report 63
| | | Lazard | | | | | |
| | | Global Dynamic Multi-Asset Portfolio | | | | | |
| | | Year Ended | | | Year Ended | | | | | |
| | | December 31, | | | December 31, | | | | | |
| | | 2020 | | | 2019 | | | | | |
| | | | |
| Shares issued and redeemed | | | | | | | | | | | | |
| | | | |
| Institutional Shares | | | | | | | | | | | | |
| Shares outstanding at beginning of period | | | 4,403,915 | | | | 4,593,006 | | | | | |
| Shares sold | | | 1,431,989 | | | | 324,728 | | | | | |
| Shares issued to shareholders from reinvestment of distributions | | | 110,450 | | | | 56,451 | | | | | |
| Shares redeemed | | | (518,973 | ) | | | (570,270 | ) | | | | |
| Net increase (decrease) | | | 1,023,466 | | | | (189,091 | ) | | | | |
| Shares outstanding at end of period | | | 5,427,381 | | | | 4,403,915 | | | | | |
| | | | |
| Open Shares | | | | | | | | | | | | |
| Shares outstanding at beginning of period | | | 27,210 | | | | 24,305 | | | | | |
| Shares sold | | | 3,726 | | | | 9,879 | | | | | |
| Shares issued to shareholders from reinvestment of distributions | | | 387 | | | | 265 | | | | | |
| Shares redeemed | | | (9,215 | ) | | | (7,239 | ) | | | | |
| Net increase (decrease) | | | (5,102 | ) | | | 2,905 | | | | | |
| Shares outstanding at end of period | | | 22,108 | | | | 27,210 | | | | | |
| (a) | Consolidated Statements of Changes in Net Assets. |
The accompanying notes are an integral part of these financial statements.
64 Annual Report
| | Lazard | | | Lazard | | |
| | Opportunistic Strategies Portfolio | | | Real Assets Portfolio (a) | | |
| | Year Ended | | | Year Ended | | | Year Ended | | | Year Ended | | |
| | December 31, | | | December 31, | | | December 31, | | | December 31, | | |
| | | 2020 | | | | 2019 | | | | 2020 | | | | 2019 | | |
| | | | | | | | | | | | | | | | | |
| | | 8,460,555 | | | | 11,766,647 | | | | 1,639,120 | | | | 1,715,687 | | |
| | | 460,110 | | | | 781,937 | | | | 636,605 | | | | 23,075 | | |
| | | | | | | | | | | | | | | | | |
| | | 148,761 | | | | 155,602 | | | | 89,265 | | | | 37,072 | | |
| | | (1,688,953 | ) | | | (4,243,631 | ) | | | (45,703 | ) | | | (136,714 | ) | |
| | | (1,080,082 | ) | | | (3,306,092 | ) | | | 680,167 | | | | (76,567 | ) | |
| | | 7,380,473 | | | | 8,460,555 | | | | 2,319,287 | | | | 1,639,120 | | |
| | | | | | | | | | | | | | | | | |
| | | 21,180 | | | | 32,902 | | | | 6,050 | | | | 4,528 | | |
| | | 205 | | | | 648 | | | | 119,887 | | | | 1,474 | | |
| | | | | | | | | | | | | | | | | |
| | | 251 | | | | 335 | | | | 373 | | | | 112 | | |
| | | (7,022 | ) | | | (12,705 | ) | | | (115,122 | ) | | | (64 | ) | |
| | | (6,566 | ) | | | (11,722 | ) | | | 5,138 | | | | 1,522 | | |
| | | 14,614 | | | | 21,180 | | | | 11,188 | | | | 6,050 | | |
Annual Report 65
The Lazard Funds, Inc. Financial Highlights
LAZARD GLOBAL DYNAMIC MULTI-ASSET PORTFOLIO
| Selected data for a share | | | | | | | | | | | | | For the Period | |
| of capital stock outstanding | | Year Ended | | 5/27/16* to | |
| throughout the period | | 12/31/20 | | | 12/31/19 | | | 12/31/18 | | | 12/31/17 | | | 12/31/16 | |
| | | | | | | | | | | | | | | | | | | | | |
| Institutional Shares | | | | | | | | | | | | | | | | | | | | |
| Net asset value, beginning of period | | $ | 10.78 | | | $ | 9.27 | | | $ | 11.49 | | | $ | 10.00 | | | $ | 10.00 | |
| Income (Loss) from investment operations: | | | | | | | | | | | | | | | | | | | | |
| Net investment income (loss) (a) | | | 0.08 | | | | 0.14 | | | | 0.16 | | | | 0.15 | | | | 0.06 | |
| Net realized and unrealized gain (loss) | | | 0.02 | | | | 1.51 | | | | (0.92 | ) | | | 1.92 | | | | (0.01 | ) |
| | | | | | | | | | | | | | | | | | | | | |
| Total from investment operations | | | 0.10 | | | | 1.65 | | | | (0.76 | ) | | | 2.07 | | | | 0.05 | |
| Less distributions from: | | | | | | | | | | | | | | | | | | | | |
| Net investment income | | | (0.21 | ) | | | (0.14 | ) | | | (0.20 | ) | | | (0.14 | ) | | | (0.05 | ) |
| Net realized gains | | | — | | | | — | | | | (1.26 | ) | | | (0.44 | ) | | | — | (b) |
| | | | | | | | | | | | | | | | | | | | | |
| Total distributions | | | (0.21 | ) | | | (0.14 | ) | | | (1.46 | ) | | | (0.58 | ) | | | (0.05 | ) |
| | | | | | | | | | | | | | | | | | | | | |
| Net asset value, end of period | | $ | 10.67 | | | $ | 10.78 | | | $ | 9.27 | | | $ | 11.49 | | | $ | 10.00 | |
| | | | | | | | | | | | | | | | | | | | | |
| Total Return (c) | | | 1.00 | % | | | 17.80 | % | | | –6.35 | % | | | 20.69 | % | | | 0.53 | % |
| | | | | | | | | | | | | | | | | | | | | |
| Ratios and Supplemental Data: | | | | | | | | | | | | | | | | | | | | |
| Net assets, end of period (in thousands) | | $ | 57,925 | | | $ | 47,481 | | | $ | 42,577 | | | $ | 68,761 | | | $ | 48,544 | |
| Ratios to average net assets (d): | | | | | | | | | | | | | | | | | | | | |
| Net expenses | | | 0.90 | % | | | 0.90 | % | | | 0.90 | % | | | 0.90 | % | | | 0.90 | % |
| Gross expenses | | | 1.32 | % | | | 1.45 | % | | | 1.34 | % | | | 1.42 | % | | | 2.14 | % |
| Net investment income (loss) | | | 0.84 | % | | | 1.36 | % | | | 1.36 | % | | | 1.40 | % | | | 0.95 | % |
| Portfolio turnover rate | | | 173 | % | | | 125 | % | | | 120 | % | | | 102 | % | | | 67 | % |
The accompanying notes are an integral part of these financial statements.
66 Annual Report
| Selected data for a share | | | | | | | | | | | | | For the Period | |
| of capital stock outstanding | | Year Ended | | 5/27/16* to | |
| throughout the period | | 12/31/20 | | | 12/31/19 | | | 12/31/18 | | | 12/31/17 | | | 12/31/16 | |
| | | | | | | | | | | | | | | | | | | | | |
| Open Shares | | | | | | | | | | | | | | | | | | | | |
| Net asset value, beginning of period | | $ | 10.78 | | | $ | 9.27 | | | $ | 11.49 | | | $ | 10.00 | | | $ | 10.00 | |
| Income (Loss) from investment operations: | | | | | | | | | | | | | | | | | | | | |
| Net investment income (loss) (a) | | | 0.06 | | | | 0.11 | | | | 0.12 | | | | 0.12 | | | | 0.04 | |
| Net realized and unrealized gain (loss) | | | 0.03 | | | | 1.51 | | | | (0.91 | ) | | | 1.91 | | | | (0.01 | ) |
| | | | | | | | | | | | | | | | | | | | | |
| Total from investment operations | | | 0.09 | | | | 1.62 | | | | (0.79 | ) | | | 2.03 | | | | 0.03 | |
| Less distributions from: | | | | | | | | | | | | | | | | | | | | |
| Net investment income | | | (0.19 | ) | | | (0.11 | ) | | | (0.17 | ) | | | (0.10 | ) | | | (0.03 | ) |
| Net realized gains | | | — | | | | — | | | | (1.26 | ) | | | (0.44 | ) | | | — | (b) |
| | | | | | | | | | | | | | | | | | | | | |
| Total distributions | | | (0.19 | ) | | | (0.11 | ) | | | (1.43 | ) | | | (0.54 | ) | | | (0.03 | ) |
| | | | | | | | | | | | | | | | | | | | | |
| Net asset value, end of period | | $ | 10.68 | | | $ | 10.78 | | | $ | 9.27 | | | $ | 11.49 | | | $ | 10.00 | |
| | | | | | | | | | | | | | | | | | | | | |
| Total Return (c) | | | 0.84 | % | | | 17.46 | % | | | –6.64 | % | | | 20.33 | % | | | 0.35 | % |
| | | | | | | | | | | | | | | | | | | | | |
| Ratios and Supplemental Data: | | | | | | | | | | | | | | | | | | | | |
| Net assets, end of period (in thousands) | | $ | 236 | | | $ | 293 | | | $ | 225 | | | $ | 414 | | | $ | 210 | |
| Ratios to average net assets (d): | | | | | | | | | | | | | | | | | | | | |
| Net expenses | | | 1.15 | % | | | 1.18 | % | | | 1.20 | % | | | 1.20 | % | | | 1.20 | % |
| Gross expenses | | | 3.09 | % | | | 5.45 | % | | | 4.20 | % | | | 5.79 | % | | | 9.43 | % |
| Net investment income (loss) | | | 0.61 | % | | | 1.10 | % | | | 1.07 | % | | | 1.09 | % | | | 0.72 | % |
| Portfolio turnover rate | | | 173 | % | | | 125 | % | | | 120 | % | | | 102 | % | | | 67 | % |
| * | The Portfolio commenced operations on May 27, 2016. |
| (a) | Net investment income (loss) has been computed using the average shares method. |
| (b) | Amount is less than $0.01 per share. |
| (c) | Total returns reflect reinvestment of all dividends and distributions, if any. Certain expenses of the Portfolio may have been waived or reimbursed by the Investment Manager, State Street or DST; without such waiver/reimbursement of expenses, the Portfolio’s returns would have been lower. Return for a period of less than one year is not annualized. |
| (d) | Annualized for a period of less than one year except for non-recurring expenses. |
The accompanying notes are an integral part of these financial statements.
Annual Report 67
LAZARD OPPORTUNISTIC STRATEGIES PORTFOLIO
| Selected data for a share | | | | | | | | | | | | | | | |
| of capital stock outstanding | | Year Ended | |
| throughout each period | | 12/31/20 | | | 12/31/19 | | | 12/31/18 | | | 12/31/17 | | | 12/31/16 | |
| | | | | | | | | | | | | | | | | | | | | |
| Institutional Shares | | | | | | | | | | | | | | | | | | | | |
| Net asset value, beginning of period | | $ | 9.87 | | | $ | 8.74 | | | $ | 10.60 | | | $ | 9.70 | | | $ | 9.36 | |
| Income (Loss) from investment operations: | | | | | | | | | | | | | | | | | | | | |
| Net investment income (loss) (a) | | | 0.05 | | | | 0.10 | | | | 0.14 | | | | 0.10 | | | | 0.16 | ^ |
| Net realized and unrealized gain (loss) | | | 0.88 | | | | 1.23 | | | | (1.48 | ) | | | 1.62 | | | | 0.34 | |
| | | | | | | | | | | | | | | | | | | | | |
| Total from investment operations | | | 0.93 | | | | 1.33 | | | | (1.34 | ) | | | 1.72 | | | | 0.50 | |
| Less distributions from: | | | | | | | | | | | | | | | | | | | | |
| Net investment income | | | (0.05 | ) | | | (0.12 | ) | | | (0.02 | ) | | | (0.14 | ) | | | (0.14 | ) |
| Net realized gains | | | (0.17 | ) | | | (0.08 | ) | | | (0.48 | ) | | | (0.68 | ) | | | — | |
| Return of capital | | | — | | | | — | | | | (0.02 | ) | | | — | | | | (0.02 | ) |
| | | | | | | | | | | | | | | | | | | | | |
| Total distributions | | | (0.22 | ) | | | (0.20 | ) | | | (0.52 | ) | | | (0.82 | ) | | | (0.16 | ) |
| | | | | | | | | | | | | | | | | | | | | |
| Redemption fees | | | — | | | | — | | | | — | | | | — | | | | — | (b) |
| | | | | | | | | | | | | | | | | | | | | |
| Net asset value, end of period | | $ | 10.58 | | | $ | 9.87 | | | $ | 8.74 | | | $ | 10.60 | | | $ | 9.70 | |
| | | | | | | | | | | | | | | | | | | | | |
| Total Return (c) | | | 9.47 | % | | | 15.16 | % | | | –12.72 | % | | | 17.74 | % | | | 5.36 | %^ |
| | | | | | | | | | | | | | | | | | | | | |
| Ratios and Supplemental Data: | | | | | | | | | | | | | | | | | | | | |
| Net assets, end of period (in thousands) | | $ | 78,116 | | | $ | 83,509 | | | $ | 102,783 | | | $ | 151,767 | | | $ | 141,494 | |
| Ratios to average net assets: | | | | | | | | | | | | | | | | | | | | |
| Net expenses | | | 1.04 | % | | | 1.22 | % | | | 1.02 | % | | | 1.05 | % | | | 1.02 | %^ |
| Gross expenses | | | 1.30 | % | | | 1.43 | % | | | 1.15 | % | | | 1.18 | % | | | 1.19 | % |
| Gross expenses, excluding expenses on securities sold short | | | 1.29 | % | | | 1.23 | % | | | 1.15 | %† | | | 1.15 | % | | | 1.19 | % |
| Net investment income (loss) | | | 0.55 | % | | | 1.08 | % | | | 1.32 | % | | | 0.99 | % | | | 1.72 | %^ |
| Portfolio turnover rate: | | | | | | | | | | | | | | | | | | | | |
| Excluding securities sold short | | | 88 | % | | | 82 | % | | | 227 | % | | | 142 | % | | | 238 | % |
| Including securities sold short | | | 94 | % | | | 99 | % | | | N/A | %† | | | 153 | % | | | N/A | %† |
The accompanying notes are an integral part of these financial statements.
68 Annual Report
| Selected data for a share | | | | | | | | | | | | | | | |
| of capital stock outstanding | | Year Ended | |
| throughout each period | | 12/31/20 | | | 12/31/19 | | | 12/31/18 | | | 12/31/17 | | | 12/31/16 | |
| | | | | | | | | | | | | | | | | | | | | |
| Open Shares | | | | | | | | | | | | | | | | | | | | |
| Net asset value, beginning of period | | $ | 9.82 | | | $ | 8.69 | | | $ | 10.55 | | | $ | 9.65 | | | $ | 9.32 | |
| Income (Loss) from investment operations: | | | | | | | | | | | | | | | | | | | | |
| Net investment income (loss) (a) | | | 0.03 | | | | 0.07 | | | | 0.10 | | | | 0.05 | | | | 0.13 | ^ |
| Net realized and unrealized gain (loss) | | | 0.86 | | | | 1.23 | | | | (1.46 | ) | | | 1.64 | | | | 0.33 | |
| | | | | | | | | | | | | | | | | | | | | |
| Total from investment operations | | | 0.89 | | | | 1.30 | | | | (1.36 | ) | | | 1.69 | | | | 0.46 | |
| Less distributions from: | | | | | | | | | | | | | | | | | | | | |
| Net investment income | | | (0.02 | ) | | | (0.09 | ) | | | — | | | | (0.11 | ) | | | (0.11 | ) |
| Net realized gains | | | (0.17 | ) | | | (0.08 | ) | | | (0.48 | ) | | | (0.68 | ) | | | — | |
| Return of capital | | | — | | | | — | | | | (0.02 | ) | | | — | | | | (0.02 | ) |
| | | | | | | | | | | | | | | | | | | | | |
| Total distributions | | | (0.19 | ) | | | (0.17 | ) | | | (0.50 | ) | | | (0.79 | ) | | | (0.13 | ) |
| | | | | | | | | | | | | | | | | | | | | |
| Net asset value, end of period | | $ | 10.52 | | | $ | 9.82 | | | $ | 8.69 | | | $ | 10.55 | | | $ | 9.65 | |
| | | | | | | | | | | | | | | | | | | | | |
| Total Return (c) | | | 9.14 | % | | | 14.91 | % | | | –13.05 | % | | | 17.48 | % | | | 4.97 | %^ |
| | | | | | | | | | | | | | | | | | | | | |
| Ratios and Supplemental Data: | | | | | | | | | | | | | | | | | | | | |
| Net assets, end of period (in thousands) | | $ | 154 | | | $ | 208 | | | $ | 286 | | | $ | 428 | | | $ | 823 | |
| Ratios to average net assets: | | | | | | | | | | | | | | | | | | | | |
| Net expenses | | | 1.28 | % | | | 1.51 | % | | | 1.32 | % | | | 1.34 | % | | | 1.32 | %^ |
| Gross expenses | | | 7.75 | % | | | 3.78 | % | | | 4.22 | % | | | 3.87 | % | | | 3.31 | % |
| Gross expenses, excluding expenses on securities sold short | | | 7.74 | % | | | 3.58 | % | | | 4.22 | %† | | | 3.85 | % | | | 3.31 | %† |
| Net investment income (loss) | | | 0.31 | % | | | 0.76 | % | | | 1.00 | % | | | 0.53 | % | | | 1.43 | %^ |
| Portfolio turnover rate: | | | | | | | | | | | | | | | | | | | | |
| Excluding securities sold short | | | 88 | % | | | 82 | % | | | 227 | % | | | 142 | % | | | 238 | % |
| Including securities sold short | | | 94 | % | | | 99 | % | | | N/A | %† | | | 153 | % | | | N/A | %† |
The accompanying notes are an integral part of these financial statements.
Annual Report 69
| † | No securities sold short during the year. |
| ^ | Refer to Note 3 in the Notes to Financial Statements for discussion of prior period custodian out-of-pocket expenses that were reimbursed to the Portfolio in the period. The amount of the reimbursement was less than $0.005 per share. There was no impact on the total return of the Portfolio. The net expenses and net investment income (loss) ratios of the Portfolio would be unchanged as the change to period custodian fees was offset against current period expense waivers/reimbursements with no impact to net expenses or net investment income (loss). |
| (a) | Net investment income (loss) has been computed using the average shares method. |
| (b) | Amount is less than $0.01 per share. |
| (c) | Total returns reflect reinvestment of all dividends and distributions, if any. Certain expenses of the Portfolio may have been waived or reimbursed by the Investment Manager, State Street or DST; without such waiver/reimbursement of expenses, the Portfolio’s returns would have been lower. |
The accompanying notes are an integral part of these financial statements.
70 Annual Report
LAZARD REAL ASSETS PORTFOLIO^
| Selected data for a share | | | | | | | | | | | | | For the Period | |
| of capital stock outstanding | | Year Ended | | 12/31/16* to | |
| throughout each period | | 12/31/20 | | | 12/31/19 | | | 12/31/18 | | | 12/31/17 | | | 12/31/16 | |
| | | | | | | | | | | | | | | | | | | | | |
| Institutional Shares | | | | | | | | | | | | | | | | | | | | |
| Net asset value, beginning of period | | $ | 10.69 | | | $ | 9.42 | | | $ | 10.71 | | | $ | 10.00 | | | $ | 10.00 | |
| Income (Loss) from investment operations: | | | | | | | | | | | | | | | | | | | | |
| Net investment income (loss) (a) | | | 0.17 | | | | 0.16 | | | | 0.16 | | | | 0.19 | | | | — | |
| Net realized and unrealized gain (loss) | | | (0.12 | ) | | | 1.35 | | | | (0.96 | ) | | | 0.78 | | | | — | (b) |
| | | | | | | | | | | | | | | | | | | | | |
| Total from investment operations | | | 0.05 | | | | 1.51 | | | | (0.80 | ) | | | 0.97 | | | | — | (b) |
| Less distributions from: | | | | | | | | | | | | | | | | | | | | |
| Net investment income | | | (0.20 | ) | | | (0.24 | ) | | | (0.25 | ) | | | (0.13 | ) | | | — | |
| Net realized gains | | | (0.21 | ) | | | — | (b) | | | (0.24 | ) | | | (0.13 | ) | | | — | |
| | | | | | | | | | | | | | | | | | | | | |
| Total distributions | | | (0.41 | ) | | | (0.24 | ) | | | (0.49 | ) | | | (0.26 | ) | | | — | |
| | | | | | | | | | | | | | | | | | | | | |
| Net asset value, end of period | | $ | 10.33 | | | $ | 10.69 | | | $ | 9.42 | | | $ | 10.71 | | | $ | 10.00 | |
| | | | | | | | | | | | | | | | | | | | | |
| Total Return (c) | | | 0.61 | % | | | 16.07 | % | | | –7.47 | % | | | 9.80 | % | | | 0.00 | % |
| | | | | | | | | | | | | | | | | | | | | |
| Ratios and Supplemental Data: | | | | | | | | | | | | | | | | | | | | |
| Net assets, end of period (in thousands) | | $ | 23,959 | | | $ | 17,515 | | | $ | 16,164 | | | $ | 17,812 | | | $ | 13,090 | |
| Ratios to average net assets (d): | | | | | | | | | | | | | | | | | | | | |
| Net expenses | | | 0.86 | % | | | 0.90 | % | | | 0.90 | % | | | 0.90 | % | | | 0.00 | % |
| Gross expenses | | | 2.13 | % | | | 2.20 | % | | | 2.04 | % | | | 3.13 | % | | | 3.49 | % |
| Net investment income (loss) | | | 1.73 | % | | | 1.59 | % | | | 1.53 | % | | | 1.79 | % | | | 0.00 | % |
| Portfolio turnover rate | | | 109 | % | | | 44 | % | | | 72 | % | | | 76 | % | | | 0 | % |
The accompanying notes are an integral part of these financial statements.
Annual Report 71
| Selected data for a share | | | | | | | | | | For the Period | | |
| of capital stock outstanding | | Year Ended | | 1/9/17* to | | |
| throughout each period | | 12/31/20 | | | 12/31/19 | | | 12/31/18 | | | 12/31/17 | | |
| | | | | | | | | | | | | | | | | | |
| Open Shares | | | | | | | | | | | | | | | | | |
| Net asset value, beginning of period | | $ | 10.67 | | | $ | 9.41 | | | $ | 10.70 | | | $ | 10.03 | | |
| Income (Loss) from investment operations: | | | | | | | | | | | | | | | | | |
| Net investment income (loss) (a) | | | 0.17 | | | | 0.14 | | | | 0.14 | | | | 0.18 | | |
| Net realized and unrealized gain (loss) | | | (0.14 | ) | | | 1.33 | | | | (0.96 | ) | | | 0.74 | | |
| | | | | | | | | | | | | | | | | | |
| Total from investment operations | | | 0.03 | | | | 1.47 | | | | (0.82 | ) | | | 0.92 | | |
| Less distributions from: | | | | | | | | | | | | | | | | | |
| Net investment income | | | (0.15 | ) | | | (0.21 | ) | | | (0.23 | ) | | | (0.12 | ) | |
| Net realized gains | | | (0.21 | ) | | | — | (b) | | | (0.24 | ) | | | (0.13 | ) | |
| | | | | | | | | | | | | | | | | | |
| Total distributions | | | (0.36 | ) | | | (0.21 | ) | | | (0.47 | ) | | | (0.25 | ) | |
| | | | | | | | | | | | | | | | | | |
| Net asset value, end of period | | $ | 10.34 | | | $ | 10.67 | | | $ | 9.41 | | | $ | 10.70 | | |
| | | | | | | | | | | | | | | | | | |
| Total Return (c) | | | 0.42 | % | | | 15.70 | % | | | –7.70 | % | | | 9.17 | % | |
| | | | | | | | | | | | | | | | | | |
| Ratios and Supplemental Data: | | | | | | | | | | | | | | | | | |
| | | | | | | | | | | | | | | | | | |
| Net assets, end of period (in thousands) | | $ | 116 | | | $ | 65 | | | $ | 43 | | | $ | 135 | | |
| Ratios to average net assets (d): | | | | | | | | | | | | | | | | | |
| Net expenses | | | 1.13 | % | | | 1.10 | % | | | 1.15 | % | | | 1.15 | % | |
| Gross expenses | | | 4.64 | % | | | 23.75 | % | | | 13.72 | % | | | 20.65 | % | |
| Net investment income (loss) | | | 1.77 | % | | | 1.39 | % | | | 1.29 | % | | | 1.69 | % | |
| Portfolio turnover rate | | | 109 | % | | | 44 | % | | | 72 | % | | | 76 | % | |
| | | | | | | | | | | | | | | | | | |
| ^ | Consolidated Financial Highlights. |
| * | The inception date for the Institutional Shares was December 30, 2016 and for the Open Shares was January 9, 2017. |
| (a) | Net investment income (loss) has been computed using the average shares method. |
| (b) | Amount is less than $0.01 per share. |
| (c) | Total returns reflect reinvestment of all dividends and distributions, if any. Certain expenses of the Portfolio may have been waived or reimbursed by the Investment Manager, State Street or DST; without such waiver/reimbursement of expenses, the Portfolio’s returns would have been lower. Returns for a period of less than one year are not annualized. |
| (d) | Annualized for a period of less than one year except for non-recurring expenses. |
The accompanying notes are an integral part of these financial statements.
72 Annual Report
The Lazard Funds, Inc. Notes to Financial Statements
December 31, 2020
1. Organization
The Lazard Funds, Inc. was incorporated in Maryland on May 17, 1991 and is registered under the Investment Company Act of 1940, as amended (the “1940 Act”), as an open-end management investment company. As of December 31, 2020, the Fund was comprised of thirty no-load portfolios (each referred to as a “Portfolio”). This report includes only the financial statements of the Lazard Global Dynamic Multi-Asset Portfolio (“Global Dynamic Multi-Asset”), the Lazard Opportunistic Strategies Portfolio (“Opportunistic Strategies”), and the Lazard Real Assets Porfolio (“Real Assets”, which was formerly the Lazard Real Assets and Pricing Portfolio). The financial statements of the other twenty-seven Portfolios are presented separately.
The Portfolios are operated as “diversified” funds, as defined in the 1940 Act.
Each Portfolio currently offers Institutional Shares and Open Shares. Each share class is identical except as to minimum investment requirements; the services offered to, and expenses borne by, each class; and the availability of Service Payments (as defined in the Fund’s prospectus).
Lazard Real Assets Portfolio commenced investment operations and issued Institutional Shares on December 30, 2016. Lazard Real Assets Portfolio, Ltd. (formerly Lazard Real Assets and Pricing Opportunities Portfolio, Ltd.) (the “Subsidiary”), organized under the laws of the Cayman Islands, was incorporated on October 7, 2016 and commenced operations on December 30, 2016. The Subsidiary acts as an investment vehicle for the Portfolio in order to effect certain investments on behalf of the Portfolio, consistent with its investment objective and policies as described in its prospectus. In addition to investing directly in commodity-linked instruments, the Portfolio may gain exposure to the commodities markets by investing up to 25% of its total assets in the Subsidiary. The financial statements of the Portfolio have been consolidated and include the accounts of both the Portfolio and the Subsidiary. All inter-company balances and transactions have been eliminated in consolidation. As of December 31, 2020, net assets of the Portfolio were $ 24,074,256, of which $ 4,877,940, or 20.26%, represented the
Annual Report 73
Portfolio’s ownership of all issued shares and voting rights of the Subsidiary.
2. Significant Accounting Policies
The accompanying financial statements are presented in conformity with GAAP. The Fund is an investment company and therefore applies specialized accounting guidance in accordance with Accounting Standards Codification Topic 946. The following is a summary of significant accounting policies consistently followed by the Fund in the preparation of the financial statements:
(a) Valuation of Investments—Equity securities traded on a securities exchange or market, including exchange-traded option contracts, rights and warrants, are valued at the last reported sales price (for US listed equity securities) or the closing price (for non-US listed equity securities) on the exchange or market on which the security is principally traded or, for securities trading on the NASDAQ National Market System (“NASDAQ”), the NASDAQ Official Closing Price. If there is no available closing price for a non-US listed equity security, the last reported sales price is used. If there are no reported sales of a security on the valuation date, the security is valued at the most recent quoted bid price on such date reported by such principal exchange or market. Futures contracts are valued at the settlement price on the exchange on which the contract is principally traded. Over the counter swap agreements are valued by an independent pricing service and centrally cleared swaps are valued at the last reported sale on the clearing exchange. Forward currency contracts generally are valued using quotations from an independent pricing service. Investments in money market funds are valued at the fund’s net asset value (“NAV”) per share.
Bonds and other fixed-income securities that are not exchange-traded are valued on the basis of prices provided by independent pricing services which are based on, among other things, trading in securities with similar characteristics, brokers’ quotations and/or a matrix system which considers such factors as other security prices, yields and maturities.
Calculation of a Portfolio’s NAV may not take place contemporaneously with the determination of the prices of portfolio assets used
74 Annual Report
in such calculation. Trading on certain non-US securities exchanges or markets, such as those in Europe and Asia, may be completed before the close of business on each business day in New York (i.e., a day on which the New York Stock Exchange (the “NYSE”) is open). In addition, securities trading in a particular non-US country or countries, may not take place on all business days in New York and on which the NAV of a Portfolio is calculated.
If a significant event materially affecting the value of securities occurs between the close of the exchange or market on which the security is principally traded and the time when a Portfolio’s NAV is calculated, or when current market quotations otherwise are determined not to be readily available or reliable (including restricted or other illiquid securities such as certain derivative instruments), such securities will be valued at their fair value as determined by, or in accordance with procedures approved by, the Fund’s Board of Directors (the “Board”). The fair value of non-US securities may be determined with the assistance of an independent pricing service using correlations between the movement of prices of such securities and indices of US securities and other appropriate indicators, such as closing market prices of relevant ADRs or futures contracts. Certain non-US securities may trade on days when a Portfolio is not open for business, thus affecting the value of the Portfolio’s assets on days when Portfolio shareholders may not be able to buy or sell Portfolio shares.
The Valuation Committee of the Investment Manager, which is subject to the oversight of the Board, may evaluate a variety of factors to determine the fair value of securities for which market quotations are determined not to be readily available or reliable. These factors include, but are not limited to, the type of security, the value of comparable securities, observations from financial institutions and relevant news events. Input from the Investment Manager’s portfolio management team also will be considered.
The effect of using fair value pricing is that the NAV of a Portfolio will reflect the affected securities’ values as determined in the judgment of the Board or its designee instead of being determined by the market. Using a fair value pricing methodology to price securities may result in a value that is different from the most
Annual Report 75
recent closing price of a security and from the prices used by other investment companies to calculate their portfolios’ NAVs.
(b) Portfolio Securities Transactions and Investment Income—Portfolio securities transactions are accounted for on trade date. Realized gain (loss) on sales of investments are recorded on a specific identification basis. Dividend income and dividend expenses on short sales are recorded on the ex-dividend date except for certain dividends from non-US securities where the dividend rate is not available. In such cases, the dividend is recorded as soon as the information is received by a Portfolio. Interest income, if any, is accrued daily. A Portfolio amortizes premiums and accretes discounts on fixed-income securities using the effective yield method.
A Portfolio may be subject to taxes imposed by non-US countries in which it invests. Such taxes are generally based upon income earned or capital gains (realized and/or unrealized). An affected Portfolio accrues and applies such taxes to net investment income, net realized gains and net unrealized gains concurrent with the recognition of income earned or capital gains (realized and/or unrealized) from the applicable Portfolio securities.
(c) Foreign Currency Translation and Forward Currency Contracts—The accounting records of the Fund are maintained in US dollars. Portfolio securities and other assets and liabilities denominated in a foreign currency are translated daily into US dollars at the prevailing rates of exchange. Purchases and sales of securities, income receipts and expense payments are translated into US dollars at the prevailing exchange rates on the respective transaction dates.
The Portfolios do not isolate the portion of operations resulting from changes in foreign exchange rates on investments from the fluctuations arising from changes in their market prices. Such fluctuations are included in net realized and unrealized gain (loss) on investments. A forward currency contract is an agreement between two parties to buy or sell currency at a set price on a future date. Daily fluctuations in the value of forward currency contracts are recorded as unrealized appreciation (depreciation) on forward currency contracts. When the contract is closed, the
76 Annual Report
Portfolio records a realized gain (loss) equal to the difference between the value at the time it was opened and the value at the time it was closed. Net realized gain (loss) on foreign currency transactions and forward currency contracts represent net foreign currency gain (loss) from forward currency contracts, disposition of foreign currencies, currency gain (loss) realized between the trade and settlement dates on securities transactions, and the difference between the amount of dividends, interest and foreign withholding taxes recorded on the Portfolios’ accounting records and the US dollar equivalent amounts actually received or paid. Net change in unrealized appreciation (depreciation) on foreign currency translations reflects the impact of changes in exchange rates on the value of assets and liabilities, other than investments in securities, during the period.
During the year ended December 31, 2020, the Global Dynamic Multi-Asset and Real Assets Portfolios traded in forward currency contracts.
(d) Futures Contracts—For hedging and investment purposes, certain Portfolios may enter into futures contracts in US domestic markets, or exchanges located outside the United States.
Foreign markets may offer advantages such as trading opportunities or arbitrage possibilities not available in the United States. Foreign markets, however, may have greater risk potential than domestic markets. For example, some foreign exchanges are principal markets so that no common clearing facility exists and an investor may look only to the broker for performance of the contract. In addition, any profits a Portfolio might realize in trading could be eliminated by adverse changes in the currency exchange rate, or the Portfolio could incur losses as a result of those changes. Transactions on foreign exchanges may include both commodities which are traded on domestic exchanges and those which are not. Unlike trading on domestic commodity exchanges, trading on foreign commodity exchanges is not regulated by the Commodity Futures Trading Commission.
Engaging in these transactions involves risk of loss to the Portfolio which could adversely affect the value of the Portfolio’s net assets.
Annual Report 77
Although each of these Portfolios intends to purchase or sell futures contracts only if there is an active market for such contracts, no assurance can be given that a liquid market will exist for any particular contract at any particular time. Many futures exchanges and boards of trade limit the amount of fluctuation permitted in futures contract prices during a single trading day. Once the daily limit has been reached in a particular contract, no trades may be made that day at a price beyond that limit or trading may be suspended for specified periods during the trading day. Futures contract prices could move to the limit for several consecutive trading days with little or no trading, thereby preventing prompt liquidation of futures positions and potentially subjecting the Portfolio to substantial losses.
During the year ended December 31, 2020, the Real Assets Portfolio traded in futures contracts.
(e) Swap Agreements—Swap agreements on equity securities involve commitments to pay interest in exchange for a market linked return based on a notional amount. The counterparty pays out the total return of the equity security or basket of equity securities and, in return, receives a regular stream of payments, based on an agreed-upon interest rate. To the extent the total return of the security or basket of securities underlying the transaction exceeds (or falls short of) the offsetting interest rate obligation, a Portfolio will receive a payment from (or make a payment to) the counterparty.
Commodity-linked swap agreements involve commitments to pay interest in exchange for a commodity-linked return based on a notional amount. To the extent the return of the reference commodity or commodity index or basket of reference commodities or commodity indexes underlying the transaction exceeds (or falls short of) the offsetting interest rate obligation, a Portfolio will receive a payment from (or make a payment to) the counterparty.
Swap agreements generally are valued by an independent pricing service, and the change in value, if any, is recorded as unrealized appreciation (depreciation) on swap agreements in a Portfolio’s accompanying Statement of Assets and Liabilities. Once the
78 Annual Report
interim payments are settled in cash, the net amount is recorded as realized gain (loss) on swap agreements in a Portfolio’s accompanying Statement of Operations, in addition to any realized gain (loss) recorded upon the termination of swap agreements.
During the year ended December 31, 2020, the Real Assets Portfolios traded in swap agreements.
(f) Short Sales—A short sale is a transaction in which a Portfolio sells securities it does not own but has borrowed in anticipation of a decline in the market price of the securities. The initial amount of a short sale is recorded as a liability which is marked-to-market daily. Fluctuations in the value of the short liability are recorded as unrealized gains or losses. A Portfolio realizes a gain or loss upon closing of the short sale (returning the security to the counterparty by way of purchase or delivery of a long position owned). Short sales by a Portfolio involve certain risks and special considerations. Possible losses from short sales differ from losses that could be incurred from a purchase of a security because losses from short sales may be unlimited, whereas losses from purchases cannot exceed the total amount invested. The Portfolio may have to pay a fee to borrow the particular security and is liable to the buyer for any dividends or interest payable on securities while those securities are in a short position. These dividends and interest amounts are an expense of the Portfolio. The Portfolio designates collateral consisting of cash, US government securities or other liquid assets sufficient to collateralize the market value of short positions.
Proceeds from short sales are generally retained in cash accounts or invested in securities that are cash equivalents. With regard to securities borrowed as of December 31, 2020, pursuant to short sale arrangements, a Portfolio has a right to set off any assets held (including the borrowed securities) or obligations owed to the lender (State Street), in the event of the lender’s default, against any obligations owed by the lender to the Portfolio under any agreement or collateral document, including the collateral value of the Securities Loan Collateral, as that term is defined in the Securities Lending and Services Agreement between the Fund and State Street.
Annual Report 79
For the year ended December 31, 2020, proceeds from securities sold short and purchases to cover short positions for the Opportunistic Strategies Portfolio were $0 and $4,647,604, respectively.
(g) Federal Income Taxes—The Fund’s policy is for each Portfolio to qualify as a regulated investment company under Subchapter M of the Internal Revenue Code of 1986, as amended (the “Code”), and to distribute all of its taxable income, including any net realized capital gains, to shareholders. Therefore, no federal income tax provision is required.
At December 31, 2020, the Global Dynamic Multi-Asset Portfolio had $896,176 unused short-term realized capital loss carryovers which, for federal income tax purposes, could be used to offset future realized capital gains.
Under current tax law, post-October capital losses or certain late-year ordinary losses, as defined by the Code, within the taxable year may be deferred and treated as occurring on the first day of the following tax year. For the tax year ended December 31, 2020, the following Portfolios elected to defer such losses as follows:
| Portfolio | | Post-October
Capital Loss
Deferral | | Late-Year
Ordinary Loss
Deferral | |
| Opportunistic Strategies | | $314,145 | | $ — | |
| Real Assets | | 15,048 | | 281,359 | |
For federal income tax purposes, the aggregate cost, aggregate gross unrealized appreciation, aggregate gross unrealized depreciation and the net unrealized appreciation (depreciation) were as follows:
| Portfolio | | Aggregate
Cost | | Aggregate
Gross
Unrealized
Appreciation | | Aggregate
Gross
Unrealized
Depreciation | | Net
Unrealized
Appreciation
(Depreciation) | |
| | | | | | | | | | |
| Global Dynamic Multi-Asset | | $50,786,541 | | $ 6,847,245 | | $228,588 | | $6,618,657 | |
| Opportunistic Strategies | | 67,670,632 | | 10,772,519 | | 64,754 | | 10,707,765 | |
| Real Assets | | 22,804,964 | | 852,204 | | 290,289 | | 561,915 | |
80 Annual Report
Management has analyzed the Portfolios tax positions, and has concluded that no liability for unrecognized tax benefits should be recorded related to uncertain tax positions taken on tax returns filed for any open tax years (or expected to be taken on future tax returns). Open tax years are those that remain subject to examination and are based on each tax jurisdiction’s statute of limitations. Each Portfolio files a US federal income tax return annually after its fiscal year-end, which is subject to examination by the Internal Revenue Service for a period of three years from the date of filing.
(h) Dividends and Distributions—For each Portfolio, income dividends are normally declared each business day and paid annually. except that the Real Assets Portfolio’s dividends from net investment income (if any), will be declared and paid quarterly. During any particular year, net realized gains from investment transactions in excess of available capital loss carryforwards would be taxable to the Portfolios, if not distributed. The Portfolios intend to declare and distribute these amounts, at least annually, to shareholders; but may be distributed more frequently. Differences in per share distributions, by class, are generally due to differences in class specific expenses.
Net income and realized gains from investments held by the Subsidiary are treated as ordinary income for tax purposes. If a net loss is realized by the Subsidiary in any taxable year, the loss will generally not be available to offset the Real Assets Portfolio’s ordinary income and/or capital gains for that year, or any future tax year.
Income and capital gains distributions are determined in accordance with federal income tax regulations which may differ from GAAP. These book/tax differences, which may result in distribution reclassifications, are primarily due to differing treatments of foreign currency transactions, wash sales, distributions redesignations, Treasury Inflation-Protected Securities, currency straddles, passive foreign investment companies, certain fixed-income securities, expenses, derivatives and distributions from real estate investment trusts. The book/tax differences relating to shareholder distri-
Annual Report 81
butions may result in reclassifications among certain capital accounts.
| Portfolio | | Paid in
Capital | | | Distributable
Earnings
(Accumulated Loss) | | |
| | | | | | | | |
| Global Dynamic Multi-Asset | | $ | (17,637 | ) | | | $17,637 | | |
| Opportunistic Strategies | | | (12,678 | ) | | | 12,678 | | |
| Real Assets | | | (30,135 | ) | | | 30,135 | | |
The tax character of dividends and distributions paid during the years ended December 31, were as follows:
| | | Ordinary Income | | Long-Term Capital Gain | |
| Portfolio | | 2020 | | | 2019 | | | 2020 | | | 2019 | | |
| | | | | | | | | | | | | | |
| Global Dynamic Multi-Asset | | $ | 1,168,219 | | | $ | 486,191 | | | $ | — | | | $ | 124,068 | | |
| Opportunistic Strategies | | | 378,002 | | | | 998,829 | | | | 1,260,234 | | | | 645,553 | | |
| Real Assets | | | 427,792 | | | | 388,282 | | | | 466,857 | | | | 4,977 | | |
At December 31, 2020, the components of distributable earnings (accumulated loss), on a tax basis, were as follows:
| Portfolio | | Undistributed
Ordinary Income
(Deferred Ordinary
Losses) | | | Undistributed
Long-Term
Capital Gain
(Deferred Capital
Losses) | | | Net Unrealized
Appreciation
(Depreciation)
Including Foreign
Currency | | |
| | | | | | | | | | | |
| Global Dynamic Multi-Asset | | $ | 239,799 | | | $ | (896,176 | ) | | $ | 6,585,969 | | |
| Opportunistic Strategies | | | — | | | | (314,145 | ) | | | 10,701,308 | | |
| Real Assets | | | — | | | | (296,407 | ) | | | 1,672,921 | | |
(i) Allocation of Expenses—Expenses common to the Fund, Lazard Retirement Series, Inc. and Lazard Global Total Return and Income Fund, Inc. (each a “Lazard Fund” and collectively, the “Lazard Fund Complex”), each a registered management investment company advised by the Investment Manager, not directly chargeable to one or more specific Lazard Funds are allocated to the Fund and among its Portfolios primarily on the basis of relative net assets. Expenses of the Fund not directly chargeable to one or more Portfolios are similarly allocated among the Portfolios on the basis of relative net assets. Portfolios accrue distribution and service (12b-1) fees in the Open Share class. Each Portfolio’s income, expenses (other than class specific expenses) and realized and unrealized gains and
82 Annual Report
losses are allocated proportionally each day between the classes based upon the relative net assets of each class.
(j) Redemption Fee—Until August 15, 2016, the Global Dynamic Multi-Asset and Opportunistic Strategies Portfolios imposed a 1.00% redemption fee (short-term trading fee) on Portfolio shares redeemed less than 30 days after such shares were acquired. The fees were retained by the Portfolios and are included as paid in capital on the Statements of Assets and Liabilities. As of August 15, 2016, redemption fees no longer apply to transactions in Portfolio shares.
(k) Estimates—The preparation of financial statements in conformity with GAAP requires management to make estimates and assumptions that affect the reported amounts of assets and liabilities and disclosure of contingent assets and liabilities at the date of the financial statements and the reported amounts of increases and decreases in net assets resulting from operations during the reporting period. Actual results could differ from those estimates.
(l) Net Asset Value—The NAV per share for each class of each Portfolio is determined each day the NYSE is open for trading as of the close of regular trading on the NYSE (generally 4:00 p.m. Eastern time). The Fund will not treat an intraday unscheduled disruption in NYSE trading as a closure of the NYSE, and will price its shares as of 4:00 p.m., if the particular disruption directly affects only the NYSE. The NAV per share of a class is determined by dividing the value of the total assets of the Portfolio represented by such class, less all liabilities, by the total number of Portfolio shares of such class outstanding.
3. Investment Management, Administration, Custody, Distribution and Transfer Agency Agreements
The Fund, on behalf of the Portfolios, has entered into a management agreement (the “Management Agreement”) with the Investment Manager. Pursuant to the Management Agreement, the Investment Manager manages the investment operations of each Portfolio and the assets of each Portfolio including the purchase, retention and disposition thereof, in accordance with the Portfolio’s investment
Annual Report 83
objectives, policies, and restrictions, and provides the Portfolios with administrative, operational and compliance assistance services. For its services provided to the Portfolios, the Investment Manager earns a management fee, accrued daily as a percentage of each Portfolio’s average daily net assets and payable by each Portfolio monthly, at the annual rate set forth below:
| Portfolio | | Annual Rate | |
| | | | | |
| Global Dynamic Multi-Asset | | | 0.80 | % |
| Opportunistic Strategies | | | 1.00 | |
| Real Assets | | | 0.65 | (a) |
| (a) | From January 1, 2020 until September 1, 2020, the annual rate was 0.70%. |
The Investment Manager provides investment management and other services to the Subsidiary. The Investment Manager does not receive separate compensation from the Subsidiary for providing such services. However, the Real Assets Portfolio pays the Investment Manager based on its net assets, which include the assets of the Subsidiary.
The Investment Manager has voluntarily agreed to waive its fees and, if necessary, reimburse each Portfolio until May 1, 2021 if the aggregate direct expenses of a Portfolio, exclusive of taxes, brokerage, interest on borrowings, dividend and interest expenses on securities sold short, fees and expenses of “Acquired Funds” (as defined in Form N-1A), fees and expenses related to filing foreign tax reclaims, and extraordinary expenses, on behalf of the Portfolio, exceed the percentages of the value of the Portfolio’s average daily net assets set forth opposite the Portfolio’s name in the table below. The Fund, on behalf of the Portfolio, may deduct from the payment to be made to the Investment Manager under the Management Agreement, or the Investment Manager will bear, such excess expenses.
| Portfolio | | Institutional
Shares | | Open Shares | |
| | | | | | | | | |
| Global Dynamic Multi-Asset | | | 0.90 | % | | | 1.15 | % |
| Opportunistic Strategies | | | 1.02 | | | | 1.27 | |
| Real Assets | | | 0.80 | (a) | | | 1.05 | (a) |
| | |
| (a) | From January 1, 2020 until September 1, 2020, annual rates were 0.90% and 1.15%, respectively. |
84 Annual Report
During the year ended December 31, 2020, the Investment Manager waived its management fees and reimbursed the following Portfolios for other expenses as follows:
| | | Institutional Shares | | | Open Shares | | |
| Portfolio | | Management
Fees Waived | | | Expenses
Reimbursed | | | Management
Fees Waived | | | Expenses
Reimbursed | | |
| | | | | | | | | | | | | | | | | | |
| Global Dynamic Multi-Asset | | $ | 213,788 | | | $ | — | | | $ | 2,129 | | | $ | 3,045 | | |
| Opportunistic Strategies | | | 205,492 | | | | — | | | | 1,582 | | | | 8,643 | | |
| Real Assets | | | 134,465 | | | | 116,040 | | | | 1,244 | | | | 5,154 | | |
The aforementioned waivers and/or reimbursements are not subject to recoupment by the Investment Manager.
State Street serves as the Fund’s custodian and provides the Fund with certain administrative services.
In December 2015, State Street announced that it had identified inconsistencies in the way in which clients were invoiced for custody out-of-pocket expenses from 1998 until 2015. The difference between what was charged and what should have been charged, plus interest, was recorded as a reimbursement when determined in 2016. Pursuant to the expense limitations described above, the Lazard Opportunistic Strategies Portfolio experienced management fee waivers during the year ended December 31, 2016. Accordingly, the reimbursement of out-of-pocket expenses resulted in the reduction in the waiver of management fees for certain Portfolios for the year ended December 31, 2016.
The Fund has a distribution agreement with Lazard Asset Management Securities LLC (the “Distributor”), a wholly-owned subsidiary of the Investment Manager, to serve as the distributor for shares of each Portfolio. The Distributor bears, amongst other things, the cost of preparing and distributing materials used by the Distributor in connection with its offering Portfolio shares and other advertising and promotional expenses.
Under a distribution and servicing plan adopted pursuant to Rule 12b-1 under the 1940 Act, each Portfolio pays a monthly fee to the Distributor, at an annual rate of 0.25% of the average daily net assets of its Open Shares, for certain distribution activities and providing services to holders of the Portfolio’s Open shares. The Distrib-
Annual Report 85
utor may make payments to third parties such as financial institutions, securities dealers and other industry professionals in respect of these services.
DST is the Fund’s transfer agent and dividend disbursing agent.
4. Directors’ Compensation
Certain Directors of the Fund are officers of the Investment Manager. For the period ended June 30, 2020, each Director who is not an affiliated person of the Investment Manager or any of its affiliates was paid by all of the Portfolios in the Lazard Fund Complex: (1) an annual retainer of $237,000, (2) an additional annual retainer of $33,700 to the lead Independent Director, and (3) an additional annual retainer of $23,500 to the Audit Committee Chair. The Independent Directors (an “Independent Director” is a Director who is not an “interested person” (as defined in the 1940 Act) of the Fund) also may be paid additional compensation for participation on ad hoc committees or other work performed on behalf of the Board. The Independent Directors may be paid additional fees for participation on ad hoc committees or other work performed on behalf of the Board. The Independent Directors are reimbursed for travel and other out-of-pocket expenses for attending Board and committee meetings or incurred in connection with work performed on behalf of the Board. The Directors do not receive benefits from the Fund pursuant to any pension, retirement or similar arrangement. The compensation policy (i.e., retainer amounts and any additional fees as described above) for Independent Directors for the Lazard Fund Complex will remain the same in 2021. Independent Directors’ compensation and expenses are allocated among the active portfolios in the Lazard Fund Complex at a rate of $5,000 per active portfolio with the remainder allocated among the active Portfolios on the basis of relative net assets. The Statements of Operations shows the Independent Directors’ compensation and expenses paid by each Portfolio.
5. Securities Transactions and Transactions with Affiliates
Purchases and sales of portfolio securities (excluding short-term investments and short sales) for the year ended December 31, 2020 were as follows:
86 Annual Report
| Portfolio | | Purchases | | | Sales | |
| | | | | | | | | |
| Global Dynamic Multi-Asset | | $ | 84,924,395 | | | $ | 74,566,193 | |
| Opportunistic Strategies | | | 59,802,621 | | | | 66,028,079 | |
| Real Assets | | | 18,374,112 | | | | 14,049,486 | |
| | | US Treasury Securities | |
| Portfolio | | Purchases | | | Sales | |
| Global Dynamic Multi-Asset | | $ | 8,490,628 | | | $ | 9,013,776 | |
| Real Assets | | $ | 770,477 | | | $ | 3,217,683 | |
At December 31, 2020, the Investment Manager owned 8.98% of the outstanding shares of the Global Dynamic Multi-Asset Portfolio.
For the year ended December 31, 2020, the Portfolios did not engage in any cross-trades in accordance with Rule 17a-7 under the 1940 Act, and no brokerage commissions were paid to affiliates of the Investment Manager or other affiliates of the Fund for portfolio transactions executed on behalf of the Fund.
6. Line of Credit
The Fund has a $100 million committed line of credit pursuant to an Amended and Restated Loan Agreement (the “Agreement”) with State Street, primarily for temporary or emergency purposes, including the meeting of redemption requests that otherwise might require the untimely disposition of securities. Interest on borrowings is payable at 1.00% plus the “Applicable Rate,” which is the higher of (a) the Federal Funds Rate plus 10 basis points and (b) the Overnight Bank Funding Rate (OBFR) plus 10 basis points, on an annualized basis. Under the Agreement, the Fund has agreed to pay a 0.20% per annum fee on the unused portion of the commitment, payable quarterly in arrears. The Fund has also agreed to pay an upfront fee of 0.05% of the committed line amount. During the year ended December 31, 2020, the following Portfolios had borrowings under the Agreement as follows:
| Portfolio | | Average
Daily Loan
Balance* | | Maximum
Daily Loan
Outstanding | | Weighted
Average
Interest
Rate | | | Number
of Days
Borrowings
were
Outstanding | |
| | | | | | | | | | | | | | | |
| Global Dynamic Multi-Asset | | $ | 259,000 | | $ | 790,000 | | | 1.19 | % | | | 4 | |
Annual Report 87
| Opportunistic Strategies | | | 317,500 | | | 430,000 | | | 1.36 | | | | 6 | |
| Real Assets | | | 755,000 | | | 755,000 | | | 1.39 | | | | 2 | |
| * | For days borrowings were outstanding. |
Management believes that the fair value of the liabilities under the Agreement is equivalent to the recorded amount based on its short-term maturity and interest rate, which fluctuates with the Applicable rate. A Portfolio’s outstanding balance under the Agreement, if any, would be categorized as Level 2.
7. Investment Risks
Not all risks described below apply to all Portfolios, or may not apply to the same degree for one or more Portfolios compared to one or more other Portfolios. In addition, not all risks applicable to an investment in a Portfolio are described below. Please see the current summary prospectus for the relevant Portfolio(s) or a current Portfolio prospectus for further information regarding a Portfolio’s investment strategy and related risks.
(a) Market Risk—A Portfolio may incur losses due to declines in one or more markets in which it invests. These declines may be the result of, among other things, political, regulatory, market, economic or social developments affecting the relevant market(s). To the extent that such developments impact specific industries, market sectors, countries or geographic regions, a Portfolio’s investments in such industries, market sectors, countries and/or geographic regions can be expected to be particularly affected, especially if such investments are a significant portion of its investment portfolio. In addition, turbulence in financial markets and reduced liquidity in equity, credit and/or fixed income markets may negatively affect many issuers, which could adversely affect a Portfolio. Global economies and financial markets are increasingly interconnected, and conditions and events in one country, region or financial market may adversely impact issuers worldwide. As a result, local, regional or global events such as war, acts of terrorism, the spread of infectious illness or other public health issues, recessions or other events could have a significant negative impact on global economic and market conditions. The coronavirus disease 2019 (COVID-19) global pandemic and the aggressive responses taken by many governments or voluntarily imposed by
88 Annual Report
private parties, including closing borders, restricting travel and imposing prolonged quarantines or similar restrictions, as well as the closure of, or operational changes to, many retail and other businesses, has had negative impacts, and in many cases severe negative impacts, on markets worldwide. It is not known how long such impacts, or any future impacts of other significant events described above, will or would last, but there could be a prolonged period of global economic slowdown, which may be expected to impact a Portfolio and its investments.
(b) Fixed-Income and Debt Securities Risk—The market value of a debt security may decline due to general market conditions that are not specifically related to a particular company, such as real or perceived adverse economic conditions, changes in the outlook for corporate earnings, changes in interest or currency rates or adverse investor sentiment generally. The debt securities market can be susceptible to increases in volatility and decreases in liquidity. Liquidity can decline unpredictably in response to overall economic conditions or credit tightening.
Prices of bonds and other debt securities tend to move inversely with changes in interest rates. Interest rate risk is usually greater for fixed-income securities with longer maturities or durations. A rise in interest rates (or the expectation of a rise in interest rates) may result in periods of volatility, decreased liquidity and increased redemptions, and, as a result, a Portfolio may have to liquidate portfolio securities at disadvantageous prices.
A Portfolio’s investments in lower-rated, higher-yielding securities (“junk bonds”) are subject to greater credit risk than its higher rated investments. Credit risk is the risk that the issuer will not make interest or principal payments, or will not make payments on a timely basis. Non-investment grade securities tend to be more volatile, less liquid and are considered speculative. If there is a decline, or perceived decline, in the credit quality of a debt security (or any guarantor of payment on such security), the security’s value could fall, potentially lowering a Portfolio’s share price. The prices of non-investment grade securities, unlike investment grade debt securities, may fluctuate unpredictably and not necessarily inversely with changes in interest rates. The market
Annual Report 89
for these securities may be less liquid and therefore these securities may be harder to value or sell at an acceptable price, especially during times of market volatility or decline.
Some debt securities may give the issuer the option to call, or redeem, the securities before their maturity, and, during a time of declining interest rates, a Portfolio may have to reinvest the proceeds of called or redeemed securities in an investment offering a lower yield (and the Portfolio may not fully benefit from any increase in the value of its portfolio holdings as a result of declining interest rates).
Structured notes are privately negotiated debt instruments where the principal and/or interest is determined by reference to a specified asset, market or rate, or the differential performance of two assets or markets. Structured notes can have risks of both debt securities and derivatives transactions.
(c) Non-US Securities Risk—A Portfolio’s performance will be influenced by political, social and economic factors affecting the non-US countries and companies in which the Portfolio invests. Non-US securities carry special risks, such as less developed or less efficient trading markets, political instability, a lack of company information, differing auditing and legal standards, and, potentially, less liquidity.
(d) Emerging Market Risk—Emerging market countries generally have economic structures that are less diverse and mature, and political systems that are less stable, than those of developed countries. The economies of countries with emerging markets may be based predominantly on only a few industries, may be highly vulnerable to changes in local or global trade conditions, and may suffer from extreme debt burdens or volatile inflation rates. The securities markets of emerging market countries have historically been extremely volatile. These market conditions may continue or worsen. Significant devaluation of emerging market currencies against the US dollar may occur subsequent to acquisition of investments denominated in emerging market currencies.
(e) Foreign Currency Risk—Investments denominated in currencies other than US dollars may experience a decline in value, in US
90 Annual Report
dollar terms, due solely to fluctuations in currency exchange rates. A Portfolio’s investments could be adversely affected by delays in, or a refusal to grant, repatriation of funds or conversion of emerging market currencies.
(f) Short Position Risk—Short positions may involve substantial risks. If a short position appreciates in value during the period of a Portfolio’s investment, there will be a loss to the Portfolio that could be substantial. Short positions involve more risk than long positions because the maximum sustainable loss on a security purchased is limited to the amount paid for the security plus the transaction costs. However, a Portfolio’s potential loss on a short position is unlimited because, theoretically, there is no limit to the potential price increase of a security.n addition, a Portfolio’s short sales transactions are dependent on counterparties to its securities borrowing transactions and are subject to the risk of default by a counterparty, which could result in a loss of Portfolio assets used as collateral or the loss of monies owed to the Portfolio by a counterparty.
(g) Derivatives and Hedging Risk—Derivatives transactions, including those entered into for hedging purposes (i.e., seeking to protect Portfolio investments), may increase volatility, reduce returns, limit gains or magnify losses, perhaps substantially, particularly since most derivatives have a leverage component that provides investment exposure in excess of the amount invested. Swap agreements; forward currency contracts; over-the-counter options on securities (including options on ETFs), indexes, currencies and structured notes; and other over-the-counter derivatives transactions are subject to the risks of the creditworthiness of and default by the counterparty and consequently may lose all or a portion of their value due solely to the creditworthiness of or default by the counterparty. Over-the-counter derivatives frequently may be illiquid and difficult to value. Changes in liquidity may result in significant, rapid and unpredictable changes in the prices for derivatives. These derivatives transactions, as well as the exchange-traded futures and options in which a Portfolio may invest, are subject to many of the risks of, and can be highly sensitive to changes in the value of, the related reference asset,
Annual Report 91
index or rate. As such, a small investment could have a potentially large impact on a Portfolio’s performance. In fact, many derivatives may be subject to greater risks than those associated with investing directly in the underlying or other reference asset. Derivatives transactions incur costs, either explicitly or implicitly, which reduce returns, and costs of engaging in such transactions may outweigh any gains or any losses averted from hedging activities. Successful use of derivatives, whether for hedging or for other investment purposes, is subject to the Investment Manager’s ability to predict correctly movements in the direction of the relevant reference asset or market and, for hedging activities, correlation of the derivative instruments used with the investments seeking to be hedged. Use of derivatives transactions, even if entered into for hedging purposes, may cause a Portfolio to experience losses greater than if the Portfolio had not engaged in such transactions. The same risks, as applicable, apply to derivatives transactions by the Subsidiary.
(h) Natural Resources Risk—Investments related to natural resources may be affected by numerous factors, including events occurring in nature, inflationary pressures and domestic and international politics. For example, events occurring in nature (such as earthquakes or fires in prime natural resource areas) and political events (such as coups or military confrontations) can affect the overall supply of a natural resource and the value of companies involved in such natural resource. Political risks and other risks to which non-US companies are subject also may affect US companies if they have significant operations or investments in non-US countries. In addition, interest rates, prices of raw materials and other commodities, international economic developments, energy conservation, tax and other government regulations (both US and non-US) may affect the supply of and demand for natural resources, which can affect the profitability and value of securities issued by companies in the natural resources category. Securities of companies within specific natural resources sub-categories can perform differently than the overall market. This may be due to changes in such things as the regulatory or competitive environment or to changes in investor perceptions.
92 Annual Report
(i) Real Estate Investments Risk—A Portfolio’s investments in Real Estate Investments (as defined in the prospectus) could lose money due to the performance of real estate-related securities even if securities markets generally are experiencing positive results. The performance of investments made by a Portfolio may be determined to a great extent by the current status of the real estate industry in general, or by other factors (such as interest rates and the availability of loan capital) that may affect the real estate industry, even if other industries would not be so affected. Consequently, Real Estate Investments could lead to investment results that may be significantly different from investments in other real assets categories or investments in the broader securities markets.
The risks related to investments in Real Estate Investments include, but are not limited to: adverse changes in general economic and local market conditions; adverse developments in employment; changes in supply or demand for similar or competing properties; unfavorable changes in applicable taxes, governmental regulations and interest rates; operating or development expenses; and lack of available financing.
Due to certain special considerations that apply to REITs, investments in REITs may carry additional risks not necessarily present in investments in other securities. REIT securities (including those trading on national exchanges) typically have trading volumes that are less than those of other types of stocks traded on national exchanges, which may affect a Portfolio’s ability to trade or liquidate those securities. An investment in REITs may be adversely affected if the REIT fails to comply with applicable laws and regulations, including failing to qualify as a REIT under the Code. Failure to qualify with any of these requirements could jeopardize a company’s status as a REIT. A Portfolio generally will have no control over the operations and policies of a REIT, and the Portfolio generally will have no ability to cause a REIT to take the actions necessary to qualify as a REIT.
(j) Infrastructure Companies Risk—Securities and instruments of infrastructure companies are more susceptible to adverse economic or regulatory occurrences affecting their industries.
Annual Report 93
Infrastructure companies may be subject to a variety of factors that may adversely affect their business or operations, including high interest costs in connection with capital construction programs, high leverage, costs associated with environmental and other regulations, the effects of economic slowdown, surplus capacity, increased competition from other providers of services, uncertainties concerning the availability of fuel at reasonable prices, the effects of energy conservation policies and other factors. Infrastructure companies also may be affected by or subject to, among other factors, regulation by various government authorities, including rate regulation and service interruption due to environmental, operational or other mishaps.
(k) Commodities-Related Investments Risk—Exposure to the commodities markets may subject a Portfolio to greater volatility than other types of investments. The values of commodities and commodity-linked derivative instruments are affected by events that may have less impact on the values of equity and fixed income securities. Investments linked to the prices of commodities are considered speculative. Because the value of a commodity-linked derivative instrument, such as a futures contract on a physical commodity, typically is based upon the price movements of the underlying reference asset, index or rate, the value of these instruments will rise or fall in response to changes in the underlying reference asset, index or rate. Prices of commodities and commodity-linked investments may fluctuate significantly over short periods for a variety of factors, including: changes in supply and demand relationships; weather; agricultural or livestock markets; agricultural or livestock disease or pestilence; trade relationships; fiscal, monetary and exchange control programs; and embargoes, tariffs, terrorism and international economic, political, military and regulatory developments.
(l) Subsidiary and Tax Status Risk—The Real Assets Portfolio invests in the Subsidiary, which is not registered as an investment company under the 1940 Act. A regulatory change in the US or the Cayman Islands, under which the Portfolio and the Subsidiary, respectively, are organized, that impacts the Subsidiary or how the Portfolio invests in the Subsidiary, such as a change in tax law, could adversely affect the Portfolio. By investing in the Subsidiary,
94 Annual Report
the Portfolio is exposed to the risks associated with the Subsidiary’s investments, which generally include the risks of investing in commodity-related derivative instruments.
Income and gains from commodities or certain commodity-linked derivative instruments do not constitute “qualifying income” to the Real Assets Portfolio for purposes of qualification as a “regulated investment company” for federal income tax purposes. Without such qualification, the Portfolio could be subject to tax. The tax treatment of the Portfolio’s investments in the Subsidiary and commodity-linked derivative instruments could affect whether income derived from such investment is “qualifying income” under the Code, or otherwise affect the character, timing and/or amount of the Portfolio’s taxable income or any gains and distributions made by the Portfolio.
(m) Closed-End Funds and ETFs Risk—Shares of closed-end funds and ETFs in which a Portfolio may invest may trade at prices that vary from their net asset values, sometimes significantly. The shares of closed-end funds and ETFs may trade at prices at, below or above their most recent net asset value. Shares of closed-end funds, in particular, frequently trade at persistent discounts to their net asset value. In addition, the performance of an ETF pursuing a passive index-based strategy may diverge from the performance of the index. A Portfolio’s investments in closed-end funds and ETFs are subject to the risks of the closed-end funds’ and ETFs’ investments, as well as to the general risks of investing in closed-end funds and ETFs, respectively. A Portfolio investing in closed-end funds or ETFs will bear not only the Portfolio’s management fees and operating expenses, but also the Portfolio’s proportional share of the management fees and operating expenses of the closed-end funds and/or ETFs in which the Portfolio invests. A Portfolio may be limited by the 1940 Act in the amount of its assets that may be invested in one or more closed-end funds and/or ETFs in the absence of an applicable exemptive order from the SEC on which the Portfolio may rely or an exemption is available.
Annual Report 95
(n) Government Securities Risk—Not all obligations of the US government, its agencies and instrumentalities are backed by the full faith and credit of the USTreasury. Some obligations are backed only by the credit of the issuing agency or instrumentality, and in some cases there may be some risk of default by the issuer. Any guarantee by the US government or its agencies or instrumentalities of a security held by a Portfolio does not apply to the market value of such security or to shares of the Portfolio itself. A security backed by the USTreasury or the full faith and credit of the United States is guaranteed only as to the timely payment of interest and principal when held to maturity.
(o) Cybersecurity Risk—The Portfolios and their service providers are susceptible to operational and information security and related risks of cybersecurity incidents. Cybersecurity attacks include, but are not limited to, gaining unauthorized access to digital systems (e.g., through “hacking” or malicious software coding) for purposes of misappropriating assets or sensitive information, corrupting data or causing operational disruption. Cybersecurity incidents affecting the Investment Manager, transfer agent or custodian or other service providers such as financial intermediaries have the ability to cause disruptions and impact business operations, potentially resulting in financial losses, including by impediments to a Portfolio’s investment trading; the inability of Portfolio shareholders to purchase and redeem Portfolio shares; interference with a Portfolio’s ability to calculate its NAV; violations of applicable privacy, data security or other laws; regulatory fines and penalties; reputational damage; reimbursement or other compensation or remediation costs; legal fees; or additional compliance costs. Similar adverse consequences could result from cybersecurity incidents affecting issuers of securities in which a Portfolio invests; counterparties with which a Portfolio engages in transactions; governmental and other regulatory authorities, exchange and other financial market operators; and banks, brokers, dealers, insurance companies and other financial institutions and other parties. There are inherent limitations in any cybersecurity risk management systems or business continuity plans, including the possibility that certain risks have not been identified.
96 Annual Report
8. Contractual Obligations
The Fund enters into contracts in the normal course of business that contain a variety of indemnification provisions. A Portfolio’s maximum exposure under these arrangements is unknown. Management has reviewed the Fund’s existing contracts and expects the risk of loss to be remote.
9. Fair Value Measurements
Fair value is defined as the price that a Portfolio would receive to sell an asset, or would pay to transfer a liability, in an orderly transaction between market participants at the date of measure-ment. The Fair Value Measurements and Disclosures provisions of GAAP also establish a framework for measuring fair value, and a three-level hierarchy for fair value measurement that is based upon the transparency of inputs to the valuation of an asset or liability. Inputs may be observable or unobservable and refer, broadly, to the assumptions that market participants would use in pricing the asset or liability. Observable inputs reflect the assumptions that market participants would use in pricing the asset or liability based on market data obtained from sources independent of the Fund. Unobservable inputs reflect the Fund’s own assumptions about the assumptions that market participants would use in pricing the asset or liability, developed based on the best information available in the circumstances. The fair value measurement level within the fair value hierarchy for the assets and liabilities of a Portfolio is based on the lowest level of any input that is significant to the overall fair value measurement. The three-level hierarchy of inputs is summarized below:
| • | Level 1 – unadjusted quoted prices in active markets for identical assets and liabilities |
| • | Level 2 – other significant observable inputs (including unadjusted quoted prices for similar assets and liabilities, interest rates, prepayment speeds, credit risk, etc.) |
| • | Level 3 – significant unobservable inputs (including the Fund’s own assumptions in determining the fair value of assets and liabilities) |
Changes in valuation methodology or inputs may result in transfers into or out of the current assigned level within the hierarchy.
Annual Report 97
The inputs or methodology used for valuing securities are not necessarily an indication of the risks associated with investing in these securities.
The following table summarizes the valuation of the Portfolios’ assets and liabilities by each fair value hierarchy level as of December 31, 2020:
| Description | | Unadjusted
Quoted Prices in
Active Markets
for Identical
Assets
and Liabilities
(Level 1) | | | Significant
Other
Observable
Inputs
(Level 2) | | | Significant
Unobservable
Inputs
(Level 3) | | | Balance as of
December 31, 2020 | |
| | | | | | | | | | | | | | | | | | |
| Global Dynamic Multi-Asset Portfolio | | | | | | | | | | | | | | | | | |
| Assets: | | | | | | | | | | | | | | | | | |
| Common Stocks* | | | | | | | | | | | | | | | | | |
| Australia | | | $ | — | | | $ | 491,911 | | | $ | — | | | $ | 491,911 | |
| Belgium | | | | — | | | | 23,123 | | | | — | | | | 23,123 | |
| Canada | | | | 985,337 | | | | — | | | | — | | | | 985,337 | |
| Denmark | | | | 155,913 | | | | 94,318 | | | | — | | | | 250,231 | |
| Finland | | | | — | | | | 96,030 | | | | — | | | | 96,030 | |
| France | | | | 281,251 | | | | 417,295 | | | | — | | | | 698,546 | |
| Germany | | | | 429,349 | | | | 75,333 | | | | — | | | | 504,682 | |
| Hong Kong | | | | 257,687 | | | | 102,785 | | | | — | | | | 360,472 | |
| Israel | | | | — | | | | 15,679 | | | | — | | | | 15,679 | |
| Japan | | | | 394,712 | | | | 1,864,867 | | | | — | | | | 2,259,579 | |
| Macau | | | | 161,998 | | | | — | | | | — | | | | 161,998 | |
| Netherlands | | | | 535,428 | | | | 104,027 | | | | — | | | | 639,455 | |
| New Zealand | | | | — | | | | 25,196 | | | | — | | | | 25,196 | |
| Norway | | | | — | | | | 79,722 | | | | — | | | | 79,722 | |
| Singapore | | | | — | | | | 63,590 | | | | — | | | | 63,590 | |
| Spain | | | | 132,940 | | | | 28,198 | | | | — | | | | 161,138 | |
| Sweden | | | | 592,564 | | | | 71,729 | | | | — | | | | 664,293 | |
| Switzerland | | | | 182,495 | | | | 253,109 | | | | — | | | | 435,604 | |
| United Kingdom | | | | 1,664,961 | | | | 357,726 | | | | — | | | | 2,022,687 | |
| United States | | | | 18,083,835 | | | | — | | | | — | | | | 18,083,835 | |
| Corporate Bonds* | | | | — | | | | 9,925,714 | | | | — | | | | 9,925,714 | |
| Foreign Government | | | | | | | | | | | | | | | | | |
| Obligations* | | | | — | | | | 13,518,246 | | | | — | | | | 13,518,246 | |
| Quasi Government Bonds* | | | | — | | | | 290,121 | | | | — | | | | 290,121 | |
| Supranational Bonds | | | | — | | | | 2,133,107 | | | | — | | | | 2,133,107 | |
| US Municipal Bonds | | | | — | | | | 409,515 | | | | — | | | | 409,515 | |
| US Treasury Securities | | | | — | | | | 272,848 | | | | — | | | | 272,848 | |
| Exchange-Traded Funds | | | | 3,120,502 | | | | — | | | | — | | | | 3,120,502 | |
| Short-Term Investments | | | | 375,514 | | | | — | | | | — | | | | 375,514 | |
| Other Financial Instruments† | | | | | | | | | | | | | | | | | |
| Forward Currency Contracts | | | | — | | | | 648,637 | | | | — | | | | 648,637 | |
| Total | | | $ | 27,354,486 | | | $ | 31,362,826 | | | $ | — | | | $ | 58,717,312 | |
| Liabilities: | | | | | | | | | | | | | | | | | |
98 Annual Report
| Other Financial Instruments† | | | | | | | | | | | | | | | | | |
| Forward Currency Contracts | | | $ | — | | | $ | (718,080 | ) | | $ | — | | | $ | (718,080 | ) |
| Description | | Unadjusted
Quoted Prices in
Active Markets
for Identical
Assets
and Liabilities
(Level 1) | | | Significant
Other
Observable
Inputs
(Level 2) | | | Significant
Unobservable
Inputs
(Level 3) | | | Balance as of
December 31, 2020 | |
| | | | | | | | | | | | | | | | | | |
| Opportunistic Strategies Portfolio | | | | | | | | | | | | | | | | | |
| Exchange-Traded Funds | | | $ | 73,518,393 | | | $ | — | | | $ | — | | | $ | 73,518,393 | |
| Short-Term Investments | | | | 4,860,004 | | | | — | | | | — | | | | 4,860,004 | |
| Total | | | $ | 78,378,397 | | | $ | — | | | $ | — | | | $ | 78,378,397 | |
| | | | | | | | | | | | | | | | | | |
| Real Assets Portfolio | | | | | | | | | | | | | | | | | |
| Assets: | | | | | | | | | | | | | | | | | |
| Common Stocks* | | | | | | | | | | | | | | | | | |
| Australia | | | $ | — | | | $ | 1,247,461 | | | $ | — | | | $ | 1,247,461 | |
| Belgium | | | | — | | | | 50,066 | | | | — | | | | 50,066 | |
| Brazil | | | | — | | | | 18,321 | | | | — | | | | 18,321 | |
| Canada | | | | 231,453 | | | | — | | | | — | | | | 231,453 | |
| China | | | | 427 | | | | 534,416 | | | | — | | | | 534,843 | |
| Finland | | | | — | | | | 22,695 | | | | — | | | | 22,695 | |
| France | | | | 16,883 | | | | 857,955 | | | | — | | | | 874,838 | |
| Germany | | | | — | | | | 321,430 | | | | — | | | | 321,430 | |
| Hong Kong | | | | — | | | | 658,296 | | | | — | | | | 658,296 | |
| Israel | | | | — | | | | 22,786 | | | | — | | | | 22,786 | |
| Italy | | | | — | | | | 2,245,306 | | | | — | | | | 2,245,306 | |
| Japan | | | | — | | | | 740,104 | | | | — | | | | 740,104 | |
| Luxembourg | | | | — | | | | 201,468 | | | | — | | | | 201,468 | |
| Mexico | | | | 58,642 | | | | — | | | | — | | | | 58,642 | |
| Netherlands | | | | — | | | | 33,379 | | | | — | | | | 33,379 | |
| Norway | | | | — | | | | 30,437 | | | | — | | | | 30,437 | |
| Singapore | | | | — | | | | 179,097 | | | | — | | | | 179,097 | |
| Spain | | | | — | | | | 712,528 | | | | �� | | | | 712,528 | |
| Sweden | | | | — | | | | 170,749 | | | | — | | | | 170,749 | |
| Switzerland | | | | — | | | | 17,236 | | | | — | | | | 17,236 | |
| United Arab Emirates | | | | — | | | | 56,264 | | | | — | | | | 56,264 | |
| United Kingdom | | | | 47,432 | | | | 1,833,358 | | | | — | | | | 1,880,790 | |
| United States | | | | 5,564,490 | | | | — | | | | — | | | | 5,564,490 | |
| Exchange-Traded Funds | | | | 1,354,800 | | | | — | | | | — | | | | 1,354,800 | |
| Short-Term Investments | | | | 5,725,684 | | | | — | | | | — | | | | 5,725,684 | |
| Other Financial Instruments† | | | | | | | | | | | | | | | | | |
| Forward Currency Contracts | | | | — | | | | 823 | | | | — | | | | 823 | |
| Futures Contracts | | | | 10,731 | | | | — | | | | — | | | | 10,731 | |
| Total Return Swap Agreements | | | | — | | | | 407,293 | | | | — | | | | 407,293 | |
| Total | | | $ | 13,010,542 | | | $ | 10,361,468 | | | $ | — | | | $ | 23,372,010 | |
| Liabilities: | | | | | | | | | | | | | | | | | |
| Other Financial Instruments† | | | | | | | | | | | | | | | | | |
| Forward Currency Contracts | | | $ | — | | | $ | (63,798 | ) | | $ | — | | | $ | (63,798 | ) |
| Futures Contracts | | | | (4,275 | ) | | | — | | | | — | | | | (4,275 | ) |
| Total | | | $ | (4,275 | ) | | $ | (63,798 | ) | | $ | — | | | $ | (68,073 | ) |
Annual Report 99
| * | Please refer to Portfolios of Investments and Notes to Portfolios of Investments for portfolio holdings by country and industry. |
| † | Other financial instruments are derivative instruments which are valued at their respective unrealized appreciation (depreciation). |
10. Derivative Instruments
Certain Portfolios may use derivative instruments, including forward currency contracts, futures contracts or swap agreements.
Forward currency contracts may be used for hedging purposes or to seek to increase returns.
A Portfolio may enter into futures transactions to hedge against changes in interest rates, securities prices, and/or currency exchange rates, to increase total return, or to otherwise gain access or attain exposure to certain markets or other underliers.
A Portfolio enters into swap agreements in an attempt to obtain a particular exposure when it is considered desirable to do so, possibly at a lower cost to such Portfolio than if it had invested directly in the asset that yielded the desired exposure.
During the period ended December 31, 2020, the approximate average monthly notional exposure for derivative instruments was as follows:
| Derivative Instruments | | Global
Dynamic
Multi-Asset
Portfolio | | | Real Assets
Portfolio | |
| | | | | | | | | |
| Forward currency contracts: | | | | | | | | |
| Average amounts purchased | | $ | 14,600,000 | | | $ | 200,000 | |
| Average amounts sold | | | 11,600,000 | | | | 5,200,000 | |
| | | | | | | | | |
| Futures contracts: | | | | | | | | |
| Average notional value of contracts – long | | | | | | | 300,000 | |
| | | | | | | | | |
| Total return swap agreements: | | | | | | | | |
| Average notional value | | | | | | | 3,100,000 | |
Global Dynamic Multi-Asset Portfolio
The following table summarizes the fair value of derivative instruments on the Statement of Assets and Liabilities as of December 31, 2020:
| Assets – Derivative Financial Instruments | | | | Total | |
| | | | | | | |
| Forward currency contracts | | Unrealized appreciation on forward currency contracts | | $ | 648,637 | |
100 Annual Report
| Liabilities – Derivative Financial Instruments | | | | Total | |
| | | | | | | |
| Forward currency contracts | | Unrealized depreciation on forward currency contracts | | $ | 718,080 | |
Real Assets Portfolio
The following table summarizes the fair value of derivative instruments on the Statement of Assets and Liabilities as of December 31, 2020:
| Assets – Derivative Financial Instruments | | Commodity
Contracts | | | Foreign
Currency
Exchange
Contracts | | | Total | |
| | | | | | | | | | | | | | |
| Forward currency contracts | | | | | | | | | | | | | |
| Unrealized appreciation on forward currency contracts | | | $ | — | | | $ | 823 | | | $ | 823 | |
| Future Contracts | | | | | | | | | | | | | |
| Variation margin on open futures contracts (a) | | | | 13,636 | | | | — | | | | 13,636 | |
| Swap agreements | | | | | | | | | | | | | |
| Unrealized appreciation on swap agreements | | | | 407,293 | | | | | | | | 407,293 | |
| Total | | | $ | 420,929 | | | $ | 823 | | | $ | 421,752 | |
| | | | | | | | | | | | | | |
| Liabilities – Derivative Financial Instruments | | Commodity
Contracts | | | Foreign
Currency
Exchange
Contracts | | | Total | |
| | | | | | | | | | | |
| Forward currency contracts | | | | | | | | | | |
| Unrealized depreciation on forward currency contracts | | | $ | — | | | $ | 63,798 | | | $ | 63,798 | |
| (a) | Net cumulative unrealized appreciation (depreciation) on futures contracts if any, are reported in the Schedule of Investments. In the Statements of Assets and Liabilities, only current day’s variation margin is reported in receivables or payables and the net cumulative unrealized appreciation (depreciation) is included in accumulated earnings (loss). |
Global Dynamic Multi-Asset Portfolio
The effect of derivative instruments on the Statement of Operations for the year ended December 31, 2020 was:
| Net Realized Gain (Loss) from: | | Total | |
| | | | | |
| Forward currency contracts | | $ | 409,494 | |
| | | | | |
| Net Change in Unrealized Appreciation (Depreciation) on: | | | Total | |
| | | | | |
| Forward currency contracts | | $ | (66,272 | ) |
Annual Report 101
Real Assets Portfolio
The effect of derivative instruments on the Statement of Operations for the year ended December 31, 2020 was
| Net Realized Gain (Loss) from: | | Commodity Contracts | | | Foreign
Currency
Exchange
Contracts | | | Total | |
| | | | | | | | | | | | | | |
| Forward currency contracts | | | $ | — | | | $ | (413,715 | ) | | $ | (413,715 | ) |
| Futures Contracts | | | | (117,932 | ) | | | — | | | | (117,932 | ) |
| Swap agreements | | | | 2,963 | | | | — | | | | 2,963 | |
| Total | | | $ | (114,969 | ) | | $ | (413,715 | ) | | $ | (528,684 | ) |
| | | | | | | | | | | | | | |
Net Change in Unrealized Appreciation
(Depreciation) on: | | Commodity Contracts | | | Foreign
Currency
Exchange
Contracts | | | Total | |
| | | | | | | | | | | | | | |
| Forward currency contracts | | | $ | — | | | $ | (1,263 | ) | | $ | (1,263 | ) |
| Futures Contracts | | | | 8,784 | | | | — | | | | 8,784 | |
| Swap agreements | | | | 393,892 | | | | — | | | | 393,892 | |
| Total | | | $ | 402,676 | | | $ | (1,263 | ) | | $ | 401,413 | |
As of December 31, 2020, the Global Dynamic Multi-Asset, Opportunistic Strategies and Real Assets Portfolios held derivative instruments that are eligible for offset in the Statements of Assets and Liabilities and are subject to master netting arrangements. A master netting arrangement is an agreement between two counterparties who have multiple contracts with each other that provides for the net settlement of all contracts, as well as any cash collateral, through a single payment in the event of default on, or termination of, any one contract.
The required information for the affected Portfolios are presented in the below table, as of December 31, 2020:
Global Dynamic Multi-Asset Portfolio
| Description | | Gross Amounts of
Recognized Assets | | Gross Amounts Offset
in the Statement of
Assets and Liabilities | | Net Amounts of
Assets Presented
in the Statement of
Assets and Liabilities | |
| | | | | | | | | | | | | | | | |
| Forward Currency Contracts | | | $ | 648,637 | | | $ | — | | | $ | 648,637 | | | |
102 Annual Report
| | | | | | | Amounts Not Offset
in the Statement of
Assets and Liabilities | | | | | |
| Counterparty | | Net Amounts of
Assets Presented
in the Statement of
Assets and Liabilities | | Financial
Instruments | | Collateral
Received | | Net Amounts of
Derivative Assets | |
| | | | | | | | | | | | | | | | | | | | |
| Citibank NA | | | $ | 36,212 | | | $ | (36,212 | ) | | $ | — | | | $ | — | | | |
| HSBC Bank USA NA | | | | 319,768 | | | | (275,556 | ) | | | — | | | | 44,212 | | | |
| JPMorgan Chase Bank NA | | | | 214,369 | | | | (214,369 | ) | | | — | | | | — | | | |
| Morgan Stanley Capital Services LLC. | | | | 76,951 | | | | (68,517 | ) | | | — | | | | 8,434 | | | |
| State Street Bank and Trust Co. | | | | 1,337 | | | | (996 | ) | | | — | | | | 341 | | | |
| Total | | | $ | 648,637 | | | $ | (595,650 | ) | | $ | — | | | $ | 52,987 | | | |
| Description | | Gross Amounts of
Recognized Liabilities | | Gross Amounts Offset
in the Statement of
Assets and Liabilities | | Net Amounts of
Liabilities Presented
in the Statement of
Assets and Liabilities | |
| | | | | | | | | | | | | | | | |
| Forward Currency Contracts | | | $ | 718,080 | | | $ | — | | | $ | 718,080 | | | |
| | | | | | | Amounts Not Offset
in the Statement of
Assets and Liabilities | | | | | |
| Counterparty | | Net Amounts of
Liabilities Presented
in the Statement of
Assets and Liabilities | | Financial
Instruments | | Collateral
Pledged | | Net Amounts of
Derivative Liabilities | |
| | | | | | | | | | | | | | | | | | | | |
| Citibank NA | | | $ | 104,738 | | | $ | (36,212 | ) | | $ | — | | | $ | 68,526 | | | |
| HSBC Bank USA NA | | | | 275,556 | | | | (275,556 | ) | | | — | | | | — | | | |
| JPMorgan Chase Bank NA 268,273 | | | | | | | | (214,369 | ) | | | — | | | | 53,904 | | | |
| Morgan Stanley Capital Services LLC. | | | | 68,517 | | | | (68,517 | ) | | | — | | | | — | | | |
| State Street Bank and Trust Co. | | | | 996 | | | | (996 | ) | | | — | | | | — | | | |
| Total | | | $ | 718,080 | | | $ | (595,650 | ) | | $ | — | | | $ | 122,430 | | | |
Real Assets Portfolio
| Description | | Gross Amounts of
Recognized Assets | | Gross Amounts Offset
in the Statement of
Assets and Liabilities | | Net Amounts of
Assets Presented
in the Statement of
Assets and Liabilities | |
| | | | | | | | | | | | | | | | |
| Forward Currency Contracts | | | $ | 823 | | | $ | — | | | $ | 823 | | | |
| Total Return Swap Agreements | | | | 407,293 | | | | — | | | | 407,293 | | | |
| Total | | | $ | 408,116 | | | $ | — | | | $ | 408,116 | | | |
Annual Report 103
| | | | | | | Amounts Not Offset
in the Statement of
Assets and Liabilities | | | | | |
| Counterparty | | Net Amounts of
Assets Presented
in the Statement of
Assets and Liabilities | | Financial
Instruments | | Collateral
Received | | Net Amounts of
Derivative Assets | |
| | | | | | | | | | | | | | | | | | | | |
| Goldman Sachs International | | | $ | 407,293 | | | $ | — | | | $ | — | | | $ | 407,293 | | | |
| JPMorgan Chase Bank NA | | | | 786 | | | | (786 | ) | | | — | | | | — | | | |
| State Street Bank and Trust Co. | | | | 37 | | | | (37 | ) | | | — | | | | — | | | |
| Total | | | $ | 408,116 | | | $ | (823 | ) | | $ | — | | | $ | 407,293 | | | |
| Description | | Gross Amounts of
Recognized Liabilities | | Gross Amounts Offset
in the Statement of
Assets and Liabilities | | Net Amounts of
Liabilities Presented
in the Statement of
Assets and Liabilities | |
| | | | | | | | | | | | | | | | |
| Forward Currency Contracts | | | $ | 63,798 | | | $ | — | | | $ | 63,798 | | | |
| | | | | | Amounts Not Offset
in the Statement of
Assets and Liabilities | | | | | |
| Counterparty | | Net Amounts of
Liabilities Presented
in the Statement of
Assets and Liabilities | | Financial
Instruments | | Collateral
Pledged | | Net Amounts of
Derivative Liabilities | |
| | | | | | | | | | | | | | | | | | | | |
| Citibank NA | | | $ | 8,666 | | | $ | — | | | $ | — | | | $ | 8,666 | | | |
| HSBC Bank USA NA | | | | 25,526 | | | | — | | | | — | | | | 25,526 | | | |
| JPMorgan Chase Bank NA | | | | 16,519 | | | | (786 | ) | | | — | | | | 15,733 | | | |
| State Street Bank and Trust Co. | | | | 13,087 | | | | (37 | ) | | | — | | | | 13,050 | | | |
| Total | | | $ | 63,798 | | | $ | (823 | ) | | $ | — | | | $ | 62,975 | | | |
11. Accounting Pronouncements
In March 2017, the Financial Accounting Standards Board issued Accounting Standards Update No. 2017—08, Receivables - Nonre-fundable Fees and Other Costs (Subtopic 310—20): Premium Amortization on Purchased Callable Debt Securities. (“ASU No. 2017-08”) ASU No. 2017—08 shortened the amortization period for certain purchased callable debt securities held at a premium to the earliest call date. Management has implemented the applicable changes, and they did not have a material impact on the Portfolios’ financial statements.
104 Annual Report
In October 2020, ASU No. 2017—08 was amended by the Financial Accounting Standards Board’s issuance of Accounting Standards Update No. 2020—08, Codification Improvements to Subtopic 310-20, Receivables-Nonrefundable Fees and Other Costs (“ASU No. 2020-08”) This amendment requires that entities re-evaluate whether callable debt securities fall within the scope of ASU No. 2017—08 for each reporting period. ASU No. 2020—08 also amends ASU No. 2017—08 to require that premiums be amortized to the “next call date” rather than the “earliest call date” and further clarifies the definition of “next call date.” Early adoption of ASU No. 2020-08 is not permitted. ASU No. 2020—08 is effective for fiscal years, and interim periods within those fiscal years, beginning after December 15, 2020. Early adoption of ASU No. 2020-08 is not permitted. Management is currently evaluating the impact, if any, of applying ASU No. 2020-08.
On March 12, 2020, the Financial Accounting Standards Board concluded its reference rate reform project with the issuance of Accounting Standards Update No. 2020-04, Reference Rate Reform (Topic 848) - Facilitation of the Effects of Reference Rate Reform on Financial Reporting. (“ASU No. 2020-04”) ASU No. 2020-04 provides elective temporary financial reporting relief from the effect of certain types of contract modifications due to the planned discontinuation of the London Interbank Offered Rate (LIBOR) and other interbank offered based reference rates as of the end of 2021. ASU No. 2020-04 is effective for certain reference rate-related contract modifications that occur during the period March 12, 2020 through December 31, 2022. Management is currently evaluating the impact, if any, of applying ASU No. 2020-04.
12. Subsequent Events
Management has evaluated subsequent events potentially affecting the Portfolios through the issuance of the financial statements and has determined that there were no other subsequent events that required adjustment or disclosure.
Annual Report 105
The Lazard Funds, Inc.
Report of Independent Registered Public Accounting Firm
To the Board of Directors ofThe Lazard Funds, Inc. and Shareholders of Lazard Global Dynamic Multi-Asset Portfolio, Lazard Opportunistic Strategies Portfolio and Lazard Real Assets Portfolio:
Opinion on the Financial Statements and Financial Highlights
We have audited the accompanying statements of assets and liabilities of Lazard Global Dynamic Multi-Asset Portfolio and Lazard Opportunistic Strategies Portfolio, two of the portfolios constituting The Lazard Funds, Inc. (the “Fund”), including the portfolios of investments, as of December 31, 2020, the related statements of operations for the year then ended, the statements of changes in net assets for each of the two years in the period then ended, the financial highlights for each of the five years in the period then ended for Lazard Opportunistic Strategies Portfolio and for the periods indicated in the table below for Lazard Global Dynamic Multi-Asset Portfolio, and the related notes. We have also audited the accompanying consolidated statement of assets and liabilities, including the consolidated portfolio of investments, of Lazard Real Assets Portfolio (formerly Lazard Real Assets and Pricing Opportunities Portfolio) (collectively, with the portfolios mentioned above, the “Portfolios”), one of the portfolios constituting the Fund, as of December 31, 2020, the related consolidated statement of operations for the year then ended, the consolidated statements of changes in net assets for each of the two years in the period then ended, the consolidated financial highlights for the periods indicated in the table below, and the related notes. In our opinion, the financial statements and financial highlights present fairly, in all material respects, the financial position of Lazard Global Dynamic Multi-Asset Portfolio and Lazard Opportunistic Strategies Portfolio, as of December 31, 2020, and the results of their operations for the year then ended, the changes in their net assets for each of the two years in the period then ended, and the financial highlights for each of the five years in the period then ended (or for the periods listed in the table below), and the consolidated financial position of Lazard Real Assets Portfolio, as of December 31, 2020, and the consolidated results of its operations for the year then ended, the
106 Annual Report
consolidated changes in its net assets for each of the two years in the period then ended, and the consolidated financial highlights for periods listed in the table below, in conformity with accounting principles generally accepted in the United States of America.
| Portfolio Name | Financial Highlights |
| Lazard Global Dynamic Multi-Asset Portfolio | For the years ended December 31, 2020, 2019, 2018 and 2017 and for the period from May 27, 2016 (commencement of operations) through December 31, 2016 |
| Lazard Real Assets Portfolio | For the years ended December 31, 2020, 2019, 2018 and 2017 and for the period from December 30, 2016 (commencement of operations) through December 31, 2016 |
Basis for Opinion
These financial statements and financial highlights are the responsibility of the Portfolios’ management. Our responsibility is to express an opinion on the Portfolios’ financial statements and financial highlights based on our audits. We are a public accounting firm registered with the Public Company Accounting Oversight Board (United States) (PCAOB) and are required to be independent with respect to the Portfolios in accordance with the U.S. federal securities laws and the applicable rules and regulations of the Securities and Exchange Commission and the PCAOB.
We conducted our audits in accordance with the standards of the PCAOB. Those standards require that we plan and perform the audit to obtain reasonable assurance about whether the financial statements and financial highlights are free of material misstatement, whether due to error or fraud. The Portfolios are not required to have, nor were we engaged to perform, an audit of their internal control over financial reporting. As part of our audits we are required to obtain an understanding of internal control over financial reporting but not for the purpose of expressing an opinion on the effectiveness of the Portfolios’ internal control over financial reporting. Accordingly, we express no such opinion.
Our audits included performing procedures to assess the risks of material misstatement of the financial statements and financial highlights, whether due to error or fraud, and performing
Annual Report 107
procedures that respond to those risks. Such procedures included examining, on a test basis, evidence regarding the amounts and disclosures in the financial statements and financial highlights. Our audits also included evaluating the accounting principles used and significant estimates made by management, as well as evaluating the overall presentation of the financial statements and financial highlights. Our procedures included confirmation of securities owned as of December 31, 2020, by correspondence with the custodian and brokers; when replies were not received from brokers, we performed other auditing procedures. We believe that our audits provide a reasonable basis for our opinion.
/s/ DELOITTE &TOUCHE LLP
NewYork, NewYork
February 24, 2021
We have served as the auditor of one or more of the investment companies in the Lazard Fund Complex since 2004.
108 Annual Report
The Lazard Funds, Inc.
Board of Directors and Officers Information (unaudited)
Name (Year of Birth)
Address(1) | | Position(s) with the
Fund (Since) and Term(2) | | Principal Occupation(s) and Other Public
Company Directorships Held During the
Past Five Years(2) |
| | | | | |
| Independent Directors(3): | | |
| | | |
| Franci J. Blassberg (1953) | | Director
(August 2014) | | Debevoise & Plimpton LLP, a law firm, Of Counsel (2013 – present) |
| | | | | |
| | | | | Cornell Law School, Adjunct Professor (2013 – present) |
| | | | | |
| | | | | The Buchmann Faculty of Law, Tel Aviv University, Visiting Professor (2019) |
| | | | | |
| | | | | University of California, Berkeley School of Law, Adjunct Professor (Spring 2017) |
| | | | | |
| Kenneth S. Davidson (1945) | | Director
(August 1995) | | Davidson Capital Management Corporation, an investment manager, President (1978 – present) |
| | | | | |
| Nancy A. Eckl (1962) | | Director
(April 2007) | | College Retirement Equities Fund (eight accounts), Trustee (2007 – present) |
| | | | | |
| | | | | TIAA-CREF Funds (68 funds) and TIAA-CREF Life Funds (11 funds), Trustee (2007 – present) |
| | | | | |
| | | | | TIAA Separate Account VA-1, Member of the Management Committee (2007 – present) |
| | | | | |
| Trevor W. Morrison (1971) | | Director
(April 2014) | | New York University School of Law, Dean and Eric M. and Laurie B. Roth Professor of Law (2013 – present) |
| | | | | |
| Richard Reiss, Jr. (1944) | | Director
(May 1991) | | Georgica Advisors LLC, an investment manager, Chairman (1997 – present) |
| | | | | |
| | | | | Resource America, Inc., a real estate asset management company, Director (2016 – 2018) |
| | | | | |
| | | | | Osprey Technology Acquisition Corp, a special purpose acquisition company, Director (2019 – present) |
Annual Report 109
Name (Year of Birth)
Address(1) | | Position(s) with the Fund (Since) and Term(2) | | Principal Occupation(s) and Other Public
Company Directorships Held During the
Past Five Years(2) |
| | | | | |
| Robert M. Solmson (1947) | | Director (September 2004) | | Fairwood Capital, LLC, a private investment corporation engaged primarily in real estate and hotel investments, Co-Managing Partner and Managing Director (2008 – present) |
| | | | | |
| Interested Directors(4): | | | |
| | | | |
| Ashish Bhutani (1960) | | Director
(July 2005) | | Investment Manager, Chief Executive Officer (2004 – present) |
| | | | | |
| | | | | Lazard Ltd, Vice Chairman and Director (2010 – present) |
| | | | | |
| Nathan A. Paul (1973) | | Director
(October 2017),
Chief Executive
Officer and President
(February 2017) | | Investment Manager, Chief Business Officer (April 2017 – present) and Managing Director (2003 – present) Investment Manager, General Counsel (2002 – April 2017) |
| | | | | |
| (1) | The address of each Director of the Fund is Lazard Asset Management LLC, 30 Rockefeller Plaza, New York, New York 10112-6300. |
| (2) | Each Director serves as a Director for each of the funds in the Lazard Fund Complex comprised of, as of January 31, 2021, 35 active investment portfolios. Each Director serves an indefinite term, until his or her successor is elected and qualifies or until his or her earlier resignation. |
| (3) | “Independent Directors” are not “interested persons” (as defined in the 1940 Act) of the Fund. |
| (4) | Messrs. Bhutani and Paul are “interested persons” (as defined in the 1940 Act) of the Fund because of their positions with the Investment Manager. |
| | |
| The Fund’s Statement of Additional Information contains further information about the Directors and is available without charge by calling 800-823-6300, or online, at www.lazardassetmanagement.com. |
110 Annual Report
Name (Year of Birth)
Address(1) | | Position(s) with the
Fund (Since) and Term(2) | | Principal Occupation(s) During the
Past Five Years |
| | | | | |
| Officers(3): | | | | |
| | | | | |
| Mark R. Anderson (1970) | | Vice President
and Secretary
(February 2017) | | Managing Director (since February 2017), General Counsel (since April 2017) and Chief Compliance Officer (since September 2014) of the Investment Manager |
| | | | | |
| Nargis Hilal ( 1984) | | Chief Compliance
Officer (July 2020) | | Senior Vice President and Counsel of the Investment Manager (since August 2017) |
| | | | | |
| | | | | Chief Compliance Officer of KLS Diversified Asset Management LP (March 2016 – August 2017) |
| | | | | |
| | | | | Deputy Chief Compliance Office KLS Diversified Asset Management LP (January 2015 – March 2016) |
| | | | | |
| Christopher Snively (1984) | | Chief Financial
Officer (March 2016) and
Treasurer
(September 2019) | | Senior Vice President of the Investment Manager |
| | | | | |
| Shari L. Soloway (1981) | | Assistant Secretary
(November 2015) | | Head of Legal, North America (since January 2019, previously Senior Vice President, Legal and Compliance) of the Investment Manager |
| | | | | |
| Jessica A. Falzone (1989) | | Assistant Secretary
(January 2019) | | Vice President, Legal and Compliance, of the Investment Manager (since March 2018) Associate at Schulte Roth & Zabel LLP (October 2014 – March 2018) |
| | | | | |
| Christina Kennedy (1990) | | Assistant Treasurer
(May 2020) | | Vice President of the Investment Manager (since July 2019) Senior Fund Accountant, Gates Capital Management Inc. (July 2016 – July 2019) |
| | | | | |
| | | | | Assurance Senior Associate at PricewaterhouseCoopers LLP (August 2013 – July 2016) |
| | | | | |
| Cesar A. Trelles (1975) | | Assistant Treasurer (December 2004) | | Vice President of the Investment Manager |
| | | | | |
| (1) | The address of each officer of the Fund is Lazard Asset Management LLC, 30 Rockefeller Plaza, New York, New York 10112-6300. |
| (2) | Each officer serves for an indefinite term, until his or her successor is elected and qualifies or until his or her earlier resignation or removal. Each officer serves in the same capacity for the other funds in the Lazard Fund Complex. |
| (3) | In addition to Nathan A. Paul, Chief Executive Officer and President (since February 2017; previously, Vice President and Secretary), whose information is included in the Interested Directors section above. |
Annual Report 111
The Lazard Funds, Inc. Tax and Other Information (unaudited)
Tax Information
Year Ended December 31, 2020
The following tax information represents year end disclosures of the tax benefits passed through to shareholders for 2020:
Of the dividends paid by the Portfolios, the corresponding percentage shown below is qualified dividend income.
| Portfolio | | | Percentage | |
| | | | | |
| Global Dynamic Multi-Asset | | | 54.24 | % |
| Opportunistic Strategies | | | 100.00 | |
| Real Assets | | | 55.60 | |
Of the dividends paid by the Portfolios, the corresponding percentage represents the amount of each dividend that qualifies for the dividends received deduction available to corporate shareholders.
| Portfolio | | | Percentage | |
| | | | | |
| Global Dynamic Multi-Asset | | | 13.52 | % |
| Opportunistic Strategies | | | 68.36 | |
| Real Assets | | | 11.85 | |
Pursuant to Section 871 of the Code, the Portfolios have no designated qualified short-term gains for purposes of exempting withholding of tax on such distributions to US nonresident shareholders.
Of the dividends paid by the Portfolios, the corresponding amount represents the long-term capital gains paid to shareholders.
| Portfolio | | | Long-Term Capital Gains | |
| | | | | |
| Opportunistic Strategies | | | $1,260,234 | |
| Real Assets | | | 466,857 | |
Proxy Voting
A description of the policies and procedures used to determine how proxies relating to Fund portfolio securities are voted is available (1) without charge, upon request, by calling (800) 823-6300 or (2) on the Securities and Exchange Commission (the “SEC”) website at https://www.sec.gov. The Fund’s proxy voting record for the most
112 Annual Report
recent 12-month period ended June 30 is available (1) without charge, upon request, by calling (800) 823-6300 or (2) on the SEC’s website at https://www.sec.gov. Information as of June 30 each year will generally be available by the following August 31.
Schedule of Portfolio Holdings
The Fund files the complete schedule of each Portfolio’s holdings with the SEC for the first and third quarters of each fiscal year as an exhibit to its reports on Form N-PORT. The Fund’s Form N-PORT reports are available on the SEC’s website at https://www.sec.gov.
Annual Report 113
NOTES
NOTES
NOTES
NOTES
NOTES
NOTES
NOTES
The Lazard Funds, Inc.
30 Rockefeller Plaza
New York, New York 10112-6300
Telephone: 800-823-6300
www.lazardassetmanagement.com
Investment Manager
Lazard Asset Management LLC
30 Rockefeller Plaza
New York, New York 10112-6300
Telephone: 800-823-6300
Distributor
Lazard Asset Management Securities LLC
30 Rockefeller Plaza
New York, New York 10112-6300
Custodian
State Street Bank and Trust Company
One Iron Street
Boston, Massachusetts 02210-1641
Transfer Agent and Dividend Disbursing Agent
DST Asset Manager Solutions, Inc.
2000 Crown Colony Drive
Quincy, Massachusetts 02169-0953
Telephone: 617-483-7000
Independent Registered Public Accounting Firm
Deloitte &Touche LLP
30 Rockefeller Plaza
New York, New York 10112-0015
Legal Counsel
Proskauer Rose LLP
Eleven Times Square
New York, New York 10036-8299
www.proskauer.com
Annual Report 121


Lazard Asset Management LLC • 30 Rockefeller Plaza • New York, NY 10112 • www.lazardassetmanagement.com
Performance information as of the most recent month end is available online at www.lazardassetmanagement.com.
LZDPS030 |  |
ITEM 2. CODE OF ETHICS.
The Registrant has adopted a code of ethics that applies to the Registrant’s principal executive officer, principal financial officer, principal accounting officer or controller, or persons performing similar functions.
ITEM 3. AUDIT COMMITTEE FINANCIAL EXPERT.
The Registrant’s Board of Directors (the “Board”) has determined that Robert M. Solmson and Nancy A. Eckl, members of the Audit Committee of the Board, are audit committee financial experts as defined by the Securities and Exchange Commission (the “SEC”). Mr. Solmson and Ms. Eckl are “independent” as defined by the SEC for purposes of audit committee financial expert determinations.
ITEM 4. PRINCIPAL ACCOUNTANT FEES AND SERVICES.
(a) Audit Fees. The aggregate fees billed for each of the last two fiscal years (the “Reporting Periods”) for professional services rendered by the Registrant’s principal accountant (the “Auditor”) for the audit of the Registrant’s annual financial statements, or services that are normally provided by the Auditor in connection with the statutory and regulatory filings or engagements for the Reporting Periods, were $1,079,470 in 2019 and $ 876,877 in 2020 (plus expenses in each case).
(b) Audit-Related Fees. There were no fees billed in the Reporting Periods by the Auditor to the Registrant for assurance and related services that are reasonably related to the performance of the audit of the Registrant’s financial statements and are not reported under paragraph (a) of this Item 4.
The aggregate fees billed in the Reporting Periods for non-audit assurance and related services provided by the Auditor to Lazard Asset Management LLC, the Registrant’s investment manager (“Lazard”) and any entity controlling, controlled by or under common control with Lazard that provides ongoing services to the Registrant (“Service Affiliates”) that were reasonably related to the performance of the annual audit of the Service Affiliate which required pre-approval by the Audit Committee were $267,330 in 2019 and $267,330 in 2020.
(c) Tax Fees. The aggregate fees billed in the Reporting Periods by the Auditor to the Registrant for professional services rendered by the Auditor for tax compliance, tax advice and tax planning (“Tax Services”) were $325,581 in 2019 and $401,953 in 2020. These Tax Services consisted of (i) review or preparation of U.S. federal, state, local and excise tax returns; (ii) U.S. federal, state and local tax planning, advice and assistance regarding statutory, regulatory or administrative developments; and (iii) tax advice regarding tax qualification matters and/or treatment of various financial instruments held or proposed to be acquired or held. Additionally, the aggregate fees billed related to European Union tax reclaim filing services rendered by the Auditor were $90,000 in 2019 and $168,217 in 2020.
The aggregate fees billed in the Reporting Periods for Tax Services provided by the Auditor to Service Affiliates which required pre-approval by the Audit Committee were $0 in 2019 and $0 in 2020.
(d) All Other Fees. There were no fees billed in the Reporting Periods for products and services provided by the Auditor, other than the services reported in paragraphs (a) through (c) above.
There were no fees billed in the Reporting Periods for products and services provided by the Auditor, other than the services reported in paragraphs (a) through (c) above, which required pre-approval by the Audit Committee.
(e) Audit Committee Pre-Approval Policies and Procedures. The Registrant’s Audit Committee has established policies and procedures (the “Policy”) for pre-approval of the Auditor’s engagements for services to the Registrant and Service Affiliates. The Policy states that the Registrant’s Audit Committee or the Chair of the Audit Committee (pursuant to delegated authority from the Audit Committee) pre-approves the Auditor’s engagements for audit and non-audit services to the Registrant and, as required, non-audit services to Service Affiliates on a case by-case basis. Pre-approval considerations include whether the proposed services are compatible with maintaining the Auditor’s independence. The Audit Committee Chair must report any pre-approval decisions he or she makes at the next scheduled Audit Committee meeting. There were no services provided by the Auditor to either the Registrant or Service Affiliates that were approved pursuant to paragraph (c)(7)(i)(C) of Rule 2-01 of Regulation S-X during the Reporting Periods.
(f) None.
(g) Non-Audit Fees. The aggregate non-audit fees billed by the Auditor for services rendered to the Registrant and Service Affiliates for the Reporting Periods were $1,128,439 in 2019 and $964,547 in 2020.
(h) Auditor Independence. The Audit Committee considered whether provision of non-audit services to Service Affiliates that were not required to be pre-approved is compatible with maintaining the Auditor’s independence.
ITEM 5. AUDIT COMMITTEE OF LISTED REGISTRANTS.
Not applicable.
ITEM 6. INVESTMENTS
Not applicable.
ITEM 7. DISCLOSURE OF PROXY VOTING POLICIES AND PROCEDURES FOR CLOSED END MANAGEMENT INVESTMENT COMPANIES.
Not applicable.
ITEM 8. PORTFOLIO MANAGERS OF CLOSED-END MANAGEMENT INVESTMENT COMPANIES.
Not applicable.
ITEM 9. PURCHASES OF EQUITY SECURITIES BY CLOSED-END MANAGEMENT INVESTMENT COMPANY AND AFFILIATED PURCHASERS.
Not applicable.
ITEM 10. SUBMISSION OF MATTERS TO A VOTE OF SECURITY HOLDERS.
There were no material changes to the procedures by which shareholders may recommend nominees to the Registrant’s Board during the period covered by this report.
ITEM 11. CONTROLS AND PROCEDURES.
(a) The Registrant’s principal executive and principal financial officers have concluded, based on their evaluation of the Registrant’s disclosure controls and procedures as of a date within 90 days of the filing date of this report, that the Registrant’s disclosure controls and procedures are reasonably designed to ensure that information required to be disclosed by the Registrant on Form N-CSR is recorded, processed, summarized and reported within the required time periods and that information required to be disclosed by the Registrant in the reports that it files or submits on Form N-CSR is accumulated and communicated to the Registrant’s management, including its principal executive and principal financial officers, as appropriate to allow timely decisions regarding required disclosure.
(b) There were no changes to the Registrant’s internal control over financial reporting that occurred during the period covered by this report that have materially affected, or are reasonably likely to materially affect, the Registrant’s internal control over financial reporting.
ITEM 12. DISCLOSURE OF SECURITIES LENDING ACTIVITIES FOR CLOSED-END MANAGEMENT INVESTMENT COMPANIES.
Not applicable.
ITEM 13. EXHIBITS.
(a)(1) Code of Ethics referred to in Item 2.
(a)(2) Certifications of principal executive and principal financial officers as required by Rule 30a-2(a) under the Investment Company Act of 1940.
(a)(3) Not applicable.
(b) Certifications of principal executive and principal financial officers as required by Rule 30a-2(b) under the Investment Company Act of 1940.
SIGNATURES
Pursuant to the requirements of the Securities Exchange Act of 1934 and the Investment Company Act of 1940, the registrant has duly caused this report to be signed on its behalf by the undersigned, thereunto duly authorized.
The Lazard Funds, Inc.
By /s/ Nathan A. Paul
Nathan A. Paul
Chief Executive Officer
Date February 26, 2021
Pursuant to the requirements of the Securities Exchange Act of 1934 and the Investment Company Act of 1940, this report has been signed below by the following persons on behalf of the registrant and in the capacities and on the dates indicated.
By /s/ Nathan A. Paul
Nathan A. Paul
Chief Executive Officer
Date February 26, 2021
By /s/ Christopher Snively
Christopher Snively
Chief Financial Officer
Date February 26, 2021