Exhibit 99.5

Structured Credit Data
Q2 2008

Cautionary Note on Forward Looking Statements
XL Capital Ltd
Structured Credit Data
This document contains forward-looking statements. Statements that are not historical facts, including
statements about XL’s beliefs, plans or expectations, are forward-looking statements. These statements are
based on current plans, estimates, and expectations. Actual results may differ materially from those included
in such forward-looking statements and therefore you should not place undue reliance on them. A non-
exclusive list of the important factors that could cause actual results to differ materially from those in such
forward-looking statements includes the following: (a) the risk that the closing of the transactions contemplated by the Master Agreement between XL and SCA does not occur for any reason, (b) greater risk of loss in connection with obligations guaranteed by certain of our insurance company operating affiliates due to recent deterioration in the credit markets stemming from the poor performance of sub-prime residential mortgage loans; (c) greater frequency or severity of claims and loss activity than XL’s underwriting, reserving or investment practices anticipate based on historical experience or industry data; (d) trends in rates for property and casualty insurance and reinsurance; (e) developments, including further volatility, in the world’s credit, financial and capital markets that adversely affect the performance of XL’s investments or access to such markets, including but not limited to, further market developments relating to sub-prime and residential mortgages; (f) changes in general economic conditions, including foreign currency exchange rates, inflation and other factors; (g) changes in the size of XL's claims relating to natural catastrophe losses due to the preliminary nature of some reports and estimates of loss and damage to date and (h) the other factors set forth in XL’s most recent reports on Form 10-K, Form 10-Q, and other documents on file with the Securities and Exchange Commission, as well as management’s response to any of the aforementioned factors. XL undertakes no obligation to update or revise publicly any forward-looking statement, whether as a result of new information, future developments or otherwise.
2
Corporates
37%
CDOs
3%
Structured
Credit Portfolio
32%
Non-Real Estate
6%
Real Estate
23%
Government,
Agency & Cash
31%
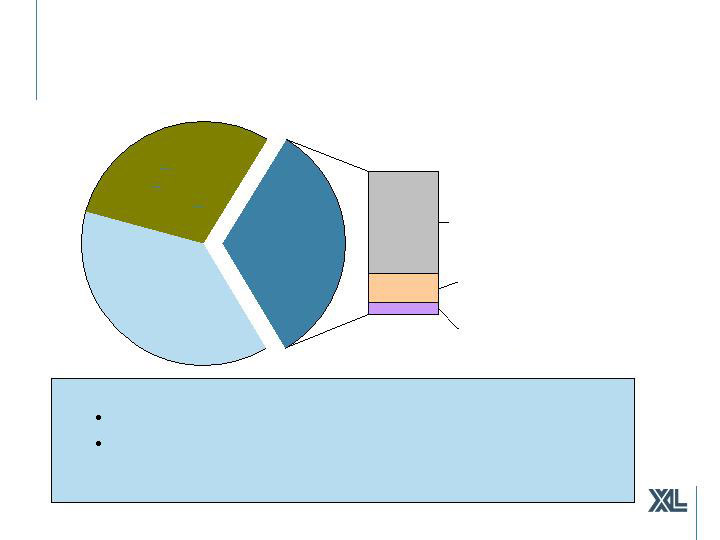
Total Fixed Income Portfolio
As at June 30, 2008
Composition ($34.3 billion)
Fixed Income Portfolio (AA rated) comprised of:
Structured Credit Portfolio (AA+ rated): $10.9B
Non-Structured Credit Portfolio: $23.4B
- Government, Agency & Cash (AA+ rated) $ 10.8B
- Corporate Credit (A rated) $ 12.6B
3
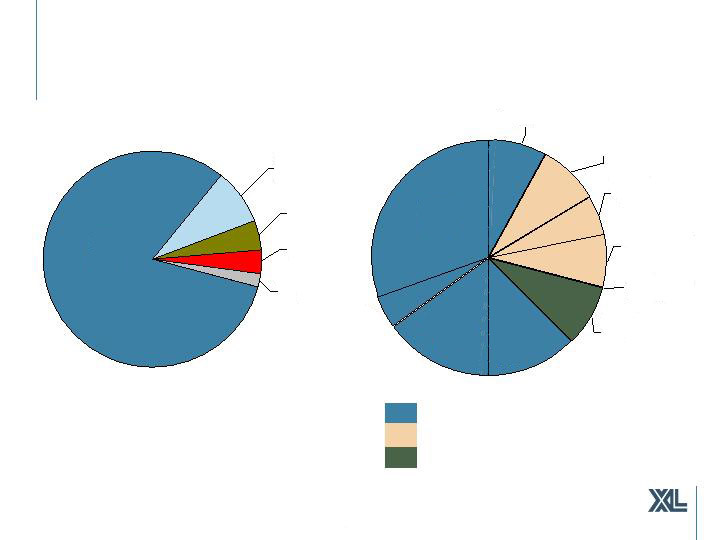
Structured Credit Portfolio- Overview
As at June 30, 2008
BBB
4%
A
5%
BB & Below
1%
AAA
82%
AA
8%
CDO (Excluding ABS CDO)
Non-Real Estate
Real Estate
Alt A
5%
Agency
14%
Whole
Loans
14%
Core CDOs
8%
CDOs - Sub-
Prime, 0%
ABS - Other
7%
ABS - Credit
Card, 6%
ABS - Auto
8%
ABS - RE
7%
CMBS
31%
4
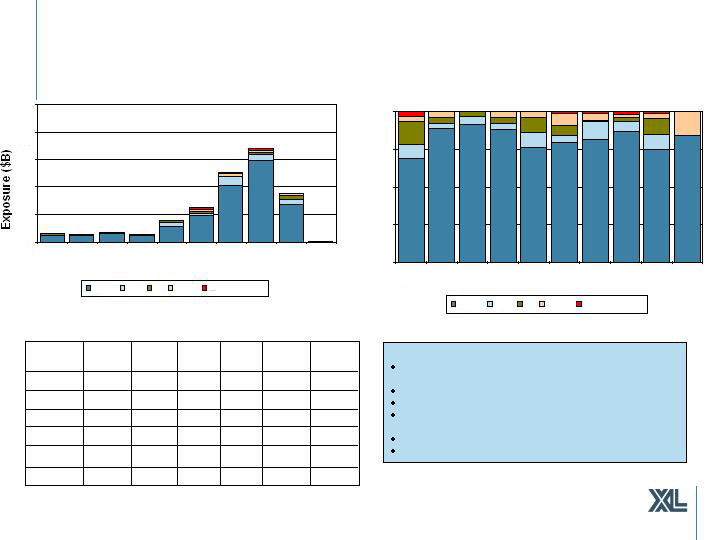
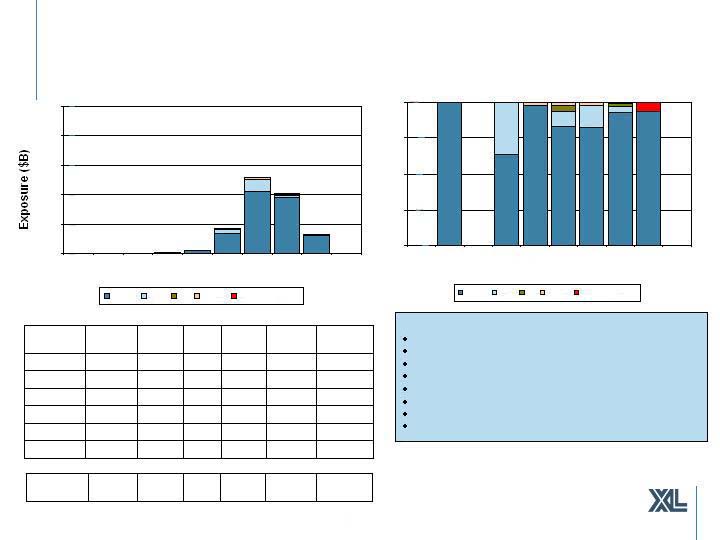
Rating & Vintage Breakdown ($B)
$0
$1
$2
$3
$4
$5
Pre
2000
'00
'01
'02
'03
'04
'05
'06
'07
'08
AAA
AA
A
BBB
BB & Below
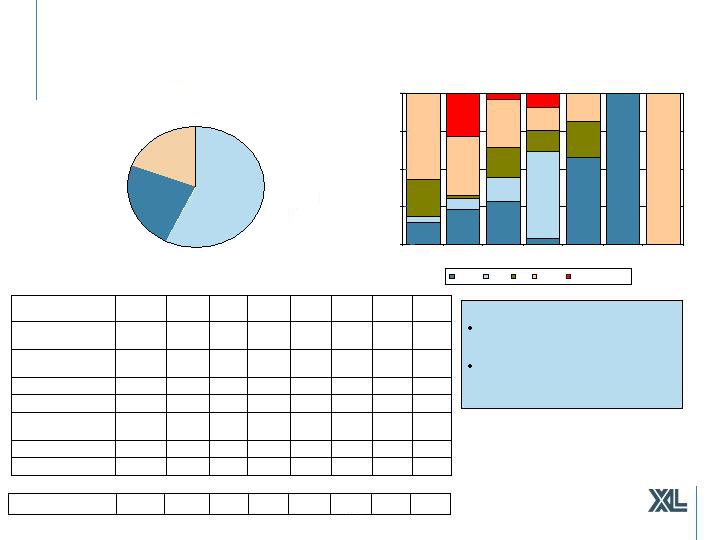
Structured Credit Portfolio: $10.9 billion
As at June 30, 2008
Exposures in $Millions
Rating & Vintage Breakdown (%)
0%
25%
50%
75%
100%
Pre
2000
'00
'01
'02
'03
'04
'05
'06
'07
'08
AAA
AA
A
BBB
BB & Below
41
2
7
-
-
32
2008
1,793
13
77
168
185
1,350
2007
10,931
129
426
516
923
8,937
Total
158
111
73
BBB
202
300
236
AA
2,569
2,045
2,941
AAA
3,202
37
236
Other
2,507
24
27
2005
3,388
53
85
2006
Total
BB &
Below
A
Vintage
Key Characteristics:
Includes all US and Non US Asset Backed and Mortgage
Related Securities
Exposure dominated by AAA
Weighted Average Life 4.8 yrs
207 Securities ($440 million) downgraded in Q2’08, of which
$225M related to monoline downgrades
$338 million on negative credit watch
OTTI: Q2 $45 million
5
Rating & Vintage Breakdown ($B)
$0.0
$0.1
$0.2
$0.3
$0.4
$0.5
Pre
2000
'00
'01
'02
'03
'04
'05
'06
'07
'08
AAA
AA
A
BBB
BB & Below
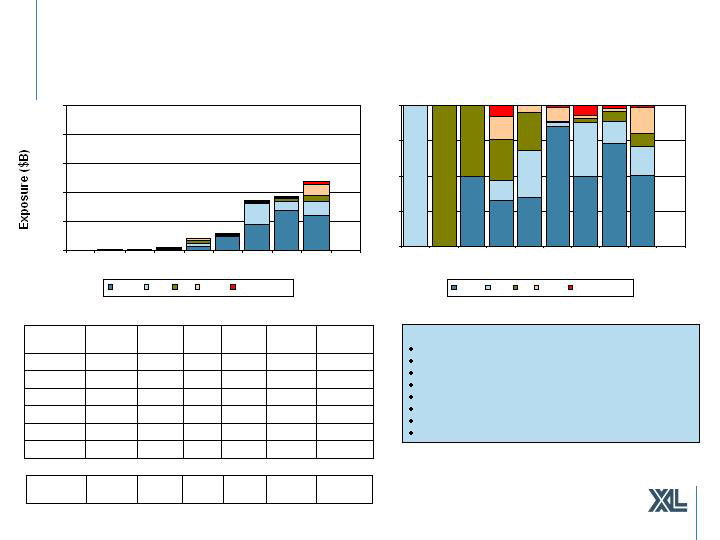
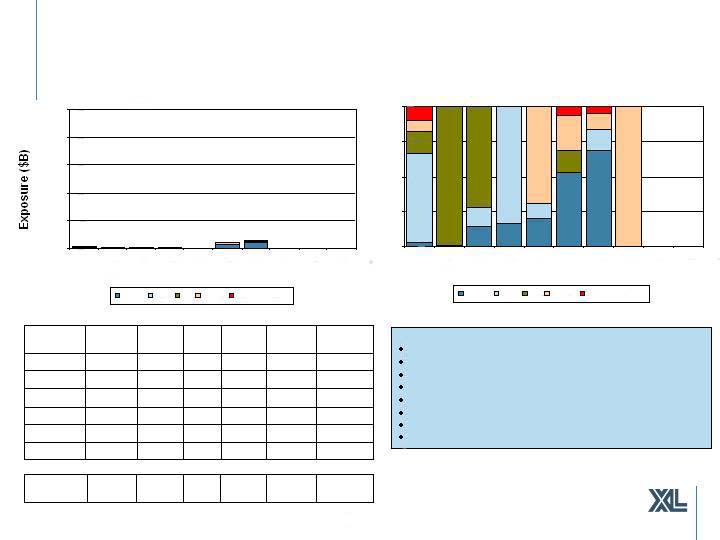
Sub Prime First Lien Securities: $724 million
As at June 30, 2008
Exposures in $Millions
Net Unrealized Gain (Loss) $Millions
(212)
(43)
(13)
(24)
(59)
(73)
Net
Unrealized
Rating & Vintage Breakdown (%)
0%
25%
50%
75%
100%
Pre
2000
'00
'01
'02
'03
'04
'05
'06
'07
'08
AAA
AA
A
BBB
BB & Below
-
-
-
-
-
-
2008
229
4
41
21
46
117
2007
724
24
59
59
163
419
Total
10
4
4
BBB
17
70
30
AA
70
92
140
AAA
120
3
20
Other
184
13
5
2005
191
4
13
2006
Total
BB &
Below
A
Vintage
Key Characteristics:
Overall average credit support: 33%
Weighted average LTV of holdings: 78%
61% pools have weighted average LTVs < 80%
Historical cumulative loss average: 2.3%
Average delinquencies 60+days: 28%
Weighted average life 3.2 years
72 Securities ($155 million) downgraded in Q2’08
OTTI: Q2 $4 million
6
Alt A Securities: $635 million
As at June 30, 2008
Exposures in $Millions
Net Unrealized Gain (Loss) $Millions
(175)
(4)
(4)
(5)
(24)
(138)
Net
Unrealized
-
-
-
-
-
-
2008
67
4
-
-
-
63
2007
635
6
8
10
58
553
Total
2
6
-
BBB
10
40
8
AA
86
213
191
AAA
101
-
3
Other
261
-
2
2005
206
2
5
2006
Total
BB &
Below
A
Vintage
Rating & Vintage Breakdown (%)
0%
25%
50%
75%
100%
Pre
2000
'00
'01
'02
'03
'04
'05
'06
'07
'08
AAA
AA
A
BBB
BB & Below
Rating & Vintage Breakdown ($B)
$0.0
$0.1
$0.2
$0.3
$0.4
$0.5
Pre
2000
'00
'01
'02
'03
'04
'05
'06
'07
'08
AAA
AA
A
BBB
BB & Below
Key Characteristics:
Overall average credit support: 27%
Weighted average LTV of holdings: 73%
69% pools have weighted average LTVs < 80%
Historical cumulative loss average: 1.4%
Average delinquencies 60+days: 14%
Weighted average life 2.9 years
13 Securities ($26 million) downgraded in Q2’08
OTTI: Q2 $12 million
7
Second Lien Securities: $66 million
As at June 30, 2008
Exposures in $Millions
Net Unrealized Gain (Loss) $Millions
(8)
(2)
(3)
(2)
(1)
-
Net
Unrealized
Rating & Vintage Breakdown (%)
0%
25%
50%
75%
100%
Pre
2000
'00
'01
'02
'03
'04
'05
'06
'07
'08
AAA
AA
A
BBB
BB & Below
-
-
-
-
-
-
2008
-
-
-
-
-
-
2007
66
3
10
12
12
29
Total
6
3
1
BBB
8
4
-
AA
11
18
-
AAA
39
2
12
Other
26
1
-
2005
1
-
-
2006
Total
BB &
Below
A
Vintage
Rating & Vintage Breakdown ($B)
$0.0
$0.1
$0.2
$0.3
$0.4
$0.5
Pre
2000
'00
'01
'02
'03
'04
'05
'06
'07
'08
AAA
AA
A
BBB
BB & Below
Key Characteristics:
Overall average credit support: 35%
Weighted average LTV of holdings: 70%
54% pools have weighted average LTVs < 80%
Historical cumulative loss average: 8.2%
Average delinquencies 60+days: 17%
Weighted average life 2.5 years
27 Securities ($12 million) downgraded in Q2’08
OTTI: Q2 $2 million
8
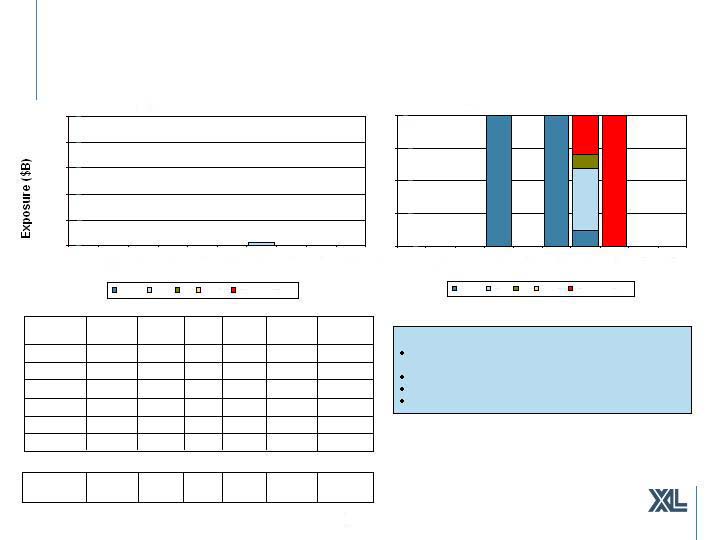
ABS CDOs w/ Sub Prime Collateral: $18 million
As at June 30, 2008
Exposures in $Millions
Net Unrealized Gain (Loss) $Millions
(5)
(1)
-
(1)
(3)
-
Net
Unrealized
Rating & Vintage Breakdown (%)
0%
25%
50%
75%
100%
Pre
2000
'00
'01
'02
'03
'04
'05
'06
'07
'08
AAA
AA
A
BBB
BB & Below
-
-
-
-
-
-
2008
-
-
-
-
-
-
2007
18
7
-
1
5
5
Total
-
-
-
BBB
-
5
-
AA
3
2
-
AAA
3
-
-
Other
12
4
1
2005
3
3
-
2006
Total
BB &
Below
A
Vintage
Rating & Vintage Breakdown ($B)
$0.0
$0.1
$0.2
$0.3
$0.4
$0.5
Pre
2000
'00
'01
'02
'03
'04
'05
'06
'07
'08
AAA
AA
A
BBB
BB & Below
Key Characteristics:
Stress scenarios reflect high probability of principal loss on
certain ABS CDO
Weighted average life 4.5 years
12 Securities ($15 million) downgraded in Q2‘08
OTTI: Q2 $4 million
9

Exposures in $Millions
Net Unrealized Gain (Loss) $Millions
(262)
(14)
(83)
(23)
(111)
(31)
Net
Unrealized
Core CDOs (excl ABS CDO): $903 million
As at June 30, 2008
Rating & Vintage Breakdown (%)
0%
25%
50%
75%
100%
Pre
2000
'00
'01
'02
'03
'04
'05
'06
'07
'08
AAA
AA
A
BBB
BB & Below
-
-
-
-
-
-
2008
170
3
26
17
89
35
2007
903
16
169
65
415
238
Total
39
62
42
BBB
7
151
168
AA
73
73
57
AAA
141
10
12
Other
299
2
11
2005
293
1
25
2006
Total
BB &
Below
A
Vintage
Rating & Vintage Breakdown ($B)
$0.0
$0.1
$0.2
$0.3
$0.4
$0.5
Pre
2000
'00
'01
'02
'03
'04
'05
'06
'07
'08
AAA
AA
A
BBB
BB & Below
Key Characteristics:
All third party managed structures
72% of holdings in CLO; limited covenant lite
Limited residential and commercial real estate
BBB and BB are managed by CDO specialists
160 issues of diversified collateral
Average credit subordination 21%
Weighted average life 6.2 years
3 Securities ($133 thousand) downgraded in Q2’08
OTTI: Q2 $3 million
10
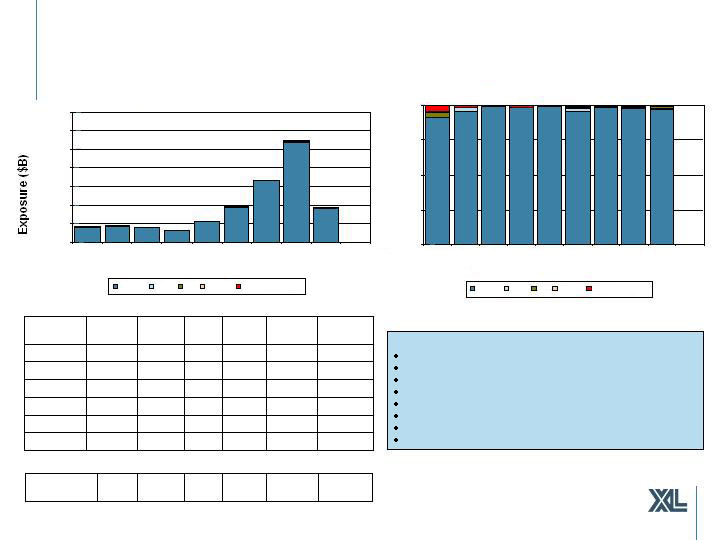
CMBS: $3.4 billion
As at June 30, 2008
Exposures in $Millions
Net Unrealized Gain (Loss) $Millions
(201)
(4)
(3)
(3)
(2)
(189)
Net
Unrealized (1)
Rating & Vintage Breakdown (%)
0.0%
25.0%
50.0%
75.0%
100.0%
Pre
2000
'00
'01
'02
'03
'04
'05
'06
'07
'08
AAA
AA
A
BBB
BB & Below
-
-
-
-
-
-
2008
371
1
1
6
2
361
2007
3,366
26
19
20
22
3,279
Total
4
2
12
BBB
15
2
3
AA
1,191
660
1,067
AAA
1,236
18
8
Other
668
1
3
2005
1,091
6
3
2006
Total
BB &
Below
A
Vintage
Rating & Vintage Breakdown ($B)
$-
$0.2
$0.4
$0.6
$0.8
$1.0
$1.2
$1.4
Pre
2000
'00
'01
'02
'03
'04
'05
'06
'07
'08
AAA
AA
A
BBB
BB & Below
Key Characteristics:
97% AAA; 91% Super/Senior tranches
Average Number of Loans: 166
51% of pools have > 140 loans
57% in Pre 2006 pools; 11% in 2007
Wtd Avg. Credit Enhancement: 26.3%, Levels>20%: 79%
Wtd. Avg. LTV: 67%, Wtd. Avg. DSCR: 1.6
41% experiencing 0% 60+ day delinquency; 78% have rates <1%
4 Securities ($5 million) downgraded in Q2’08
(1) Of the net unrealized losses on CMBS securities, $94 million is the result of the
weakening USD and is offset by the cumulative translation adjustment
11
Guarantor Wrapped Assets: $533 million
As at June 30, 2008
By Sector ($M)
Structured
Credit, $305
Corporate,
$125
Muni, $103
Exposures in $Millions
Net Unrealized Gain (Loss) $Millions
(1)
-
(68)
-
(3)
(13)
(22)
(29)
Net Unrealized
Ratings of Underlying (%)
0.0%
25.0%
50.0%
75.0%
100.0%
AMBAC
FGIC
FSA
MBIA
MGIC
RAA
XLCA
AAA
AA
A
BBB
BB & Below
Notes:
Corporate bucket is made up of structured
corporate credit bonds of whole business
assets (non USD)
$57 million of the exposure above relates to “topical” structured credit ($37million Sub Prime; $14 million 2nd Lien; $7 million Alt-A)
128
-
-
1
8
33
51
35
Other
41
-
-
-
3
21
12
5
Auto ABS
57
1
8
-
4
14
10
20
“Topical” (Subprime,
2nd Lien, Alt-A)
150
31
-
46
MBIA
224
27
5
132
AMBAC
533
103
7
197
Total
-
-
11
-
8
Diversified Business
Securitization
-
-
-
-
2
Public Finance
Projects
1
8
12
19
119
Total
-
MGIC
4
FGIC
41
FSA
-
-
Municipal
RAA
SCA
Guarantor
12

Consumer ABS: $1.5 billion
As at June 30, 2008
8%
117
-
-
-
-
-
117
Student Loan
1,532
558
857
Total
21
-
21
AAA
Wrapped
56%
2
2
30
15
787
Autos
100%
3
42
185
20
1,261
Total
40
BBB
5
AA
357
AAA
36%
1
155
Credit Card
% of
Total
BB &
Below
A
Exposures in $Millions
Credit Card Rating & Vintage Breakdown ($B)
$0.0
$0.1
$0.2
$0.3
$0.4
$0.5
$0.6
Pre
2000
'00
'01
'02
'03
'04
'05
'06
'07
AAA
AA
A
BBB
BB & Below
(4)
(24)
-
(18)
-
-
(2)
Net Unrealized
Net Unrealized Gain (Loss) $Millions
Autos:
Average credit support: 22.1%
11 bonds ($21 million) downgraded in Q2’08
Weighted average life 1.0 years
Credit Cards:
Average excess spread: 14%
Average credit enhancement to charge off
ratio: 4.05
Weighted average life 3.2 years
ABS Auto Rating & Vintage Breakdown ($B)
$0.0
$0.1
$0.2
$0.3
$0.4
$0.5
$0.6
Pre
2000
'00
'01
'02
'03
'04
'05
'06
'07
AAA
AA
A
BBB
BB & Below
13
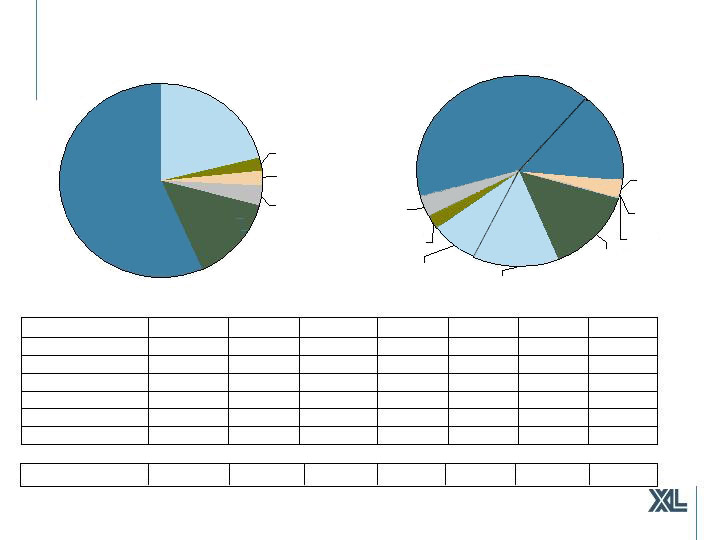
Total US Agency: $3.0 billion
As at June 30, 2008
71
-
-
-
-
71
GNMA
1,508
-
3
-
225
1,209
MBS
426
-
-
177
246
FHLB
97
-
-
-
97
Other
1,209
73
387
406
Senior Debt
17
-
10
7
Preferred Stock
241
-
4
60
Subordinated
626
-
FHLMC
1,683
1
FNMA
2,976
73
Total
1
-
Common Stock
Total
Farmer
Capital
FHLB
14%
Other
3%
Farmer Mac
2%
GNMA, 2%
FHLMC
21%
FNMA
58%
GNMA MBS
2%
Preferred Stock
1%
FNMA Debt
16%
Farmer Debt
2%
Common Equity
0%
FNMA MBS
42%
Other Debt
2%
FHLMC MBS
8%
FHLB Debt
14%
FHLMC Debt
13%
(1)
2
0
(8)
5
(8)
(6)
Net Unrealized
Total Agency Exposures in $Millions
Net Unrealized Gain (Loss) $Millions
14