
1 Investor Day Presentation June 1, 2017 NASDAQ: BOKF
2 Joe Crivelli Director, Investor Relations & Corporate Communications Welcome

3 Forward-Looking Statements: This presentation contains statements that are based on management’s beliefs, assumptions, current expectations, estimates, and projections about BOK Financial Corporation, the financial services industry, and the economy generally. These remarks constitute forward-looking statements within the meaning of the Private Securities Litigation Reform Act of 1995. Words such as “anticipates”, “believes”, “estimates”, “expects”, “forecasts”, “plans”, “projects”, variations of such words, and similar expressions are intended to identify such forward-looking statements. Management judgments relating to, and discussion of the provision and allowance for credit losses involve judgments as to future events and are inherently forward-looking statements. Assessments that BOK Financial’s acquisitions and other growth endeavors will be profitable are necessary statements of belief as to the outcome of future events, based in part on information provided by others which BOKF has not independently verified. These statements are not guarantees of future performance and involve certain risks, uncertainties, and assumptions which are difficult to predict with regard to timing, extent, likelihood and degree of occurrence. Therefore, actual results and outcomes may materially differ from what is expressed, implied or forecasted in such forward-looking statements. Internal and external factors that might cause such a difference include, but are not limited to, changes in interest rates and interest rate relationships, demand for products and services, the degree of competition by traditional and non-traditional competitors, changes in banking regulations, tax laws, prices, levies, and assessments, the impact of technological advances, and trends in customer behavior as well as their ability to repay loans. For a discussion of risk factors that may cause actual results to differ from expectations, please refer to BOK Financial Corporation’s most recent annual and quarterly reports. BOK Financial Corporation and its affiliates undertake no obligation to update, amend, or clarify forward-looking statements, whether as a result of new information, future events, or otherwise. Non-GAAP Financial Measures: This presentation may refer to non-GAAP financial measures. Additional information on these financial measures is available in BOK Financial’s 10-Q and 10-K filings with the Securities and Exchange Commission which can be accessed at www.BOKF.com. All data is presented as of March 31, 2017 unless otherwise noted.
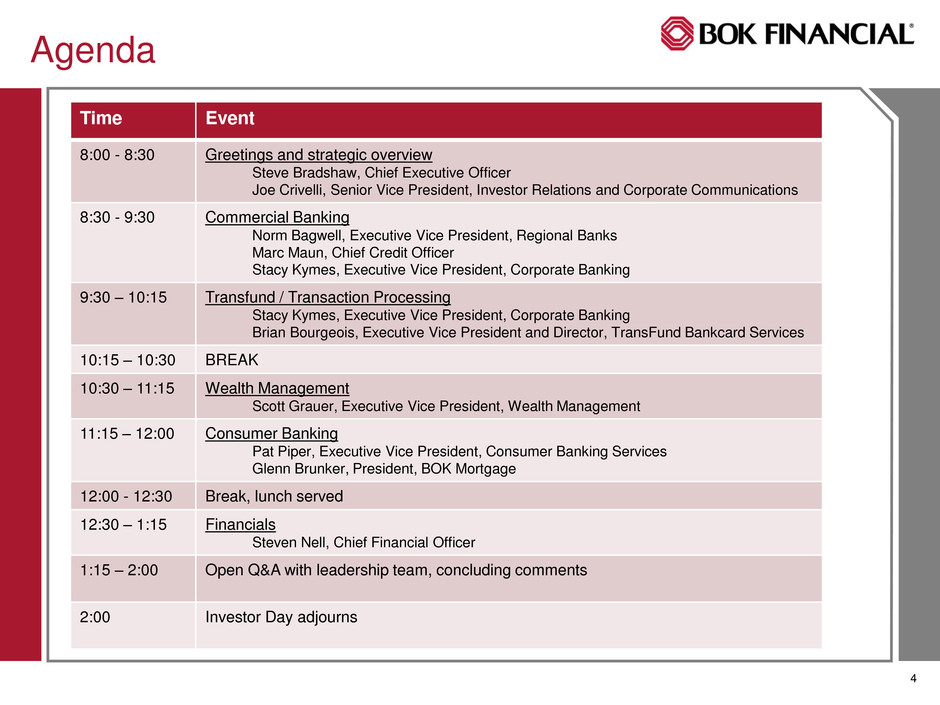
4 Agenda Time Event 8:00 - 8:30 Greetings and strategic overview Steve Bradshaw, Chief Executive Officer Joe Crivelli, Senior Vice President, Investor Relations and Corporate Communications 8:30 - 9:30 Commercial Banking Norm Bagwell, Executive Vice President, Regional Banks Marc Maun, Chief Credit Officer Stacy Kymes, Executive Vice President, Corporate Banking 9:30 – 10:15 Transfund / Transaction Processing Stacy Kymes, Executive Vice President, Corporate Banking Brian Bourgeois, Executive Vice President and Director, TransFund Bankcard Services 10:15 – 10:30 BREAK 10:30 – 11:15 Wealth Management Scott Grauer, Executive Vice President, Wealth Management 11:15 – 12:00 Consumer Banking Pat Piper, Executive Vice President, Consumer Banking Services Glenn Brunker, President, BOK Mortgage 12:00 - 12:30 Break, lunch served 12:30 – 1:15 Financials Steven Nell, Chief Financial Officer 1:15 – 2:00 Open Q&A with leadership team, concluding comments 2:00 Investor Day adjourns

5 Steve Bradshaw Chief Executive Officer Strategic Overview

6 Core Strategy: Build a recession proof bank that will outperform peers across the economic cycle NASDAQ: BOKF One of the largest U.S. bank holding companies Valuable Midwest / Southwest franchise Seasoned management team Proven ability to deliver organic growth Consistent execution Consistent strategy: Build a bank that will outperform across the economic cycle Dec 31, 2016 Assets $33 billion Loans $17 billion Deposits $23 billion Fiduciary Assets $42 billion Assets Under Management & Custody $75 billion

7 Disciplined credit focus Robust portfolio of fee generating businesses Largely focused on organic growth Neutral balance sheet Differentiated specialty lending businesses - energy and healthcare Opportunistic investment in new businesses “There is no principle more emphasized in our organization than managing for long-term value rather than short-term results.” – George Kaiser, Chairman As of 4/30/17 10 Yr. TSR 15 Yr. TSR BOKF 111% 255% Peer average 47% 128% Peer median 51% 98% NASDAQ Bank Index 45% 116% KBW Bank Index (1)% 54% Core Strategy: Build a recession proof bank that will outperform peers across the economic cycle

8 What’s Changed Since Last Investor Day (October 1, 2014) Internal Acquisitions Mobank Weaver Wealth Management E-Spectrum Advisors Exit of supermarket branch channel Opportunistic repurchase of 4.8 million shares at average price of $63.78 External: BOKF passed the ultimate stress test: a two-year energy downturn Interest rate environment has changed for the better Improved regulatory environment

9 Primary Business Segments Percent of Net Interest Revenue (TTM 3/31/17) Percent of Fees and Commissions Revenue (TTM 3/31/17) Percent of Loans (3/31/17) Percent of Deposits (3/31/17) Commercial Consumer Wealth Management Funds Management and other Legend:

10 Diverse Revenue Sources Net Interest 52% Brokerage & Trading 10% Transaction Card 9% Trust Fees 9% Service Charges 7% Mortgage 9%Other 4% 48% Fee Income Significant differentiator compared to other midsized regional banks Sources of Revenue: 12 months ended 12/31/16 Revenue CAGR 2011–2016 Brokerage and Trading 6% Transaction Card 3% Trust Fees 13% Service Charges 1% Mortgage Banking 8% Overall CAGR 5%

11 Our Culture
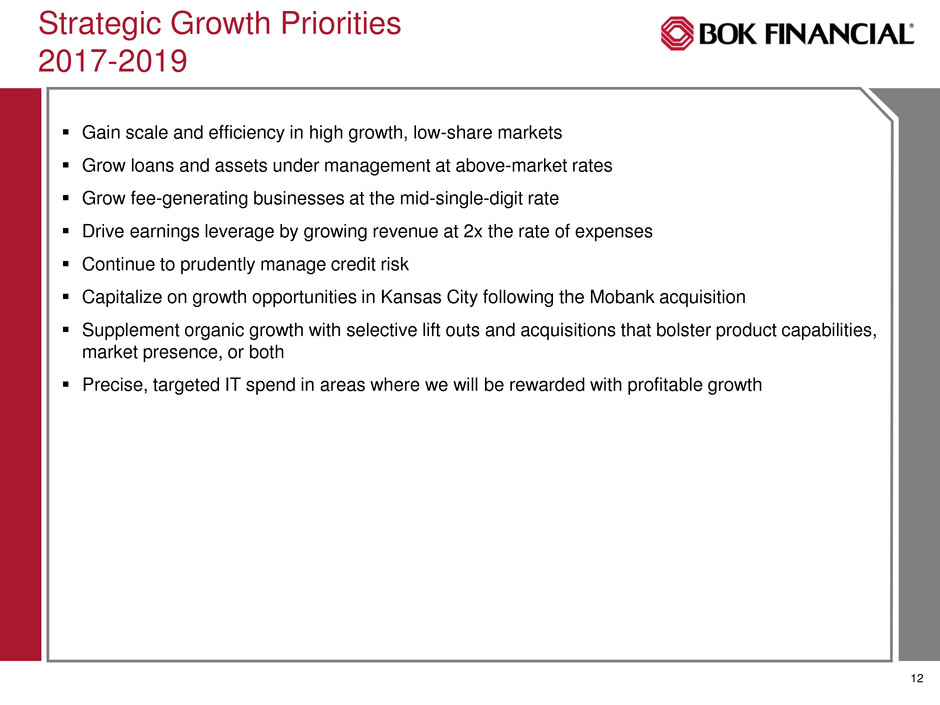
12 Strategic Growth Priorities 2017-2019 Gain scale and efficiency in high growth, low-share markets Grow loans and assets under management at above-market rates Grow fee-generating businesses at the mid-single-digit rate Drive earnings leverage by growing revenue at 2x the rate of expenses Continue to prudently manage credit risk Capitalize on growth opportunities in Kansas City following the Mobank acquisition Supplement organic growth with selective lift outs and acquisitions that bolster product capabilities, market presence, or both Precise, targeted IT spend in areas where we will be rewarded with profitable growth

13 Q&A with Steve Bradshaw
14 Commercial Banking Overview and Panel Discussion

15 Norm Bagwell Executive Vice President, Regional Banks Regional Banking Overview

16 The Commercial Bank Regional Banking Norm Bagwell Corporate Banking Stacy Kymes Middle Market (C&I) Energy Business Banking Commercial Real Estate Treasury Services Healthcare Market CEO Channel TransFund

17 Diversified Loan Portfolio Loan Portfolio by Collateral Location:Loan Portfolio Segmentation Services 18% Energy 15% Healthcare 13% Personal 5% Mfr 3% Other C&I 3% CRE 23% Residential Mortgage 11% Wholesale/ Retail 9% OK 19% TX 33% NM 5% CO 8% AZ 5%KS/MO 9% Other 21% Disciplined concentration management and diversified by sector and geography are hallmarks of the BOKF credit approach

18 Regional Bank Composition Markets Business Units Albuquerque Middle Market (C&I) Arizona Business Banking Arkansas Treasury Services Colorado Specialty Groups Dallas NativeAmerican Fort Worth Financial Institutions Houston Leasing Kansas City Food & Commodities Oklahoma City Heavy Equipment Tulsa Marine Finance

19 Regional Markets % of Regional Banks Profit Profit Growth 2015-2016 Tulsa 25% 1.9% OKC 16% 2.8% Dallas 15% 15.4% Houston 10% 7.1% Colorado 9% 2.6% New Mexico 6% 3.4% Kansas City 5% 26.8% Arizona 5% 24.3% Ft. Worth 5% 14.2% Arkansas 4% 8.7%
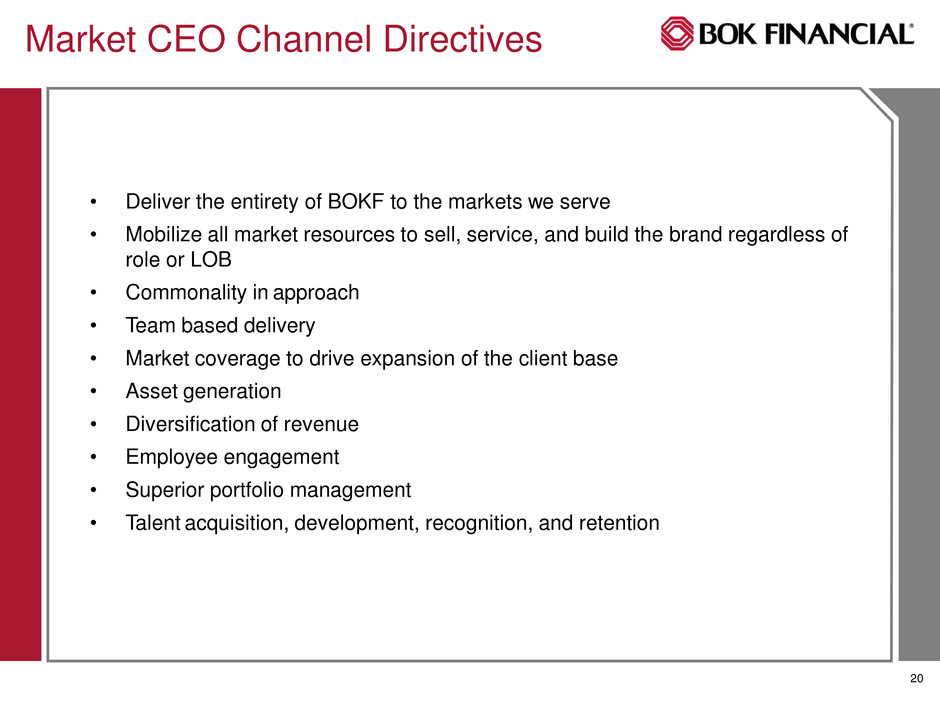
20 • Deliver the entirety of BOKF to the markets we serve • Mobilize all market resources to sell, service, and build the brand regardless of role or LOB • Commonality in approach • Team based delivery • Market coverage to drive expansion of the client base • Asset generation • Diversification of revenue • Employee engagement • Superior portfolio management • Talent acquisition, development, recognition, and retention Market CEO Channel Directives

21 Key Drivers and Objectives • Target $25MM to $1B in sales size companies • Capacity utilization strategy creating expense leverage and efficiency • Market coverage efforts designed to drive new and expanded relationships • Single digit loan growth • Focus on defending the deposit book • Niche and specialty initiatives $000s 2014 2015 2016 CAGR Gross Loans 4,413,803 4,975,513 5,314,470 9.5% Total Deposits 3,754,958 4,248,421 4,468,872 12.1% Net Interest Revenue 123,713 137,623 150,107 9.6% Operating Revenue 33,618 32,269 37,700 8.8% Middle Market Banking Overview

22 Key Drivers and Objectives • Market generally consists of companies $5MM to $40MM in sales • Deposit rich franchise with 75% of relationships having full treasury • Solid momentum building off an improved 2016 • Strategically challenged due to competitive space and scale (All banks/all sizes) • Double digit loan growth is a mission critical objective • Pivot up market in coordination with Treasury and Middle Market $000s 2014 2015 2016 CAGR Gross Loans 625,769 662,978 706,360 4.5% Total Deposits 1,139,752 1,257,988 1,326,217 7.1% Net Interest Revenue 26,436 28,358 31,498 6.2% Operating Revenue 5,629 6,192 6,882 6.7% Business Banking Overview

23 Market Coverage Call Trend Franchise Building * Revenue ≥ $10,000 17,540 25,995 28,056 0 5,000 10,000 15,000 20,000 25,000 30,000 35,000 2014 2015 2016 217 240 282 322 341 360 0 50 100 150 200 250 300 350 400 2014 2015 2016 New Relationships Expanded Relationships

24 Treasury Services Balanced offering of technology, sales, and service Healthcare is the fastest growing sector with strong potential Ideally positioned to bank the “modern economy” Core Competency of BOKF (Sales, Services, Platform) Annuity Revenue Stream but Sensitive to Economic Cycles (Volume) New Products: Commercial Card, webERA, Same Day ACH Rated A+ by Phoenix Hecht: $4.8 $5.0 $5.2 $5.4 $5.6 $5.8 $6.0 $6.2 Commercial DDA Supported 4.2% CAGR 2013 2014 2015 2016 $52,000 $54,000 $56,000 $58,000 $60,000 $62,000 $64,000 $66,000 Gross Fee Revenue 4.3% CAGR 2013 2014 2015 2016

25 Stacy Kymes Executive Vice President, Corporate Banking Energy, Healthcare, and Commercial Real Estate

26 Energy Banking Core competency of BOK for over 100 years Differentiated specialty lending business Substantially all first lien, senior secured, reserve-based loans – the sweet spot in energy lending Regionally diverse collateral focused on “lower 48” onshore drilling In-house engineering staff represents significant competitive advantage At 3/31/17: $2.8 billion unfunded commitments and $2.5 billion O/S ~60/40 split between oil and gas E&P line utilization 51% (below pre- downturn levels) 78% 15% 7% Oil & Gas Producers Midstream & Other Energy Services

27 Energy Banking Attributes Favorable LIBOR spreads Collateralized by readily marketable assets – oil and natural gas Advance rates typically under 60% of collateral value Ability to redetermine collateral values and remargin loans every 6 months Favorable credit metrics Full and valuable relationships with E&P customers Treasury management and deposits Wealth Management 20 year average gross loss rate on E&P loans (gross chargeoffs as a percent of period average loans) is 14.3 bps
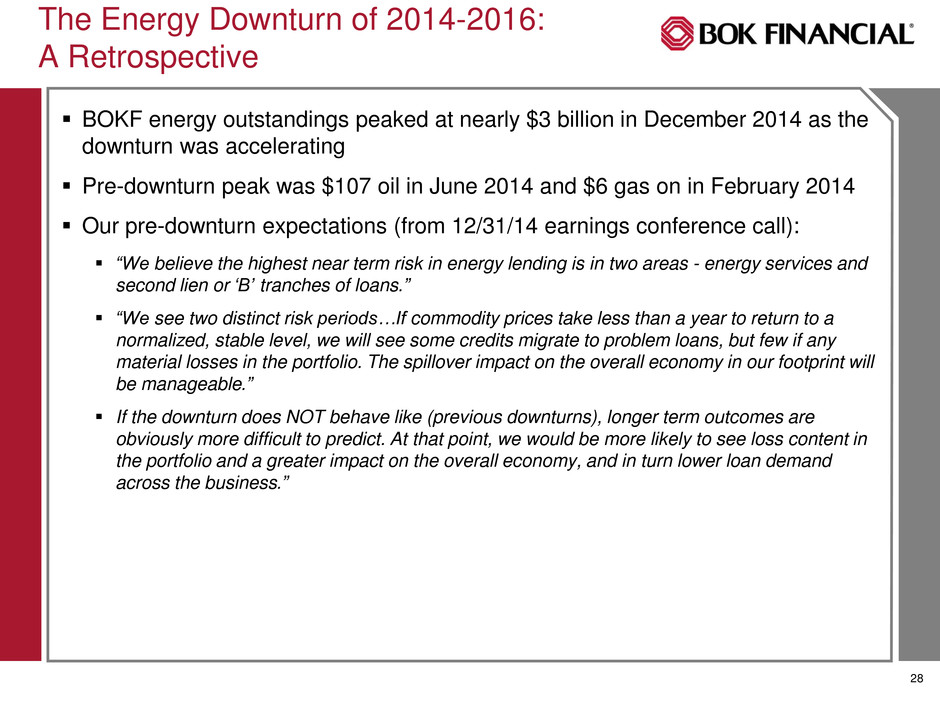
28 The Energy Downturn of 2014-2016: A Retrospective BOKF energy outstandings peaked at nearly $3 billion in December 2014 as the downturn was accelerating Pre-downturn peak was $107 oil in June 2014 and $6 gas on in February 2014 Our pre-downturn expectations (from 12/31/14 earnings conference call): “We believe the highest near term risk in energy lending is in two areas - energy services and second lien or ‘B’ tranches of loans.” “We see two distinct risk periods…If commodity prices take less than a year to return to a normalized, stable level, we will see some credits migrate to problem loans, but few if any material losses in the portfolio. The spillover impact on the overall economy in our footprint will be manageable.” If the downturn does NOT behave like (previous downturns), longer term outcomes are obviously more difficult to predict. At that point, we would be more likely to see loss content in the portfolio and a greater impact on the overall economy, and in turn lower loan demand across the business.”
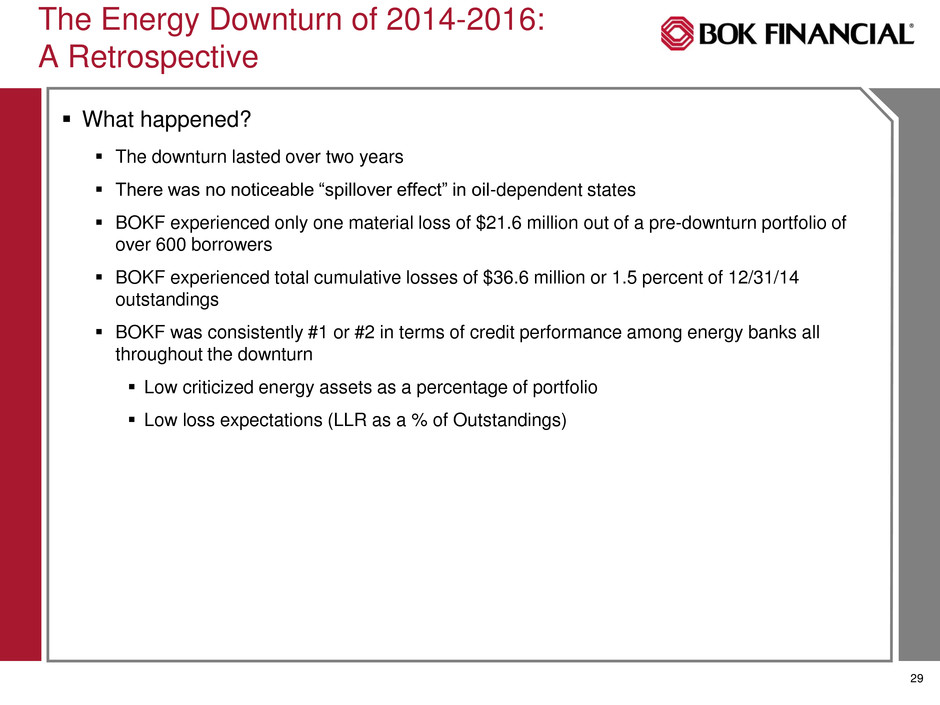
29 The Energy Downturn of 2014-2016: A Retrospective What happened? The downturn lasted over two years There was no noticeable “spillover effect” in oil-dependent states BOKF experienced only one material loss of $21.6 million out of a pre-downturn portfolio of over 600 borrowers BOKF experienced total cumulative losses of $36.6 million or 1.5 percent of 12/31/14 outstandings BOKF was consistently #1 or #2 in terms of credit performance among energy banks all throughout the downturn Low criticized energy assets as a percentage of portfolio Low loss expectations (LLR as a % of Outstandings)

30 The Energy Downturn of 2014-2016: 12 Lessons Learned 1. Portfolio composition mattered 2. SNCs generally performed better than non-SNCs 3. Large E&P borrowers performed better than small E&P borrowers 4. First lien senior secured positions did not get equitized 5. Wide-scale drawdowns on lines of credit did not occur 6. Private equity never left the market – although it did slow in Q1 2016 7. Texas and Oklahoma are more diverse than investors believed, and it was not “another 1980s” in oil patch states 8. Services held up reasonably well 9. The regulators were reasonable and took prudent actions through the downturn 10. OPEC and its machinations were largely irrelevant 11. U.S. exploration and production companies became recognized as the swing producers, and they behaved rationally 12. Production and demand balanced – but it took time
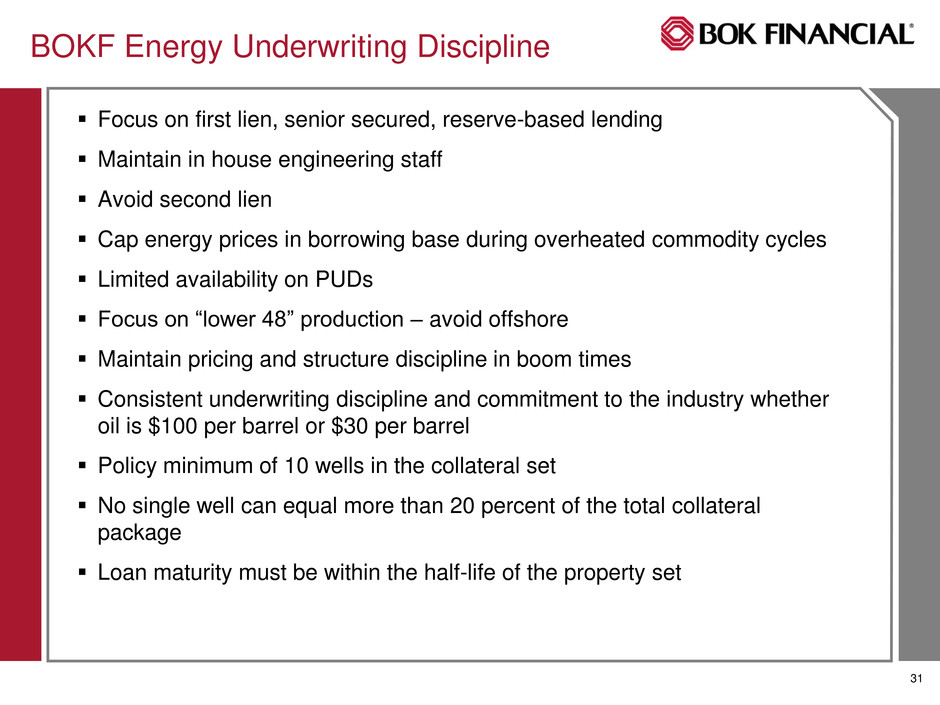
31 Focus on first lien, senior secured, reserve-based lending Maintain in house engineering staff Avoid second lien Cap energy prices in borrowing base during overheated commodity cycles Limited availability on PUDs Focus on “lower 48” production – avoid offshore Maintain pricing and structure discipline in boom times Consistent underwriting discipline and commitment to the industry whether oil is $100 per barrel or $30 per barrel Policy minimum of 10 wells in the collateral set No single well can equal more than 20 percent of the total collateral package Loan maturity must be within the half-life of the property set BOKF Energy Underwriting Discipline

32 BOK Financial formed Healthcare Banking as a Line of Business in July 2013 As of December 2016, commitments totaled $2.2 billion across 35 states. Commitments are classified among three categories: Senior Housing Hospitals Service Medical Senior Housing (highlighting skilled nursing) is a strategic focus due to favorable risk/return Healthcare Banking 53% 23% 24% Senior Housing Hospital Service Medical

33 Strategy Senior Housing Strong strategic focus on skilled nursing facilities where the market possesses significant barriers to entry Continued prudent expansion into new territories Hospitals Strategic focus on large health systems within BOK Financial’s metropolitan markets Selective expansion in other urban markets and physician-owned hospitals Credit relationships enhanced by significant treasury management opportunities Service Medical Selective expansion due to asset-lite business composition

34 Healthcare Banking Attributes Favorable LIBOR spreads Above-average loan utilization rates Predominately BOK Financial originated commitments Less than 14% of commitments from broadly syndicated transactions Senior Housing commitments real-estate collateralized and secured Favorable credit metrics No charge-offs since line of business inception No senior housing charge-offs (net of recoveries) since 2003
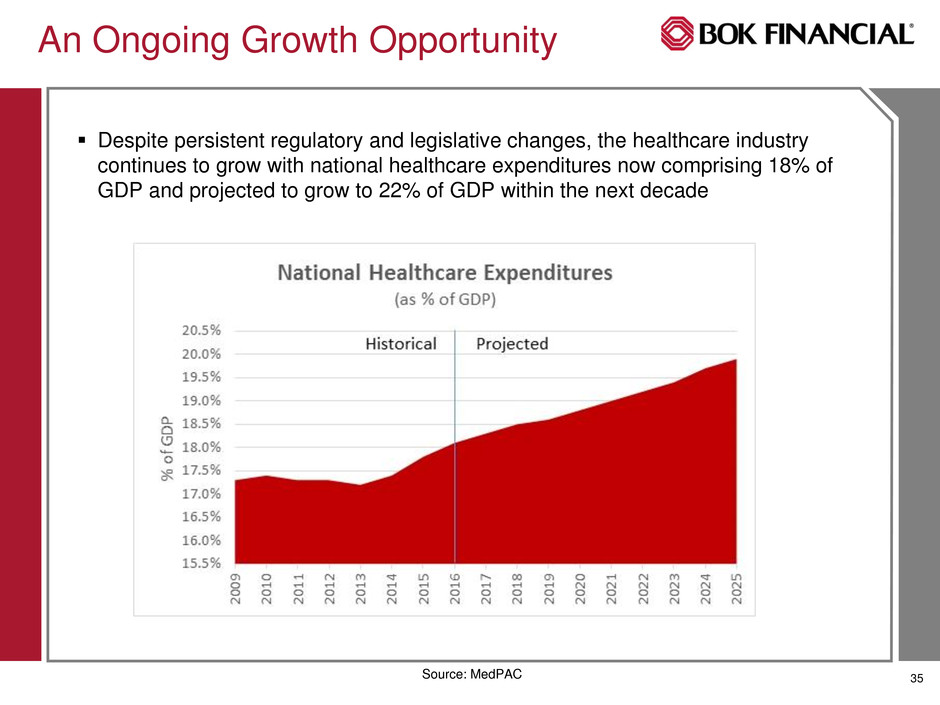
35 Despite persistent regulatory and legislative changes, the healthcare industry continues to grow with national healthcare expenditures now comprising 18% of GDP and projected to grow to 22% of GDP within the next decade An Ongoing Growth Opportunity Source: MedPAC

36 Centralized Underwriting Centralized underwriting streamlines workflow, promotes consistency, and enhances long-term credit outcomes Seven senior underwriters possess an average of 20 years of banking experience and nearly seven years of healthcare experience Senior underwriters have served in a variety of roles within the organization including: Relationship manager Loan review officer Business banking approver Finance analyst Senior professionals underwrite new relationships and complex restructuring of existing relationships. These senior underwriters also serve as advisors to Relationship Managers throughout deal process
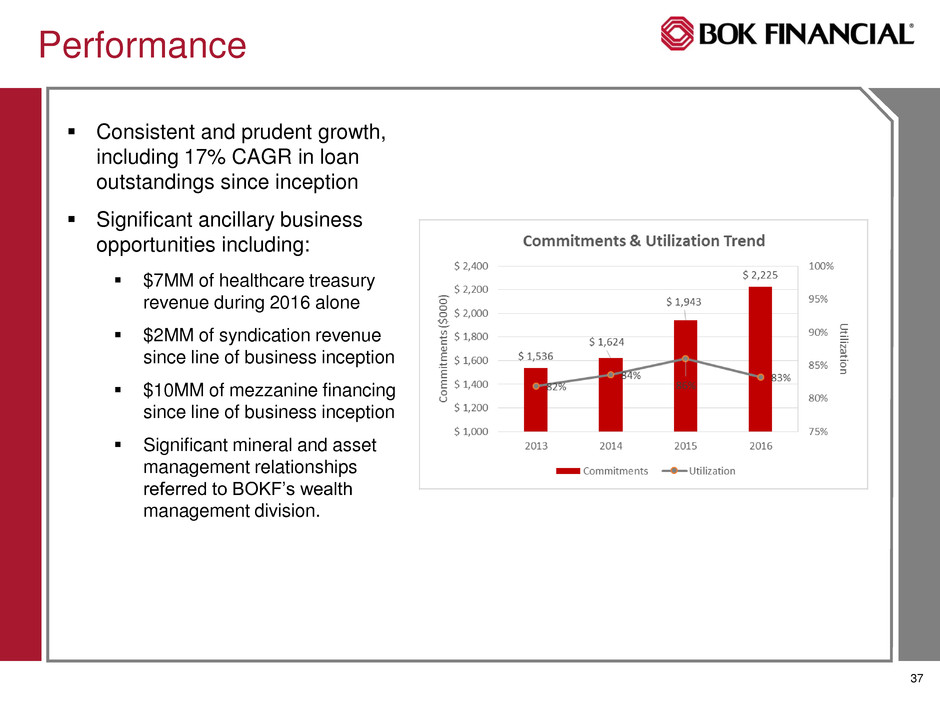
37 Performance Consistent and prudent growth, including 17% CAGR in loan outstandings since inception Significant ancillary business opportunities including: $7MM of healthcare treasury revenue during 2016 alone $2MM of syndication revenue since line of business inception $10MM of mezzanine financing since line of business inception Significant mineral and asset management relationships referred to BOKF’s wealth management division.

38 What’s Next Continued strategic focus on Senior Housing sector (highlighting skilled nursing) with increased penetration in recently approved markets “Sell-the-bank” focus with particular cross-selling emphasis on healthcare treasury management, wealth management, and derivative product offerings Capitalize on existing healthcare professionals in BOK Financial markets to increase local market presence Opportunistically add talent outside of BOK Financial’s existing footprint Infrastructure investment to meet planned growth Monitor regulatory environment and fine-tune customer selection accordingly

39 OK TX NMCOAZ KS/MO Other CRE Portfolio by Collateral Location Construction/ Land Development Retail Office Multifamily Industrial Other CRE Portfolio by Product Type Commercial Real Estate Concentration management is key to BOKF’s commercial real estate strategy Overall CRE exposure capped as percent of Tier 1 Capital + Reserves as well as percent of overall portfolio Sub-limits by product type and geography Proven willingness to reduce origination efforts when internal limits are approached, even when to do so limits overall loan growth
40 New or renewal term and construction loans over $2,000,000 Cash flow sensitivity for required debt service: Current and pro-forma cash flow stressed for: Interest Rate Vacancies CAP Rates Rental Rates Variable operating expenses Officer support required for: Discussion of stress parameters and analysis results Mitigating factors (guarantor support, pending takeout, etc.) on highly sensitive properties CRE Underwriting – Stress Testing

41 Appraised values evaluated for acceptable CAP rates considering market data and historical investment returns Internal value established using BOKF minimum CAP Rates for underwriting and grading decisions Considerations include: Property Class (age, condition, rental rate volatility, market vacancy history, location, permanent financing options) Property Type (multifamily, senior housing, industrial, retail, office) GSA or Credit Tenant Lease CRE Underwriting – CAP Rates
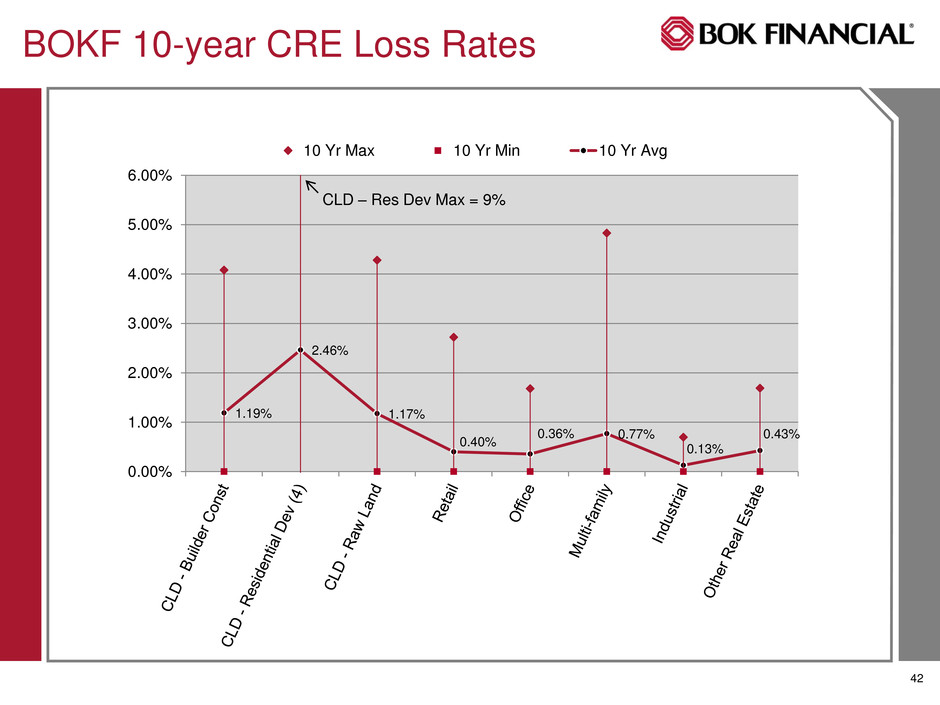
42 1.19% 2.46% 1.17% 0.40% 0.36% 0.77% 0.13% 0.43% 0.00% 1.00% 2.00% 3.00% 4.00% 5.00% 6.00% 10 Yr Max 10 Yr Min 10 Yr Avg CLD – Res Dev Max = 9% BOKF 10-year CRE Loss Rates
43 Marc Maun Chief Credit Officer The Current Credit Environment

44 Current Credit Environment Energy portfolio continues to improve No signs of material stress in non-energy portfolio Net recoveries for two consecutive quarters Material reductions in non-accruals and non-performing assets Healthy combined allowance for credit losses to period end loans of 1.52% 0.00% 0.50% 1.00% 1.50% 2.00% 2.50% $0 $50 $100 $150 $200 $250 $300 2011 2012 2013 2014 Q1 15 Q2 15 Q3 15 2015 Q1 16 Q2 16 Q3 16 4Q 16 1Q 17 M ill io n s Required ACL (before Q&E) ACL Q&E ACL as a Percent of Total Loans

45 Reserve for Credit Losses - Policy Evaluation of loan portfolio by industry (29 categories) For each industry: Greater of 10 year or trailing 12 months gross loss rate For the graded portion of the portfolio, 20 categories: Correlation of our loss data and grades to Moody’s loss data and ratings Comparison of current weighted average risk grade (WARG) to historical WARG Loss rate adjustment based on correlation to Moody’s data, positive or negative for movement in WARG Credit cycle adjustment when loss rates are not representative of the current credit cycle. Additional industry adjustment for credit risk that currently exists in the portfolio Non-specified Qualitative and Environmental factors: Factors not related to specific industries Economic (national and regional), interest rates, concentration of large balance loans
46 Retail CRE: Total outstandings of $745 million at 3/31/17 Criticized/classified Retail CRE loans totaled $6MM at 3/31/17 – less than 1% of the portfolio $4MM paid off in April No exposure to traditional enclosed malls Very limited exposure to high-profile troubled retailers Well-diversified by product type and geography Retail CRE portfolio down 8.1% over past 12 months Portfolio is focused on best-in-class retail developers with multiple sources of repayment Each new loan is stress tested at origination to ensure no dependencies on any single tenant Focus Areas: Retail CRE and Healthcare Healthcare Total outstandings of $2.3 billion at 3/31/17 Limited exposure to asset-light, cash flow based healthcare loans that have caused credit issues at other regional banks Well-diversified by product type and geography Portfolio is focused on best-in-class owner operators with multiple sources of repayment Criticized/classified healthcare loans totaled $76MM at 3/31/17 or 3.3% of the portfolio

47 Commercial Banking Q&A

48 Stacy Kymes Executive Vice President, Commercial Banking Brian Bourgeois Executive Vice President, TransFund Transaction Processing Overview

49 TransFund History 1975: Bank of Oklahoma installs first ATM in State of Oklahoma 1981: TransFund becomes a shared EFT Network by signing its first participating Financial Institution Oklahoma Networks: • SCS (Fiserv) • Exchequer (MPact) • ChecOKard (Chase) • TransFund 1990s: TransFund saturates Oklahoma and begins concentrating on growth outside of Oklahoma

50 ATM Network Among the top 10 networks in the US Operates in 26 states 63% of clients are outside of Oklahoma generating 55% of the revenue Clients: 221 Banks, 150 Credit Unions, 4 C-Store partners In 2016, processed 569 million EFT transactions Merchant Payment Processing Process payments for 6,697 merchant and cash advance locations In 2016, processed $2.2 billion in merchant sales 0 100 200 300 400 500 600 2011 2016 EFT Transaction Volumes (M) SIG POS PIN POS ATM $- $500 $1,000 $1,500 $2,000 $2,500 2011 2016 Merchant Volume $Mil Retail Sales Cash Advance CAGR: 8.18% CAGR: 7.20% TransFund Today

51 TransFund Overview Customers Financial Institutions (Banks / Credit Unions) Convenience Stores Merchants Products ATM Driving Debit Card Processing Services Merchant Payment Processing

52 Payment Card Transaction Flow

53 Growth Strategies TransFund provides mega-bank products and solutions to community banks and credit unions On/Off Spend Thresholds Location Region Transaction Type Merchant Type Mobile

54 TransFund builds relationships with Convenience Stores allowing participating financial institutions Surcharge-Free access to ATMs. TransFund also offers access to a National Surcharge Free Network with over 25,000 locations. Surcharge-Free ATMs Growth Strategies
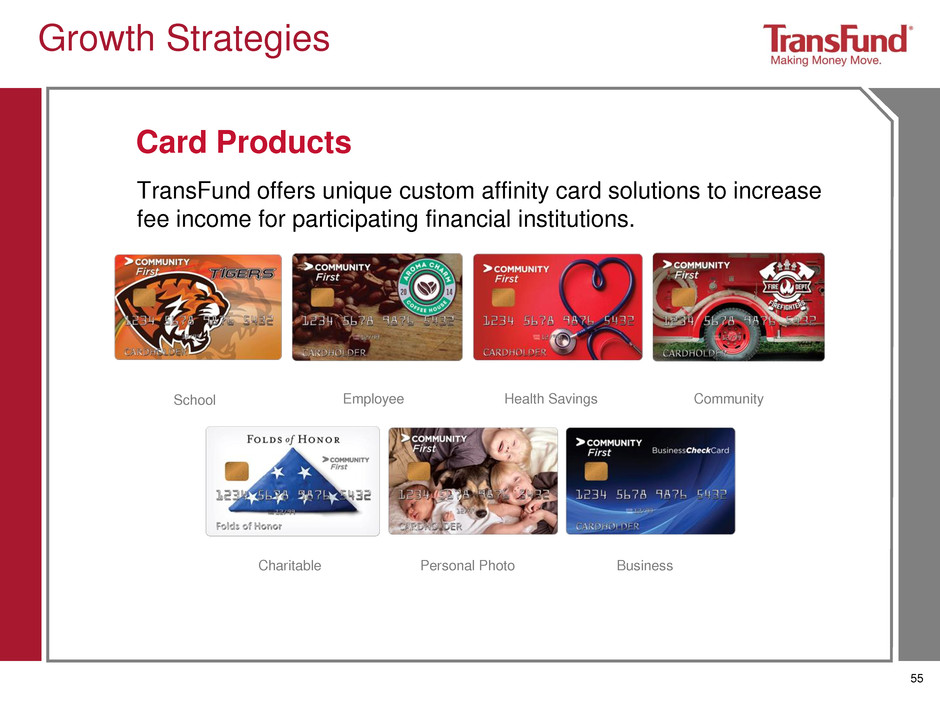
55 TransFund offers unique custom affinity card solutions to increase fee income for participating financial institutions. School Employee Health Savings Community Charitable Personal Photo Business Card Products Growth Strategies

56 Affinity/Loyalty programs Rewards Sweepstakes Cash Back Card Linked Offers Charitable Cards TransFund analyzes the primary drivers of financial institutions’ debit card portfolios (penetration, activation, usage, revenue, etc.) enabling them to make precise marketing decisions to increase profitability. PAU Analytics Growth Strategies Growth Strategies
57 Key Objectives 2017 EMV Apple Pay / Samsung Pay / Android Pay Mobile ATM Managed Services Grow Merchant Services Continue to monitor evolution of FinTech in payments space for additional opportunities

58 TransFund Revenue Growth 10 Year CAGR = 7.1%

59 Transaction Processing Q&A

60 Intermission Presentations will resume at approximately 10:30 AM eastern time

61 Scott Grauer Executive Vice President, Wealth Management Wealth Management Overview

62 Wealth Management at BOKF Differentiated products and services that address all aspects of the market from mass affluent to ultra-high net worth Capability dates back to the origins of the bank in the early 1900s Trust powers since 1918 Fee-based asset management since 1949 Balanced revenue model: net interest income, fee-based asset management, and transactional revenue Well positioned to take advantage of the biggest demographic trend facing the financial services industry: the retirement of the baby boomers and the coming transition of over $30 trillion of wealth to their heirs
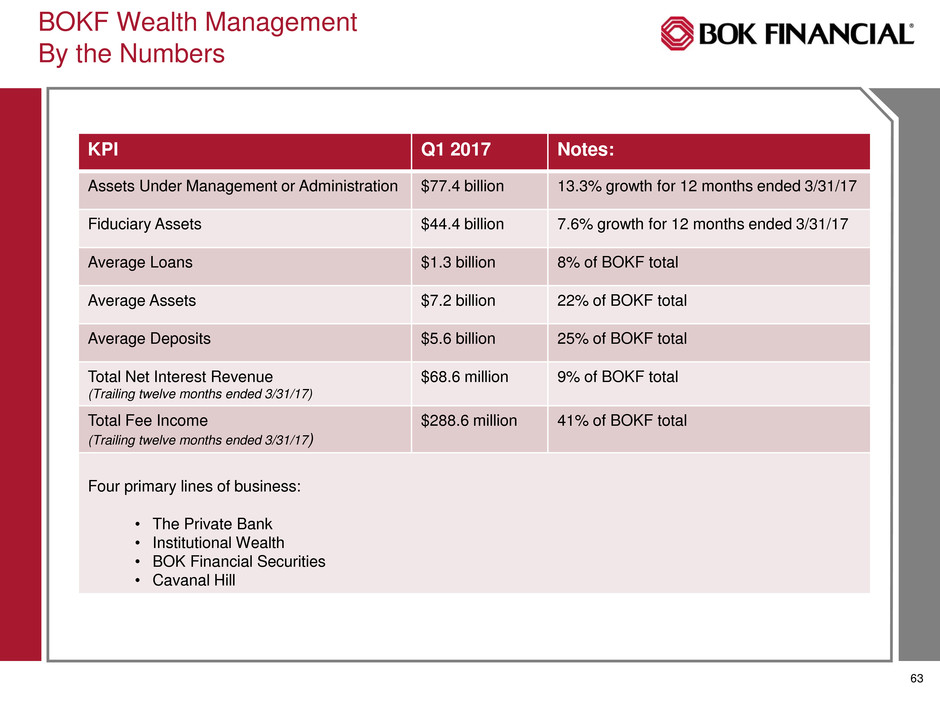
63 BOKF Wealth Management By the Numbers KPI Q1 2017 Notes: Assets Under Management or Administration $77.4 billion 13.3% growth for 12 months ended 3/31/17 Fiduciary Assets $44.4 billion 7.6% growth for 12 months ended 3/31/17 Average Loans $1.3 billion 8% of BOKF total Average Assets $7.2 billion 22% of BOKF total Average Deposits $5.6 billion 25% of BOKF total Total Net Interest Revenue (Trailing twelve months ended 3/31/17) $68.6 million 9% of BOKF total Total Fee Income (Trailing twelve months ended 3/31/17) $288.6 million 41% of BOKF total Four primary lines of business: • The Private Bank • Institutional Wealth • BOK Financial Securities • Cavanal Hill

64 Wealth Management AUMA Growth 10.2% CAGR
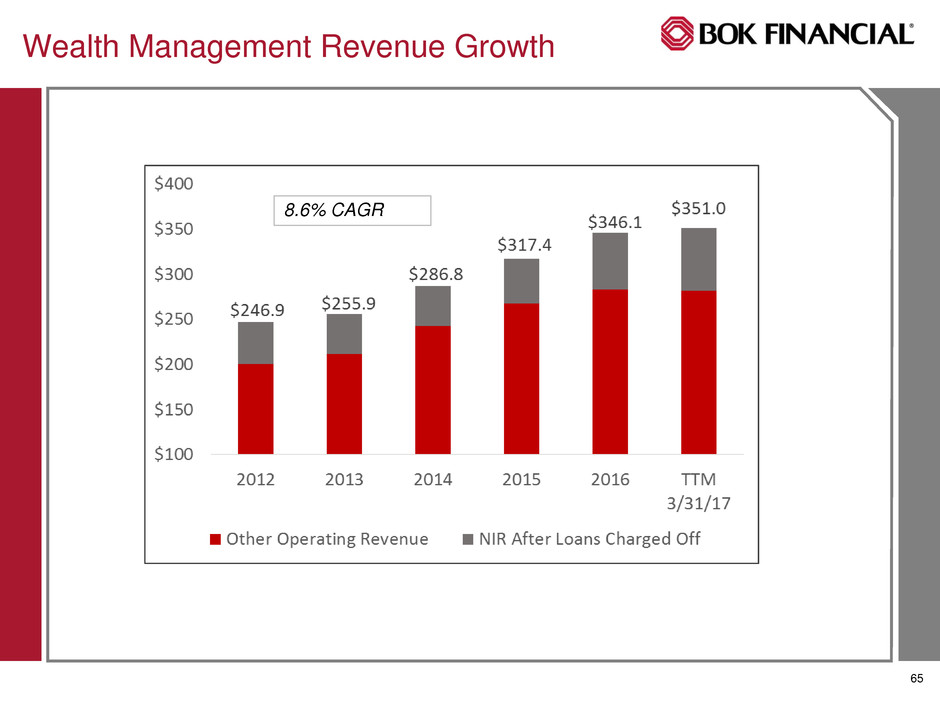
65 Wealth Management Revenue Growth 8.6% CAGR

66 Wealth Management Loans and Deposits 6.7% CAGR 4.3% CAGR

67 BOK Financial Securities 22% Institutional Wealth 54% The Private Bank 20% Cavanal Hill 4% Wealth Management Revenue and AUMA by Business Line BOK Financial Securities 40% Institutional Wealth 15% The Private Bank 40% Cavanal Hill 5% Wealth Revenue by LOB: Wealth AUMA by LOB:

68 Awards, Recognition, and Rankings: Five top-ten rankings for investment banking underwriting services One of the top 25 firms that fulfills the hedging needs of the mortgage banking industry. Practice areas: Institutional Sales & Trading Retail Brokerage Investment Banking Financial Risk Management Metrics: More than $1 trillion in traded securities annually Growth Strategies: Connecticut lift-out; expand services to mortgage industry A growing financial institutions group Continued growth in recurring revenues (NIR and fee-based asset management) BOK Financial Securities

69 Connecticut Trading Desk BOK Financial is a significant player in all aspects of the mortgage industry: Origination Servicer Owner of mortgage securities Top 25 TBA player Secondary dealer of mortgage securities Connecticut trading desk maximizes opportunities from this positioning in the mortgage industry: August 2016 lift-out of 6 employees from a brokerage firm Expertise in specified pools Overlapping customers with BOKF Little Rock office Identifies specific mortgages and pools of mortgages for investors with specific needs/interests Ability to trade in CRA and “scratch and dent” mortgages

70 Awards, Recognition, and Rankings: 14 “Best in Class” awards – Plan Sponsor Magazine 2016 Seventh largest corporate trustee bank ranked by number of issues and dollar amount Practice areas: Bond Trustee Services Escrow Services Retirement Plan Services Investment Management Services and Investment Consulting Asset Custody, Reporting, and Performance Measurement Metrics: 61 years of experience Clients from coast to coast and participants in virtually every state More than 100 professionals serving our Retirement Plan clients Growth Strategies 3(38) fiduciary services Bankruptcy trustee services Comprehensive retirement strategies Institutional Wealth

71 Practice Areas: SMAs and mutual funds Acts as CIO for all of wealth management Fixed income (taxable and tax free) Equity (fundamental and quantitative) Cash management offerings Metrics: Currently manages approximately $7 billion in assets; approximately $3 billion direct Award-winning portfolio managers supported by teams of experienced analysts with an average of more than 14 years industry experience Growth Strategies: World Energy Fund Opportunistic Fund Quantitative Multi-cap Equity Awards, Recognition, and Rankings: Two five-star ratings from Morningstar for Cavanal Hill Three #1 Lipper awards in 2016 for Cavanal Hill Cavanal Hill Equity Strategies 34% Fixed Income 33% Cash Management 33%
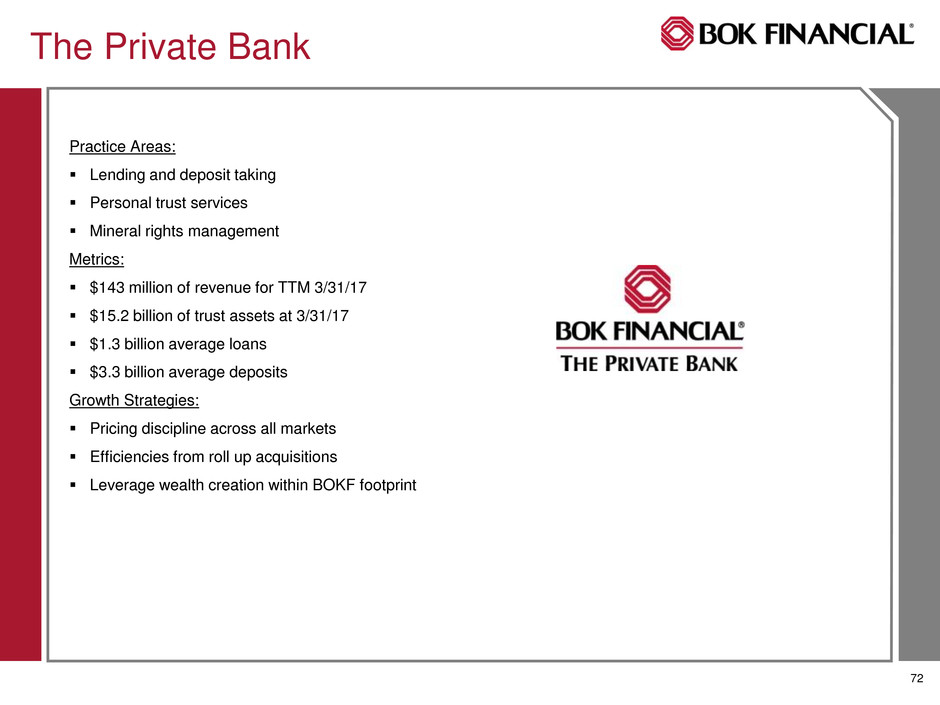
72 The Private Bank Practice Areas: Lending and deposit taking Personal trust services Mineral rights management Metrics: $143 million of revenue for TTM 3/31/17 $15.2 billion of trust assets at 3/31/17 $1.3 billion average loans $3.3 billion average deposits Growth Strategies: Pricing discipline across all markets Efficiencies from roll up acquisitions Leverage wealth creation within BOKF footprint
73 Wealth Management Q&A
74 Pat Piper Executive Vice President, Consumer Banking Glenn Brunker Senior Vice President, President, BOKF Mortgage Consumer Banking and Mortgage Overview

75 Deposit mix ($bn) $21 $20 $21 $21 $23 $0 $6 $12 $18 $24 Dec '12 Dec '13 Dec '14 Dec '15 Dec '16 Demand Interest-bearing transaction Savings Time Strong Core Deposit Franchise MSA Branches Deposit share Tulsa 25 32% DFW 21 2% Oklahoma City 18 13% Albuquerque 16 9% Houston 12 1% Denver 11 2% Kansas City 6 2% Phoenix 4 1% Northwest Arkansas 2 4% Other MSAs 9 Total Branches 124 Source: SNL Source: Company filings; SNL Financial

76 Optimizing Delivery 76 Significant investment to create a strong digital foundation Established the Digital Banking Center of Excellence Establish Virtual Operations Support, lowering delivery cost while preserving experience and risk management Strategic reduction of banking center network vs. peers at 15%. o Exit Instore Channel o $13MM annual expense reduction o Focus on solutions vs. transactions 126 Banking Centers, down 28%.

77 Positioned for Rising Rates 7 distinct brands priced at the market-level Market compositions offer pricing advantage Positioned to price efficiently when rates move Ability to test and learn Upper, Middle, and Lower refer to market competitive position. Market Based Pricing Differential Upper Middle Lower 0.5% Consumer Banking Deposit Concentration 52% 1.4% 13%0.9% 8.5% 23.3% ++ + Par - - - OK AZ K.C. NM CO AR TX
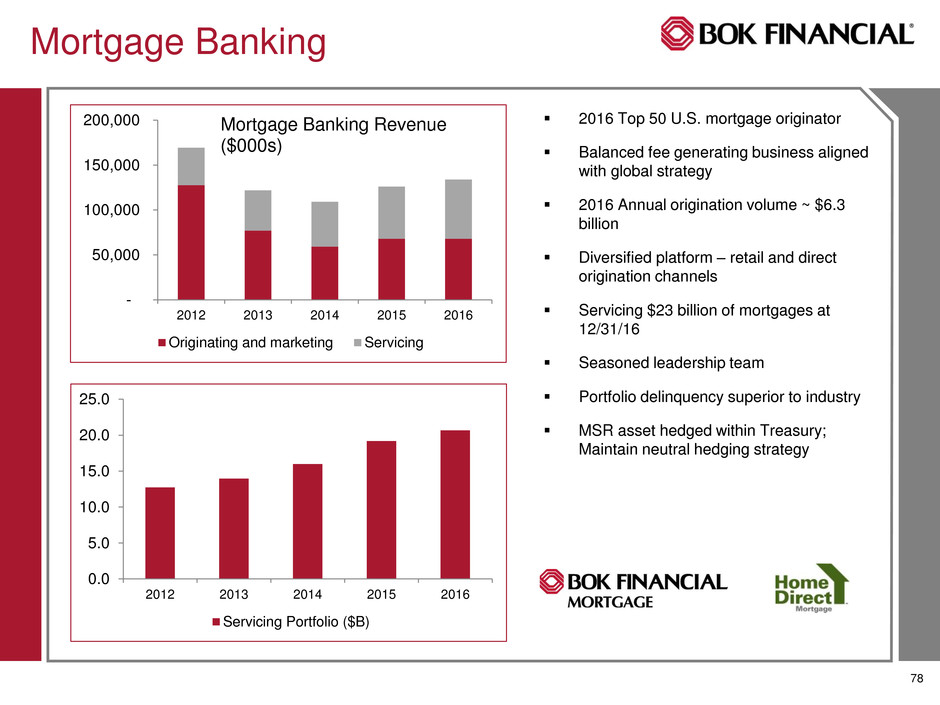
78 - 50,000 100,000 150,000 200,000 2012 2013 2014 2015 2016 Mortgage Banking Revenue ($000s) Originating and marketing Servicing Mortgage Banking 0.0 5.0 10.0 15.0 20.0 25.0 2012 2013 2014 2015 2016 Servicing Portfolio ($B) 2016 Top 50 U.S. mortgage originator Balanced fee generating business aligned with global strategy 2016 Annual origination volume ~ $6.3 billion Diversified platform – retail and direct origination channels Servicing $23 billion of mortgages at 12/31/16 Seasoned leadership team Portfolio delinquency superior to industry MSR asset hedged within Treasury; Maintain neutral hedging strategy
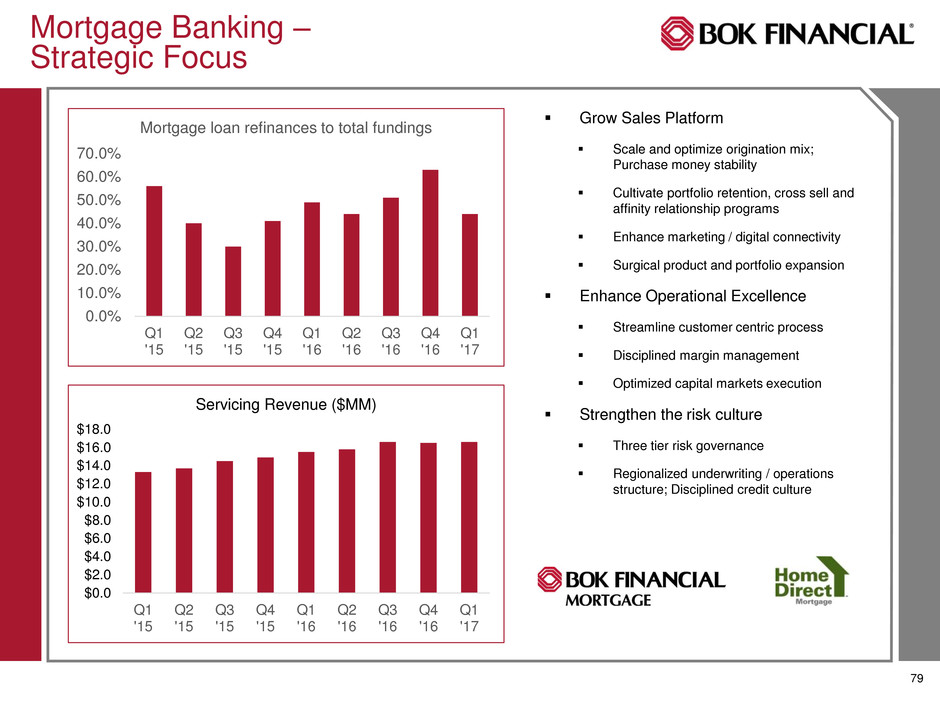
79 Mortgage Banking – Strategic Focus Grow Sales Platform Scale and optimize origination mix; Purchase money stability Cultivate portfolio retention, cross sell and affinity relationship programs Enhance marketing / digital connectivity Surgical product and portfolio expansion Enhance Operational Excellence Streamline customer centric process Disciplined margin management Optimized capital markets execution Strengthen the risk culture Three tier risk governance Regionalized underwriting / operations structure; Disciplined credit culture $0.0 $2.0 $4.0 $6.0 $8.0 $10.0 $12.0 $14.0 $16.0 $18.0 Q1 '15 Q2 '15 Q3 '15 Q4 '15 Q1 '16 Q2 '16 Q3 '16 Q4 '16 Q1 '17 Servicing Revenue ($MM) 0.0% 10.0% 20.0% 30.0% 40.0% 50.0% 60.0% 70.0% Q1 '15 Q2 '15 Q3 '15 Q4 '15 Q1 '16 Q2 '16 Q3 '16 Q4 '16 Q1 '17 Mortgage loan refinances to total fundings

80 Mortgage Banking – Strategic Focus 0% 5% 10% 15% 20% 25% 30% 35% 40% Q1 2015 Q2 2015 Q3 2015 Q4 2015 Q1 2016 Q2 2016 Q3 2016 Q4 2016 HomeDirect Channel % of Originations 0 500 1,000 1,500 2,000 2,500 3,000 Q1 2015 Q2 2015 Q3 2015 Q4 2015 Q1 2016 Q2 2016 Q3 2016 Q4 2016 Cost to Produce per Loan Invest in Technology Upgraded loan operating / servicing platform with supporting technologies Install customer portal offering robust digital capability Implement CMS solution to enhance lead conversion; Optimize data Leverage HomeDirect Channel Accelerate HomeDirect growth as a percentage of total originations; Driven by shift in buyer behavior Scale HomeDirect third party referral source originations; Build purchase money base Maintain focus on delivering efficiencies from originations through servicing ($)

81 Consumer Banking Q&A

82 Intermission Presentations will resume at approximately 12:30 PM eastern time

83 Steven Nell Executive Vice President, Chief Financial Officer Financial Overview

84 Earnings Momentum: • Noteworthy items impacting Q1 profitability: • Improved interest rate environment. BOKF balance sheet behaving more asset sensitive in the early part of the current interest rate cycle. • Continued healthy fee and commission income, driven by wealth management. • Much better expense management: total expenses down $21 million despite full quarter of Mobank- related operating expenses. • Significant improvement in MSR hedging outcomes. • Benign credit environment – no provision for loan losses in the quarter. Q1 2017 Q4 2016 Q1 2016 Diluted EPS $1.35 $0.76 $0.64 Net income before taxes ($M) $126.8 $72.4 $62.4 Net income attributable to BOKF shareholders ($M) $88.4 $50.0 $42.6 $42.6 $65.8 $74.3 $50.0 $88.4 $0.64 $1.00 $1.13 $0.76 $1.35 1Q16 2Q16 3Q16 4Q16 1Q17 Net Income Net income attributable to shareholders Net income per share - diluted

85 2017 Expectations Mid-single-digit loan growth for the full year $700 million reduction in available for sale securities portfolio for the full year Stable to increasing net interest margin Low-single-digit net interest revenue growth (linked quarter annualized) Loan loss provision of $15 - $20 million for the year Low-single-digit revenue growth from fee-generating businesses on a trailing twelve month basis Expenses flat to slightly down compared to 2016 (GAAP basis) Capital deployment through organic growth, acquisitions, dividends, and limited stock buybacks
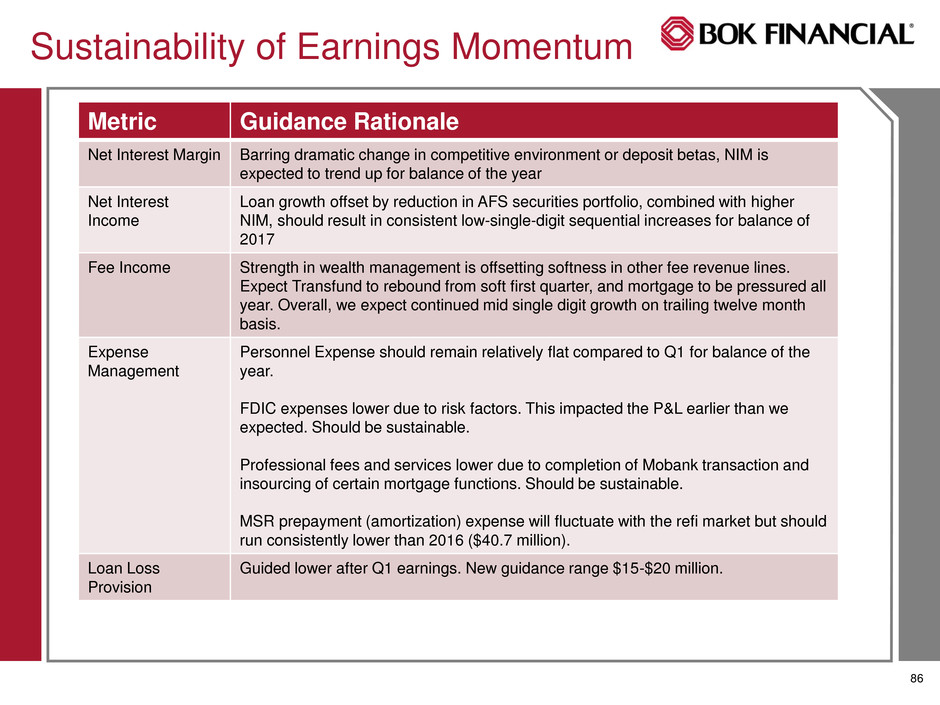
86 Sustainability of Earnings Momentum Metric Guidance Rationale Net Interest Margin Barring dramatic change in competitive environment or deposit betas, NIM is expected to trend up for balance of the year Net Interest Income Loan growth offset by reduction in AFS securities portfolio, combined with higher NIM, should result in consistent low-single-digit sequential increases for balance of 2017 Fee Income Strength in wealth management is offsetting softness in other fee revenue lines. Expect Transfund to rebound from soft first quarter, and mortgage to be pressured all year. Overall, we expect continued mid single digit growth on trailing twelve month basis. Expense Management Personnel Expense should remain relatively flat compared to Q1 for balance of the year. FDIC expenses lower due to risk factors. This impacted the P&L earlier than we expected. Should be sustainable. Professional fees and services lower due to completion of Mobank transaction and insourcing of certain mortgage functions. Should be sustainable. MSR prepayment (amortization) expense will fluctuate with the refi market but should run consistently lower than 2016 ($40.7 million). Loan Loss Provision Guided lower after Q1 earnings. New guidance range $15-$20 million.

87 Interest Rate Risk Management Managing the balance sheet to be neutral for interest rate movements is a core, fundamental tenet of BOKF’s long-term philosophy If BOKF had moved 4% asset sensitive (peer average) on January 1, 2013 (assumed as the starting date for the current banking industry asset sensitivity craze) it would have forsaken more than $300 million in net interest income over the ensuing four years

88 Interest Rate Risk Management Non-maturity Deposit Assumptions • Now, more than ever, non-maturity deposit assumptions play a critical role in the measurement of interest rate risk. • Relatively small differences in repricing and balance assumptions can drive large differences among the interest rate risk positions reported by banks. What This Means for BOKF • Our modestly liability-sensitive position in an UP 200bp scenario assumes - Historical interest-bearing NMD product betas with no additional lag over the next few rate hikes - Material migration of non-interest DDA into interest-bearing alternatives • To the extent there’s additional pricing lag over the next few rate hikes (relative to pre-crisis product betas), BOKF will outperform expectations

89 Liquidity/Deposits • Liquidity remains strong • No material pressure on deposit pricing at this time • Liquidity/deposit initiatives have been developed, inventoried, and prioritized • Focus is on optimizing the balance between growth and cost as competition for deposits increases NMD/Cust REPO DDA FHLB Capital CDs All Other BOKF Funding Sources 1Q17 Average Balances Securities Collateral $4.0 B Brokered Deposits $3.0 B Fed Funds $3.3 B BOKF Wholesale Funding Availability $10.3 billion as of 03/31/17

90 $8.4 Billion at 3/31/17 High quality, actively managed Securities portfolio used primarily to manage interest rate risk and generate incremental net interest revenue Consistent strategy; actively managed for total return Total AFS portfolio estimated duration of 3.1 years Duration expected to extend to 3.4 years with 200bp interest rate upward shock Agency RMBS, $5.4 Agency CMBS, $2.9 Other, $0.1 Available for Sale Securities Portfolio

91 Uses of Capital / Rationale Capital Management BOKF internal operating limit: maintain 100 basis point operating buffer over regulatory minimum for a well-capitalized bank, including the capital conservation buffer. Current Priorities Organic growth Regular quarterly dividends M&A Stock buyback 1 Regulatory minimum includes the capital conservation buffer. Capital Ratios Tier 1 Common Equity Tier 1 Risk Based Total Risk Based Ratio 11.60% 11.60% 13.26% Excess versus 100 bp over regulatory minimum1 $896 million $523 million $438 million

92 M&A Criteria and Return Objectives Whole bank acquisitions Primarily in-market (TX, KS/MO, CO) Bank and non-bank entities Ability to leverage existing business or add elements Revenue-generating capabilities Solid customer base Talented employee continuance Expense synergies are important, but secondary to revenue generation Cash-on-cash return (IRR) is primary metric Interested in EPS impact and other metrics (TBV multiple, TBV earn back), but secondary to return metrics Active executive calling/relationship building effort underway No material changes in M&A strategy and approach since prior investor day

93 Conclusion: BOKF is a Best-in- Class Midsized Regional Bank A consistent strategy that works Plentiful organic growth opportunities Disciplined Entrepreneurial A mix of fee businesses unlike any other in the regional banking sector…all of which would trade at a premium on a stand alone basis A long-term focus that consistently outperforms peers across the economic cycle BUT…BOKF trades at a discount to regional peers: Price/Forward Earnings Price/TBV CFR 15.7 2.5 TCBI 15.7 2.0 PB 14.7 2.6 UMB 16.8 2.1 CBSH 17.7 2.3 Peer Avg 16.1 2.3 BOKF 15.0 1.9 Discount to peers -7% -18%

94 Conclusion: BOKF is a Best-in-Class Midsized Regional Bank And a great investment opportunity for investors.

95 Open Q&A with Leadership Team