
BOK Financial Corporation
Analyst Day
April 29, 2009
Forward-Looking Statements
This presentation contains forward-looking statements that are based on management’s beliefs, assumptions, current expectations, estimates, and projections about BOK Financial Corporation, the financial services industry, and the economy generally. Words such as “anticipates”, “believes”, “estimates”, “expects”, “forecasts”, “plans”, “projects”, variations of such words, and similar expressions are intended to identify such forward-looking statements. Management judgments relating to, and discussion of the provision and allowance for credit losses involve judgments as to future events and are inherently forward-looking statements. Assessments that BOKF’s acquisitions and other growth endeavors will be profitable are necessary statements of belief as to the outcome of future events, based in part on information provided by others which BOKF has not independently verified. These statements are not guarantees of future performance and involve certain risks, uncertainties, and assumptions which are difficult to predict with regard to timing, extent, likelihood and degree of occurrence. Therefore, actual results and outcomes may materially differ from what is expressed, implied or forecasted in such forward-looking statements. Internal and external factors that might cause such a difference include, but are not limited to, (1) the ability to fully realize expected cost savings from mergers within the expected time frames, (2) the ability of other companies on which BOKF relies to provide goods and services in a timely and accurate manner, (3) changes in interest rates and interest rate relationships, (4) demand for products and services, (5) the degree of competition by traditional and non-traditional competitors, (6) changes in banking regulations, tax laws, prices, levies, and assessments, (7) the impact of technological advances, and (8) trends in customer behavior as well as their ability to repay loans. BOK Financial Corporation and its affiliates undertake no obligation to update, amend, or clarify forward-looking statements, whether as a result of new information, future events, or otherwise.
2

Agenda
7:30-8:00 a.m. Continental Breakfast – Doubletree Hotel at Warren Place
Tulsa Learning Center
8:00-8:15 a.m. Welcome – Stan Lybarger, President & CEO
8:15-9:00 a.m. Review of 1st Quarter Earnings – Steven Nell,
Chief Financial Officer
9:00-9:45 a.m. Loan Portfolio & Asset Quality – Chuck Cotter, Chief Credit Officer
9:45-10:00 a.m. Break
10:00-10:45 a.m. Oklahoma, Arizona, New Mexico, Arkansas, Commercial &
TransFund – Dan Ellinor, Sr. Executive Vice President
10:45-11:30 a.m. Colorado, Kansas City, Consumer & Wealth Management –
Steve Bradshaw, Sr. Executive Vice President
11:30-12:00 p.m. Texas – Norm Bagwell, Chairman & CEO, Bank of Texas
12:00 Lunch
3

Review of 1st Quarter Earnings
4
Steven Nell
Chief Financial Officer
Executive Vice President
12/31/08 3/31/09 Change*
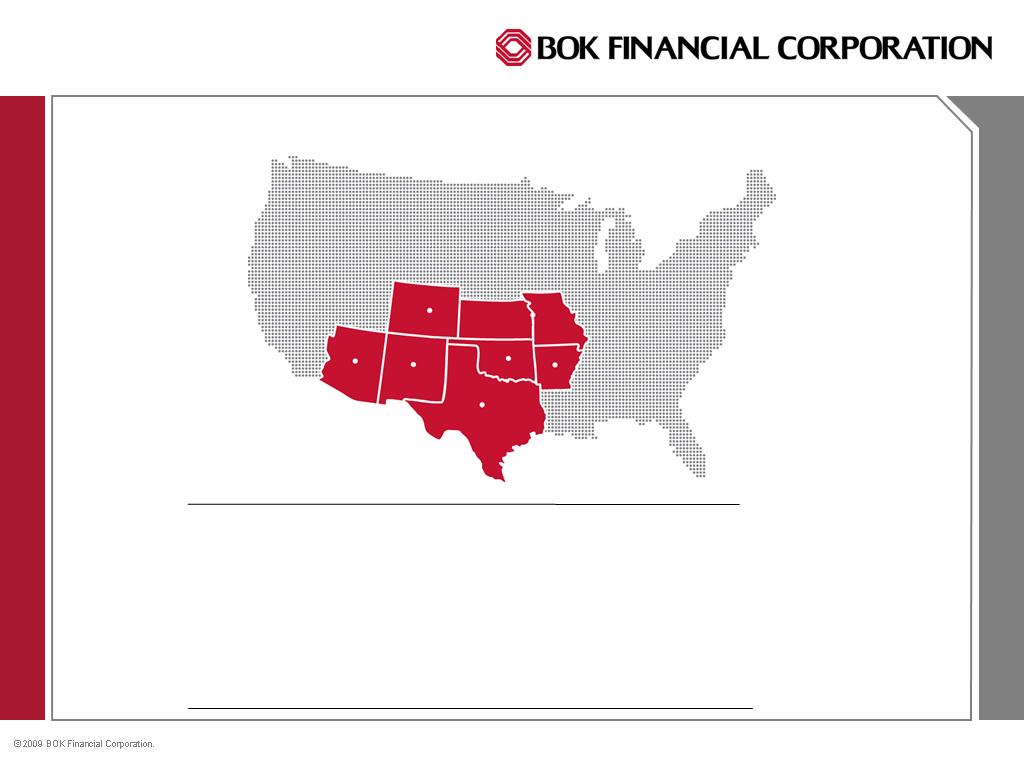
BOK Financial Today
5
*annualized
Total assets
22,734,648
$
23,333,442
$
10.54
%
Average loans
12,826,696
$
12,784,765
$
(1.31)
%
Combined Reserve for Loan
Losses/Pd End Loans
1.93%
2.07%
14
bps
Average deposits
14,093,936
$
14,850,184
$
21.46
%
Shareholder's equity
1,846,257
$
1,931,300
$
18.42
%
Tangible Common Equity
6.64%
6.84%
20
bps
Market Cap
$ 2.7 billion
2.4 billion
(11.11)
%
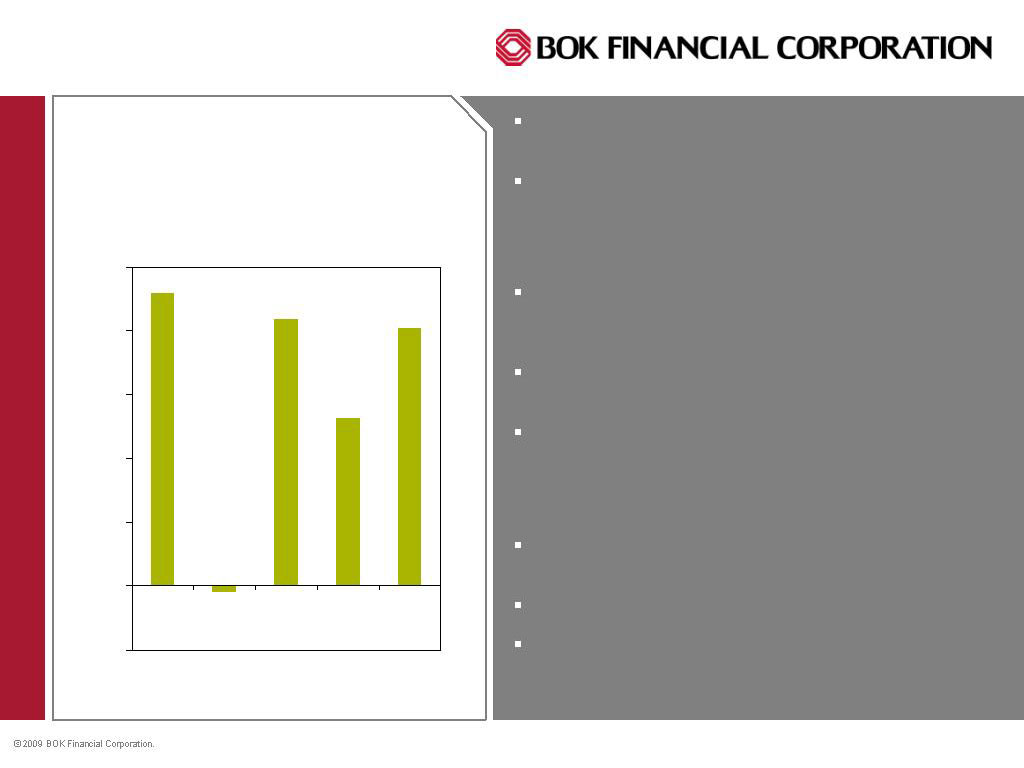
-$0.20
$0.00
$0.20
$0.40
$0.60
$0.80
$1.00
1Q08
2Q08
3Q08
4Q08
1Q09
Earnings of $55 million or $0.81 per diluted
share
The net interest margin of 3.47%, down 10
basis points from 4Q08 due primarily to the
spread between LIBOR and federal funds
returning to a historically normal level
Fees and commissions revenue totaled
$121.5 million, an increase of nearly $11
million or 9.8% over 4Q08
Recognized OTTI charges of $15 million for
certain preferred stocks and private label MBS
Planned provision of $45 million less net
charge offs of $31.9 million increased
combined reserve for credit losses to 2.07% of
outstanding loans
Average deposits up $756 million or 21%
annualized since 4Q08
Tangible common equity increased to 6.84%
Increased the cash dividend from $0.225 to
$0.24 per common share
Diluted Earnings Per Share
First Quarter Results
6

Quarterly Results ($ In 000s)
7
3/31/2008
6/30/2008
9/30/2008
12/31/2008
3/31/2009
Net interest revenue
147,128
$
158,939
$
164,348
$
176,447
$
169,845
$
Net interest margin
3.31%
3.44%
3.48%
3.57%
3.47%
Other operating revenue
113,857
124,449
119,958
110,930
121,507
Other operating expense
151,642
158,501
158,736
159,010
167,749
Efficiency Ratio
57.60%
55.55%
55.46%
54.94%
57.10%
Net operating income
109,343
124,887
125,570
128,367
123,603
Provision for credit losses
17,571
59,310
52,711
73,001
45,040
Net change re: mortgage
servicing rights and related hedge
(1,571)
(6,285)
(4,368)
(11,343)
(163)
Gain (loss) on securities,
derivatives and asset sales
11,852
(3,834)
4,442
(4,572)
20,705
Net impairment losses
5,306
15,002
Non-recurring (losses) recoveries
-
(60,700)
6,700
-
-
Federal and state income taxes
34,450
(2,862)
22,958
10,363
28,838
Non-controlling interest income (expense), net
(32)
1,219
10
6,355
(233)
Net income
62,265
$
(1,161)
$
56,685
$
35,443
$
55,032
$
Quarter Ended

Net interest revenue was
down $6.6 million
compared to 4Q08 due
primarily to the spread
between LIBOR and the
federal funds rate
returning to a historically
normal level
Average earning assets
increased $477 million
from the previous quarter
Average interest bearing
deposits increased $604
million while average
funds purchased, repos
and other borrowed funds
decreased $361 million
from 4Q08
Net Interest Margin
8
12/31/08
3/31/09
TAX-EQUIVALENT ASSETS YIELDS
Trading securities
6.55%
3.69%
Funds sold and resell agreements
0.76%
0.24%
Total securities
5.17%
4.96%
Total loans
5.27%
4.56%
Less Allowance for loan losses
-
-
Total loans, net
5.35%
4.65%
Total tax-equivalent yield on earning assets
5.28%
4.75%
COST OF INTEREST-BEARING LIABILITIES
Interest-bearing deposits:
Interest-bearing transaction
1.51%
0.95%
Savings
0.37%
0.28%
Time
3.28%
2.83%
Total interest-bearing deposits
2.29%
1.76%
Funds purchased and repurchase agreements
0.94%
0.45%
Other borrowings
1.51%
0.58%
Subordinated debt
5.48%
5.67%
Total cost of interest-bearing liabilities
2.02%
1.50%
Tax-equivalent net interest revenue spread
3.26%
3.25%
Effect of noninterest-bearing funding sources
and other
0.31%
0.22%
Tax-equivalent net interest margin
3.57%
3.47%
Quarter Ended
0%
20%
40%
60%
80%
100%
Net Interest Revenue, 58.2%
Brokerage & Trading, 8.5%
Transaction Card, 8.7
Trust fees, 5.7%
Deposit service charges, 9.4%
Mortgage Banking, 6.3%
Other, 3.2%
Components of Revenue
FYE 12/31/08
9
Fee Revenue in Millions
4Q08 1Q09
Brokerage & Trading $23.50 $24.70
Transaction Card
25.18
25.43
Trust Fees
17.14
16.51
Deposit Svc Charges
29.24
27.40
Mortgage Banking
7.22
18.50
Margin Asset Fees
.19
.06
Other
8.46
8.90
Total
$110.93
$121.50
The 156% increase in mortgage banking
revenue was primarily driven by increased
volume in refinancing due to government
initiatives to lower mortgage interest rates
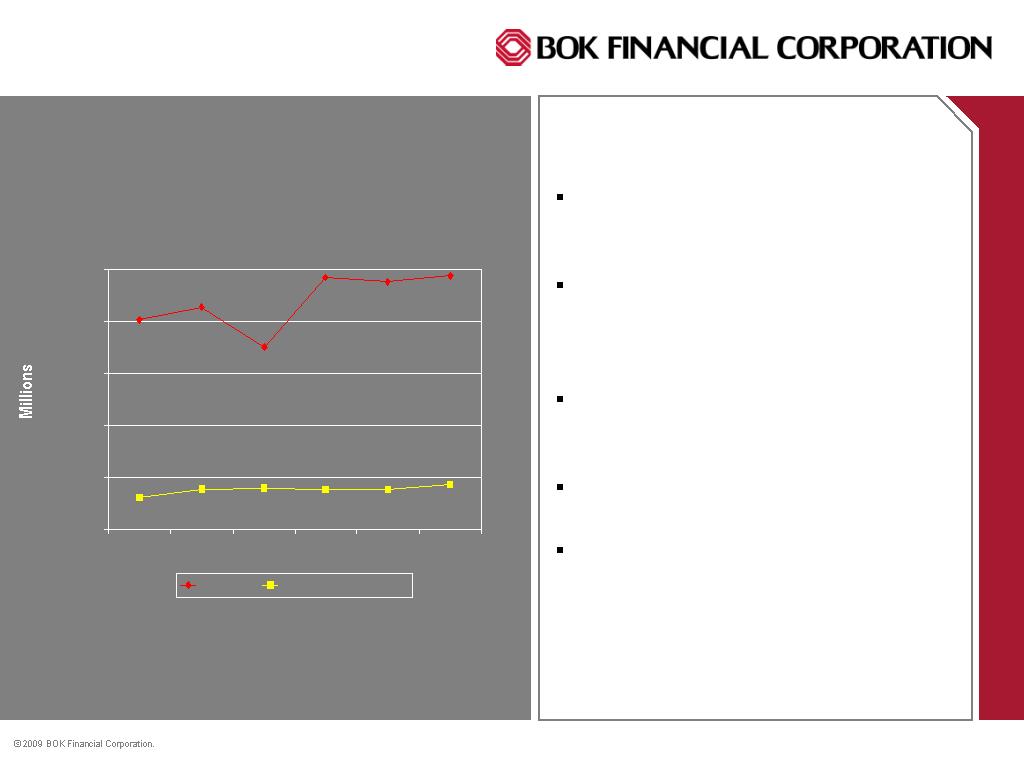
Expense Management
Higher FDIC insurance premiums
resulted in a $2.2 million increase
over 4Q08
Personnel expense increased in
1Q09 primarily due to seasonal
increases in payroll taxes and other
employee benefit costs
Added 61 employees during 1Q09,
hired high quality talent for BOSC,
Mortgage, Treasury and RITS,
New initiatives include capping merit
increases for 2009
Recently began a review of non-
personnel operating expenses to
identify opportunities to decrease
cost without impacting service quality
10
$50,000
$100,000
$150,000
$200,000
$250,000
$300,000
4Q07
1Q08
2Q08
3Q08
4Q08
1Q09
Revenue
Personnel Expense
Revenue & Personnel Expense Trends
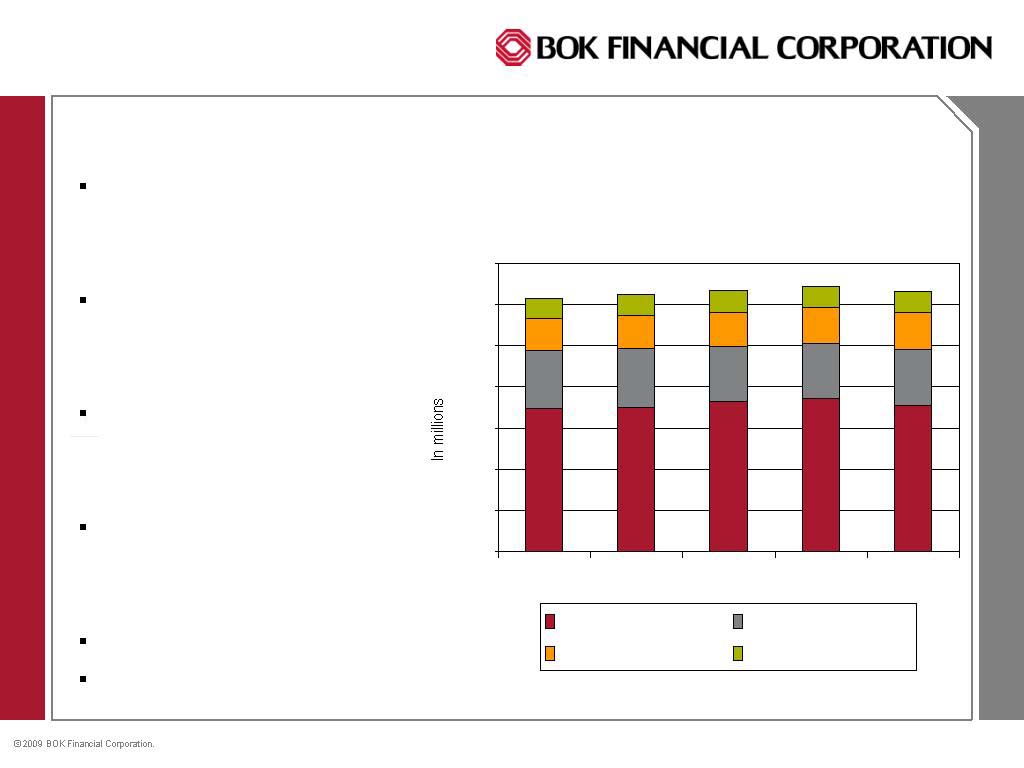
Loans
Loan Trends
Commercial loans decreased
$310 million in 1Q09; decrease
was generally consistent across
nearly all sectors
CRE increased $31 million;
increases in retail, office and
multifamily offset the decrease in
construction & land development
Residential mortgages increased
$67 million due to higher
originations driven by lower
interest rates
Consumer loans decreased as
BOKF exited the dealer financial
services in favor of a customer-
focused direct lending approach
Loan pricing is improving
Approximately 25% of CRE is
owner-occupied property
$0
$2,000
$4,000
$6,000
$8,000
$10,000
$12,000
$14,000
1Q08
2Q08
3Q08
4Q08
1Q09
Commercial
Commercial Real Estate
Residential Mortgage
Consumer
57%
23%
12%
8%
8%
11
56%
22%
14%
58%
21%
13%
57%
22%
13%
56%
22%
13%
8%
8%
8%
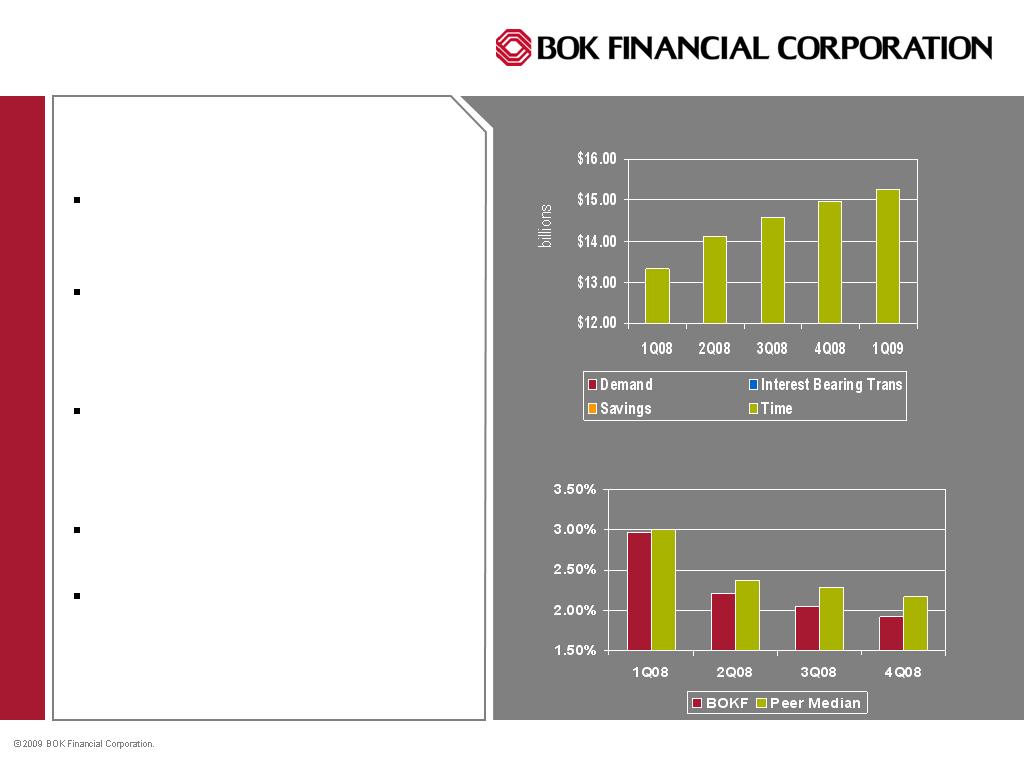
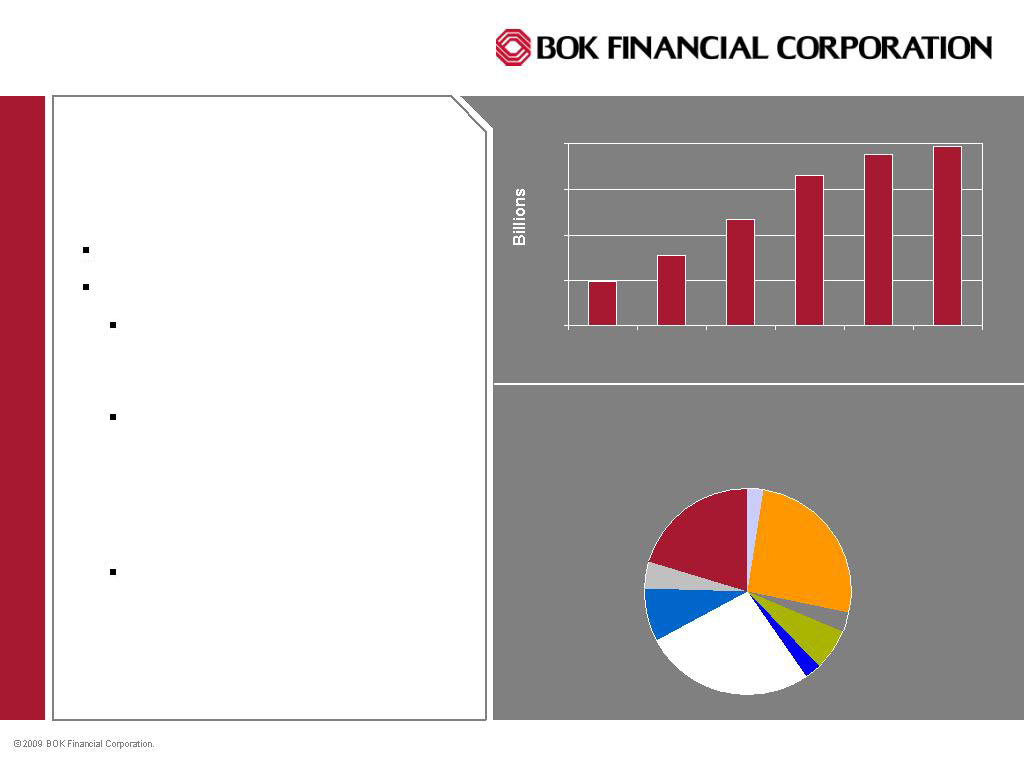
Deposits
Deposits
Cost of Deposits
BOKF has placed a special focus on
growing deposits and maximizing
liquidity
Deposits increased $288 million
during 1Q09 primarily due to growth
in Consumer and Wealth
Management accounts
Texas and Arkansas experienced
the largest deposit growth, though
deposits in nearly all markets
increased
Loan to deposit ratio was 83% at
3/31/09
Over the last year, demand and
interest bearing transaction deposits
have increased as a percent of total
deposits; the mix stayed consistent
from 4Q08 to 1Q09
12
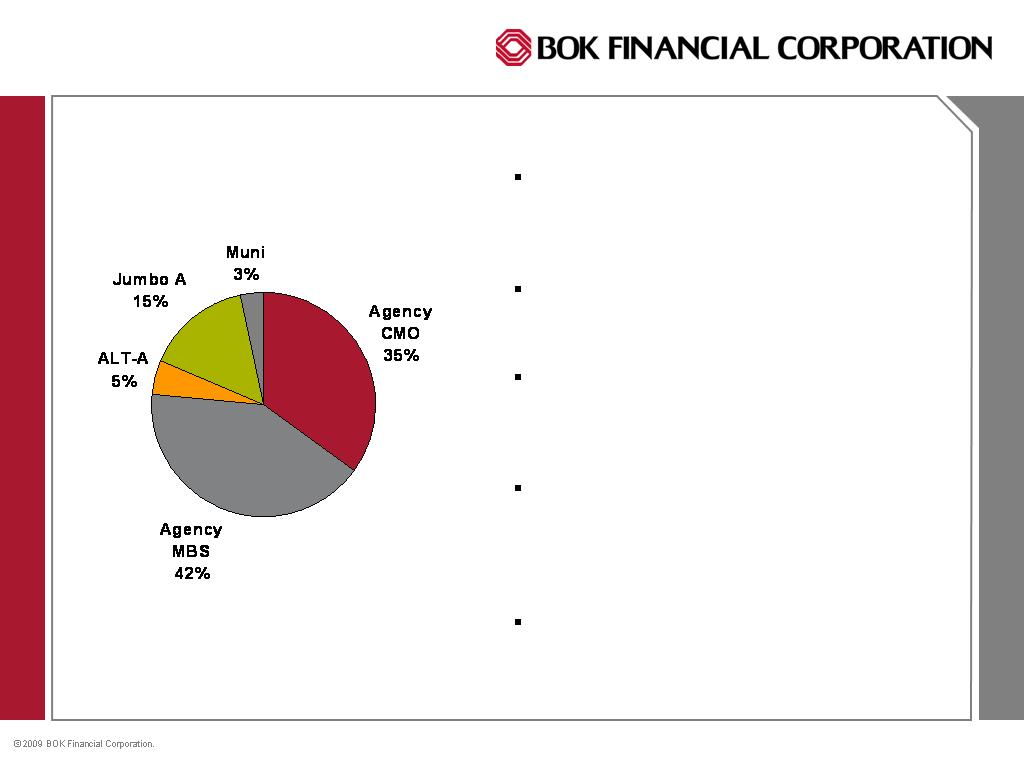
$7.7B Investment Portfolio
Current portfolio has an effective duration
of approximately 1.9 years and would
extend less than one year if rates increase
300bp
The $665 million increase in the portfolio in
1Q09 included purchases and a $69 million
increase in the fair value of AFS securities
At 3/31, our AFS portfolio included $5.5
billion MBS, fully backed by U.S.
government agencies and $1.6 billion
privately issued MBS
Approximately $381 million of the privately
issued MBS consisted of Alt-A mortgage
loans; all Alt-A MBS originated in 2007 and
2006 are credit enhanced with additional
collateral support
BOKF does not hold any CLOs, CDOs,
payment option ARMs or subprime
mortgage loans
13
As of 3/31/09
OTTI Evaluation of Debt
Securities
Debt securities rated below investment grade
were evaluated for other-than-temporary
impairment
The evaluation was based on projections of
estimated cash flows using current and
anticipated unemployment and default rates,
decreasing housing prices and increasing
default rates
14 MBS totaling approx. $444 million were
rated below investment grade by at least one
nationally-recognized rating agency; six of
these were still rated investment grade by
another rating agency
Four of the 14 MBS analyzed were identified
as having other-than-temporary impairment;
the aggregate unrealized loss on these
securities totaled $46 million and estimated
credit losses totaled $7 million
Summary ($ in millions)
Amortized cost of private issue MBS $1,556
Aggregate cost of securities
rated < investment grade by at
least one rating agency 444
Fair value of securities
rated < investment grade by at
least one rating agency 277
Other Than Temporary Impairment 46
Credit component 7
14

OTTI Evaluation of Equities
BOKF owns preferred stocks issued by six
financial institutions
Preferred stocks have a current carrying
value of $24 million including $22 million in
cumulative other-than-temporary
impairment charges
In 1Q09, we recognized an $8 million other-
than temporary impairment on the preferred
stock of one issuer whose preferred stock,
though not in default, was downgraded to
below investment grade
These preferred stocks have certain debt-
like features such as a quarterly dividend
based on LIBOR
Summary ($ in 000s)
Original cost at purchase $46,419
Previously written down value 32,464
Fair value at 3/31/09 16,341
OTTI recognized 1Q09 8,000
Aggregate tax equivalent yield is 12.05%
15
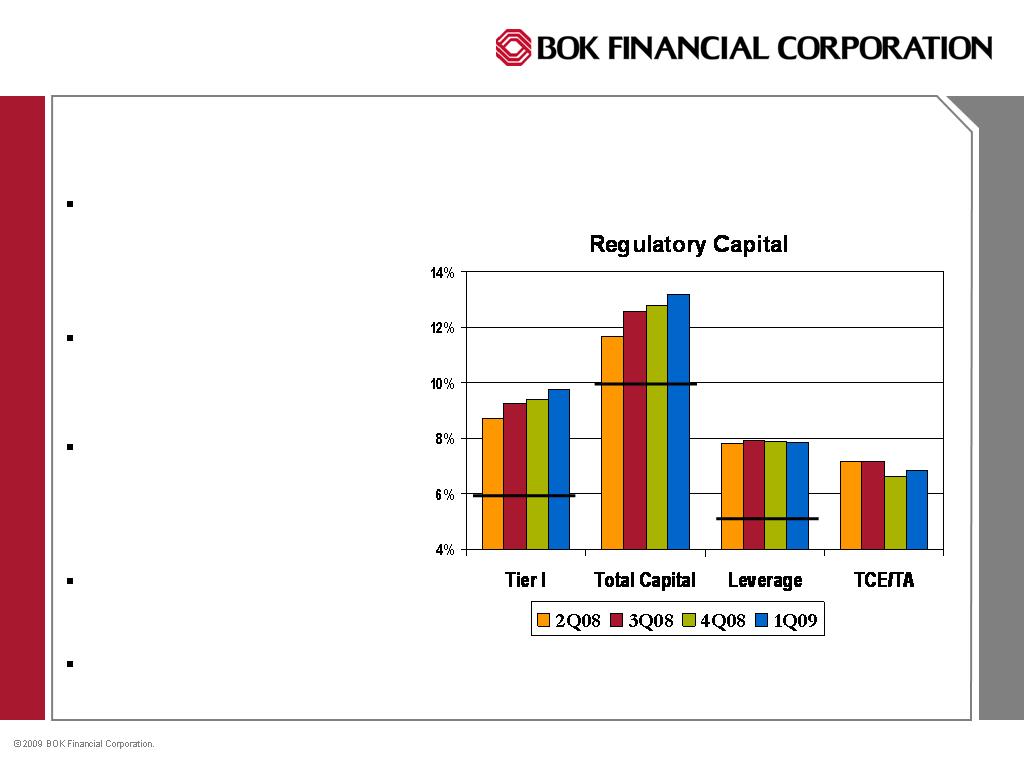
Solid Capital
16
BOKF elected not to participate
in the Capital Purchase
Program (an element of TARP)
as current capital sufficient to
support planned growth
Current uses of capital include
organic growth, dividends,
acquisitions within our footprint
and periodic stock buyback
BOKF’s capital levels far
exceed “well capitalized” as
defined by the federal banking
agencies as indicated by the
solid black lines
Tangible common equity ratio
increased to 6.84% from 6.64%
at 12/31/08
TCE/RWA increased to 8.65%
from 8.07% at 12/31/08
First Quarter Results
7
17
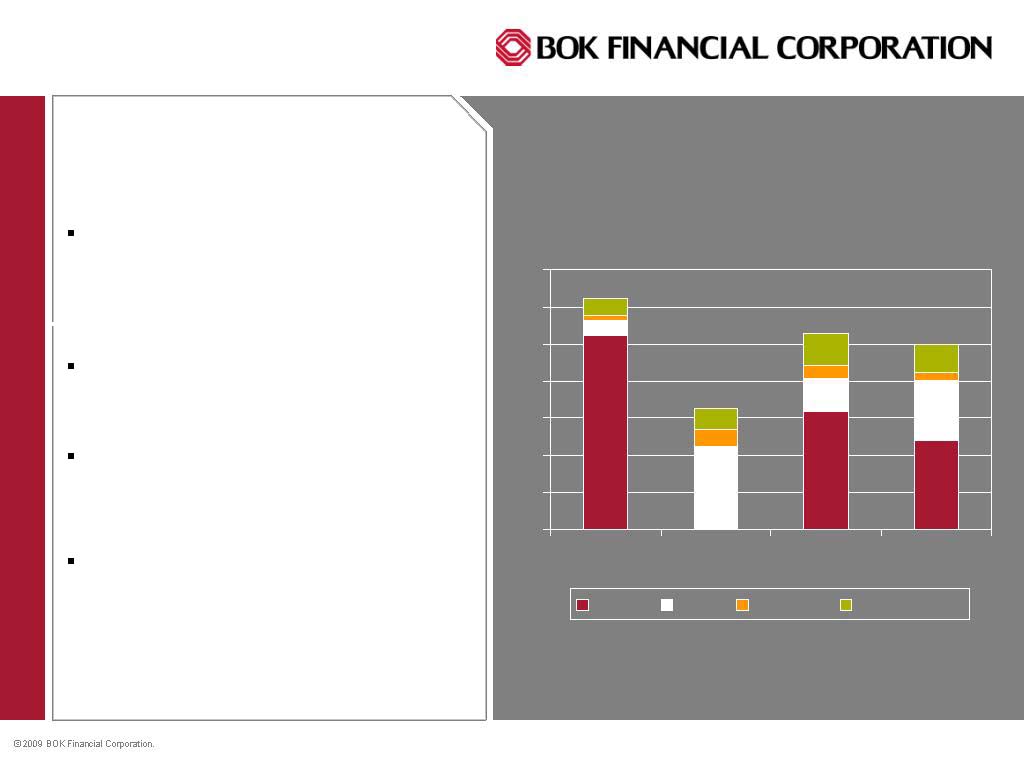
LOB’s performance includes allocation of
funds, direct and indirect expenses, taxes
and net charge-offs
Funds Management unit manages overall
liquidity and interest rate risk, and contains
impairment charges and excess provision
over net charge-offs
62,265
$
55,032
$
Total
3,429
23,381
Funds management and other
58,836
31,651
Subtotal
10,053
5,502
Wealth management
12,033
9,628
Consumer banking
36,750
$
16,521
$
Commercial banking
8
200
9
200
March 31,
Three Months ended
(In Thousands)
Net Income by Line of Business
Net Income by Geographic
Region
(In Thousands)
Three Months ended March 31,
200
9
200
8
Oklahoma
$
25,051
$
36,335
Texas
6,808
12,180
New Mexico
2,610
4,592
Arkansas
3,707
2,239
Colorado
(1,873)
2,981
Arizona
(
6,455
)
554
Kansas City
1,739
489
Subtotal
31,587
59,370
F
unds management and other
23,445
2,895
Total
$
55,032
$
62,265
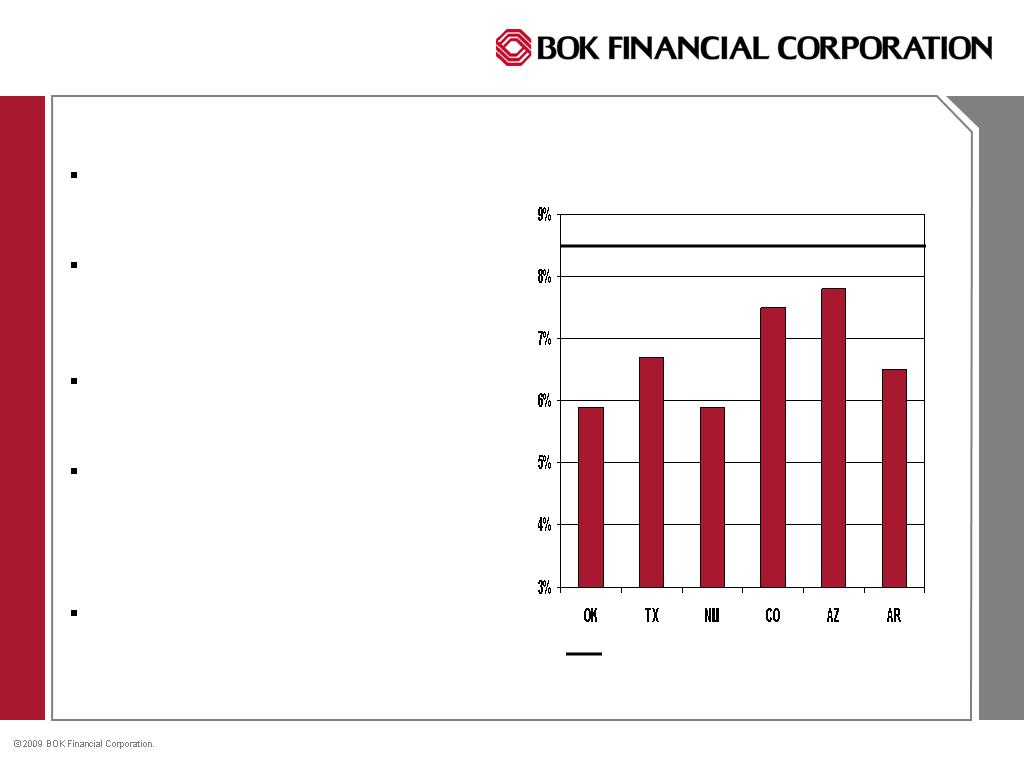
Market Update
March Unemployment Rates
US unemployment rate (8.5%)
In OK, loan demand has slowed, but
spreads and fees are improving; record
syndication fees and solid deposit growth
In the regional markets we have seen an
increase in employees and customers in
play due to competitors downsizing or
exiting fee business
In Texas, we have successfully grown
low cost deposits and enhanced deposit
margin
In Albuquerque, northwest AR, KC and
Denver, account officers are working
through exit credits; recent growth in
pipeline reflects progress in re-focusing
on new business
In AZ, loan demand is slow and CRE
values are still declining; we closed the
Tucson office and opened three new
branches in Phoenix
18
Source: US Dept of Labor
Current Focus
Aggressively address credit quality, including continuous evaluation
of the loan portfolio
Continue to focus on growing loans at higher spreads
Increase fee revenue in regional markets
Grow deposits at the lowest cost possible and actively manage
liquidity
Control expense growth in relation to revenue growth
Continue expansion efforts through modest branching and
opportunistic acquisitions within our footprint
Focus on providing exceptional delivery of our products and service
while laying the groundwork for our long term growth objectives
19
Loan Portfolio and
Asset Quality
20
Chuck Cotter
Chief Credit Officer
Executive Vice President

Credit Administration
Re-examined our loan and risk management policies in 2008, adding some
additional controls to limit and identify risk
Expanded the list of unacceptable loan types
Added required approvals to new loans, renewals and extensions for CRE
loans
Revised the hedging policies, adding cash margin requirements
Exited Indirect Auto Lending and certain agriculture portfolios
Senior Loan Committee approves loans beginning at $7.5 million depending on
risk grade
Credit Committee of the Board of Directors approves loans $25 million to $40
million
Board of Directors approves all loans over $40 million
21
Asset Quality –
Net Charge-Offs
Net Charge-Offs Basis Points
Subsidiary banks are governed by
the same credit policies and a
strong centralized credit
administration staff and loan
review team
2Q08 included a $26 million write-
off related to midstream company
loan exposure
3Q08 included nearly $12 million
in non-recurring commercial loan
recoveries from loans charged off
several years ago
Net losses charges against the
allowance for loan losses in 1Q09
totaled $31.9 million or 1.00%
annualized of average
outstanding loans
0
20
40
60
80
100
120
140
2Q08
3Q08
4Q08
1Q09
Coml
CRE
Res RE
Consumer
22
Asset Quality –
Nonperforming Assets
Nonperforming Assets
Beginning in 2Q08, NPAs include
approx $47 million related to a
midstream company - this
represents 1/3 of the original
exposure
NPAs totaled $414 million or
3.26% of outstanding loans and
repossessed assets
BOKF’s approach is to maximize
collection of loans rather than to
sell problem loans at distressed
priced
Growth in nonaccruing assets
during 1Q09 was concentrated
primarily in the AZ market; BOKF
exited the Tucson market earlier
this year
0.0%
0.5%
1.0%
1.5%
2.0%
2.5%
3.0%
3.5%
1Q08
2Q08
3Q08
4Q08
1Q09
Coml
CRE
Res RE
Consumer
OREO
Renegotiated Loans
23

Non-Accruing Loans
Office CRE
7%
Construction &
Land Dev
29%
Healthcare
4%
Residential RE
10%
Other CRE
7%
All Others
3%
Multifamily CRE
8%
Energy*
15%
Services
9%
Wholesale/ Retail
3%
Manufacturing
5%
0.0%
1.0%
2.0%
3.0%
4.0%
5.0%
OK
TX
NM
AR
CO
AZ^
KS
By Loan Sector
As A Percent of Loans
in the Market
24
* Loan to a midstream company accounts for 94%
of Energy non-accruals
indicates OK non-accruals excluding
the midstream company
indicates CO non-accruals excluding
loans acquired with First United Bank
As of 3/31/09
^ Non-accruals in AZ represent 19% of outstanding loans
in that market
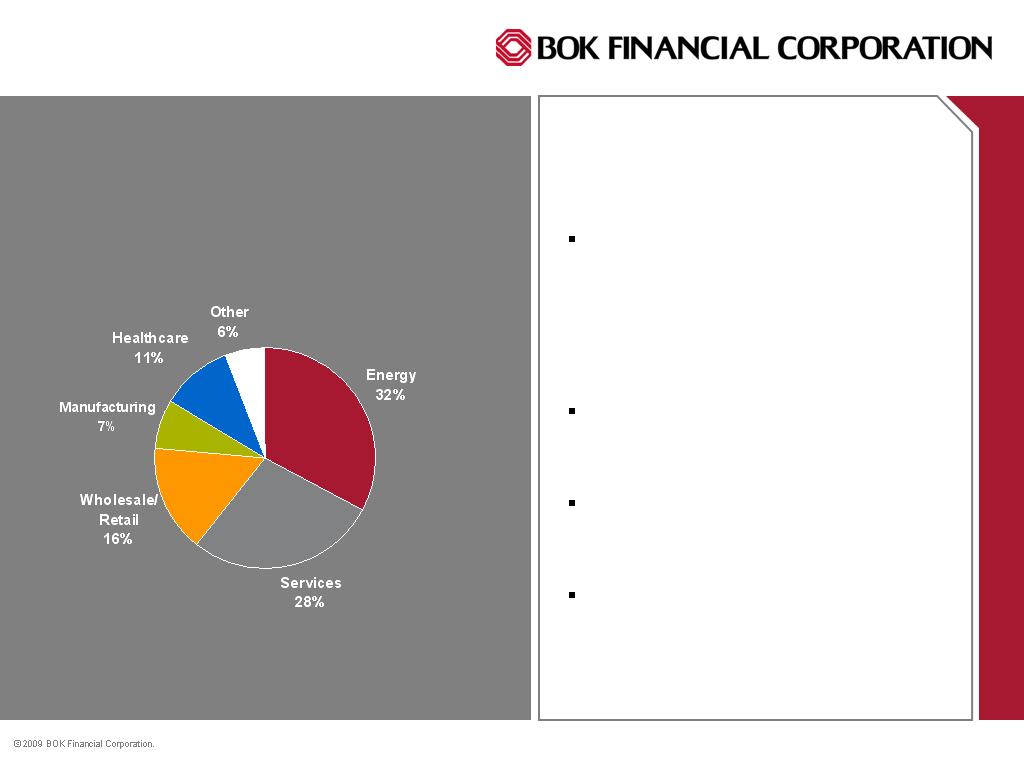
Commercial & Industrial
Loans
The services sector includes a
large number of loans to a
variety of businesses including
communications, gaming and
recreation, transportation and
financial services
Outstanding loans in the
services sector decreased $76
million during 1Q09
Over 60% of the loans in the
services sector have individual
balances less than $10 million
$690 million of the services
sector portfolio is attributed to TX
and $587 million to OK
C&I Portfolio By Industry
25
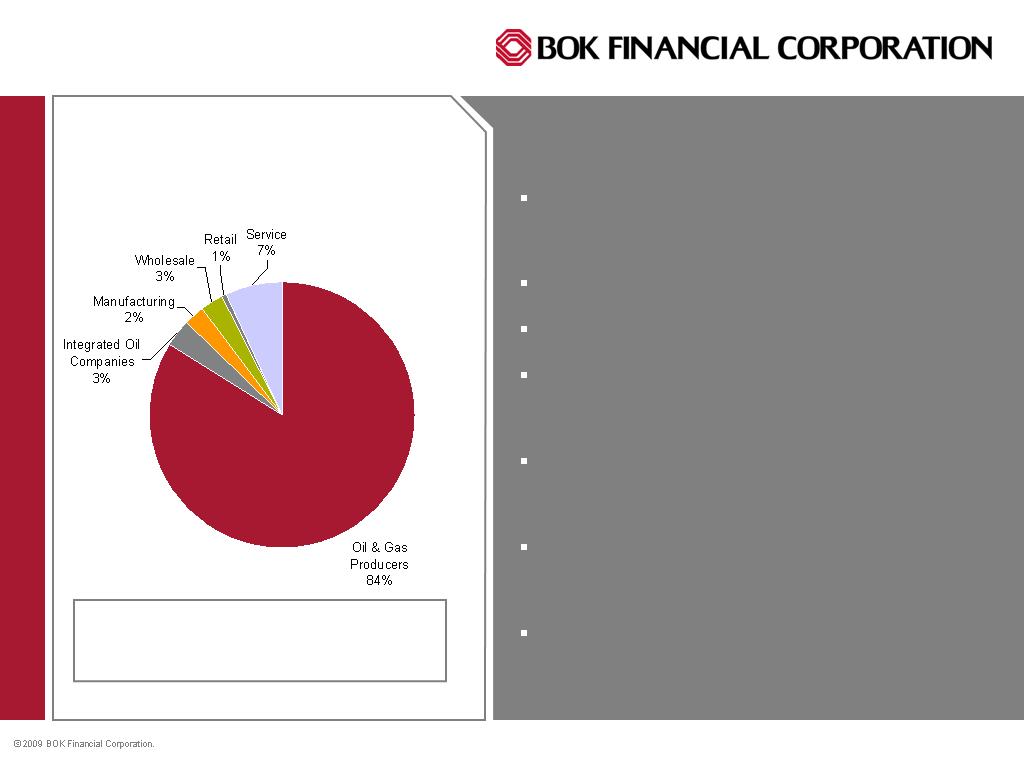
Energy Portfolio
Approximately $1.1 billion of the energy
portfolio is attributed to OK, $761 million
to TX and $426 million to CO
50-60% loan to value
54% gas concentration
Energy production portfolio has been
one of the best performing portfolios for
the last 20+ years
Sensitivity analysis is performed for
each credit – currently using a base of
$40/bbl for oil and $5/mcf for gas
Petroleum engineers on staff perform
engineering reviews of properties
pledged as collateral
Limited exposure to oil field service
companies (drilling contractors, etc.)
26
84% of the $2.3 billion energy
portfolio is collateralized by
production
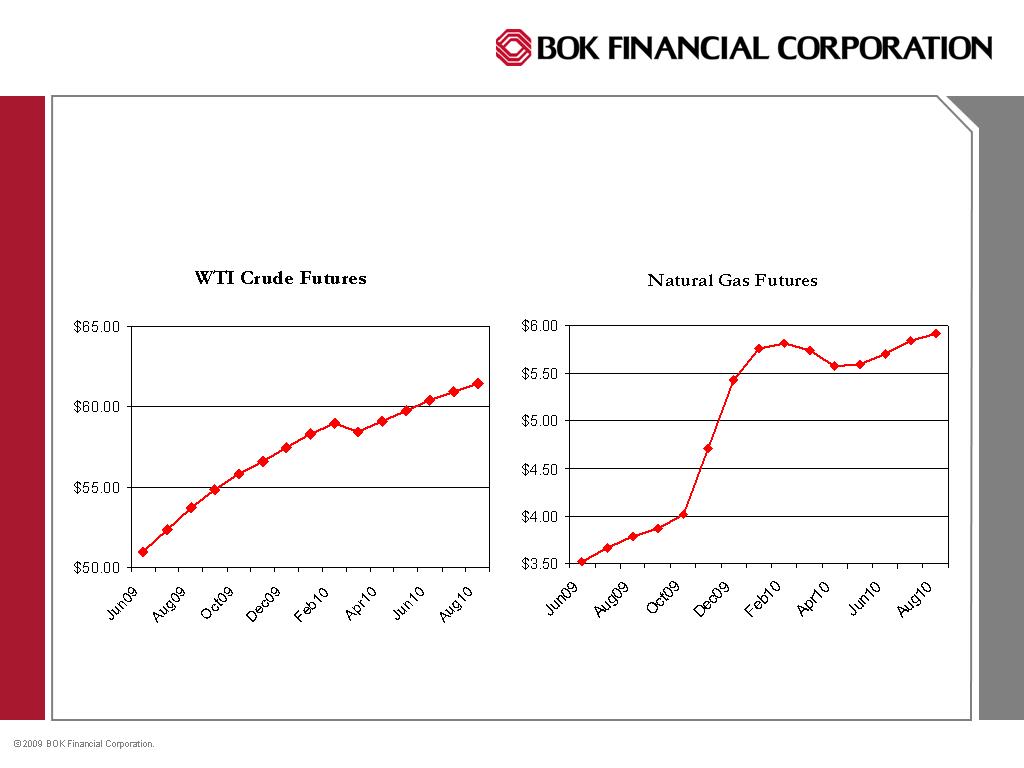
Energy Futures
Source: Bloomberg/pricing date of 4/24/09
27

CRE by Market
Commercial Real Estate
Of the $879 million in
construction and development
loans, approximately $246
million are attributed to the OK
market, $223 million to TX,
$165 million to CO, $131 million
to AZ and $87 million to NM
Initial underwriting of many
construction loans includes
mini-perm options
In stressed markets, appraisals
are updated every 6 months
28
Market $ in 000s % of Total
Oklahoma 881,620 32%
Texas 816,830 30
New Mexico 315,511 12
Arkansas 133,227 5
Colorado 267,035 10
Arizona 285,841 10
Kansas 32,017 1

Shared National Credits
Shared National Credits ($ in millions):
December
2008
March 2009
Nu
mber of Relationships
1
7
6
17
6
Commt ($)
O/S ($)
Commt ($)
O/S ($)
Shared Natio
nal Credit Volume
3,479
2,250
3,
4
49
2,
1
36
Agented by BOKF
825
527
781
488
Percent of Total
23.73
%
23.42
%
22.
66
%
22.8
6
%
Relationships in Local Markets
3,097
1,976
3,0
74
1,8
60
Percent of Total
89.03
%
87.78
%
89.1
4
%
87.
05
%
SNCs are held to the same standard of analysis and level of review as
internally originated credits
At 3/31, there were 5 SNC’s on non-accrual with outstanding balances
totaling $48 million
29

Additional Loan Detail
30
Residential Mortgage Loans, excluding loans held for sale totaled $1.8B
$1.6 billion or 86% of the residential mortgage loan portfolio is attributed to
Oklahoma and Texas where home values have been more stable
BOKF has no concentration in sub-prime residential mortgage loans and BOKF
ARMS do not include below-market rates
Indirect auto loans totaled $650 million
Approximately $404 million were purchased from dealers in OK and $162
million were purchased from dealers in AR with the remaining loans purchased
from dealers in TX
Indirect auto loans decreased $42 million in 1Q09 primarily due to BOKF’s
decision to exit the business in favor or a more customer-focused direct lending
approach
Commercial Banking
Oklahoma, Arkansas, Arizona, New Mexico
Energy and Real Estate Banking
BOKF Footprint
31
Dan Ellinor
Senior Executive Vice President
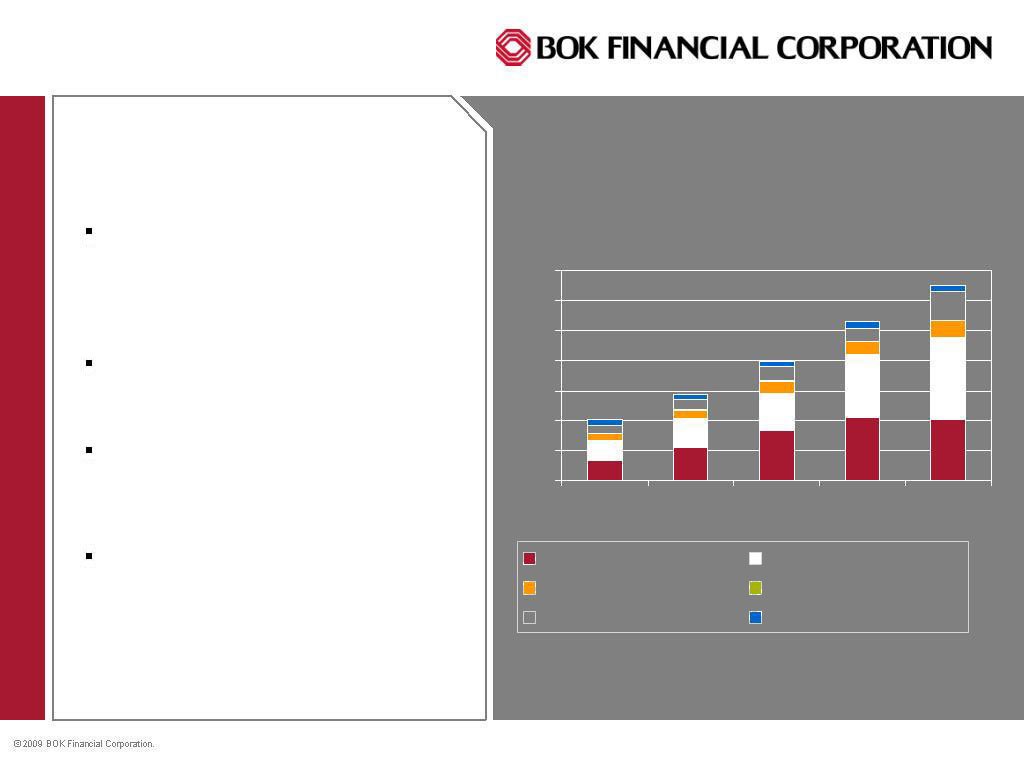
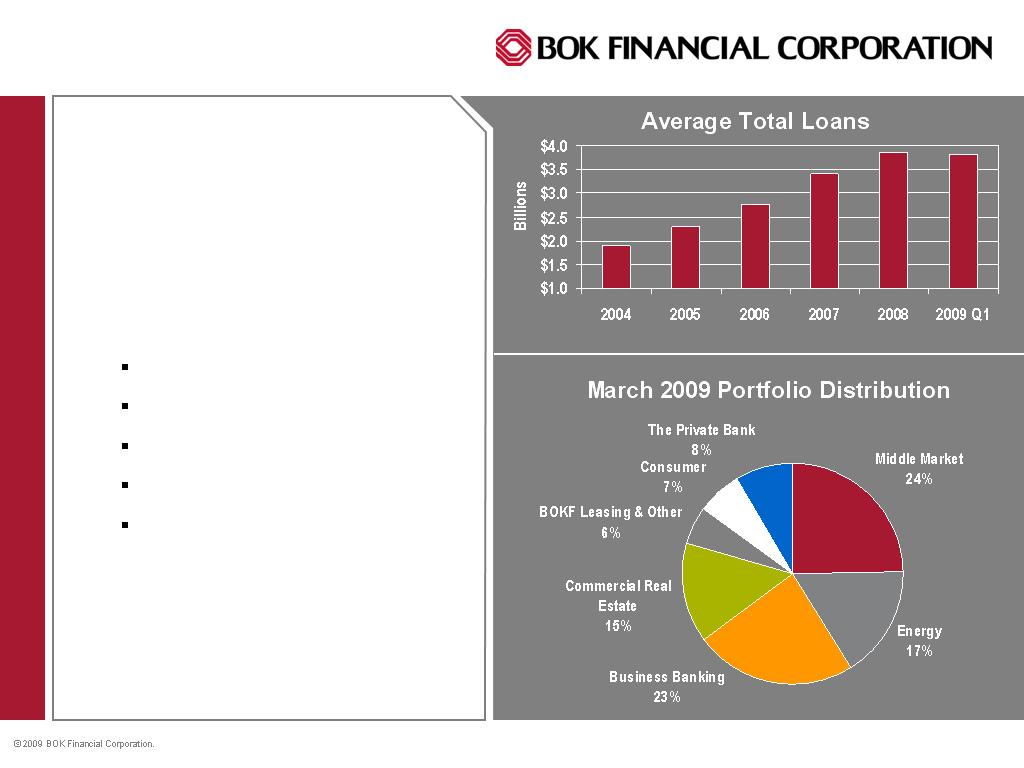
Loan Growth & Distribution
5 Year CAGR 11.36%
3 Year CAGR 11.83%
Largest Segments are
Energy, Real Estate, and
Middle Market
Niche Businesses:
Agribusiness growth slowed
as portfolio mix was cleaned
up, and Dealer Financial
Services originations have
been discontinued
Affiliate Banking Markets in
Arkansas, Arizona, and New
Mexico provide strong
growth rates
Average Total Loans
$4.0
$5.0
$6.0
$7.0
$8.0
2004
2005
2006
2007
2008
2009 Q1
March 2009 Portfolio Distribution
Middle Market,
20.23%
Commercial RE
BOKF, 26.64%
Agribusiness,
2.46%
Arkansas, 3.14%
Business Banking
OK, 6.40%
Energy BOKF,
25.59%
Arizona
Commercial &
BBG, 2.63%
Dealer Financial,
8.41%
New Mexico
Commercial &
BBG, 4.50%
32
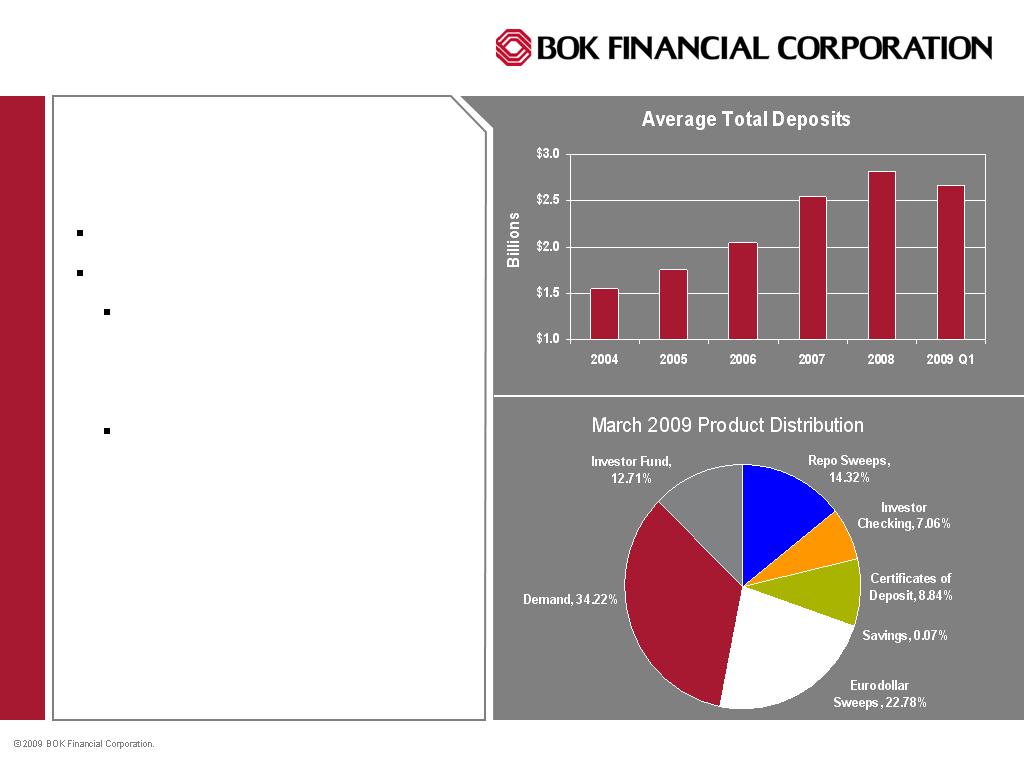
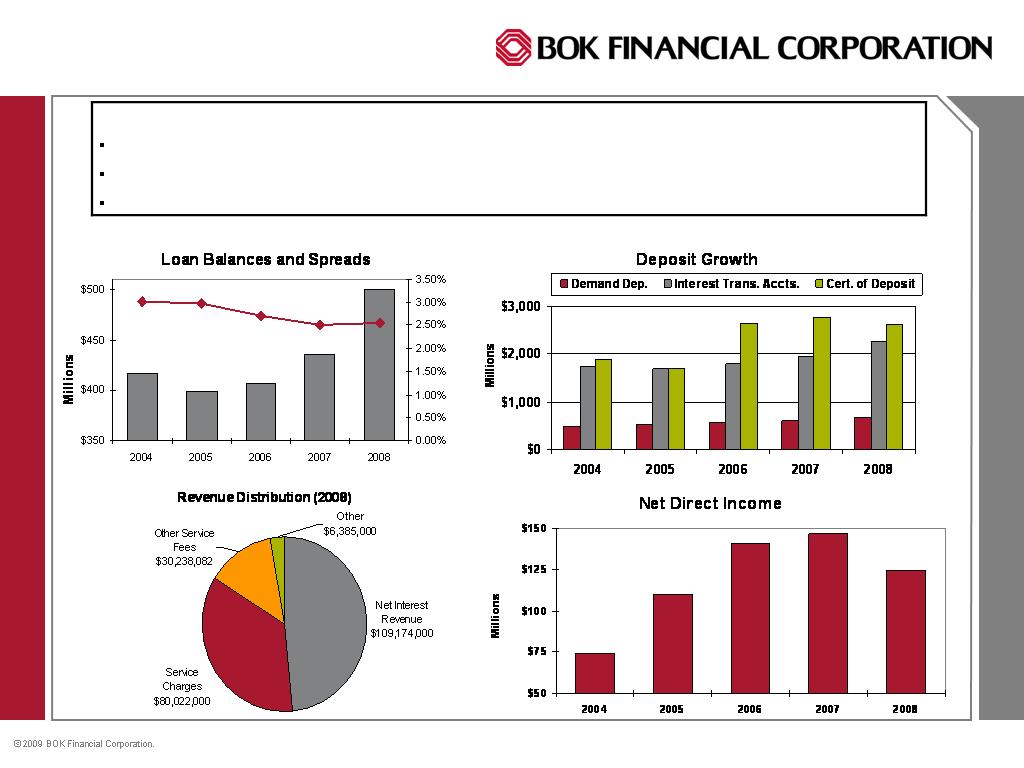
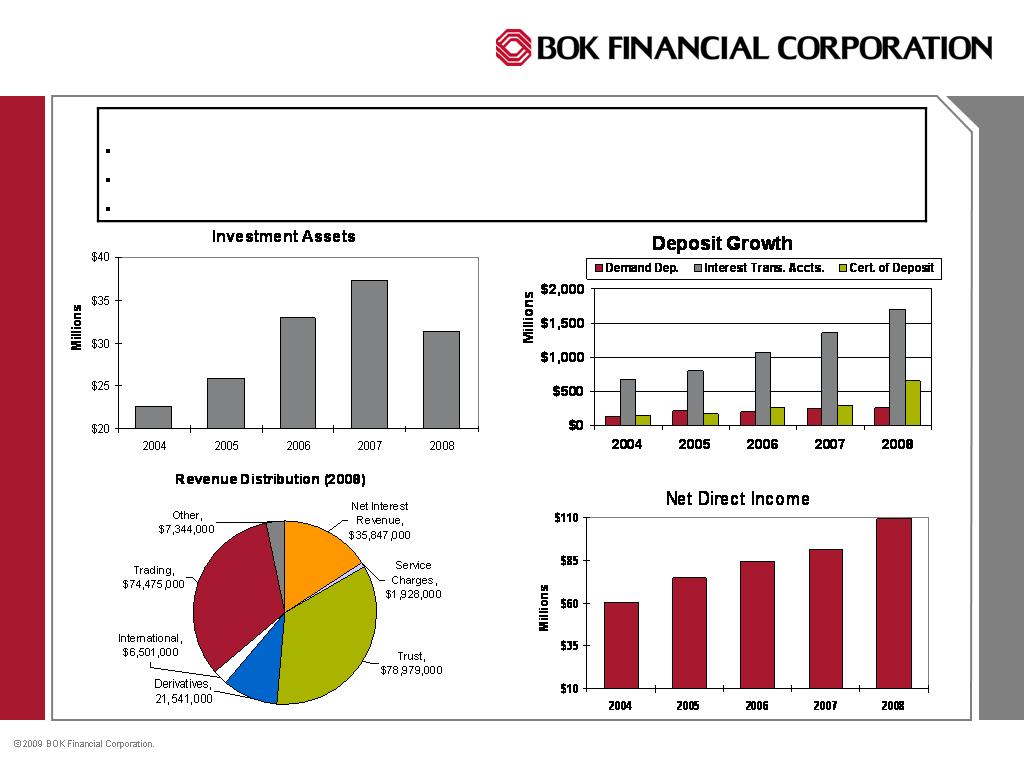
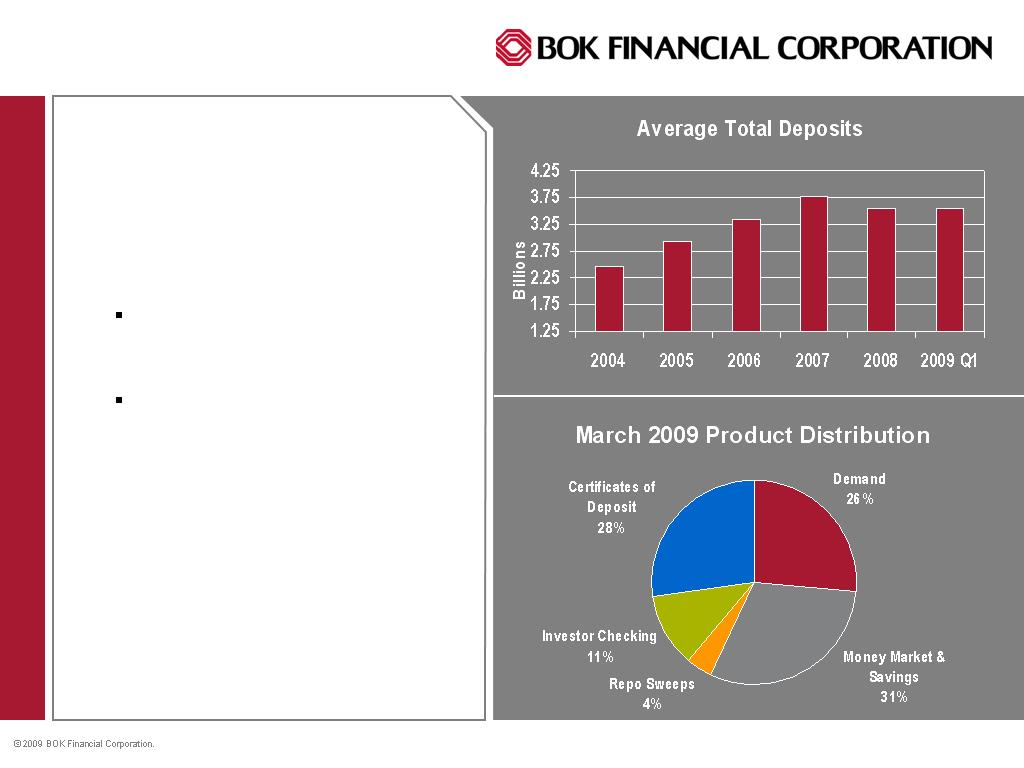
Deposit Growth &
Distribution
5 Year CAGR of 8.44%
3 Year CAGR of 5.70%
The higher growth rate
products continue to be the
higher rate investor fund and
sweep products
Demand Deposits continue to
grow at a nice pace 6.42%
over the last 3 years. New
tiered pricing for analyzed
balances has move dollars
from sweep products back to
deposits.
33
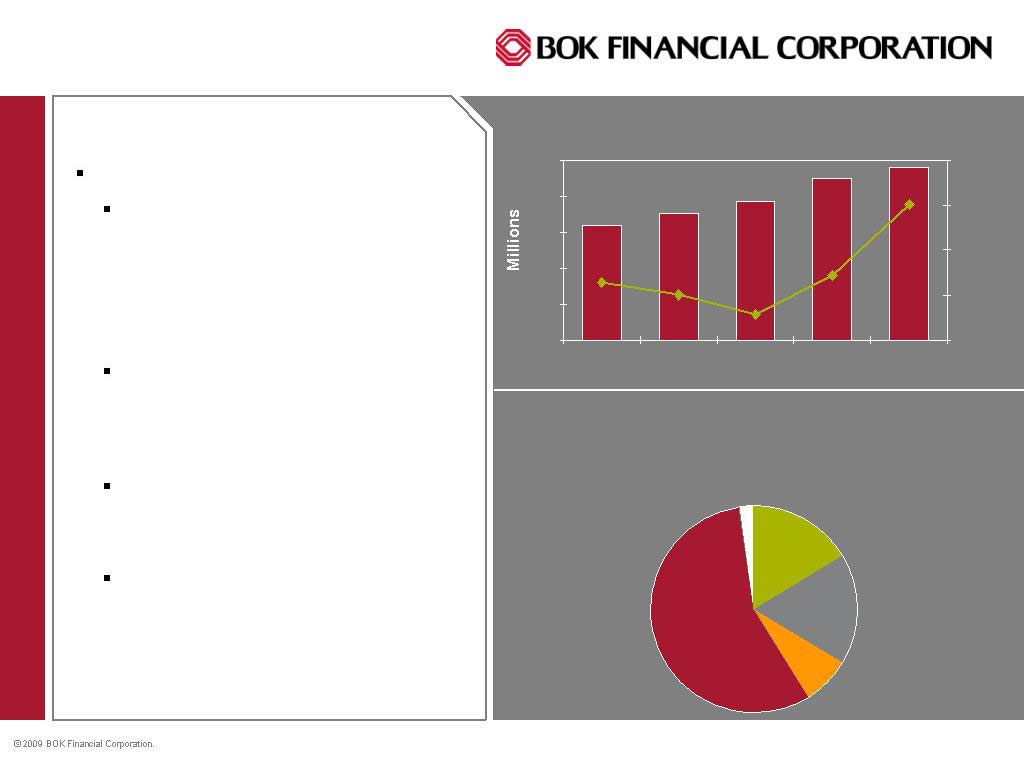
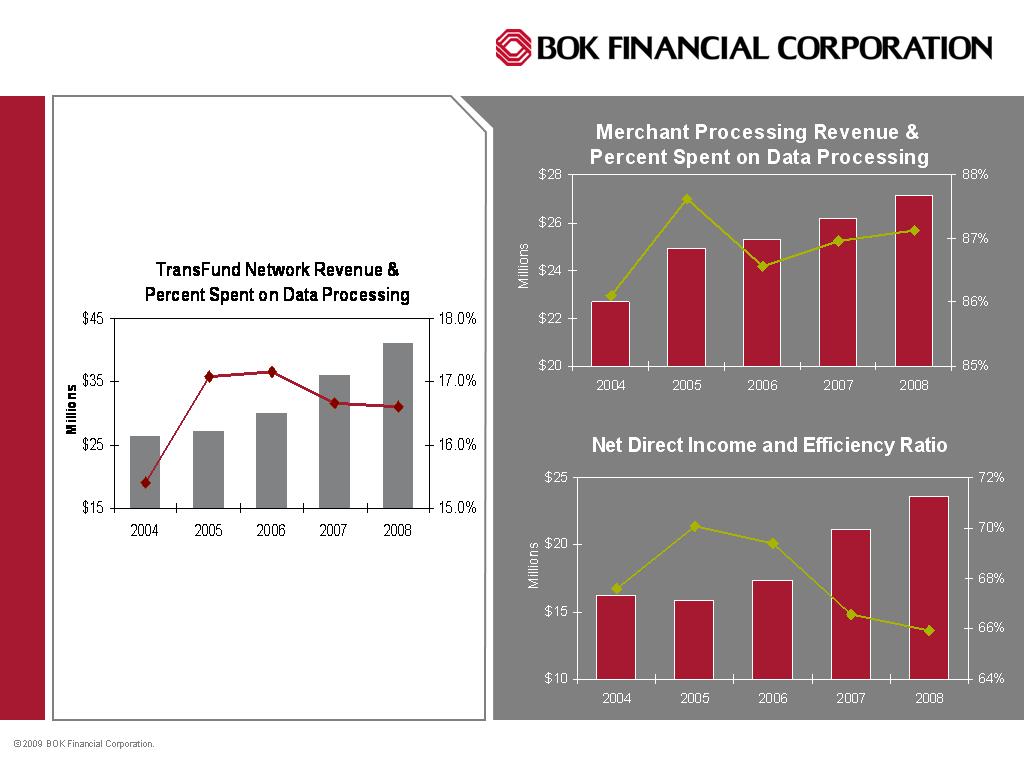
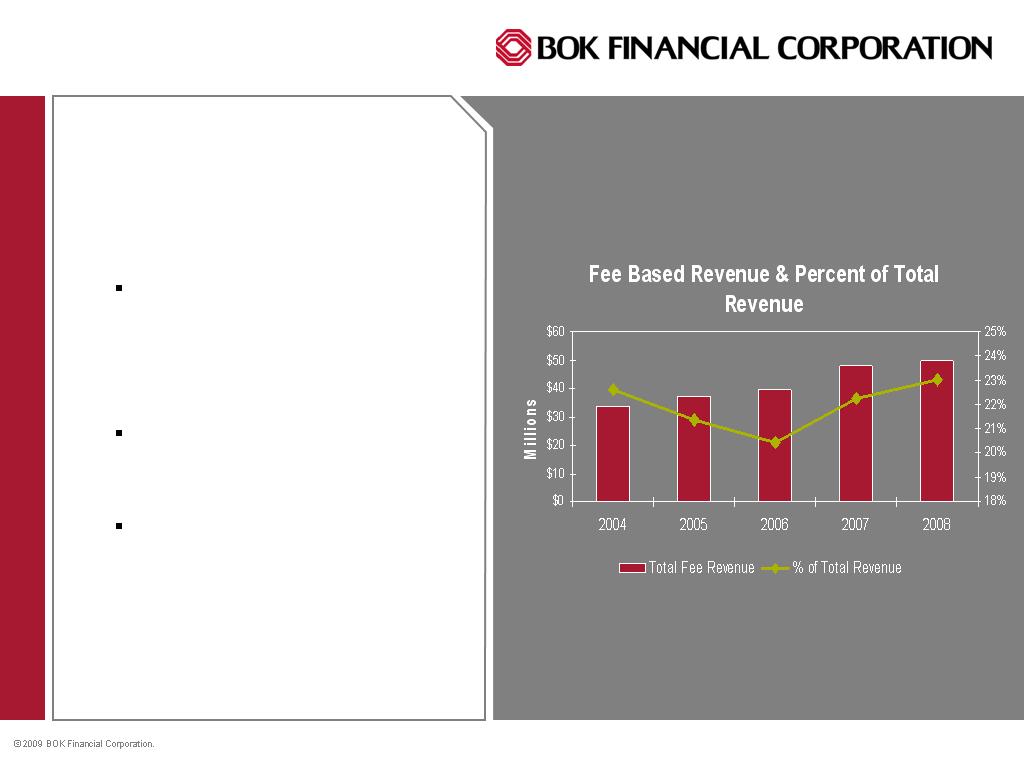
Fee Based Revenue
5 year CAGR of 2.05%
Results were hurt by $45 million
loss with SemGroup in 2008.
Excluding the volatility of trading
revenue, other fee based
revenue items have a 5 yr CAGR
of 8.39%
Transaction card revenue from
the TransFund Network
continues to produce double digit
growth rates
Revenue recognized from
Merchant Banking activities
totaled $1.5 million in 2008
Service charge revenue results
have been enhanced by the
lower rate environment, reducing
ECR credit given analyzed
balances
Service Fee Revenue & Percent of Total Revenue
w/o $43.2MM SemGroup Loss 2008
$0
$25
$50
$75
$100
$125
2004
2005
2006
2007
2008
30%
31%
32%
33%
34%
Fee Based Revenue Distribution 2008
excludes Derivative Credit Quality Losses
International,
7.54%
Other, 2.09%
Transaction
Card, 56.80%
Service
Charges,
17.13%
Derivatives,
16.44%
34
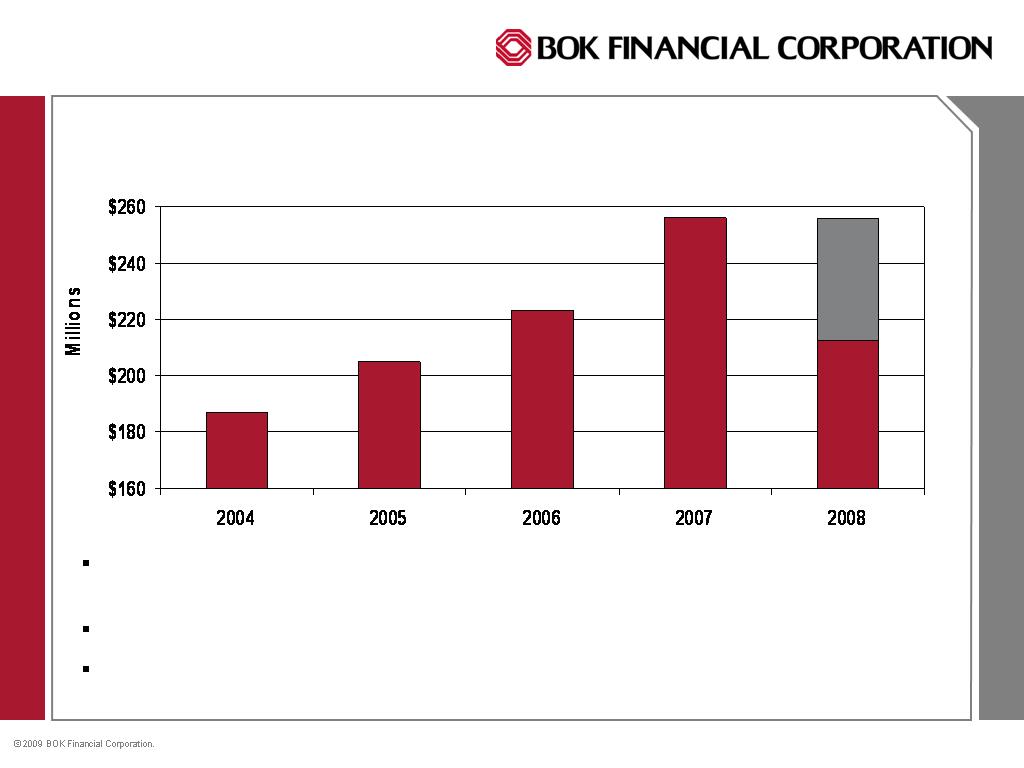
Net Direct Income Results
Adding Back SemGroup Loss
Net direct income from the operation of this business group has produced a CAGR of
4.99% over the last 5 years (8.95% without the impact of the SemGroup loss in 2008)
Fee based revenue contributes around 30% of total revenue
Expenses were held in check, although the SemGroup derivative loss caused the
efficiency ratio to jump to 33.83%
35
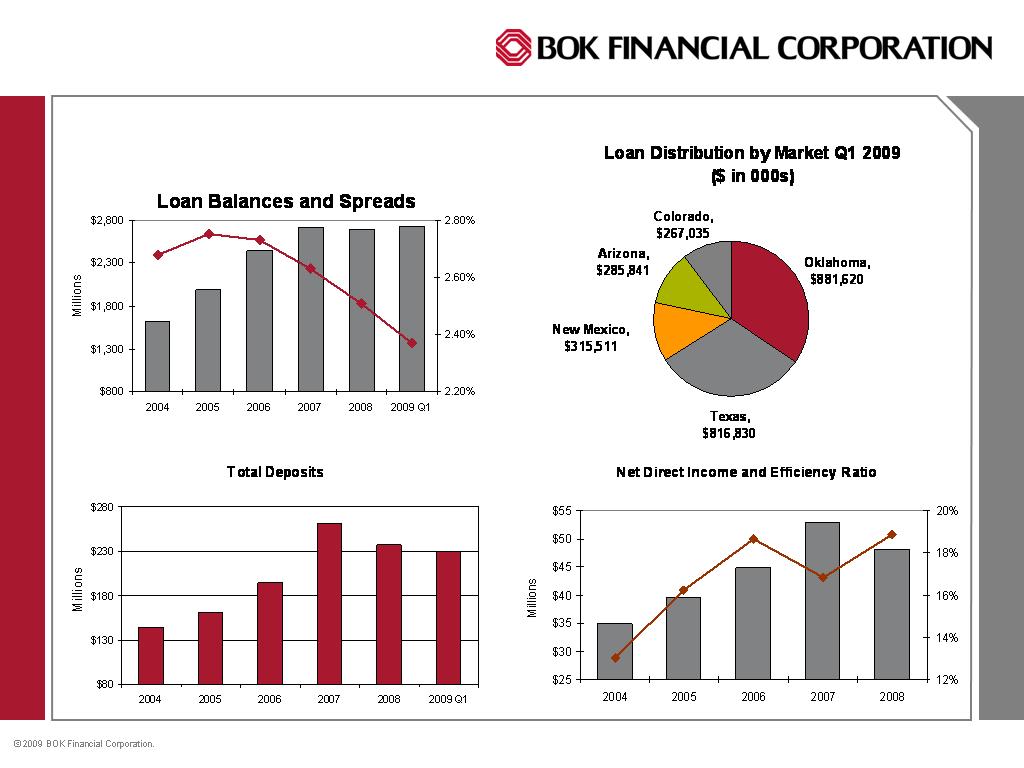
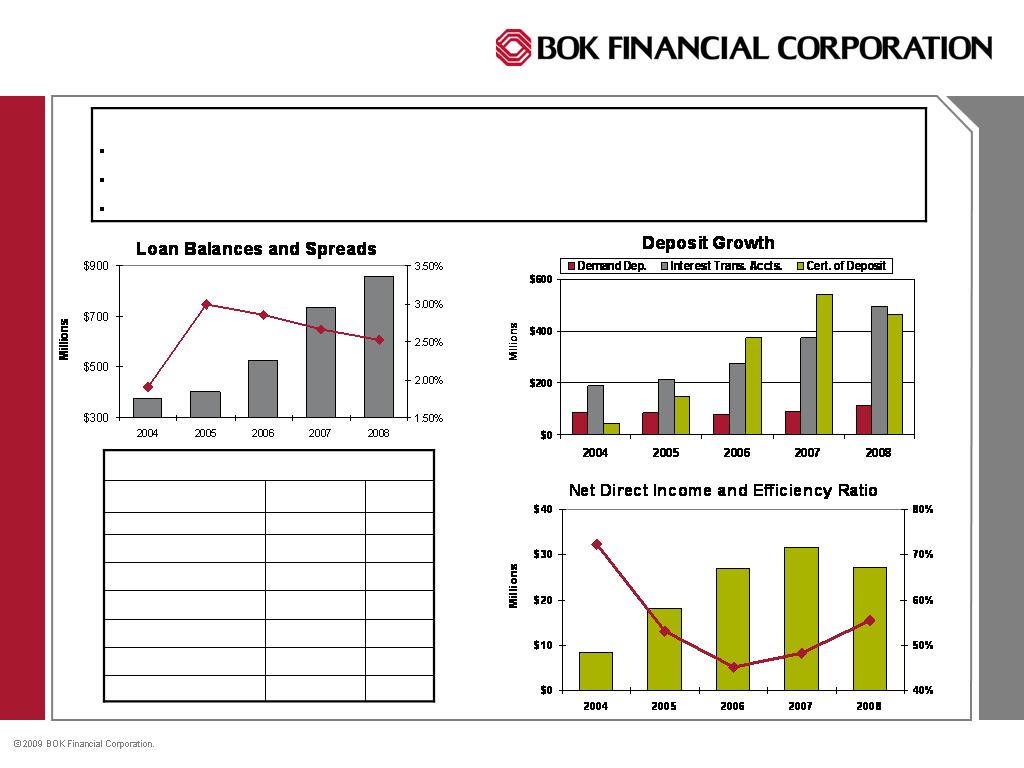
Oklahoma Commercial Banking
Loan Balances and Spreads
$2.5
$3.0
$3.5
$4.0
$4.5
$5.0
2004
2005
2006
2007
2008
2009 Q1
2.00%
2.25%
2.50%
2.75%
Net Direct Income & Efficiency Ratio
w/o $43.2MM SemGroup Loss 2008
$50
$70
$90
$110
$130
$150
$170
$190
2004
2005
2006
2007
2008
14.00%
14.50%
15.00%
15.50%
16.00%
16.50%
17.00%
Deposit Growth
$50
$250
$450
$650
$850
2004
2005
2006
2007
2008
2009 Q1
Demand Dep.
Interest Trans. Accts.
Cert. of Deposit
0.4%
829,079
Other Revenue
0.3%
721,526
Syndication Fees
11.2%
23,146,802
Service Charge Revenue
7.1%
14,625,331
Derivative Revenue w/o SemGroup
100.0%
$207,410,026
Total Revenue
4.0%
8,317,406
International Revenue
77.0%
$159,769,882
Net Interest Revenue
Revenue Distribution (2008)
$ Amt
% of Total
36
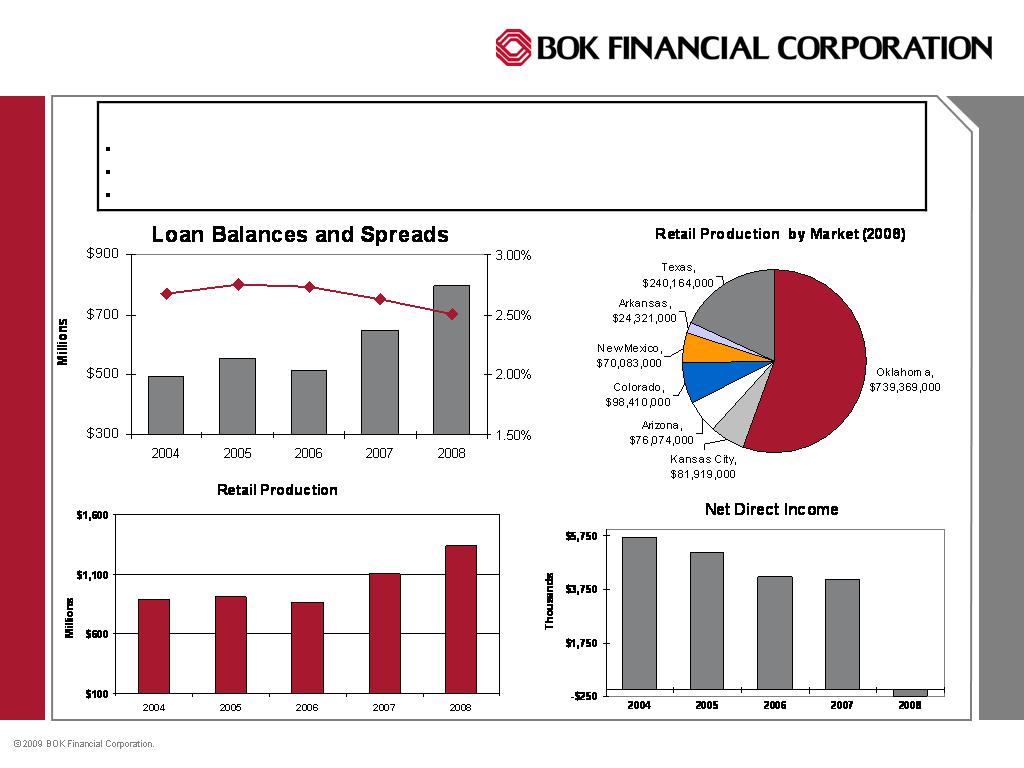
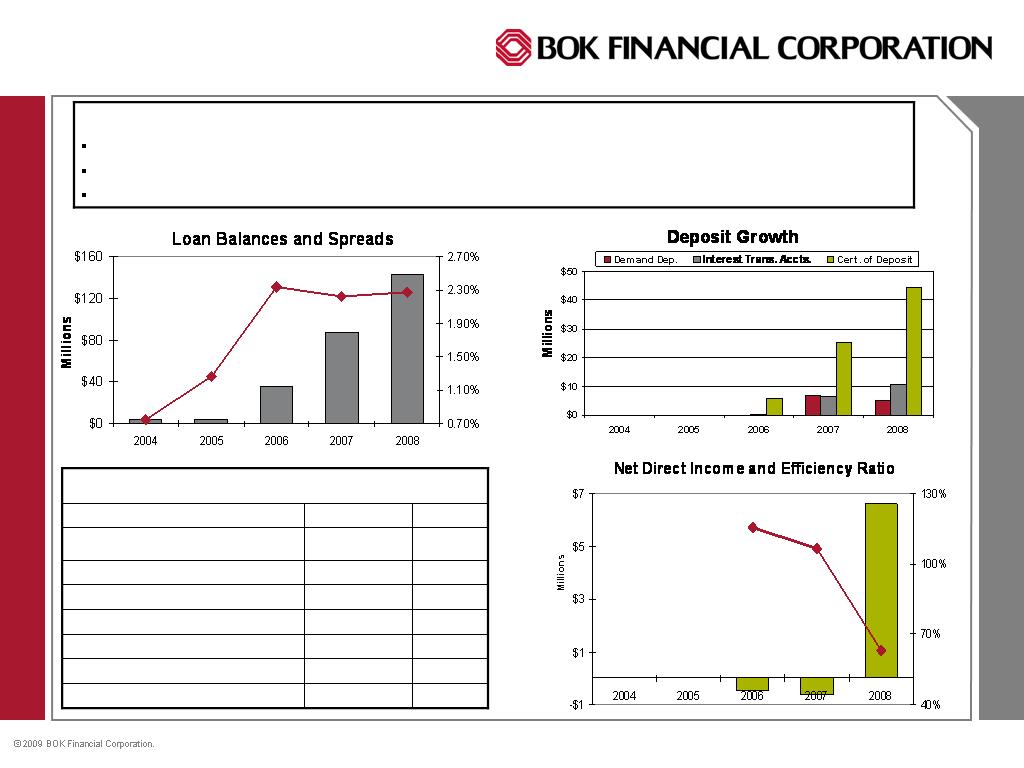
Bank of Arizona
Deposit Growth
$0
$20
$40
$60
$80
2004
2005
2006
2007
2008
2009 Q1
Demand Dep.
Interest Trans. Accts.
Cert. of Deposit
Loan Balances and Spreads
$0
$150
$300
$450
$600
2004
2005
2006
2007
2008
2009 Q1
1.50%
1.75%
2.00%
2.25%
2.50%
2.75%
Net Direct Income and Efficiency Ratio
-$1
$0
$1
$2
$3
$4
$5
$6
2004
2005
2006
2007
2008
0%
30%
60%
90%
0.5%
100,175
International Revenue
1.5%
320,976
Other Revenue
0.8%
162,503
Trading Revenue
3.5%
718,921
Service Charge Revenue
2.1%
441,168
Trust Revenue
100.0%
$20,771,001
Total Revenue
-1.4%
-291,523
Mortgage Revenue
93.0%
$19,318,781
Net Interest Revenue
Revenue Distribution (2008)
$ Amt
% of Total
37
Bank of Albuquerque
Loan Balances and Spreads
$50
$250
$450
$650
$850
2004
2005
2006
2007
2008
2009 Q1
2.35%
2.55%
2.75%
2.95%
Net Direct Income & Efficiency Ratio
$15
$25
$35
$45
$55
2004
2005
2006
2007
2008
32%
34%
36%
38%
40%
42%
Deposit Growth
$50
$150
$250
$350
$450
$550
$650
2004
2005
2006
2007
2008
2009 Q1
Demand Dep.
Interest Trans. Accts.
Cert. of Deposit
0.7%
552,139
International Revenue
5.4%
4,151,851
Other Revenue (check card rev)
2.1%
1,624,406
Trading Revenue
17.0%
13,097,577
Service Charge Revenue
5.4%
4,135,534
Trust Revenue
100.0%
$76,954,722
Total Revenue
0.4%
296,322
Mortgage Revenue
69.0%
$53,096,893
Net Interest Revenue
Revenue Distribution (2008) $ Amt % of Total
38
Bank of Arkansas
Loan Balances and Spreads
$100
$200
$300
$400
$500
2004
2005
2006
2007
2008
2009 Q1
2.00%
2.20%
2.40%
2.60%
2.80%
Net Direct Income and Efficiency Ratio
$0
$3
$6
$9
$12
$15
2004
2005
2006
2007
2008
0%
10%
20%
30%
Deposit Growth
$0
$30
$60
$90
$120
2004
2005
2006
2007
2008
2009 Q1
Demand Dep.
Interest Trans. Accts.
Cert. of Deposit
0.7%
114,090
International Revenue
1.5%
222,280
Other Revenue
0.2%
31,266
Trading Revenue
6.0%
966,368
Service Charge Revenue
5.8%
933,770
Trust Revenue
100.0%
$16,040,442
Total Revenue
0.7%
119,143
Mortgage Revenue
85.1%
$13,653,525
Net Interest Revenue
Revenue Distribution (2008) $ Amt % of Total
39

Energy Lending - BOKF
40
Real Estate Banking - BOKF
41
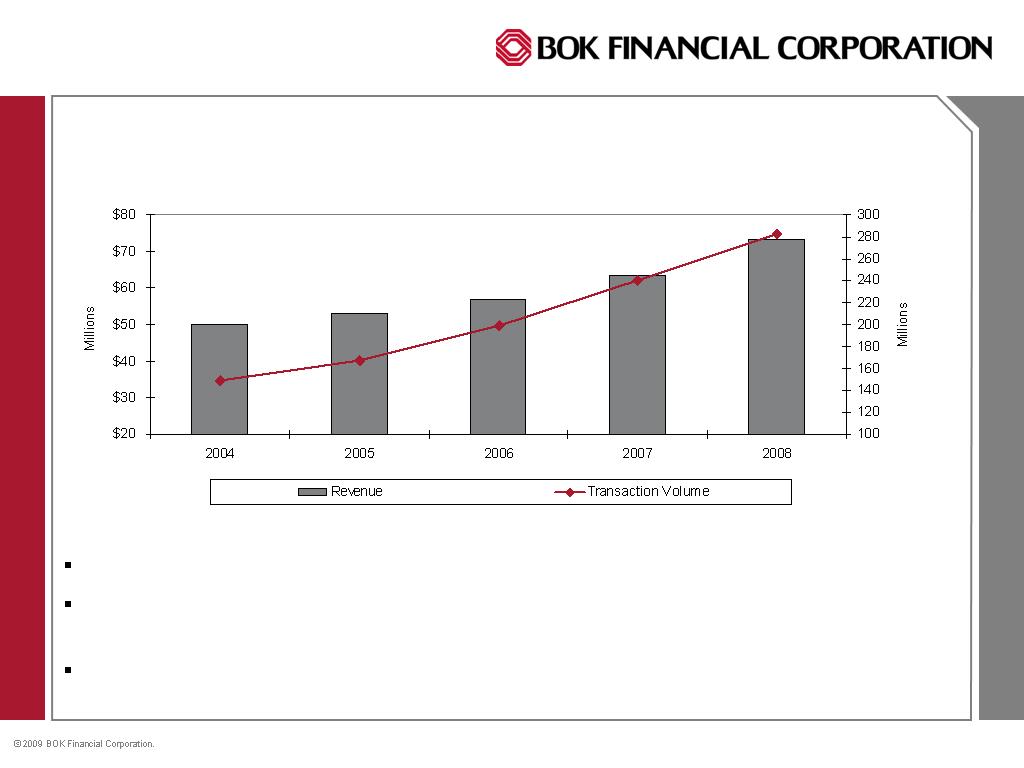
TransFund Revenue and Transaction Volume
TransFund is the 9th largest ATM network in the nation.
Transaction volumes have produced a 17.4% CAGR over the last five years, resulting
in an 10.4% CAGR for revenue recognized.
Customer base consists of 385 financial institutions, 1,933 ATMs, and 2.2 million
cardholders located in a 13 state area.
42

TransFund Expansion to New Markets
In the past year, 97% of all new business sold was outside the state of Oklahoma.
TransFund now has relationships with major convenience store chains in a 6 state
area (QuikTrip, 7-Eleven, Kum & Go, etc.), offering convenient, surcharge-free
access to TransFund cardholders.
43
TransFund
44

Consumer Banking & Corporate
Marketing, Wealth Management, Treasury
Services, International, Mortgage
Banking, Colorado and Kansas City
Steve Bradshaw
Senior Executive Vice President
45
Consumer Banking
2008 Highlights:
Branch Expansion – Organic & Acquisition
ExpressBank Relocation to the Business Technology Center
Deposit Growth During Market Unrest
CAGR 6.3%
46
Consumer Banking
2009 Strategies:
Optimization Projects – SmarterPay & Deposit Pricing
Financial Needs Analysis Profile Certification Program
Deposit Account Acquisition Initiatives – QuickSave & Online
Deposit Application
Enhanced Brand Marketing Initiatives
47
Wealth Management
2008 Highlights:
Added Record Volume of New Assets Under Management
Maximized Fixed Income Trading Opportunities
Completed Comprehensive Rebranding Initiatives
CAGR: 6.8%
48
Wealth Management
2009 Strategies:
Successfully complete Texas Private Bank Expansion Project
Maximize Municipal Finance Financial Advisory and Underwriting
Opportunities
Significantly grow Cavanal Hill Assets Under Management
49
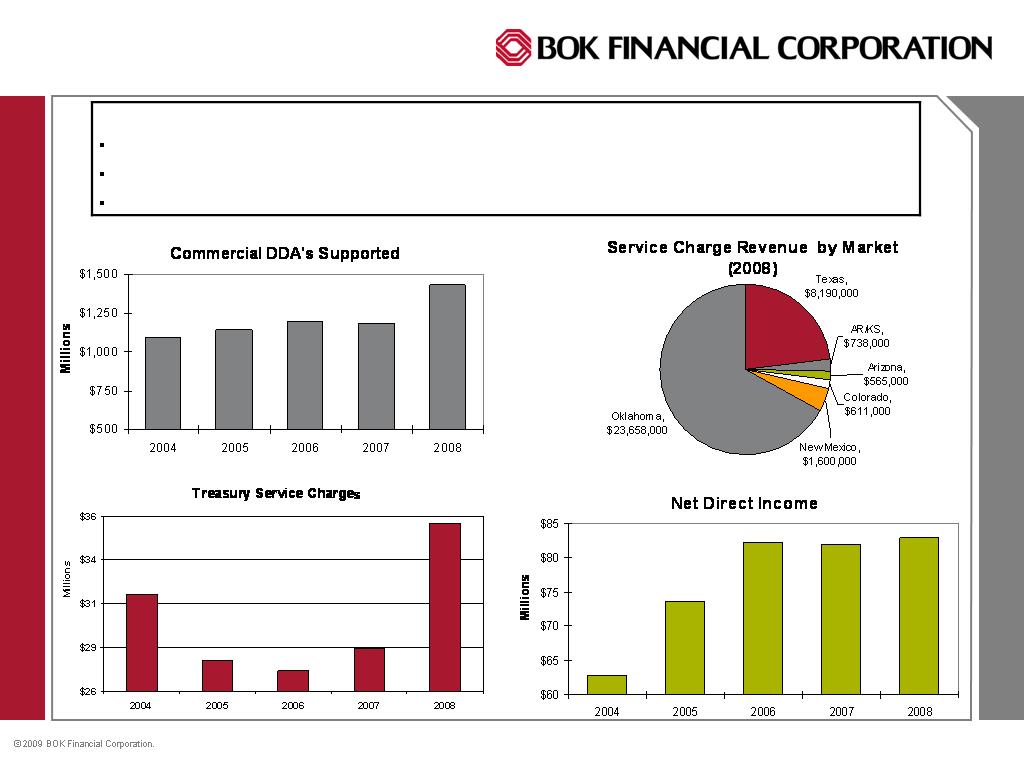
Treasury Services
2008 Highlights:
Received “A” Rating in 2008 Phoenix-Hecht Middle Market Monitor
Launched Treasury Services Healthcare Vertical
Achieved modest (3%) Growth in Low Rate Turbulent Market
50

Treasury Services
2009 Strategies:
Targeted effort to grow Commercial DDA 10% across footprint
Increase top line revenue growth at least 4%
Launch Targeted Commercial Credit Card Sales Effort
Strong regional growth goal alignment
51
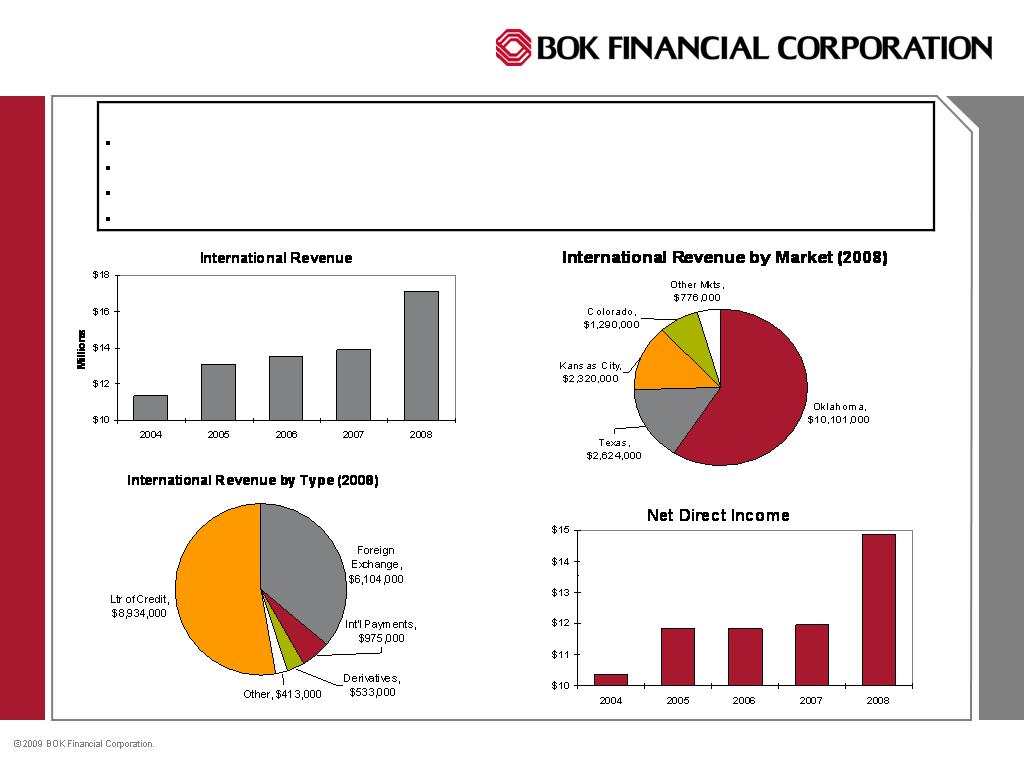
International Services
2008 Highlights:
Focused on supporting the International Services & Trade Finance needs of BOKF Clients
Continued to enhance product and technology platforms
Bolstered Management and Sales Teams
Increased Revenue to $17.1M, 24% growth
52

International Revenues
2009 Strategies:
Strategically expand and enhance Correspondent Bank network
Product & Sales training initiative
Enhance International Branding
53
Mortgage Banking
2008 Highlights:
Continued Sales Force Growth
Continued increase in Mortgage Referrals from Consumer Branches
Mortgage Servicing Delinquencies Remain Well Below National Average
54

Mortgage Banking
2009 Strategies:
Maintain and grow Servicing Portfolio during period of low
interest rates
Continue to build sales force and sales leadership outside of
Oklahoma
Streamline processes end to end to cut costs and create
scalability
55
Colorado Market
2008 Highlights:
Loans Grew 18% and Operating Revenue Grew 5%; Exceeded NDO Plan
Added Key Talent
Achieved Integration of First United Bank Acquisition
2.1%
1,290,266
International Revenue
.8%
459,567
Other Revenue
4.1%
2,483,625
Trading Revenue
3.8%
2,339,357
Service Charge Revenue
16.3%
9,965,779
Trust Revenue
100.0%
61,056,958
Total Revenue
-.4%
-247,323
Mortgage Revenue
73.3%
$44,765,687
Net Interest Revenue
Revenue Distribution (2008) $ Amt % of Total
56

Colorado Market
2009 Strategies:
Intensify focus on growth areas
Enhance credit quality
Develop Market Wide Performance System
57
Kansas City Market
2008 Highlights:
Exceptional Growth in Fee based Lines of Business due in part to Strong Cross Sale/Team Selling Culture
Expansion through Talent Acquisition
Identified and Managed Asset Quality Issues
11.8%
2,118,290
International Revenue
1.3%
232,823
Other Revenue
51.1%
9,208,133
Trading Revenue
3.4%
621,034
Service Charge Revenue
2.4%
429,915
Trust Revenue
100.0%
$18,012,185
Total Revenue
2.6%
465,255
Mortgage Revenue
27.4%
$4,936,735
Net Interest Revenue
Revenue Distribution (2008) $ Amt % of Total
58

Kansas City Market
2009 Strategies:
Targeted Market Expansion
Talent Acquisition and Board Development
Bank of Kansas City Brand Identification
Long Term Strategic Planning Initiative
59

Bank of Texas
60
Norm Bagwell
Chairman & CEO
Bank of Texas
Net Direct Operating Income
5 year CAGR of 14.8%
61
Loan Growth & Distribution
5 Year CAGR 16.7%
Largest Segments are
Middle Market - 25%
Business Banking - 24%
Energy - 17%
Real Estate - 15%
Consumer/Wealth - 14%
62
Deposit Growth &
Product Type
5 Year CAGR 9.3%
Heavy focus on deposit
generation and migration of
book to high margin products
Demand Deposits have
grown at a CAGR of 10.5%
over the last 5 years, from
$610M in 2003 to ~$1 Billion
today.
63
Fee Based Revenue
5 year CAGR of 11.0%
Service Charge Revenues
from Consumer NSF fees
and Treasury have been a
strong driver and account for
42% of the mix
Trust Fees & Commissions
have a five-year CAGR of
8.3%
Trading & Brokerage has a
five-year CAGR of 53%
64

Components of Fee Based Revenue
5 year CAGR of 11.0%
65

Qualitative Outcomes for Texas 2008
Common Business Model
Evolution of Eight Banking Charters into One
Commercial, Consumer, and Wealth Segments
Dallas, Ft. Worth, and Houston Markets
Launched Wealth Management Initiative
Rapid build enabled by market conditions
Significant investment and opportunity
Building a Disciplined, Consistent, and Holistic Sales Effort
Identified Target Markets (industry, sales size, specialization)
Delivery of the entire BOKF platform
Teamwork Across All Markets, Products, and LOB’s
Diversification of Revenue
66

Areas of Focus in Texas 2009
Portfolio Management
Diversification of revenue with focus on fee generating businesses
Build of core deposits
Improved margin on loans and deposits
Expense discipline balancing investment with expense leverage
Talent acquisition across all lines
67