Exhibit 99.2

Exhibit 99.2
The BOK Financial Corporation Story
Forward-Looking Statement
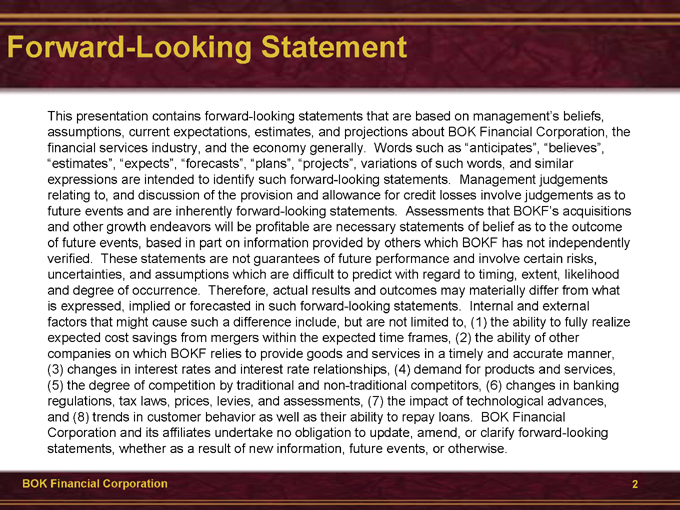
This presentation contains forward-looking statements that are based on management’s beliefs, assumptions, current expectations, estimates, and projections about BOK Financial Corporation, the financial services industry, and the economy generally. Words such as “anticipates”, “believes”, “estimates”, “expects”, “forecasts”, “plans”, “projects”, variations of such words, and similar expressions are intended to identify such forward-looking statements. Management judgements relating to, and discussion of the provision and allowance for credit losses involve judgements as to future events and are inherently forward-looking statements. Assessments that BOKF’s acquisitions and other growth endeavors will be profitable are necessary statements of belief as to the outcome of future events, based in part on information provided by others which BOKF has not independently verified. These statements are not guarantees of future performance and involve certain risks, uncertainties, and assumptions which are difficult to predict with regard to timing, extent, likelihood and degree of occurrence. Therefore, actual results and outcomes may materially differ from what is expressed, implied or forecasted in such forward-looking statements. Internal and external factors that might cause such a difference include, but are not limited to, (1) the ability to fully realize expected cost savings from mergers within the expected time frames, (2) the ability of other companies on which BOKF relies to provide goods and services in a timely and accurate manner, (3) changes in interest rates and interest rate relationships, (4) demand for products and services, (5) the degree of competition by traditional and non-traditional competitors, (6) changes in banking regulations, tax laws, prices, levies, and assessments, (7) the impact of technological advances, and (8) trends in customer behavior as well as their ability to repay loans. BOK Financial
Corporation and its affiliates undertake no obligation to update, amend, or clarify forward-looking statements, whether as a result of new information, future events, or otherwise.
BOK Financial Corporation
2

Agenda
11:00 – 12:00 Annual Meeting
12:00 – 1:30 Lunch – Jim Huntzinger (ALCO) 1:30 - 2:00 Chuck Cotter (Credit Quality) 2:00 – 2:30 Jeff Pickryl (Regional Banks) 2:30 – 3:15 George Kaiser and Stan Lybarger 3:15 – 3:30 Break
3:30 – 4:00 Dan Ellinor (OK Com’l and Com’l Fee Businesses) 4:00 – 4:30 Steve Bradshaw (Consumer and Wealth Management) 4:30 – 5:00 General Q&A
6:30 Dinner at Flavor’s
BOK Financial Corporation
3
Investment Portfolio Management
Jim Huntzinger Senior Vice President Chief Investment Officer
Investment Portfolio Strategy
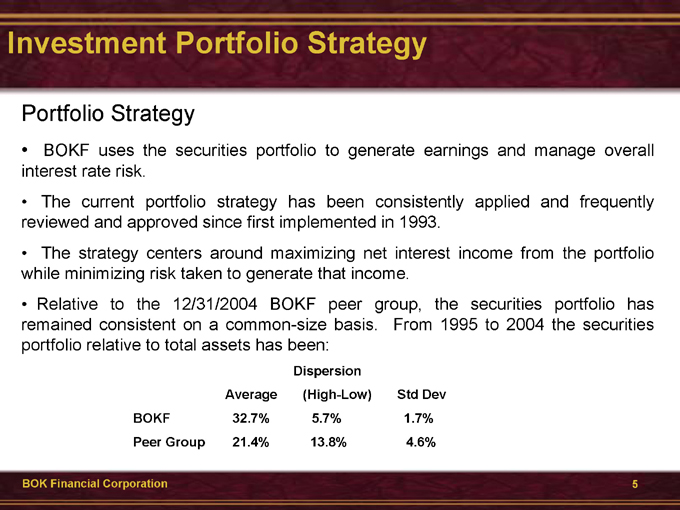
Portfolio Strategy
BOKF uses the securities portfolio to generate earnings and manage overall interest rate risk.
The current portfolio strategy has been consistently applied and frequently reviewed and approved since first implemented in 1993.
The strategy centers around maximizing net interest income from the portfolio while minimizing risk taken to generate that income.
Relative to the 12/31/2004 BOKF peer group, the securities portfolio has remained consistent on a common-size basis. From 1995 to 2004 the securities portfolio relative to total assets has been:
Dispersion
Average (High-Low) Std Dev BOKF 32.7% 5.7% 1.7% Peer Group 21.4% 13.8% 4.6%
BOK Financial Corporation
5
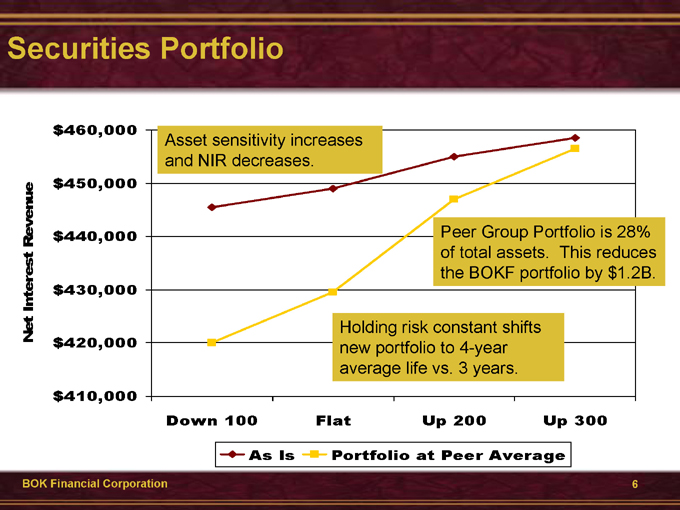
Securities Portfolio $460,000 $450,000 $440,000 $430,000 $420,000 $410,000
Asset sensitivity increases and NIR decreases.
Peer Group Portfolio is 28% of total assets. This reduces the BOKF portfolio by $1.2B.
Holding risk constant shifts new portfolio to 4-year average life vs. 3 years.
Down 100 Flat Up 200 Up 300
As Is
Portfolio at Peer Average
BOK Financial Corporation
Net Interest Revenue
6
Credit Quality
Chuck Cotter Executive Vice President Chief Credit Officer
Credit Quality
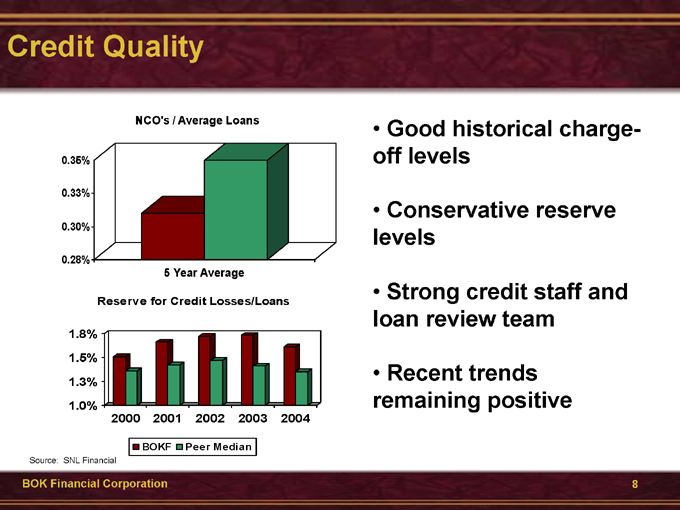
NCO’s / Average Loans
0.35% 0.33% 0.30%
0.28%
5 Year Average
Reserve for Credit Losses/Loans
1.8% 1.5% 1.3% 1.0%
2000 2001 2002 2003 2004
BOKF Peer Median
Source: SNL Financial
Good historical charge-off levels
Conservative reserve levels
Strong credit staff and loan review team
Recent trends remaining positive
BOK Financial Corporation
8
Regional Banks
Jeff Pickryl
Senior Executive Vice President
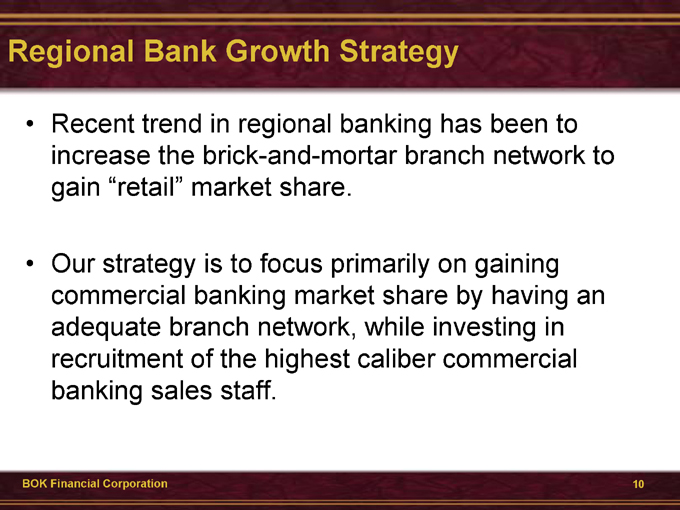
Regional Bank Growth Strategy
Recent trend in regional banking has been to increase the brick-and-mortar branch network to gain “retail” market share.
Our strategy is to focus primarily on gaining commercial banking market share by having an adequate branch network, while investing in recruitment of the highest caliber commercial banking sales staff.
BOK Financial Corporation
10
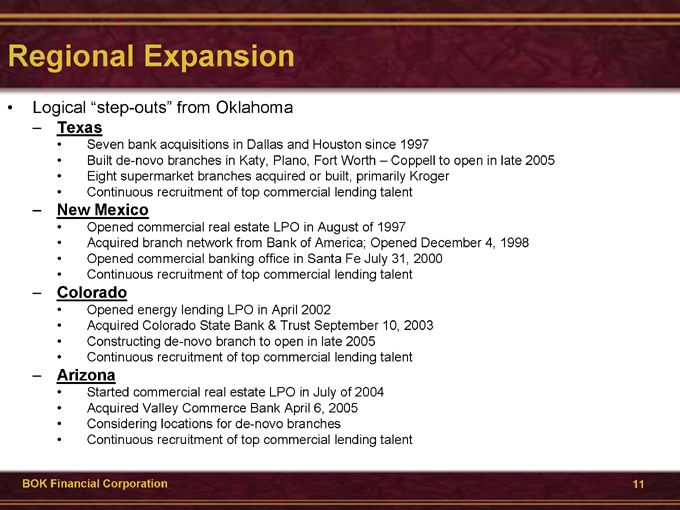
Regional Expansion
Logical “step-outs” from Oklahoma
Texas
Seven bank acquisitions in Dallas and Houston since 1997
Built de-novo branches in Katy, Plano, Fort Worth – Coppell to open in late 2005 Eight supermarket branches acquired or built, primarily Kroger Continuous recruitment of top commercial lending talent
New Mexico
Opened commercial real estate LPO in August of 1997
Acquired branch network from Bank of America; Opened December 4, 1998 Opened commercial banking office in Santa Fe July 31, 2000 Continuous recruitment of top commercial lending talent
Colorado
Opened energy lending LPO in April 2002
Acquired Colorado State Bank & Trust September 10, 2003 Constructing de-novo branch to open in late 2005 Continuous recruitment of top commercial lending talent
Arizona
Started commercial real estate LPO in July of 2004 Acquired Valley Commerce Bank April 6, 2005 Considering locations for de-novo branches Continuous recruitment of top commercial lending talent
BOK Financial Corporation
11
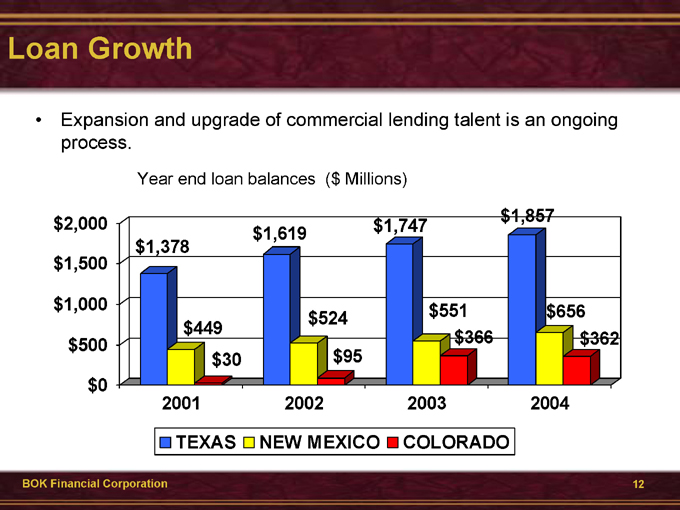
Loan Growth
Expansion and upgrade of commercial lending talent is an ongoing process.
Year end loan balances ($Millions) $2,000 $1,500 $1,000 $500 $0
2001 2002 2003 2004
TEXAS NEW MEXICO COLORADO
$1,857 $1,619 $1,747 $1,378
$524 $551 $656 $449 $366 $362
$30 $95
BOK Financial Corporation
12
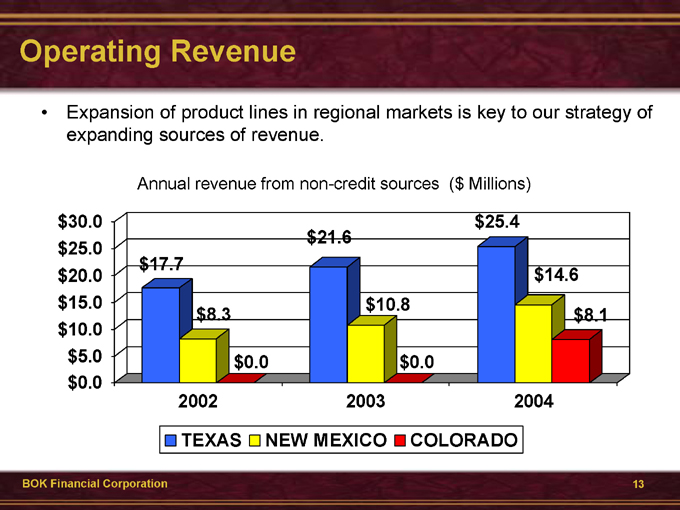
Operating Revenue
Expansion of product lines in regional markets is key to our strategy of expanding sources of revenue.
Annual revenue from non-credit sources ($Millions) $30.0 $25.0 $20.0 $15.0 $10.0 $5.0 $0.0 $25.4 $21.6 $17.7 $14.6 $10.8 $8.3 $8.1
$0.0 $0.0
2002 2003 2004
TEXAS NEW MEXICO COLORADO
BOK Financial Corporation
13
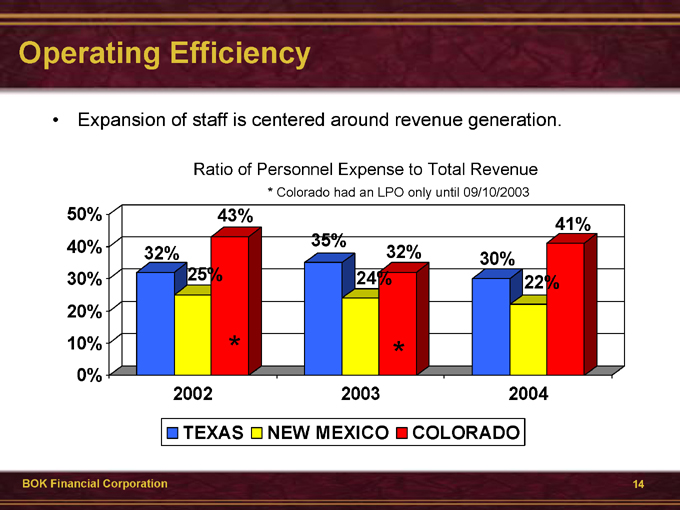
Operating Efficiency
Expansion of staff is centered around revenue generation.
Ratio of Personnel Expense to Total Revenue
* Colorado had an LPO only until 09/10/2003
50% 40% 30% 20% 10% 0%
43%
41% 35% 32% 32% 30% 25% 24% 22%
* *
2002 2003 2004
TEXAS NEW MEXICO COLORADO
BOK Financial Corporation
14
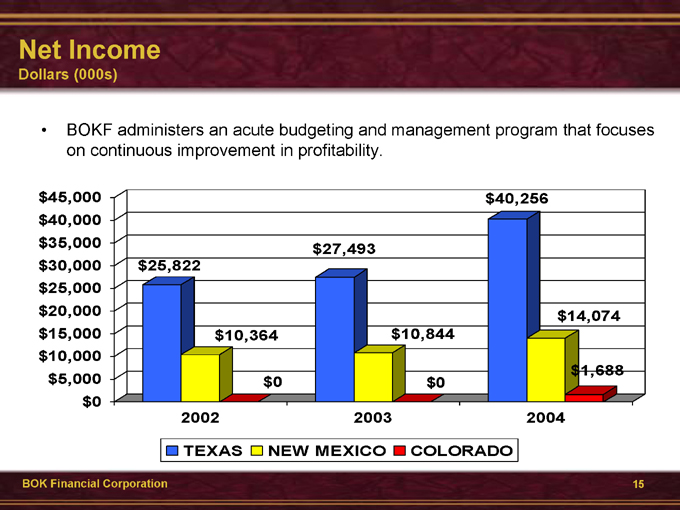
Net Income
Dollars (000s)
BOKF administers an acute budgeting and management program that focuses on continuous improvement in profitability.
$45,000 $40,000 $35,000 $30,000 $25,000 $20,000 $15,000 $10,000 $5,000 $0 $40,256
$27,493 $25,822
$14,074 $10,364 $10,844
$1,688
$0 $0
2002 2003 2004
TEXAS NEW MEXICO COLORADO
BOK Financial Corporation
15
General Discussion
George Kaiser Chairman BOK Financial Corporation
Stan Lybarger President and CEO
BOK Financial Corporation

Oklahoma Commercial and Fee Businesses
Dan Ellinor
Senior Executive Vice President
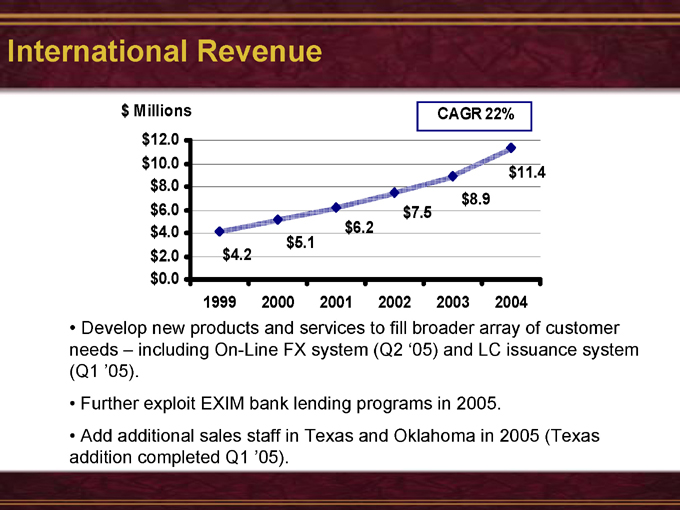
International Revenue $Millions CAGR 22% $12.0 $10.0 $11.4 $8.0 $8.9 $6.0 $7.5 $4.0 $6.2 $5.1 $2.0 $4.2 $0.0 1999 2000 2001 2002 2003 2004
Develop new products and services to fill broader array of customer needs – including On-Line FX system (Q2 ‘05) and LC issuance system (Q1 ‘05).
Further exploit EXIM bank lending programs in 2005.
Add additional sales staff in Texas and Oklahoma in 2005 (Texas addition completed Q1 ‘05).
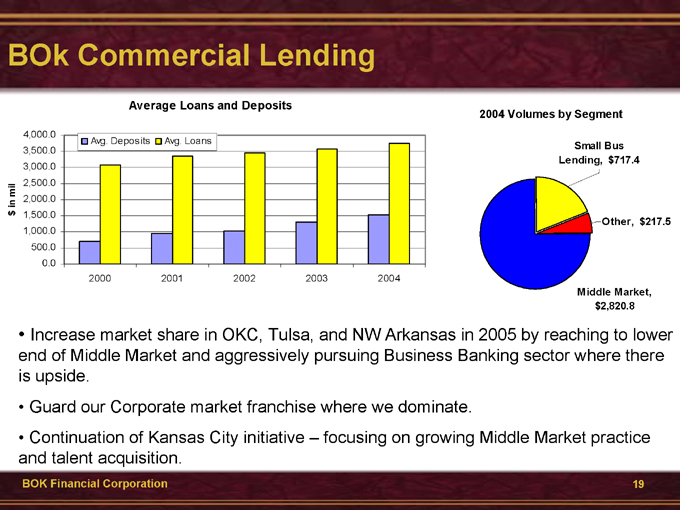
BOk Commercial Lending
Average Loans and Deposits
$ in mil
4,000.0
Avg. Deposits Avg. Loans 3,500.0 3,000.0 2,500.0 2,000.0 1,500.0 1,000.0 500.0 0.0
2000 2001 2002 2003 2004
2004 Volumes by Segment
Small Bus Lending, $717.4
Other, $217.5
Middle Market, $2,820.8
Increase market share in OKC, Tulsa, and NW Arkansas in 2005 by reaching to lower end of Middle Market and aggressively pursuing Business Banking sector where there is upside.
Guard our Corporate market franchise where we dominate.
Continuation of Kansas City initiative – focusing on growing Middle Market practice and talent acquisition.
BOK Financial Corporation
19
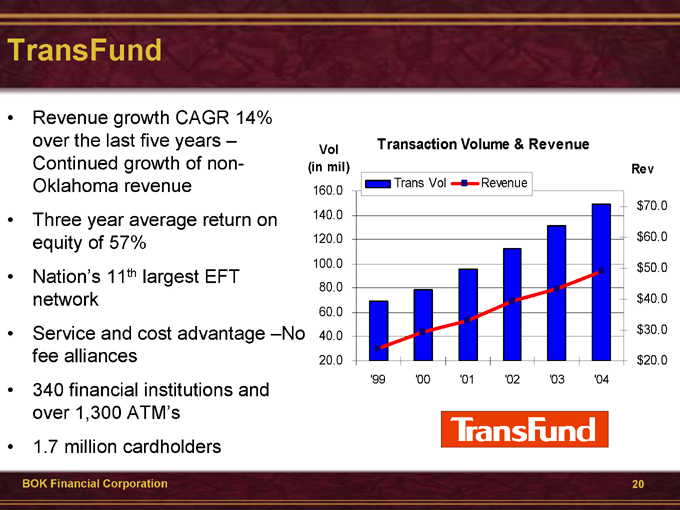
TransFund
Vol Transaction Volume & Revenue
(in mil) Rev
Trans Vol Revenue 160.0 $70.0 140.0 120.0 $60.0 100.0 $50.0 80.0 $40.0 60.0 $30.0 40.0 20.0 $20.0
‘99 ‘00 ‘01 ‘02 ‘03 ‘04
Revenue growth CAGR 14% over the last five years – Continued growth of non-Oklahoma revenue Three year average return on equity of 57% Nation’s 11th largest EFT network Service and cost advantage –No fee alliances 340 financial institutions and over 1,300 ATM’s 1.7 million cardholders
BOK Financial Corporation
20
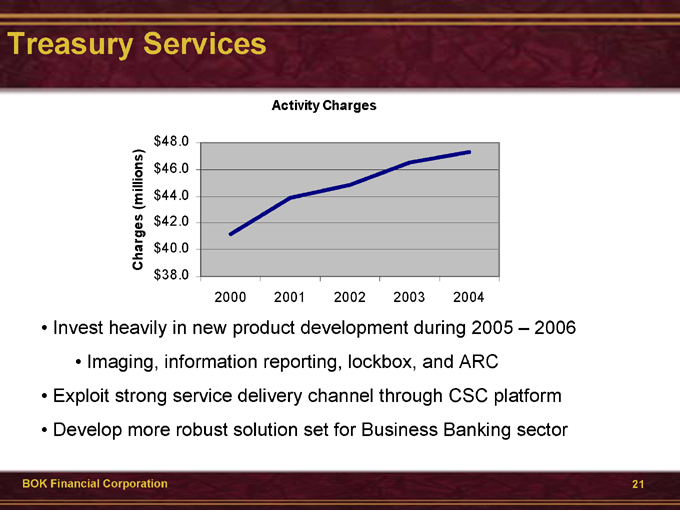
Treasury Services
Charges (millions)
Activity Charges $48.0 $46.0 $44.0 $42.0 $40.0 $38.0
2000 2001 2002 2003 2004
Invest heavily in new product development during 2005— 2006
Imaging, information reporting, lockbox, and ARC
Exploit strong service delivery channel through CSC platform Develop more robust solution set for Business Banking sector
BOK Financial Corporation
21

Consumer Banking and Wealth Management
Steve Bradshaw Senior Executive Vice President
Consumer Banking
140 branches, 92 traditional and 48 in-store in 6 states Primary focus:
Fee income lift Core deposit growth
Perfect Banking sales & service mission Strategic branch expansion
BOK Financial Corporation
23
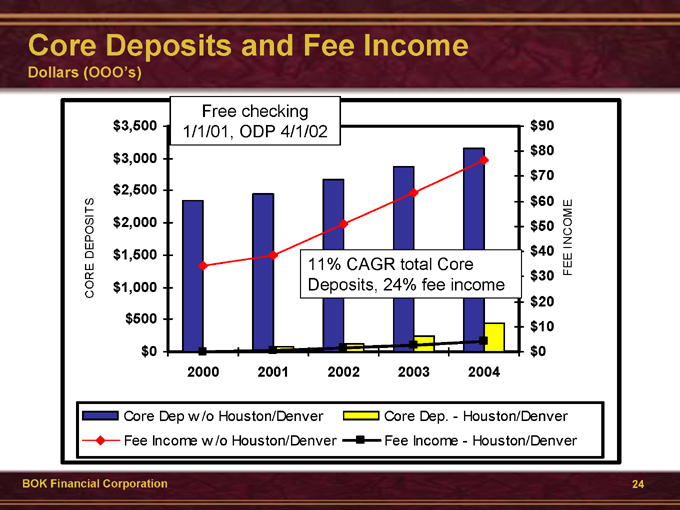
Core Deposits and Fee Income
Dollars (OOO’s)
CORE DEPOSITS
FEE INCOME
Free checking 1/1/01, ODP 4/1/02 $3,500 $3,000 $2,500 $2,000 $1,500 $1,000 $500 $0
11% CAGR total Core Deposits, 24% fee income $90 $80 $70 $60 $50 $40 $30 $20 $10 $0
2000 2001 2002 2003 2004
Core Dep w /o Houston/Denver Fee Income w /o Houston/Denver
Core Dep.—Houston/Denver Fee Income—Houston/Denver
BOK Financial Corporation
24
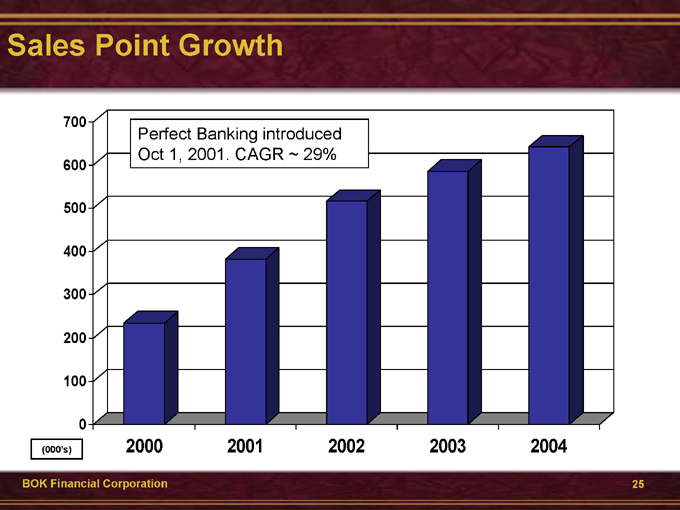
Sales Point Growth
Perfect Banking introduced Oct 1, 2001. CAGR ~ 29%
700 600 500 400 300 200 100 0
2000 2001 2002 2003 2004
(000’s)
BOK Financial Corporation
25
Wealth Management $25 billion in assets, $9 billion managed Primary focus:
Nationally competitive products Extraordinary client experience
Team investment delivery
Open architecture & improved equity performance Trusted advisor sales & service mission
BOK Financial Corporation
26
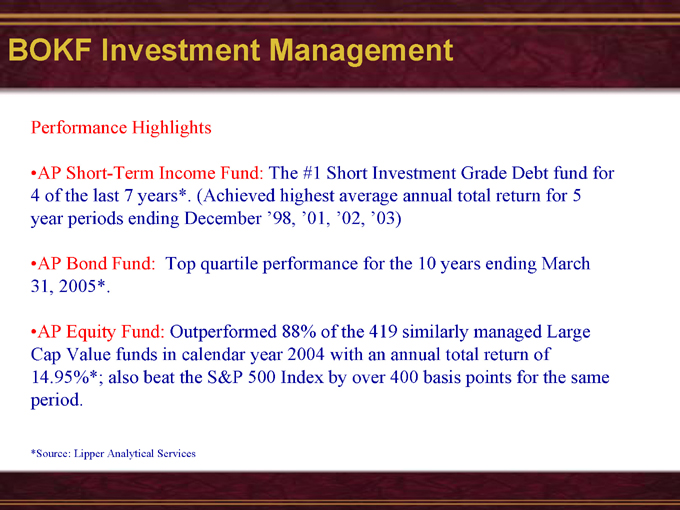
BOKF Investment Management
Performance Highlights
AP Short-Term Income Fund: The #1 Short Investment Grade Debt fund for 4 of the last 7 years*. (Achieved highest average annual total return for 5 year periods ending December ‘98, ‘01, ‘02, ‘03)
AP Bond Fund: Top quartile performance for the 10 years ending March 31, 2005*.
AP Equity Fund: Outperformed 88% of the 419 similarly managed Large Cap Value funds in calendar year 2004 with an annual total return of 14.95%*; also beat the S&P 500 Index by over 400 basis points for the same period.
*Source: Lipper Analytical Services
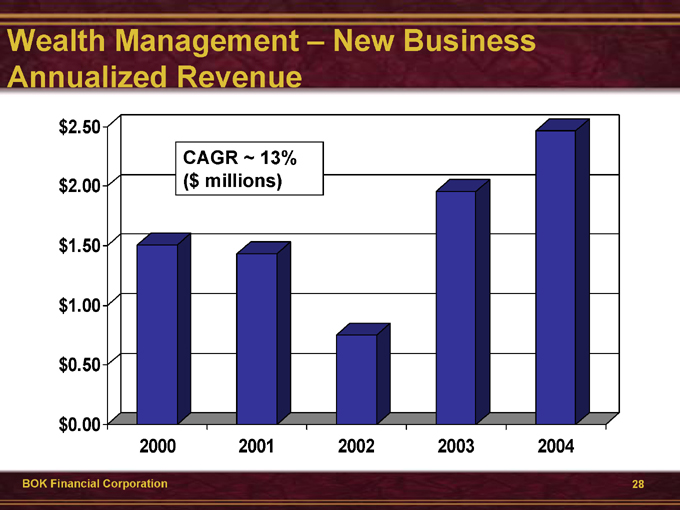
Wealth Management — New Business Annualized Revenue
CAGR ~ 13% ($ millions) $2.50 $2.00 $1.50 $1.00 $0.50 $0.00
2000 2001 2002 2003 2004
BOK Financial Corporation
28
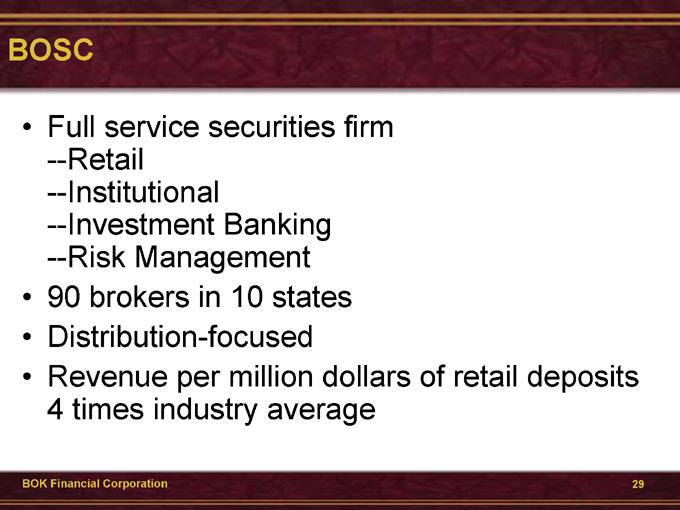
BOSC
Full service securities firm
Retail Institutional
Investment Banking Risk Management
90 brokers in 10 states Distribution-focused
Revenue per million dollars of retail deposits 4 times industry average
BOK Financial Corporation
29
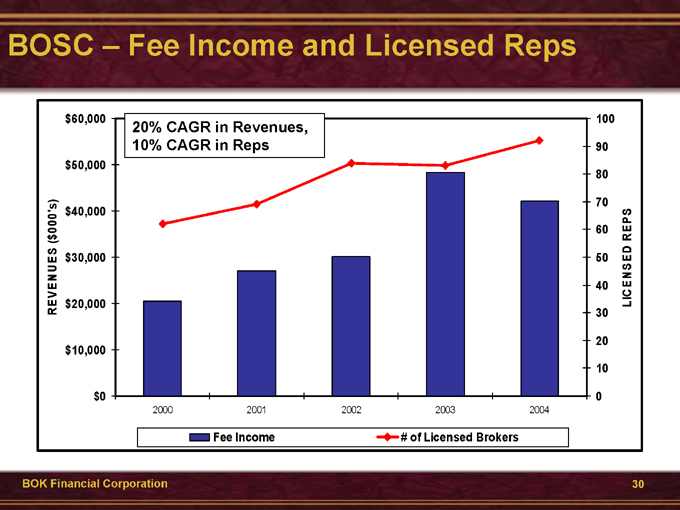
BOSC — Fee Income and Licensed Reps $60,000 $50,000 $40,000 $30,000 $20,000 $10,000 $0
20% CAGR in Revenues, 10% CAGR in Reps REVENUES ($000’S)
LICENSED REPS
100 90 80 70 60 50 40 30 20 10 0
2000 2001 2002 2003 2004
Fee Income # of Licensed Brokers
BOK Financial Corporation
30
The BOK Financial Corporation Story