UNITED STATES
SECURITIES AND EXCHANGE COMMISSION
Washington, D.C. 20549
FORM N-CSR
CERTIFIED SHAREHOLDER REPORT OF REGISTERED MANAGEMENT
INVESTMENT COMPANIES
Investment Company Act file number | 811- 6325 |
| |
| Dreyfus Midcap Index Fund, Inc. | |
| (Exact name of Registrant as specified in charter) | |
| | |
| c/o The Dreyfus Corporation 200 Park Avenue New York, New York 10166 | |
| (Address of principal executive offices) (Zip code) | |
| | |
| John Pak, Esq. 200 Park Avenue New York, New York 10166 | |
| (Name and address of agent for service) | |
|
Registrant's telephone number, including area code: | (212) 922-6000 |
| |
Date of fiscal year end: | 10/31 | |
Date of reporting period: | 10/31/2013 | |
| | | | | | | |
FORM N-CSR
Item 1. Reports to Stockholders.
The views expressed in this report reflect those of the portfolio manager only through the end of the period covered and do not necessarily represent the views of Dreyfus or any other person in the Dreyfus organization. Any such views are subject to change at any time based upon market or other conditions and Dreyfus disclaims any responsibility to update such views.These views may not be relied on as investment advice and, because investment decisions for a Dreyfus fund are based on numerous factors, may not be relied on as an indication of trading intent on behalf of any Dreyfus fund.
| | Contents |
| | THE FUND |
| 2 | A Letter from the President |
| 3 | Discussion of Fund Performance |
| 6 | Fund Performance |
| 7 | Understanding Your Fund’s Expenses |
| 7 | Comparing Your Fund’s Expenses With Those of Other Funds |
| 8 | Statement of Investments |
| 22 | Statement of Financial Futures |
| 23 | Statement of Assets and Liabilities |
| 24 | Statement of Operations |
| 25 | Statement of Changes in Net Assets |
| 26 | Financial Highlights |
| 27 | Notes to Financial Statements |
| 37 | Report of Independent Registered Public Accounting Firm |
| 38 | Important Tax Information |
| 39 | Board Members Information |
| 41 | Officers of the Fund |
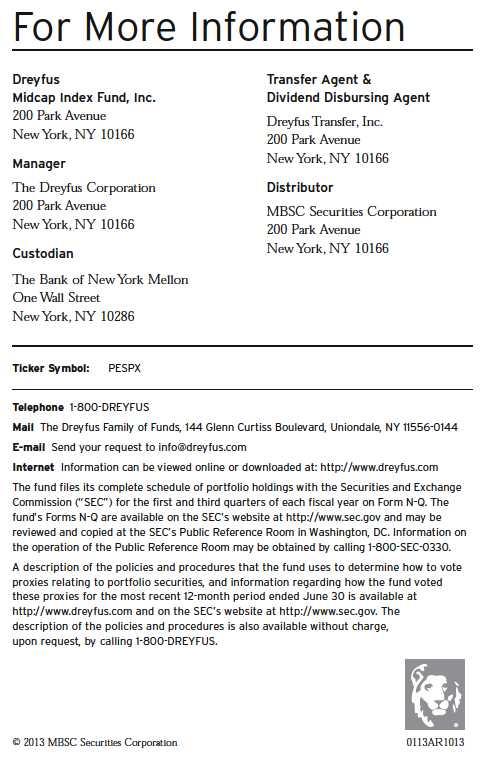
| | FOR MORE INFORMATION |
| | Back Cover |
Dreyfus
Midcap Index Fund, Inc.
The Fund
A LETTER FROM THE PRESIDENT
Dear Shareholder:
We are pleased to present this annual report for Dreyfus Midcap Index Fund, Inc., covering the 12-month period from November 1, 2012, through October 31, 2013. For information about how the fund performed during the reporting period, as well as general market perspectives, we provide a Discussion of Fund Performance on the pages that follow.
Although expectations of higher long-term interest rates and a more moderately stimulative monetary policy sparked volatility in the U.S stock market at times during the reporting period, improved U.S. economic conditions drove stock prices substantially higher for the reporting period overall. Even the 16-day U.S. government shutdown in October failed to derail the market’s advance, enabling some broad measures of stock market performance to reach new record highs by the end of the month. Stocks across most capitalization ranges and investment styles produced strong results.
We currently expect U.S. economic conditions to continue to improve in 2014, with accelerating growth supported by the fading drags of tighter federal fiscal policies and downsizing on the state and local levels. Moreover, inflation is likely to remain muted, so monetary policy can remain stimulative. Globally, we anticipate stronger growth in many developed countries due to past and continuing monetary ease, while emerging markets seem poised for moderate economic expansion despite recently negative investor sentiment. For more information on how these observations may affect your investments, we encourage you to speak with your financial advisor.
Sincerely,

J. Charles Cardona
President
The Dreyfus Corporation
November 15, 2013
2
DISCUSSION OF FUND PERFORMANCE
For the reporting period of November 1, 2012, through October 31, 2013, as provided by Thomas J. Durante, Richard A. Brown, and Karen Q.Wong, Portfolio Managers
Fund and Market Performance Overview
For the 12-month period ended October 31, 2013, Dreyfus Midcap Index Fund produced a total return of 32.84%.1 The Standard & Poor’s MidCap 400® Index (“S&P 400 Index”), the fund’s benchmark, produced a total return of 33.48% for the same period.2,3
Like other capitalization ranges, midcap stocks responded positively to recovering global and domestic economies during the reporting period.The difference in returns between the fund and the S&P 400 Index was primarily the result of transaction costs and operating expenses that are not reflected in the S&P 400 Index’s results.
The Fund’s Investment Approach
The fund seeks to match the total return of the S&P 400 Index by generally investing in all 400 stocks in the S&P 400 Index, in proportion to their respective weightings. The fund may also use stock index futures as a substitute for the sale or purchase of stocks.The S&P 400 Index is composed of 400 stocks of midsize domestic companies across 10 economic sectors. Each stock is weighted by its market capitalization; that is, larger companies have greater representation in the S&P 400 Index than smaller ones.
The fund employed futures contracts during the reporting period in its efforts to replicate the returns of the S&P 400 Index.
Recovering U.S. and Global Economies Fueled Market Gains
The reporting period began soon after the start of a sustained stock market rally driven by improved U.S. employment and housing markets. Investors were particularly encouraged by a new round of quantitative easing from the Federal Reserve Board (the “Fed”) involving massive monthly purchases of U.S. government securities. Improving conditions in overseas markets also contributed to greater optimism as investors responded positively to the potential for more robust export activity to overseas markets.
The Fund 3
DISCUSSION OF FUND PERFORMANCE (continued)
Economic data continued to improve, and stocks generally continued to rally, through the spring of 2013. However, in late May, relatively hawkish remarks by Fed chairman Ben Bernanke were widely interpreted as a signal that U.S. monetary policymakers would begin to back away from their quantitative easing program sooner than many analysts had expected, sparking volatility that erased some of the market’s previous gains.The S&P 400 Index generally stabilized over the summer, and stocks advanced strongly in September when the Fed refrained from tapering its bond purchasing program. Even a 16-day federal government shutdown in October failed to derail the rally, enabling the S&P 400 Index to reach record highs by the reporting period’s end.
In this constructive environment, midcap stocks produced higher returns, on average, than their large-cap counterparts. However, midcap stocks generally trailed small-cap equities over the reporting period.
The Industrials Sector Led the Market’s Advance
All of the economic sectors represented in the S&P 400 Index produced double-digit gains for the reporting period, reflecting broad-based support for midcap stocks.The industrials sector led the market rally as aerospace and defense companies posted strong gains despite the potentially negative implications of reduced government spending stemming from protracted budget disagreements in Congress. Machinery producers benefited from low-cost energy and the return of manufacturing facilities to the United States, particularly those using automated processes. Professional services providers, such as staffing agencies, rallied on the strength of improved hiring trends.
In the financials sector, the insurance industry was bolstered by higher premiums at a time when a relatively mild hurricane season kept claims low. Moreover, many midcap insurance companies have boosted their bottom lines by expanding into new lines of business. Commercial banks with a regional focus benefited from strengthening housing markets, higher lending volumes, and declining loan losses. Among information technology companies, software developers advanced strongly due to intensifying demand for productivity and efficiency enhancements among business enterprises.
4
The fund received less favorable contributions from the telecommunications services and utilities sectors. Midcap wireless and landline carriers were hurt by rising capital expenditures to upgrade their networks. Both sectors also were undermined by a shift in investor sentiment away from slower-growing, dividend-paying stocks and toward faster growing industry groups.
Replicating the Performance of the S&P 400 Index
Although we do not actively manage the fund’s investments in response to macroeconomic trends, it is worth noting that recent evidence of sustained domestic and global growth has the potential to fuel further gains in U.S. equity markets, including midcap stocks. As always, we have continued to monitor the factors considered by the fund’s investment model in light of current market conditions.
November 15, 2013
|
| Equity funds are subject generally to market, market sector, market liquidity, issuer and investment style risks, among |
| other factors, to varying degrees, all of which are more fully described in the fund’s prospectus. |
| Stocks of mid-cap companies often experience sharper price fluctuations than stocks of large-cap companies. |
| 1 Total return includes reinvestment of dividends and any capital gains paid. Past performance is no guarantee of future |
| results. Share price and investment return fluctuate such that upon redemption, fund shares may be worth more or less |
| than their original cost. |
| 2 SOURCE: LIPPER INC. – Reflects reinvestment of dividends and, where applicable, capital gain distributions.The |
| Standard & Poor’s MidCap 400 Index is a widely accepted, unmanaged total return index measuring the |
| performance of the midsize company segment of the U.S. market. Investors cannot invest directly in any index. |
| 3 “Standard & Poor’s®,” “S&P®” and “S&P MidCap 400®” are registered trademarks of Standard & Poor’s |
| Financial Services LLC, and have been licensed for use on behalf of the fund.The fund is not sponsored, endorsed, |
| managed, advised, sold or promoted by Standard & Poor’s and its affiliates and Standard & Poor’s and its affiliates |
| make no representation regarding the advisability of investing in the fund. |
The Fund 5
FUND PERFORMANCE

|
| † Source: Lipper Inc. |
| Past performance is not predictive of future performance.The fund’s performance shown in the graph and table does not |
| reflect the deduction of taxes that a shareholder would pay on fund distributions or the redemption of fund shares. |
| The above graph compares a $10,000 investment made in Dreyfus Midcap Index Fund, Inc. on 10/31/03 to a |
| $10,000 investment made in the Standard & Poor’s MidCap 400 Index (the “Index”) on that date.All dividends and |
| capital gain distributions are reinvested. |
| The fund’s performance shown in the line graph above takes into account all applicable fees and expenses.The Index is a |
| widely accepted, unmanaged total return index measuring the performance of the midsize company segment of the U.S. |
| stock market. Unlike a mutual fund, the Index is not subject to charges, fees and other expenses. Investors cannot invest |
| directly in any index. Further information relating to fund performance, including expense reimbursements, if applicable, is |
| contained in the Financial Highlights section of the prospectus and elsewhere in this report. |
6
UNDERSTANDING YOUR FUND’S EXPENSES (Unaudited)

The Fund 7
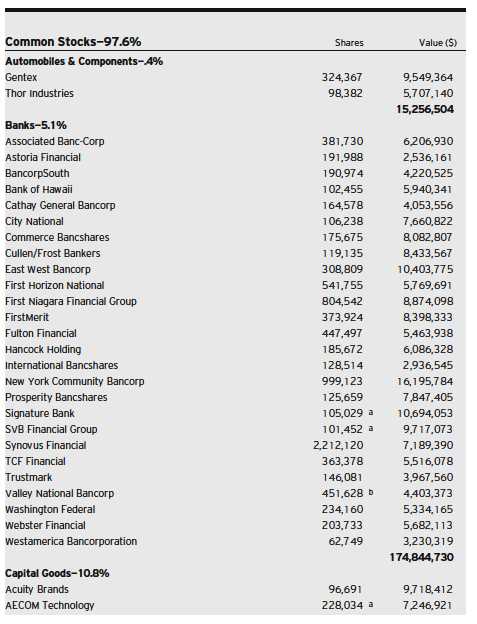
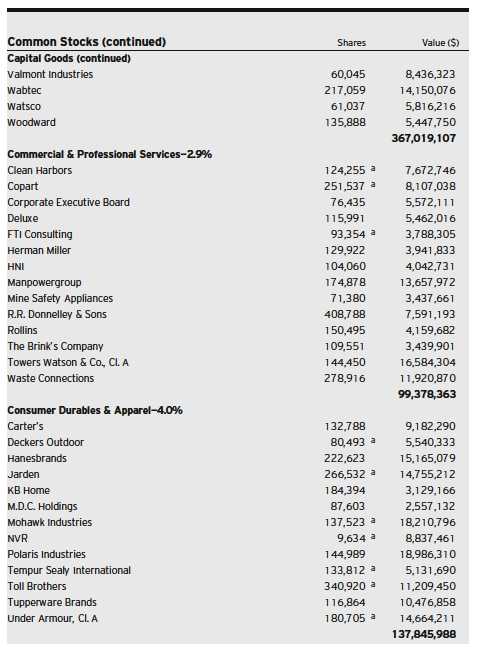
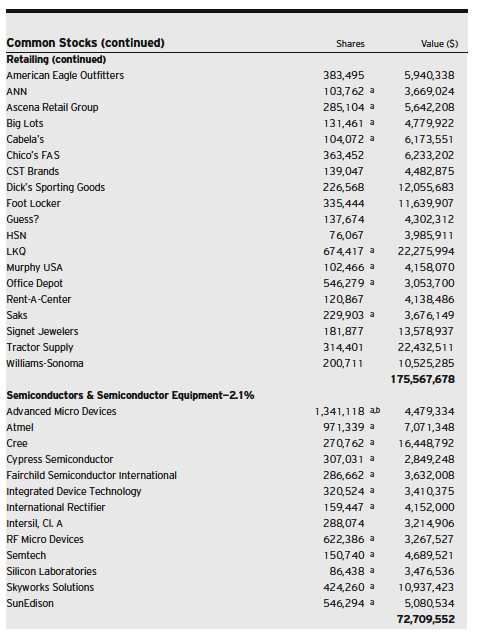
STATEMENT OF INVESTMENTS
October 31, 2013
8
The Fund 9
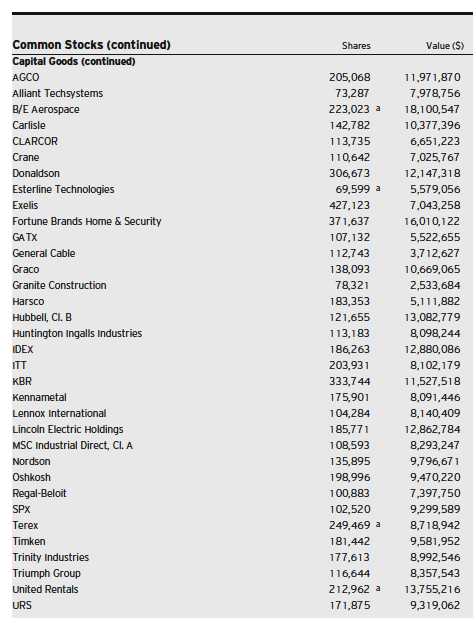
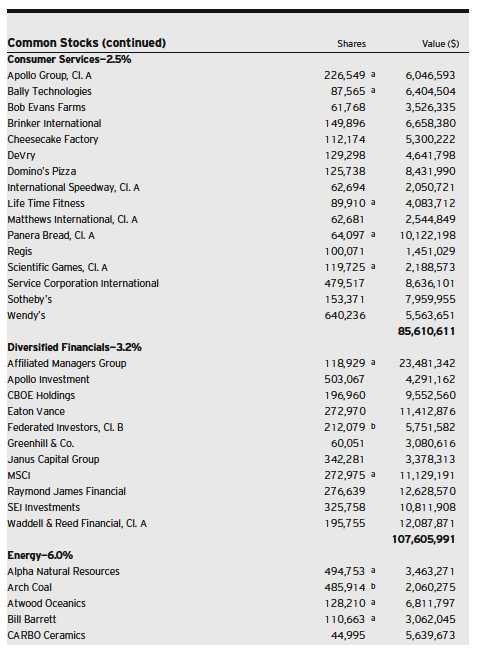
STATEMENT OF INVESTMENTS (continued)
10
The Fund 11
STATEMENT OF INVESTMENTS (continued)

12

The Fund 13
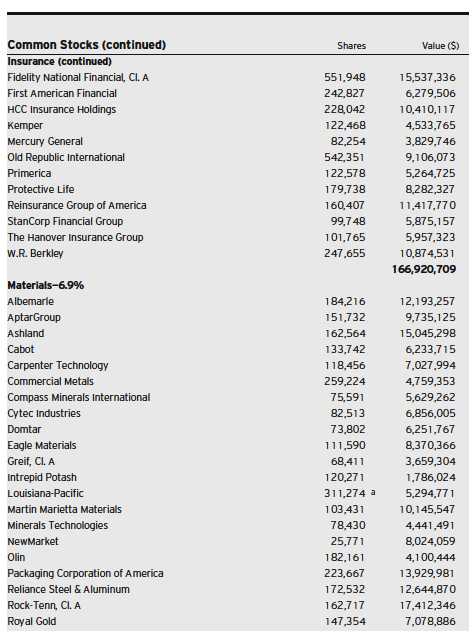
STATEMENT OF INVESTMENTS (continued)
14

The Fund 15
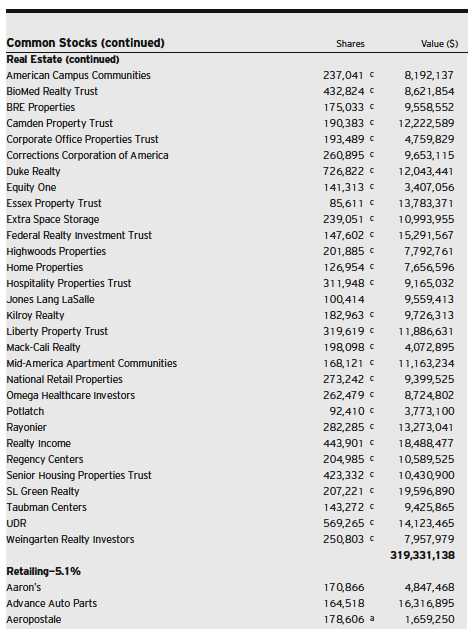
STATEMENT OF INVESTMENTS (continued)
16
The Fund 17
STATEMENT OF INVESTMENTS (continued)

18

The Fund 19
STATEMENT OF INVESTMENTS (continued)

20
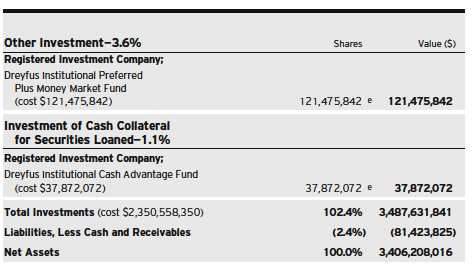
|
| a Non-income producing security. |
| b Security, or portion thereof, on loan.At October 31, 2013, the value of the fund’s securities on loan was |
| $37,104,617 and the value of the collateral held by the fund was $37,872,072. |
| c Investment in real estate investment trust. |
| d Held by or on behalf of a counterparty for open financial futures positions. |
| e Investment in affiliated money market mutual fund. |

|
| † Based on net assets. |
| See notes to financial statements. |
The Fund 21
STATEMENT OF FINANCIAL FUTURES
October 31, 2013

|
| See notes to financial statements. |
22
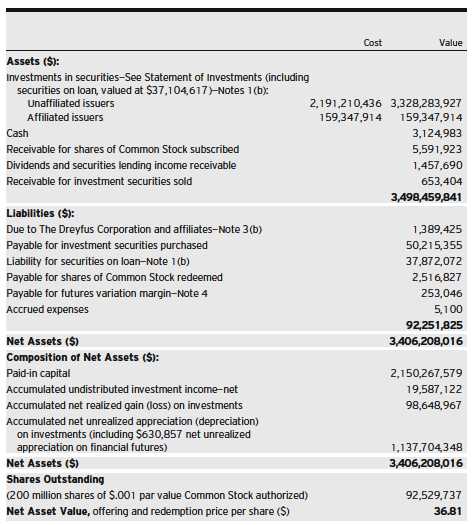
STATEMENT OF ASSETS AND LIABILITIES
October 31, 2013
|
| See notes to financial statements. |
The Fund 23
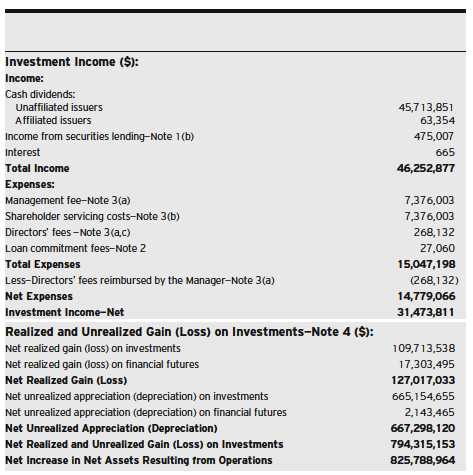
STATEMENT OF OPERATIONS
Year Ended October 31, 2013
|
| See notes to financial statements. |
24
STATEMENT OF CHANGES IN NET ASSETS

|
| See notes to financial statements. |
The Fund 25
FINANCIAL HIGHLIGHTS
The following table describes the performance for the fiscal periods indicated. Total return shows how much your investment in the fund would have increased (or decreased) during each period, assuming you had reinvested all dividends and distributions.These figures have been derived from the fund’s financial statements.

|
| a Based on average shares outstanding at each month end. |
| See notes to financial statements. |
26
NOTES TO FINANCIAL STATEMENTS
NOTE 1—Significant Accounting Policies:
Dreyfus Midcap Index Fund, Inc. (the “fund”) is registered under the Investment Company Act of 1940, as amended (the “Act”), as a non-diversified open-end management investment company. The fund’s investment objective seeks to match the performance of the Standard & Poor’s® MidCap 400 Index.The Dreyfus Corporation (the “Manager” or “Dreyfus”), a wholly-owned subsidiary of The Bank of New York Mellon Corporation (“BNY Mellon”), serves as the fund’s investment adviser. MBSC Securities Corporation (the “Distributor”), a wholly-owned subsidiary of the Manager, is the distributor of the fund’s shares, which are sold to the public without a sales charge.
The Financial Accounting Standards Board (“FASB”) Accounting Standards Codification is the exclusive reference of authoritative U.S. generally accepted accounting principles (“GAAP”) recognized by the FASB to be applied by nongovernmental entities. Rules and interpretive releases of the Securities and Exchange Commission (“SEC”) under authority of federal laws are also sources of authoritative GAAP for SEC registrants. The fund’s financial statements are prepared in accordance with GAAP, which may require the use of management estimates and assumptions.Actual results could differ from those estimates.
The fund enters into contracts that contain a variety of indemnifications. The fund’s maximum exposure under these arrangements is unknown.The fund does not anticipate recognizing any loss related to these arrangements.
(a) Portfolio valuation: The fair value of a financial instrument is the amount that would be received to sell an asset or paid to transfer a liability in an orderly transaction between market participants at the measurement date (i.e., the exit price). GAAP establishes a fair value hierarchy that prioritizes the inputs of valuation techniques used to measure fair value. This hierarchy gives the highest priority to unadjusted quoted prices in active markets for identical assets or liabilities (Level 1 measurements) and the lowest priority to unobservable inputs (Level 3 measurements).
The Fund 27
NOTES TO FINANCIAL STATEMENTS (continued)
Additionally, GAAP provides guidance on determining whether the volume and activity in a market has decreased significantly and whether such a decrease in activity results in transactions that are not orderly. GAAP requires enhanced disclosures around valuation inputs and techniques used during annual and interim periods.
Various inputs are used in determining the value of the fund’s investments relating to fair value measurements.These inputs are summarized in the three broad levels listed below:
Level 1—unadjusted quoted prices in active markets for identical investments.
Level 2—other significant observable inputs (including quoted prices for similar investments, interest rates, prepayment speeds, credit risk, etc.).
Level 3—significant unobservable inputs (including the fund’s own assumptions in determining the fair value of investments).
The inputs or methodology used for valuing securities are not necessarily an indication of the risk associated with investing in those securities.
Changes in valuation techniques may result in transfers in or out of an assigned level within the disclosure hierarchy. Valuation techniques used to value the fund’s investments are as follows:
Investments in securities are valued at the last sales price on the securities exchange or national securities market on which such securities are primarily traded. Securities listed on the National Market System for which market quotations are available are valued at the official closing price or, if there is no official closing price that day, at the last sales price. Securities not listed on an exchange or the national securities market, or securities for which there were no transactions, are valued at the average of the most recent bid and asked prices, except for open short positions, where the asked price is used for valuation purposes. Bid price is used when no asked price is available. Registered investment companies that are not traded on an exchange are valued at their net asset value. All of the preceding securities are categorized within Level 1 of the fair value hierarchy.
28
U.S. Treasury Bills are valued at the mean price between quoted bid prices and asked prices by an independent pricing service (the “Service”) approved by the fund’s Board of Directors (the “Board”). These securities are generally categorized within Level 2 of the fair value hierarchy.
The Service’s procedures are reviewed by Dreyfus under the general supervision of the Board.
Fair valuing of securities may be determined with the assistance of a pricing service using calculations based on indices of domestic securities and other appropriate indicators, such as prices of relevant American Depository Receipts and financial futures. Utilizing these techniques may result in transfers between Level 1 and Level 2 of the fair value hierarchy.
When market quotations or official closing prices are not readily available, or are determined not to reflect accurately fair value, such as when the value of a security has been significantly affected by events after the close of the exchange or market on which the security is principally traded (for example, a foreign exchange or market), but before the fund calculates its net asset value, the fund may value these investments at fair value as determined in accordance with the procedures approved by the Board. Certain factors may be considered when fair valuing investments such as: fundamental analytical data, the nature and duration of restrictions on disposition, an evaluation of the forces that influence the market in which the securities are purchased and sold, and public trading in similar securities of the issuer or comparable issuers. These securities are either categorized within Level 2 or 3 of the fair value hierarchy depending on the relevant inputs used.
For restricted securities where observable inputs are limited, assumptions about market activity and risk are used and are categorized within Level 3 of the fair value hierarchy.
Financial futures, which are traded on an exchange, are valued at the last sales price on the securities exchange on which such securities are
The Fund 29
NOTES TO FINANCIAL STATEMENTS (continued)
primarily traded or at the last sales price on the national securities market on each business day and are generally categorized within Level 1 of the fair value hierarchy.
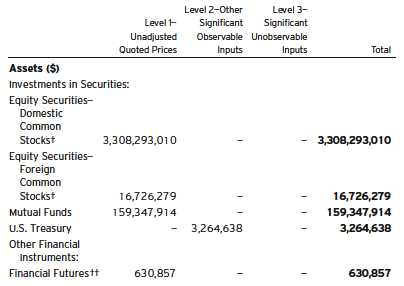
The following is a summary of the inputs used as of October 31, 2013 in valuing the fund’s investments:
| |
| † | See Statement of Investments for additional detailed categorizations. |
| †† | Amount shown represents unrealized appreciation at period end. |
At October 31, 2013, there were no transfers between Level 1 and Level 2 of the fair value hierarchy.
(b) Securities transactions and investment income: Securities transactions are recorded on a trade date basis. Realized gains and losses from securities transactions are recorded on the identified cost basis. Dividend income is recognized on the ex-dividend date and interest income, including, where applicable, accretion of discount and amortization of premium on investments, is recognized on the accrual basis.
Pursuant to a securities lending agreement with The Bank of New York Mellon, a subsidiary of BNY Mellon and an affiliate of Dreyfus,
30
the fund may lend securities to qualified institutions. It is the fund’s policy that, at origination, all loans are secured by collateral of at least 102% of the value of U.S. securities loaned and 105% of the value of foreign securities loaned. Collateral equivalent to at least 100% of the market value of securities on loan is maintained at all times. Collateral is either in the form of cash, which can be invested in certain money market mutual funds managed by the Manager or U.S. Government and Agency securities. The fund is entitled to receive all dividends, interest and distributions on securities loaned, in addition to income earned as a result of the lending transaction. Should a borrower fail to return the securities in a timely manner, The Bank of New York Mellon is required to replace the securities for the benefit of the fund or credit the fund with the market value of the unreturned securities and is subrogated to the fund’s rights against the borrower and the collateral. During the period ended October 31, 2013, The Bank of New York Mellon earned $155,497 from lending portfolio securities, pursuant to the securities lending agreement.
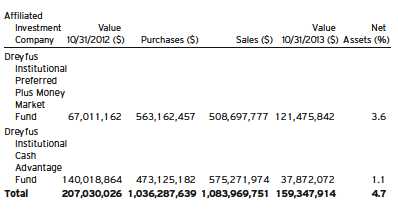
(c) Affiliated issuers: Investments in other investment companies advised by Dreyfus are defined as “affiliated” under the Act. Investments in affiliated investment companies during the period ended October 31, 2013 were as follows:
The Fund 31
NOTES TO FINANCIAL STATEMENTS (continued)
(d) Dividends to shareholders: Dividends are recorded on the ex-dividend date. Dividends from investment income-net and dividends from net realized capital gains, if any, are normally declared and paid annually, but the fund may make distributions on a more frequent basis to comply with the distribution requirements of the Internal Revenue Code of 1986, as amended (the “Code”).To the extent that net realized capital gains can be offset by capital loss carryovers, it is the policy of the fund not to distribute such gains. Income and capital gain distributions are determined in accordance with income tax regulations, which may differ from GAAP.
(e) Federal income taxes: It is the policy of the fund to continue to qualify as a regulated investment company, if such qualification is in the best interests of its shareholders, by complying with the applicable provisions of the Code, and to make distributions of taxable income sufficient to relieve it from substantially all federal income and excise taxes.
As of and during the period ended October 31, 2013, the fund did not have any liabilities for any uncertain tax positions.The fund recognizes interest and penalties, if any, related to uncertain tax positions as income tax expense in the Statement of Operations. During the period ended October 31, 2013, the fund did not incur any interest or penalties.
Each tax year in the four-year period ended October 31, 2013 remains subject to examination by the Internal Revenue Service and state taxing authorities.
At October 31, 2013, the components of accumulated earnings on a tax basis were as follows: undistributed ordinary income $32,929,226, undistributed capital gains $112,669,995 and unrealized appreciation $1,110,341,216.
The tax character of distributions paid to shareholders during the fiscal periods ended October 31, 2013 and October 31, 2012 were as fol-
32
lows: ordinary income $32,853,514 and $18,118,885, and long-term capital gains $90,037,003 and $93,796,391, respectively.
(f) Accounting Pronouncement: In January 2013, FASB issued Accounting Standards Update No. 2013-01 (“ASU 2013-01”), “Clarifying the Scope of Disclosures about Offsetting Assets and Liabilities”, which replaced Accounting Standards Update No. 2011-11 (“ASU 2011-11”), “Disclosures about Offsetting Assets and Liabilities”. ASU 2013-01 is effective for fiscal years beginning on or after January 1, 2013, and interim periods within those annual periods. ASU 2011-11 was intended to enhance disclosure requirements on the offsetting of financial assets and liabilities.ASU 2013-01 limits the scope of the new balance sheet offsetting disclosures to derivatives, repurchase agreements, and securities lending transactions to the extent that they are (1) offset in the financial statements or (2) subject to enforceable master netting arrangements (“MNA”) or similar agreements. Management is currently evaluating the application of ASU 2013-01 and its impact on the fund’s financial statements.
NOTE 2—Bank Lines of Credit:
The fund participates with other Dreyfus-managed funds in a $265 million unsecured credit facility led by Citibank, N.A. and a $300 million unsecured credit facility provided by The Bank of New York Mellon (each, a “Facility”), each to be utilized primarily for temporary or emergency purposes, including the financing of redemptions. Prior to October 9, 2013, the unsecured credit facility with Citibank, N.A. was $210 million. In connection therewith, the fund has agreed to pay its pro rata portion of commitment fees for each Facility. Interest is charged to the fund based on rates determined pursuant to the terms of the respective Facility at the time of borrowing. During the period ended October 31, 2013, the fund did not borrow under the Facilities.
The Fund 33
NOTES TO FINANCIAL STATEMENTS (continued)
NOTE 3—Management Fee and Other Transactions With Affiliates:
(a) Pursuant to a management agreement (the “Agreement”) with the Manager, the management fee is computed at the annual rate of .25% of the value of the fund’s average daily net assets and is payable monthly. Under the terms of the Agreement, the Manager has agreed to pay all of the fund’s direct expenses, except management fees, Shareholder Services Plan fees, brokerage fees and commissions, taxes, interest expense, commitment fees on borrowings, fees and expenses of non-interested Board members, fees and expenses of independent counsel to the fund and extraordinary expenses. The Manager has also agreed to reduce its management fee in an amount equal to the fund’s allocable portion of the accrued fees and expenses of the non-interested Board members and fees and expenses of independent counsel to the fund and to non-interested Board members. During the period ended October 31, 2013, fees reimbursed by the Manager amounted to $268,132.
(b) Under the Shareholder Services Plan, the fund pays the Distributor for the provision of certain services, at an annual rate of .25% of the value of the fund’s average daily net assets.The services provided may include personal services relating to shareholder accounts, such as answering shareholder inquiries regarding the fund and providing reports and other information, and services related to the maintenance of shareholder accounts.The Distributor may make payments to Service Agents (securities dealers, financial institutions or other industry professionals) with respect to these services.The Distributor determines the amounts to be paid to Service Agents. During the period ended October 31, 2013, the fund was charged $7,376,003 pursuant to the Shareholder Services Plan.
The components of “Due to The Dreyfus Corporation and affiliates” in the Statement of Assets and Liabilities consist of: management fees $704,783 and Shareholder Services Plan fees $704,783, which are offset against an expense reimbursement currently in effect in the amount of $20,141.
34
(c) Each Board member also serves as a Board member of other funds within the Dreyfus complex. Annual retainer fees and attendance fees are allocated to each fund based on net assets.
NOTE 4—Securities Transactions:
The aggregate amount of purchases and sales of investment securities, excluding short-term securities and financial futures, during the period ended October 31, 2013, amounted to $430,645,033 and $298,233,892, respectively.
Derivatives: A derivative is a financial instrument whose performance is derived from the performance of another asset. Each type of derivative instrument that was held by the fund during the period ended October 31, 2013 is discussed below.
Financial Futures: In the normal course of pursuing its investment objective, the fund is exposed to market risk, including equity price risk as a result of changes in value of underlying financial instruments.The fund invests in financial futures in order to manage its exposure to or protect against changes in the market. A financial futures contract represents a commitment for the future purchase or a sale of an asset at a specified date. Upon entering into such contracts, these investments require initial margin deposits with a counterparty, which consist of cash or cash equivalents.The amount of these deposits is determined by the exchange or Board of Trade on which the contract is traded and is subject to change.Accordingly, variation margin payments are received or made to reflect daily unrealized gains or losses which are recorded in the Statement of Operations.When the contracts are closed, the fund recognizes a realized gain or loss which is reflected in the Statement of Operations.There is minimal counterparty credit risk to the fund with financial futures since they are exchange traded, and the exchange guarantees the financial futures against default. Financial futures open at October 31, 2013 are set forth in the Statement of Financial Futures.
The Fund 35
NOTES TO FINANCIAL STATEMENTS (continued)
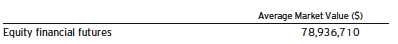
The following summarizes the average market value of derivatives outstanding during the period ended October 31, 2013:
At October 31, 2013, the cost of investments for federal income tax purposes was $2,377,290,625; accordingly, accumulated net unrealized appreciation on investments was $1,110,341,216, consisting of $1,218,948,551 gross unrealized appreciation and $108,607,335 gross unrealized depreciation.
NOTE 5—Pending Legal Matters:
The fund and dozens of other entities and individuals have been named as defendants in an adversary proceeding pending in the United States Bankruptcy Court for the Southern District of New York (Weisfelner, as Trustee of the LB Creditor Trust v. Fund 1, et al., Adv. Pro. No. 10-04609). The complaint alleges that payments made to shareholders of Lyondell Chemical Company (“Lyondell”) in connection with the acquisition of Lyondell by Basell AF S.C.A. in a cash-out merger in or around December, 2007 constitute constructive or intentional “fraudulent transfers” under applicable state law and seeks to recover from the former Lyondell shareholders the payments received for the shares.
At this stage in the proceedings, it is not possible to assess with any reasonable certainty the probable outcome of the pending litigation. Consequently, at this time, management is unable to estimate the possible loss that may result.
36
REPORT OF INDEPENDENT REGISTERED
PUBLIC ACCOUNTING FIRM
Shareholders and Board of Directors Dreyfus Midcap Index Fund, Inc.
We have audited the accompanying statement of assets and liabilities of Dreyfus Midcap Index Fund, Inc., including the statements of investments and financial futures, as of October 31, 2013, and the related statement of operations for the year then ended, the statement of changes in net assets for each of the two years in the period then ended, and the financial highlights for each of the five years in the period then ended. These financial statements and financial highlights are the responsibility of the Fund’s management. Our responsibility is to express an opinion on these financial statements and financial highlights based on our audits.
We conducted our audits in accordance with the standards of the Public Company Accounting Oversight Board (United States).Those standards require that we plan and perform the audit to obtain reasonable assurance about whether the financial statements and financial highlights are free of material misstatement.We were not engaged to perform an audit of the Fund’s internal control over financial reporting. Our audits included consideration of internal control over financial reporting as a basis for designing audit procedures that are appropriate in the circumstances, but not for the purpose of expressing an opinion on the effectiveness of the Fund’s internal control over financial reporting. Accordingly, we express no such opinion. An audit also includes examining, on a test basis, evidence supporting the amounts and disclosures in the financial statements and financial highlights, assessing the accounting principles used and significant estimates made by management, and evaluating the overall financial statement presentation. Our procedures included confirmation of securities owned as of October 31, 2013 by correspondence with the custodian and others. We believe that our audits provide a reasonable basis for our opinion.
In our opinion, the financial statements and financial highlights referred to above present fairly, in all material respects, the financial position of Dreyfus Midcap Index Fund, Inc. at October 31, 2013, the results of its operations for the year then ended, the changes in its net assets for each of the two years in the period then ended, and the financial highlights for each of the five years in the period then ended, in conformity with U.S. generally accepted accounting principles.
New York, New York
December 27, 2013
The Fund 37
IMPORTANT TAX INFORMATION (Unaudited)
In accordance with federal tax law, the fund hereby reports 100% of the ordinary dividends paid during the fiscal year ended October 31, 2013 as qualifying for the corporate dividends received deduction. For the fiscal year ended October 31, 2013, certain dividends paid by the fund may be subject to a maximum tax rate of 15%, as provided for by the Jobs and Growth Tax Relief Reconciliation Act of 2003. Of the distributions paid during the fiscal year, $32,853,514 represents the maximum amount that may be considered qualified dividend income. Shareholders will receive notification in early 2014 of the percentage applicable to the preparation of their 2013 income tax returns.Also, the fund hereby designates $1.0370 per share as a long-term capital gain distribution and $.0480 per share as a short-term capital gain distribution paid on December 27, 2012 and the fund also reports $.0169 per share as a long-term capital gain distribution paid on March 19, 2013.
38
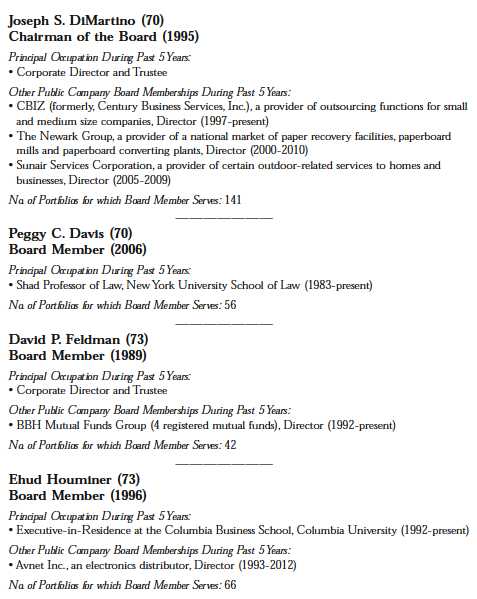
BOARD MEMBERS INFORMATION (Unaudited)
The Fund 39
BOARD MEMBERS INFORMATION (Unaudited) (continued)
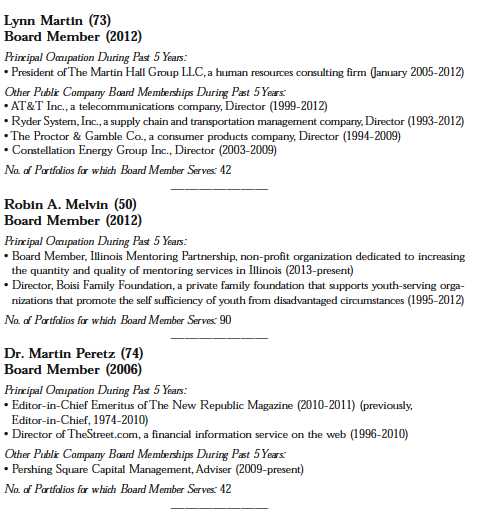
|
| Once elected all Board Members serve for an indefinite term, but achieve Emeritus status upon reaching age 80.The |
| address of the Board Members and Officers is c/o The Dreyfus Corporation, 200 Park Avenue, NewYork, NewYork |
| 10166.Additional information about the Board Members is available in the fund’s Statement of Additional Information |
| which can be obtained from Dreyfus free of charge by calling this toll free number: 1-800-DREYFUS. |
| James F. Henry, Emeritus Board Member |
| Dr. Paul A. Marks, Emeritus Board Member |
| Philip L.Toia, Emeritus Board Member |
40
OFFICERS OF THE FUND (Unaudited)
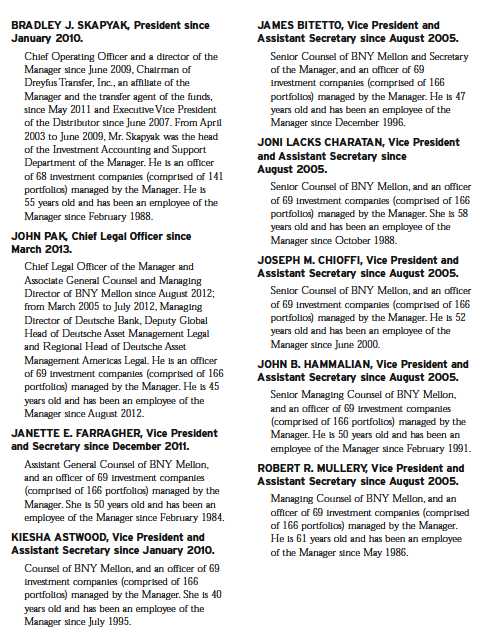
The Fund 41
OFFICERS OF THE FUND (Unaudited) (continued)

42
Item 2. Code of Ethics.
The Registrant has adopted a code of ethics that applies to the Registrant's principal executive officer, principal financial officer, principal accounting officer or controller, or persons performing similar functions. There have been no amendments to, or waivers in connection with, the Code of Ethics during the period covered by this Report.
Item 3. Audit Committee Financial Expert.
The Registrant's Board has determined that David P. Feldman, a member of the Audit Committee of the Board, is an audit committee financial expert as defined by the Securities and Exchange Commission (the "SEC"). David P. Feldman is "independent" as defined by the SEC for purposes of audit committee financial expert determinations.
Item 4. Principal Accountant Fees and Services.
(a) Audit Fees. The aggregate fees billed for each of the last two fiscal years (the "Reporting Periods") for professional services rendered by the Registrant's principal accountant (the "Auditor") for the audit of the Registrant's annual financial statements or services that are normally provided by the Auditor in connection with the statutory and regulatory filings or engagements for the Reporting Periods, were $30,857 in 2012 and $31,594 in 2013.
(b) Audit-Related Fees. The aggregate fees billed in the Reporting Periods for assurance and related services by the Auditor that are reasonably related to the performance of the audit of the Registrant's financial statements and are not reported under paragraph (a) of this Item 4 were $6,000 in 2012 and $6,000 in 2013. These services consisted of one or more of the following: (i) agreed upon procedures related to compliance with Internal Revenue Code section 817(h), (ii) security counts required by Rule 17f-2 under the Investment Company Act of 1940, as amended, (iii) advisory services as to the accounting or disclosure treatment of Registrant transactions or events and (iv) advisory services to the accounting or disclosure treatment of the actual or potential impact to the Registrant of final or proposed rules, standards or interpretations by the Securities and Exchange Commission, the Financial Accounting Standards Boards or other regulatory or standard-setting bodies.
The aggregate fees billed in the Reporting Periods for non-audit assurance and related services by the Auditor to the Registrant's investment adviser (not including any sub-investment adviser whose role is primarily portfolio management and is subcontracted with or overseen by another investment adviser), and any entity controlling, controlled by or under common control with the investment adviser that provides ongoing services to the Registrant ("Service Affiliates"), that were reasonably related to the performance of the annual audit of the Service Affiliate, which required pre-approval by the Audit Committee were $-0- in 2012 and $-0- in 2013.
(c) Tax Fees. The aggregate fees billed in the Reporting Periods for professional services rendered by the Auditor for tax compliance, tax advice, and tax planning ("Tax Services") were $3,538 in 2012 and $4,064 in 2013. These services consisted of: (i) review or preparation of U.S. federal, state, local and excise tax returns; (ii) U.S. federal, state and local tax planning, advice and assistance regarding statutory, regulatory or administrative developments; (iii) tax advice regarding tax qualification matters and/or treatment of various financial instruments held or proposed to be acquired or held, and (iv) determination of Passive Foreign Investment Companies. The aggregate fees billed in the Reporting Periods for Tax Services by the Auditor to Service Affiliates, which required pre-approval by the Audit Committee were $-0- in 2012 and $-0- in 2013.
(d) All Other Fees. The aggregate fees billed in the Reporting Periods for products and services provided by the Auditor, other than the services reported in paragraphs (a) through (c) of this Item, were $2,046 in 2012 and $2,133 in 2013. These services consisted of a review of the Registrant's anti-money laundering program.
The aggregate fees billed in the Reporting Periods for Non-Audit Services by the Auditor to Service Affiliates, other than the services reported in paragraphs (b) through (c) of this Item, which required pre-approval by the Audit Committee, were $200,000 in 2012 and $-0- in 2013.
(e)(1) Audit Committee Pre-Approval Policies and Procedures. The Registrant's Audit Committee has established policies and procedures (the "Policy") for pre-approval (within specified fee limits) of the Auditor's engagements for non-audit services to the Registrant and Service Affiliates without specific case-by-case consideration. The pre-approved services in the Policy can include pre-approved audit services, pre-approved audit-related services, pre-approved tax services and pre-approved all other services. Pre-approval considerations include whether the proposed services are compatible with maintaining the Auditor's independence. Pre-approvals pursuant to the Policy are considered annually.
(e)(2) Note: None of the services described in paragraphs (b) through (d) of this Item 4 were approved by the Audit Committee pursuant to paragraph (c)(7)(i)(C) of Rule 2-01 of Regulation S-X.
(f) None of the hours expended on the principal accountant's engagement to audit the registrant's financial statements for the most recent fiscal year were attributed to work performed by persons other than the principal account's full-time, permanent employees.
Non-Audit Fees. The aggregate non-audit fees billed by the Auditor for services rendered to the Registrant, and rendered to Service Affiliates, for the Reporting Periods were $47,346,640 in 2012 and $53,266,415 in 2013.
Auditor Independence. The Registrant's Audit Committee has considered whether the provision of non-audit services that were rendered to Service Affiliates, which were not pre-approved (not requiring pre-approval), is compatible with maintaining the Auditor's independence.
Item 5. Audit Committee of Listed Registrants.
Not applicable. [CLOSED-END FUNDS ONLY]
Item 6. Investments.
(a) Not applicable.
Item 7. Disclosure of Proxy Voting Policies and Procedures for Closed-End Management Investment Companies.
Not applicable. [CLOSED-END FUNDS ONLY]
Item 8. Portfolio Managers of Closed-End Management Investment Companies.
Not applicable. [CLOSED-END FUNDS ONLY, beginning with reports for periods ended on and after December 31, 2005]
Item 9. Purchases of Equity Securities by Closed-End Management Investment Companies and Affiliated Purchasers.
Not applicable. [CLOSED-END FUNDS ONLY]
Item 10. Submission of Matters to a Vote of Security Holders.
There have been no material changes to the procedures applicable to Item 10.
Item 11. Controls and Procedures.
(a) The Registrant's principal executive and principal financial officers have concluded, based on their evaluation of the Registrant's disclosure controls and procedures as of a date within 90 days of the filing date of this report, that the Registrant's disclosure controls and procedures are reasonably designed to ensure that information required to be disclosed by the Registrant on Form N-CSR is recorded, processed, summarized and reported within the required time periods and that information required to be disclosed by the Registrant in the reports that it files or submits on Form N-CSR is accumulated and communicated to the Registrant's management, including its principal executive and principal financial officers, as appropriate to allow timely decisions regarding required disclosure.
(b) There were no changes to the Registrant's internal control over financial reporting that occurred during the second fiscal quarter of the period covered by this report that have materially affected, or are reasonably likely to materially affect, the Registrant's internal control over financial reporting.
Item 12. Exhibits.
(a)(1) Code of ethics referred to in Item 2.
(a)(2) Certifications of principal executive and principal financial officers as required by Rule 30a-2(a) under the Investment Company Act of 1940.
(a)(3) Not applicable.
(b) Certification of principal executive and principal financial officers as required by Rule 30a-2(b) under the Investment Company Act of 1940.
SIGNATURES
Pursuant to the requirements of the Securities Exchange Act of 1934 and the Investment Company Act of 1940, the Registrant has duly caused this Report to be signed on its behalf by the undersigned, thereunto duly authorized.
Dreyfus Midcap Index Fund, Inc. By: /s/ Bradley J. Skapyak |
Bradley J. Skapyak President |
Date: | December 18, 2013 |
|
Pursuant to the requirements of the Securities Exchange Act of 1934 and the Investment Company Act of 1940, this Report has been signed below by the following persons on behalf of the Registrant and in the capacities and on the dates indicated. |
|
By: /s/ Bradley J. Skapyak |
Bradley J. Skapyak President |
Date: | December 18, 2013 |
|
By: /s/ James Windels |
James Windels �� Treasurer |
Date: | December 18, 2013 |
|
EXHIBIT INDEX
(a)(1) Code of ethics referred to in Item 2.
(a)(2) Certifications of principal executive and principal financial officers as required by Rule 30a-2(a) under the Investment Company Act of 1940. (EX-99.CERT)
(b) Certification of principal executive and principal financial officers as required by Rule 30a-2(b) under the Investment Company Act of 1940. (EX-99.906CERT)