Progress Financial Results Q3 2020 Supplemental Data

Legal Notice This presentation contains statements that are “forward-looking statements” within the meaning of Section 27A of the Securities Act of 1933, as amended, and Section 21E of the Securities Exchange Act of 1934, as amended. Progress has identified some of these forward-looking statements with words like “believe,” “may,” “could,” “would,” “might,” “should,” “expect,” “intend,” “plan,” “target,” “anticipate” and “continue,” the negative of these words, other terms of similar meaning or the use of future dates. Forward-looking statements in this presentation include, but are not limited to, statements regarding Progress’s strategy; acquisitions; future revenue growth, operating margin and cost savings; strategic partnering and marketing initiatives; and other statements regarding the future operation, direction, prospects and success of Progress’s business. There are a number of factors that could cause actual results or future events to differ materially from those anticipated by the forward-looking statements, including, without limitation: ▪ Economic, geopolitical and market conditions can adversely affect our business, results of operations and financial condition, including our revenue growth and profitability, which in turn could adversely affect our stock price. ▪ We may fail to achieve our financial forecasts due to such factors as delays or size reductions in transactions, fewer large transactions in a particular quarter, fluctuations in currency exchange rates, or a decline in our renewal rates for contracts. ▪ Our ability to successfully manage transitions to new business models and markets, including an increased emphasis on a cloud and subscription strategy, may not be successful. ▪ If we are unable to develop new or sufficiently differentiated products and services, or to enhance and improve our existing products and services in a timely manner to meet market demand, partners and customers may not purchase new software licenses or subscriptions or purchase or renew support contracts. ▪ We depend upon our extensive partner channel and we may not be successful in retaining or expanding our relationships with channel partners. ▪ Our international sales and operations subject us to additional risks that can adversely affect our operating results, including risks relating to foreign currency gains and losses. ▪ If the security measures for our software, services or other offerings are compromised or subject to a successful cyber-attack, or if such offerings contain significant coding or configuration errors, we may experience reputational harm, legal claims and financial exposure. ▪ We have made acquisitions, and may make acquisitions in the future, and those acquisitions may not be successful, may involve unanticipated costs or other integration issues or may disrupt our existing operations. ▪ Delay or failure to consummate the proposed acquisition of Chef Software or to realize the expected synergies and benefits of the acquisition could negatively impact our future results of operations and financial condition. ▪ The coronavirus disease (COVID-19) outbreak and the impact it could have on our employees, customers, partners, and the global financial markets could adversely affect our business, results of operations and financial condition. For further information regarding risks and uncertainties associated with our business, please refer to our filings with the Securities and Exchange Commission. Progress undertakes no obligation to update any forward- looking statements, which speak only as of the date of this presentation, except for statements relating to Progress' projected results for the quarter ended August 31, 2020 and fiscal year ended November 30, 2020, which speak only as of September 29, 2020. Finally, during this presentation we will be referring to non-GAAP financial measures such as non-GAAP revenue, non-GAAP income from operations and operating margin, adjusted free cash flow and non-GAAP diluted earnings per share. These non-GAAP measures are not prepared in accordance with generally accepted accounting principles. A reconciliation between non-GAAP and the most directly comparable GAAP financial measures appears in our earnings press release for the fiscal quarter ended August 31, 2020 and is available in the Investor Relations section of our Web site. © 2020 Progress Software Corporation and/or its subsidiaries or affiliates. All rights reserved. 2
Conference Call Details What: Progress Q3 2020 Financial Results Conference Call When: Tuesday, September 29th, 2020 Time: 5:00 p.m. ET Live Call: 888-204-4368 or 323-994-2093, passcode 7969757 Live / Recorded Webcast: http://investors.progress.com © 2020 Progress Software Corporation and/or its subsidiaries or affiliates. All rights reserved. 3
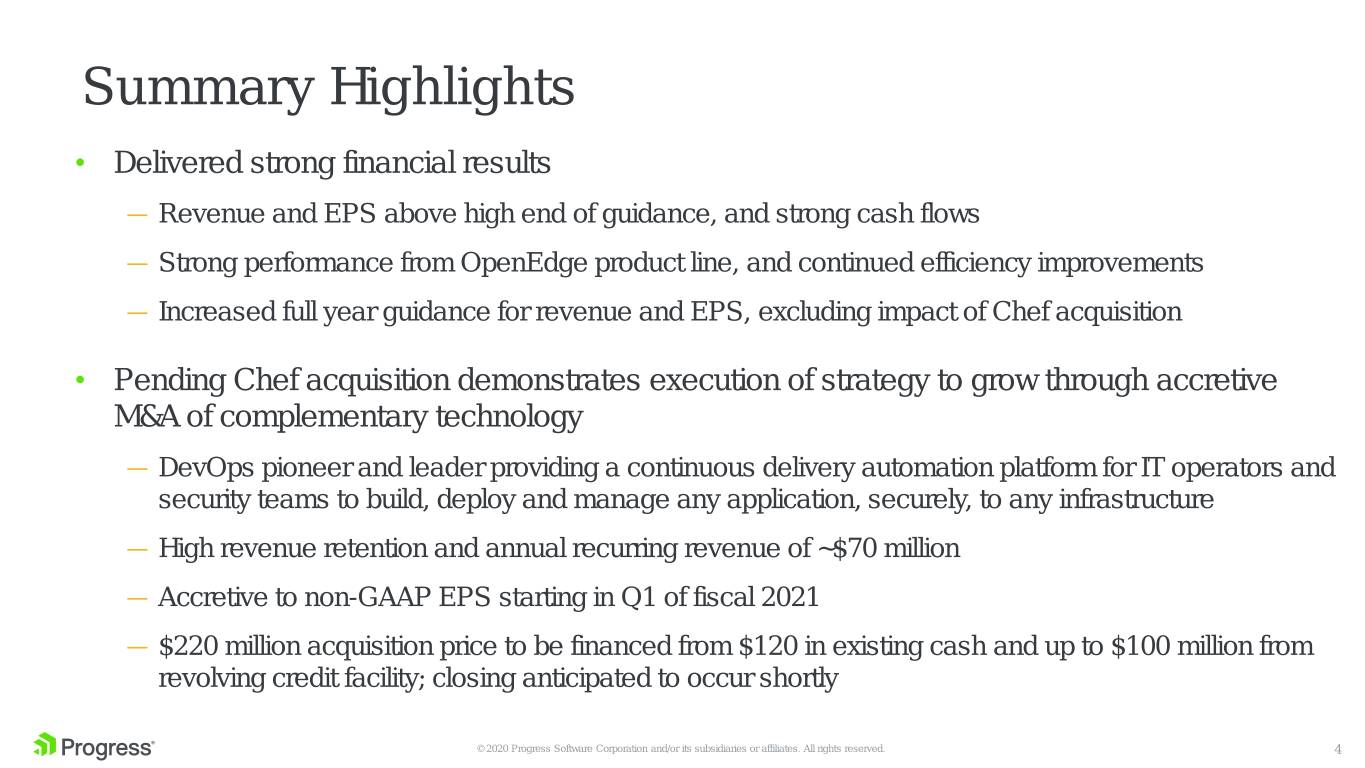
Summary Highlights • Delivered strong financial results — Revenue and EPS above high end of guidance, and strong cash flows — Strong performance from OpenEdge product line, and continued efficiency improvements — Increased full year guidance for revenue and EPS, excluding impact of Chef acquisition • Pending Chef acquisition demonstrates execution of strategy to grow through accretive M&A of complementary technology — DevOps pioneer and leader providing a continuous delivery automation platform for IT operators and security teams to build, deploy and manage any application, securely, to any infrastructure — High revenue retention and annual recurring revenue of ~$70 million — Accretive to non-GAAP EPS starting in Q1 of fiscal 2021 — $220 million acquisition price to be financed from $120 in existing cash and up to $100 million from revolving credit facility; closing anticipated to occur shortly © 2020 Progress Software Corporation and/or its subsidiaries or affiliates. All rights reserved. 4
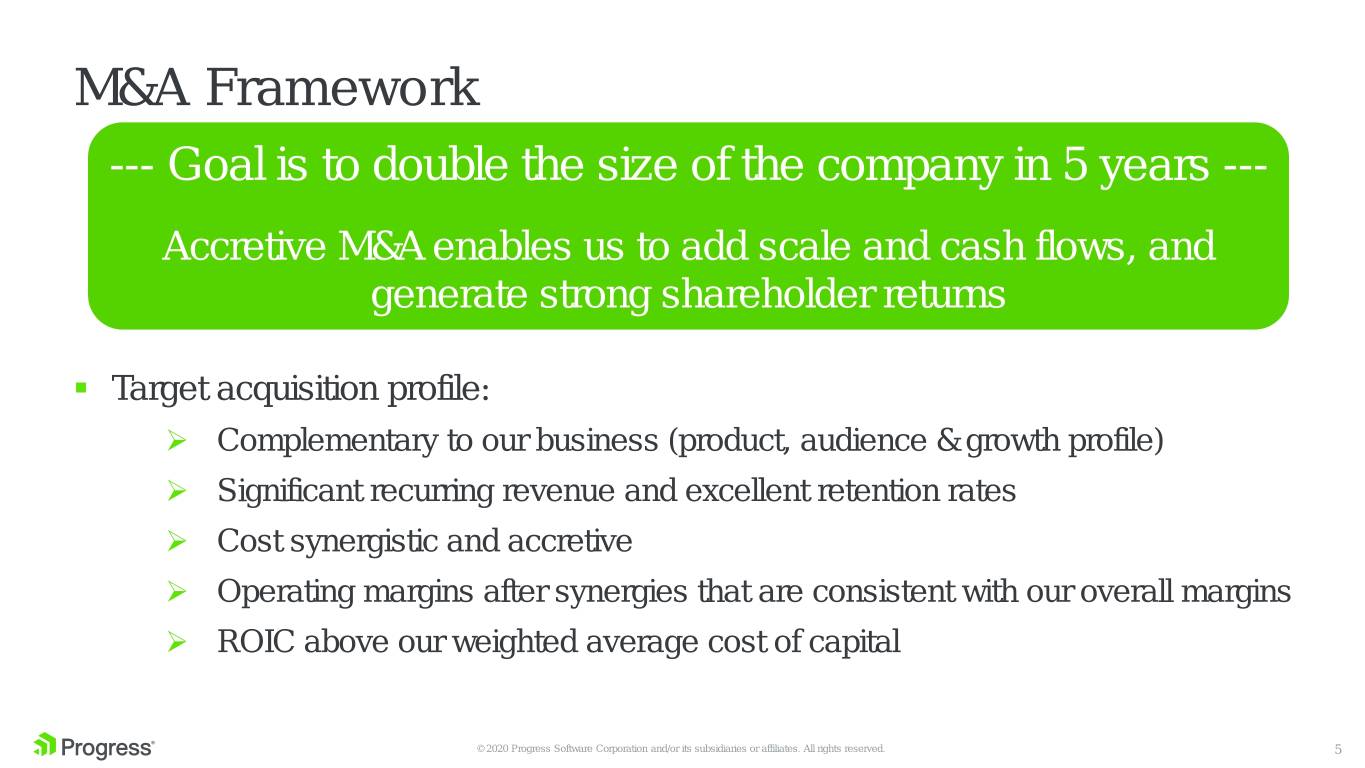
M&A Framework --- Goal is to double the size of the company in 5 years --- Accretive M&A enables us to add scale and cash flows, and generate strong shareholder returns ▪ Target acquisition profile: ➢ Complementary to our business (product, audience & growth profile) ➢ Significant recurring revenue and excellent retention rates ➢ Cost synergistic and accretive ➢ Operating margins after synergies that are consistent with our overall margins ➢ ROIC above our weighted average cost of capital © 2020 Progress Software Corporation and/or its subsidiaries or affiliates. All rights reserved. 5
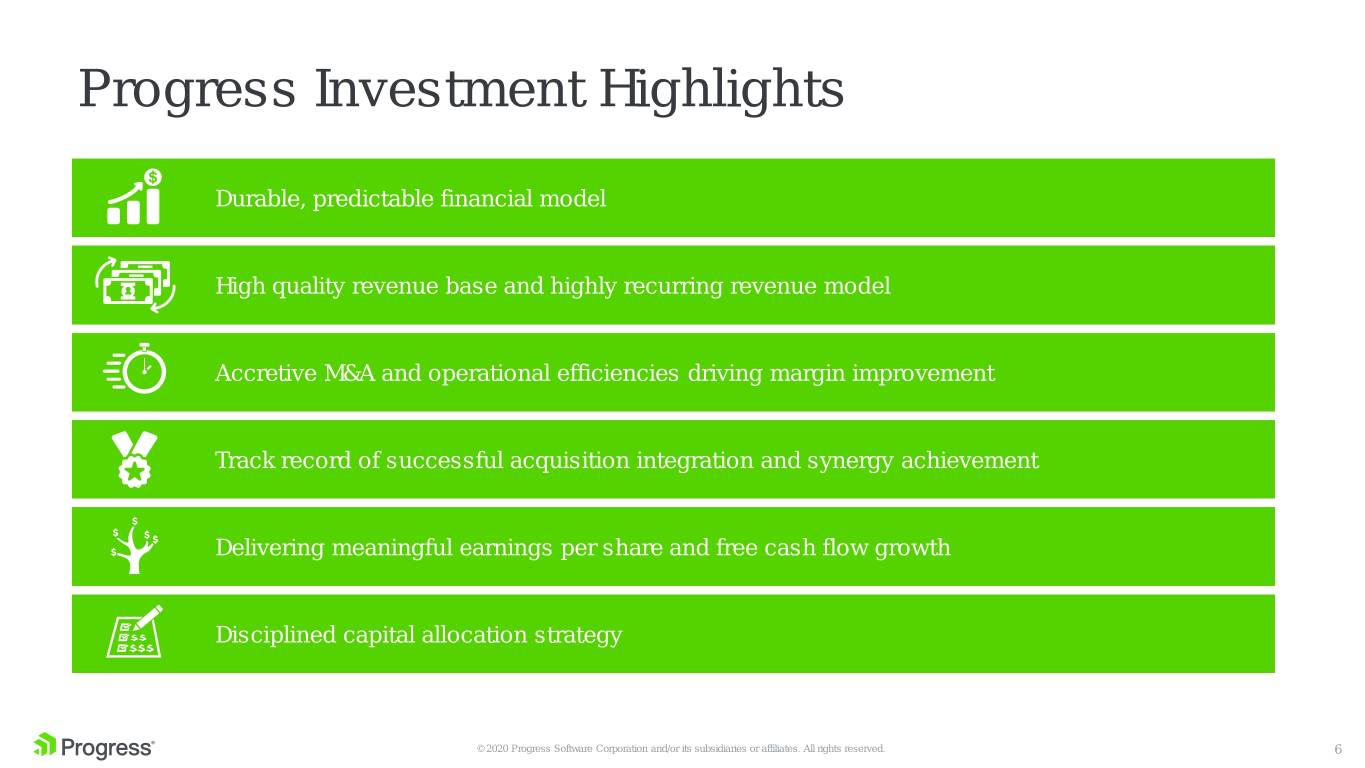
Progress Investment Highlights Durable, predictable financial model High quality revenue base and highly recurring revenue model Accretive M&A and operational efficiencies driving margin improvement Track record of successful acquisition integration and synergy achievement Delivering meaningful earnings per share and free cash flow growth Disciplined capital allocation strategy © 2020 Progress Software Corporation and/or its subsidiaries or affiliates. All rights reserved. 6
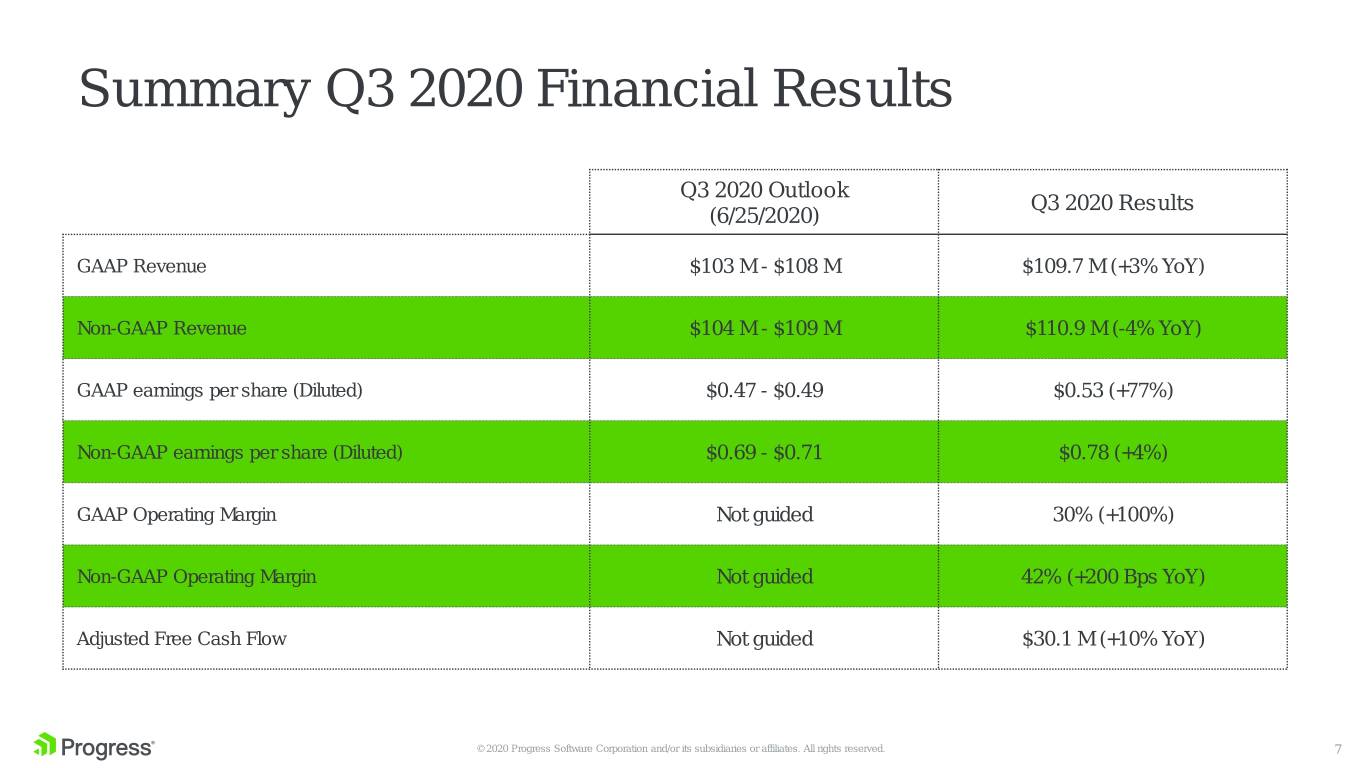
Summary Q3 2020 Financial Results Q3 2020 Outlook Q3 2020 Results (6/25/2020) GAAP Revenue $103 M - $108 M $109.7 M (+3% YoY) Non-GAAP Revenue $104 M - $109 M $110.9 M (-4% YoY) GAAP earnings per share (Diluted) $0.47 - $0.49 $0.53 (+77%) Non-GAAP earnings per share (Diluted) $0.69 - $0.71 $0.78 (+4%) GAAP Operating Margin Not guided 30% (+100%) Non-GAAP Operating Margin Not guided 42% (+200 Bps YoY) Adjusted Free Cash Flow Not guided $30.1 M (+10% YoY) © 2020 Progress Software Corporation and/or its subsidiaries or affiliates. All rights reserved. 7
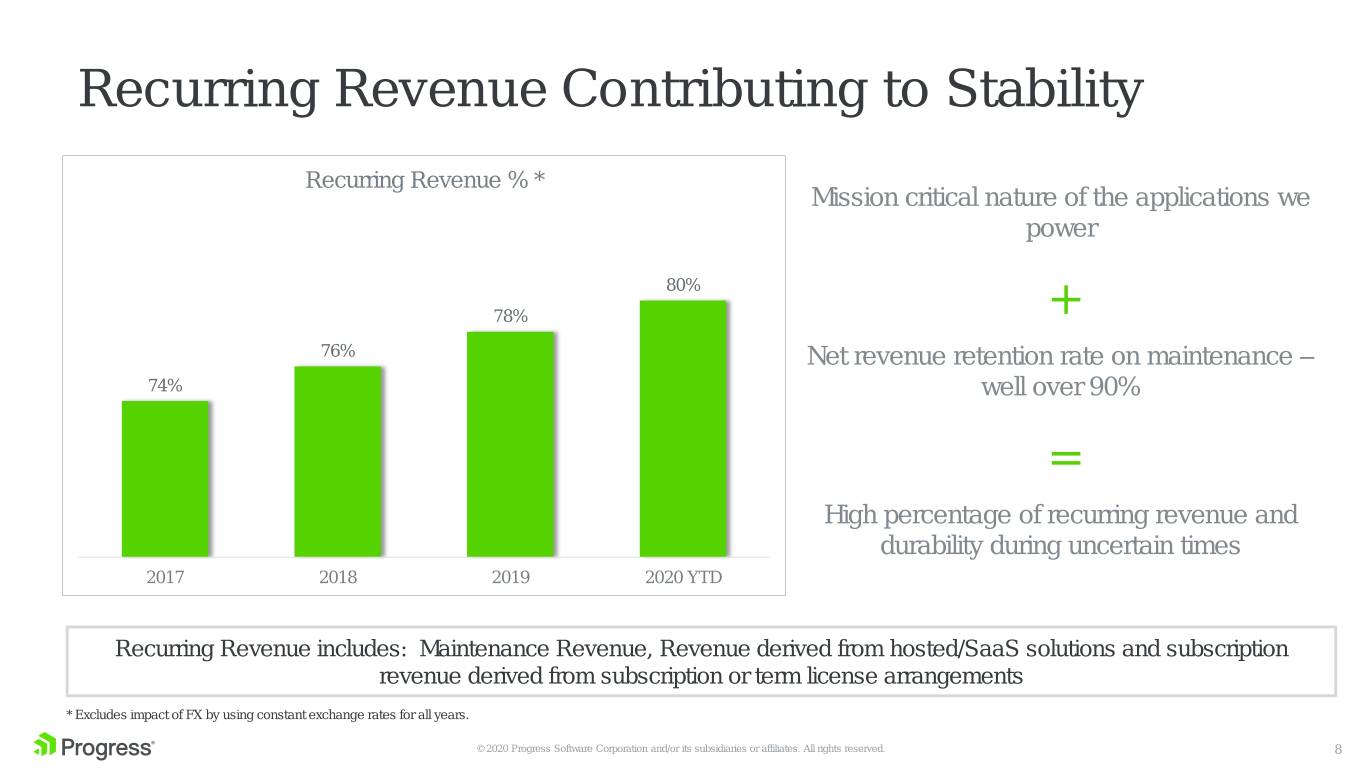
Recurring Revenue Contributing to Stability Recurring Revenue % * Mission critical nature of the applications we power 80% 78% + 76% Net revenue retention rate on maintenance – 74% well over 90% = High percentage of recurring revenue and durability during uncertain times 2017 2018 2019 2020 YTD Recurring Revenue includes: Maintenance Revenue, Revenue derived from hosted/SaaS solutions and subscription revenue derived from subscription or term license arrangements * Excludes impact of FX by using constant exchange rates for all years. © 2020 Progress Software Corporation and/or its subsidiaries or affiliates. All rights reserved. 8
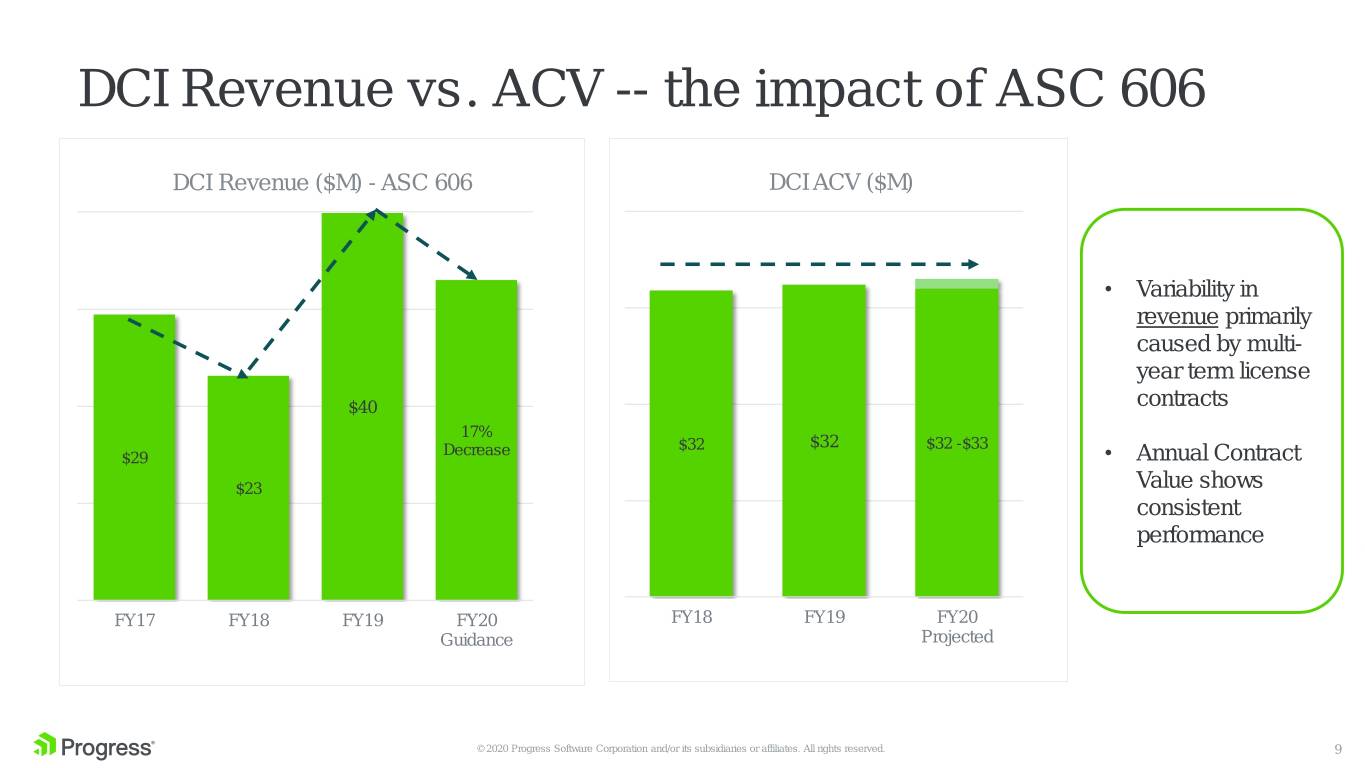
DCI Revenue vs. ACV -- the impact of ASC 606 DCI Revenue ($M) - ASC 606 DCI ACV ($M) • Variability in revenue primarily caused by multi- year term license $40 contracts 17% Decrease $32 $32 $32 -$33 $29 • Annual Contract $23 Value shows consistent performance FY17 FY18 FY19 FY20 FY18 FY19 FY20 Guidance Projected © 2020 Progress Software Corporation and/or its subsidiaries or affiliates. All rights reserved. 9

Driving Operating Leverage (% of non-GAAP revenue) Non-GAAP Operating Income Non-GAAP Operating Margin $180 40% $162 38% 35% $134 $132 34% 2017 2018 2019 2020 Guidance (Mid-point) 2017 2018 2019 2020 Guidance Focus on cost management and running a lean, profitable business Integrating acquisitions into our operating model drives more scale in operating margin (Ipswitch in May 2019) © 2020 Progress Software Corporation and/or its subsidiaries or affiliates. All rights reserved. 10
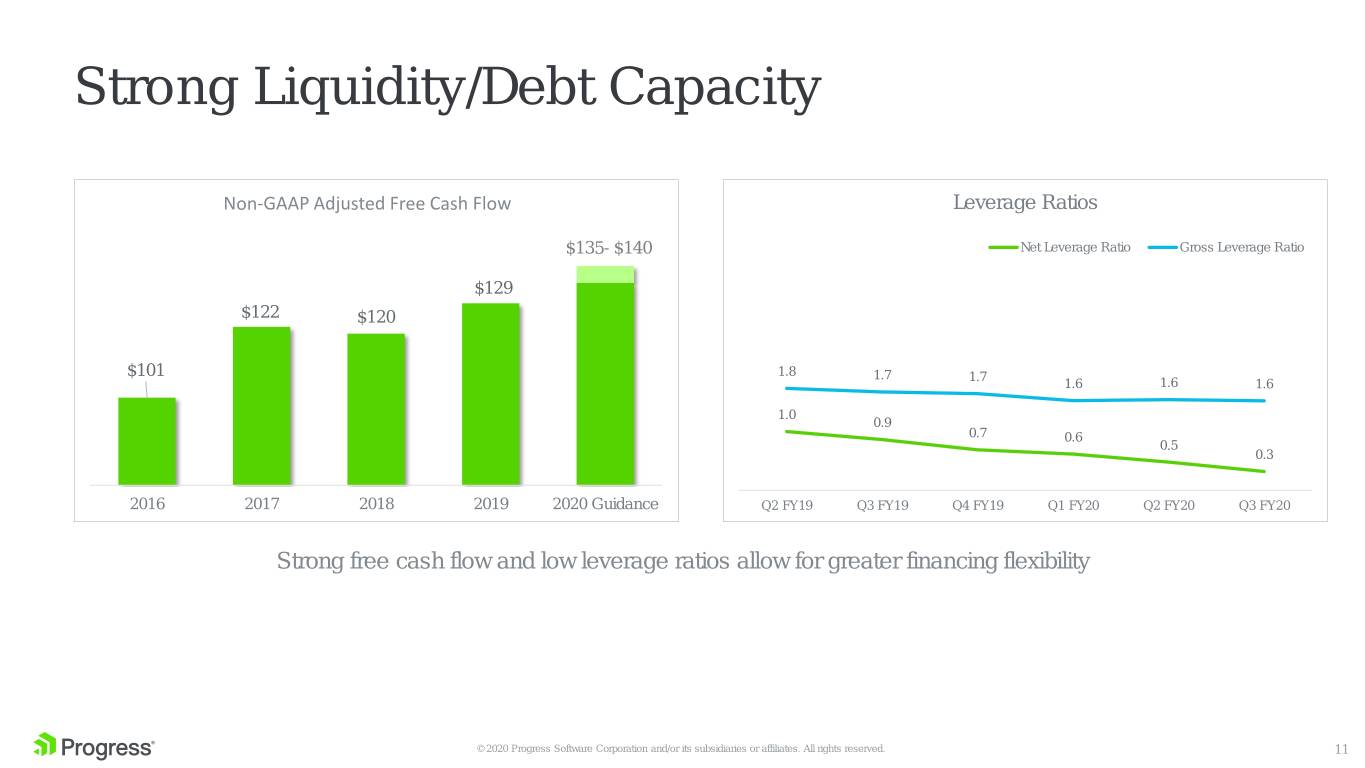
Strong Liquidity/Debt Capacity Non-GAAP Adjusted Free Cash Flow Leverage Ratios $135- $140 Net Leverage Ratio Gross Leverage Ratio $129 $122 $120 $101 1.8 1.7 1.7 1.6 1.6 1.6 1.0 0.9 0.7 0.6 0.5 0.3 2016 2017 2018 2019 2020 Guidance Q2 FY19 Q3 FY19 Q4 FY19 Q1 FY20 Q2 FY20 Q3 FY20 Strong free cash flow and low leverage ratios allow for greater financing flexibility © 2020 Progress Software Corporation and/or its subsidiaries or affiliates. All rights reserved. 11
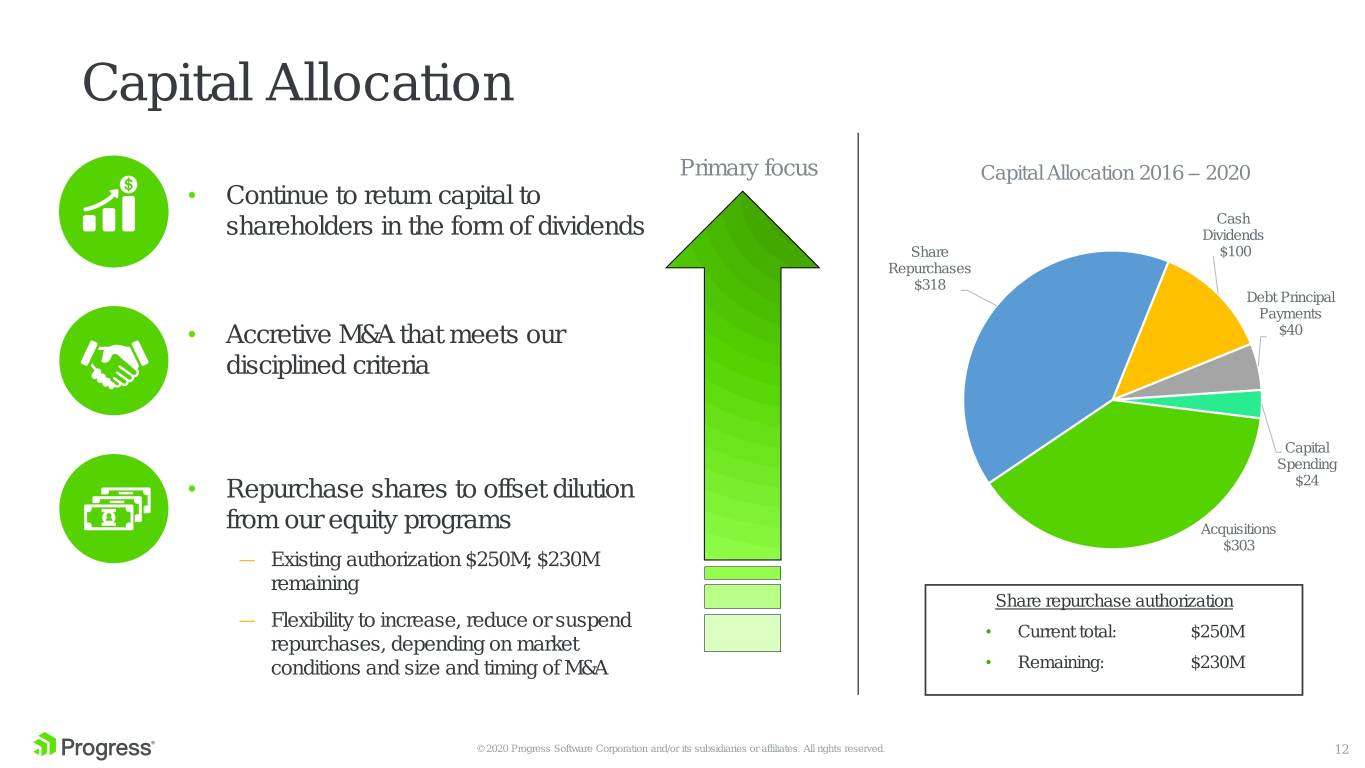
Capital Allocation Primary focus Capital Allocation 2016 – 2020 • Continue to return capital to Cash shareholders in the form of dividends Dividends Share $100 Repurchases $318 Debt Principal Payments • Accretive M&A that meets our $40 disciplined criteria Capital Spending • Repurchase shares to offset dilution $24 from our equity programs Acquisitions $303 — Existing authorization $250M; $230M remaining Share repurchase authorization — Flexibility to increase, reduce or suspend • Current total: $250M repurchases, depending on market conditions and size and timing of M&A • Remaining: $230M © 2020 Progress Software Corporation and/or its subsidiaries or affiliates. All rights reserved. 12
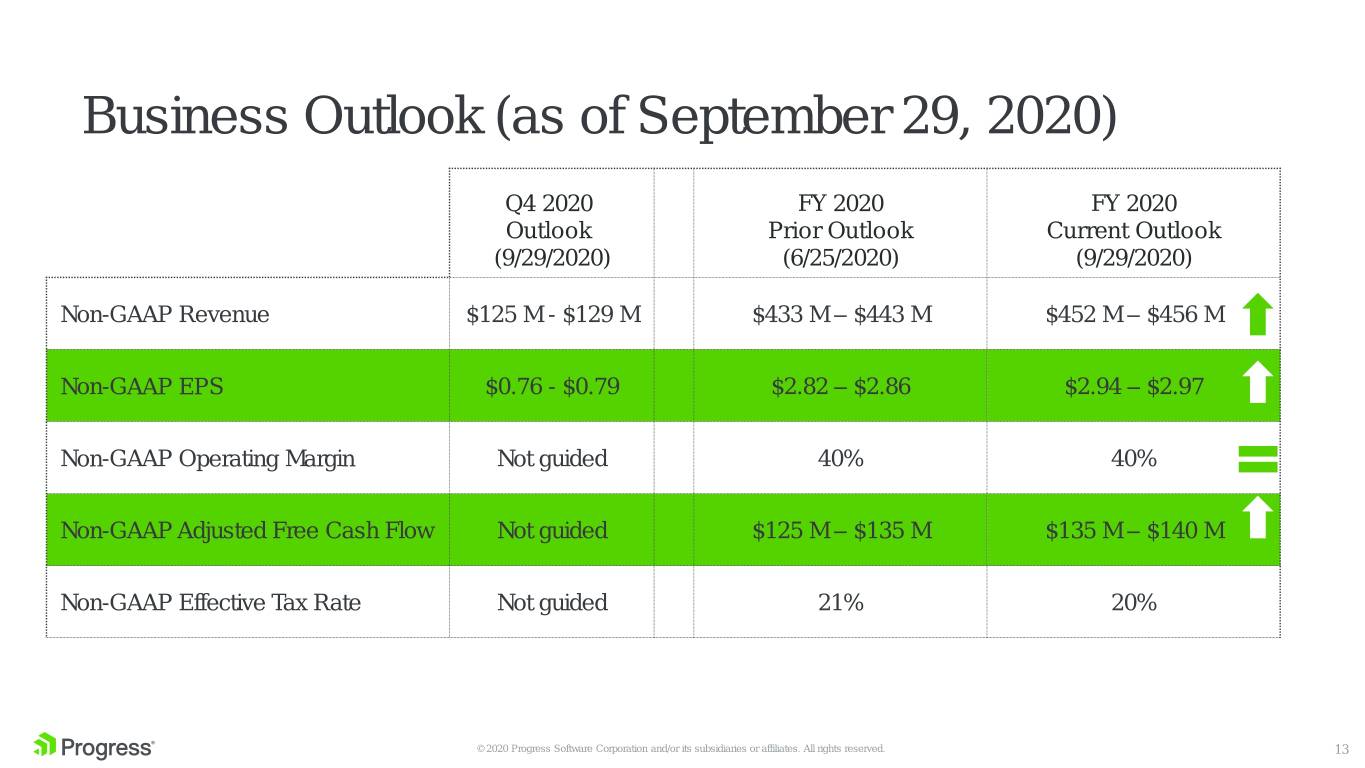
Business Outlook (as of September 29, 2020) Q4 2020 FY 2020 FY 2020 Outlook Prior Outlook Current Outlook (9/29/2020) (6/25/2020) (9/29/2020) Non-GAAP Revenue $125 M - $129 M $433 M – $443 M $452 M – $456 M Non-GAAP EPS $0.76 - $0.79 $2.82 – $2.86 $2.94 – $2.97 Non-GAAP Operating Margin Not guided 40% 40% Non-GAAP Adjusted Free Cash Flow Not guided $125 M – $135 M $135 M – $140 M Non-GAAP Effective Tax Rate Not guided 21% 20% © 2020 Progress Software Corporation and/or its subsidiaries or affiliates. All rights reserved. 13

Supplemental Financial Information
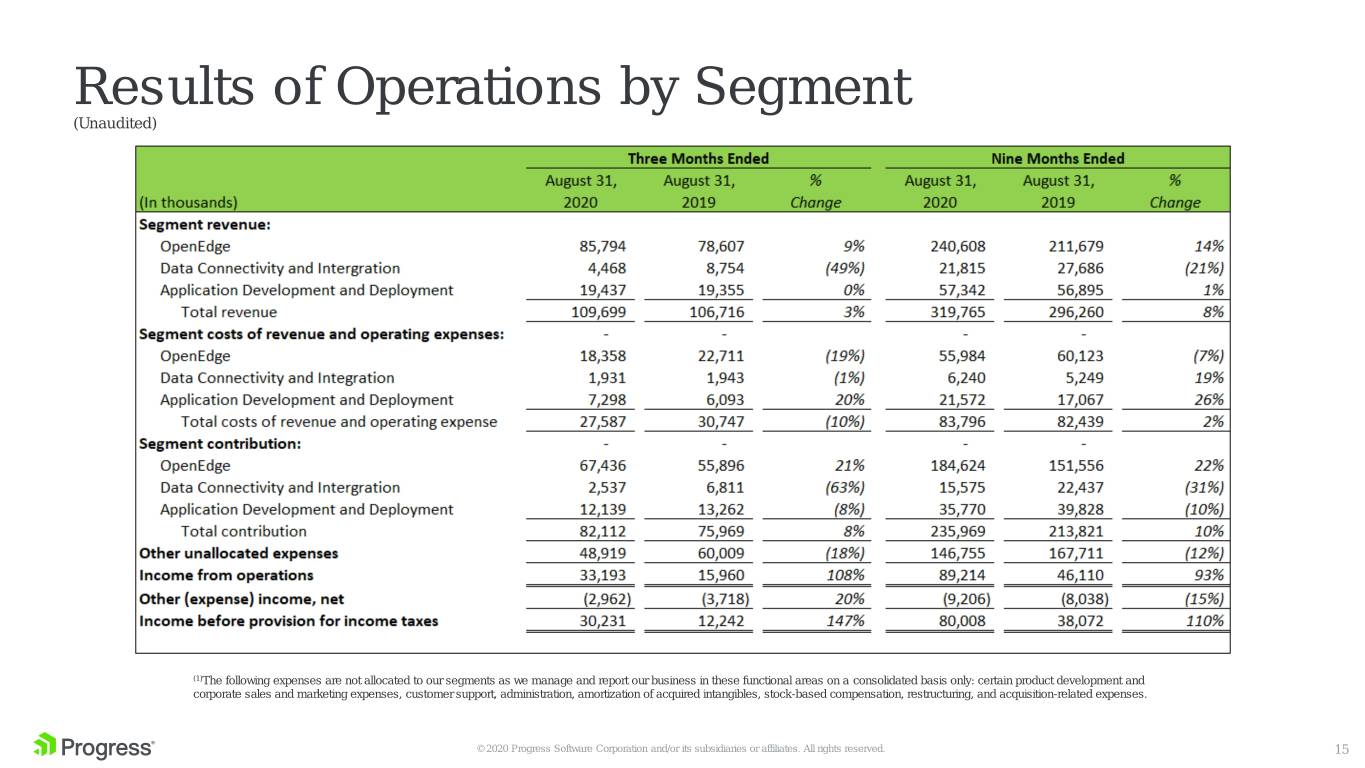
Results of Operations by Segment (Unaudited) (1)The following expenses are not allocated to our segments as we manage and report our business in these functional areas on a consolidated basis only: certain product development and corporate sales and marketing expenses, customer support, administration, amortization of acquired intangibles, stock-based compensation, restructuring, and acquisition-related expenses. © 2020 Progress Software Corporation and/or its subsidiaries or affiliates. All rights reserved. 15
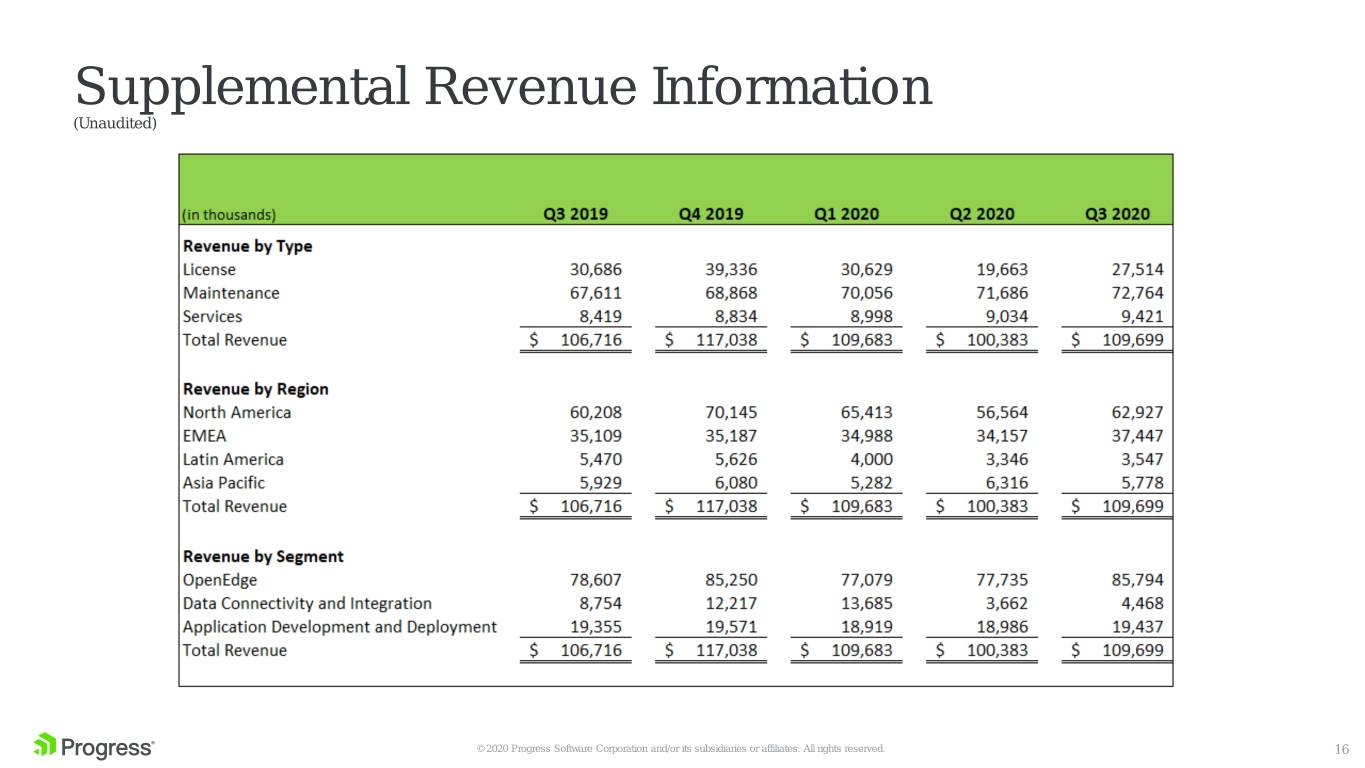
Supplemental Revenue Information (Unaudited) © 2020 Progress Software Corporation and/or its subsidiaries or affiliates. All rights reserved. 16

Other NON-GAAP Financial Measures (Unaudited) © 2020 Progress Software Corporation and/or its subsidiaries or affiliates. All rights reserved. 17

Other NON-GAAP Financial Measures (Unaudited) © 2020 Progress Software Corporation and/or its subsidiaries or affiliates. All rights reserved. 18


