UNITED STATES
SECURITIES AND EXCHANGE COMMISSION
Washington, D.C. 20549
FORM N-CSR
CERTIFIED SHAREHOLDER REPORT OF REGISTERED
MANAGEMENT INVESTMENT COMPANIES
Investment Company Act file number | 811-06338 | |||||||
| ||||||||
Columbia Balanced Fund, Inc. | ||||||||
(Exact name of registrant as specified in charter) | ||||||||
| ||||||||
One Financial Center, Boston, Massachusetts |
| 02111 | ||||||
(Address of principal executive offices) |
| (Zip code) | ||||||
| ||||||||
James R. Bordewick, Jr., Esq. | ||||||||
(Name and address of agent for service) | ||||||||
| ||||||||
Registrant’s telephone number, including area code: | 1-617-426-3750 |
| ||||||
| ||||||||
Date of fiscal year end: | August 31, 2006 |
| ||||||
| ||||||||
Date of reporting period: | February 28, 2006 |
| ||||||
Form N-CSR is to be used by management investment companies to file reports with the Commission not later than 10 days after the transmission to stockholders of any report that is required to be transmitted to stockholders under Rule 30e-1 under the Investment Company Act of 1940 (17 CFR 270.30e-1). The Commission may use the information provided on Form N-CSR in its regulatory, disclosure review, inspection, and policymaking roles.
A registrant is required to disclose the information specified by Form N-CSR, and the Commission will make this information public. A registrant is not required to respond to the collection of information contained in Form N-CSR unless the Form displays a currently valid Office of Management and Budget (“OMB”) control number. Please direct comments concerning the accuracy of the information collection burden estimate and any suggestions for reducing the burden to Secretary, Securities and Exchange Commission, 450 Fifth Street, NW, Washington, DC 20549-0609. The OMB has reviewed this collection of information under the clearance requirements of 44 U.S.C. § 3507.
Item 1. Reports to Stockholders.

Columbia Funds
Semiannual Report
February 28, 2006
Columbia International Stock Fund
Columbia Mid Cap Growth Fund
Columbia Small Cap Growth Fund I
Columbia Real Estate Equity Fund
Columbia Technology Fund
Columbia Strategic Investor Fund
Columbia Balanced Fund
Columbia Oregon Intermediate Municipal Bond Fund
Columbia Conservative High Yield Fund
PRESIDENT'S MESSAGE
Columbia Funds
Table of Contents
| Columbia International Stock Fund | 1 | ||||||
| Columbia Mid Cap Growth Fund | 4 | ||||||
| Columbia Small Cap Growth Fund I | 7 | ||||||
| Columbia Real Estate Equity Fund | 10 | ||||||
| Columbia Technology Fund | 13 | ||||||
| Columbia Strategic Investor Fund | 16 | ||||||
| Columbia Balanced Fund | 19 | ||||||
| Columbia Oregon Intermediate Municipal Bond Fund | 22 | ||||||
| Columbia Conservative High Yield Fund | 25 | ||||||
| Financial Statements | 28 | ||||||
| Board Consideration and Approval of Investment Advisory Agreements | 151 | ||||||
| Summary of Management Fee Evaluation by Independent Fee Consultant | 154 | ||||||
| Columbia Funds | 158 | ||||||
| Important Information About This Report | 161 | ||||||
A message to our valued clients
In the mutual fund business, success can be measured a number of different ways. Performance is a key measure—the one that gains most attention. But fees and service are also important. In that regard, we are pleased to report that Columbia Management has experienced success on all three fronts over the past year. Even more important, our shareholders have benefited from this success.
Because performance ultimately determines investment success, we have devoted considerable energy to improving the performance of all Columbia funds. And we are happy to report that we have made considerable progress toward this important goal1.
Columbia has also taken great strides toward making fund operations more cost effective, which has translated into lower expense ratios on many Columbia funds. In this regard, we believe we still have more work to do, and we will continue to explore opportunities for reining in expenses to the benefit of all our shareholders.
On the service front, we have made it easy and convenient for shareholders to do business with us both on the web at www.columbiafunds.com or over the phone at 800.345.6611. In fact, we've recently upgraded our automated phone system with an advanced speech recognition system that allows callers to interact with the system using natural spoken commands.
After secure login, shareholders can buy, sell or exchange funds either online or over the phone. (Buying shares requires that a link has been established between the shareholder's bank account and Columbia.) Up-to-date performance and pricing information is available online and over the phone. At www.columbiafunds.com, shareholders can also update important personal information and get access to prospectuses and fund reports, which reduces paper clutter for shareholders and translates into a reduction of costs for the funds.
At Columbia Management, we think that you'll like what you see as you read the reports for the period ended February 28, 2006. We are committed to continued improvements in an effort to help our shareholders reach their long-term financial goals. And we look forward to continuing to work with you, our valued financial clients, in the years to come.
Sincerely,

Christopher L. Wilson
President, Columbia Funds

The views expressed in the President's Message reflect the current views of Columbia Funds. These views are not guarantees of future performance and involve certain risks, uncertainties and assumptions that are difficult to predict so actual outcomes and results may differ significantly from the views expressed. These views are subject to change at any time based upon economic, market or other conditions and Columbia Funds disclaims any responsibility to update such views. These views may not be relied on as investment advice and, because investment decisions for a Columbia Fund are based on numerous factors, may not be relied on as an indication of trading intent on behalf of any particular Columbia Fund. References to specific company securities should not be construed as a recommendation or investment advice.
Not FDIC
Insured
May Lose Value
No Bank Guarantee
1Past performance is no guarantee of future results.
Performance Information – Columbia International Stock Fund
Performance data quoted represents past performance and current performance may be lower or higher. Past performance is no guarantee of future results. The investment return and principal value will fluctuate so that shares, when redeemed, may be worth more or less than the original cost. Please visit www.columbiafunds.com for daily and most recent month-end performance updates.
Growth of a $10,000 investment 03/01/96 – 02/28/06 ($)
| Share class | |||||||||||
| Sales charge | without | with | |||||||||
| Class A | 21,709 | 20,458 | |||||||||
| Class B | 21,124 | 21,124 | |||||||||
| Class C | 21,208 | 21,208 | |||||||||
| Class D | 21,268 | 21,061 | |||||||||
| Class G | 21,122 | 21,122 | |||||||||
| Class Z | 22,052 | n/a | |||||||||
The table above shows the growth in value of a hypothetical $10,000 investment in each share class of Columbia International Stock Fund during the stated time period, and does not reflect the deduction of taxes that a shareholder would pay on fund distributions or the redemption of fund shares.
| Net asset value per share | |||||||
| as of 02/28/06 ($) | |||||||
| Class A | 17.72 | ||||||
| Class B | 17.36 | ||||||
| Class C | 17.43 | ||||||
| Class D | 17.48 | ||||||
| Class G | 17.35 | ||||||
| Class Z | 17.82 | ||||||
| Distributions declared per share | |||||||
| 09/01/05 – 02/28/06 ($) | |||||||
| Class A | 0.30 | ||||||
| Class B | 0.18 | ||||||
| Class C | 0.18 | ||||||
| Class D | 0.18 | ||||||
| Class G | 0.19 | ||||||
| Class Z | 0.34 | ||||||
Average annual total return as of 02/28/06 (%)
| Share class | A | B | C | D | G | Z | |||||||||||||||||||||||||||||||||||||||||
| Inception date | 11/01/02 | 11/01/02 | 10/13/03 | 11/01/02 | 03/18/05 | 10/01/92 | |||||||||||||||||||||||||||||||||||||||||
| Sales charge | without | with | without | with | without | with | without | with | without | with | without | ||||||||||||||||||||||||||||||||||||
| 6-month (cumulative) | 14.43 | 7.85 | 14.19 | 9.19 | 14.20 | 13.20 | 14.16 | 13.16 | 14.18 | 9.18 | 14.66 | ||||||||||||||||||||||||||||||||||||
| 1-year | 17.71 | 10.94 | 17.01 | 12.01 | 17.09 | 16.09 | 16.95 | 15.95 | 17.00 | 12.00 | 18.17 | ||||||||||||||||||||||||||||||||||||
| 5-year | 5.46 | 4.22 | 4.88 | 4.55 | 4.97 | 4.97 | 5.03 | 4.82 | 4.88 | 4.38 | 5.79 | ||||||||||||||||||||||||||||||||||||
| 10-year | 8.06 | 7.42 | 7.76 | 7.76 | 7.81 | 7.81 | 7.84 | 7.73 | 7.76 | 7.76 | 8.23 | ||||||||||||||||||||||||||||||||||||
Average annual total return as of 12/31/05 (%)
| Share class | A | B | C | D | G | Z | |||||||||||||||||||||||||||||||||||||||||
| Sales charge | without | with | without | with | without | with | without | with | without | with | without | ||||||||||||||||||||||||||||||||||||
| 6- month (cumulative) | 15.72 | 9.06 | 15.43 | 10.43 | 15.51 | 14.51 | 15.46 | 14.46 | 15.41 | 10.41 | 15.96 | ||||||||||||||||||||||||||||||||||||
| 1-year | 13.26 | 6.75 | 12.53 | 7.53 | 12.63 | 11.63 | 12.51 | 11.51 | 12.52 | 7.52 | 13.66 | ||||||||||||||||||||||||||||||||||||
| 5-year | 3.03 | 1.82 | 2.50 | 2.13 | 2.58 | 2.58 | 2.64 | 2.44 | 2.49 | 1.94 | 3.35 | ||||||||||||||||||||||||||||||||||||
| 10-year | 7.60 | 6.96 | 7.32 | 7.32 | 7.36 | 7.36 | 7.40 | 7.29 | 7.32 | 7.32 | 7.76 | ||||||||||||||||||||||||||||||||||||
The "with sales charge" returns include the maximum initial sales charge of 5.75% for class A shares, maximum contingent deferred sales charge of 5.00% for class B and G shares and 1.00% for class C and D shares for the first year only. The "without sales charge" returns do not include the effect of sales charges. If they had, returns would have been lower.
Performance results reflect any voluntary waivers or reimbursement of fund expenses by the advisor or its affiliates. Absent these waivers or reimbursement arrangements, performance results would have been lower.
Class Z shares are sold at net asset value with no Rule 12b-1 fees. Class Z shares have limited eligibility and the investment minimum requirement may vary. All results shown assume reinvestment of distributions. Please see the fund's prospectus for details. Performance for different share classes will vary based on differences in sales charges and fees associated with each class.
Effective October 13, 2003, class D shares are closed to all new investors and new accounts. Existing class D shareholders will be able to make additional purchases at any time. In addition, the class D sales charge of 1.00% is waived after October 13, 2003.
Classes A, B and D (newer class shares) share performance information includes returns of the fund's class Z shares (the oldest existing fund class) for periods prior to the inception of the newer class shares. The returns for Class C include the returns of Class B prior to 10/13/03, the date on which class C was initially offered by the fund. The returns shown for Class C also include the performance of Class Z prior to the inception of Class B (11/01/02). Class G performance information includes returns of the fund's Class B shares for the period from 11/01/02 through 03/18/05 and for periods prior thereto, the fund's Class Z shares. Class Z share returns are not restated to reflect any expense differential (e.g., Rule 12b-1 fees) between class Z shares and the newer class shares. Had the expense differential been reflected, the returns for the periods prior to the inception of classes A, B, C, D and G would have been lower.
1
Fund Profile – Columbia International Stock Fund
Performance data quoted represents past performance and current performance may be lower or higher. Past performance is no guarantee of future results. The investment return and principal value will fluctuate so that shares, when redeemed, may be worth more or less than the original cost. Please visit www.columbiafunds.com for daily and most recent month-end performance updates.
Summary
+14.43%
 Class A Shares
+15.14%
 MSCI EAFE Index
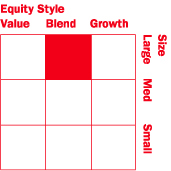
Management Style
Summary
n For the six-month period ended February 28, 2006, the Columbia International Stock Fund's Class A Shares returned 14.43% without sales charge. The fund's return was lower than its benchmarks, the MSCI EAFE Index, which returned 15.14%, and the MSCI All Country World ex US Index, which returned 17.09%.1 The fund fell just short of the average return of its peer group, the Morningstar Foreign Large Blend Fund Category, which was 14.95%.2
n The fund's out-of-benchmark weight in emerging markets and an above-average weight in Japan detracted from performance. Both markets aided performance in previous periods, and some of the fund's best performers came from emerging and Japanese stock markets during this reporting period. The fund has retained its exposure to both regions. Emerging markets, in particular, appear to offer some of the best opportunities for long-term growth despite intermittent volatility.
n A reduction in the fund's energy position was timely as it locked in gains for the fund before energy commodity prices began to decline – and energy stock prices along with them. A decision to underweight the United Kingdom (UK) also aided performance. A relatively tight monetary policy had a negative impact on UK stocks, and the UK was one of the worst-performing markets for the period.
1 The MSCI EAFE Index is a free float-adjusted market capitalization index that is designed to measure developed market equity performance, excluding the US and Canada. The MSCI All Country World Ex US Index is also an index of global stock market performance that includes developed and emerging markets but excludes the US. Unlike the fund, indices are not investments, do not incur fees or expenses and are not professionally managed. It is not possible to invest directly in an index. Securities in the fund may not match those in an index.
2 ©2006 by Morningstar, Inc. All rights reserved. The information contained herein is the proprietary information of Morningstar, Inc. may not be copied or redistributed for any purpose and may only be used for non-commercial, personal purposes. The information contained herein is not represented or warranted to be accurate, complete or timely. Morningstar, Inc. shall not be responsible for investment decisions, damages or other losses resulting from use of this information. Morningstar, Inc. has not granted consent for it to be considered or deemed an "expert" under the Securities Act of 1933.
Portfolio Management
Fred Copper, CFA
n With the fund since 2005
n MBA, University of Chicago; BS, Boston College
Equity investments are affected by stock market fluctuations that occur in response to economic and business developments.
International investing may involve certain risks, including foreign taxation, currency fluctuations, risks associated with possible differences in financial standards and other monetary and political risks.
Management style is determined by Columbia Management and is based on the investment strategy and process as outlined in the fund's prospectus.
2
UNDERSTANDING YOUR EXPENSES
Columbia International Stock Fund
Estimating your actual expenses
To estimate the expenses that you paid over the period, first you will need your account balance at the end of the period:
n For shareholders who receive their account statements from Columbia Management Services, Inc., your account balance is available online at www.columbiafunds.com or by calling Shareholder Services at 800.345.6611.
n For shareholders who receive their account statements from their brokerage firm, contact your brokerage firm to obtain your account balance.
1. Divide your ending account balance by $1,000. For example, if an account balance was $8,600 at the end of the period, the result would be 8.6.
2. In the section of the table below titled "Expenses paid during the period," locate the amount for your share class. You will find this number is in the column labeled "actual." Multiply this number by the result from step 1. Your answer is an estimate of the expenses you paid on your account during the period.
As a fund shareholder, you incur two types of costs. There are transaction costs, which generally include sales charges on purchases and may include redemption or exchange fees. There are also ongoing costs, which generally include investment advisory, Rule 12b-1 fees and other fund expenses. The information on this page is intended to help you understand your ongoing costs of investing in the fund and to compare these costs with the ongoing costs of investing in other mutual funds.
Analyzing your fund's expenses by share class
To illustrate these ongoing costs, we have provided an example and calculated the expenses paid by investors in each share class during the reporting period. The information in the following table is based on an initial investment of $1,000, which is invested at the beginning of the reporting period and held for the entire period. Expense information is calculated two ways and each method provides you with different information. The amount listed in the "actual" column is calculated using the fund's actual operating expenses and total return for the period. The amount listed in the "hypothetical" column for each share class assumes that the return each year is 5% before expenses and includes the fund's actual expense ratio. You should not use the hypothetical account values and expenses to estimate either your actual account balance at the end of the period or the expenses you paid during this reporting period.
09/01/05 – 02/28/06
| Account value at the beginning of the period ($) | Account value at the end of the period ($) | Expenses paid during the period ($) | Fund's annualized expense ratio (%) | ||||||||||||||||||||||||||||
| Actual | Hypothetical | Actual | Hypothetical | Actual | Hypothetical | ||||||||||||||||||||||||||
| Class A | 1,000.00 | 1,000.00 | 1,144.30 | 1,018.94 | 6.27 | 5.91 | 1.18 | ||||||||||||||||||||||||
| Class B | 1,000.00 | 1,000.00 | 1,141.92 | 1,015.22 | 10.25 | 9.64 | 1.93 | ||||||||||||||||||||||||
| Class C | 1,000.00 | 1,000.00 | 1,142.02 | 1,015.22 | 10.25 | 9.64 | 1.93 | ||||||||||||||||||||||||
| Class D | 1,000.00 | 1,000.00 | 1,141.58 | 1,015.22 | 10.25 | 9.64 | 1.93 | ||||||||||||||||||||||||
| Class G | 1,000.00 | 1,000.00 | 1,141.82 | 1,015.47 | 9.98 | 9.39 | 1.88 | ||||||||||||||||||||||||
| Class Z | 1,000.00 | 1,000.00 | 1,146.59 | 1,020.18 | 4.95 | 4.66 | 0.93 | ||||||||||||||||||||||||
Expenses paid during the period are equal to the fund's respective class annualized expense ratio, multiplied by the average account value over the period, then multiplied by the number of days in the fund's most recent fiscal half-year and divided by 365.
Had the transfer agent not waived a portion of expenses, total return would have been reduced.
It is important to note that the expense amounts shown in the table are meant to highlight only ongoing costs of investing in the fund and do not reflect any transaction costs, such as sales charges, redemption or exchange fees. Therefore, the hypothetical examples provided will not help you determine the relative total costs of owning shares of different funds. If these transaction costs were included, your costs would have been higher.
Compare with other funds
Since all mutual funds are required to include the same hypothetical calculations about expenses in shareholder reports, you can use this information to compare the ongoing cost of investing in the fund with other funds. To do so, compare the 5% hypothetical example with the 5% hypothetical examples that appear in the shareholder reports of other funds. As you compare hypothetical examples of other fund companies, it is important to note that hypothetical examples are meant to highlight the continuing cost of investing in a fund and do not reflect any transaction costs, such as sales charges or redemption or exchange fees.
3
Performance Information – Columbia Mid Cap Growth Fund
Performance data quoted represents past performance and current performance may be lower or higher. Past performance is no guarantee of future results. The investment return and principal value will fluctuate so that shares, when redeemed, may be worth more or less than the original cost. Please visit www.columbiafunds.com for daily and most recent month-end performance updates.
Growth of a $10,000 investment 03/01/96 – 02/28/06 ($)
| Share class | |||||||||||
| Sales charge | without | with | |||||||||
| Class A | 22,969 | 21,645 | |||||||||
| Class B | 22,404 | 22,404 | |||||||||
| Class C | 22,449 | 22,449 | |||||||||
| Class D | 22,422 | 22,202 | |||||||||
| Class G | 22,350 | 22,350 | |||||||||
| Class R | 22,960 | n/a | |||||||||
| Class T | 23,005 | 21,679 | |||||||||
| Class Z | 23,256 | n/a | |||||||||
The table above shows the growth in value of a hypothetical $10,000 investment in each share class of Columbia Mid Cap Growth Fund during the stated time period, and does not reflect the deduction of taxes that a shareholder would pay on fund distributions or the redemption of fund shares.
| Net asset value per share | |||||||
| as of 02/28/06 ($) | |||||||
| Class A | 25.29 | ||||||
| Class B | 24.66 | ||||||
| Class C | 24.71 | ||||||
| Class D | 24.68 | ||||||
| Class G | 24.60 | ||||||
| Class R | 25.28 | ||||||
| Class T | 25.33 | ||||||
| Class Z | 25.61 | ||||||
| Distributions declared per share | |||||||
| 09/01/05 – 02/28/06 ($) | |||||||
| Class A | 0.31 | ||||||
| Class B | 0.31 | ||||||
| Class C | 0.31 | ||||||
| Class D | 0.31 | ||||||
| Class G | 0.31 | ||||||
| Class R | 0.00 | ||||||
| Class T | 0.31 | ||||||
| Class Z | 0.31 | ||||||
Average annual total return as of 02/28/06 (%)
| Share class | A | B | C | D | G | R | T | Z | |||||||||||||||||||||||||||||||||||||||||||||||||||
| Inception | 11/01/02 | 11/01/02 | 10/13/03 | 11/01/02 | 11/01/02 | 01/23/06 | 11/01/02 | 11/20/85 | |||||||||||||||||||||||||||||||||||||||||||||||||||
| Sales charge | without | with | without | with | without | with | without | with | without | with | without | without | with | without | |||||||||||||||||||||||||||||||||||||||||||||
| 6-month (cumulative) | 15.61 | 8.97 | 15.21 | 10.21 | 15.18 | 14.18 | 15.20 | 14.20 | 15.25 | 10.25 | 15.57 | 15.59 | 8.96 | 15.75 | |||||||||||||||||||||||||||||||||||||||||||||
| 1-year | 24.43 | 17.27 | 23.53 | 18.53 | 23.53 | 22.53 | 23.50 | 22.50 | 23.60 | 18.60 | 24.38 | 24.38 | 17.22 | 24.71 | |||||||||||||||||||||||||||||||||||||||||||||
| 5-year | 3.44 | 2.22 | 2.92 | 2.57 | 2.97 | 2.97 | 2.94 | 2.73 | 2.88 | 2.33 | 3.43 | 3.47 | 2.26 | 3.70 | |||||||||||||||||||||||||||||||||||||||||||||
| 10-year | 8.67 | 8.03 | 8.40 | 8.40 | 8.42 | 8.42 | 8.41 | 8.30 | 8.69 | 8.37 | 8.67 | 8.69 | 8.04 | 8.81 | |||||||||||||||||||||||||||||||||||||||||||||
Average annual total return as of 12/31/05 (%)
| Share class | A | B | C | D | G | T | Z | ||||||||||||||||||||||||||||||||||||||||||||||||
| Sales charge | without | with | without | with | without | with | without | with | without | with | without | with | without | ||||||||||||||||||||||||||||||||||||||||||
| 6-month (cumulative) | 14.68 | 8.09 | 14.24 | 9.24 | 14.26 | 13.26 | 14.23 | 13.23 | 14.23 | 9.23 | 14.65 | 8.05 | 14.81 | ||||||||||||||||||||||||||||||||||||||||||
| 1- year | 16.08 | 9.41 | 15.20 | 10.20 | 15.22 | 14.22 | 15.19 | 14.19 | 15.25 | 10.25 | 16.05 | 9.39 | 16.36 | ||||||||||||||||||||||||||||||||||||||||||
| 5- year | -0.83 | -2.00 | -1.30 | -1.67 | -1.25 | -1.25 | -1.28 | -1.48 | -1.35 | -1.91 | -0.79 | -1.96 | -0.59 | ||||||||||||||||||||||||||||||||||||||||||
| 10-Year | 8.26 | 7.62 | 8.01 | 8.01 | 8.03 | 8.03 | 8.01 | 7.90 | 7.98 | 7.98 | 8.28 | 7.64 | 8.39 | ||||||||||||||||||||||||||||||||||||||||||
The "with sales charge" returns include the maximum initial sales charge of 5.75% for class A and T shares, maximum contingent deferred sales charge of 5.00% for class B and G shares and 1.00% for class C and D shares for the first year only. The "without sales charge" returns do not include the effect of sales charges. If they had, returns would have been lower.
Performance results reflect any voluntary waivers or reimbursement of fund expenses by the advisor or its affiliates. Absent these waivers or reimbursement arrangements, performance results would have been lower.
Class R and Class Z shares are sold at net asset value with no Rule 12b-1 fees. Class R and Class Z shares have limited eligibility and the investment minimum requirement may vary. All results shown assume reinvestment of distributions. Please see the fund's prospectus for details. Performance for different share classes will vary based on differences in sales charges and fees associated with each class.
Effective October 13, 2003, class D shares are closed to all new investors and new accounts. Existing class D shareholders will be able to make additional purchases at any time. In addition, the class D sales charge of 1.00% is waived after October 13, 2003.
Classes A, B, D, G and T (newer class shares) share performance information includes returns of the fund's class Z shares (the oldest existing fund class) for periods prior to the inception of the newer class shares. The returns for class C include the returns of class B prior to 10/13/03, the date on which class C was initially offered by the fund. The returns shown for class C also include the performance of class Z prior to the inception of class B (11/01/02). The returns for class R include the returns of class A prior to 01/23/06, the date on which class R was initially offered by the fund. The returns shown for class R also include the performance of class Z prior to the inception of class A (11/01/02). Class Z share returns are not restated to reflect any expense differential (e.g., Rule 12b-1 fees) between class Z shares and the newer class shares. Had the expense differential been reflected, the returns for the periods prior to the inception of classes A, B, C, D, G and T would have been lower.
4
Fund Profile – Columbia Mid Cap Growth Fund
Performance data quoted represents past performance and current performance may be lower or higher. Past performance is no guarantee of future results. The investment return and principal value will fluctuate so that shares, when redeemed, may be worth more or less than the original cost. Please visit www.columbiafunds.com for daily and most recent month-end performance updates.
Summary
+15.61%
 Class A Shares
+8.90%
 Russell Midcap Index
+9.69%
 Russell Midcap Growth Index
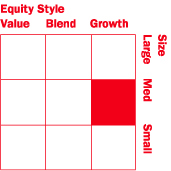
Management Style
Summary
n For the six-month period that ended February 28, 2006, the Columbia Mid Cap Growth Fund's Class A Shares returned 15.61% without sales charge. It outperformed both the Russell Midcap Index and the Russell Midcap Growth Index,1 which returned 8.90% and 9.69%, respectively, for the same period. Its return was also higher than the average return of the Morningstar Mid Cap Growth Funds Category, which was 10.66%.2 Strong stock selection across a variety of sectors accounted for the fund's strong performance.
n Stock selection within technology, industrials, health care, financials and telecommunications services made a significant contribution to the fund's return relative to its benchmarks and peer group. The fund's top contributor was Broadcom Corp. (3.0% of net assets), in the technology sector, which enjoyed strong profit growth as the result of higher-than-expected gross margins. Consumer staples stocks were the fund's weakest performers. Tyson Foods, Inc. (0.2% of net assets) was the fund's worst performer, as the company struggled to improve its profit margins.
n In an environment of healthy economic growth and relatively low inflation, the fund's managers maintain a bullish outlook for growth stocks, especially within the energy, materials and industrials sectors. However, decelerating growth could provoke a reassessment of the strength and duration of the current economic expansion. The fund's managers plan to continue to seek the stocks of growth companies with strong earnings prospects and attractive valuations.
1 The Russell Midcap Index is an index that measures the performance of the 800 smallest companies in the Russell 1000 Index, as ranked by total market capitalization. The Russell Midcap Growth Index is an index that measures the performance of those Russell Midcap companies with higher price-to-book ratios and higher forecasted growth values. Unlike the fund, indices are not investments, they do not incur fees or expenses and are not professionally managed. It is not possible to invest directly in an index. Securities in the fund may not match those in an index.
2 ©2006 by Morningstar, Inc. All rights reserved. The information contained herein is the proprietary information of Morningstar, Inc. may not be copied or redistributed for any purpose and may only be used for non-commercial, personal purposes. The information contained herein is not represented or warranted to be accurate, complete or timely. Morningstar, Inc. shall not be responsible for investment decisions, damages or other losses resulting from use of this information. Morningstar, Inc. has not granted consent for it to be considered or deemed an "expert" under the Securities Act of 1933.
Portfolio Management
Kenneth A. Korngiebel, CFA
n With the fund since 2004
n MBA, Wharton School at University of Pennsylvania; BA, Stanford University
Wayne M. Collette, CFA
n With the fund since 2006
n MBA, Columbia University; BS, Brandeis University
J. Michael Kosicki, CFA
n With the fund since 2006
n BA, Hamilton College
George J. Myers, CFA
n With the fund since 2006
n MS, University of Wisconsin; BBA, University of Wisconsin
Theodore R. Wendell, CFA
n With the fund since 2006
n MBA, Columbia University; BA, Emory University
Equity investments are affected by stock market fluctuations that occur in response to economic and business developments.
Investing in growth stocks incurs the possibility of losses because their prices are sensitive to changes in current or expected earnings.
Investing in mid-cap stocks may present special risks, including possible illiquidity and greater price volatility than stocks of larger, more established companies.
Management style is determined by Columbia Management and is based on the investment strategy and process as outlined in the fund's prospectus.
5
UNDERSTANDING YOUR EXPENSES
Columbia Mid Cap Growth Fund
Estimating your actual expenses
To estimate the expenses that you paid over the period, first you will need your account balance at the end of the period:
n For shareholders who receive their account statements from Columbia Management Services, Inc., your account balance is available online at www.columbiafunds.com or by calling Shareholder Services at 800.345.6611.
n For shareholders who receive their account statements from their brokerage firm, contact your brokerage firm to obtain your account balance.
1. Divide your ending account balance by $1,000. For example, if an account balance was $8,600 at the end of the period, the result would be 8.6.
2. In the section of the table below titled "Expenses paid during the period," locate the amount for your share class. You will find this number is in the column labeled "actual." Multiply this number by the result from step 1. Your answer is an estimate of the expenses you paid on your account during the period.
As a fund shareholder, you incur two types of costs. There are transaction costs, which generally include sales charges on purchases and may include redemption or exchange fees. There are also ongoing costs, which generally include investment advisory, Rule 12b-1 fees and other fund expenses. The information on this page is intended to help you understand your ongoing costs of investing in the fund and to compare these costs with the ongoing costs of investing in other mutual funds.
Analyzing your fund's expenses by share class
To illustrate these ongoing costs, we have provided an example and calculated the expenses paid by investors in each share class during the reporting period. The information in the following table is based on an initial investment of $1,000, which is invested at the beginning of the reporting period and held for the entire period. Expense information is calculated two ways and each method provides you with different information. The amount listed in the "actual" column is calculated using the fund's actual operating expenses and total return for the period. The amount listed in the "hypothetical" column for each share class assumes that the return each year is 5% before expenses and includes the fund's actual expense ratio. You should not use the hypothetical account values and expenses to estimate either your actual account balance at the end of the period or the expenses you paid during this reporting period.
09/01/05 – 02/28/06
| Account value at the beginning of the period ($) | Account value at the end of the period ($) | Expenses paid during the period ($) | Fund's annualized expense ratio (%) | ||||||||||||||||||||||||||||
| Actual | Hypothetical | Actual | Hypothetical | Actual | Hypothetical | ||||||||||||||||||||||||||
| Class A | 1,000.00 | 1,000.00 | 1,156.11 | 1,018.94 | 6.31 | 5.91 | 1.18 | ||||||||||||||||||||||||
| Class B | 1,000.00 | 1,000.00 | 1,152.09 | 1,015.22 | 10.30 | 9.64 | 1.93 | ||||||||||||||||||||||||
| Class C | 1,000.00 | 1,000.00 | 1,151.79 | 1,015.22 | 10.30 | 9.64 | 1.93 | ||||||||||||||||||||||||
| Class D | 1,000.00 | 1,000.00 | 1,151.99 | 1,015.22 | 10.30 | 9.64 | 1.93 | ||||||||||||||||||||||||
| Class G | 1,000.00 | 1,000.00 | 1,152.49 | 1,015.47 | 10.03 | 9.39 | 1.88 | ||||||||||||||||||||||||
| Class R | 1,000.00 | 1,000.00 | 1,155.70 | 1,017.55 | 1.72 | 7.30 | 1.46 | ||||||||||||||||||||||||
| Class T | 1,000.00 | 1,000.00 | 1,155.91 | 1,018.70 | 6.57 | 6.16 | 1.23 | ||||||||||||||||||||||||
| Class Z | 1,000.00 | 1,000.00 | 1,157.49 | 1,020.18 | 4.97 | 4.66 | 0.93 | ||||||||||||||||||||||||
Expenses paid during the period are equal to the fund's respective class annualized expense ratio, multiplied by the average account value over the period, then multiplied by the number of days in the fund's most recent fiscal half-year and divided by 365.
Had the transfer agent not waived a portion of expenses, total return would have been reduced.
It is important to note that the expense amounts shown in the table are meant to highlight only ongoing costs of investing in the fund and do not reflect any transaction costs, such as sales charges, redemption or exchange fees. Therefore, the hypothetical examples provided will not help you determine the relative total costs of owning shares of different funds. If these transaction costs were included, your costs would have been higher.
Compare with other funds
Since all mutual funds are required to include the same hypothetical calculations about expenses in shareholder reports, you can use this information to compare the ongoing cost of investing in the fund with other funds. To do so, compare the 5% hypothetical example with the 5% hypothetical examples that appear in the shareholder reports of other funds. As you compare hypothetical examples of other fund companies, it is important to note that hypothetical examples are meant to highlight the continuing cost of investing in a fund and do not reflect any transaction costs, such as sales charges or redemption or exchange fees.
6
Performance Information – Columbia Small Cap Growth Fund I
Performance data quoted represents past performance and current performance may be lower or higher. Past performance is no guarantee of future results. The investment return and principal value will fluctuate so that shares, when redeemed, may be worth more or less than the original cost. Please visit www.columbiafunds.com for daily and most recent month-end performance updates.
Growth of a $10,000 investment 10/01/96 – 02/28/06 ($)
| Share class | |||||||||||
| Sales charge | without | with | |||||||||
| Class A | 31,990 | 30,142 | |||||||||
| Class B | 31,940 | 31,940 | |||||||||
| Class C | 31,940 | 31,940 | |||||||||
| Class Z | 32,009 | n/a | |||||||||
The table above shows the growth in value of a hypothetical $10,000 investment in each share class of Columbia Small Cap Growth Fund I during the stated time period, and does not reflect the deduction of taxes that a shareholder would pay on fund distributions or the redemption of fund shares.
| Net asset value per share | |||||||
| as of 02/28/06 ($) | |||||||
| Class A | 31.51 | ||||||
| Class B | 31.46 | ||||||
| Class C | 31.46 | ||||||
| Class Z | 31.54 | ||||||
| Distributions declared per share | |||||||
| 09/01/05 – 02/28/06 ($) | |||||||
| Class A | 0.89 | ||||||
| Class B | 0.89 | ||||||
| Class C | 0.89 | ||||||
| Class Z | 0.89 | ||||||
Average annual total return as of 02/28/06 (%)
| Share class | A | B | C | Z | |||||||||||||||||||||||||||
| Inception date | 11/01/05 | 11/01/05 | 11/01/05 | 10/01/96 | |||||||||||||||||||||||||||
| Sales charge | without | with | without | with | without | with | without | ||||||||||||||||||||||||
| 6-month (cumulative) | 16.95 | 10.21 | 16.76 | 11.76 | 16.76 | 15.76 | 17.02 | ||||||||||||||||||||||||
| 1-year | 29.43 | 22.00 | 29.22 | 24.22 | 29.22 | 28.22 | 29.50 | ||||||||||||||||||||||||
| 5-year | 6.84 | 5.57 | 6.80 | 6.49 | 6.80 | 6.80 | 6.85 | ||||||||||||||||||||||||
| 10-year | 13.15 | 12.44 | 13.13 | 13.13 | 13.13 | 13.13 | 13.16 | ||||||||||||||||||||||||
Average annual total return as of 12/31/05 (%)
| Share class | A | B | C | Z | |||||||||||||||||||||||||||
| Sales charge | without | with | without | with | without | with | without | ||||||||||||||||||||||||
| 6-month (cumulative) | 10.91 | 4.55 | 10.87 | 5.87 | 10.87 | 9.87 | 10.91 | ||||||||||||||||||||||||
| 1-year | 13.15 | 6.65 | 13.11 | 8.11 | 13.11 | 12.11 | 13.14 | ||||||||||||||||||||||||
| 5-year | 2.43 | 1.22 | 2.42 | 2.06 | 2.42 | 2.42 | 2.43 | ||||||||||||||||||||||||
| 10-year | 12.07 | 11.36 | 12.07 | 12.07 | 12.07 | 12.07 | 12.07 | ||||||||||||||||||||||||
The "with sales charge" returns include the maximum initial sales charge of 5.75% for class A shares and maximum contingent deferred sales charge of 5.00% for class B shares and 1.00% for class C shares for the first year only. The "without sales charge" returns do not include the effect of sales charges. If they had, returns would be lower.
Performance results reflect any voluntary waivers or reimbursement of fund expenses by the advisor or its affiliates. Absent these waivers or reimbursement arrangements, performance results would have been lower.
Class Z shares are sold at net asset value with no Rule 12b-1 fees. Class Z shares have limited eligibility and the investment minimum requirement may vary. All results shown assume reinvestment of distributions. Please see the fund's prospectus for details. Performance for different share classes will vary based on differences in sales charges and fees associated with each class.
Classes A, B and C (newer class shares) share performance information includes returns of the fund's class Z shares (the oldest existing fund class) for periods prior to the inception of the newer class shares. Class Z share returns are not restated to reflect any expense differential (e.g., Rule 12b-1 fees) between class Z shares and the newer class shares. Had the expense differential been reflected, the returns for the periods prior to the inception of classes A, B and C would have been lower.
7
Fund Profile – Columbia Small Cap Growth Fund I
Performance data quoted represents past performance and current performance may be lower or higher. Past performance is no guarantee of future results. The investment return and principal value will fluctuate so that shares, when redeemed, may be worth more or less than the original cost. Please visit www.columbiafunds.com for daily and most recent month-end performance updates.
Summary
+16.95%
 Class A Shares
+10.24%
 Russell 2000 Index
+11.69%
 Russell 2000 Growth Index
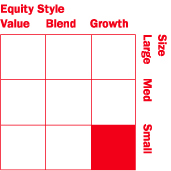
Management Style
Summary
n For the six-month period that ended February 28, 2006, Columbia Small Cap Growth Fund I's Class A Shares returned 16.95% without sales charge. It outperformed both the Russell 2000 Index and the Russell 2000 Growth Index, which returned 10.24% and 11.69%, respectively.1 The fund's return was also higher than the average return of the Morningstar Small Growth Funds Category, which was 11.06%.2 The management team's strong stock decisions helped the fund outperform its benchmark and peer group for the period.
n A decision to overweight industrials, one of the period's strongest sectors, aided performance. Ceradyne, Inc. (1.8% of net assets), an industrial company that develops ceramic products and components, was the fund's top contributor. The company benefited from a ramp up in military orders for body and vehicle armor. Information technology and energy sectors also had a positive impact on performance, as did the telecommunications and consumer discretionary sectors, which provided a standout performance from Millicom International Cellular SA (0.9% of net assets). The company, which provides cellular phone service to emerging markets, rose more than 117% during the period. Consumer staples stocks posted a slight decline and the fund's health care holdings underperformed.
n In an environment of healthy economic growth and relatively low inflation, the fund's managers maintain a bullish outlook for growth stocks, especially within the energy, materials and industrials sectors. However, decelerating growth could provoke a reassessment of the strength and duration of the current economic expansion. The fund's managers plan to continue to seek the stocks of growth companies with strong earnings prospects and attractive valuations.
1 The Russell 2000 Index is an index that tracks the performance of the 2,000 smallest of the 3,000 largest US companies based on market capitalization. The Russell 2000 Growth Index is an index that measures the performance of those Russell 2000 Index companies with higher price-to-book ratios and higher forecasted growth values. Unlike the fund, indices are not investments, they do not incur fees or expenses and are not professionally managed. It is not possible to invest directly in an index. Securities in the fund may not match those in an index.
2 ©2006 by Morningstar, Inc. All rights reserved. The information contained herein is the proprietary information of Morningstar, Inc. may not be copied or redistributed for any purpose and may only be used for non-commercial, personal purposes. The information contained herein is not represented or warranted to be accurate, complete or timely. Morningstar, Inc. shall not be responsible for investment decisions, damages or other losses resulting from use of this information. Morningstar, Inc. has not granted consent for it to be considered or deemed an "expert" under the Securities Act of 1933.
Portfolio Management
Kenneth A. Korngiebel, CFA
n With the fund since 2004
n MBA, Wharton School at University of Pennsylvania; BA, Stanford University
Wayne M. Collette, CFA
n With the fund since 2006
n MBA, Columbia University; BS, Brandeis University
J. Michael Kosicki, CFA
n With the fund since 2006
n BA, Hamilton College
George J. Myers, CFA
n With the fund since 2006
n MS, University of Wisconsin; BBA, University of Wisconsin
Theodore R. Wendell, CFA
n With the fund since 2006
n MBA, Columbia University; BA, Emory University
Equity investments are affected by stock market fluctuations that occur in response to economic and business developments.
Investing in growth stocks incurs the possibility of losses because their prices are sensitive to changes in current or expected earnings.
Investments in small-cap stocks may be subject to greater volatility and price fluctuations because they may be thinly traded and less liquid than investments in larger companies.
Management style is determined by Columbia Management and is based on the investment strategy and process as outlined in the fund's prospectus.
8
UNDERSTANDING YOUR EXPENSES
Columbia Small Cap Growth Fund I
Estimating your actual expenses
To estimate the expenses that you paid over the period, first you will need your account balance at the end of the period:
n For shareholders who receive their account statements from Columbia Management Services, Inc., your account balance is available online at www.columbiafunds.com or by calling Shareholder Services at 800.345.6611.
n For shareholders who receive their account statements from their brokerage firm, contact your brokerage firm to obtain your account balance.
1. Divide your ending account balance by $1,000. For example, if an account balance was $8,600 at the end of the period, the result would be 8.6.
2. In the section of the table below titled "Expenses paid during the period," locate the amount for your share class. You will find this number is in the column labeled "actual." Multiply this number by the result from step 1. Your answer is an estimate of the expenses you paid on your account during the period.
As a fund shareholder, you incur two types of costs. There are transaction costs, which generally include sales charges on purchases and may include redemption or exchange fees. There are also ongoing costs, which generally include investment advisory, Rule 12b-1 fees and other fund expenses. The information on this page is intended to help you understand your ongoing costs of investing in the fund and to compare these costs with the ongoing costs of investing in other mutual funds.
Analyzing your fund's expenses by share class
To illustrate these ongoing costs, we have provided an example and calculated the expenses paid by investors in each share class during the reporting period. The information in the following table is based on an initial investment of $1,000, which is invested at the beginning of the reporting period and held for the entire period. Expense information is calculated two ways and each method provides you with different information. The amount listed in the "actual" column is calculated using the fund's actual operating expenses and total return for the period. The amount listed in the "hypothetical" column for each share class assumes that the return each year is 5% before expenses and includes the fund's actual expense ratio. You should not use the hypothetical account values and expenses to estimate either your actual account balance at the end of the period or the expenses you paid during this reporting period.
09/01/05 – 02/28/06
| Account value at the beginning of the period ($) | Account value at the end of the period ($) | Expenses paid during the period ($) | Fund's annualized expense ratio (%) | ||||||||||||||||||||||||||||
| Actual | Hypothetical | Actual | Hypothetical | Actual | Hypothetical | ||||||||||||||||||||||||||
| Class A | 1,000.00 | 1,000.00 | 1,183.09 | 1,017.85 | 5.02 | 7.00 | 1.40 | ||||||||||||||||||||||||
| Class B | 1,000.00 | 1,000.00 | 1,181.22 | 1,014.13 | 7.71 | 10.74 | 2.15 | ||||||||||||||||||||||||
| Class C | 1,000.00 | 1,000.00 | 1,181.22 | 1,014.13 | 7.71 | 10.74 | 2.15 | ||||||||||||||||||||||||
| Class Z | 1,000.00 | 1,000.00 | 1,170.19 | 1,019.19 | 6.08 | 5.66 | 1.13 | ||||||||||||||||||||||||
Expenses paid during the period are equal to the fund's respective class annualized expense ratio, multiplied by the average account value over the period, then multiplied by the number of days in the fund's most recent fiscal half-year and divided by 365.
Had the transfer agent not waived a portion of expenses, total return would have been reduced.
It is important to note that the expense amounts shown in the table are meant to highlight only ongoing costs of investing in the fund and do not reflect any transaction costs, such as sales charges, redemption or exchange fees. Therefore, the hypothetical examples provided will not help you determine the relative total costs of owning shares of different funds. If these transaction costs were included, your costs would have been higher.
Compare with other funds
Since all mutual funds are required to include the same hypothetical calculations about expenses in shareholder reports, you can use this information to compare the ongoing cost of investing in the fund with other funds. To do so, compare the 5% hypothetical example with the 5% hypothetical examples that appear in the shareholder reports of other funds. As you compare hypothetical examples of other fund companies, it is important to note that hypothetical examples are meant to highlight the continuing cost of investing in a fund and do not reflect any transaction costs, such as sales charges or redemption or exchange fees.
9
Performance Information – Columbia Real Estate Equity Fund
Performance data quoted represents past performance and current performance may be lower or higher. Past performance is no guarantee of future results. The investment return and principal value will fluctuate so that shares, when redeemed, may be worth more or less than the original cost. Please visit www.columbiafunds.com for daily and most recent month-end performance updates.
Growth of a $10,000 investment 03/01/96 – 02/28/06 ($)
| Share class | |||||||||||
| Sales charge | without | with | |||||||||
| Class A | 40,781 | 38,427 | |||||||||
| Class B | 39,825 | 39,825 | |||||||||
| Class C | 39,814 | 39,814 | |||||||||
| Class D | 39,853 | 39,460 | |||||||||
| Class Z | 41,234 | n/a | |||||||||
The table above shows the growth in value of a hypothetical $10,000 investment in each share class of Columbia Real Estate Equity Fund during the stated time period, and does not reflect the deduction of taxes that a shareholder would pay on fund distributions or the redemption of fund shares.
| Net asset value per share | |||||||
| as of 02/28/06 ($) | |||||||
| Class A | 26.44 | ||||||
| Class B | 26.46 | ||||||
| Class C | 26.44 | ||||||
| Class D | 26.46 | ||||||
| Class Z | 26.46 | ||||||
| Distributions declared per share | |||||||
| 09/01/05 – 02/28/06 ($) | |||||||
| Class A | 3.77 | ||||||
| Class B | 3.67 | ||||||
| Class C | 3.67 | ||||||
| Class D | 3.67 | ||||||
| Class Z | 3.80 | ||||||
Average annual total return as of 02/28/06 (%)
| A | B | C | D | Z | |||||||||||||||||||||||||||||||||||
| Inception | 11/01/02 | 11/01/02 | 10/13/03 | 11/01/02 | 04/01/94 | ||||||||||||||||||||||||||||||||||
| Sales charge | without | with | without | with | without | with | without | with | without | ||||||||||||||||||||||||||||||
| 6-month (cumulative) | 9.51 | 3.22 | 9.12 | 4.37 | 9.13 | 8.18 | 9.16 | 8.21 | 9.65 | ||||||||||||||||||||||||||||||
| 1-year | 22.25 | 15.22 | 21.31 | 16.31 | 21.32 | 20.32 | 21.35 | 20.35 | 22.54 | ||||||||||||||||||||||||||||||
| 5-year | 17.69 | 16.30 | 17.13 | 16.92 | 17.12 | 17.12 | 17.15 | 16.91 | 17.95 | ||||||||||||||||||||||||||||||
| 10-year | 15.09 | 14.41 | 14.82 | 14.82 | 14.82 | 14.82 | 14.83 | 14.71 | 15.22 | ||||||||||||||||||||||||||||||
Average annual total return as of 12/31/05 (%)
| A | B | C | D | Z | |||||||||||||||||||||||||||||||||||
| Sales charge | without | with | without | with | without | with | without | with | without | ||||||||||||||||||||||||||||||
| 6-month (cumulative) | 3.97 | -2.01 | 3.53 | -0.97 | 3.57 | 2.67 | 3.57 | 2.67 | 4.06 | ||||||||||||||||||||||||||||||
| 1-year | 6.98 | 0.83 | 6.18 | 1.59 | 6.18 | 5.27 | 6.22 | 5.30 | 7.25 | ||||||||||||||||||||||||||||||
| 5-year | 15.42 | 14.07 | 14.90 | 14.67 | 14.89 | 14.89 | 14.91 | 14.68 | 15.66 | ||||||||||||||||||||||||||||||
| 10-year | 14.56 | 13.88 | 14.30 | 14.30 | 14.30 | 14.30 | 14.31 | 14.19 | 14.68 | ||||||||||||||||||||||||||||||
The "with sales charge" returns include the maximum initial sales charge of 5.75% for class A shares, maximum contingent deferred sales charge of 5.00% for class B shares and 1.00% for class C and D shares for the first year only. The "without sales charge" returns do not include the effect of sales charges. If they had, returns would be lower.
Performance results reflect any voluntary waivers or reimbursement of fund expenses by the advisor or its affiliates. Absent these waivers or reimbursement arrangements, performance results would have been lower.
Class Z shares are sold at net asset value with no Rule 12b-1 fees. Class Z shares have limited eligibility and the investment minimum requirement may vary. All results shown assume reinvestment of distributions. Please see the fund's prospectus for details. Performance for different share classes will vary based on differences in sales charges and fees associated with each class.
Effective October 13, 2003, class D shares are closed to all new investors and new accounts. Existing class D shareholders will be able to make additional purchases at any time. In addition, class D sales charge of 1.00% is waived after October 13, 2003.
Classes A, B and D (newer class shares) share performance information includes returns of the fund's class Z shares (the oldest existing fund class) for periods prior to the inception of the newer class shares. The returns for class C include the returns of class B prior to 10/13/03, the date on which class C was initially offered by the fund. The returns shown for class C also include the performance of class Z prior to the inception of class B (11/01/02). Class Z share returns are not restated to reflect any expense differential (e.g., Rule 12b-1 fees) between class Z shares and the newer class shares. Had the expense differential been reflected, the returns for the periods prior to the inception of classes A, B, C and D would have been lower.
10
Fund Profile – Columbia Real Estate Equity Fund
Performance data quoted represents past performance and current performance may be lower or higher. Past performance is no guarantee of future results. The investment return and principal value will fluctuate so that shares, when redeemed, may be worth more or less than the original cost. Please visit www.columbiafunds.com for daily and most recent month-end performance updates.
Summary
+9.51%
 Class A Shares
+11.57%
 NAREIT Index
Summary
n For the six-month period ended February 28, 2006, the Columbia Real Estate Equity Fund's Class A Shares returned 9.51% without sales charge. The fund underperformed its benchmark, the NAREIT Index, which returned 11.57%.1 Its return was also lower than the 11.73% average return of its peer group, the Morningstar Specialty-Real Estate Funds Category.2
n The fund's REIT holdings performed well in a market that was generally favorable for higher-quality REITs. In this environment, apartment REITs were exceptional performers. The rental market strengthened, especially at the high end, as some potential homebuyers were priced out of the market for single-family homes and condominiums. However, performance was dragged down by exposure to investments outside of the conventional REIT market, especially mortgage REITs and a high cash position. A position in hotel stocks also delivered disappointing returns. However, we have maintained the fund's position in hotel stocks in light of improved business prospects for hotels, particularly in higher-end urban markets.
n The fund was restructured when new managers took over in October 2005. Sector weights were brought more in line with its benchmark, and investments outside the real estate market were sold and replaced by securities that were more consistent with the fund's focus on real estate. The fund's new managers also positioned the fund more conservatively, with an emphasis on REITS with high-quality management and the potential for sustainable growth.
1 The National Association of Real Estate Investment Trusts (NAREIT) Index is an index that tracks performance of all publicly traded equity REIT. Unlike the fund, indices are not investments, do not incur fees or expenses and are not professionally managed. It is not possible to invest directly in an index. Securities in the fund may not match those in an index.
2 ©2006 by Morningstar, Inc. All rights reserved. The information contained herein is the proprietary information of Morningstar, Inc. may not be copied or redistributed for any purpose and may only be used for non-commercial, personal purposes. The information contained herein is not represented or warranted to be accurate, complete or timely. Morningstar, Inc. shall not be responsible for investment decisions, damages or other losses resulting from use of this information. Morningstar, Inc. has not granted consent for it to be considered or deemed an "expert" under the Securities Act of 1933.
Portfolio Management
Robert McConnaughey
n With the fund since 2005
n MIA, Columbia University; BA, Grinnell College
David I. Hoffman
n With the fund since 2005
n BS, Dartmouth College
Equity investments are affected by stock market fluctuations that occur in response to economic and business developments.
The fund may be subject to the same types of risks associated with direct ownership of real estate including the decline of property value due to general, local and regional economic conditions. In addition, the fund's share price will likely be subject to more volatility than the overall stock market because it concentrates in real estate stocks.
11
UNDERSTANDING YOUR EXPENSES
Columbia Real Estate Equity Fund
Estimating your actual expenses
To estimate the expenses that you paid over the period, first you will need your account balance at the end of the period:
n For shareholders who receive their account statements from Columbia Management Services, Inc., your account balance is available online at www.columbiafunds.com or by calling Shareholder Services at 800.345.6611.
n For shareholders who receive their account statements from their brokerage firm, contact your brokerage firm to obtain your account balance.
1. Divide your ending account balance by $1,000. For example, if an account balance was $8,600 at the end of the period, the result would be 8.6.
2. In the section of the table below titled "Expenses paid during the period," locate the amount for your share class. You will find this number is in the column labeled "actual." Multiply this number by the result from step 1. Your answer is an estimate of the expenses you paid on your account during the period.
As a fund shareholder, you incur two types of costs. There are transaction costs, which generally include sales charges on purchases and may include redemption or exchange fees. There are also ongoing costs, which generally include investment advisory, Rule 12b-1 fees and other fund expenses. The information on this page is intended to help you understand your ongoing costs of investing in the fund and to compare these costs with the ongoing costs of investing in other mutual funds.
Analyzing your fund's expenses by share class
To illustrate these ongoing costs, we have provided an example and calculated the expenses paid by investors in each share class during the reporting period. The information in the following table is based on an initial investment of $1,000, which is invested at the beginning of the reporting period and held for the entire period. Expense information is calculated two ways and each method provides you with different information. The amount listed in the "actual" column is calculated using the fund's actual operating expenses and total return for the period. The amount listed in the "hypothetical" column for each share class assumes that the return each year is 5% before expenses and includes the fund's actual expense ratio. You should not use the hypothetical account values and expenses to estimate either your actual account balance at the end of the period or the expenses you paid during this reporting period.
09/01/05 – 02/28/06
| Account value at the beginning of the period ($) | Account value at the end of the period ($) | Expenses paid during the period ($) | Fund's annualized expense ratio (%) | ||||||||||||||||||||||||||||
| Actual | Hypothetical | Actual | Hypothetical | Actual | Hypothetical | ||||||||||||||||||||||||||
| Class A | 1,000.00 | 1,000.00 | 1,095.11 | 1,018.99 | 6.08 | 5.86 | 1.17 | ||||||||||||||||||||||||
| Class B | 1,000.00 | 1,000.00 | 1,091.19 | 1,015.27 | 9.96 | 9.59 | 1.92 | ||||||||||||||||||||||||
| Class C | 1,000.00 | 1,000.00 | 1,091.29 | 1,015.27 | 9.96 | 9.59 | 1.92 | ||||||||||||||||||||||||
| Class D | 1,000.00 | 1,000.00 | 1,091.59 | 1,015.27 | 9.96 | 9.59 | 1.92 | ||||||||||||||||||||||||
| Class Z | 1,000.00 | 1,000.00 | 1,096.50 | 1,020.23 | 4.78 | 4.61 | 0.92 | ||||||||||||||||||||||||
Expenses paid during the period are equal to the fund's respective class annualized expense ratio, multiplied by the average account value over the period, then multiplied by the number of days in the fund's most recent fiscal half-year and divided by 365.
Had the transfer agent not waived a portion of expenses, total return would have been reduced.
It is important to note that the expense amounts shown in the table are meant to highlight only ongoing costs of investing in the fund and do not reflect any transaction costs, such as sales charges, redemption or exchange fees. Therefore, the hypothetical examples provided will not help you determine the relative total costs of owning shares of different funds. If these transaction costs were included, your costs would have been higher.
Compare with other funds
Since all mutual funds are required to include the same hypothetical calculations about expenses in shareholder reports, you can use this information to compare the ongoing cost of investing in the fund with other funds. To do so, compare the 5% hypothetical example with the 5% hypothetical examples that appear in the shareholder reports of other funds. As you compare hypothetical examples of other fund companies, it is important to note that hypothetical examples are meant to highlight the continuing cost of investing in a fund and do not reflect any transaction costs, such as sales charges or redemption or exchange fees.
12
Performance Information – Columbia Technology Fund
Performance data quoted represents past performance and current performance may be lower or higher. Past performance is no guarantee of future results. The investment return and principal value will fluctuate so that shares, when redeemed, may be worth more or less than the original cost. Please visit www.columbiafunds.com for daily and most recent month-end performance updates.
Growth of a $10,000 investment 11/09/00 – 02/28/06 ($)
| Share class | |||||||||||
| Sales charge | without | with | |||||||||
| Class A | 10,940 | 10,312 | |||||||||
| Class B | 10,651 | 10,551 | |||||||||
| Class C | 10,671 | 10,671 | |||||||||
| Class D | 10,711 | 10,605 | |||||||||
| Class Z | 11,064 | n/a | |||||||||
The table above shows the growth in value of a hypothetical $10,000 investment in each share class of Columbia Technology Fund during the stated time period, and does not reflect the deduction of taxes that a shareholder would pay on fund distributions or the redemption of fund shares.
| Net asset value per share | |||||||
| as of 02/28/06 ($) | |||||||
| Class A | 10.33 | ||||||
| Class B | 10.11 | ||||||
| Class C | 10.13 | ||||||
| Class D | 10.17 | ||||||
| Class Z | 10.43 | ||||||
| Distributions declared per share | |||||||
| 09/01/05 – 02/28/06 ($) | |||||||
| Class A | 0.56 | ||||||
| Class B | 0.50 | ||||||
| Class C | 0.50 | ||||||
| Class D | 0.50 | ||||||
| Class Z | 0.58 | ||||||
Average annual total return as of 02/28/06 (%)
| A | B | C | D | Z | |||||||||||||||||||||||||||||||||||
| Inception | 11/01/02 | 11/01/02 | 10/13/03 | 11/01/02 | 11/09/00 | ||||||||||||||||||||||||||||||||||
| without | with | without | with | without | with | without | with | without | |||||||||||||||||||||||||||||||
| 6-month (cumulative) | 24.87 | 17.69 | 24.40 | 19.40 | 24.35 | 23.35 | 24.37 | 24.37 | 24.99 | ||||||||||||||||||||||||||||||
| 1-year | 39.86 | 31.81 | 39.00 | 34.00 | 38.90 | 37.90 | 38.87 | 37.87 | 40.36 | ||||||||||||||||||||||||||||||
| 5-year | 9.93 | 8.63 | 9.35 | 9.07 | 9.39 | 9.39 | 9.47 | 9.25 | 10.18 | ||||||||||||||||||||||||||||||
| Since inception | 1.71 | 0.58 | 1.20 | 1.02 | 1.23 | 1.23 | 1.30 | 1.11 | 1.92 | ||||||||||||||||||||||||||||||
Average annual total return as of 12/31/05 (%)
| Shares class | A | B | C | D | Z | ||||||||||||||||||||||||||||||||||
| without | with | without | with | without | with | without | with | without | |||||||||||||||||||||||||||||||
| 6-month (cumulative) | 23.39 | 16.29 | 23.01 | 18.01 | 22.95 | 21.95 | 22.99 | 21.99 | 23.57 | ||||||||||||||||||||||||||||||
| 1-year | 16.53 | 9.83 | 15.74 | 10.74 | 15.71 | 14.71 | 15.77 | 14.77 | 16.76 | ||||||||||||||||||||||||||||||
| 5-year | 2.70 | 1.48 | 2.17 | 1.80 | 2.21 | 2.21 | 2.30 | 2.08 | 2.91 | ||||||||||||||||||||||||||||||
| Since inception | -0.29 | -1.43 | -0.80 | -0.98 | -0.76 | -0.76 | -0.68 | -0.87 | -0.10 | ||||||||||||||||||||||||||||||
The "with sales charge" returns include the maximum initial sales charge of 5.75% for class A shares, maximum contingent deferred sales charge of 5.00% for class B shares and 1.00% for class C and D shares for the first year only. The "without sales charge" returns do not include the effect of sales charges. If they had, returns would be lower.
Performance results reflect any voluntary waivers or reimbursement of fund expenses by the advisor or its affiliates. Absent these waivers or reimbursement arrangements, performance results would have been lower.
Class Z shares are sold at net asset value with no Rule 12b-1 fees. Class Z shares have limited eligibility and the investment minimum requirement may vary. All results shown assume reinvestment of distributions. Please see the fund's prospectus for details. Performance for different share classes will vary based on differences in sales charges and fees associated with each class.
Effective October 13, 2003, class D shares are closed to all new investors and new accounts. Existing class D shareholders will be able to make additional purchases at any time. In addition, class D sales charge of 1.00% is waived after October 13, 2003.
Classes A, B and D (newer class shares) share performance information includes returns of the fund's class Z shares (the oldest existing fund class) for periods prior to the inception of the newer class shares. The returns for class C include the returns of class B prior to 10/13/03, the date on which class C was initially offered by the fund. The returns shown for class C also include the performance of class Z prior to the inception of class B (11/01/02). Class Z share returns are not restated to reflect any expense differential (e.g., Rule 12b-1 fees) between class Z shares and the newer class shares. Had the expense differential been reflected, the returns for the periods prior to the inception of classes A, B, C and D would have been lower.
13
Fund Profile – Columbia Technology Fund
Performance data quoted represents past performance and current performance may be lower or higher. Past performance is no guarantee of future results. The investment return and principal value will fluctuate so that shares, when redeemed, may be worth more or less than the original cost. Please visit www.columbiafunds.com for daily and most recent month-end performance updates.
Summary
+24.87%
 Class A Shares
+12.85%
 Merrill Lynch 100 Technology Index
Summary
n For the six-month period ended February 28, 2006, the Columbia Technology Fund's Class A Shares returned 24.87% without sales charge. The fund outperformed its benchmark, the Merrill Lynch 100 Technology Index, which returned 12.85%.1 It also surpassed the average return of its peer group, the Morningstar Specialty – Technology Category, which was 11.62% for the same period.2 Semiconductor stocks made the greatest positive impact on fund performance. Wireless telecommunications services also made a strong contribution to the fund's return.
n Within the semiconductor industry, the fund's managers continued to look beyond mega-sized firms to identify growth potential among companies with specific product strengths. The fund had more exposure to wireless stocks than the index, because of positive trends that indicated growing demand and expanded usage for wireless technology. Holdings in systems software detracted from performance.
n The fund remained focused on companies positioned to potentially benefit from the adoption of new technologies, cost savings through outsourcing and key products – especially in the semiconductor industry. The fund's managers plan to continue to evaluate investments in wireless communications.
1 The Merrill Lynch 100 Technology Index is an equally weighted index of 100 leading technology stocks. Unlike the fund, indices are not investments, do not incur fees or expenses and are not professionally managed. It is not possible to invest directly in an index. Securities in the fund may not match those in an index.
2 ©2006 by Morningstar, Inc. All rights reserved. The information contained herein is the proprietary information of Morningstar, Inc. may not be copied or redistributed for any purpose and may only be used for non-commercial, personal purposes. The information contained herein is not represented or warranted to be accurate, complete or timely. Morningstar, Inc. shall not be responsible for investment decisions, damages or other losses resulting from use of this information. Morningstar, Inc. has not granted consent for it to be considered or deemed an "expert" under the Securities Act of 1933.
Portfolio Management
Wayne M. Collette, CFA
n With the fund since 2005
n MBA, Columbia University; BS, Brandeis University
Theodore R. Wendell, CFA
n With the fund since 2005
n MBA, Columbia University; BA, Emory University
Equity investments are affected by stock market fluctuations that occur in response to economic and business developments.
The share price of a fund that invests primarily in one sector will likely be subject to more volatility than a fund that invests across many sectors. Technology stocks may be more volatile than stocks in other sectors. The fund should be considered part of an overall investment program, and not a complete investment program.
International investing may involve certain risks, including foreign taxation, currency fluctuations, risks associated with possible differences in financial standards and other monetary and political risks.
Some of the countries the fund invests in are considered emerging economies, which means there may be greater risks associated with investing there than in more developed countries. In addition, concentration of investments in a single region may result in greater volatility.
14
UNDERSTANDING YOUR EXPENSES
Columbia Technology Fund
Estimating your actual expenses
To estimate the expenses that you paid over the period, first you will need your account balance at the end of the period:
n For shareholders who receive their account statements from Columbia Management Services, Inc., your account balance is available online at www.columbiafunds.com or by calling Shareholder Services at 800.345.6611.
n For shareholders who receive their account statements from their brokerage firm, contact your brokerage firm to obtain your account balance.
1. Divide your ending account balance by $1,000. For example, if an account balance was $8,600 at the end of the period, the result would be 8.6.
2. In the section of the table below titled "Expenses paid during the period," locate the amount for your share class. You will find this number is in the column labeled "actual." Multiply this number by the result from step 1. Your answer is an estimate of the expenses you paid on your account during the period.
As a fund shareholder, you incur two types of costs. There are transaction costs, which generally include sales charges on purchases and may include redemption or exchange fees. There are also ongoing costs, which generally include investment advisory, Rule 12b-1 fees and other fund expenses. The information on this page is intended to help you understand your ongoing costs of investing in the fund and to compare these costs with the ongoing costs of investing in other mutual funds.
Analyzing your fund's expenses by share class
To illustrate these ongoing costs, we have provided an example and calculated the expenses paid by investors in each share class during the reporting period. The information in the following table is based on an initial investment of $1,000, which is invested at the beginning of the reporting period and held for the entire period. Expense information is calculated two ways and each method provides you with different information. The amount listed in the "actual" column is calculated using the fund's actual operating expenses and total return for the period. The amount listed in the "hypothetical" column for each share class assumes that the return each year is 5% before expenses and includes the fund's actual expense ratio. You should not use the hypothetical account values and expenses to estimate either your actual account balance at the end of the period or the expenses you paid during this reporting period.
09/01/05 – 02/28/06
| Account value at the beginning of the period ($) | Account value at the end of the period ($) | Expenses paid during the period ($) | Fund's annualized expense ratio (%) | ||||||||||||||||||||||||||||
| Actual | Hypothetical | Actual | Hypothetical | Actual | Hypothetical | ||||||||||||||||||||||||||
| Class A | 1,000.00 | 1,000.00 | 1,244.62 | 1,017.80 | 7.85 | 7.05 | 1.41 | ||||||||||||||||||||||||
| Class B | 1,000.00 | 1,000.00 | 1,240.06 | 1,014.08 | 12.00 | 10.79 | 2.16 | ||||||||||||||||||||||||
| Class C | 1,000.00 | 1,000.00 | 1,239.47 | 1,014.08 | 11.99 | 10.79 | 2.16 | ||||||||||||||||||||||||
| Class D | 1,000.00 | 1,000.00 | 1,239.76 | 1,014.08 | 12.00 | 10.79 | 2.16 | ||||||||||||||||||||||||
| Class Z | 1,000.00 | 1,000.00 | 1,245.86 | 1,019.04 | 6.46 | 5.81 | 1.16 | ||||||||||||||||||||||||
Expenses paid during the period are equal to the fund's respective class annualized expense ratio, multiplied by the average account value over the period, then multiplied by the number of days in the fund's most recent fiscal half-year and divided by 365.
Had the transfer agent not waived a portion of expenses, total return would have been reduced.
It is important to note that the expense amounts shown in the table are meant to highlight only ongoing costs of investing in the fund and do not reflect any transaction costs, such as sales charges, redemption or exchange fees. Therefore, the hypothetical examples provided will not help you determine the relative total costs of owning shares of different funds. If these transaction costs were included, your costs would have been higher.
Compare with other funds
Since all mutual funds are required to include the same hypothetical calculations about expenses in shareholder reports, you can use this information to compare the ongoing cost of investing in the fund with other funds. To do so, compare the 5% hypothetical example with the 5% hypothetical examples that appear in the shareholder reports of other funds. As you compare hypothetical examples of other fund companies, it is important to note that hypothetical examples are meant to highlight the continuing cost of investing in a fund and do not reflect any transaction costs, such as sales charges or redemption or exchange fees.
15
Performance Information – Columbia Strategic Investor Fund
Performance data quoted represents past performance and current performance may be lower or higher. Past performance is no guarantee of future results. The investment return and principal value will fluctuate so that shares, when redeemed, may be worth more or less than the original cost. Please visit www.columbiafunds.com for daily and most recent month-end performance updates.
Growth of a $10,000 investment 11/09/00 – 02/28/06 ($)
| Share class | |||||||||||
| Sales charge | without | with | |||||||||
| Class A | 23,174 | 21,845 | |||||||||
| Class B | 22,476 | 22,576 | |||||||||
| Class C | 22,587 | 22,587 | |||||||||
| Class D | 22,343 | 22,566 | |||||||||
| Class Z | 23,374 | n/a | |||||||||
The table above shows the growth in value of a hypothetical $10,000 investment in each share class of Columbia Strategic Investor Fund during the stated time period, and does not reflect the deduction of taxes that a shareholder would pay on fund distributions or the redemption of fund shares.
| Net asset value per share | |||||||
| as of 02/28/06 ($) | |||||||
| Class A | 20.79 | ||||||
| Class B | 20.47 | ||||||
| Class C | 20.48 | ||||||
| Class D | 20.46 | ||||||
| Class Z | 20.83 | ||||||
| Distributions declared per share | |||||||
| 09/01/05 – 02/28/06 ($) | |||||||
| Class A | 1.66 | ||||||
| Class B | 1.52 | ||||||
| Class C | 1.52 | ||||||
| Class D | 1.52 | ||||||
| Class Z | 1.71 | ||||||
Average annual total return as of 02/28/06 (%)
| A | B | C | D | Z | |||||||||||||||||||||||||||||||||||
| Inception date | 11/01/02 | 11/01/02 | 10/13/03 | 11/01/02 | 11/09/00 | ||||||||||||||||||||||||||||||||||
| Sales charge | without | with | without | with | without | without | without | with | without | ||||||||||||||||||||||||||||||
| 6-month (cumulative) | 6.06 | -0.04 | 5.71 | 0.80 | 5.71 | 4.73 | 5.66 | 4.68 | 6.21 | ||||||||||||||||||||||||||||||
| 1-year | 9.79 | 3.48 | 8.95 | 3.95 | 9.00 | 8.00 | 8.95 | 7.95 | 10.04 | ||||||||||||||||||||||||||||||
| 5-year | 13.59 | 12.25 | 13.00 | 12.75 | 13.01 | 13.01 | 12.99 | 12.77 | 13.79 | ||||||||||||||||||||||||||||||
| Life | 17.17 | 15.87 | 16.59 | 16.50 | 16.60 | 16.60 | 16.58 | 16.37 | 17.36 | ||||||||||||||||||||||||||||||
Average annual total return as of 12/31/05 (%)
| A | B | C | D | Z | |||||||||||||||||||||||||||||||||||
| Sales charge | without | with | without | with | without | without | without | with | without | ||||||||||||||||||||||||||||||
| 6-month (cumulative) | 6.77 | 0.63 | 6.33 | 1.39 | 6.33 | 5.34 | 6.39 | 5.40 | 6..91 | ||||||||||||||||||||||||||||||
| 1-year | 7.09 | 0.93 | 6.28 | 1.34 | 6.28 | 5.29 | 6.33 | 5.35 | 7.38 | ||||||||||||||||||||||||||||||
| 5-year | 14.81 | 13.45 | 14.24 | 14.00 | 14.25 | 14.25 | 14.24 | 14.01 | 15.00 | ||||||||||||||||||||||||||||||
| Life | 16.97 | 15.64 | 16.40 | 16.30 | 16.41 | 16.41 | 16.40 | 16.18 | 17.16 | ||||||||||||||||||||||||||||||
The "with sales charge" returns include the maximum initial sales charge of 5.75% for class A shares, maximum contingent deferred sales charge of 5.00% for class B shares and 1.00% for class C and D shares for the first year only. The "without sales charge" returns do not include the effect of sales charges. If they had, returns would be lower.
Performance results reflect any voluntary waivers or reimbursement of fund expenses by the advisor or its affiliates. Absent these waivers or reimbursement arrangements, performance results would have been lower.
Effective October 13, 2003, class D shares are closed to all new investors and new accounts. Existing class D shareholders will be able to make additional purchases at any time. In addition, class D sales charge of 1.00% is waived after October 13, 2003.
Class Z shares are sold at net asset value with no Rule 12b-1 fees. Class Z shares have limited eligibility and the investment minimum requirement may vary. All results shown assume reinvestment of distributions. Please see the fund's prospectus for details. Performance for different share classes will vary based on differences in sales charges and fees associated with each class.
Classes A, B and D (newer class shares) share performance information includes returns of the fund's class Z shares (the oldest existing fund class) for periods prior to the inception of the newer class shares. The returns for class C include the returns of class B prior to 10/13/03, the date on which class C was initially offered by the fund. The returns shown for class C also include the performance of class Z prior to the inception of class B (11/01/02). Class Z share returns are not restated to reflect any expense differential (e.g., Rule 12b-1 fees) between class Z shares and the newer class shares. Had the expense differential been reflected, the returns for the periods prior to the inception of classes A, B, C and D would have been lower.
16
Fund Profile – Columbia Strategic Investor Fund
Performance data quoted represents past performance and current performance may be lower or higher. Past performance is no guarantee of future results. The investment return and principal value will fluctuate so that shares, when redeemed, may be worth more or less than the original cost. Please visit www.columbiafunds.com for daily and most recent month-end performance updates.
Summary
+6.06%
 Class A Shares
+7.46%
 Russell 3000 Value Index
Summary
n For the six-month period ended February 28, 2006, the Columbia Strategic Investor Fund's Class A Shares returned 6.06% without sales charge. The fund's return fell between the returns of its two benchmarks, the Russell 3000 Value Index, which returned 7.46%, and the S&P 500 Index, which returned 5.93% for the same period.1 It fell short of the 7.83% average return of its peer group, the Morningstar Mid-Cap Blend Funds Category.2
n Recognizing that the fund has two benchmarks, the following performance discussion relates to its performance vs. the S&P 500. Good relative performance, especially from the information technology, financials, industrials, energy and materials sector, contributed to solid returns for the fund's equity holdings. The information technology sector made the greatest contribution to relative performance. However, the fund experienced poor relative performance within the consumer discretionary, consumer staples, utilities and healthcare sectors. The weakest relative performance came from the consumer discretionary and the consumer staples sectors. In addition, the fund's cash position, at 18.2% of the portfolio, hampered relative performance as these assets could not keep up with gains in the equity markets.
n In view of their expectation that recent interest-rate increases could slow economic growth in 2006, the fund's management team plans to seek companies with less sensitivity to economic cycles and the ability to maintain stable growth as the economic cycle matures. The managers will continue to evaluate investment opportunities overseas, considering those areas with compelling growth trends and reasonable prices.
1 The Russell 3000 Value Index is an index that measures the performance of those Russell 3000 Index companies with lower price-to-book ratios and lower forecasted growth values. The S&P 500 Index is an index that tracks the performance of 500 widely held, large capitalization US stocks. Unlike the fund, indices are not investments, do not incur fees or expenses and are not professionally managed. It is not possible to invest directly in an index. Securities in the fund may not match those in an index.
2 ©2006 by Morningstar, Inc. All rights reserved. The information contained herein is the proprietary information of Morningstar, Inc. may not be copied or redistributed for any purpose and may only be used for non-commercial, personal purposes. The information contained herein is not represented or warranted to be accurate, complete or timely. Morningstar, Inc. shall not be responsible for investment decisions, damages or other losses resulting from use of this information. Morningstar, Inc. has not granted consent for it to be considered or deemed an "expert" under the Securities Act of 1933.
Portfolio Management
Emil A. Gjester
n With the fund since 2002
n MBA, University of Cambridge; BBA, Pacific Lutheran University
Dara J. White, CFA
n With the fund since 2006
n BS, Boston College
Jonas Patrikson
n With the fund since 2006
Equity investments are affected by stock market fluctuations that occur in response to economic and business developments.
17
UNDERSTANDING YOUR EXPENSES
Columbia Strategic Investor Fund
Estimating your actual expenses
To estimate the expenses that you paid over the period, first you will need your account balance at the end of the period:
n For shareholders who receive their account statements from Columbia Management Services, Inc., your account balance is available online at www.columbiafunds.com or by calling Shareholder Services at 800.345.6611.
n For shareholders who receive their account statements from their brokerage firm, contact your brokerage firm to obtain your account balance.
1. Divide your ending account balance by $1,000. For example, if an account balance was $8,600 at the end of the period, the result would be 8.6.
2. In the section of the table below titled "Expenses paid during the period," locate the amount for your share class. You will find this number is in the column labeled "actual." Multiply this number by the result from step 1. Your answer is an estimate of the expenses you paid on your account during the period.
As a fund shareholder, you incur two types of costs. There are transaction costs, which generally include sales charges on purchases and may include redemption or exchange fees. There are also ongoing costs, which generally include investment advisory, Rule 12b-1 fees and other fund expenses. The information on this page is intended to help you understand your ongoing costs of investing in the fund and to compare these costs with the ongoing costs of investing in other mutual funds.
Analyzing your fund's expenses by share class
To illustrate these ongoing costs, we have provided an example and calculated the expenses paid by investors in each share class during the reporting period. The information in the following table is based on an initial investment of $1,000, which is invested at the beginning of the reporting period and held for the entire period. Expense information is calculated two ways and each method provides you with different information. The amount listed in the "actual" column is calculated using the fund's actual operating expenses and total return for the period. The amount listed in the "hypothetical" column for each share class assumes that the return each year is 5% before expenses and includes the fund's actual expense ratio. You should not use the hypothetical account values and expenses to estimate either your actual account balance at the end of the period or the expenses you paid during this reporting period.
09/01/05 – 02/28/06
| Account value at the beginning of the period ($) | Account value at the end of the period ($) | Expenses paid during the period ($) | Fund's annualized expense ratio (%) | ||||||||||||||||||||||||||||
| Actual | Hypothetical | Actual | Hypothetical | Actual | Hypothetical | ||||||||||||||||||||||||||
| Class A | 1,000.00 | 1,000.00 | 1,060.60 | 1,018.79 | 6.18 | 6.06 | 1.21 | ||||||||||||||||||||||||
| Class B | 1,000.00 | 1,000.00 | 1,057.08 | 1,015.08 | 10.00 | 9.79 | 1.96 | ||||||||||||||||||||||||
| Class C | 1,000.00 | 1,000.00 | 1,057.08 | 1,015.08 | 10.00 | 9.79 | 1.96 | ||||||||||||||||||||||||
| Class D | 1,000.00 | 1,000.00 | 1,056.58 | 1,015.08 | 9.99 | 9.79 | 1.96 | ||||||||||||||||||||||||
| Class Z | 1,000.00 | 1,000.00 | 1,062.09 | 1,020.03 | 4.91 | 4.81 | 0.96 | ||||||||||||||||||||||||
Expenses paid during the period are equal to the fund's respective class annualized expense ratio, multiplied by the average account value over the period, then multiplied by the number of days in the fund's most recent fiscal half-year and divided by 365.
Had the transfer agent not waived a portion of expenses, total return would have been reduced.
It is important to note that the expense amounts shown in the table are meant to highlight only ongoing costs of investing in the fund and do not reflect any transaction costs, such as sales charges, redemption or exchange fees. Therefore, the hypothetical examples provided will not help you determine the relative total costs of owning shares of different funds. If these transaction costs were included, your costs would have been higher.
Compare with other funds
Since all mutual funds are required to include the same hypothetical calculations about expenses in shareholder reports, you can use this information to compare the ongoing cost of investing in the fund with other funds. To do so, compare the 5% hypothetical example with the 5% hypothetical examples that appear in the shareholder reports of other funds. As you compare hypothetical examples of other fund companies, it is important to note that hypothetical examples are meant to highlight the continuing cost of investing in a fund and do not reflect any transaction costs, such as sales charges or redemption or exchange fees.
18
Performance Information – Columbia Balanced Fund
Performance data quoted represents past performance and current performance may be lower or higher. Past performance is no guarantee of future results. The investment return and principal value will fluctuate so that shares, when redeemed, may be worth more or less than the original cost. Please visit www.columbiafunds.com for daily and most recent month-end performance updates.
Growth of a $10,000 investment 03/01/96 – 02/28/06 ($)
| Share class | |||||||||||
| Sales charge | without | with | |||||||||
| Class A | 19,366 | 18,252 | |||||||||
| Class B | 18,891 | 18,891 | |||||||||
| Class C | 18,892 | 18,892 | |||||||||
| Class D | 18,908 | 18,715 | |||||||||
| Class Z | 19,586 | n/a | |||||||||
The table above shows the growth in value of a hypothetical $10,000 investment in each share class of Columbia Balanced Fund during the stated time period, and does not reflect the deduction of taxes that a shareholder would pay on fund distributions or the redemption of fund shares.
| Net asset value per share | |||||||
| as of 02/28/06 ($) | |||||||
| Class A | 22.36 | ||||||
| Class B | 22.33 | ||||||
| Class C | 22.33 | ||||||
| Class D | 22.32 | ||||||
| Class Z | 22.35 | ||||||
| Distributions declared per share | |||||||
| 09/01/05 – 02/28/06 ($) | |||||||
| Class A | 0.20 | ||||||
| Class B | 0.12 | ||||||
| Class C | 0.12 | ||||||
| Class D | 0.12 | ||||||
| Class Z | 0.23 | ||||||
Average annual total return as of 02/28/06 (%)
| Share class | A | B | C | D | Z | ||||||||||||||||||||||||||||||||||
| Inception | 11/01/02 | 11/01/02 | 10/13/03 | 11/01/02 | 10/01/91 | ||||||||||||||||||||||||||||||||||
| Sales charge | without | with | without | with | without | with | without | with | without | ||||||||||||||||||||||||||||||
| 6-month (cumulative) | 3.76 | -2.20 | 3.38 | -1.62 | 3.38 | 2.38 | 3.33 | 2.33 | 3.89 | ||||||||||||||||||||||||||||||
| 1-year | 8.41 | 2.17 | 7.61 | 2.61 | 7.61 | 6.61 | 7.56 | 6.56 | 8.68 | ||||||||||||||||||||||||||||||
| 5-year | 2.55 | 1.34 | 2.04 | 1.67 | 2.04 | 2.04 | 2.06 | 1.86 | 2.78 | ||||||||||||||||||||||||||||||
| 10-year | 6.83 | 6.20 | 6.57 | 6.57 | 6.57 | 6.57 | 6.58 | 6.47 | 6.95 | ||||||||||||||||||||||||||||||
Average annual total return as of 12/31/05 (%)
| Share class | A | B | C | D | Z | ||||||||||||||||||||||||||||||||||
| Sales charge | without | with | without | with | without | with | without | with | without | ||||||||||||||||||||||||||||||
| 6-month (cumulative) | 6.43 | 0.31 | 5.98 | 0.98 | 5.98 | 4.98 | 6.04 | 5.04 | 6.52 | ||||||||||||||||||||||||||||||
| 1-year | 5.54 | -0.53 | 4.71 | -0.29 | 4.71 | 3.71 | 4.76 | 3.76 | 5.76 | ||||||||||||||||||||||||||||||
| 5-year | 1.33 | 0.14 | 0.84 | 0.47 | 0.85 | 0.85 | 0.87 | 0.67 | 1.54 | ||||||||||||||||||||||||||||||
| 10-year | 6.82 | 6.19 | 6.56 | 6.56 | 6.57 | 6.57 | 6.58 | 6.47 | 6.93 | ||||||||||||||||||||||||||||||
The "with sales charge" returns include the maximum initial sales charge of 5.75% for class A shares, maximum contingent deferred sales charge of 5.00% for class B shares and 1.00% for class C and D shares for the first year only. The "without sales charge" returns do not include the effect of sales charges. If they had, returns would be lower.
Performance results reflect any voluntary waivers or reimbursement of fund expenses by the advisor or its affiliates. Absent these waivers or reimbursement arrangements, performance results would have been lower.
Class Z shares are sold at net asset value with no Rule 12b-1 fees. Class Z shares have limited eligibility and the investment minimum requirement may vary. All results shown assume reinvestment of distributions. Please see the fund's prospectus for details. Performance for different share classes will vary based on differences in sales charges and fees associated with each class.
Effective October 13, 2003, class D shares are closed to all new investors and new accounts. Existing class D shareholders will be able to make additional purchases at any time. In addition, class D sales charge of 1.00% is waived after October 13, 2003.
Classes A, B and D (newer class shares) share performance information includes returns of the fund's class Z shares (the oldest existing fund class) for periods prior to the inception of the newer class shares. The returns for class C include the returns of class B prior to 10/13/03, the date on which class C was initially offered by the fund. The returns shown for class C also include the performance of class Z prior to the inception of class B (11/01/02). Class Z share returns are not restated to reflect any expense differential (e.g., Rule 12b-1 fees) between class Z shares and the newer class shares. Had the expense differential been reflected, the returns for the periods prior to the inception of classes A, B, C and D would have been lower.
19
Fund Profile – Columbia Balanced Fund
Performance data quoted represents past performance and current performance may be lower or higher. Past performance is no guarantee of future results. The investment return and principal value will fluctuate so that shares, when redeemed, may be worth more or less than the original cost. Please visit www.columbiafunds.com for daily and most recent month-end performance updates.
Summary
+3.76%
 Class A Shares
+5.93%
 S&P 500 Index
-0.11%
 Lehman Brothers Aggregate
Bond Index
Summary
n For the six-month period that ended February 28, 2006, the Columbia Balanced Fund's Class A Shares returned 3.76% without sales charge. The fund's return was higher than the blended return 3.51% of its two benchmarks based on a 60/40 allocation between them, the S&P 500 Index which returned 5.93% and the Lehman Brothers Aggregate Bond Index which returned negative 0.11%.1 The fund's return was lower than the average return of its peer group, the Lipper Balanced Funds Category which returned 4.24%.2
n Favorable stock selection, especially within health care and financials, helped the fund's equity holdings outperform its benchmark. The fund was overweight in health care relative to the S&P 500 Index, which meant that superior stock selection had an even more favorable impact on return. These gains were enough to offset weakness among the fund's consumer discretionary stocks. Given recent short-term interest-rate increases and their potential for slowing economic growth, the fund's equity managers plan to focus on companies that they believe can weather a changing economic climate.
n The fund's fixed income holdings performed generally in line with its Lehman benchmark as rising interest rates put pressure on all segments of the bond market. However, short-term yields rose more than long-term yields. In this environment, performance was helped by management's decision to maintain a slightly shorter duration than the benchmark for most of the period. (Duration is a measure of interest-rate sensitivity.) Duration was extended to match the benchmark toward the end of the period as a greater level of uncertainty entered the market with a new Federal Reserve Board chairman and a change in the language used to describe the Fed's interest-rate policy. A decision to overweight mortgage-backed securities, asset-backed securities and corporate bonds also aided performance.
1 The S&P 500 Index is an index that tracks the performance of 500 widely held, large capitalization US stocks. The Lehman Brothers Aggregate Bond Index is a market value-weighted index that tracks the performance of fixed-rate, publicly placed, dollar denominated, and non-convertible investment grade debt issues. Unlike the fund, indices are not investments, do not incur fees or expenses and are not professionally managed. It is not possible to invest directly in an index. Securities in the fund may not match those in an index.
2 Lipper Inc., a widely respected data provider in the industry, calculates an average total return (assuming reinvestment of distributions) for mutual funds with investment objectives similar to those of the fund. Lipper makes no adjustment for the effect of sales loads.
Portfolio Management
Leonard A. Aplet, CFA
n With the fund since 1991
n MBA, University of California at Berkeley; BS, Oregon State University
Guy W. Pope, CFA
n With the fund since 1997
n MBA, Northwestern University; BA, The Colorado College
Ronald B. Stahl, CFA
n With the fund since 2005
n MBA, Portland State University; BS, Oregon State University
Stephen C. Peacher, CFA
n With the fund since 2005
n BS, University of Virginia
Jeffrey D. Huffman
n With the fund since 2005
n MBA, University of Washington; BA, Brigham Young University
Equity investments are affected by stock market fluctuations that occur in response to economic and business developments.
Investing in fixed-income securities may involve certain risks, including the credit quality of individual issuers, possible prepayments, market or economic developments and yield and share price fluctuations due to changes in interest rates. When interest rates go up, bond prices typically drop, and vice versa.
Investing in high-yield securities (commonly known as "junk" bonds) offers the potential for high current income and attractive total returns but involves certain risks. Changes in economic conditions or other circumstances may adversely affect a junk bond issuer's ability to make principal and interest payments. Rising interest rates tend to lower the value of all bonds.
20
UNDERSTANDING YOUR EXPENSES
Columbia Balanced Fund
Estimating your actual expenses
To estimate the expenses that you paid over the period, first you will need your account balance at the end of the period:
n For shareholders who receive their account statements from Columbia Management Services, Inc., your account balance is available online at www.columbiafunds.com or by calling Shareholder Services at 800.345.6611.
n For shareholders who receive their account statements from their brokerage firm, contact your brokerage firm to obtain your account balance.
1. Divide your ending account balance by $1,000. For example, if an account balance was $8,600 at the end of the period, the result would be 8.6.
2. In the section of the table below titled "Expenses paid during the period," locate the amount for your share class. You will find this number is in the column labeled "actual." Multiply this number by the result from step 1. Your answer is an estimate of the expenses you paid on your account during the period.
As a fund shareholder, you incur two types of costs. There are transaction costs, which generally include sales charges on purchases and may include redemption or exchange fees. There are also ongoing costs, which generally include investment advisory, Rule 12b-1 fees and other fund expenses. The information on this page is intended to help you understand your ongoing costs of investing in the fund and to compare these costs with the ongoing costs of investing in other mutual funds.
Analyzing your fund's expenses by share class
To illustrate these ongoing costs, we have provided an example and calculated the expenses paid by investors in each share class during the reporting period. The information in the following table is based on an initial investment of $1,000, which is invested at the beginning of the reporting period and held for the entire period. Expense information is calculated two ways and each method provides you with different information. The amount listed in the "actual" column is calculated using the fund's actual operating expenses and total return for the period. The amount listed in the "hypothetical" column for each share class assumes that the return each year is 5% before expenses and includes the fund's actual expense ratio. You should not use the hypothetical account values and expenses to estimate either your actual account balance at the end of the period or the expenses you paid during this reporting period.
09/01/05 – 02/28/06
| Account value at the beginning of the period ($) | Account value at the end of the period ($) | Expenses paid during the period ($) | Fund's annualized expense ratio (%) | ||||||||||||||||||||||||||||
| Actual | Hypothetical | Actual | Hypothetical | Actual | Hypothetical | ||||||||||||||||||||||||||
| Class A | 1,000.00 | 1,000.00 | 1,036.99 | 1,019.89 | 5.00 | 4.96 | 0.99 | ||||||||||||||||||||||||
| Class B | 1,000.00 | 1,000.00 | 1,033.22 | 1,016.17 | 8.77 | 8.70 | 1.74 | ||||||||||||||||||||||||
| Class C | 1,000.00 | 1,000.00 | 1,033.22 | 1,016.17 | 8.77 | 8.70 | 1.74 | ||||||||||||||||||||||||
| Class D | 1,000.00 | 1,000.00 | 1,032.78 | 1,016.17 | 8.77 | 8.70 | 1.74 | ||||||||||||||||||||||||
| Class Z | 1,000.00 | 1,000.00 | 1,038.28 | 1,021.12 | 3.74 | 3.71 | 0.74 | ||||||||||||||||||||||||
Expenses paid during the period are equal to the fund's respective class annualized expense ratio, multiplied by the average account value over the period, then multiplied by the number of days in the fund's most recent fiscal half-year and divided by 365.
Had the transfer agent not waived a portion of expenses, total return would have been reduced.
It is important to note that the expense amounts shown in the table are meant to highlight only ongoing costs of investing in the fund and do not reflect any transaction costs, such as sales charges, redemption or exchange fees. Therefore, the hypothetical examples provided will not help you determine the relative total costs of owning shares of different funds. If these transaction costs were included, your costs would have been higher.
Compare with other funds
Since all mutual funds are required to include the same hypothetical calculations about expenses in shareholder reports, you can use this information to compare the ongoing cost of investing in the fund with other funds. To do so, compare the 5% hypothetical example with the 5% hypothetical examples that appear in the shareholder reports of other funds. As you compare hypothetical examples of other fund companies, it is important to note that hypothetical examples are meant to highlight the continuing cost of investing in a fund and do not reflect any transaction costs, such as sales charges or redemption or exchange fees.
21
Performance Information – Columbia Oregon Intermediate Municipal Bond Fund
Performance data quoted represents past performance and current performance may be lower or higher. Past performance is no guarantee of future results. The investment return and principal value will fluctuate so that shares, when redeemed, may be worth more or less than the original cost. Please visit www.columbiafunds.com for daily and most recent month-end performance updates.
Growth of a $10,000 investment 03/01/96 – 02/28/06 ($)
| Share class | |||||||||||
| Sales charge | without | with | |||||||||
| Class A | 16,320 | 15,548 | |||||||||
| Class B | 15,917 | 15,917 | |||||||||
| Class C | 16,053 | 16,053 | |||||||||
| Class D | 16,110 | 15,954 | |||||||||
| Class Z | 16,489 | n/a | |||||||||
The table above shows the growth in value of a hypothetical $10,000 investment in each share class of Columbia Oregon Intermediate Municipal Bond Fund during the stated time period, and does not reflect the deduction of taxes that a shareholder would pay on fund distributions or the redemption of fund shares. The growth of $10,000 with sales charge for Class A is calculated with an initial sales charge of 4.75%.
| Net asset value per share | |||||||
| as of 02/28/06 ($) | |||||||
| Class A | 12.30 | ||||||
| Class B | 12.30 | ||||||
| Class C | 12.30 | ||||||
| Class D | 12.30 | ||||||
| Class Z | 12.30 | ||||||
| Distributions declared per share | |||||||
| 09/01/05 – 02/28/06 ($) | |||||||
| Class A | 0.23 | ||||||
| Class B | 0.18 | ||||||
| Class C | 0.20 | ||||||
| Class D | 0.20 | ||||||
| Class Z | 0.24 | ||||||
A portion of the fund's income may be subject to the alternative minimum tax. The fund may at times purchase tax-exempt securities at a discount. Some or all of this discount may be included in the fund's ordinary income, and is taxable when distributed.
Average annual total return as of 02/28/06 (%)
| A | B | C | D | Z | |||||||||||||||||||||||||||||||||||
| Inception | 11/01/02 | 11/01/02 | 10/13/03 | 11/01/02 | 07/02/84 | ||||||||||||||||||||||||||||||||||
| Sales charge | without | with | without | with | without | with | without | with | without | ||||||||||||||||||||||||||||||
| 6-month (cumulative) | 0.65 | -2.63 | 0.27 | -2.69 | 0.44 | -0.54 | 0.45 | -0.54 | 0.77 | ||||||||||||||||||||||||||||||
| 1-year | 3.11 | -1.79 | 2.34 | -0.64 | 2.70 | 1.70 | 2.70 | 1.70 | 3.37 | ||||||||||||||||||||||||||||||
| 5-year | 4.79 | 3.77 | 4.27 | 4.27 | 4.44 | 4.44 | 4.52 | 4.31 | 5.01 | ||||||||||||||||||||||||||||||
| 10-year | 5.02 | 4.51 | 4.76 | 4.76 | 4.85 | 4.85 | 4.88 | 4.78 | 5.13 | ||||||||||||||||||||||||||||||
Average annual total return as of 12/31/05 (%)
| A | B | C | D | Z | |||||||||||||||||||||||||||||||||||
| Sales charge | without | with | without | with | without | with | without | with | without | ||||||||||||||||||||||||||||||
| 6-month (cumulative) | 0.39 | -4.38 | 0.01 | -2.94 | 0.19 | -0.80 | 0.19 | -0.80 | 0.52 | ||||||||||||||||||||||||||||||
| 1-year | 2.68 | -2.20 | 1.91 | -1.05 | 2.27 | 1.28 | 2.27 | 1.28 | 2.94 | ||||||||||||||||||||||||||||||
| 5-year | 4.96 | 3.95 | 4.46 | 4.46 | 4.62 | 4.62 | 4.70 | 4.49 | 5.16 | ||||||||||||||||||||||||||||||
| 10-year | 4.96 | 4.45 | 4.71 | 4.71 | 4.80 | 4.80 | 4.83 | 4.73 | 5.07 | ||||||||||||||||||||||||||||||
The "with sales charge" returns include the maximum initial sales charge of 3.25% for class A shares, maximum contingent deferred sales charge of 5.00% for class B shares and 1.00% for class C and D shares for the first year only. The "without sales charge" returns do not include the effect of sales charges. If they had, returns would be lower.
The 1, 5 & 10-year average annual returns with sales charge as of 02/28/06 include the previous sales charge of 4.75%. The 6-month cumulative return with sales charge as of 02/28/06 includes the new sales charge of 3.25%. This change was effective beginning August 22, 2005.
All returns with sales charges as of 12/31/05 include the previous sales charge of 4.75%.
Performance results reflect any voluntary waivers or reimbursement of fund expenses by the advisor or its affiliates. Absent these waivers or reimbursement arrangements, performance results would have been lower.
Class Z shares are sold at net asset value with no Rule 12b-1 fees. Class Z shares have limited eligibility and the investment minimum requirement may vary. All results shown assume reinvestment of distributions. Please see the fund's prospectus for details. Performance for different share classes will vary based on differences in sales charges and fees associated with each class.
Effective October 13, 2003, class D shares are closed to all new investors and new accounts. Existing class D shareholders will be able to make additional purchases at any time. In addition, class D sales charge of 1.00% is waived after October 13, 2003.
Classes A, B and D (newer class shares) share performance information includes returns of the fund's class Z shares (the oldest existing fund class) for periods prior to the inception of the newer class shares. The returns for class C include the returns of class B prior to 10/13/03, the date on which class C was initially offered by the fund. The returns shown for class C also include the performance of class Z prior to the inception of class B (11/01/02). Class Z share returns are not restated to reflect any expense differential (e.g., Rule 12b-1 fees) between class Z shares and the newer class shares. Had the expense differential been reflected, the returns for the periods prior to the inception of classes A, B, C and D would have been lower.
22
Fund Profile – Columbia Oregon Intermediate Municipal Bond Fund
Performance data quoted represents past performance and current performance may be lower or higher. Past performance is no guarantee of future results. The investment return and principal value will fluctuate so that shares, when redeemed, may be worth more or less than the original cost. Please visit www.columbiafunds.com for daily and most recent month-end performance updates.
Summary
+0.65
 Class A Shares
+0.84
 Lehman Brothers General
Obligation Bond Index
Management Style
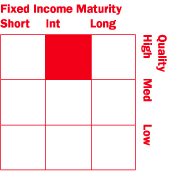
Summary
n For the six-month period ended February 28, 2006, the Columbia Oregon Intermediate Municipal Bond Fund's Class A Shares returned 0.65% without sales charge. The fund's return was lower than the 0.84% return of its benchmark, the Lehman Brothers General Obligation Bond Index.1 However, it was higher than the average return of its peer group, the Lipper Other States Intermediate Municipal Debt Funds Category, which was 0.39%.2
n The fund's short fall versus the benchmark can be accounted for by two factors: It had slightly less exposure than the index to 20-year bonds, which were strong performers. Also, the index includes California bonds, which outperformed the bonds of other states. The fund's mix of higher-yielding investment-grade bonds helped it outperform its peer group.
n Several of the fund's best-performing bonds were pre-refunded during the period. When a bond is pre-refunded, the issuer floats a second bond to pay off the first bond at its first call date. Pre-refunding is generally viewed favorably by investors, and in the case of the pre-refunded bonds in the fund, resulted in total returns between 4% and 5%. Bonds in the hospital sector also did well. Non-callable bonds in the 2010 – 2013 maturity range underperformed as interest rates rose and the differences in yield among short-, intermediate- and long-term bonds narrowed.
1 The Lehman Brothers General Obligation Bond Index is an index that represents average market-weighted performance of general obligation securities that have been issued in the last five years with maturities greater than one year. Unlike the fund, indices are not investments, do not incur fees or expenses and are not professionally managed. It is not possible to invest directly in an index. Securities in the fund may not match those in an index.
2 Lipper Inc., a widely respected data provider in the industry, calculates an average total return (assuming reinvestment of distributions) for mutual funds with investment objectives similar to those of the fund. Lipper makes no adjustment for the effect of sales loads.
Portfolio Management
Brian McGreevy
n With the fund since 2003
n BS, University of Massachusetts Dartmouth
Tax-exempt investing offers current tax-exempt income, but it also involves special risks. The value of the fund will be affected by interest rate changes and the creditworthiness of issues held in the fund. When interest rates go up, bond prices generally drop and vice versa.
Interest income from certain tax-exempt bonds may be subject to certain state and local taxes and, if applicable, the alternative minimum tax. Capital gains are not exempt from income taxes.
Single-state municipal bond funds pose additional risks due to limited geographical diversification.
Management style is determined by Columbia Management and is based on the investment strategy and process as outlined in the fund's prospectus.
23
UNDERSTANDING YOUR EXPENSES
Columbia Oregon Intermediate Municipal Bond Fund
Estimating your actual expenses
To estimate the expenses that you paid over the period, first you will need your account balance at the end of the period:
n For shareholders who receive their account statements from Columbia Management Services, Inc., your account balance is available online at www.columbiafunds.com or by calling Shareholder Services at 800.345.6611.
n For shareholders who receive their account statements from their brokerage firm, contact your brokerage firm to obtain your account balance.
1. Divide your ending account balance by $1,000. For example, if an account balance was $8,600 at the end of the period, the result would be 8.6.
2. In the section of the table below titled "Expenses paid during the period," locate the amount for your share class. You will find this number is in the column labeled "actual." Multiply this number by the result from step 1. Your answer is an estimate of the expenses you paid on your account during the period.
As a fund shareholder, you incur two types of costs. There are transaction costs, which generally include sales charges on purchases and may include redemption or exchange fees. There are also ongoing costs, which generally include investment advisory, Rule 12b-1 fees and other fund expenses. The information on this page is intended to help you understand your ongoing costs of investing in the fund and to compare these costs with the ongoing costs of investing in other mutual funds.
Analyzing your fund's expenses by share class
To illustrate these ongoing costs, we have provided an example and calculated the expenses paid by investors in each share class during the reporting period. The information in the following table is based on an initial investment of $1,000, which is invested at the beginning of the reporting period and held for the entire period. Expense information is calculated two ways and each method provides you with different information. The amount listed in the "actual" column is calculated using the fund's actual operating expenses and total return for the period. The amount listed in the "hypothetical" column for each share class assumes that the return each year is 5% before expenses and includes the fund's actual expense ratio. You should not use the hypothetical account values and expenses to estimate either your actual account balance at the end of the period or the expenses you paid during this reporting period.
09/01/05 – 02/28/06
| Account value at the beginning of the period ($) | Account value at the end of the period ($) | Expenses paid during the period ($) | Fund's annualized expense ratio (%) | ||||||||||||||||||||||||||||
| Actual | Hypothetical | Actual | Hypothetical | Actual | Hypothetical | ||||||||||||||||||||||||||
| Class A | 1,000.00 | 1,000.00 | 1,006.50 | 1,020.43 | 4.38 | 4.41 | 0.88 | ||||||||||||||||||||||||
| Class B | 1,000.00 | 1,000.00 | 1,002.68 | 1,016.71 | 8.09 | 8.15 | 1.63 | ||||||||||||||||||||||||
| Class C | 1,000.00 | 1,000.00 | 1,004.41 | 1,018.45 | 6.36 | 6.41 | 1.28 | ||||||||||||||||||||||||
| Class D | 1,000.00 | 1,000.00 | 1,004.51 | 1,018.45 | 6.36 | 6.41 | 1.28 | ||||||||||||||||||||||||
| Class Z | 1,000.00 | 1,000.00 | 1,007.69 | 1,021.67 | 3.14 | 3.16 | 0.63 | ||||||||||||||||||||||||
Expenses paid during the period are equal to the fund's respective class annualized expense ratio, multiplied by the average account value over the period, then multiplied by the number of days in the fund's most recent fiscal half-year and divided by 365.
Had the transfer agent and distributor not waived a portion of expenses, total return would have been reduced.
It is important to note that the expense amounts shown in the table are meant to highlight only ongoing costs of investing in the fund and do not reflect any transaction costs, such as sales charges, redemption or exchange fees. Therefore, the hypothetical examples provided will not help you determine the relative total costs of owning shares of different funds. If these transaction costs were included, your costs would have been higher.
Compare with other funds
Since all mutual funds are required to include the same hypothetical calculations about expenses in shareholder reports, you can use this information to compare the ongoing cost of investing in the fund with other funds. To do so, compare the 5% hypothetical example with the 5% hypothetical examples that appear in the shareholder reports of other funds. As you compare hypothetical examples of other fund companies, it is important to note that hypothetical examples are meant to highlight the continuing cost of investing in a fund and do not reflect any transaction costs, such as sales charges or redemption or exchange fees.
24
Performance Information – Columbia Conservative High Yield Fund
Performance data quoted represents past performance and current performance may be lower or higher. Past performance is no guarantee of future results. The investment return and principal value will fluctuate so that shares, when redeemed, may be worth more or less than the original cost. Please visit www.columbiafunds.com for daily and most recent month-end performance updates.
Growth of a $10,000 investment 03/01/96 – 02/28/06 ($)
| Share class | |||||||||||
| Sales charge | without | With | |||||||||
| Class A | 18,429 | 17,562 | |||||||||
| Class B | 17,954 | 17,954 | |||||||||
| Class C | 18,007 | 18,007 | |||||||||
| Class D | 18,051 | 17,871 | |||||||||
| Class Z | 18,591 | n/a | |||||||||
The table above shows the growth in value of a hypothetical $10,000 investment in each share class of Columbia Conservative High Yield Fund during the stated time period, and does not reflect the deduction of taxes that a shareholder would pay on fund distributions or the redemption of fund shares.
| Net asset value per share | |||||||
| as of 02/28/06 ($) | |||||||
| Class A | 8.53 | ||||||
| Class B | 8.53 | ||||||
| Class C | 8.53 | ||||||
| Class D | 8.53 | ||||||
| Class Z | 8.53 | ||||||
| Distributions declared per share | |||||||
| 09/01/05 – 02/28/06 ($) | |||||||
| Class A | 0.27 | ||||||
| Class B | 0.24 | ||||||
| Class C | 0.24 | ||||||
| Class D | 0.24 | ||||||
| Class Z | 0.28 | ||||||
Average annual total return as of 02/28/06 (%)
| Share class | A | B | C | D | Z | ||||||||||||||||||||||||||||||||||
| Inception | 11/01/02 | 11/01/02 | 10/13/03 | 11/01/02 | 10/01/93 | ||||||||||||||||||||||||||||||||||
| Sales charge | without | with | without | with | without | with | without | with | without | ||||||||||||||||||||||||||||||
| 6-month (cumulative) | 2.12 | -2.73 | 1.74 | -3.21 | 1.82 | 0.83 | 1.82 | 0.77 | 2.24 | ||||||||||||||||||||||||||||||
| 1-year | 2.99 | -1.91 | 2.22 | -2.62 | 2.38 | 1.41 | 2.38 | 1.34 | 3.23 | ||||||||||||||||||||||||||||||
| 5-year | 5.08 | 4.06 | 4.53 | 4.22 | 4.59 | 4.59 | 4.64 | 4.44 | 5.26 | ||||||||||||||||||||||||||||||
| 10-year | 6.30 | 5.79 | 6.03 | 6.03 | 6.06 | 6.06 | 6.08 | 5.98 | 6.40 | ||||||||||||||||||||||||||||||
Average annual total return as of 12/31/05 (%)
| Share class | A | B | C | D | Z | ||||||||||||||||||||||||||||||||||
| Sales charge | without | with | without | with | without | with | without | with | without | ||||||||||||||||||||||||||||||
| 6-month (cumulative) | 1.36 | -3.45 | 0.98 | -3.93 | 1.06 | 0.07 | 1.06 | 0.01 | 1.48 | ||||||||||||||||||||||||||||||
| 1-year | 2.45 | -2.43 | 1.69 | -3.13 | 1.84 | 0.87 | 1.84 | 0.81 | 2.68 | ||||||||||||||||||||||||||||||
| 5-year | 5.64 | 4.61 | 5.11 | 4.80 | 5.17 | 5.17 | 5.22 | 5.01 | 5.82 | ||||||||||||||||||||||||||||||
| 10-year | 6.32 | 5.81 | 6.06 | 6.06 | 6.09 | 6.09 | 6.11 | 6.01 | 6.41 | ||||||||||||||||||||||||||||||
The "with sales charge" returns include the maximum initial sales charge of 4.75% for class A shares, maximum contingent deferred sales charge of 5.00% for class B shares and 1.00% for class C and D shares for the first year only. The "without sales charge" returns do not include the effect of sales charges. If they had, returns would have been lower.
Performance results reflect any voluntary waivers or reimbursement of fund expenses by the advisor or its affiliates. Absent these waivers or reimbursement arrangements, performance results would have been lower.
Class Z shares are sold at net asset value with no Rule 12b-1 fees. Class Z shares have limited eligibility and the investment minimum requirement may vary. All results shown assume reinvestment of distributions. Please see the fund's prospectus for details. Performance for different share classes will vary based on differences in sales charges and fees associated with each class.
Effective October 13, 2003, class D shares are closed to all new investors and new accounts. Existing class D shareholders will be able to make additional purchases at any time. In addition, class D sales charge of 1.00% is waived after October 13, 2003.
Classes A, B and D (newer class shares) share performance information includes returns of the fund's class Z shares (the oldest existing fund class) for periods prior to the inception of the newer class shares. The returns for class C include the returns of class B prior to 10/13/03, the date on which class C was initially offered by the fund. The returns shown for class C also include the performance of class Z prior to the inception of class B (11/01/02). Class Z share returns are not restated to reflect any expense differential (e.g., Rule 12b-1 fees) between class Z shares and the newer class shares. Had the expense differential been reflected, the returns for the periods prior to the inception of classes A, B, C and D would have been lower.
25
Fund Profile – Columbia Conservative High Yield Fund
Performance data quoted represents past performance and current performance may be lower or higher. Past performance is no guarantee of future results. The investment return and principal value will fluctuate so that shares, when redeemed, may be worth more or less than the original cost. Please visit www.columbiafunds.com for daily and most recent month-end performance updates.
Summary
+2.12%
 Class A Shares
+1.46%
 JPMorgan Chase Developed BB High Yield Index
Management Style
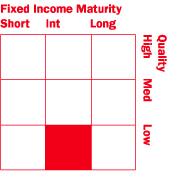
Summary
n For the six-month period ended February 28, 2006, the Columbia Conservative High Yield Fund's Class A Shares returned 2.12% without sales charge. It outperformed its benchmarks, the JPMorgan Chase Developed BB High Yield Index and the Merrill Lynch U.S. High Yield, Cash Pay Only Index, which returned 1.46% and 1.90%, respectively.1 Its return fell just short of the average return of its peer group, the Lipper High Yield Funds Category, which was 2.26%.2 Most of the fund's positive return was generated in the final months of the period, as high-yield bonds enjoyed a seasonal rally. Its high-quality orientation aided performance relative to its benchmarks as lower-rated securities struggled to break even during the period.
n A decision to underweight the auto sector relative to the fund's benchmarks also aided return. US auto companies suffered under the weight of weak operating results and concerns about future pension and health care obligations. However, the fund gave up some performance because it had less exposure to wireline and wireless telecommunications stocks, which were strong performers.
n During the period, the fund's new managers brought its industry weights more in line with its benchmarks and broadened the fund's diversification. However, the fund's conservative orientation was preserved, in keeping with management's assessment that the high-yield market is currently fairly valued as well as the fund's overall conservative investment policy.
1 JPMorgan Chase Developed BB High Yield Index is an index that is designed to mirror the investable universe of the US dollar developed, BB-rated, high yield corporate debt market. The Merrill Lynch U.S. High Yield, Cash Pay Only Index is an index that tracks the performance of non-investment-grade corporate bonds. Unlike the fund, indices are not investments, do not incur fees or expenses and are not professionally managed. It is not possible to invest directly in an index. Securities in the fund may not match those in an index.
2 Lipper Inc., a widely respected data provider in the industry, calculates an average total return (assuming reinvestment of distributions) for mutual funds with investment objectives similar to those of the fund. Lipper makes no adjustment for the effect of sales loads.
Portfolio Management
Stephen C. Peacher, CFA
n With the fund since 2005
n BS, University of Virginia
Kevin L. Cronk, CFA
n With the fund since 2005
n BS, Finance and Economics, Creighton University
Thomas A. LaPointe, CFA
n With the fund since 2005
n BS, Babson College
Investing in fixed-income securities may involve certain risks, including the credit quality of individual issuers, possible prepayments, market or economic developments and yields and share price fluctuations due to changes in interest rates. When interest rates go up, bond prices typically drop, and vice versa.
The term "conservative" in the Columbia Conservative High Yield Fund's name and as used in the discussion above is intended to describe the Fund's credit approach relative to other high yield funds; the Fund invests primarily in bonds rated Ba or B by Moody's Investors Service, Inc. or BB or B by Standard & Poor's. These lower rated bonds, commonly referred to as "junk bonds", are subject to greater credit risk, and are generally less liquid, than higher-rated, lower yielding bonds. Also changes in economic conditions or other circumstances may adversely affect a junk bond issuer's ability to make principal and interest payments. Rising interest rates tend to lower the value of all bonds.
Management style is determined by Columbia Management and is based on the investment strategy and process as outlined in the fund's prospectus.
26
UNDERSTANDING YOUR EXPENSES
Columbia Conservative High Yield Fund
Estimating your actual expenses
To estimate the expenses that you paid over the period, first you will need your account balance at the end of the period:
n For shareholders who receive their account statements from Columbia Management Services, Inc., your account balance is available online at www.columbiafunds.com or by calling Shareholder Services at 800.345.6611.
n For shareholders who receive their account statements from their brokerage firm, contact your brokerage firm to obtain your account balance.
1. Divide your ending account balance by $1,000. For example, if an account balance was $8,600 at the end of the period, the result would be 8.6.
2. In the section of the table below titled "Expenses paid during the period," locate the amount for your share class. You will find this number is in the column labeled "actual." Multiply this number by the result from step 1. Your answer is an estimate of the expenses you paid on your account during the period.
As a fund shareholder, you incur two types of costs. There are transaction costs, which generally include sales charges on purchases and may include redemption or exchange fees. There are also ongoing costs, which generally include investment advisory, Rule 12b-1 fees and other fund expenses. The information on this page is intended to help you understand your ongoing costs of investing in the fund and to compare these costs with the ongoing costs of investing in other mutual funds.
Analyzing your fund's expenses by share class
To illustrate these ongoing costs, we have provided an example and calculated the expenses paid by investors in each share class during the reporting period. The information in the following table is based on an initial investment of $1,000, which is invested at the beginning of the reporting period and held for the entire period. Expense information is calculated two ways and each method provides you with different information. The amount listed in the "actual" column is calculated using the fund's actual operating expenses and total return for the period. The amount listed in the "hypothetical" column for each share class assumes that the return each year is 5% before expenses and includes the fund's actual expense ratio. You should not use the hypothetical account values and expenses to estimate either your actual account balance at the end of the period or the expenses you paid during this reporting period.
09/01/05 – 02/28/06
| Account value at the beginning of the period ($) | Account value at the end of the period ($) | Expenses paid during the period ($) | Fund's annualized expense ratio (%) | ||||||||||||||||||||||||||||
| Actual | Hypothetical | Actual | Hypothetical | Actual | Hypothetical | ||||||||||||||||||||||||||
| Class A | 1,000.00 | 1,000.00 | 1,020.83 | 1,020.18 | 4.66 | 4.66 | 0.93 | ||||||||||||||||||||||||
| Class B | 1,000.00 | 1,000.00 | 1,017.16 | 1,016.46 | 8.40 | 8.40 | 1.68 | ||||||||||||||||||||||||
| Class C | 1,000.00 | 1,000.00 | 1,017.90 | 1,017.21 | 7.66 | 7.65 | 1.53 | ||||||||||||||||||||||||
| Class D | 1,000.00 | 1,000.00 | 1,017.90 | 1,017.21 | 7.66 | 7.65 | 1.53 | ||||||||||||||||||||||||
| Class Z | 1,000.00 | 1,000.00 | 1,022.07 | 1,021.42 | 3.41 | 3.41 | 0.68 | ||||||||||||||||||||||||
Expenses paid during the period are equal to the fund's respective class annualized expense ratio, multiplied by the average account value over the period, then multiplied by the number of days in the fund's most recent fiscal half-year and divided by 365.
Had the transfer agent and distributor not waived a portion of expenses, total return would have been reduced.
It is important to note that the expense amounts shown in the table are meant to highlight only ongoing costs of investing in the fund and do not reflect any transaction costs, such as sales charges, redemption or exchange fees. Therefore, the hypothetical examples provided will not help you determine the relative total costs of owning shares of different funds. If these transaction costs were included, your costs would have been higher.
Compare with other funds
Since all mutual funds are required to include the same hypothetical calculations about expenses in shareholder reports, you can use this information to compare the ongoing cost of investing in the fund with other funds. To do so, compare the 5% hypothetical example with the 5% hypothetical examples that appear in the shareholder reports of other funds. As you compare hypothetical examples of other fund companies, it is important to note that hypothetical examples are meant to highlight the continuing cost of investing in a fund and do not reflect any transaction costs, such as sales charges or redemption or exchange fees.
27
INVESTMENT PORTFOLIO
February 28, 2006 (Unaudited) Columbia International Stock Fund
| Shares | Value ($) | ||||||||||
| Common Stocks – 97.9% | |||||||||||
| CONSUMER DISCRETIONARY – 10.9% | |||||||||||
| Auto Components – 2.1% | |||||||||||
| Compagnie Generale des Etablissements Michelin, Class B | 183,488 | 11,191,656 | |||||||||
| Continental AG | 90,471 | 9,256,373 | |||||||||
| Denso Corp. | 249,000 | 9,081,568 | |||||||||
| Auto Components Total | 29,529,597 | ||||||||||
| Automobiles – 2.3% | |||||||||||
| Hyundai Motor Co. | 78,400 | 6,669,174 | |||||||||
| Toyota Motor Corp. | 458,400 | 24,556,333 | |||||||||
| Automobiles Total | 31,225,507 | ||||||||||
| Distributors – 0.6% | |||||||||||
| Canon Sales Co., Inc. | 289,000 | 6,199,017 | |||||||||
| Li & Fung Ltd. | 1,325,000 | 2,671,719 | |||||||||
| Distributors Total | 8,870,736 | ||||||||||
| Hotels, Restaurants & Leisure – 0.5% | |||||||||||
| City Developments Ltd. | 1,114,200 | 6,503,571 | |||||||||
| Hotels, Restaurants & Leisure Total | 6,503,571 | ||||||||||
| Household Durables – 3.1% | |||||||||||
| JM AB | 150,300 | 8,372,448 | |||||||||
| Makita Corp. | 202,800 | 5,896,824 | |||||||||
| Matsushita Electric Industrial Co., Ltd. | 511,000 | 10,854,269 | |||||||||
| Sony Corp. | 130,900 | 6,106,256 | |||||||||
| Taylor Woodrow PLC | 1,614,599 | 11,766,255 | |||||||||
| Household Durables Total | 42,996,052 | ||||||||||
| Leisure Equipment & Products – 0.5% | |||||||||||
| Sega Sammy Holdings, Inc. | 175,300 | 7,145,035 | |||||||||
| Leisure Equipment & Products Total | 7,145,035 | ||||||||||
| Media – 1.2% | |||||||||||
| Vivendi Universal SA | 555,165 | 16,739,161 | |||||||||
| Media Total | 16,739,161 | ||||||||||
| Specialty Retail – 0.6% | |||||||||||
| Esprit Holdings Ltd. | 410,100 | 3,147,863 | |||||||||
| Yamada Denki Co., Ltd. | 43,500 | 4,654,281 | |||||||||
| Specialty Retail Total | 7,802,144 | ||||||||||
| CONSUMER DISCRETIONARY TOTAL | 150,811,803 | ||||||||||
| Shares | Value ($) | ||||||||||
| CONSUMER STAPLES – 5.6% | |||||||||||
| Beverages – 0.5% | |||||||||||
| Diageo PLC | 489,739 | 7,523,745 | |||||||||
| Beverages Total | 7,523,745 | ||||||||||
| Food & Staples Retailing – 0.3% | |||||||||||
| FamilyMart Co., Ltd. | 127,300 | 3,986,731 | |||||||||
| Food & Staples Retailing Total | 3,986,731 | ||||||||||
| Food Products – 2.6% | |||||||||||
| Nestle SA, Registered Shares | 83,346 | 24,496,743 | |||||||||
| Unilever PLC | 1,094,223 | 11,293,374 | |||||||||
| Food Products Total | 35,790,117 | ||||||||||
| Household Products – 0.5% | |||||||||||
| Kao Corp. | 279,000 | 7,576,140 | |||||||||
| Household Products Total | 7,576,140 | ||||||||||
| Tobacco – 1.7% | |||||||||||
| British American Tobacco PLC | 410,331 | 9,792,240 | |||||||||
| Imperial Tobacco Group PLC | 190,866 | 5,740,316 | |||||||||
| Japan Tobacco, Inc. | 444 | 7,651,921 | |||||||||
| Tobacco Total | 23,184,477 | ||||||||||
| CONSUMER STAPLES TOTAL | 78,061,210 | ||||||||||
| ENERGY – 9.2% | |||||||||||
| Oil, Gas & Consumable Fuels – 9.2% | |||||||||||
| BP PLC | 859,748 | 9,487,010 | |||||||||
| BP PLC, ADR | 173,330 | 11,512,578 | |||||||||
| CNOOC Ltd. | 6,739,000 | 5,599,491 | |||||||||
| EnCana Corp. | 124,600 | 5,153,064 | |||||||||
| ENI S.p.A. | 707,675 | 20,242,647 | |||||||||
| Norsk Hydro ASA | 132,760 | 15,554,497 | |||||||||
| PetroChina Co., Ltd., Class H | 5,480,000 | 5,339,226 | |||||||||
| Royal Dutch Shell PLC, Class A | 267,976 | 8,062,390 | |||||||||
| Royal Dutch Shell PLC, Class B | 404,770 | 12,734,939 | |||||||||
| Statoil ASA | 335,550 | 8,577,490 | |||||||||
| Total SA | 83,442 | 20,960,002 | |||||||||
| Yanzhou Coal Mining Co., Ltd., Class H | 5,480,000 | 4,486,138 | |||||||||
| Oil, Gas & Consumable Fuels Total | 127,709,472 | ||||||||||
| ENERGY TOTAL | 127,709,472 | ||||||||||
| FINANCIALS – 32.0% | |||||||||||
| Capital Markets – 4.2% | |||||||||||
| Credit Suisse Group, Registered Shares | 222,792 | 12,333,222 | |||||||||
| Daiwa Securities Group, Inc. | 709,000 | 8,387,807 | |||||||||
| Deutsche Bank AG, Registered Shares | 148,052 | 16,304,778 | |||||||||
| Nomura Holdings, Inc. | 493,200 | 9,336,645 | |||||||||
See Accompanying Notes to Financial Statements.
28
February 28, 2006 (Unaudited) Columbia International Stock Fund
| Shares | Value ($) | ||||||||||
| Common Stocks – (continued) | |||||||||||
| FINANCIALS – (continued) | |||||||||||
| Capital Markets – (continued) | |||||||||||
| UBS AG, Registered Shares | 113,948 | 12,079,962 | |||||||||
| Capital Markets Total | 58,442,414 | ||||||||||
| Commercial Banks – 18.9% | |||||||||||
| Australia & New Zealand Banking Group Ltd. | 465,348 | 8,849,857 | |||||||||
| Banco Bilbao Vizcaya Argentaria SA | 1,136,780 | 23,141,698 | |||||||||
| Banco Santander Central Hispano SA | 1,226,144 | 17,904,524 | |||||||||
| Bangkok Bank Public Co., Ltd., NVDR | 1,198,800 | 3,586,285 | |||||||||
| Barclays PLC | 1,921,089 | 22,521,269 | |||||||||
| BNP Paribas SA | 211,295 | 19,554,427 | |||||||||
| Depfa Bank PLC | 694,152 | 11,530,580 | |||||||||
| ForeningsSparbanken AB | 282,800 | 7,539,858 | |||||||||
| HBOS PLC | 1,100,935 | 20,505,980 | |||||||||
| HSBC Holdings PLC | 1,258,435 | 21,532,290 | |||||||||
| Kasikornbank Public Co., Ltd., Foreign Shares | 4,338,200 | 7,627,032 | |||||||||
| Kasikornbank Public Co., Ltd., NVDR | 384,600 | 658,865 | |||||||||
| Kookmin Bank | 129,900 | 9,875,449 | |||||||||
| Mitsubishi UFJ Financial Group, Inc. | 935 | 14,306,385 | |||||||||
| Mizuho Financial Group, Inc. | 1,102 | 8,778,209 | |||||||||
| Oversea-Chinese Banking Corp., Ltd. | 829,000 | 3,462,947 | |||||||||
| Societe Generale | 125,869 | 17,835,153 | |||||||||
| Standard Chartered PLC | 213,100 | 5,565,540 | |||||||||
| Sumitomo Mitsui Financial Group, Inc. | 646 | 7,030,062 | |||||||||
| Sumitomo Trust & Banking Co., Ltd. | 776,000 | 7,836,594 | |||||||||
| United Overseas Bank Ltd. | 1,051,900 | 9,674,024 | |||||||||
| Westpac Banking Corp. | 676,036 | 11,792,301 | |||||||||
| Commercial Banks Total | 261,109,329 | ||||||||||
| Consumer Finance – 0.8% | |||||||||||
| Aiful Corp. | 82,250 | 5,513,627 | |||||||||
| ORIX Corp. | 22,940 | 6,006,516 | |||||||||
| Consumer Finance Total | 11,520,143 | ||||||||||
| Diversified Financial Services – 2.1% | |||||||||||
| Fortis | 359,666 | 12,810,754 | |||||||||
| ING Groep NV | 421,723 | 15,848,932 | |||||||||
| Diversified Financial Services Total | 28,659,686 | ||||||||||
| Insurance – 4.7% | |||||||||||
| Allianz AG, Registered Shares | 94,475 | 15,247,042 | |||||||||
| Aviva PLC | 875,671 | 12,117,311 | |||||||||
| Shares | Value ($) | ||||||||||
| Cathay Financial Holding Co., Ltd. | 3,287,600 | 6,329,272 | |||||||||
| Muenchener Rueckversicherungs- Gesellschaft AG, Registered Shares | 54,745 | 7,422,753 | |||||||||
| Sampo Oyj, Class A | 634,500 | 12,710,577 | |||||||||
| Samsung Fire & Marine Insurance Co., Ltd. | 44,400 | 5,662,124 | |||||||||
| Storebrand ASA (a) | 528,100 | 5,832,498 | |||||||||
| Insurance Total | 65,321,577 | ||||||||||
| Real Estate – 1.3% | |||||||||||
| Sun Hung Kai Properties Ltd. | 777,000 | 8,080,752 | |||||||||
| Swire Pacific Ltd., Class A | 1,048,300 | 10,001,206 | |||||||||
| Real Estate Total | 18,081,958 | ||||||||||
| FINANCIALS TOTAL | 443,135,107 | ||||||||||
| HEALTH CARE – 8.3% | |||||||||||
| Health Care Equipment & Supplies – 0.5% | |||||||||||
| GN Store Nord A/S | 531,900 | 7,093,809 | |||||||||
| Pihsiang Machinery Manufacturing Co., Ltd. | 3 | 5 | |||||||||
| Health Care Equipment & Supplies Total | 7,093,814 | ||||||||||
| Pharmaceuticals – 7.8% | |||||||||||
| Altana AG | 149,729 | 8,036,746 | |||||||||
| Astellas Pharma, Inc. | 71,800 | 2,769,387 | |||||||||
| AstraZeneca PLC | 411,474 | 19,011,376 | |||||||||
| Eisai Co., Ltd. | 122,100 | 5,648,531 | |||||||||
| GlaxoSmithKline PLC | 503,701 | 12,791,729 | |||||||||
| H. Lundbeck A/S | 368,000 | 7,581,262 | |||||||||
| Novartis AG, Registered Shares | 240,092 | 12,803,926 | |||||||||
| Roche Holding AG, Genusschein Shares | 68,714 | 10,150,892 | |||||||||
| Sanofi-Aventis | 127,687 | 10,853,046 | |||||||||
| Schering AG | 119,300 | 8,569,809 | |||||||||
| Takeda Pharmaceutical Co., Ltd. | 182,800 | 10,217,925 | |||||||||
| Pharmaceuticals Total | 108,434,629 | ||||||||||
| HEALTH CARE TOTAL | 115,528,443 | ||||||||||
| INDUSTRIALS – 8.9% | |||||||||||
| Aerospace & Defense – 0.3% | |||||||||||
| Singapore Technologies Engineering Ltd. | 2,175,000 | 4,060,612 | |||||||||
| Aerospace & Defense Total | 4,060,612 | ||||||||||
| Airlines – 0.6% | |||||||||||
| British Airways PLC (a) | 1,437,200 | 8,274,635 | |||||||||
| Airlines Total | 8,274,635 | ||||||||||
See Accompanying Notes to Financial Statements.
29
February 28, 2006 (Unaudited) Columbia International Stock Fund
| Shares | Value ($) | ||||||||||
| Common Stocks – (continued) | |||||||||||
| INDUSTRIALS – (continued) | |||||||||||
| Construction & Engineering – 0.5% | |||||||||||
| Shimizu Corp. | 974,000 | 6,852,492 | |||||||||
| Construction & Engineering Total | 6,852,492 | ||||||||||
| Electrical Equipment – 1.5% | |||||||||||
| ABB Ltd. | 561,572 | 6,708,163 | |||||||||
| Mitsubishi Electric Corp. | 1,402,000 | 11,144,915 | |||||||||
| Shanghai Electric Group Co., Ltd., Class H (a) | 7,006,000 | 3,082,608 | |||||||||
| Electrical Equipment Total | 20,935,686 | ||||||||||
| Industrial Conglomerates – 0.3% | |||||||||||
| SembCorp Industries Ltd. | 1,758,980 | 3,364,674 | |||||||||
| Industrial Conglomerates Total | 3,364,674 | ||||||||||
| Machinery – 3.2% | |||||||||||
| Atlas Copco AB, Class B | 475,500 | 10,806,660 | |||||||||
| Komatsu Ltd. | 640,000 | 11,347,363 | |||||||||
| Saurer AG, Registered Shares (a) | 77,709 | 5,640,029 | |||||||||
| Stork NV | 190,158 | 10,838,539 | |||||||||
| Volvo AB, Class B | 142,700 | 6,228,804 | |||||||||
| Machinery Total | 44,861,395 | ||||||||||
| Road & Rail – 0.9% | |||||||||||
| Central Japan Railway Co. | 960 | 9,401,156 | |||||||||
| ComfortDelGro Corp., Ltd. | 3,420,000 | 3,473,738 | |||||||||
| Road & Rail Total | 12,874,894 | ||||||||||
| Trading Companies & Distributors – 1.4% | |||||||||||
| Hitachi High-Technologies Corp. | 240,500 | 6,262,708 | |||||||||
| Mitsubishi Corp. | 540,500 | 12,528,245 | |||||||||
| Trading Companies & Distributors Total | 18,790,953 | ||||||||||
| Transportation Infrastructure – 0.2% | |||||||||||
| Zhejiang Expressway Co., Ltd., Class H | 4,364,100 | 3,079,266 | |||||||||
| Transportation Infrastructure Total | 3,079,266 | ||||||||||
| INDUSTRIALS TOTAL | 123,094,607 | ||||||||||
| INFORMATION TECHNOLOGY – 8.4% | |||||||||||
| Communications Equipment – 2.0% | |||||||||||
| Nokia Oyj | 1,088,650 | 20,243,798 | |||||||||
| Telefonaktiebolaget LM Ericsson, ADR | 239,100 | 8,153,310 | |||||||||
| Communications Equipment Total | 28,397,108 | ||||||||||
| Shares | Value ($) | ||||||||||
| Computers & Peripherals – 0.8% | |||||||||||
| Acer, Inc. | 1,541,700 | 3,410,755 | |||||||||
| FUJITSU Ltd. | 647,000 | 5,147,085 | |||||||||
| Wincor Nixdorf AG | 18,911 | 2,411,704 | |||||||||
| Computers & Peripherals Total | 10,969,544 | ||||||||||
| Electronic Equipment & Instruments – 1.8% | |||||||||||
| Hon Hai Precision Industry Co., Ltd. | 658,600 | 4,160,058 | |||||||||
| Hoya Corp. | 200,400 | 7,918,263 | |||||||||
| Kyocera Corp. | 82,900 | 7,324,692 | |||||||||
| Venture Corp., Ltd. | 709,000 | 5,705,781 | |||||||||
| Electronic Equipment & Instruments Total | 25,108,794 | ||||||||||
| IT Services – 0.7% | |||||||||||
| CGI Group, Inc., Class A (a) | 1,272,800 | 9,553,420 | |||||||||
| IT Services Total | 9,553,420 | ||||||||||
| Office Electronics – 1.0% | |||||||||||
| Canon, Inc. | 216,700 | 13,611,907 | |||||||||
| Office Electronics Total | 13,611,907 | ||||||||||
| Semiconductors & Semiconductor Equipment – 1.6% | |||||||||||
| Advantest Corp. | 48,300 | 5,488,052 | |||||||||
| Samsung Electronics Co., Ltd. | 18,601 | 13,036,268 | |||||||||
| Taiwan Semiconductor Manufacturing Co., Ltd., ADR | 369,679 | 3,596,977 | |||||||||
| Semiconductors & Semiconductor Equipment Total | 22,121,297 | ||||||||||
| Software – 0.5% | |||||||||||
| Cognos, Inc. (a) | 163,400 | 6,250,050 | |||||||||
| Software Total | 6,250,050 | ||||||||||
| INFORMATION TECHNOLOGY TOTAL | 116,012,120 | ||||||||||
| MATERIALS – 7.1% | |||||||||||
| Chemicals – 5.2% | |||||||||||
| BASF AG | 245,208 | 18,486,855 | |||||||||
| Bayer AG | 133,545 | 5,373,082 | |||||||||
| Clariant AG, Registered Shares (a) | 559,002 | 8,537,388 | |||||||||
| Shin-Etsu Chemical Co., Ltd. | 158,400 | 8,434,513 | |||||||||
| Sumitomo Chemical Co., Ltd. | 1,240,000 | 9,653,686 | |||||||||
| Syngenta AG (a) | 58,680 | 8,317,933 | |||||||||
| Teijin Ltd. | 1,086,000 | 7,331,370 | |||||||||
| Yara International ASA | 427,400 | 6,497,060 | |||||||||
| Chemicals Total | 72,631,887 | ||||||||||
| Construction Materials – 0.7% | |||||||||||
| Titan Cement Co. SA | 189,431 | 9,067,891 | |||||||||
| Construction Materials Total | 9,067,891 | ||||||||||
See Accompanying Notes to Financial Statements.
30
February 28, 2006 (Unaudited) Columbia International Stock Fund
| Shares | Value ($) | ||||||||||
| Common Stocks – (continued) | |||||||||||
| MATERIALS – (continued) | |||||||||||
| Metals & Mining – 1.2% | |||||||||||
| Kobe Steel Ltd. | 2,313,000 | 8,829,545 | |||||||||
| Rio Tinto PLC | 152,641 | 7,198,740 | |||||||||
| Metals & Mining Total | 16,028,285 | ||||||||||
| MATERIALS TOTAL | 97,728,063 | ||||||||||
| TELECOMMUNICATION SERVICES – 3.2% | |||||||||||
| Diversified Telecommunication Services – 2.6% | |||||||||||
| Chunghwa Telecom Co. Ltd., ADR | 505,100 | 9,546,390 | |||||||||
| Deutsche Telekom AG, Registered Shares | 795,701 | 12,555,752 | |||||||||
| Nippon Telegraph & Telephone Corp. | 2,136 | 9,281,124 | |||||||||
| PT Telekomunikasi Indonesia TBK, Series B Shares | 5,897,200 | 3,925,444 | |||||||||
| Diversified Telecommunication Services Total | 35,308,710 | ||||||||||
| Wireless Telecommunication Services – 0.6% | |||||||||||
| China Mobile Hong Kong Ltd. | 1,236,800 | 5,988,300 | |||||||||
| Taiwan Mobile Co., Ltd | 3,076,000 | 2,836,760 | |||||||||
| Wireless Telecommunication Services Total | 8,825,060 | ||||||||||
| TELECOMMUNICATION SERVICES TOTAL | 44,133,770 | ||||||||||
| UTILITIES – 4.3% | |||||||||||
| Electric Utilities – 2.8% | |||||||||||
| E.ON AG | 154,622 | 17,110,960 | |||||||||
| Endesa SA | 330,984 | 11,087,505 | |||||||||
| Terna S.p.A. | 3,980,050 | 10,472,346 | |||||||||
| Electric Utilities Total | 38,670,811 | ||||||||||
| Gas Utilities – 0.7% | |||||||||||
| Tokyo Gas Co., Ltd. | 1,610,000 | 7,326,186 | |||||||||
| Xinao Gas Holdings Ltd. | 2,812,000 | 2,380,114 | |||||||||
| Gas Utilities Total | 9,706,300 | ||||||||||
| Independent Power Producers & Energy Traders – 0.8% | |||||||||||
| Electric Power Development Co., Ltd. | 366,480 | 11,640,796 | |||||||||
| Independent Power Producers & Energy Traders Total | 11,640,796 | ||||||||||
| UTILITIES TOTAL | 60,017,907 | ||||||||||
| Total Common Stocks (cost of $1,103,433,792) | 1,356,232,502 | ||||||||||
| Shares | Value ($) | ||||||||||
| Investment Company – 0.8% | |||||||||||
| iShares MSCI EAFE Index Fund | 166,966 | 10,422,018 | |||||||||
| Total Investment Company (cost of $10,192,854) | 10,422,018 | ||||||||||
| Short-Term Obligation – 1.1% | Par ($) | ||||||||||
| Repurchase agreement with State Street Bank & Trust Co., dated 02/28/06, due 03/01/06 at 4.440%, collateralized by a U.S. Treasury Note maturing 08/15/10, market value of $15,503,400 (repurchase proceeds $15,198,874) | 15,197,000 | 15,197,000 | |||||||||
| Total Short-Term Obligation (cost of $15,197,000) | 15,197,000 | ||||||||||
| Total Investments – 99.8% (cost of $1,128,823,646) (b) | 1,381,851,520 | ||||||||||
| Other Assets & Liabilities, Net – 0.2% | 2,975,452 | ||||||||||
| Net Assets – 100.0% | 1,384,826,972 | ||||||||||
Notes to Investment Portfolio:
(a) Non-income producing security.
(b) Cost for federal income tax purposes is $1,128,823,646.
See Accompanying Notes to Financial Statements.
31
February 28, 2006 (Unaudited) Columbia International Stock Fund
The Fund was invested in the following countries at February 28, 2006:
| Summary of Securities by Country | Value | % of Total Investments | |||||||||
| Japan | $ | 339,064,162 | 24.5 | % | |||||||
| United Kingdom | 217,431,717 | 15.7 | |||||||||
| Germany | 120,775,855 | 8.7 | |||||||||
| Switzerland | 101,068,258 | 7.3 | |||||||||
| France | 97,133,445 | 7.0 | |||||||||
| Spain | 52,133,727 | 3.8 | |||||||||
| Sweden | 41,101,081 | 3.0 | |||||||||
| Hong Kong | 37,869,445 | 2.7 | |||||||||
| Norway | 36,461,545 | 2.6 | |||||||||
| Singapore | 36,245,348 | 2.6 | |||||||||
| Korea | 35,243,014 | 2.6 | |||||||||
| Finland | 32,954,375 | 2.4 | |||||||||
| Italy | 30,714,993 | 2.2 | |||||||||
| Taiwan | 29,880,216 | 2.2 | |||||||||
| Netherlands | 26,687,470 | 1.9 | |||||||||
| United States* | 25,619,018 | 1.9 | |||||||||
| Canada | 20,956,534 | 1.5 | |||||||||
| Australia | 20,642,158 | 1.5 | |||||||||
| China | 15,987,237 | 1.2 | |||||||||
| Denmark | 14,675,072 | 1.1 | |||||||||
| Belgium | 12,810,754 | 0.9 | |||||||||
| Thailand | 11,872,181 | 0.9 | |||||||||
| Ireland | 11,530,580 | 0.8 | |||||||||
| Greece | 9,067,891 | 0.7 | |||||||||
| Indonesia | 3,925,444 | 0.3 | |||||||||
| $ | 1,381,851,520 | 100.0 | % | ||||||||
* Includes Short-Term Obligation.
Certain securities are listed by country of underlying exposure but may trade predominately on other exchanges.
| Acronym | Name | ||||||
| ADR | American Depositary Receipt | ||||||
| NVDR | Non-Voting Depositary Receipt | ||||||
See Accompanying Notes to Financial Statements.
32
INVESTMENT PORTFOLIO
February 28, 2006 (Unaudited) Columbia Mid Cap Growth Fund
| Shares | Value ($) | ||||||||||
| Common Stocks – 97.5% | |||||||||||
| CONSUMER DISCRETIONARY – 17.7% | |||||||||||
| Diversified Consumer Services – 0.4% | |||||||||||
| Education Management Corp. (a) | 97,736 | 3,674,874 | |||||||||
| Diversified Consumer Services Total | 3,674,874 | ||||||||||
| Hotels, Restaurants & Leisure – 5.5% | |||||||||||
| Applebee's International, Inc. | 158,330 | 3,663,756 | |||||||||
| Brinker International, Inc. | 88,390 | 3,681,444 | |||||||||
| Cheesecake Factory, Inc. (a) | 213,020 | 7,702,803 | |||||||||
| Harrah's Entertainment, Inc. | 57,028 | 4,101,454 | |||||||||
| Hilton Hotels Corp. | 303,890 | 7,354,138 | |||||||||
| Marriott International, Inc., Class A | 72,970 | 4,991,148 | |||||||||
| Scientific Games Corp., Class A (a) | 120,900 | 3,697,122 | |||||||||
| Starwood Hotels & Resorts Worldwide, Inc. | 69,000 | 4,381,500 | |||||||||
| Wendy's International, Inc. | 68,050 | 3,940,095 | |||||||||
| Yum! Brands, Inc. | 163,400 | 7,794,180 | |||||||||
| Hotels, Restaurants & Leisure Total | 51,307,640 | ||||||||||
| Household Durables – 2.0% | |||||||||||
| Centex Corp. | 53,670 | 3,628,629 | |||||||||
| D.R. Horton, Inc. | 153,486 | 5,235,407 | |||||||||
| Fortune Brands, Inc. | 55,810 | 4,328,066 | |||||||||
| Lennar Corp., Class A | 47,600 | 2,849,336 | |||||||||
| NVR, Inc. (a) | 3,700 | 2,786,100 | |||||||||
| Household Durables Total | 18,827,538 | ||||||||||
| Internet & Catalog Retail – 0.7% | |||||||||||
| NetFlix, Inc. (a) | 224,560 | 6,020,453 | |||||||||
| Internet & Catalog Retail Total | 6,020,453 | ||||||||||
| Leisure Equipment & Products – 0.5% | |||||||||||
| SCP Pool Corp. | 110,770 | 4,815,172 | |||||||||
| Leisure Equipment & Products Total | 4,815,172 | ||||||||||
| Media – 2.1% | |||||||||||
| Cablevision Systems Corp. (a) | 91,700 | 2,407,125 | |||||||||
| Getty Images, Inc. (a) | 51,090 | 4,139,823 | |||||||||
| Grupo Televisa SA, ADR | 79,170 | 6,211,678 | |||||||||
| Lamar Advertising Co., Class A (a) | 68,010 | 3,469,870 | |||||||||
| XM Satellite Radio Holdings, Inc., Class A (a) | 160,725 | 3,550,415 | |||||||||
| Media Total | 19,778,911 | ||||||||||
| Specialty Retail – 5.1% | |||||||||||
| Abercrombie & Fitch Co., Class A | 151,940 | 10,228,601 | |||||||||
| Chico's FAS, Inc. (a) | 405,580 | 19,082,539 | |||||||||
| Shares | Value ($) | ||||||||||
| Children's Place Retail Stores, Inc. (a) | 69,820 | 3,258,499 | |||||||||
| GameStop Corp., Class A (a) | 159,800 | 6,396,794 | |||||||||
| PETsMART, Inc. | 167,290 | 4,342,849 | |||||||||
| Urban Outfitters, Inc. (a) | 158,163 | 4,444,380 | |||||||||
| Specialty Retail Total | 47,753,662 | ||||||||||
| Textiles, Apparel & Luxury Goods – 1.4% | |||||||||||
| Coach, Inc. (a) | 358,750 | 12,814,550 | |||||||||
| Textiles, Apparel & Luxury Goods Total | 12,814,550 | ||||||||||
| CONSUMER DISCRETIONARY TOTAL | 164,992,800 | ||||||||||
| CONSUMER STAPLES – 1.8% | |||||||||||
| Food & Staples Retailing – 0.5% | |||||||||||
| Whole Foods Market, Inc. | 68,500 | 4,375,780 | |||||||||
| Food & Staples Retailing Total | 4,375,780 | ||||||||||
| Food Products – 0.5% | |||||||||||
| H.J. Heinz Co. | 92,350 | 3,497,294 | |||||||||
| Tyson Foods, Inc., Class A | 131,200 | 1,775,136 | |||||||||
| Food Products Total | 5,272,430 | ||||||||||
| Personal Products – 0.6% | |||||||||||
| Alberto-Culver Co. | 65,600 | 2,995,952 | |||||||||
| Estee Lauder Companies, Inc., Class A | 63,080 | 2,360,454 | |||||||||
| Personal Products Total | 5,356,406 | ||||||||||
| Tobacco – 0.2% | |||||||||||
| UST, Inc. | 40,670 | 1,581,250 | |||||||||
| Tobacco Total | 1,581,250 | ||||||||||
| CONSUMER STAPLES TOTAL | 16,585,866 | ||||||||||
| ENERGY – 10.0% | |||||||||||
| Energy Equipment & Services – 5.1% | |||||||||||
| BJ Services Co. | 200,100 | 6,265,131 | |||||||||
| Diamond Offshore Drilling, Inc. | 80,140 | 6,202,035 | |||||||||
| ENSCO International, Inc. | 103,900 | 4,643,291 | |||||||||
| FMC Technologies, Inc. (a) | 176,270 | 8,270,588 | |||||||||
| Grant Prideco, Inc. (a) | 140,300 | 5,677,941 | |||||||||
| Nabors Industries Ltd. (a) | 67,670 | 4,462,836 | |||||||||
| National-Oilwell Varco, Inc. (a) | 64,700 | 3,938,936 | |||||||||
| Smith International, Inc. | 193,360 | 7,488,833 | |||||||||
| Energy Equipment & Services Total | 46,949,591 | ||||||||||
| Oil, Gas & Consumable Fuels – 4.9% | |||||||||||
| Chesapeake Energy Corp. | 110,440 | 3,278,964 | |||||||||
| EOG Resources, Inc. | 144,570 | 9,744,018 | |||||||||
| Massey Energy Co. | 112,600 | 4,188,720 | |||||||||
See Accompanying Notes to Financial Statements.
33
February 28, 2006 (Unaudited) Columbia Mid Cap Growth Fund
| Shares | Value ($) | ||||||||||
| Common Stocks – (continued) | |||||||||||
| ENERGY – (continued) | |||||||||||
| Oil, Gas & Consumable Fuels – (continued) | |||||||||||
| Peabody Energy Corp. | 165,040 | 7,966,481 | |||||||||
| Quicksilver Resources, Inc. (a) | 51,200 | 1,859,584 | |||||||||
| Southwestern Energy Co. (a) | 166,620 | 5,346,836 | |||||||||
| Tesoro Corp. | 64,000 | 3,866,240 | |||||||||
| XTO Energy, Inc. | 231,950 | 9,716,385 | |||||||||
| Oil, Gas & Consumable Fuels Total | 45,967,228 | ||||||||||
| ENERGY TOTAL | 92,916,819 | ||||||||||
| FINANCIALS – 7.1% | |||||||||||
| Capital Markets – 4.3% | |||||||||||
| Affiliated Managers Group, Inc. (a) | 90,830 | 8,940,397 | |||||||||
| E*TRADE Financial Corp. (a) | 281,180 | 7,192,585 | |||||||||
| Lazard Ltd., Class A | 272,300 | 10,478,104 | |||||||||
| Legg Mason, Inc. | 46,260 | 6,041,093 | |||||||||
| T. Rowe Price Group, Inc. | 97,200 | 7,463,016 | |||||||||
| Capital Markets Total | 40,115,195 | ||||||||||
| Commercial Banks – 1.5% | |||||||||||
| East West Bancorp, Inc. | 174,520 | 6,577,659 | |||||||||
| Zions Bancorporation | 85,630 | 7,066,187 | |||||||||
| Commercial Banks Total | 13,643,846 | ||||||||||
| Diversified Financial Services – 0.8% | |||||||||||
| Chicago Mercantile Exchange Holdings, Inc. | 18,056 | 7,684,634 | |||||||||
| Diversified Financial Services Total | 7,684,634 | ||||||||||
| Insurance – 0.5% | |||||||||||
| Ambac Financial Group, Inc. | 67,610 | 5,080,891 | |||||||||
| Insurance Total | 5,080,891 | ||||||||||
| FINANCIALS TOTAL | 66,524,566 | ||||||||||
| HEALTH CARE – 17.6% | |||||||||||
| Biotechnology – 2.8% | |||||||||||
| Amylin Pharmaceuticals, Inc. (a) | 158,420 | 6,872,260 | |||||||||
| Celgene Corp. (a) | 83,000 | 3,154,000 | |||||||||
| Invitrogen Corp. (a) | 25,600 | 1,815,808 | |||||||||
| MedImmune, Inc. (a) | 120,500 | 4,397,045 | |||||||||
| Nektar Therapeutics (a) | 206,470 | 4,317,288 | |||||||||
| Neurocrine Biosciences, Inc. (a) | 86,855 | 5,698,556 | |||||||||
| Biotechnology Total | 26,254,957 | ||||||||||
| Shares | Value ($) | ||||||||||
| Health Care Equipment & Supplies – 4.6% | |||||||||||
| Biomet, Inc. | 177,169 | 6,448,952 | |||||||||
| DENTSPLY International, Inc. | 59,480 | 3,389,765 | |||||||||
| Gen-Probe, Inc. (a) | 138,510 | 6,919,960 | |||||||||
| ResMed, Inc. (a) | 146,504 | 5,946,597 | |||||||||
| Thermo Electron Corp. (a) | 199,510 | 6,907,036 | |||||||||
| Varian Medical Systems, Inc. (a) | 163,830 | 9,482,481 | |||||||||
| Waters Corp. (a) | 98,310 | 4,200,786 | |||||||||
| Health Care Equipment & Supplies Total | 43,295,577 | ||||||||||
| Health Care Providers & Services – 7.0% | |||||||||||
| Cerner Corp. (a) | 104,040 | 4,331,185 | |||||||||
| Community Health Systems, Inc. (a) | 116,570 | 4,420,334 | |||||||||
| Coventry Health Care, Inc. (a) | 186,490 | 11,118,534 | |||||||||
| DaVita, Inc. (a) | 175,225 | 10,231,388 | |||||||||
| Health Management Associates, Inc., Class A | 140,060 | 2,981,877 | |||||||||
| Henry Schein, Inc. (a) | 82,760 | 3,860,754 | |||||||||
| Humana, Inc. (a) | 139,500 | 7,207,965 | |||||||||
| Laboratory Corp. of America Holdings (a) | 112,760 | 6,552,484 | |||||||||
| Lincare Holdings, Inc. (a) | 48,300 | 1,975,470 | |||||||||
| Medco Health Solutions, Inc. (a) | 63,780 | 3,553,822 | |||||||||
| Quest Diagnostics, Inc. | 80,630 | 4,262,908 | |||||||||
| United Surgical Partners International, Inc. (a) | 123,135 | 4,328,195 | |||||||||
| Health Care Providers & Services Total | 64,824,916 | ||||||||||
| Pharmaceuticals – 3.2% | |||||||||||
| Allergan, Inc. | 72,460 | 7,844,519 | |||||||||
| Endo Pharmaceuticals Holdings, Inc. (a) | 134,335 | 4,234,239 | |||||||||
| Forest Laboratories, Inc. (a) | 79,750 | 3,660,525 | |||||||||
| Shire Pharmaceuticals Group PLC, ADR | 133,700 | 6,361,446 | |||||||||
| Teva Pharmaceutical Industries Ltd., ADR | 176,626 | 7,416,526 | |||||||||
| Pharmaceuticals Total | 29,517,255 | ||||||||||
| HEALTH CARE TOTAL | 163,892,705 | ||||||||||
| INDUSTRIALS – 12.8% | |||||||||||
| Aerospace & Defense – 2.2% | |||||||||||
| Armor Holdings, Inc. (a) | 91,540 | 5,376,144 | |||||||||
| BE Aerospace, Inc. (a) | 174,100 | 4,176,659 | |||||||||
| Hexcel Corp. (a) | 83,100 | 1,788,312 | |||||||||
| Rockwell Collins, Inc. | 171,820 | 9,132,233 | |||||||||
| Aerospace & Defense Total | 20,473,348 | ||||||||||
See Accompanying Notes to Financial Statements.
34
February 28, 2006 (Unaudited) Columbia Mid Cap Growth Fund
| Shares | Value ($) | ||||||||||
| Common Stocks – (continued) | |||||||||||
| INDUSTRIALS – (continued) | |||||||||||
| Air Freight & Logistics – 1.5% | |||||||||||
| C.H. Robinson Worldwide, Inc. | 188,240 | 8,436,917 | |||||||||
| UTI Worldwide, Inc. | 58,940 | 6,166,892 | |||||||||
| Air Freight & Logistics Total | 14,603,809 | ||||||||||
| Airlines – 0.6% | |||||||||||
| Southwest Airlines Co. | 316,570 | 5,308,879 | |||||||||
| Airlines Total | 5,308,879 | ||||||||||
| Commercial Services & Supplies – 3.9% | |||||||||||
| ChoicePoint, Inc. (a) | 182,570 | 8,106,108 | |||||||||
| Cintas Corp. | 75,090 | 3,085,448 | |||||||||
| Corporate Executive Board Co. | 147,930 | 14,793,000 | |||||||||
| Robert Half International, Inc. | 301,800 | 10,840,656 | |||||||||
| Commercial Services & Supplies Total | 36,825,212 | ||||||||||
| Construction & Engineering – 0.2% | |||||||||||
| Jacobs Engineering Group, Inc. (a) | 22,770 | 1,952,300 | |||||||||
| Construction & Engineering Total | 1,952,300 | ||||||||||
| Electrical Equipment – 1.2% | |||||||||||
| Rockwell Automation, Inc. | 130,780 | 8,915,273 | |||||||||
| Roper Industries, Inc. | 45,500 | 2,050,685 | |||||||||
| Electrical Equipment Total | 10,965,958 | ||||||||||
| Machinery – 2.6% | |||||||||||
| Joy Global, Inc. | 256,012 | 13,199,978 | |||||||||
| Terex Corp. (a) | 138,425 | 10,956,339 | |||||||||
| Machinery Total | 24,156,317 | ||||||||||
| Road & Rail – 0.6% | |||||||||||
| Landstar System, Inc. | 116,730 | 5,438,451 | |||||||||
| Road & Rail Total | 5,438,451 | ||||||||||
| INDUSTRIALS TOTAL | 119,724,274 | ||||||||||
| INFORMATION TECHNOLOGY – 19.2% | |||||||||||
| Communications Equipment – 2.5% | |||||||||||
| Comverse Technology, Inc. (a) | 339,770 | 9,771,785 | |||||||||
| CSR PLC (a) | 503,000 | 7,966,424 | |||||||||
| F5 Networks, Inc. (a) | 50,100 | 3,397,782 | |||||||||
| Harris Corp. | 58,730 | 2,682,787 | |||||||||
| Communications Equipment Total | 23,818,778 | ||||||||||
| Shares | Value ($) | ||||||||||
| Computers & Peripherals – 0.2% | |||||||||||
| Sun Microsystems, Inc. (a) | 563,500 | 2,349,795 | |||||||||
| Computers & Peripherals Total | 2,349,795 | ||||||||||
| Electronic Equipment & Instruments – 0.6% | |||||||||||
| Trimble Navigation Ltd. (a) | 137,600 | 5,629,216 | |||||||||
| Electronic Equipment & Instruments Total | 5,629,216 | ||||||||||
| Internet Software & Services – 0.4% | |||||||||||
| VeriSign, Inc. (a) | 168,250 | 3,980,795 | |||||||||
| Internet Software & Services Total | 3,980,795 | ||||||||||
| IT Services – 4.2% | |||||||||||
| Affiliated Computer Services, Inc., Class A (a) | 60,630 | 3,814,840 | |||||||||
| Alliance Data Systems Corp. (a) | 212,220 | 9,180,637 | |||||||||
| Cognizant Technology Solutions Corp., Class A (a) | 164,160 | 9,457,258 | |||||||||
| Fiserv, Inc. (a) | 74,170 | 3,078,055 | |||||||||
| Global Payments, Inc. | 130,000 | 6,767,800 | |||||||||
| Paychex, Inc. | 162,890 | 6,523,744 | |||||||||
| IT Services Total | 38,822,334 | ||||||||||
| Semiconductors & Semiconductor Equipment – 7.3% | |||||||||||
| Advanced Micro Devices, Inc. (a) | 109,700 | 4,242,099 | |||||||||
| Broadcom Corp., Class A (a) | 624,165 | 28,143,600 | |||||||||
| Intersil Corp., Class A | 188,900 | 5,353,426 | |||||||||
| Marvell Technology Group Ltd. (a) | 228,480 | 13,987,546 | |||||||||
| MEMC Electronic Materials, Inc. (a) | 191,670 | 6,419,028 | |||||||||
| National Semiconductor Corp. | 170,650 | 4,786,732 | |||||||||
| NVIDIA Corp. (a) | 103,710 | 4,887,852 | |||||||||
| Semiconductors & Semiconductor Equipment Total | 67,820,283 | ||||||||||
| Software – 4.0% | |||||||||||
| Amdocs Ltd. (a) | 153,560 | 5,085,907 | |||||||||
| Autodesk, Inc. | 81,939 | 3,085,003 | |||||||||
| Check Point Software Technologies Ltd. (a) | 70 | 1,488 | |||||||||
| Citrix Systems, Inc. (a) | 259,330 | 8,391,919 | |||||||||
| Hyperion Solutions Corp. (a) | 142,455 | 4,779,365 | |||||||||
| Intuit, Inc. (a) | 42,538 | 2,066,496 | |||||||||
| McAfee, Inc. (a) | 79,050 | 1,838,703 | |||||||||
| Mercury Interactive Corp. (a) | 115,150 | 4,087,825 | |||||||||
| NAVTEQ (a) | 170,650 | 7,902,802 | |||||||||
| Software Total | 37,239,508 | ||||||||||
| INFORMATION TECHNOLOGY TOTAL | 179,660,709 | ||||||||||
See Accompanying Notes to Financial Statements.
35
February 28, 2006 (Unaudited) Columbia Mid Cap Growth Fund
| Shares | Value ($) | ||||||||||
| Common Stocks – (continued) | |||||||||||
| MATERIALS – 5.8% | |||||||||||
| Chemicals – 2.0% | |||||||||||
| Ecolab, Inc. | 101,500 | 3,673,285 | |||||||||
| Potash Corp. of Saskatchewan, Inc. | 160,390 | 15,357,343 | |||||||||
| Chemicals Total | 19,030,628 | ||||||||||
| Construction Materials – 1.2% | |||||||||||
| Cemex SA de CV, ADR | 79,100 | 4,885,216 | |||||||||
| Eagle Materials, Inc. | 108,300 | 5,862,279 | |||||||||
| Construction Materials Total | 10,747,495 | ||||||||||
| Metals & Mining – 2.6% | |||||||||||
| Allegheny Technologies, Inc. | 58,100 | 2,934,631 | |||||||||
| Freeport-McMoRan Copper & Gold, Inc., Class B | 130,380 | 6,601,139 | |||||||||
| Inco Ltd. | 75,460 | 3,646,227 | |||||||||
| Phelps Dodge Corp. | 53,080 | 7,325,040 | |||||||||
| Zinifex Ltd. | 676,500 | 3,836,366 | |||||||||
| Metals & Mining Total | 24,343,403 | ||||||||||
| MATERIALS TOTAL | 54,121,526 | ||||||||||
| TELECOMMUNICATION SERVICES – 4.5% | |||||||||||
| Wireless Telecommunication Services – 4.5% | |||||||||||
| American Tower Corp., Class A (a) | 453,317 | 14,429,080 | |||||||||
| Crown Castle International Corp. (a) | 253,890 | 7,959,452 | |||||||||
| Millicom International Cellular SA (a) | 213,430 | 8,936,314 | |||||||||
| NII Holdings, Inc. (a) | 149,320 | 7,648,170 | |||||||||
| VimpelCom, ADR (a) | 68,530 | 3,015,320 | |||||||||
| Wireless Telecommunication Services Total | 41,988,336 | ||||||||||
| TELECOMMUNICATION SERVICES TOTAL | 41,988,336 | ||||||||||
| UTILITIES – 1.0% | |||||||||||
| Independent Power Producers & Energy Traders – 1.0% | |||||||||||
| AES Corp. (a) | 541,110 | 9,361,203 | |||||||||
| Independent Power Producers & Energy Traders Total | 9,361,203 | ||||||||||
| UTILITIES TOTAL | 9,361,203 | ||||||||||
| Total Common Stocks (cost of $660,865,629) | 909,768,804 | ||||||||||
| Par ($) | Value ($) | ||||||||||
| Short-Term Obligation – 2.3% | |||||||||||
| Repurchase agreement with State Street Bank & Trust Co., dated 02/28/06, due 03/01/06 at 4.440%, collateralized by a U.S. Treasury Note maturing 08/15/10, market value of $21,865,275 (repurchase proceeds $21,434,643) | 21,432,000 | 21,432,000 | |||||||||
| Total Short-Term Obligation (cost of $21,432,000) | 21,432,000 | ||||||||||
| Total Investments – 99.8% (cost of $682,297,629) (b) | 931,200,804 | ||||||||||
| Other Assets & Liabilities, Net – 0.2% | 1,924,698 | ||||||||||
| Net Assets – 100.0% | 933,125,502 | ||||||||||
Notes to Investment Portfolio:
(a) Non-income producing security.
(b) Cost for federal income tax purposes is $682,297,629.
At February 28, 2006, the Fund held investments in the following sectors:
| Sector | % of Net Assets | ||||||
| Information Technology | 19.2 | % | |||||
| Consumer Discretionary | 17.7 | ||||||
| Health Care | 17.6 | ||||||
| Industrials | 12.8 | ||||||
| Energy | 10.0 | ||||||
| Financials | 7.1 | ||||||
| Materials | 5.8 | ||||||
| Telecommunication Services | 4.5 | ||||||
| Consumer Staples | 1.8 | ||||||
| Utilities | 1.0 | ||||||
| Short-Term Obligation | 2.3 | ||||||
| Other Assets & Liabilities, Net | 0.2 | ||||||
| 100.0 | % | ||||||
| Acronym | Name | ||||||
| ADR | American Depositary Receipt | ||||||
See Accompanying Notes to Financial Statements.
36
INVESTMENT PORTFOLIO
February 28, 2006 (Unaudited) Columbia Small Cap Growth Fund I
| Shares | Value ($) | ||||||||||
| Common Stocks – 99.3% | |||||||||||
| CONSUMER DISCRETIONARY – 12.1% | |||||||||||
| Diversified Consumer Services – 0.4% | |||||||||||
| Laureate Education, Inc. (a) | 14,900 | 771,522 | |||||||||
| Diversified Consumer Services Total | 771,522 | ||||||||||
| Hotels, Restaurants & Leisure – 5.0% | |||||||||||
| Cosi, Inc. (a) | 108,000 | 1,005,480 | |||||||||
| Pinnacle Entertainment, Inc. (a) | 49,800 | 1,396,890 | |||||||||
| RARE Hospitality International, Inc. (a) | 34,270 | 1,096,640 | |||||||||
| Red Robin Gourmet Burgers, Inc. (a) | 24,400 | 975,756 | |||||||||
| Ruby Tuesday, Inc. | 21,300 | 608,115 | |||||||||
| Scientific Games Corp., Class A (a) | 85,040 | 2,600,523 | |||||||||
| Shuffle Master, Inc. (a) | 40,500 | 1,058,265 | |||||||||
| Trump Entertainment Resorts, Inc. (a) | 87,700 | 1,622,450 | |||||||||
| Hotels, Restaurants & Leisure Total | 10,364,119 | ||||||||||
| Household Durables – 0.1% | |||||||||||
| Tupperware Brands Corp. | 15,800 | 334,802 | |||||||||
| Household Durables Total | 334,802 | ||||||||||
| Internet & Catalog Retail – 2.5% | |||||||||||
| NetFlix, Inc. (a) | 48,490 | 1,300,017 | |||||||||
| Nutri/System, Inc. (a) | 11,300 | 485,561 | |||||||||
| VistaPrint Ltd. (a) | 91,934 | 3,324,334 | |||||||||
| Internet & Catalog Retail Total | 5,109,912 | ||||||||||
| Leisure Equipment & Products – 0.7% | |||||||||||
| SCP Pool Corp. | 34,000 | 1,477,980 | |||||||||
| Leisure Equipment & Products Total | 1,477,980 | ||||||||||
| Media – 0.3% | |||||||||||
| Radio One, Inc., Class D (a) | 72,500 | 604,650 | |||||||||
| Media Total | 604,650 | ||||||||||
| Specialty Retail – 3.1% | |||||||||||
| Aaron Rents, Inc. | 35,600 | 932,720 | |||||||||
| Children's Place Retail Stores, Inc. (a) | 37,830 | 1,765,526 | |||||||||
| GameStop Corp., Class A (a) | 35,400 | 1,417,062 | |||||||||
| Genesco, Inc. (a) | 9,600 | 389,760 | |||||||||
| Gymboree Corp. (a) | 57,500 | 1,314,450 | |||||||||
| Tractor Supply Co. (a) | 10,900 | 688,662 | |||||||||
| Specialty Retail Total | 6,508,180 | ||||||||||
| CONSUMER DISCRETIONARY TOTAL | 25,171,165 | ||||||||||
| Shares | Value ($) | ||||||||||
| CONSUMER STAPLES – 2.4% | |||||||||||
| Beverages – 0.3% | |||||||||||
| Hansen Natural Corp. (a) | 6,600 | 616,044 | |||||||||
| Beverages Total | 616,044 | ||||||||||
| Household Products – 0.9% | |||||||||||
| Central Garden & Pet Co. (a) | 34,400 | 1,869,984 | |||||||||
| Household Products Total | 1,869,984 | ||||||||||
| Personal Products – 1.2% | |||||||||||
| Playtex Products, Inc. (a) | 56,900 | 597,450 | |||||||||
| USANA Health Sciences, Inc. (a) | 42,900 | 1,851,135 | |||||||||
| Personal Products Total | 2,448,585 | ||||||||||
| CONSUMER STAPLES TOTAL | 4,934,613 | ||||||||||
| ENERGY – 8.0% | |||||||||||
| Energy Equipment & Services – 6.0% | |||||||||||
| Atwood Oceanics, Inc. (a) | 20,900 | 1,884,762 | |||||||||
| CAL Dive International, Inc. (a) | 48,528 | 1,708,671 | |||||||||
| Core Laboratories NV (a) | 37,500 | 1,719,375 | |||||||||
| Grey Wolf, Inc. (a) | 228,050 | 1,582,667 | |||||||||
| Oil States International, Inc. (a) | 26,100 | 901,233 | |||||||||
| Tetra Technologies, Inc. (a) | 44,967 | 1,690,759 | |||||||||
| Todco, Class A (a) | 27,500 | 921,800 | |||||||||
| Veritas DGC, Inc. (a) | 47,400 | 1,996,962 | |||||||||
| Energy Equipment & Services Total | 12,406,229 | ||||||||||
| Oil, Gas & Consumable Fuels – 2.0% | |||||||||||
| Carrizo Oil & Gas, Inc. (a) | 59,091 | 1,376,229 | |||||||||
| Foundation Coal Holdings, Inc. | 22,200 | 888,000 | |||||||||
| Frontier Oil Corp. | 19,000 | 878,750 | |||||||||
| Holly Corp. | 18,400 | 1,098,480 | |||||||||
| Oil, Gas & Consumable Fuels Total | 4,241,459 | ||||||||||
| ENERGY TOTAL | 16,647,688 | ||||||||||
| FINANCIALS – 6.2% | |||||||||||
| Capital Markets – 2.1% | |||||||||||
| Affiliated Managers Group, Inc. (a) | 43,501 | 4,281,803 | |||||||||
| Capital Markets Total | 4,281,803 | ||||||||||
| Commercial Banks – 1.8% | |||||||||||
| Signature Bank (a) | 47,440 | 1,537,056 | |||||||||
| Sterling Financial Corp. | 30,138 | 872,194 | |||||||||
| UCBH Holdings, Inc. | 45,700 | 818,030 | |||||||||
| Wintrust Financial Corp. | 11,400 | 600,552 | |||||||||
| Commercial Banks Total | 3,827,832 | ||||||||||
See Accompanying Notes to Financial Statements.
37
February 28, 2006 (Unaudited) Columbia Small Cap Growth Fund I
| Shares | Value ($) | ||||||||||
| Common Stocks – (continued) | |||||||||||
| FINANCIALS – (continued) | |||||||||||
| Diversified Financial Services – 0.7% | |||||||||||
| IntercontinentalExchange, Inc. (a) | 10,408 | 569,838 | |||||||||
| Nasdaq Stock Market, Inc. (a) | 19,500 | 789,945 | |||||||||
| Diversified Financial Services Total | 1,359,783 | ||||||||||
| Insurance – 1.6% | |||||||||||
| Hanover Insurance Group, Inc. | 26,870 | 1,301,852 | |||||||||
| ProAssurance Corp. (a) | 41,477 | 2,127,355 | |||||||||
| Insurance Total | 3,429,207 | ||||||||||
| FINANCIALS TOTAL | 12,898,625 | ||||||||||
| HEALTH CARE – 18.2% | |||||||||||
| Biotechnology – 4.3% | |||||||||||
| Alkermes, Inc. (a) | 34,000 | 863,940 | |||||||||
| Amylin Pharmaceuticals, Inc. (a) | 27,700 | 1,201,626 | |||||||||
| Digene Corp. (a) | 59,070 | 2,449,042 | |||||||||
| ICOS Corp. (a) | 27,400 | 661,162 | |||||||||
| Nektar Therapeutics (a) | 75,900 | 1,587,069 | |||||||||
| Neurocrine Biosciences, Inc. (a) | 21,970 | 1,441,452 | |||||||||
| United Therapeutics Corp. (a) | 13,200 | 813,648 | |||||||||
| Biotechnology Total | 9,017,939 | ||||||||||
| Health Care Equipment & Supplies – 5.5% | |||||||||||
| ArthroCare Corp. (a) | 24,432 | 1,103,594 | |||||||||
| Foxhollow Technologies, Inc. (a) | 21,400 | 568,384 | |||||||||
| Haemonetics Corp. (a) | 28,763 | 1,489,923 | |||||||||
| Hologic, Inc. (a) | 15,137 | 724,003 | |||||||||
| Intuitive Surgical, Inc. (a) | 9,800 | 883,960 | |||||||||
| Iris International, Inc. (a) | 30,788 | 699,811 | |||||||||
| Kyphon, Inc. (a) | 37,130 | 1,325,912 | |||||||||
| OraSure Technologies, Inc. (a) | 156,400 | 1,488,928 | |||||||||
| ResMed, Inc. (a) | 68,322 | 2,773,190 | |||||||||
| Thoratec Corp. (a) | 16,500 | 331,980 | |||||||||
| Health Care Equipment & Supplies Total | 11,389,685 | ||||||||||
| Health Care Providers & Services – 7.1% | |||||||||||
| Allscripts Healthcare Solutions, Inc. (a) | 58,023 | 1,087,931 | |||||||||
| Cerner Corp. (a) | 24,676 | 1,027,262 | |||||||||
| DaVita, Inc. (a) | 17,950 | 1,048,101 | |||||||||
| HealthExtras, Inc. (a) | 102,336 | 3,168,323 | |||||||||
| ICON PLC, ADR (a) | 56,614 | 2,717,472 | |||||||||
| LHC Group, Inc. (a) | 38,300 | 620,843 | |||||||||
| Matria Healthcare, Inc. (a) | 32,800 | 1,419,256 | |||||||||
| Pediatrix Medical Group, Inc. (a) | 10,700 | 1,009,866 | |||||||||
| Psychiatric Solutions, Inc. (a) | 19,100 | 630,873 | |||||||||
| United Surgical Partners International, Inc. (a) | 55,803 | 1,961,475 | |||||||||
| Health Care Providers & Services Total | 14,691,402 | ||||||||||
| Shares | Value ($) | ||||||||||
| Pharmaceuticals – 1.3% | |||||||||||
| Medicis Pharmaceutical Corp., Class A | 15,300 | 435,132 | |||||||||
| Salix Pharmaceuticals Ltd. (a) | 146,128 | 2,302,977 | |||||||||
| Pharmaceuticals Total | 2,738,109 | ||||||||||
| HEALTH CARE TOTAL | 37,837,135 | ||||||||||
| INDUSTRIALS – 23.2% | |||||||||||
| Aerospace & Defense – 4.0% | |||||||||||
| Armor Holdings, Inc. (a) | 23,600 | 1,386,028 | |||||||||
| BE Aerospace, Inc. (a) | 121,527 | 2,915,433 | |||||||||
| Ceradyne, Inc. (a) | 60,500 | 3,683,240 | |||||||||
| Hexcel Corp. (a) | 18,900 | 406,728 | |||||||||
| Aerospace & Defense Total | 8,391,429 | ||||||||||
| Air Freight & Logistics – 1.4% | |||||||||||
| Forward Air Corp. | 44,583 | 1,581,805 | |||||||||
| UTI Worldwide, Inc. | 11,862 | 1,241,121 | |||||||||
| Air Freight & Logistics Total | 2,822,926 | ||||||||||
| Building Products – 0.6% | |||||||||||
| ElkCorp. | 37,200 | 1,342,920 | |||||||||
| Building Products Total | 1,342,920 | ||||||||||
| Commercial Services & Supplies – 6.1% | |||||||||||
| Corporate Executive Board Co. | 37,116 | 3,711,600 | |||||||||
| Global Cash Access, Inc. (a) | 65,805 | 1,112,105 | |||||||||
| Huron Consulting Group, Inc. (a) | 62,298 | 1,709,457 | |||||||||
| Kenexa Corp. (a) | 92,578 | 2,473,684 | |||||||||
| LECG Corp. (a) | 47,307 | 764,954 | |||||||||
| Resources Connection, Inc. (a) | 73,066 | 2,010,776 | |||||||||
| Waste Connections, Inc. (a) | 21,400 | 784,096 | |||||||||
| Commercial Services & Supplies Total | 12,566,672 | ||||||||||
| Construction & Engineering – 1.8% | |||||||||||
| Perini Corp. (a) | 54,900 | 1,668,411 | |||||||||
| URS Corp. (a) | 48,145 | 2,098,640 | |||||||||
| Construction & Engineering Total | 3,767,051 | ||||||||||
| Electrical Equipment – 1.7% | |||||||||||
| Evergreen Solar, Inc. (a) | 59,700 | 930,723 | |||||||||
| General Cable Corp. (a) | 59,600 | 1,609,200 | |||||||||
| Roper Industries, Inc. | 22,120 | 996,948 | |||||||||
| Electrical Equipment Total | 3,536,871 | ||||||||||
See Accompanying Notes to Financial Statements.
38
February 28, 2006 (Unaudited) Columbia Small Cap Growth Fund I
| Shares | Value ($) | ||||||||||
| Common Stocks – (continued) | |||||||||||
| INDUSTRIALS – (continued) | |||||||||||
| Machinery – 6.6% | |||||||||||
| ESCO Technologies, Inc. (a) | 37,636 | 1,911,156 | |||||||||
| Joy Global, Inc. | 56,884 | 2,932,939 | |||||||||
| RBC Bearings, Inc. (a) | 63,266 | 1,248,238 | |||||||||
| Terex Corp. (a) | 38,754 | 3,067,379 | |||||||||
| Wabtec Corp. | 135,220 | 4,466,317 | |||||||||
| Machinery Total | 13,626,029 | ||||||||||
| Road & Rail – 1.0% | |||||||||||
| Landstar System, Inc. | 21,120 | 983,981 | |||||||||
| Old Dominion Freight Line, Inc. (a) | 37,850 | 997,726 | |||||||||
| Road & Rail Total | 1,981,707 | ||||||||||
| INDUSTRIALS TOTAL | 48,035,605 | ||||||||||
| INFORMATION TECHNOLOGY – 23.7% | |||||||||||
| Communications Equipment – 2.8% | |||||||||||
| CSR PLC (a) | 109,300 | 1,731,074 | |||||||||
| F5 Networks, Inc. (a) | 32,535 | 2,206,523 | |||||||||
| Ixia (a) | 150,148 | 1,810,785 | |||||||||
| Communications Equipment Total | 5,748,382 | ||||||||||
| Computers & Peripherals – 2.0% | |||||||||||
| Electronics for Imaging, Inc. (a) | 43,600 | 1,169,352 | |||||||||
| M-Systems Flash Disk Pioneers Ltd. (a) | 32,296 | 871,992 | |||||||||
| Presstek, Inc. (a) | 87,093 | 1,103,468 | |||||||||
| Rackable Systems, Inc. (a) | 26,815 | 1,057,316 | |||||||||
| Computers & Peripherals Total | 4,202,128 | ||||||||||
| Internet Software & Services – 1.5% | |||||||||||
| aQuantive, Inc. (a) | 45,900 | 1,220,481 | |||||||||
| Equinix, Inc. (a) | 24,940 | 1,307,853 | |||||||||
| Liquidity Services, Inc. (a) | 45,028 | 531,331 | |||||||||
| Internet Software & Services Total | 3,059,665 | ||||||||||
| IT Services – 4.2% | |||||||||||
| Acxiom Corp. | 50,500 | 1,306,940 | |||||||||
| CACI International, Inc., Class A (a) | 20,109 | 1,211,969 | |||||||||
| Euronet Worldwide, Inc. (a) | 80,460 | 2,820,928 | |||||||||
| Global Payments, Inc. | 41,312 | 2,150,703 | |||||||||
| Heartland Payment Systems, Inc. (a) | 54,600 | 1,203,930 | |||||||||
| IT Services Total | 8,694,470 | ||||||||||
| Shares | Value ($) | ||||||||||
| Semiconductors & Semiconductor Equipment – 7.7% | |||||||||||
| Atheros Communications, Inc. (a) | 106,300 | 2,187,654 | |||||||||
| ATMI, Inc. (a) | 64,620 | 1,940,539 | |||||||||
| Hittite Microwave Corp. (a) | 77,700 | 2,146,851 | |||||||||
| Microsemi Corp. (a) | 39,630 | 1,218,622 | |||||||||
| Silicon Laboratories, Inc. (a) | 9,600 | 460,608 | |||||||||
| SiRF Technology Holdings, Inc. (a) | 105,085 | 3,933,332 | |||||||||
| Tessera Technologies, Inc. (a) | 54,200 | 1,692,666 | |||||||||
| Trident Microsystems, Inc. (a) | 88,684 | 2,477,831 | |||||||||
| Semiconductors & Semiconductor Equipment Total | 16,058,103 | ||||||||||
| Software – 5.5% | |||||||||||
| Embarcadero Technologies, Inc. (a) | 205,791 | 1,409,668 | |||||||||
| Epicor Software Corp. (a) | 104,430 | 1,297,021 | |||||||||
| Hyperion Solutions Corp. (a) | 29,476 | 988,920 | |||||||||
| Informatica Corp. (a) | 98,200 | 1,573,164 | |||||||||
| Kronos, Inc. (a) | 15,400 | 631,554 | |||||||||
| Micros Systems, Inc. (a) | 21,972 | 951,168 | |||||||||
| Nuance Communications, Inc. (a) | 33,760 | 361,232 | |||||||||
| Quest Software, Inc. (a) | 78,500 | 1,143,745 | |||||||||
| Transaction Systems Architects, Inc. (a) | 36,600 | 1,220,976 | |||||||||
| Wind River Systems, Inc. (a) | 123,700 | 1,913,639 | |||||||||
| Software Total | 11,491,087 | ||||||||||
| INFORMATION TECHNOLOGY TOTAL | 49,253,835 | ||||||||||
| MATERIALS – 3.3% | |||||||||||
| Construction Materials – 0.8% | |||||||||||
| Eagle Materials, Inc. | 29,100 | 1,575,183 | |||||||||
| Construction Materials Total | 1,575,183 | ||||||||||
| Metals & Mining – 2.5% | |||||||||||
| Allegheny Technologies, Inc. | 33,132 | 1,673,497 | |||||||||
| Century Aluminum Co. (a) | 44,883 | 1,597,386 | |||||||||
| Cleveland-Cliffs, Inc. | 12,400 | 1,067,020 | |||||||||
| Zinifex Ltd. | 153,100 | 868,215 | |||||||||
| Metals & Mining Total | 5,206,118 | ||||||||||
| MATERIALS TOTAL | 6,781,301 | ||||||||||
| TELECOMMUNICATION SERVICES – 2.2% | |||||||||||
| Wireless Telecommunication Services – 2.2% | |||||||||||
| Dobson Communications Corp., Class A (a) | 134,900 | 976,676 | |||||||||
| Millicom International Cellular SA (a) | 46,584 | 1,950,472 | |||||||||
| SBA Communications Corp., Class A (a) | 75,707 | 1,702,651 | |||||||||
| Wireless Telecommunication Services Total | 4,629,799 | ||||||||||
| TELECOMMUNICATION SERVICES TOTAL | 4,629,799 | ||||||||||
| Total Common Stocks (cost of $151,333,379) | 206,189,766 | ||||||||||
See Accompanying Notes to Financial Statements.
39
February 28, 2006 (Unaudited) Columbia Small Cap Growth Fund I
| Par ($) | Value ($) | ||||||||||
| Short-Term Obligation – 0.8% | |||||||||||
| Repurchase agreement with State Street Bank & Trust Co., dated 02/28/06, due 03/01/06 at 4.440%, collateralized by a U.S. Treasury Note maturing 02/15/29, market value of $1,629,619 (repurchase proceeds $1,593,196) | 1,593,000 | 1,593,000 | |||||||||
| Total Short-Term Obligation (cost of $1,593,000) | 1,593,000 | ||||||||||
| Total Investments – 100.1% (cost of $152,926,379) (b) | 207,782,766 | ||||||||||
| Other Assets & Liabilities, Net – (0.1)% | (223,639 | ) | |||||||||
| Net Assets – 100.0% | 207,559,127 | ||||||||||
Notes to Investment Portfolio:
(a) Non-income producing security.
(b) Cost for federal income tax purposes is $152,926,379.
At February 28, 2006, the Fund held investments in the following sectors:
| Sector | % of Net Assets | ||||||
| Information Technology | 23.7 | % | |||||
| Industrials | 23.2 | ||||||
| Health Care | 18.2 | ||||||
| Consumer Discretionary | 12.1 | ||||||
| Energy | 8.0 | ||||||
| Financials | 6.2 | ||||||
| Materials | 3.3 | ||||||
| Consumer Staples | 2.4 | ||||||
| Telecommunication Services | 2.2 | ||||||
| Short-Term Obligation | 0.8 | ||||||
| Other Assets & Liabilities, Net | (0.1 | ) | |||||
| 100.0 | % | ||||||
| Acronym | Name | ||||||
| ADR | American Depositary Receipt | ||||||
See Accompanying Notes to Financial Statements.
40
INVESTMENT PORTFOLIO
February 28, 2006 (Unaudited) Columbia Real Estate Equity Fund
| Shares | Value ($) | ||||||||||
| Common Stocks – 98.3% | |||||||||||
| CONSUMER DISCRETIONARY – 11.5% | |||||||||||
| Hotels, Restaurants & Leisure – 11.5% | |||||||||||
| Hilton Hotels Corp. | 996,100 | 24,105,620 | |||||||||
| Marriott International, Inc., Class A | 325,600 | 22,271,040 | |||||||||
| Starwood Hotels & Resorts Worldwide, Inc. | 475,000 | 30,162,500 | |||||||||
| Hotels, Restaurants & Leisure Total | 76,539,160 | ||||||||||
| CONSUMER DISCRETIONARY TOTAL | 76,539,160 | ||||||||||
| FINANCIALS – 86.3% | |||||||||||
| Real Estate – 86.3% | |||||||||||
| Alexandria Real Estate Equities, Inc., REIT | 395,400 | 34,803,108 | |||||||||
| AMB Property Corp., REIT | 147,627 | 7,920,189 | |||||||||
| Archstone-Smith Trust, REIT | 393,571 | 18,655,265 | |||||||||
| AvalonBay Communities, Inc., REIT | 179,000 | 18,437,000 | |||||||||
| Boston Properties, Inc., REIT | 222,700 | 18,856,009 | |||||||||
| Brandywine Realty Trust, REIT | 151,455 | 4,448,233 | |||||||||
| Brookfield Properties Corp., REIT | 219,400 | 6,496,434 | |||||||||
| Corporate Office Properties Trust, REIT | 116,880 | 4,852,858 | |||||||||
| Cousins Properties, Inc., REIT | 1,007,250 | 30,892,357 | |||||||||
| Duke Realty Corp., REIT | 438,800 | 15,401,880 | |||||||||
| Equity Office Properties Trust, REIT | 743,637 | 23,387,384 | |||||||||
| Equity Residential Property Trust, REIT | 671,206 | 30,392,208 | |||||||||
| Essex Property Trust, Inc., REIT | 50,500 | 5,032,325 | |||||||||
| General Growth Properties, Inc., REIT | 617,280 | 31,104,739 | |||||||||
| Home Properties, Inc., REIT | 141,000 | 6,959,760 | |||||||||
| Host Marriott Corp., REIT | 1,001,200 | 19,453,316 | |||||||||
| iStar Financial, Inc., REIT | 737,950 | 28,115,895 | |||||||||
| Kimco Realty Corp., REIT | 828,300 | 29,760,819 | |||||||||
| Liberty Property Trust, REIT | 439,500 | 19,680,810 | |||||||||
| Macerich Co., REIT | 54,900 | 3,955,545 | |||||||||
| Mack-Cali Realty Corp., REIT | 365,900 | 16,428,910 | |||||||||
| Newcastle Investment Corp., REIT | 125,700 | 3,006,744 | |||||||||
| Pan Pacific Retail Properties, Inc., REIT | 219,200 | 15,170,832 | |||||||||
| ProLogis Trust, REIT | 534,106 | 28,051,247 | |||||||||
| Public Storage, Inc., REIT | 410,432 | 32,021,905 | |||||||||
| Regency Centers Corp., REIT | 297,600 | 19,195,200 | |||||||||
| Simon Property Group, Inc., REIT | 491,056 | 40,742,916 | |||||||||
| SL Green Realty Corp., REIT | 224,900 | 19,546,059 | |||||||||
| Sun Communities, Inc., REIT | 114,700 | 3,970,914 | |||||||||
| Taubman Centers, Inc., REIT | 106,400 | 4,228,336 | |||||||||
| United Dominion Realty Trust, Inc., REIT | 262,600 | 7,024,550 | |||||||||
| Vornado Realty Trust, REIT | 206,200 | 18,349,738 | |||||||||
| Weingarten Realty Investors, REIT | 190,200 | 7,490,076 | |||||||||
| Real Estate Total | 573,833,561 | ||||||||||
| FINANCIALS TOTAL | 573,833,561 | ||||||||||
| Shares | Value ($) | ||||||||||
| INDUSTRIALS – 0.5% | |||||||||||
| Marine – 0.5% | |||||||||||
| Alexander & Baldwin, Inc. | 65,300 | 3,182,069 | |||||||||
| Marine Total | 3,182,069 | ||||||||||
| INDUSTRIALS TOTAL | 3,182,069 | ||||||||||
| Total Common Stocks (cost of $316,665,376) | 653,554,790 | ||||||||||
| Short-Term Obligation – 1.8% | Par ($) | ||||||||||
| Repurchase agreement with State Street Bank & Trust Co., dated 02/28/06, due 03/01/06 at 4.440%, collateralized by a U.S. Treasury Note maturing 08/15/10, market value of $12,400,763 (repurchase proceeds $12,156,499) | 12,155,000 | 12,155,000 | |||||||||
| Total Short-Term Obligation (cost of $12,155,000) | 12,155,000 | ||||||||||
| Total Investments – 100.1% (cost of $328,820,376) (a) | 665,709,790 | ||||||||||
| Other Assets & Liabilities, Net – (0.1)% | (965,423 | ) | |||||||||
| Net Assets – 100.0% | 664,744,367 | ||||||||||
Notes to Investment Portfolio:
(a) Cost for federal income tax purposes is $328,820,376.
At February 28, 2006, the Fund held investments in the following sectors:
| Sector | % of Net Assets | ||||||
| Financials | 86.3 | % | |||||
| Consumer Discretionary | 11.5 | ||||||
| Industrials | 0.5 | ||||||
| Short-Term Obligation | 1.8 | ||||||
| Other Assets & Liabilities, Net | (0.1 | ) | |||||
| 100.0 | % | ||||||
| Acronym | Name | ||||||
| REIT | Real Estate Investment Trust | ||||||
See Accompanying Notes to Financial Statements.
41
INVESTMENT PORTFOLIO
February 28, 2006 (Unaudited) Columbia Technology Fund
| Shares | Value ($) | ||||||||||
| Common Stocks – 93.2% | |||||||||||
| CONSUMER DISCRETIONARY – 5.2% | |||||||||||
| Hotels, Restaurants & Leisure – 0.5% | |||||||||||
| Sportingbet PLC (a) | 105,550 | 735,231 | |||||||||
| Hotels, Restaurants & Leisure Total | 735,231 | ||||||||||
| Household Durables – 0.5% | |||||||||||
| Sony Corp., ADR | 15,820 | 741,642 | |||||||||
| Household Durables Total | 741,642 | ||||||||||
| Internet & Catalog Retail – 3.8% | |||||||||||
| Audible, Inc. (a) | 49,830 | 504,778 | |||||||||
| Blue Nile, Inc. (a) | 15,500 | 517,235 | |||||||||
| IAC/InterActiveCorp (a) | 40,790 | 1,192,699 | |||||||||
| NetFlix, Inc. (a) | 85,880 | 2,302,443 | |||||||||
| VistaPrint Ltd. (a) | 41,930 | 1,516,189 | |||||||||
| Internet & Catalog Retail Total | 6,033,344 | ||||||||||
| Media – 0.4% | |||||||||||
| XM Satellite Radio Holdings, Inc., Class A (a) | 31,792 | 702,285 | |||||||||
| Media Total | 702,285 | ||||||||||
| CONSUMER DISCRETIONARY TOTAL | 8,212,502 | ||||||||||
| FINANCIALS – 0.5% | |||||||||||
| Diversified Financial Services – 0.5% | |||||||||||
| NETeller PLC (a) | 64,720 | 853,400 | |||||||||
| Diversified Financial Services Total | 853,400 | ||||||||||
| FINANCIALS TOTAL | 853,400 | ||||||||||
| HEALTH CARE – 1.8% | |||||||||||
| Biotechnology – 1.4% | |||||||||||
| Combinatorx, Inc. (a) | 116,315 | 1,520,237 | |||||||||
| Panacos Pharmaceuticals, Inc. (a) | 98,160 | 714,605 | |||||||||
| Biotechnology Total | 2,234,842 | ||||||||||
| Health Care Equipment & Supplies – 0.4% | |||||||||||
| Gen-Probe, Inc. (a) | 14,130 | 705,935 | |||||||||
| Health Care Equipment & Supplies Total | 705,935 | ||||||||||
| HEALTH CARE TOTAL | 2,940,777 | ||||||||||
| INDUSTRIALS – 5.8% | |||||||||||
| Aerospace & Defense – 1.3% | |||||||||||
| Ceradyne, Inc. (a) | 34,000 | 2,069,920 | |||||||||
| Aerospace & Defense Total | 2,069,920 | ||||||||||
| Shares | Value ($) | ||||||||||
| Commercial Services & Supplies – 1.2% | |||||||||||
| Huron Consulting Group, Inc. (a) | 35,274 | 967,919 | |||||||||
| Kenexa Corp. (a) | 34,956 | 934,024 | |||||||||
| Commercial Services & Supplies Total | 1,901,943 | ||||||||||
| Electrical Equipment – 3.3% | |||||||||||
| BTU International, Inc. (a) | 68,975 | 1,007,725 | |||||||||
| Evergreen Solar, Inc. (a) | 110,990 | 1,730,334 | |||||||||
| Suntech Power Holdings Co. Ltd. (a) | 68,441 | 2,570,644 | |||||||||
| Electrical Equipment Total | 5,308,703 | ||||||||||
| INDUSTRIALS TOTAL | 9,280,566 | ||||||||||
| INFORMATION TECHNOLOGY – 67.1% | |||||||||||
| Communications Equipment – 11.3% | |||||||||||
| Cisco Systems, Inc. (a) | 144,350 | 2,921,644 | |||||||||
| Comverse Technology, Inc. (a) | 24,260 | 697,718 | |||||||||
| CSR PLC (a) | 341,370 | 5,406,557 | |||||||||
| Global IP Sound AB (a) | 61,750 | 233,348 | |||||||||
| Harris Corp. | 31,410 | 1,434,809 | |||||||||
| Nokia Oyj, ADR | 321,670 | 5,976,628 | |||||||||
| QUALCOMM, Inc. | 29,290 | 1,382,781 | |||||||||
| Communications Equipment Total | 18,053,485 | ||||||||||
| Computers & Peripherals – 4.1% | |||||||||||
| Apple Computer, Inc. (a) | 16,220 | 1,111,719 | |||||||||
| Electronics for Imaging, Inc. (a) | 48,667 | 1,305,249 | |||||||||
| International Business Machines Corp. | 14,090 | 1,130,581 | |||||||||
| M-Systems Flash Disk Pioneers Ltd. (a) | 8,940 | 241,380 | |||||||||
| Network Appliance, Inc. (a) | 22,410 | 743,116 | |||||||||
| SanDisk Corp. (a) | 20,250 | 1,221,885 | |||||||||
| Seagate Technology (a) | 27,850 | 739,974 | |||||||||
| Computers & Peripherals Total | 6,493,904 | ||||||||||
| Electronic Equipment & Instruments – 2.2% | |||||||||||
| I.D. Systems, Inc. (a) | 7,320 | 160,015 | |||||||||
| Novatel, Inc. (a) | 33,519 | 1,109,144 | |||||||||
| Trimble Navigation Ltd. (a) | 55,330 | 2,263,550 | |||||||||
| Electronic Equipment & Instruments Total | 3,532,709 | ||||||||||
| Internet Software & Services – 4.3% | |||||||||||
| eBay, Inc. (a) | 72,218 | 2,893,053 | |||||||||
| Google, Inc., Class A (a) | 3,940 | 1,428,723 | |||||||||
| Liquidity Services, Inc. (a) | 87,730 | 1,035,214 | |||||||||
| VeriSign, Inc. (a) | 24,720 | 584,875 | |||||||||
| Yahoo!, Inc. (a) | 28,310 | 907,619 | |||||||||
| Internet Software & Services Total | 6,849,484 | ||||||||||
See Accompanying Notes to Financial Statements.
42
February 28, 2006 (Unaudited) Columbia Technology Fund
| Shares | Value ($) | ||||||||||
| Common Stocks – (continued) | |||||||||||
| INFORMATION TECHNOLOGY – (continued) | |||||||||||
| IT Services – 5.7% | |||||||||||
| Accenture Ltd., Class A | 33,200 | 1,084,312 | |||||||||
| Affiliated Computer Services, Inc., Class A (a) | 14,690 | 924,295 | |||||||||
| Cognizant Technology Solutions Corp., Class A (a) | 40,450 | 2,330,325 | |||||||||
| Computer Sciences Corp. (a) | 13,440 | 730,330 | |||||||||
| DST Systems, Inc. (a) | 16,810 | 945,226 | |||||||||
| Euronet Worldwide, Inc. (a) | 15,170 | 531,860 | |||||||||
| Global Payments, Inc. | 22,220 | 1,156,773 | |||||||||
| Infosys Technologies Ltd., ADR | 9,950 | 704,460 | |||||||||
| RightNow Technologies, Inc. (a) | 42,380 | 698,846 | |||||||||
| IT Services Total | 9,106,427 | ||||||||||
| Semiconductors & Semiconductor Equipment – 26.0% | |||||||||||
| Advanced Micro Devices, Inc. (a) | 52,140 | 2,016,254 | |||||||||
| Atheros Communications, Inc. (a) | 143,160 | 2,946,233 | |||||||||
| ATI Technologies, Inc. (a) | 24,660 | 391,601 | |||||||||
| ATMI, Inc. (a) | 30,430 | 913,813 | |||||||||
| Broadcom Corp., Class A (a) | 145,928 | 6,579,871 | |||||||||
| Conexant Systems, Inc. (a) | 72,292 | 215,430 | |||||||||
| Hittite Microwave Corp. (a) | 55,097 | 1,522,330 | |||||||||
| Intersil Corp., Class A | 84,140 | 2,384,528 | |||||||||
| Marvell Technology Group Ltd. (a) | 112,780 | 6,904,392 | |||||||||
| MEMC Electronic Materials, Inc. (a) | 27,760 | 929,682 | |||||||||
| Micron Technology, Inc. (a) | 83,390 | 1,293,379 | |||||||||
| Netlogic Microsystems, Inc. (a) | 35,050 | 1,239,018 | |||||||||
| NVIDIA Corp. (a) | 43,670 | 2,058,167 | |||||||||
| Q-Cells AG (a) | 12,260 | 1,244,108 | |||||||||
| Samsung Electronics Co., Ltd., GDR (b) | 5,610 | 1,984,537 | |||||||||
| Silicon Laboratories, Inc. (a) | 18,590 | 891,948 | |||||||||
| SiRF Technology Holdings, Inc. (a) | 133,381 | 4,992,451 | |||||||||
| Trident Microsystems, Inc. (a) | 77,344 | 2,160,991 | |||||||||
| Zoran Corp. (a) | 36,100 | 714,058 | |||||||||
| Semiconductors & Semiconductor Equipment Total | 41,382,791 | ||||||||||
| Software – 13.5% | |||||||||||
| Adobe Systems, Inc. | 26,840 | 1,036,561 | |||||||||
| Amdocs Ltd. (a) | 46,030 | 1,524,514 | |||||||||
| Autodesk, Inc. | 7,560 | 284,634 | |||||||||
| Business Objects SA, ADR (a) | 22,670 | 845,364 | |||||||||
| Check Point Software Technologies Ltd. (a) | 36,290 | 771,525 | |||||||||
| Citrix Systems, Inc. (a) | 31,320 | 1,013,515 | |||||||||
| Electronic Arts, Inc. (a) | 11,160 | 579,985 | |||||||||
| Embarcadero Technologies, Inc. (a) | 47,540 | 325,649 | |||||||||
| Informatica Corp. (a) | 38,080 | 610,042 | |||||||||
| Intuit, Inc. (a) | 17,630 | 856,465 | |||||||||
| Shares | Value ($) | ||||||||||
| Kronos, Inc. (a) | 15,370 | 630,324 | |||||||||
| McAfee, Inc. (a) | 47,220 | 1,098,337 | |||||||||
| Mentor Graphics Corp. (a) | 41,580 | 466,943 | |||||||||
| Micros Systems, Inc. (a) | 15,706 | 679,913 | |||||||||
| Microsoft Corp. | 30,820 | 829,058 | |||||||||
| NAVTEQ (a) | 60,629 | 2,807,729 | |||||||||
| Oracle Corp. (a) | 79,110 | 982,546 | |||||||||
| Quest Software, Inc. (a) | 18,660 | 271,876 | |||||||||
| Red Hat, Inc. (a) | 12,350 | 331,845 | |||||||||
| SAP AG, ADR | 35,150 | 1,796,165 | |||||||||
| Symantec Corp. (a) | 44,484 | 751,335 | |||||||||
| Synopsys, Inc. (a) | 43,890 | 959,874 | |||||||||
| Transaction Systems Architects, Inc. (a) | 17,029 | 568,088 | |||||||||
| Wind River Systems, Inc. (a) | 98,110 | 1,517,762 | |||||||||
| Software Total | 21,540,049 | ||||||||||
| INFORMATION TECHNOLOGY TOTAL | 106,958,849 | ||||||||||
| TELECOMMUNICATION SERVICES – 12.8% | |||||||||||
| Diversified Telecommunication Services – 1.2% | |||||||||||
| Chunghwa Telecom Co. Ltd. | 67,867 | 1,282,686 | |||||||||
| Consolidated Communications Holdings, Inc. | 40,810 | 581,135 | |||||||||
| Diversified Telecommunication Services Total | 1,863,821 | ||||||||||
| Wireless Telecommunication Services – 11.6% | |||||||||||
| America Movil SA de CV, ADR | 95,320 | 3,310,464 | |||||||||
| American Tower Corp., Class A (a) | 77,333 | 2,461,509 | |||||||||
| Crown Castle International Corp. (a) | 39,510 | 1,238,638 | |||||||||
| Dobson Communications Corp., Class A (a) | 275,020 | 1,991,145 | |||||||||
| iPCS, Inc. (a) | 15,610 | 735,231 | |||||||||
| Leap Wireless International, Inc. (a) | 24,840 | 1,046,012 | |||||||||
| Millicom International Cellular SA (a) | 77,400 | 3,240,738 | |||||||||
| NII Holdings, Inc. (a) | 56,540 | 2,895,979 | |||||||||
| SBA Communications Corp., Class A (a) | 69,990 | 1,574,075 | |||||||||
| Wireless Telecommunication Services Total | 18,493,791 | ||||||||||
| TELECOMMUNICATION SERVICES TOTAL | 20,357,612 | ||||||||||
| Total Common Stocks (cost of $125,904,187) | 148,603,706 | ||||||||||
See Accompanying Notes to Financial Statements.
43
February 28, 2006 (Unaudited) Columbia Technology Fund
| Par ($) | Value ($) | ||||||||||
| Short-Term Obligation – 5.4% | |||||||||||
| Repurchase agreement with State Street Bank & Trust Co., dated 02/28/06, due 03/01/06 at 4.440%, collateralized by a U.S. Treasury Note maturing 08/15/10, market value of $8,769,600 (repurchase proceeds $8,594,060) | 8,593,000 | 8,593,000 | |||||||||
| Total Short-Term Obligation (cost of $8,593,000) | 8,593,000 | ||||||||||
| Total Investments – 98.6% (cost of $134,497,187) (c) | 157,196,706 | ||||||||||
| Other Assets & Liabilities, Net – 1.4% | 2,225,069 | ||||||||||
| Net Assets – 100.0% | 159,421,775 | ||||||||||
Notes to Investment Portfolio:
(a) Non-income producing security.
(b) Security exempt from registration pursuant to Rule 144A under the Securities Act of 1933. This security may be resold in transactions exempt from registration, normally to qualified institutional buyers. At February 28, 2006, the value of this security, which is not illiquid, represents 1.2% of net assets.
(c) Cost for federal income tax purposes is $134,497,187.
At February 28, 2006, the Fund held investments in the following sectors:
| Sector | % of Net Assets | ||||||
| Information Technology | 67.1 | % | |||||
| Telecommunication Services | 12.8 | ||||||
| Industrials | 5.8 | ||||||
| Consumer Discretionary | 5.2 | ||||||
| Health Care | 1.8 | ||||||
| Financials | 0.5 | ||||||
| Short-Term Obligation | 5.4 | ||||||
| Other Assets & Liabilities, Net | 1.4 | ||||||
| 100.0 | % | ||||||
| Acronym | Name | ||||||
| ADR | American Depositary Receipt | ||||||
| GDR | Global Depositary Receipt | ||||||
See Accompanying Notes to Financial Statements.
44
INVESTMENT PORTFOLIO
February 28, 2006 (Unaudited) Columbia Strategic Investor Fund
| Shares | Value ($) | ||||||||||
| Common Stocks – 80.9% | |||||||||||
| CONSUMER DISCRETIONARY – 7.3% | |||||||||||
| Auto Components – 0.2% | |||||||||||
| Nokian Renkaat Oyj | 70,000 | 1,114,048 | |||||||||
| Auto Components Total | 1,114,048 | ||||||||||
| Hotels, Restaurants & Leisure – 0.5% | |||||||||||
| Fairmont Hotels & Resorts, Inc. | 30,000 | 1,329,600 | |||||||||
| Yum! Brands, Inc. | 20,000 | 954,000 | |||||||||
| Hotels, Restaurants & Leisure Total | 2,283,600 | ||||||||||
| Household Durables – 0.4% | |||||||||||
| Makita Corp., ADR | 62,000 | 1,797,008 | |||||||||
| Household Durables Total | 1,797,008 | ||||||||||
| Internet & Catalog Retail – 0.2% | |||||||||||
| IAC/InterActiveCorp (a) | 28,750 | 840,650 | |||||||||
| Internet & Catalog Retail Total | 840,650 | ||||||||||
| Media – 2.2% | |||||||||||
| Cablevision Systems Corp. (a) | 50,000 | 1,312,500 | |||||||||
| Comcast Corp., Class A (a) | 102,500 | 2,741,875 | |||||||||
| Entravision Communications Corp., Class A (a) | 75,000 | 557,250 | |||||||||
| Liberty Media Corp., Class A (a) | 100,000 | 824,000 | |||||||||
| Media General, Inc., Class A | 30,000 | 1,503,000 | |||||||||
| News Corp., Class A | 75,000 | 1,221,000 | |||||||||
| Time Warner, Inc. | 157,500 | 2,726,325 | |||||||||
| Media Total | 10,885,950 | ||||||||||
| Multiline Retail – 1.7% | |||||||||||
| Federated Department Stores, Inc. | 19,468 | 1,383,007 | |||||||||
| Kohl's Corp. (a) | 57,500 | 2,766,325 | |||||||||
| Saks, Inc. (a) | 75,000 | 1,417,500 | |||||||||
| Stockmann Oyj Abp, Class B | 75,000 | 2,949,255 | |||||||||
| Multiline Retail Total | 8,516,087 | ||||||||||
| Specialty Retail – 1.2% | |||||||||||
| Bed Bath & Beyond, Inc. (a) | 49,000 | 1,765,960 | |||||||||
| CarMax, Inc. (a) | 20,000 | 628,400 | |||||||||
| Gap, Inc. | 110,000 | 2,039,400 | |||||||||
| TJX Companies, Inc. | 59,000 | 1,444,910 | |||||||||
| Specialty Retail Total | 5,878,670 | ||||||||||
| Shares | Value ($) | ||||||||||
| Textiles, Apparel & Luxury Goods – 0.9% | |||||||||||
| NIKE, Inc., Class B | 48,000 | 4,165,440 | |||||||||
| Textiles, Apparel & Luxury Goods Total | 4,165,440 | ||||||||||
| CONSUMER DISCRETIONARY TOTAL | 35,481,453 | ||||||||||
| CONSUMER STAPLES – 7.9% | |||||||||||
| Beverages – 1.5% | |||||||||||
| Anheuser-Busch Companies, Inc. | 37,500 | 1,557,750 | |||||||||
| Coca-Cola Co. | 114,000 | 4,784,580 | |||||||||
| Coca-Cola Enterprises, Inc. | 30,000 | 589,500 | |||||||||
| Constellation Brands, Inc., Class A (a) | 10,000 | 263,400 | |||||||||
| Beverages Total | 7,195,230 | ||||||||||
| Food & Staples Retailing – 2.3% | |||||||||||
| Kroger Co. (a) | 67,500 | 1,352,700 | |||||||||
| United Natural Foods, Inc. (a) | 40,000 | 1,330,400 | |||||||||
| Wal-Mart Stores, Inc. | 127,500 | 5,783,400 | |||||||||
| Walgreen Co. | 62,500 | 2,803,750 | |||||||||
| Food & Staples Retailing Total | 11,270,250 | ||||||||||
| Food Products – 3.0% | |||||||||||
| ConAgra Foods, Inc. | 47,000 | 988,410 | |||||||||
| Delta & Pine Land Co. | 50,000 | 1,265,500 | |||||||||
| General Mills, Inc. | 32,500 | 1,600,625 | |||||||||
| Nestle SA, Registered Shares | 12,000 | 3,526,995 | |||||||||
| Unilever NV, NY Shares | 47,500 | 3,305,525 | |||||||||
| Wrigley (Wm.) Jr. Co. | 58,000 | 3,685,320 | |||||||||
| Food Products Total | 14,372,375 | ||||||||||
| Personal Products – 0.2% | |||||||||||
| Avon Products, Inc. | 36,000 | 1,038,600 | |||||||||
| Personal Products Total | 1,038,600 | ||||||||||
| Tobacco – 0.9% | |||||||||||
| Altria Group, Inc. | 62,500 | 4,493,750 | |||||||||
| Tobacco Total | 4,493,750 | ||||||||||
| CONSUMER STAPLES TOTAL | 38,370,205 | ||||||||||
| ENERGY – 8.2% | |||||||||||
| Energy Equipment & Services – 3.9% | |||||||||||
| Cooper Cameron Corp. (a) | 35,000 | 1,417,500 | |||||||||
| Core Laboratories NV (a) | 20,000 | 917,000 | |||||||||
| Dril-Quip, Inc. (a) | 26,000 | 1,320,800 | |||||||||
| GlobalSantaFe Corp. | 20,000 | 1,106,800 | |||||||||
| Input/Output, Inc. (a) | 100,000 | 756,000 | |||||||||
| National-Oilwell Varco, Inc. (a) | 10,000 | 608,800 | |||||||||
| Schlumberger Ltd. | 57,500 | 6,612,500 | |||||||||
See Accompanying Notes to Financial Statements.
45
February 28, 2006 (Unaudited) Columbia Strategic Investor Fund
| Shares | Value ($) | ||||||||||
| Common Stocks – (continued) | |||||||||||
| ENERGY – (continued) | |||||||||||
| Energy Equipment & Services – (continued) | |||||||||||
| TGS Nopec Geophysical Co., ASA (a) | 17,000 | 963,271 | |||||||||
| Transocean, Inc. (a) | 67,500 | 5,007,150 | |||||||||
| Energy Equipment & Services Total | 18,709,821 | ||||||||||
| Oil, Gas & Consumable Fuels – 4.3% | |||||||||||
| Apache Corp. | 20,000 | 1,338,400 | |||||||||
| BP PLC, ADR | 32,500 | 2,158,650 | |||||||||
| Chevron Corp. | 48,000 | 2,711,040 | |||||||||
| ConocoPhillips | 50,000 | 3,048,000 | |||||||||
| Exxon Mobil Corp. | 113,500 | 6,738,495 | |||||||||
| McMoRan Exploration Co. (a) | 62,500 | 1,105,625 | |||||||||
| Newfield Exploration Co. (a) | 77,500 | 2,995,375 | |||||||||
| Plains Exploration & Production Co. (a) | 25,000 | 1,018,750 | |||||||||
| Oil, Gas & Consumable Fuels Total | 21,114,335 | ||||||||||
| ENERGY TOTAL | 39,824,156 | ||||||||||
| FINANCIALS – 14.2% | |||||||||||
| Capital Markets – 2.9% | |||||||||||
| Ameriprise Financial, Inc. | 50,000 | 2,274,000 | |||||||||
| Bank of New York Co., Inc. | 30,000 | 1,027,200 | |||||||||
| Charles Schwab Corp. | 97,500 | 1,580,475 | |||||||||
| Deutsche Bank AG, Registered Shares | 4,000 | 443,000 | |||||||||
| Lazard Ltd., Class A | 67,500 | 2,597,400 | |||||||||
| Morgan Stanley | 67,500 | 4,027,050 | |||||||||
| Nomura Holdings, Inc., ADR | 110,000 | 2,121,900 | |||||||||
| Capital Markets Total | 14,071,025 | ||||||||||
| Commercial Banks – 5.0% | |||||||||||
| Allied Irish Banks PLC, ADR | 30,000 | 1,434,000 | |||||||||
| HSBC Holdings PLC, ADR | 43,500 | 3,727,515 | |||||||||
| ICICI Bank Ltd., ADR | 79,500 | 2,441,445 | |||||||||
| Mitsubishi UFJ Financial Group, Inc., ADR | 300,000 | 4,470,000 | |||||||||
| Mizuho Financial Group, Inc. | 800 | 6,372,566 | |||||||||
| Raiffeisen International Bank Holding AG (a) | 24,000 | 2,001,688 | |||||||||
| SunTrust Banks, Inc. | 22,500 | 1,628,325 | |||||||||
| U.S. Bancorp | 75,000 | 2,318,250 | |||||||||
| Commercial Banks Total | 24,393,789 | ||||||||||
| Consumer Finance – 0.6% | |||||||||||
| SLM Corp. | 54,000 | 3,046,140 | |||||||||
| Consumer Finance Total | 3,046,140 | ||||||||||
| Shares | Value ($) | ||||||||||
| Diversified Financial Services – 2.0% | |||||||||||
| Asset Acceptance Capital Corp. (a) | 70,000 | 1,399,300 | |||||||||
| Citigroup, Inc. | 75,000 | 3,477,750 | |||||||||
| JPMorgan Chase & Co. | 120,200 | 4,945,028 | |||||||||
| Diversified Financial Services Total | 9,822,078 | ||||||||||
| Insurance – 3.4% | |||||||||||
| American International Group, Inc. | 50,000 | 3,318,000 | |||||||||
| Arthur J. Gallagher & Co. | 62,500 | 1,843,125 | |||||||||
| Axis Capital Holdings Ltd. | 20,000 | 619,200 | |||||||||
| Berkshire Hathaway, Inc., Class B (a) | 1,000 | 2,888,000 | |||||||||
| Hannover Rueckversicherung AG, Registered Shares | 75,500 | 2,863,085 | |||||||||
| Marsh & McLennan Companies, Inc. | 40,000 | 1,236,400 | |||||||||
| St. Paul Travelers Companies, Inc. | 50,005 | 2,149,215 | |||||||||
| XL Capital Ltd., Class A | 20,000 | 1,351,000 | |||||||||
| Insurance Total | 16,268,025 | ||||||||||
| Thrifts & Mortgage Finance – 0.3% | |||||||||||
| Freddie Mac | 17,500 | 1,179,325 | |||||||||
| Thrifts & Mortgage Finance Total | 1,179,325 | ||||||||||
| FINANCIALS TOTAL | 68,780,382 | ||||||||||
| HEALTH CARE – 13.9% | |||||||||||
| Biotechnology – 1.9% | |||||||||||
| Amgen, Inc. (a) | 27,500 | 2,075,975 | |||||||||
| Applera Corp.-Applied Biosystems Group | 92,500 | 2,614,975 | |||||||||
| Biogen Idec, Inc. (a) | 47,500 | 2,244,375 | |||||||||
| Chiron Corp. (a) | 20,000 | 913,400 | |||||||||
| Qiagen NV (a) | 100,000 | 1,491,000 | |||||||||
| Biotechnology Total | 9,339,725 | ||||||||||
| Health Care Equipment & Supplies – 3.6% | |||||||||||
| Baxter International, Inc. | 87,500 | 3,311,875 | |||||||||
| Cytyc Corp. (a) | 32,500 | 936,975 | |||||||||
| DENTSPLY International, Inc. | 38,000 | 2,165,620 | |||||||||
| Hospira, Inc. (a) | 97,500 | 3,870,750 | |||||||||
| Medtronic, Inc. | 50,000 | 2,697,500 | |||||||||
| STERIS Corp. | 30,000 | 743,100 | |||||||||
| Viasys Healthcare, Inc. (a) | 50,000 | 1,459,000 | |||||||||
| Zimmer Holdings, Inc. (a) | 34,000 | 2,352,120 | |||||||||
| Health Care Equipment & Supplies Total | 17,536,940 | ||||||||||
| Health Care Providers & Services – 3.5% | |||||||||||
| Cardinal Health, Inc. | 10,000 | 726,000 | |||||||||
| Community Health Systems, Inc. (a) | 50,000 | 1,896,000 | |||||||||
| Health Management Associates, Inc., Class A | 30,000 | 638,700 | |||||||||
| Henry Schein, Inc. (a) | 35,000 | 1,632,750 | |||||||||
See Accompanying Notes to Financial Statements.
46
February 28, 2006 (Unaudited) Columbia Strategic Investor Fund
| Shares | Value ($) | ||||||||||
| Common Stocks – (continued) | |||||||||||
| HEALTH CARE – (continued) | |||||||||||
| Health Care Providers & Services – (continued) | |||||||||||
| LifePoint Hospitals, Inc. (a) | 56,000 | 1,739,360 | |||||||||
| McKesson Corp. | 56,000 | 3,031,280 | |||||||||
| Omnicare, Inc. | 52,500 | 3,194,625 | |||||||||
| Patterson Companies, Inc. (a) | 73,000 | 2,630,920 | |||||||||
| Quest Diagnostics, Inc. | 25,000 | 1,321,750 | |||||||||
| Health Care Providers & Services Total | 16,811,385 | ||||||||||
| Pharmaceuticals – 4.9% | |||||||||||
| Abbott Laboratories | 40,000 | 1,767,200 | |||||||||
| Andrx Corp. (a) | 100,000 | 1,960,000 | |||||||||
| Eli Lilly & Co. | 30,000 | 1,668,600 | |||||||||
| Gedeon Richter Ltd. | 12,500 | 2,545,672 | |||||||||
| Johnson & Johnson | 76,000 | 4,381,400 | |||||||||
| Novartis AG, ADR | 30,000 | 1,597,500 | |||||||||
| Novo-Nordisk A/S, Class B | 21,000 | 1,234,437 | |||||||||
| Pfizer, Inc. | 65,700 | 1,720,683 | |||||||||
| Sanofi-Aventis, ADR | 27,000 | 1,151,010 | |||||||||
| Shire Pharmaceuticals Group PLC, ADR | 20,000 | 951,600 | |||||||||
| Valeant Pharmaceuticals International | 100,000 | 1,782,000 | |||||||||
| Watson Pharmaceuticals, Inc. (a) | 62,500 | 1,873,750 | |||||||||
| Wyeth | 20,000 | 996,000 | |||||||||
| Pharmaceuticals Total | 23,629,852 | ||||||||||
| HEALTH CARE TOTAL | 67,317,902 | ||||||||||
| INDUSTRIALS – 8.7% | |||||||||||
| Aerospace & Defense – 0.3% | |||||||||||
| Raytheon Co. | 30,000 | 1,302,000 | |||||||||
| Aerospace & Defense Total | 1,302,000 | ||||||||||
| Air Freight & Logistics – 1.1% | |||||||||||
| United Parcel Service, Inc., Class B | 48,500 | 3,623,435 | |||||||||
| Yamato Transport Co., Ltd. | 100,000 | 1,915,527 | |||||||||
| Air Freight & Logistics Total | 5,538,962 | ||||||||||
| Commercial Services & Supplies – 1.2% | |||||||||||
| Avery Dennison Corp. | 57,500 | 3,450,000 | |||||||||
| R.R. Donnelley & Sons Co. | 62,500 | 2,103,750 | |||||||||
| Commercial Services & Supplies Total | 5,553,750 | ||||||||||
| Construction & Engineering – 0.7% | |||||||||||
| Foster Wheeler Ltd. (a) | 72,500 | 3,480,000 | |||||||||
| Construction & Engineering Total | 3,480,000 | ||||||||||
| Shares | Value ($) | ||||||||||
| Electrical Equipment – 0.4% | |||||||||||
| Thomas & Betts Corp. (a) | 41,000 | 2,017,200 | |||||||||
| Electrical Equipment Total | 2,017,200 | ||||||||||
| Industrial Conglomerates – 1.6% | |||||||||||
| General Electric Co. | 173,000 | 5,686,510 | |||||||||
| Siemens AG, ADR | 22,500 | 2,069,550 | |||||||||
| Industrial Conglomerates Total | 7,756,060 | ||||||||||
| Machinery – 2.4% | |||||||||||
| Caterpillar, Inc. | 50,000 | 3,654,000 | |||||||||
| Deere & Co. | 25,000 | 1,906,750 | |||||||||
| Eaton Corp. | 20,000 | 1,393,400 | |||||||||
| Hitachi Construction Machinery Co., Ltd. | 100,000 | 2,447,762 | |||||||||
| Pall Corp. | 50,000 | 1,471,000 | |||||||||
| Timken Co. | 20,000 | 573,600 | |||||||||
| Machinery Total | 11,446,512 | ||||||||||
| Marine – 0.5% | |||||||||||
| A.P. Moller-Maersk A/S | 280 | 2,565,969 | |||||||||
| Marine Total | 2,565,969 | ||||||||||
| Trading Companies & Distributors – 0.5% | |||||||||||
| GATX Corp. | 62,500 | 2,481,250 | |||||||||
| Trading Companies & Distributors Total | 2,481,250 | ||||||||||
| INDUSTRIALS TOTAL | 42,141,703 | ||||||||||
| INFORMATION TECHNOLOGY – 10.4% | |||||||||||
| Communications Equipment – 2.4% | |||||||||||
| Andrew Corp. (a) | 82,500 | 1,118,700 | |||||||||
| Cisco Systems, Inc. (a) | 137,500 | 2,783,000 | |||||||||
| Corning, Inc. (a) | 67,500 | 1,647,675 | |||||||||
| CSR PLC (a) | 79,000 | 1,251,188 | |||||||||
| Nokia Oyj, ADR | 100,000 | 1,858,000 | |||||||||
| Packeteer, Inc. (a) | 100,000 | 1,196,000 | |||||||||
| QUALCOMM, Inc. | 20,000 | 944,200 | |||||||||
| Tellabs, Inc. (a) | 50,000 | 734,500 | |||||||||
| Communications Equipment Total | 11,533,263 | ||||||||||
| Computers & Peripherals – 2.2% | |||||||||||
| Dell, Inc. (a) | 70,000 | 2,030,000 | |||||||||
| Electronics for Imaging, Inc. (a) | 72,500 | 1,944,450 | |||||||||
| Hewlett-Packard Co. | 87,500 | 2,870,875 | |||||||||
| International Business Machines Corp. | 20,000 | 1,604,800 | |||||||||
| Palm, Inc. (a) | 50,000 | 2,065,000 | |||||||||
| Quantum Corp. (a) | 75,000 | 267,750 | |||||||||
| Computers & Peripherals Total | 10,782,875 | ||||||||||
See Accompanying Notes to Financial Statements.
47
February 28, 2006 (Unaudited) Columbia Strategic Investor Fund
| Shares | Value ($) | ||||||||||
| Common Stocks – (continued) | |||||||||||
| INFORMATION TECHNOLOGY – (continued) | |||||||||||
| Electronic Equipment & Instruments – 0.1% | |||||||||||
| Symbol Technologies, Inc. | 41,854 | 486,343 | |||||||||
| Electronic Equipment & Instruments Total | 486,343 | ||||||||||
| IT Services – 1.0% | |||||||||||
| DST Systems, Inc. (a) | 41,500 | 2,333,545 | |||||||||
| First Data Corp. | 49,250 | 2,222,653 | |||||||||
| IT Services Total | 4,556,198 | ||||||||||
| Office Electronics – 0.5% | |||||||||||
| Zebra Technologies Corp., Class A (a) | 54,687 | 2,413,884 | |||||||||
| Office Electronics Total | 2,413,884 | ||||||||||
| Semiconductors & Semiconductor Equipment – 2.8% | |||||||||||
| Advanced Micro Devices, Inc. (a) | 30,000 | 1,160,100 | |||||||||
| ASML Holding N.V., N.Y. Registered Shares (a) | 36,000 | 744,480 | |||||||||
| Intel Corp. | 50,000 | 1,030,000 | |||||||||
| LSI Logic Corp. (a) | 75,000 | 731,250 | |||||||||
| Micron Technology, Inc. (a) | 75,000 | 1,163,250 | |||||||||
| Samsung Electronics Co., Ltd., GDR (b) | 15,000 | 5,306,250 | |||||||||
| Sanken Electric Co. Ltd. | 74,000 | 1,108,119 | |||||||||
| Texas Instruments, Inc. | 67,500 | 2,014,875 | |||||||||
| United Microelectronics Corp. | 149,292 | 470,270 | |||||||||
| Semiconductors & Semiconductor Equipment Total | 13,728,594 | ||||||||||
| Software – 1.4% | |||||||||||
| Check Point Software Technologies Ltd. (a) | 60,000 | 1,275,600 | |||||||||
| Microsoft Corp. | 112,500 | 3,026,250 | |||||||||
| Novell, Inc. (a) | 100,000 | 951,000 | |||||||||
| Quest Software, Inc. (a) | 60,000 | 874,200 | |||||||||
| Wind River Systems, Inc. (a) | 40,000 | 618,800 | |||||||||
| Software Total | 6,745,850 | ||||||||||
| INFORMATION TECHNOLOGY TOTAL | 50,247,007 | ||||||||||
| MATERIALS – 5.1% | |||||||||||
| Chemicals – 2.1% | |||||||||||
| Air Products & Chemicals, Inc. | 27,500 | 1,764,400 | |||||||||
| Cabot Corp. | 40,000 | 1,480,800 | |||||||||
| Calgon Carbon Corp. | 50,000 | 389,000 | |||||||||
| Dow Chemical Co. | 20,000 | 860,600 | |||||||||
| International Flavors & Fragrances, Inc. | 47,000 | 1,627,610 | |||||||||
| Mosaic Co. (a) | 40,000 | 636,000 | |||||||||
| Potash Corp. of Saskatchewan, Inc. | 37,500 | 3,590,625 | |||||||||
| Chemicals Total | 10,349,035 | ||||||||||
| Shares | Value ($) | ||||||||||
| Construction Materials – 0.4% | |||||||||||
| Martin Marietta Materials, Inc. | 20,000 | 1,950,000 | |||||||||
| Construction Materials Total | 1,950,000 | ||||||||||
| Containers & Packaging – 0.2% | |||||||||||
| Packaging Corp. of America | 40,000 | 912,400 | |||||||||
| Containers & Packaging Total | 912,400 | ||||||||||
| Metals & Mining – 1.8% | |||||||||||
| AngloGold Ashanti Ltd., ADR | 30,000 | 1,527,600 | |||||||||
| Companhia Vale do Rio Doce, ADR | 67,500 | 3,134,025 | |||||||||
| Gammon Lake Resources, Inc. (a) | 50,000 | 802,000 | |||||||||
| Mittal Steel Co. NV, Class A | 67,000 | 2,219,040 | |||||||||
| Newmont Mining Corp. | 20,000 | 1,058,400 | |||||||||
| Metals & Mining Total | 8,741,065 | ||||||||||
| Paper & Forest Products – 0.6% | |||||||||||
| International Paper Co. | 30,000 | 983,100 | |||||||||
| Votorantim Celulose e Papel SA, ADR | 126,000 | 1,859,760 | |||||||||
| Paper & Forest Products Total | 2,842,860 | ||||||||||
| MATERIALS TOTAL | 24,795,360 | ||||||||||
| TELECOMMUNICATION SERVICES – 2.1% | |||||||||||
| Diversified Telecommunication Services – 1.6% | |||||||||||
| AT&T, Inc. | 42,500 | 1,172,575 | |||||||||
| BellSouth Corp. | 50,000 | 1,579,000 | |||||||||
| Chunghwa Telecom Co. Ltd., ADR | 76,000 | 1,436,400 | |||||||||
| Telekomunikasi Indonesia, ADR | 86,000 | 2,240,300 | |||||||||
| Verizon Communications, Inc. | 47,500 | 1,600,750 | |||||||||
| Diversified Telecommunication Services Total | 8,029,025 | ||||||||||
| Wireless Telecommunication Services – 0.5% | |||||||||||
| Nextel Partners, Inc., Class A (a) | 40,000 | 1,122,400 | |||||||||
| Sprint Nextel Corp. | 50,000 | 1,201,500 | |||||||||
| Wireless Telecommunication Services Total | 2,323,900 | ||||||||||
| TELECOMMUNICATION SERVICES TOTAL | 10,352,925 | ||||||||||
| UTILITIES – 3.1% | |||||||||||
| Electric Utilities – 1.3% | |||||||||||
| Edison International | 75,000 | 3,327,000 | |||||||||
| Entergy Corp. | 12,500 | 906,375 | |||||||||
| Exelon Corp. | 30,000 | 1,713,300 | |||||||||
| Westar Energy, Inc. | 30,000 | 645,600 | |||||||||
| Electric Utilities Total | 6,592,275 | ||||||||||
See Accompanying Notes to Financial Statements.
48
February 28, 2006 (Unaudited) Columbia Strategic Investor Fund
| Shares | Value ($) | ||||||||||
| Common Stocks – (continued) | |||||||||||
| UTILITIES – (continued) | |||||||||||
| Independent Power Producers & Energy Traders – 0.4% | |||||||||||
| Duke Energy Corp. | 40,000 | 1,136,000 | |||||||||
| Dynegy, Inc., Class A (a) | 117,500 | 635,675 | |||||||||
| Independent Power Producers & Energy Traders Total | 1,771,675 | ||||||||||
| Multi-Utilities – 1.1% | |||||||||||
| Dominion Resources, Inc. | 30,000 | 2,253,000 | |||||||||
| NiSource, Inc. | 75,000 | 1,539,750 | |||||||||
| TECO Energy, Inc. | 100,000 | 1,706,000 | |||||||||
| Multi-Utilities Total | 5,498,750 | ||||||||||
| Water-Utilities – 0.3% | |||||||||||
| California Water Service Group | 32,546 | 1,424,213 | |||||||||
| Water-Utilities Total | 1,424,213 | ||||||||||
| UTILITIES TOTAL | 15,286,913 | ||||||||||
| Total Common Stocks (cost of $299,237,979) | 392,598,006 | ||||||||||
| Investment Companies – 0.8% | |||||||||||
| iShares MSCI Malaysia Index Fund | 150,000 | 1,101,000 | |||||||||
| Japan Smaller Capitalization Fund, Inc. (a) | 100,000 | 1,576,000 | |||||||||
| Thai Fund, Inc. | 100,000 | 1,075,000 | |||||||||
| Total Investment Companies (cost of $2,730,651) | 3,752,000 | ||||||||||
| Short-Term Obligations – 18.2% | Par ($) | ||||||||||
| REPURCHASE AGREEMENT – 16.4% | |||||||||||
| Repurchase agreement with State Street Bank & Trust Co., dated 02/28/06, due 03/01/06 at 4.440%, collateralized by a U.S. Treasury Note maturing 08/15/10, market value of $82,815,000 (repurchase proceeds $79,473,801) | 79,464,000 | 79,464,000 | |||||||||
| Par ($) | Value ($) | ||||||||||
| U.S. GOVERNMENT AGENCY – 1.8% | |||||||||||
| Federal Home Loan Bank Discount Note 2.600% 03/01/06 (c) | 8,840,000 | 8,840,000 | |||||||||
| Total Short-Term Obligations (cost of $88,304,000) | 88,304,000 | ||||||||||
| Total Investments – 99.9% (cost of $390,272,630) (d) | 484,654,006 | ||||||||||
| Other Assets & Liabilities, Net – 0.1% | 487,762 | ||||||||||
| Net Assets – 100.0% | 485,141,768 | ||||||||||
Notes to Investment Portfolio:
(a) Non-income producing security.
(b) Security exempt from registration pursuant to Rule 144A under the Securities Act of 1933. This security may be resold in transactions exempt from registration, normally to qualified institutional buyers. At February 28, 2006, the value of this security, which is not illiquid, represents 1.1% of net assets.
(c) The rate shown represents the annualized yield at the date of purchase.
(d) Cost for federal income tax purposes is $390,272,630.
At February 28, 2006, the Fund held investments in the following sectors:
| Sector | % of Net Assets | ||||||
| Financials | 14.2 | % | |||||
| Health Care | 13.9 | ||||||
| Information Technology | 10.4 | ||||||
| Industrials | 8.7 | ||||||
| Energy | 8.2 | ||||||
| Consumer Staples | 7.9 | ||||||
| Consumer Discretionary | 7.3 | ||||||
| Materials | 5.1 | ||||||
| Utilities | 3.1 | ||||||
| Telecommunication Services | 2.1 | ||||||
| Investment Companies | 0.8 | ||||||
| Short-Term Obligations | 18.2 | ||||||
| Other Assets & Liabilities, Net | 0.1 | ||||||
| 100.0 | % | ||||||
See Accompanying Notes to Financial Statements.
49
February 28, 2006 (Unaudited) Columbia Strategic Investor Fund
The Fund was invested in the following countries at February 28, 2006:
| Summary of Securities by Country | Value | % of Total Investments | |||||||||
| United States* | $ | 373,149,721 | 77.0 | % | |||||||
| Japan | 20,232,882 | 4.2 | |||||||||
| Netherlands | 8,677,045 | 1.8 | |||||||||
| United Kingdom | 8,088,953 | 1.7 | |||||||||
| Cayman Islands | 7,464,950 | 1.5 | |||||||||
| Bermuda | 6,696,600 | 1.4 | |||||||||
| Netherlands Antilles | 6,612,500 | 1.4 | |||||||||
| Finland | 5,921,303 | 1.2 | |||||||||
| Canada | 5,722,225 | 1.2 | |||||||||
| Germany | 5,375,635 | 1.1 | |||||||||
| Republic of Korea | 5,306,250 | 1.1 | |||||||||
| Switzerland | 5,124,495 | 1.0 | |||||||||
| Brazil | 4,993,785 | 1.0 | |||||||||
| Denmark | 3,800,406 | 0.8 | |||||||||
| Hungary | 2,545,672 | 0.5 | |||||||||
| India | 2,441,445 | 0.5 | |||||||||
| Indonesia | 2,240,300 | 0.5 | |||||||||
| Austria | 2,001,688 | 0.4 | |||||||||
| Taiwan | 1,906,670 | 0.4 | |||||||||
| South Africa | 1,527,600 | 0.3 | |||||||||
| Ireland | 1,434,000 | 0.3 | |||||||||
| Israel | 1,275,600 | 0.3 | |||||||||
| France | 1,151,010 | 0.2 | |||||||||
| Norway | 963,271 | 0.2 | |||||||||
| $ | 484,654,006 | 100.0 | % | ||||||||
* Includes Short-Term Obligations.
Certain securities are listed by country of underlying exposure but may trade predominately on other exchanges.
| Acronym | Name | ||||||
| ADR | American Depositary Receipt | ||||||
| GDR | Global Depositary Receipt | ||||||
See Accompanying Notes to Financial Statements.
50
INVESTMENT PORTFOLIO
February 28, 2006 (Unaudited) Columbia Balanced Fund
| Shares | Value ($) | ||||||||||
| Common Stocks – 61.9% | |||||||||||
| CONSUMER DISCRETIONARY – 9.5% | |||||||||||
| Diversified Consumer Services – 0.9% | |||||||||||
| Career Education Corp. (a) | 75,100 | 2,466,284 | |||||||||
| Diversified Consumer Services Total | 2,466,284 | ||||||||||
| Hotels, Restaurants & Leisure – 0.4% | |||||||||||
| Hilton Hotels Corp. | 41,700 | 1,009,140 | |||||||||
| Hotels, Restaurants & Leisure Total | 1,009,140 | ||||||||||
| Leisure Equipment & Products – 0.3% | |||||||||||
| Hasbro, Inc. | 48,470 | 983,456 | |||||||||
| Leisure Equipment & Products Total | 983,456 | ||||||||||
| Media – 6.5% | |||||||||||
| Clear Channel Communications, Inc. | 50,400 | 1,426,320 | |||||||||
| Comcast Corp., Class A (a) | 113,526 | 3,045,903 | |||||||||
| Dreamworks Animation SKG, Inc., Class A (a) | 48,400 | 1,306,800 | |||||||||
| Liberty Global, Inc., Class A (a) | 28,045 | 569,594 | |||||||||
| Liberty Global, Inc., Series C (a) | 25,745 | 499,453 | |||||||||
| Liberty Media Corp., Class A (a) | 295,520 | 2,435,085 | |||||||||
| News Corp., Class A | 159,460 | 2,596,009 | |||||||||
| Omnicom Group, Inc. | 15,300 | 1,221,246 | |||||||||
| Time Warner, Inc. | 181,830 | 3,147,477 | |||||||||
| Viacom, Inc., Class B (a) | 17,440 | 696,902 | |||||||||
| XM Satellite Radio Holdings, Inc., Class A (a) | 39,900 | 881,391 | |||||||||
| Media Total | 17,826,180 | ||||||||||
| Multiline Retail – 0.9% | |||||||||||
| Kohl's Corp. (a) | 50,230 | 2,416,565 | |||||||||
| Multiline Retail Total | 2,416,565 | ||||||||||
| Specialty Retail – 0.4% | |||||||||||
| RadioShack Corp. | 58,360 | 1,140,938 | |||||||||
| Specialty Retail Total | 1,140,938 | ||||||||||
| Textiles, Apparel & Luxury Goods – 0.1% | |||||||||||
| NIKE, Inc., Class B | 4,119 | 357,447 | |||||||||
| Textiles, Apparel & Luxury Goods Total | 357,447 | ||||||||||
| CONSUMER DISCRETIONARY TOTAL | 26,200,010 | ||||||||||
| Shares | Value ($) | ||||||||||
| CONSUMER STAPLES – 3.0% | |||||||||||
| Beverages – 0.9% | |||||||||||
| Coca-Cola Co. | 59,940 | 2,515,682 | |||||||||
| Beverages Total | 2,515,682 | ||||||||||
| Food & Staples Retailing – 0.3% | |||||||||||
| Sysco Corp. | 28,900 | 869,601 | |||||||||
| Food & Staples Retailing Total | 869,601 | ||||||||||
| Food Products – 0.6% | |||||||||||
| Smithfield Foods, Inc. (a) | 56,200 | 1,485,366 | |||||||||
| Food Products Total | 1,485,366 | ||||||||||
| Household Products – 0.6% | |||||||||||
| Colgate-Palmolive Co. | 32,130 | 1,750,442 | |||||||||
| Household Products Total | 1,750,442 | ||||||||||
| Tobacco – 0.6% | |||||||||||
| Altria Group, Inc. | 22,065 | 1,586,474 | |||||||||
| Tobacco Total | 1,586,474 | ||||||||||
| CONSUMER STAPLES TOTAL | 8,207,565 | ||||||||||
| ENERGY – 1.8% | |||||||||||
| Energy Equipment & Services – 0.5% | |||||||||||
| Transocean, Inc. (a) | 18,910 | 1,402,744 | |||||||||
| Energy Equipment & Services Total | 1,402,744 | ||||||||||
| Oil, Gas & Consumable Fuels – 1.3% | |||||||||||
| Anadarko Petroleum Corp. | 10,810 | 1,071,920 | |||||||||
| BP PLC, ADR | 14,360 | 953,791 | |||||||||
| Devon Energy Corp. | 27,870 | 1,634,018 | |||||||||
| Oil, Gas & Consumable Fuels Total | 3,659,729 | ||||||||||
| ENERGY TOTAL | 5,062,473 | ||||||||||
| FINANCIALS – 13.3% | |||||||||||
| Capital Markets – 2.5% | |||||||||||
| Ameriprise Financial, Inc. | 37,521 | 1,706,455 | |||||||||
| E*TRADE Financial Corp. (a) | 94,810 | 2,425,240 | |||||||||
| Lazard Ltd., Class A | 36,840 | 1,417,603 | |||||||||
| Morgan Stanley | 24,165 | 1,441,684 | |||||||||
| Capital Markets Total | 6,990,982 | ||||||||||
| Commercial Banks – 0.7% | |||||||||||
| Wachovia Corp. | 32,100 | 1,799,847 | |||||||||
| Commercial Banks Total | 1,799,847 | ||||||||||
See Accompanying Notes to Financial Statements.
51
February 28, 2006 (Unaudited) Columbia Balanced Fund
| Shares | Value ($) | ||||||||||
| Common Stocks – (continued) | |||||||||||
| FINANCIALS – (continued) | |||||||||||
| Consumer Finance – 0.6% | |||||||||||
| American Express Co. | 30,405 | 1,638,221 | |||||||||
| Consumer Finance Total | 1,638,221 | ||||||||||
| Diversified Financial Services – 2.6% | |||||||||||
| Citigroup, Inc. | 85,933 | 3,984,714 | |||||||||
| JPMorgan Chase & Co. | 77,780 | 3,199,869 | |||||||||
| Diversified Financial Services Total | 7,184,583 | ||||||||||
| Insurance – 6.1% | |||||||||||
| Ace Ltd. | 35,310 | 1,967,826 | |||||||||
| Ambac Financial Group, Inc. | 25,200 | 1,893,780 | |||||||||
| American International Group, Inc. | 53,350 | 3,540,306 | |||||||||
| Berkshire Hathaway, Inc., Class B (a) | 1,216 | 3,511,808 | |||||||||
| Chubb Corp. | 13,045 | 1,249,059 | |||||||||
| UnumProvident Corp. | 132,000 | 2,731,080 | |||||||||
| XL Capital Ltd., Class A | 27,200 | 1,837,360 | |||||||||
| Insurance Total | 16,731,219 | ||||||||||
| Thrifts & Mortgage Finance – 0.8% | |||||||||||
| MGIC Investment Corp. | 36,640 | 2,335,800 | |||||||||
| Thrifts & Mortgage Finance Total | 2,335,800 | ||||||||||
| FINANCIALS TOTAL | 36,680,652 | ||||||||||
| HEALTH CARE – 11.8% | |||||||||||
| Biotechnology – 2.1% | |||||||||||
| Amgen, Inc. (a) | 20,193 | 1,524,369 | |||||||||
| MedImmune, Inc. (a) | 42,230 | 1,540,973 | |||||||||
| Millennium Pharmaceuticals, Inc. (a) | 261,800 | 2,743,664 | |||||||||
| Biotechnology Total | 5,809,006 | ||||||||||
| Health Care Equipment & Supplies – 3.7% | |||||||||||
| Bausch & Lomb, Inc. | 19,800 | 1,370,358 | |||||||||
| Baxter International, Inc. | 24,200 | 915,970 | |||||||||
| Biomet, Inc. | 36,240 | 1,319,136 | |||||||||
| Stryker Corp. | 29,500 | 1,363,490 | |||||||||
| Thermo Electron Corp. (a) | 52,030 | 1,801,278 | |||||||||
| Waters Corp. (a) | 42,930 | 1,834,399 | |||||||||
| Zimmer Holdings, Inc. (a) | 22,800 | 1,577,304 | |||||||||
| Health Care Equipment & Supplies Total | 10,181,935 | ||||||||||
| Shares | Value ($) | ||||||||||
| Health Care Providers & Services – 2.3% | |||||||||||
| AmerisourceBergen Corp. | 33,280 | 1,530,547 | |||||||||
| Cardinal Health, Inc. | 28,350 | 2,058,210 | |||||||||
| Emdeon Corp. (a) | 161,140 | 1,698,416 | |||||||||
| McKesson Corp. | 21,130 | 1,143,767 | |||||||||
| Health Care Providers & Services Total | 6,430,940 | ||||||||||
| Pharmaceuticals – 3.7% | |||||||||||
| Abbott Laboratories | 60,499 | 2,672,846 | |||||||||
| Barr Pharmaceuticals, Inc. (a) | 25,550 | 1,716,449 | |||||||||
| Endo Pharmaceuticals Holdings, Inc. (a) | 76,756 | 2,419,349 | |||||||||
| Johnson & Johnson | 42,000 | 2,421,300 | |||||||||
| Teva Pharmaceutical Industries Ltd., ADR | 22,300 | 936,377 | |||||||||
| Pharmaceuticals Total | 10,166,321 | ||||||||||
| HEALTH CARE TOTAL | 32,588,202 | ||||||||||
| INDUSTRIALS – 6.8% | |||||||||||
| Aerospace & Defense – 1.1% | |||||||||||
| Honeywell International, Inc. | 70,490 | 2,886,565 | |||||||||
| Aerospace & Defense Total | 2,886,565 | ||||||||||
| Air Freight & Logistics – 0.8% | |||||||||||
| United Parcel Service, Inc., Class B | 29,200 | 2,181,532 | |||||||||
| Air Freight & Logistics Total | 2,181,532 | ||||||||||
| Airlines – 0.3% | |||||||||||
| UAL Corp. (a) | 24,300 | 861,921 | |||||||||
| Airlines Total | 861,921 | ||||||||||
| Commercial Services & Supplies – 1.4% | |||||||||||
| ARAMARK Corp., Class B | 81,500 | 2,319,490 | |||||||||
| Cintas Corp. | 35,720 | 1,467,735 | |||||||||
| Commercial Services & Supplies Total | 3,787,225 | ||||||||||
| Industrial Conglomerates – 1.5% | |||||||||||
| General Electric Co. | 72,400 | 2,379,788 | |||||||||
| Tyco International Ltd. | 66,000 | 1,702,140 | |||||||||
| Industrial Conglomerates Total | 4,081,928 | ||||||||||
| Machinery – 1.0% | |||||||||||
| Dover Corp. | 59,315 | 2,843,561 | |||||||||
| Machinery Total | 2,843,561 | ||||||||||
See Accompanying Notes to Financial Statements.
52
February 28, 2006 (Unaudited) Columbia Balanced Fund
| Shares | Value ($) | ||||||||||
| Common Stocks – (continued) | |||||||||||
| INDUSTRIALS – (continued) | |||||||||||
| Road & Rail – 0.7% | |||||||||||
| Union Pacific Corp. | 21,860 | 1,935,703 | |||||||||
| Road & Rail Total | 1,935,703 | ||||||||||
| INDUSTRIALS TOTAL | 18,578,435 | ||||||||||
| INFORMATION TECHNOLOGY – 12.9% | |||||||||||
| Communications Equipment – 2.3% | |||||||||||
| Avaya, Inc. (a) | 158,600 | 1,763,632 | |||||||||
| Cisco Systems, Inc. (a) | 141,750 | 2,869,020 | |||||||||
| Nortel Networks Corp. (a) | 551,500 | 1,577,290 | |||||||||
| Communications Equipment Total | 6,209,942 | ||||||||||
| Computers & Peripherals – 2.2% | |||||||||||
| Dell, Inc. (a) | 86,510 | 2,508,790 | |||||||||
| Hewlett-Packard Co. | 47,350 | 1,553,554 | |||||||||
| International Business Machines Corp. | 26,530 | 2,128,767 | |||||||||
| Computers & Peripherals Total | 6,191,111 | ||||||||||
| Electronic Equipment & Instruments – 0.5% | |||||||||||
| Symbol Technologies, Inc. | 124,400 | 1,445,528 | |||||||||
| Electronic Equipment & Instruments Total | 1,445,528 | ||||||||||
| Internet Software & Services – 0.9% | |||||||||||
| VeriSign, Inc. (a) | 107,100 | 2,533,986 | |||||||||
| Internet Software & Services Total | 2,533,986 | ||||||||||
| Semiconductors & Semiconductor Equipment – 2.9% | |||||||||||
| ATI Technologies, Inc. (a) | 137,821 | 2,188,597 | |||||||||
| Broadcom Corp., Class A (a) | 52,080 | 2,348,287 | |||||||||
| Intel Corp. | 69,850 | 1,438,910 | |||||||||
| Linear Technology Corp. | 54,000 | 1,990,440 | |||||||||
| Semiconductors & Semiconductor Equipment Total | 7,966,234 | ||||||||||
| Software – 4.1% | |||||||||||
| Electronic Arts, Inc. (a) | 18,260 | 948,972 | |||||||||
| Microsoft Corp. | 183,490 | 4,935,881 | |||||||||
| Oracle Corp. (a) | 191,575 | 2,379,362 | |||||||||
| Symantec Corp. (a) | 174,000 | 2,938,860 | |||||||||
| Software Total | 11,203,075 | ||||||||||
| INFORMATION TECHNOLOGY TOTAL | 35,549,876 | ||||||||||
| Shares | Value ($) | ||||||||||
| MATERIALS – 1.5% | |||||||||||
| Chemicals – 0.5% | |||||||||||
| Dow Chemical Co. | 27,800 | 1,196,234 | |||||||||
| Chemicals Total | 1,196,234 | ||||||||||
| Containers & Packaging – 1.0% | |||||||||||
| Smurfit-Stone Container Corp. (a) | 213,200 | 2,797,184 | |||||||||
| Containers & Packaging Total | 2,797,184 | ||||||||||
| MATERIALS TOTAL | 3,993,418 | ||||||||||
| TELECOMMUNICATION SERVICES – 1.3% | |||||||||||
| Diversified Telecommunication Services – 0.4% | |||||||||||
| CenturyTel, Inc. | 28,430 | 1,022,912 | |||||||||
| Diversified Telecommunication Services Total | 1,022,912 | ||||||||||
| Wireless Telecommunication Services – 0.9% | |||||||||||
| Sprint Nextel Corp. | 101,278 | 2,433,710 | |||||||||
| Wireless Telecommunication Services Total | 2,433,710 | ||||||||||
| TELECOMMUNICATION SERVICES TOTAL | 3,456,622 | ||||||||||
| Total Common Stocks (cost of $152,291,605) | 170,317,253 | ||||||||||
| Corporate Fixed-Income Bonds & Notes – 11.9% | Par ($) | ||||||||||
| BASIC MATERIALS – 0.4% | |||||||||||
| Chemicals – 0.1% | |||||||||||
| Airgas, Inc. | |||||||||||
| 9.125% 10/01/11 | 75,000 | 79,781 | |||||||||
| EquiStar Chemicals LP | |||||||||||
| 10.125% 09/01/08 | 25,000 | 26,875 | |||||||||
| 10.625% 05/01/11 | 25,000 | 27,000 | |||||||||
| Nalco Co. | |||||||||||
| 7.750% 11/15/11 | 25,000 | 25,594 | |||||||||
| Chemicals Total | 159,250 | ||||||||||
| Forest Products & Paper – 0.1% | |||||||||||
| Boise Cascade LLC | |||||||||||
| 7.125% 10/15/14 | 95,000 | 90,962 | |||||||||
| Westvaco Corp. | |||||||||||
| 8.200% 01/15/30 | 225,000 | 260,530 | |||||||||
| Forest Products & Paper Total | 351,492 | ||||||||||
| Iron/Steel – 0.0% | |||||||||||
| Russel Metals, Inc. | |||||||||||
| 6.375% 03/01/14 | 65,000 | 63,944 | |||||||||
| Iron/Steel Total | 63,944 | ||||||||||
See Accompanying Notes to Financial Statements.
53
February 28, 2006 (Unaudited) Columbia Balanced Fund
| Par ($) | Value ($) | ||||||||||
| Corporate Fixed-Income Bonds & Notes – (continued) | |||||||||||
| BASIC MATERIALS – (continued) | |||||||||||
| Metals & Mining – 0.2% | |||||||||||
| Alcan, Inc. | |||||||||||
| 4.500% 05/15/13 | 500,000 | 473,155 | |||||||||
| Metals & Mining Total | 473,155 | ||||||||||
| BASIC MATERIALS TOTAL | 1,047,841 | ||||||||||
| COMMUNICATIONS – 1.6% | |||||||||||
| Media – 0.6% | |||||||||||
| Comcast Corp. | |||||||||||
| 7.050% 03/15/33 | 375,000 | 403,777 | |||||||||
| DirecTV Holdings LLC | |||||||||||
| 8.375% 03/15/13 | 96,000 | 103,440 | |||||||||
| EchoStar DBS Corp. | |||||||||||
| 5.750% 10/01/08 | 90,000 | 88,987 | |||||||||
| 6.625% 10/01/14 | 85,000 | 82,662 | |||||||||
| Emmis Operating Co. | |||||||||||
| 6.875% 05/15/12 | 35,000 | 34,125 | |||||||||
| Lamar Media Corp. | |||||||||||
| 7.250% 01/01/13 | 150,000 | 154,875 | |||||||||
| LIN Television Corp. | |||||||||||
| 6.500% 05/15/13 | 50,000 | 48,000 | |||||||||
| R.H. Donnelley Finance Corp. | |||||||||||
| 10.875% 12/15/12 (b) | 115,000 | 129,375 | |||||||||
| Rogers Cable, Inc. | |||||||||||
| 7.875% 05/01/12 | 100,000 | 107,500 | |||||||||
| Time Warner, Inc. | |||||||||||
| 6.625% 05/15/29 | 425,000 | 431,957 | |||||||||
| Media Total | 1,584,698 | ||||||||||
| Telecommunication Services – 1.0% | |||||||||||
| American Towers, Inc. | |||||||||||
| 7.250% 12/01/11 | 20,000 | 20,950 | |||||||||
| Deutsche Telekom International Finance BV | |||||||||||
| 8.500% 06/15/10 | 525,000 | 577,438 | |||||||||
| New Cingular Wireless Services, Inc. | |||||||||||
| 8.750% 03/01/31 | 250,000 | 332,968 | |||||||||
| Nextel Communications, Inc. | |||||||||||
| 7.375% 08/01/15 | 175,000 | 185,274 | |||||||||
| Rogers Wireless, Inc. | |||||||||||
| 7.500% 03/15/15 | 15,000 | 16,312 | |||||||||
| 8.000% 12/15/12 | 30,000 | 32,175 | |||||||||
| Sprint Capital Corp. | |||||||||||
| 6.875% 11/15/28 | 450,000 | 493,294 | |||||||||
| Verizon Global Funding Corp. | |||||||||||
| 7.750% 12/01/30 | 700,000 | 817,798 | |||||||||
| Vodafone Group PLC | |||||||||||
| 7.750% 02/15/10 | 350,000 | 379,451 | |||||||||
| Telecommunication Services Total | 2,855,660 | ||||||||||
| COMMUNICATIONS TOTAL | 4,440,358 | ||||||||||
| Par ($) | Value ($) | ||||||||||
| CONSUMER CYCLICAL – 0.9% | |||||||||||
| Apparel – 0.0% | |||||||||||
| Phillips-Van Heusen Corp. | |||||||||||
| 7.250% 02/15/11 | 30,000 | 30,750 | |||||||||
| Apparel Total | 30,750 | ||||||||||
| Auto Manufacturers – 0.1% | |||||||||||
| DaimlerChrysler NA Holding Corp. | |||||||||||
| 8.500% 01/18/31 | 230,000 | 281,173 | |||||||||
| Auto Manufacturers Total | 281,173 | ||||||||||
| Auto Parts & Equipment – 0.0% | |||||||||||
| TRW Automotive, Inc. | |||||||||||
| 9.375% 02/15/13 | 25,000 | 27,187 | |||||||||
| Auto Parts & Equipment Total | 27,187 | ||||||||||
| Entertainment – 0.1% | |||||||||||
| Cinemark USA, Inc. | |||||||||||
| 9.000% 02/01/13 | 75,000 | 79,125 | |||||||||
| Speedway Motorsports, Inc. | |||||||||||
| 6.750% 06/01/13 | 96,000 | 97,680 | |||||||||
| Warner Music Group | |||||||||||
| 7.375% 04/15/14 | 60,000 | 60,300 | |||||||||
| Entertainment Total | 237,105 | ||||||||||
| Home Builders – 0.0% | |||||||||||
| K. Hovnanian Enterprises, Inc. | |||||||||||
| 6.000% 01/15/10 | 25,000 | 23,875 | |||||||||
| 6.375% 12/15/14 | 30,000 | 28,275 | |||||||||
| 6.500% 01/15/14 | 5,000 | 4,763 | |||||||||
| KB Home | |||||||||||
| 8.625% 12/15/08 | 75,000 | 79,312 | |||||||||
| Home Builders Total | 136,225 | ||||||||||
| Leisure Time – 0.1% | |||||||||||
| Royal Caribbean Cruises Ltd. | |||||||||||
| 6.750% 03/15/08 | 45,000 | 46,125 | |||||||||
| 6.875% 12/01/13 | 50,000 | 53,000 | |||||||||
| 8.750% 02/02/11 | 55,000 | 61,806 | |||||||||
| Leisure Time Total | 160,931 | ||||||||||
| Lodging – 0.2% | |||||||||||
| Caesars Entertainment, Inc. | |||||||||||
| 7.875% 03/15/10 | 45,000 | 48,150 | |||||||||
| 8.875% 09/15/08 | 15,000 | 16,200 | |||||||||
| 9.375% 02/15/07 | 35,000 | 36,225 | |||||||||
| Hilton Hotels Corp. | |||||||||||
| 7.500% 12/15/17 | 20,000 | 22,062 | |||||||||
See Accompanying Notes to Financial Statements.
54
February 28, 2006 (Unaudited) Columbia Balanced Fund
| Par ($) | Value ($) | ||||||||||
| Corporate Fixed-Income Bonds & Notes – (continued) | |||||||||||
| CONSUMER CYCLICAL – (continued) | |||||||||||
| Lodging – (continued) | |||||||||||
| MGM Mirage | |||||||||||
| 6.000% 10/01/09 | 45,000 | 44,663 | |||||||||
| 8.500% 09/15/10 | 30,000 | 32,400 | |||||||||
| Starwood Hotels & Resorts Worldwide, Inc. | |||||||||||
| 7.375% 05/01/07 | 150,000 | 153,750 | |||||||||
| Station Casinos, Inc. | |||||||||||
| 6.875% 03/01/16 | 165,000 | 167,475 | |||||||||
| Wynn Las Vegas LLC | |||||||||||
| 6.625% 12/01/14 | 70,000 | 69,125 | |||||||||
| Lodging Total | 590,050 | ||||||||||
| Retail – 0.4% | |||||||||||
| AmeriGas Partners LP. | |||||||||||
| 7.125% 05/20/16 | 15,000 | 15,150 | |||||||||
| AutoNation, Inc. | |||||||||||
| 9.000% 08/01/08 | 100,000 | 107,000 | |||||||||
| Couche-Tard | |||||||||||
| 7.500% 12/15/13 | 125,000 | 130,312 | |||||||||
| Domino's, Inc. | |||||||||||
| 8.250% 07/01/11 | 30,000 | 31,163 | |||||||||
| Group 1 Automotive, Inc. | |||||||||||
| 8.250% 08/15/13 | 50,000 | 50,000 | |||||||||
| Lowe's Companies, Inc. | |||||||||||
| 6.500% 03/15/29 | 700,000 | 784,226 | |||||||||
| Retail Total | 1,117,851 | ||||||||||
| CONSUMER CYCLICAL TOTAL | 2,581,272 | ||||||||||
| CONSUMER NON-CYCLICAL – 1.3% | |||||||||||
| Beverages – 0.4% | |||||||||||
| Bottling Group LLC | |||||||||||
| 2.450% 10/16/06 | 700,000 | 688,838 | |||||||||
| Constellation Brands, Inc. | |||||||||||
| 8.000% 02/15/08 | 175,000 | 182,437 | |||||||||
| Cott Beverages, Inc. | |||||||||||
| 8.000% 12/15/11 | 165,000 | 170,363 | |||||||||
| Beverages Total | 1,041,638 | ||||||||||
| Commercial Services – 0.1% | |||||||||||
| Corrections Corp. of America | |||||||||||
| 6.250% 03/15/13 | 25,000 | 24,875 | |||||||||
| 7.500% 05/01/11 | 100,000 | 103,500 | |||||||||
| Iron Mountain, Inc. | |||||||||||
| 7.750% 01/15/15 | 150,000 | 152,625 | |||||||||
| NationsRent Companies, Inc. | |||||||||||
| 9.500% 10/15/10 | 20,000 | 21,900 | |||||||||
| Par ($) | Value ($) | ||||||||||
| United Rentals, Inc. | |||||||||||
| 7.750% 11/15/13 | 45,000 | 45,113 | |||||||||
| Commercial Services Total | 348,013 | ||||||||||
| Food – 0.3% | |||||||||||
| Kroger Co. | |||||||||||
| 6.200% 06/15/12 | 400,000 | 410,252 | |||||||||
| Safeway, Inc. | |||||||||||
| 4.950% 08/16/10 | 400,000 | 389,007 | |||||||||
| Food Total | 799,259 | ||||||||||
| Healthcare Products – 0.1% | |||||||||||
| Baxter FinCo BV | |||||||||||
| 4.750% 10/15/10 (b) | 375,000 | 365,639 | |||||||||
| Healthcare Products Total | 365,639 | ||||||||||
| Healthcare Services – 0.2% | |||||||||||
| Extendicare Health Services, Inc. | |||||||||||
| 6.875% 05/01/14 | 30,000 | 28,800 | |||||||||
| 9.500% 07/01/10 | 10,000 | 10,400 | |||||||||
| Fisher Scientific International, Inc. | |||||||||||
| 6.750% 08/15/14 | 55,000 | 57,475 | |||||||||
| HCA, Inc. | |||||||||||
| 6.950% 05/01/12 | 125,000 | 128,511 | |||||||||
| Triad Hospitals, Inc. | |||||||||||
| 7.000% 05/15/12 | 25,000 | 25,625 | |||||||||
| WellPoint, Inc. | |||||||||||
| 6.800% 08/01/12 | 300,000 | 323,683 | |||||||||
| Healthcare Services Total | 574,494 | ||||||||||
| Household Products/Wares – 0.2% | |||||||||||
| Fortune Brands, Inc. | |||||||||||
| 5.125% 01/15/11 | 300,000 | 296,528 | |||||||||
| Scotts Co. | |||||||||||
| 6.625% 11/15/13 | 70,000 | 71,400 | |||||||||
| Household Products/Wares Total | 367,928 | ||||||||||
| Pharmaceuticals – 0.0% | |||||||||||
| Omnicare, Inc. | |||||||||||
| 6.750% 12/15/13 | 15,000 | 15,225 | |||||||||
| Pharmaceuticals Total | 15,225 | ||||||||||
| CONSUMER NON-CYCLICAL TOTAL | 3,512,196 | ||||||||||
See Accompanying Notes to Financial Statements.
55
February 28, 2006 (Unaudited) Columbia Balanced Fund
| Par ($) | Value ($) | ||||||||||
| Corporate Fixed-Income Bonds & Notes – (continued) | |||||||||||
| ENERGY – 0.9% | |||||||||||
| Coal – 0.1% | |||||||||||
| Arch Western Finance LLC | |||||||||||
| 6.750% 07/01/13 | 115,000 | 115,575 | |||||||||
| Massey Energy Co. | |||||||||||
| 6.875% 12/15/13 (b) | 40,000 | 40,200 | |||||||||
| Peabody Energy Corp. | |||||||||||
| 6.875% 03/15/13 | 120,000 | 124,200 | |||||||||
| Coal Total | 279,975 | ||||||||||
| Oil & Gas – 0.5% | |||||||||||
| Chesapeake Energy Corp. | |||||||||||
| 6.375% 06/15/15 | 15,000 | 15,000 | |||||||||
| 7.500% 09/15/13 | 145,000 | 154,425 | |||||||||
| Devon Energy Corp. | |||||||||||
| 7.950% 04/15/32 | 375,000 | 485,398 | |||||||||
| Marathon Oil Corp. | |||||||||||
| 6.800% 03/15/32 | 300,000 | 345,089 | |||||||||
| Newfield Exploration Co. | |||||||||||
| 6.625% 09/01/14 | 80,000 | 82,400 | |||||||||
| Plains Exploration & Production Co. | |||||||||||
| 7.125% 06/15/14 | 90,000 | 94,275 | |||||||||
| Pogo Producing Co. | |||||||||||
| 8.250% 04/15/11 | 20,000 | 20,850 | |||||||||
| Pride International, Inc. | |||||||||||
| 7.375% 07/15/14 | 110,000 | 117,700 | |||||||||
| Vintage Petroleum, Inc. | |||||||||||
| 7.875% 05/15/11 | 100,000 | 104,000 | |||||||||
| Oil & Gas Total | 1,419,137 | ||||||||||
| Oil & Gas Services – 0.1% | |||||||||||
| Hornbeck Offshore Services, Inc. | |||||||||||
| 6.125% 12/01/14 | 50,000 | 49,750 | |||||||||
| Universal Compression, Inc. | |||||||||||
| 7.250% 05/15/10 | 95,000 | 98,800 | |||||||||
| Oil & Gas Services Total | 148,550 | ||||||||||
| Pipelines – 0.2% | |||||||||||
| Atlas Pipeline Partners LP | |||||||||||
| 8.125% 12/15/15 (b) | 15,000 | 15,487 | |||||||||
| Kinder Morgan Energy Partners LP | |||||||||||
| 7.300% 08/15/33 | 450,000 | 514,452 | |||||||||
| MarkWest Energy Partners LP | |||||||||||
| 6.875% 11/01/14 (b) | 45,000 | 42,187 | |||||||||
| Williams Companies, Inc. | |||||||||||
| 6.375% 10/01/10 (b) | 10,000 | 10,138 | |||||||||
| 8.125% 03/15/12 | 85,000 | 93,500 | |||||||||
| Pipelines Total | 675,764 | ||||||||||
| ENERGY TOTAL | 2,523,426 | ||||||||||
| Par ($) | Value ($) | ||||||||||
| FINANCIALS – 4.4% | |||||||||||
| Banks – 1.0% | |||||||||||
| Marshall & Ilsley Corp. | |||||||||||
| 4.375% 08/01/09 | 700,000 | 684,975 | |||||||||
| U.S. Bank NA | |||||||||||
| 6.375% 08/01/11 | 600,000 | 633,228 | |||||||||
| Wachovia Corp. | |||||||||||
| 4.875% 02/15/14 | 300,000 | 290,504 | |||||||||
| Wells Fargo & Co. | |||||||||||
| 4.520% 03/10/08 (c) | 1,200,000 | 1,200,607 | |||||||||
| Banks Total | 2,809,314 | ||||||||||
| Diversified Financial Services – 2.5% | |||||||||||
| American General Finance Corp. | |||||||||||
| 5.375% 09/01/09 | 475,000 | 476,330 | |||||||||
| Capital One Bank | |||||||||||
| 4.875% 05/15/08 | 325,000 | 321,867 | |||||||||
| Citigroup, Inc. | |||||||||||
| 5.000% 09/15/14 | 700,000 | 685,767 | |||||||||
| Countrywide Home Loans, Inc. | |||||||||||
| 2.875% 02/15/07 | 600,000 | 587,016 | |||||||||
| General Electric Capital Corp. | |||||||||||
| 5.000% 01/08/16 | 1,000,000 | 980,226 | |||||||||
| Goldman Sachs Group, Inc. | |||||||||||
| 6.345% 02/15/34 | 370,000 | 386,333 | |||||||||
| HSBC Finance Corp. | |||||||||||
| 5.000% 06/30/15 | 650,000 | 626,993 | |||||||||
| JPMorgan Chase Capital XV | |||||||||||
| 5.875% 03/15/35 | 800,000 | 793,207 | |||||||||
| Lehman Brothers Holdings, Inc. | |||||||||||
| 5.000% 01/14/11 | 600,000 | 595,162 | |||||||||
| Merrill Lynch & Co., Inc. | |||||||||||
| 4.125% 01/15/09 | 500,000 | 485,097 | |||||||||
| Morgan Stanley | |||||||||||
| 4.750% 04/01/14 | 400,000 | 381,406 | |||||||||
| SLM Corp. | |||||||||||
| 5.125% 08/27/12 | 490,000 | 484,653 | |||||||||
| Diversified Financial Services Total | 6,804,057 | ||||||||||
| Insurance – 0.5% | |||||||||||
| Allstate Financial Global Funding II | |||||||||||
| 2.625% 10/22/06 (b) | 700,000 | 687,821 | |||||||||
| Genworth Financial, Inc. | |||||||||||
| 4.750% 06/15/09 | 650,000 | 640,445 | |||||||||
| Insurance Total | 1,328,266 | ||||||||||
| Real Estate Investment Trusts (REITs) – 0.2% | |||||||||||
| Health Care Property Investors, Inc. | |||||||||||
| 6.450% 06/25/12 | 500,000 | 519,430 | |||||||||
| Real Estate Investment Trusts Total | 519,430 | ||||||||||
See Accompanying Notes to Financial Statements.
56
February 28, 2006 (Unaudited) Columbia Balanced Fund
| Par ($) | Value ($) | ||||||||||
| Corporate Fixed-Income Bonds & Notes – (continued) | |||||||||||
| FINANCIALS – (continued) | |||||||||||
| Savings & Loans – 0.2% | |||||||||||
| Washington Mutual, Inc. | |||||||||||
| 4.200% 01/15/10 | 700,000 | 672,870 | |||||||||
| Savings & Loans Total | 672,870 | ||||||||||
| FINANCIALS TOTAL | 12,133,937 | ||||||||||
| INDUSTRIALS – 1.1% | |||||||||||
| Aerospace & Defense – 0.2% | |||||||||||
| DRS Technologies, Inc. | |||||||||||
| 6.625% 02/01/16 | 25,000 | 25,250 | |||||||||
| L-3 Communications Corp. | |||||||||||
| 7.625% 06/15/12 | 170,000 | 178,925 | |||||||||
| Lockheed Martin Corp. | |||||||||||
| 8.500% 12/01/29 | 225,000 | 306,888 | |||||||||
| Sequa Corp. | |||||||||||
| 9.000% 08/01/09 | 25,000 | 26,875 | |||||||||
| TransDigm, Inc. | |||||||||||
| 8.375% 07/15/11 | 25,000 | 26,187 | |||||||||
| Aerospace & Defense Total | 564,125 | ||||||||||
| Auto Manufacturers – 0.1% | |||||||||||
| Ford Motor Credit Co. | |||||||||||
| 7.375% 10/28/09 | 400,000 | 369,004 | |||||||||
| Auto Manufacturers Total | 369,004 | ||||||||||
| Environmental Control – 0.2% | |||||||||||
| Allied Waste North America, Inc. | |||||||||||
| 6.375% 04/15/11 | 75,000 | 73,875 | |||||||||
| Waste Management, Inc. | |||||||||||
| 7.375% 08/01/10 | 450,000 | 484,514 | |||||||||
| Environmental Control Total | 558,389 | ||||||||||
| Machinery-Diversified – 0.1% | |||||||||||
| Westinghouse Air Brake Technologies Corp. | |||||||||||
| 6.875% 07/31/13 | 155,000 | 158,100 | |||||||||
| Machinery-Diversified Total | 158,100 | ||||||||||
| Miscellaneous Manufacturing – 0.0% | |||||||||||
| Bombardier, Inc. | |||||||||||
| 6.300% 05/01/14 (b) | 35,000 | 31,675 | |||||||||
| Miscellaneous Manufacturing Total | 31,675 | ||||||||||
| Par ($) | Value ($) | ||||||||||
| Packaging & Containers – 0.1% | |||||||||||
| Jefferson Smurfit Corp. | |||||||||||
| 8.250% 10/01/12 | 55,000 | 53,763 | |||||||||
| Owens-Illinois, Inc. | |||||||||||
| 7.500% 05/15/10 | 90,000 | 91,800 | |||||||||
| Silgan Holdings, Inc. | |||||||||||
| 6.750% 11/15/13 | 90,000 | 89,550 | |||||||||
| Smurfit-Stone Container Corp. | |||||||||||
| 8.375% 07/01/12 | 25,000 | 24,625 | |||||||||
| Packaging & Containers Total | 259,738 | ||||||||||
| Transportation – 0.4% | |||||||||||
| Canadian National Railway Co. | |||||||||||
| 7.195% 01/02/16 | 495,302 | 560,402 | |||||||||
| Offshore Logistics, Inc. | |||||||||||
| 6.125% 06/15/13 | 105,000 | 98,962 | |||||||||
| Teekay Shipping Corp. | |||||||||||
| 8.875% 07/15/11 | 60,000 | 66,450 | |||||||||
| Union Pacific Corp. | |||||||||||
| 3.875% 02/15/09 | 500,000 | 481,152 | |||||||||
| Transportation Total | 1,206,966 | ||||||||||
| INDUSTRIALS TOTAL | 3,147,997 | ||||||||||
| TECHNOLOGY – 0.2% | |||||||||||
| Computers – 0.2% | |||||||||||
| International Business Machines Corp. | |||||||||||
| 6.220% 08/01/27 | 400,000 | 432,441 | |||||||||
| Computers Total | 432,441 | ||||||||||
| Office/Business Equipment – 0.0% | |||||||||||
| Xerox Corp. | |||||||||||
| 7.125% 06/15/10 | 30,000 | 31,050 | |||||||||
| Office/Business Equipment Total | 31,050 | ||||||||||
| Semiconductors – 0.0% | |||||||||||
| Freescale Semiconductor, Inc. | |||||||||||
| 6.875% 07/15/11 | 65,000 | 67,031 | |||||||||
| Semiconductors Total | 67,031 | ||||||||||
| TECHNOLOGY TOTAL | 530,522 | ||||||||||
| UTILITIES – 1.1% | |||||||||||
| Electric – 0.9% | |||||||||||
| AES Corp. | |||||||||||
| 7.750% 03/01/14 | 70,000 | 74,025 | |||||||||
| American Electric Power Co., Inc. | |||||||||||
| 5.250% 06/01/15 | 350,000 | 343,719 | |||||||||
| CenterPoint Energy Houston Electric | |||||||||||
| 5.750% 01/15/14 | 250,000 | 254,105 | |||||||||
See Accompanying Notes to Financial Statements.
57
February 28, 2006 (Unaudited) Columbia Balanced Fund
| Par ($) | Value ($) | ||||||||||
| Corporate Fixed-Income Bonds & Notes – (continued) | |||||||||||
| UTILITIES – (continued) | |||||||||||
| Electric – (continued) | |||||||||||
| CMS Energy Corp. | |||||||||||
| 6.875% 12/15/15 | 20,000 | 20,450 | |||||||||
| 8.500% 04/15/11 | 10,000 | 10,925 | |||||||||
| Edison Mission Energy | |||||||||||
| 7.730% 06/15/09 | 15,000 | 15,563 | |||||||||
| Exelon Generation Co. | |||||||||||
| 6.950% 06/15/11 | 500,000 | 532,635 | |||||||||
| Mirant North America LLC | |||||||||||
| 7.375% 12/31/13 (b) | 30,000 | 30,825 | |||||||||
| MSW Energy Holdings LLC | |||||||||||
| 7.375% 09/01/10 | 20,000 | 20,700 | |||||||||
| Nevada Power Co. | |||||||||||
| 5.875% 01/15/15 | 15,000 | 15,019 | |||||||||
| 6.500% 04/15/12 | 30,000 | 30,937 | |||||||||
| NorthWestern Corp. | |||||||||||
| 5.875% 11/01/14 | 5,000 | 5,013 | |||||||||
| NRG Energy, Inc. | |||||||||||
| 7.250% 02/01/14 | 15,000 | 15,300 | |||||||||
| 7.375% 02/01/16 | 15,000 | 15,413 | |||||||||
| Scottish Power PLC | |||||||||||
| 5.375% 03/15/15 | 450,000 | 446,059 | |||||||||
| Virginia Electric & Power Co. | |||||||||||
| 5.375% 02/01/07 | 700,000 | 700,707 | |||||||||
| Electric Total | 2,531,395 | ||||||||||
| Gas – 0.2% | |||||||||||
| Sempra Energy | |||||||||||
| 4.750% 05/15/09 | 375,000 | 369,075 | |||||||||
| Gas Total | 369,075 | ||||||||||
| UTILITIES TOTAL | 2,900,470 | ||||||||||
| Total Corporate Fixed-Income Bonds & Notes (cost of $32,754,642) | 32,818,019 | ||||||||||
| Collateralized Mortgage Obligations – 8.9% | |||||||||||
| AGENCY – 6.3% | |||||||||||
| Federal Home Loan Mortgage Corp. | |||||||||||
| 4.000% 09/15/15 | 4,320,000 | 4,183,150 | |||||||||
| 4.000% 10/15/18 | 3,600,000 | 3,297,229 | |||||||||
| 4.000% 10/15/26 | 3,300,000 | 3,215,637 | |||||||||
| 4.500% 03/15/18 | 2,920,000 | 2,833,902 | |||||||||
| 4.500% 10/15/18 | 1,840,000 | 1,811,905 | |||||||||
| 4.500% 02/15/27 | 630,000 | 614,167 | |||||||||
| 4.500% 08/15/28 | 720,000 | 692,495 | |||||||||
| 6.500% 11/15/30 | 100,992 | 101,382 | |||||||||
| Federal National Mortgage Association | |||||||||||
| 4.500% 11/25/14 | 630,000 | 618,505 | |||||||||
| 6.500% 07/25/30 | 115,830 | 115,592 | |||||||||
| AGENCY TOTAL | 17,483,964 | ||||||||||
| Par ($) | Value ($) | ||||||||||
| NON-AGENCY – 2.6% | |||||||||||
| Bear Stearns Asset Backed Securities, Inc. | |||||||||||
| 5.000% 01/25/34 | 1,340,041 | 1,319,499 | |||||||||
| Countrywide Alternative Loan Trust | |||||||||||
| 4.981% 03/25/34 (c) | 3,765,728 | 3,777,457 | |||||||||
| SACO I, Inc. | |||||||||||
| 0.001% 09/25/24 (c) | 20,671 | 20,257 | |||||||||
| Structured Asset Securities Corp. | |||||||||||
| 5.500% 05/25/33 | 791,037 | 773,378 | |||||||||
| 5.500% 07/25/33 | 1,167,662 | 1,156,190 | |||||||||
| NON-AGENCY TOTAL | 7,046,781 | ||||||||||
| Total Collateralized Mortgage Obligations (cost of $25,031,646) | 24,530,745 | ||||||||||
| Government & Agency Obligations – 6.8% | |||||||||||
| FOREIGN GOVERNMENT OBLIGATIONS – 0.5% | |||||||||||
| Province of Ontario | |||||||||||
| 3.500% 09/17/07 | 1,000,000 | 979,753 | |||||||||
| United Mexican States | |||||||||||
| 7.500% 04/08/33 | 250,000 | 304,000 | |||||||||
| FOREIGN GOVERNMENT OBLIGATIONS TOTAL | 1,283,753 | ||||||||||
| U.S. GOVERNMENT AGENCIES – 0.1% | |||||||||||
| Federal Home Loan Bank | |||||||||||
| 3.000% 05/15/06 | 250,000 | 249,060 | |||||||||
| U.S. GOVERNMENT AGENCIES TOTAL | 249,060 | ||||||||||
| U.S. GOVERNMENT OBLIGATIONS – 6.2% | |||||||||||
| U.S. Treasury Bonds | |||||||||||
| 6.250% 08/15/23 | 5,835,000 | 6,899,432 | |||||||||
| 7.250% 05/15/16 | 5,685,000 | 6,880,624 | |||||||||
| U.S. Treasury Inflation Index Notes | |||||||||||
| 3.875% 01/15/09 | 2,340,332 | 2,476,089 | |||||||||
| U.S. Treasury Notes | |||||||||||
| 3.500% 11/15/06 | 925,000 | 917,051 | |||||||||
| U.S. GOVERNMENT OBLIGATIONS TOTAL | 17,173,196 | ||||||||||
| Total Government & Agency Obligations (cost of $18,886,772) | 18,706,009 | ||||||||||
See Accompanying Notes to Financial Statements.
58
February 28, 2006 (Unaudited) Columbia Balanced Fund
| Par ($) | Value ($) | ||||||||||
| Mortgage-Backed Securities – 5.6% | |||||||||||
| Federal Home Loan Mortgage Corp. | |||||||||||
| 5.500% 12/01/18 | 1,302,090 | 1,307,537 | |||||||||
| 5.500% 07/01/19 | 366,048 | 367,488 | |||||||||
| 5.500% 08/01/35 | 1,713,225 | 1,699,199 | |||||||||
| 6.000% 03/01/17 | 121,238 | 123,304 | |||||||||
| 6.000% 04/01/17 | 731,702 | 744,173 | |||||||||
| 6.000% 05/01/17 | 369,541 | 375,840 | |||||||||
| 6.000% 08/01/17 | 225,558 | 229,403 | |||||||||
| 6.500% 08/01/32 | 220,159 | 225,674 | |||||||||
| Federal National Mortgage Association | |||||||||||
| 5.000% 07/01/18 | 92,528 | 91,499 | |||||||||
| 5.000% 08/01/18 | 1,583,513 | 1,565,431 | |||||||||
| 5.000% 10/01/18 | 474,824 | 469,401 | |||||||||
| 5.000% 05/01/20 | 1,855,156 | 1,831,167 | |||||||||
| 5.000% 06/01/20 | 822,966 | 812,324 | |||||||||
| 5.000% 07/01/20 | 4,456,357 | 4,398,730 | |||||||||
| 5.796% 07/01/32 (c) | 687,553 | 684,491 | |||||||||
| Government National Mortgage Association | |||||||||||
| 7.000% 10/15/31 | 104,730 | 109,445 | |||||||||
| 7.000% 04/15/32 | 92,637 | 96,801 | |||||||||
| 7.000% 05/15/32 | 112,892 | 117,966 | |||||||||
| Total Mortgage-Backed Securities (cost of $15,555,866) | 15,249,873 | ||||||||||
| Commercial Mortgage-Backed Securities – 1.8% | |||||||||||
| Bear Stearns Commercial Mortgage Securities | |||||||||||
| 5.449% 12/11/40 (c) | 500,000 | 503,865 | |||||||||
| Nationslink Funding Corp. | |||||||||||
| 6.888% 11/10/30 | 4,380,000 | 4,453,891 | |||||||||
| Total Commercial Mortgage-Backed Securities (cost of $4,930,869) | 4,957,756 | ||||||||||
| Asset-Backed Securities – 1.7% | |||||||||||
| Cityscape Home Equity Loan Trust | |||||||||||
| 7.410% 05/25/28 | 416,187 | 414,962 | |||||||||
| Federal Housing Administration | |||||||||||
| 9.125% 03/25/33 | 1,526,177 | 1,511,679 | |||||||||
| First Alliance Mortgage Loan Trust | |||||||||||
| 7.340% 06/20/27 | 111,504 | 111,350 | |||||||||
| IMC Home Equity Loan Trust | |||||||||||
| 7.310% 11/20/28 | 1,246,552 | 1,244,485 | |||||||||
| 7.520% 08/20/28 | 665,720 | 664,078 | |||||||||
| Salomon Brothers Mortgage Securities VII | |||||||||||
| 7.150% 06/25/28 | 650,413 | 641,367 | |||||||||
| Total Asset-Backed Securities (cost of $4,639,846) | 4,587,921 | ||||||||||
| Par ($) | Value ($) | ||||||||||
| Short-Term Obligation – 1.6% | |||||||||||
| Repurchase agreement with State Street Bank & Trust Co., dated 02/28/06, due 03/01/06 at 4.440%, collateralized by a U.S. Treasury Note maturing 08/15/10, market value of $4,492,463 (repurchase proceeds $4,400,543) | 4,400,000 | 4,400,000 | |||||||||
| Total Short-Term Obligation (cost of $4,400,000) | 4,400,000 | ||||||||||
| Total Investments – 100.2% (cost of $258,491,246) (d) | 275,567,576 | ||||||||||
| Other Assets & Liabilities, Net – (0.2)% | (580,533 | ) | |||||||||
| Net Assets – 100.0% | 274,987,043 | ||||||||||
Notes to Investment Portfolio:
(a) Non-income producing security.
(b) Security exempt from registration pursuant to Rule 144A under the Securities Act of 1933. These securities may be resold in transactions exempt from registration, normally to qualified institutional buyers. At February 28, 2006, these securities, which are not illiquid, amounted to $1,353,347, which represents 0.5% of net assets.
(c) The interest rate shown on floating rate or variable rate securities reflects the rate at February 28, 2006.
(d) Cost for federal income tax purposes is $258,776,606.
At February 28, 2006, the asset allocation of the Fund is as follows:
| Asset Allocation | % of Net Assets | ||||||
| Common Stocks | 61.9 | % | |||||
| Corporate Fixed-Income Bonds & Notes | 11.9 | ||||||
| Collateralized Mortgage Obligations | 8.9 | ||||||
| Government & Agency Obligations | 6.8 | ||||||
| Mortgage-Backed Securities | 5.6 | ||||||
| Commercial Mortgage-Backed Securities | 1.8 | ||||||
| Asset-Backed Securities | 1.7 | ||||||
| Short-Term Obligation | 1.6 | ||||||
| Other Assets & Liabilities, Net | (0.2 | ) | |||||
| 100.0 | % | ||||||
| Acronym | Name | ||||||
| ADR | American Depositary Receipt | ||||||
See Accompanying Notes to Financial Statements.
59
INVESTMENT PORTFOLIO
February 28, 2006 (Unaudited) Columbia Oregon Intermediate Municipal Bond Fund
| Par ($) | Value ($) | ||||||||||
| Municipal Bonds – 97.8% | |||||||||||
| EDUCATION – 5.6% | |||||||||||
| Education – 5.6% | |||||||||||
| OR Facilities Authority Linfield College Project, Series 2005 A, 5.000% 10/01/20 | 1,825,000 | 1,925,941 | |||||||||
| OR Health Sciences University Series 1996 A, Insured: MBIA: | |||||||||||
| (a) 07/01/09 | 1,530,000 | 1,359,818 | |||||||||
| (a) 07/01/12 | 1,315,000 | 1,035,089 | |||||||||
| (a) 07/01/14 | 2,550,000 | 1,831,384 | |||||||||
| (a) 07/01/15 | 4,325,000 | 2,966,215 | |||||||||
| (a) 07/01/21 | 12,515,000 | 6,457,365 | |||||||||
| OR Health, Housing, Educational & Cultural Facilities Authority Linfield College Project, Series 1998 A: | |||||||||||
| 4.650% 10/01/09 | 555,000 | 567,499 | |||||||||
| 5.500% 10/01/18 | 1,000,000 | 1,033,640 | |||||||||
| Reed College Project, Series 1995 A: 5.300% 07/01/11 | 500,000 | 512,555 | |||||||||
| Insured: MBIA 5.100% 07/01/10 | 900,000 | 940,608 | |||||||||
| OR Multnomah County Educational Facilities Authority University of Portland Project: | |||||||||||
| Refunding, Series 1997, Insured: AMBAC 5.000% 04/01/11 | 1,150,000 | 1,190,054 | |||||||||
| Series 2000: | |||||||||||
| 5.700% 04/01/15 | 1,000,000 | 1,058,310 | |||||||||
| 6.000% 04/01/20 | 1,000,000 | 1,067,370 | |||||||||
| 6.000% 04/01/25 | 500,000 | 532,715 | |||||||||
| Education Total | 22,478,563 | ||||||||||
| EDUCATION TOTAL | 22,478,563 | ||||||||||
| HEALTH CARE – 8.9% | |||||||||||
| Continuing Care Retirement – 0.3% | |||||||||||
| OR Albany Hospital Facility Authority Mennonite Home Albany, Series 2004 PJ-A: | |||||||||||
| 4.750% 10/01/11 | 660,000 | 682,856 | |||||||||
| 5.000% 10/01/12 | 680,000 | 712,449 | |||||||||
| Continuing Care Retirement Total | 1,395,305 | ||||||||||
| Par ($) | Value ($) | ||||||||||
| Hospitals – 8.4% | |||||||||||
| OR Benton County Hospital Facilities Authority Samaritan Health Services Project, Refunding, Series 1998: | |||||||||||
| 4.400% 10/01/07 | 220,000 | 222,268 | |||||||||
| 4.800% 10/01/11 | 245,000 | 251,921 | |||||||||
| 5.200% 10/01/17 | 2,255,000 | 2,323,259 | |||||||||
| OR Clackamas County Hospital Facility Authority Legacy Health System: Refunding, Series 2001: | |||||||||||
| 4.600% 05/01/10 | 885,000 | 913,886 | |||||||||
| 5.250% 05/01/21 | 4,890,000 | 5,165,747 | |||||||||
| 5.750% 05/01/12 | 2,000,000 | 2,185,480 | |||||||||
| 5.750% 05/01/16 | 1,500,000 | 1,622,550 | |||||||||
| Series 1999: | |||||||||||
| 5.000% 02/15/16 | 1,010,000 | 1,046,148 | |||||||||
| 5.500% 02/15/13 | 5,450,000 | 5,776,673 | |||||||||
| 5.500% 02/15/14 | 2,385,000 | 2,527,957 | |||||||||
| Legacy Health System, IBC, Series 1999, Insured: MBIA 5.500% 02/15/13 | 495,000 | 527,324 | |||||||||
| OR Medford Hospital Facilities Authority Asante Health System, Series 1998 A, Insured: MBIA: | |||||||||||
| 5.250% 08/15/10 | 485,000 | 507,441 | |||||||||
| 5.250% 08/15/11 | 260,000 | 271,591 | |||||||||
| OR Multnomah County Hospital Facilities Authority Revenue Providence Health System, Series 2004, 5.250% 10/01/16 | 2,970,000 | 3,217,817 | |||||||||
| OR Salem Hospital Facility Authority Series 1998: | |||||||||||
| 5.000% 08/15/18 | 2,000,000 | 2,056,280 | |||||||||
| 5.250% 08/15/14 | 4,860,000 | 5,038,265 | |||||||||
| OR Umatilla County Hospital Facility Authority Catholic Health Initiatives, Series 2000 A, 5.750% 12/01/20 | 285,000 | 307,318 | |||||||||
| Hospitals Total | 33,961,925 | ||||||||||
See Accompanying Notes to Financial Statements.
60
February 28, 2006 (Unaudited) Columbia Oregon Intermediate Municipal Bond Fund
| Par ($) | Value ($) | ||||||||||
| Municipal Bonds – (continued) | |||||||||||
| HEALTH CARE – (continued) | |||||||||||
| Nursing Homes – 0.2% | |||||||||||
| OR Clackamas County Hospital Facility Authority Odd Fellows Home, Refunding, Series 1998 A, 5.875% 09/15/21 | 705,000 | 665,132 | |||||||||
| Nursing Homes Total | 665,132 | ||||||||||
| HEALTH CARE TOTAL | 36,022,362 | ||||||||||
| HOUSING – 4.3% | |||||||||||
| Assisted Living/Senior – 0.5% | |||||||||||
| OR Clackamas County Hospital Facility Authority Robison Jewish Home Project, Series 2005: | |||||||||||
| 5.000% 10/01/19 | 1,000,000 | 1,006,020 | |||||||||
| 5.125% 10/01/24 | 1,000,000 | 997,910 | |||||||||
| Assisted Living/Senior Total | 2,003,930 | ||||||||||
| Multi-Family – 1.2% | |||||||||||
| OR Clackamas County Housing Authority Multi-Family Housing, Easton Ridge, Series 1996 A, 5.800% 12/01/16 | 2,255,000 | 2,270,199 | |||||||||
| OR Washington County Housing Authority Affordable Housing Pool, Series 2002 A: | |||||||||||
| 5.750% 07/01/23 | 1,000,000 | 1,024,580 | |||||||||
| 6.000% 07/01/23 | 1,000,000 | 1,030,000 | |||||||||
| PR Commonwealth of Puerto Rico Housing Finance Corp. Multi-Family Mortgage, Portfolio A-1, Series 1990, Insured FHA 7.500% 04/01/22 | 305,000 | 308,443 | |||||||||
| Multi-Family Total | 4,633,222 | ||||||||||
| Par ($) | Value ($) | ||||||||||
| Single-Family – 2.6% | |||||||||||
| OR Housing & Community Services Department Mortgage Single Family Program: | |||||||||||
| Series 1991 D, 6.700% 07/01/13 | 335,000 | 335,566 | |||||||||
| Series 1998 A, 4.850% 07/01/10 | 130,000 | 134,212 | |||||||||
| Series 1999 E, 5.375% 07/01/21 | 2,875,000 | 2,986,378 | |||||||||
| Series 1999 M, AMT, 5.800% 07/01/12 | 170,000 | 176,321 | |||||||||
| Series 2000 E, Insured: FHA: | |||||||||||
| 5.700% 07/01/12 | 525,000 | 527,084 | |||||||||
| 5.800% 07/01/14 | 470,000 | 472,007 | |||||||||
| 6.000% 07/01/20 | 1,305,000 | 1,312,021 | |||||||||
| Series 2001 J, 5.150% 07/01/24 | 1,760,000 | 1,805,003 | |||||||||
| Series 2001 Q: | |||||||||||
| 4.700% 07/01/15 | 570,000 | 586,450 | |||||||||
| 4.900% 07/01/17 | 555,000 | 572,904 | |||||||||
| Series 2006 A, 4.300% 07/01/20 | 1,475,000 | 1,481,697 | |||||||||
| OR Housing Finance Revenue Series 1977, Insured: FHA 5.800% 07/01/09 | 150,000 | 150,888 | |||||||||
| Single-Family Total | 10,540,531 | ||||||||||
| HOUSING TOTAL | 17,177,683 | ||||||||||
| OTHER – 32.5% | |||||||||||
| Other – 0.9% | |||||||||||
| OR Health, Housing, Educational & Cultural Facilities Authority, Goodwill Industries Lane County, Series 1998 A, 6.650% 11/15/22 (b) | 3,635,000 | 3,639,944 | |||||||||
| Other Total | 3,639,944 | ||||||||||
| Pool/Bond Bank – 0.3% | |||||||||||
| OR Economic Community Development Department Series 2000 A, Insured: MBIA 5.375% 01/01/11 | 1,105,000 | 1,162,935 | |||||||||
| Pool/Bond Bank Total | 1,162,935 | ||||||||||
See Accompanying Notes to Financial Statements.
61
February 28, 2006 (Unaudited) Columbia Oregon Intermediate Municipal Bond Fund
| Par ($) | Value ($) | ||||||||||
| Municipal Bonds – (continued) | |||||||||||
| OTHER – (continued) | |||||||||||
| Refunded/Escrowed (c) – 31.3% | |||||||||||
| OR Board of Higher Education Lottery Education Project, Series 1999 A: Pre-refunded 04/01/09, Insured: FSA 5.250% 04/01/13 | 1,600,000 | 1,697,152 | |||||||||
| Pre-refunded 04/01/11, Insured: FSA 5.000% 04/01/14 | 2,705,000 | 2,883,557 | |||||||||
| Series 2001 A, Pre-refunded 08/01/11: | |||||||||||
| 5.250% 08/01/14 | 1,225,000 | 1,318,578 | |||||||||
| 5.250% 08/01/16 | 4,550,000 | 4,897,574 | |||||||||
| OR Clackamas County Hospital Facility Authority Kaiser Permanente, Series 1998 A, Escrowed to Maturity, 5.375% 04/01/14 | 7,135,000 | 7,574,659 | |||||||||
| Robison Jewish Home Project, Series 1996, Pre-refunded 10/01/06, 6.250% 10/01/21 | 1,650,000 | 1,676,631 | |||||||||
| Willamette View, Inc. Project, Series 1999 A, Pre-refunded 11/01/09, 6.850% 11/01/15 | 1,480,000 | 1,640,728 | |||||||||
| OR Clackamas County School District No. 086, Series 2000, Pre-refunded 06/15/10, 6.000% 06/15/16 | 2,350,000 | 2,579,618 | |||||||||
| School District No. 108, Series 2001, Pre-refunded 06/15/11, Insured: FSA 5.375% 06/15/15 | 1,055,000 | 1,145,688 | |||||||||
| School District No. 12, North Clackamas, Series 1998, Pre-refunded 06/01/09, Insured: FGIC: | |||||||||||
| 5.250% 06/01/11 | 1,000,000 | 1,054,120 | |||||||||
| 5.250% 06/01/15 | 2,750,000 | 2,898,830 | |||||||||
| School District No. 62C, Series 2000, Pre-refunded 06/15/10, 5.375% 06/15/17 | 1,250,000 | 1,341,238 | |||||||||
| Par ($) | Value ($) | ||||||||||
| School District No. 7J, Lake Oswega, Series 2001, Pre-refunded 06/01/11: | |||||||||||
| 5.375% 06/01/15 | 2,450,000 | 2,659,303 | |||||||||
| 5.375% 06/01/16 | 1,295,000 | 1,405,632 | |||||||||
| 5.375% 06/01/17 | 2,535,000 | 2,751,565 | |||||||||
| OR Coos County School District No. 13, North Bend, Series 2002, Pre-refunded 06/15/12, Insured: FSA 5.500% 06/15/15 | 1,765,000 | 1,949,425 | |||||||||
| OR Department of Administrative Services Certificates of Participation, Series 1997 A, Pre-refunded 06/01/07, Insured: AMBAC 5.300% 05/01/08 | 750,000 | 773,685 | |||||||||
| OR Department of Transportation Highway User Tax, Series 2002 A, Pre-refunded 11/15/12, 5.500% 11/15/16 | 2,500,000 | 2,773,825 | |||||||||
| OR Deschutes County Hospital Facilities Authority Cascade Health Services, Inc., Series 2002, Pre-refunded 01/01/12: | |||||||||||
| 5.500% 01/01/22 | 2,000,000 | 2,186,360 | |||||||||
| 5.600% 01/01/27 | 5,550,000 | 6,096,064 | |||||||||
| 5.600% 01/01/32 | 2,000,000 | 2,196,780 | |||||||||
| OR Deschutes County Certificates of Participation, Series 1998 A, Pre-refunded 06/01/09, 5.050% 06/01/17 | 420,000 | 439,505 | |||||||||
| School District No. 1, Series 2001 A, Pre-refunded 06/15/11, Insured: FSA 5.500% 06/15/18 | 1,000,000 | 1,091,940 | |||||||||
| OR Jackson County School District No. 4, Phoenix-Talent, Series 2001, Pre-refunded 06/15/11, Insured: FSA 5.500% 06/15/16 | 1,000,000 | 1,091,940 | |||||||||
| School District No. 9, Eagle Point, Series 2000, Pre-refunded 06/15/11, 5.625% 06/15/15 | 1,920,000 | 2,108,006 | |||||||||
See Accompanying Notes to Financial Statements.
62
February 28, 2006 (Unaudited) Columbia Oregon Intermediate Municipal Bond Fund
| Par ($) | Value ($) | ||||||||||
| Municipal Bonds – (continued) | |||||||||||
| OTHER – (continued) | |||||||||||
| Refunded/Escrowed (c) – (continued) | |||||||||||
| OR Josephine County School District No. 7, Grants Pass, Series 1995, Pre-refunded 06/01/07, Insured: FGIC 5.700% 06/01/13 | 2,000,000 | 2,056,660 | |||||||||
| OR Linn County Community School District No. 9, Lebanon, Series 2001, Pre-refunded 06/15/13, Insured: FGIC 5.550% 06/15/21 | 2,000,000 | 2,236,240 | |||||||||
| School District No. 9, Series 2001, Pre-refunded 06/15/13, Insured: FGIC 5.250% 06/15/15 | 405,000 | 444,585 | |||||||||
| OR Medford Hospital Facilities Authority Asante Health System, Series 1998 A, Pre-refunded 08/15/08, Insured: MBIA: | |||||||||||
| 5.250% 08/15/10 | 1,015,000 | 1,066,258 | |||||||||
| 5.250% 08/15/11 | 540,000 | 567,270 | |||||||||
| OR Metro Washington Park Zoo Series 1996 A, Pre-refunded 01/15/07, 5.300% 01/15/11 | 1,000,000 | 1,016,720 | |||||||||
| OR Multnomah County Certificates of Participation, Series 1998, Pre-refunded 08/01/08, 4.550% 08/01/10 | 235,000 | 243,028 | |||||||||
| School District No. 40, Series 2001, Pre-refunded 12/01/10, Insured: FSA 5.000% 12/01/14 | 1,790,000 | 1,902,860 | |||||||||
| School District No. 7, Reynolds, Series 2000, Pre-refunded 06/15/11: | |||||||||||
| 5.625% 06/15/14 | 2,670,000 | 2,931,446 | |||||||||
| 5.625% 06/15/17 | 1,000,000 | 1,097,920 | |||||||||
| OR Multnomah-Clackamas Counties Centennial School District No. 28-302, Series 2001, Pre-refunded 06/15/11, Insured: FGIC: | |||||||||||
| 5.375% 06/15/16 | 2,055,000 | 2,231,648 | |||||||||
| 5.375% 06/15/17 | 2,280,000 | 2,475,989 | |||||||||
| 5.375% 06/15/18 | 2,490,000 | 2,704,040 | |||||||||
| Par ($) | Value ($) | ||||||||||
| OR North Clackamas Parks & Recreation District Facilities Series 1993, Escrowed to Maturity, 5.700% 04/01/13 | 2,920,000 | 3,135,496 | |||||||||
| OR Northern Oregon Corrections Series 1997, Pre-refunded 09/15/07, Insured: AMBAC: | |||||||||||
| 5.250% 09/15/12 | 1,000,000 | 1,027,820 | |||||||||
| 5.300% 09/15/13 | 1,000,000 | 1,028,570 | |||||||||
| OR Portland Arena Gas Tax Series 1996, Pre-refunded 06/01/06, Insured: FSA: | |||||||||||
| (a) 06/01/16 | 1,100,000 | 592,284 | |||||||||
| (a) 06/01/17 | 2,320,000 | 1,168,955 | |||||||||
| OR Portland Community College District Series 2001 A, Pre-refunded 06/01/11: | |||||||||||
| 5.375% 06/01/14 | 1,925,000 | 2,089,453 | |||||||||
| 5.375% 06/01/16 | 2,705,000 | 2,936,088 | |||||||||
| 5.375% 06/01/17 | 2,540,000 | 2,756,992 | |||||||||
| OR Powell Valley Water District Series 2000, Pre-refunded 08/01/09, 6.000% 02/01/15 | 620,000 | 668,168 | |||||||||
| OR Salem Water & Sewer Series 2000, Pre-refunded 06/01/10, Insured: FSA 5.300% 06/01/15 | 1,500,000 | 1,604,220 | |||||||||
| OR Umatilla County Hospital Facility Authority Catholic Health Initiatives, Series 2000 A, Escrowed to Maturity: | |||||||||||
| 5.750% 12/01/20 | 245,000 | 268,344 | |||||||||
| 6.000% 12/01/30 | 4,825,000 | 5,319,128 | |||||||||
| OR Washington & Clackamas Counties School District No. 23J, Tigard, Series 2002, Pre-refunded 06/15/12, Insured: MBIA 5.375% 06/15/17 | 1,500,000 | 1,646,265 | |||||||||
See Accompanying Notes to Financial Statements.
63
February 28, 2006 (Unaudited) Columbia Oregon Intermediate Municipal Bond Fund
| Par ($) | Value ($) | ||||||||||
| Municipal Bonds – (continued) | |||||||||||
| OTHER – (continued) | |||||||||||
| Refunded/Escrowed (c) – (continued) | |||||||||||
| OR Washington County School District No. 15, Forest Grove, Series 2001, Pre-refunded 06/15/11, Insured: FSA: | |||||||||||
| 5.375% 06/15/13 | 2,070,000 | 2,247,937 | |||||||||
| 5.375% 06/15/15 | 2,515,000 | 2,731,189 | |||||||||
| School District No. 48J, Beaverton: Series 1998, Pre-refunded 08/01/08, 5.250% 08/01/10 | 1,150,000 | 1,197,921 | |||||||||
| Series 1999, Pre-refunded 06/01/09, Insured: FGIC 5.100% 06/01/12 | 500,000 | 524,770 | |||||||||
| Series 2001, Pre-refunded 01/01/11: | |||||||||||
| 5.125% 01/01/14 | 2,000,000 | 2,137,980 | |||||||||
| 5.125% 01/01/17 | 1,820,000 | 1,945,562 | |||||||||
| 5.125% 01/01/18 | 2,260,000 | 2,415,917 | |||||||||
| Series 2001, Pre-refunded 06/01/11, 5.500% 06/01/16 | 2,785,000 | 3,039,493 | |||||||||
| OR Washington, Multnomah & Yamhill Counties School District No. 1J: Series 1999, Pre-refunded 06/01/09, 5.250% 06/01/14 | 500,000 | 527,060 | |||||||||
| Series 2001, Pre-refunded 06/01/11, Insured: MBIA 5.000% 06/01/13 | 1,500,000 | 1,601,415 | |||||||||
| OR Yamhill County School District No. 029J, Series 2002, Pre-refunded 06/15/12, Insured: MBIA 5.250% 06/15/16 | 2,535,000 | 2,764,494 | |||||||||
| VI Virgin Islands Public Finance Authority Series 1989 A, Escrowed to Maturity, 7.300% 10/01/18 | 1,185,000 | 1,489,995 | |||||||||
| Refunded/Escrowed Total | 126,072,583 | ||||||||||
| OTHER TOTAL | 130,875,462 | ||||||||||
| Par ($) | Value ($) | ||||||||||
| OTHER REVENUE – 2.2% | |||||||||||
| Recreation – 2.2% | |||||||||||
| OR Board of Higher Education Lottery Education Project: Series 1999 B, Insured: FSA 5.250% 04/01/15 | 1,315,000 | 1,391,270 | |||||||||
| Series 2003 A, Insured: FSA: | |||||||||||
| 5.000% 04/01/14 | 1,830,000 | 1,977,333 | |||||||||
| 5.000% 04/01/14 | 1,000,000 | 1,085,060 | |||||||||
| 5.250% 04/01/11 | 4,000,000 | 4,232,000 | |||||||||
| Recreation Total | 8,685,663 | ||||||||||
| OTHER REVENUE TOTAL | 8,685,663 | ||||||||||
| TAX-BACKED – 34.4% | |||||||||||
| Local Appropriated – 0.5% | |||||||||||
| OR Deschutes & Jefferson County School District No. 02J, Series 2004 B, Insured: FGIC (a) 06/15/22 | 2,335,000 | 1,156,152 | |||||||||
| OR Multnomah County Certificates of Participation, Series 1998, 4.550% 08/01/10 | 765,000 | 788,378 | |||||||||
| Local Appropriated Total | 1,944,530 | ||||||||||
| Local General Obligations – 19.4% | |||||||||||
| OR Aurora Series 1999, 5.600% 06/01/24 | 1,205,000 | 1,266,033 | |||||||||
| OR Bend Municipal Airport Project Series 1999 B, AMT, 5.375% 06/01/13 | 150,000 | 156,643 | |||||||||
| OR Benton & Linn Counties School District No. 509J, Corvallis, Series 2003, Insured: FSA 5.000% 06/01/17 | 2,665,000 | 2,846,860 | |||||||||
| OR Canyonville South Umpqua Rural Fire District Series 2001, 5.400% 07/01/31 | 610,000 | 614,044 | |||||||||
| OR Clackamas & Washington Counties School District No. 003JT, Series 2003, Insured: FGIC (a) 06/15/17 | 4,000,000 | �� | 2,488,120 | ||||||||
See Accompanying Notes to Financial Statements.
64
February 28, 2006 (Unaudited) Columbia Oregon Intermediate Municipal Bond Fund
| Par ($) | Value ($) | ||||||||||
| Municipal Bonds – (continued) | |||||||||||
| TAX-BACKED – (continued) | |||||||||||
| Local General Obligations – (continued) | |||||||||||
| OR Clackamas Community College Series 2001, Insured: FGIC 5.250% 06/15/15 | 1,500,000 | 1,612,095 | |||||||||
| OR Clackamas County School District No. 007J, Lake Oswego, Refunding, Series 2005, Insured: FSA 5.250% 06/01/21 | 2,000,000 | 2,275,960 | |||||||||
| School District No. 108, Estacada, Series 2005, Insured: FSA 5.500% 06/15/25 | 2,485,000 | 2,930,958 | |||||||||
| OR Columbia County School District No. 502, Deferred Interest, Series 1999, Insured: FGIC: | |||||||||||
| (a) 06/01/13 | 1,685,000 | 1,272,411 | |||||||||
| (a) 06/01/14 | 1,025,000 | 738,635 | |||||||||
| OR Coos Bay Series 2000, 4.900% 09/01/07 | 1,030,000 | 1,040,640 | |||||||||
| OR Crook County School District, Series 2002, Insured: FSA 5.000% 02/01/14 | 2,860,000 | 3,055,653 | |||||||||
| OR Jackson County School District No. 009, Series 2005, Insured: MBIA: | |||||||||||
| 5.500% 06/15/20 | 1,000,000 | 1,162,060 | |||||||||
| 5.500% 06/15/21 | 1,410,000 | 1,644,864 | |||||||||
| School District No. 6, Central Point, Series 2000, 6.000% 06/15/09 | 1,090,000 | 1,173,821 | |||||||||
| OR Jefferson County School District No. 509J, Madras School District, Series 2002, Insured: FGIC 5.250% 06/15/18 | 1,075,000 | 1,158,388 | |||||||||
| OR Josephine County Unit School District, Three Rivers, Series 2005, Insured: FGIC: | |||||||||||
| 5.000% 12/15/15 | 1,000,000 | 1,092,380 | |||||||||
| 5.000% 12/15/16 | 1,000,000 | 1,091,510 | |||||||||
| Par ($) | Value ($) | ||||||||||
| OR Lane County School District No. 19, Springfield, Refunding, Series 1997, Insured: FGIC: | |||||||||||
| 6.000% 10/15/12 | 1,740,000 | 1,972,551 | |||||||||
| 6.000% 10/15/14 | 1,310,000 | 1,516,967 | |||||||||
| School District No. 4J, Eugene, Refunding, Series 2002: | |||||||||||
| 5.000% 07/01/12 | 1,000,000 | 1,075,760 | |||||||||
| 5.250% 07/01/13 | 1,000,000 | 1,097,460 | |||||||||
| OR Lincoln County School District, Series 1995, Insured: FGIC 5.600% 06/15/10 | 3,480,000 | 3,703,520 | |||||||||
| OR Linn Benton Community College Series 2001, Insured: FGIC (a) 06/15/13 | 1,000,000 | 752,230 | |||||||||
| Series 2002, Insured: FGIC (a) 06/15/14 | 1,000,000 | 720,800 | |||||||||
| OR Linn County Community School District No. 9, Lebanon, Series 2001, Insured: FGIC 5.250% 06/15/15 | 305,000 | 333,078 | |||||||||
| OR Madras Aquatic Center District Series 2005, 5.000% 06/01/22 | 1,695,000 | 1,763,614 | |||||||||
| OR Metro Series 2002, 5.250% 09/01/14 | 3,130,000 | 3,399,587 | |||||||||
| OR Multnomah-Clackamas Counties School District No. 10JT, Series 2003 A, Insured: FSA 5.250% 06/15/12 | 1,000,000 | 1,089,350 | |||||||||
| OR Portland Limited Tax Series 2001 B: | |||||||||||
| (a) 06/01/12 | 1,750,000 | 1,382,097 | |||||||||
| (a) 06/01/13 | 1,500,000 | 1,132,710 | |||||||||
| (a) 06/01/16 | 3,500,000 | 2,296,070 | |||||||||
| (a) 06/01/18 | 4,000,000 | 2,387,600 | |||||||||
| (a) 06/01/19 | 4,000,000 | 2,272,600 | |||||||||
| (a) 06/01/20 | 4,000,000 | 2,171,680 | |||||||||
See Accompanying Notes to Financial Statements.
65
February 28, 2006 (Unaudited) Columbia Oregon Intermediate Municipal Bond Fund
| Par ($) | Value ($) | ||||||||||
| Municipal Bonds – (continued) | |||||||||||
| TAX-BACKED – (continued) | |||||||||||
| Local General Obligations – (continued) | |||||||||||
| OR Rogue Community College District, Refunding, Series 2005, Insured: MBIA: | |||||||||||
| 5.000% 06/15/15 | 1,015,000 | 1,108,096 | |||||||||
| 5.000% 06/15/16 | 1,050,000 | 1,142,358 | |||||||||
| 5.000% 06/15/17 | 1,255,000 | 1,361,211 | |||||||||
| OR Salem-Keizer School District No. 24J, Series 2004, Insured: FSA 5.000% 06/15/18 | 2,000,000 | 2,145,760 | |||||||||
| OR Tualatin Hills Park & Recreation District Series 1998, Insured: FGIC 5.750% 03/01/14 | 990,000 | 1,124,630 | |||||||||
| OR Washington & Clackamas Counties Deferred Interest, Series 1999 A, (a) 06/01/10 | 1,520,000 | 1,283,914 | |||||||||
| School District No. 23J, Tigard: Series 2000, (a) 06/15/18 | 2,700,000 | 1,604,934 | |||||||||
| Series 2005, Insured: MBIA 5.000% 06/15/21 | 6,575,000 | 7,257,945 | |||||||||
| OR Washington County Criminal Justice Facilities, Refunding, Series 1998, 5.000% 12/01/10 | 1,400,000 | 1,434,230 | |||||||||
| OR Washington, Multnomah & Yamhill Counties | |||||||||||
| School District No. 1J, Series 1998, 5.000% 11/01/13 | 1,100,000 | 1,191,674 | |||||||||
| OR Yamhill County School District No. 029J, Series 2005, Insured: FGIC 5.500% 06/15/21 | 1,000,000 | 1,166,570 | |||||||||
| School District No. 40, Series 1997, Insured: FGIC 6.000% 06/01/09 | 500,000 | 538,035 | |||||||||
| Local General Obligations Total | 78,048,106 | ||||||||||
| Par ($) | Value ($) | ||||||||||
| Special Property Tax – 6.9% | |||||||||||
| OR Hood River Urban Renewal Agency Series 1996, 6.250% 12/15/11 | 985,000 | 1,014,343 | |||||||||
| OR Lebanon Urban Renewal Agency Series 1999, 5.625% 06/01/19 | 1,000,000 | 1,050,160 | |||||||||
| Series 2000: | |||||||||||
| 5.750% 06/01/15 | 1,120,000 | 1,163,814 | |||||||||
| 6.000% 06/01/20 | 1,580,000 | 1,661,797 | |||||||||
| OR Medford Urban Renewal Series 1996, 5.875% 09/01/10 | 500,000 | 505,095 | |||||||||
| OR Portland Airport Way Urban Renewal & Redevelopment Convention Center, Series 2000 A, Insured: AMBAC: | |||||||||||
| 5.750% 06/15/17 | 1,500,000 | 1,638,930 | |||||||||
| 5.750% 06/15/18 | 2,050,000 | 2,239,871 | |||||||||
| OR Portland Limited Tax Series 2003 A, 3.400% 06/01/13 | 975,000 | 960,911 | |||||||||
| OR Portland River District Urban Renewal & Redevelopment Series 2003 A, Insured: AMBAC: | |||||||||||
| 5.000% 06/15/17 | 1,500,000 | 1,602,840 | |||||||||
| 5.000% 06/15/18 | 3,070,000 | 3,274,462 | |||||||||
| 5.000% 06/15/20 | 2,000,000 | 2,133,200 | |||||||||
| OR Portland Urban Renewal & Redevelopment South Park Blocks, Series 2000 A, Insured: AMBAC: | |||||||||||
| 5.750% 06/15/17 | 2,065,000 | 2,256,260 | |||||||||
| 5.750% 06/15/19 | 2,580,000 | 2,818,960 | |||||||||
| OR Redmond Urban Renewal Agency Downtown Area B, Series 1999: | |||||||||||
| 5.650% 06/01/13 | 720,000 | 743,580 | |||||||||
| 5.850% 06/01/19 | 785,000 | 811,572 | |||||||||
| South Airport Industrial Area A, Series 1999, 5.700% 06/01/19 | 650,000 | 663,416 | |||||||||
| OR Seaside Urban Renewal Agency Greater Seaside Urban Renewal, Series 2001, 5.250% 06/01/15 | 1,000,000 | 1,034,720 | |||||||||
| OR Veneta Urban Renewal Agency Series 2001: | |||||||||||
| 5.375% 02/15/16 | 700,000 | 738,171 | |||||||||
| 5.625% 02/15/21 | 1,100,000 | 1,156,078 | |||||||||
See Accompanying Notes to Financial Statements.
66
February 28, 2006 (Unaudited) Columbia Oregon Intermediate Municipal Bond Fund
| Par ($) | Value ($) | ||||||||||
| Municipal Bonds – (continued) | |||||||||||
| TAX-BACKED – (continued) | |||||||||||
| Special Property Tax – (continued) | |||||||||||
| OR Wilsonville Limited Tax Improvement Series 1998, 5.000% 12/01/10 | 250,000 | 250,988 | |||||||||
| Special Property Tax Total | 27,719,168 | ||||||||||
| State Appropriated – 3.8% | |||||||||||
| OR Department of Administrative Services Certificates of Participation, Refunding, | |||||||||||
| Series 1999 A, Insured: AMBAC: | |||||||||||
| 4.500% 05/01/12 | 1,020,000 | 1,050,060 | |||||||||
| 5.000% 05/01/13 | 4,240,000 | 4,455,138 | |||||||||
| 5.000% 05/01/14 | 1,000,000 | 1,050,740 | |||||||||
| Series 2002 B, Insured: MBIA 5.250% 05/01/10 | 840,000 | 893,575 | |||||||||
| Series 2002 C, Insured: MBIA: | |||||||||||
| 5.250% 11/01/15 | 1,000,000 | 1,079,660 | |||||||||
| 5.250% 11/01/17 | 5,000,000 | 5,369,800 | |||||||||
| Series 2002 E, Insured: FSA 5.000% 11/01/13 | 1,470,000 | 1,570,386 | |||||||||
| State Appropriated Total | 15,469,359 | ||||||||||
| State General Obligations – 3.8% | |||||||||||
| OR Board of Higher Education Deffered Interest, Series 2001 A, (a) 08/01/17 | 1,050,000 | 651,892 | |||||||||
| Series 1996 A, (a) 08/01/14 | 490,000 | 351,095 | |||||||||
| Series 2001 A: | |||||||||||
| 5.250% 08/01/14 | 255,000 | 274,403 | |||||||||
| 5.250% 08/01/16 | 780,000 | 838,157 | |||||||||
| Series 2004 A, 5.000% 08/01/12 | 2,075,000 | 2,228,550 | |||||||||
| Series 2004 D, 5.000% 08/01/24 | 3,620,000 | 3,850,015 | |||||||||
| OR Elderly & Disabled Housing Series 2001 B, 4.950% 08/01/20 | 985,000 | 1,015,052 | |||||||||
| OR State Series 1980, 9.200% 10/01/08 | 385,000 | 438,384 | |||||||||
| Series 2002 A, 5.250% 10/15/15 | 1,735,000 | 1,891,341 | |||||||||
| Par ($) | Value ($) | ||||||||||
| OR Veterans Welfare Series 1980, 8.000% 07/01/08 | 580,000 | 637,600 | |||||||||
| Series 1995, 5.850% 10/01/15 | 300,000 | 306,372 | |||||||||
| Series 2000 80A, 5.700% 10/01/32 | 1,740,000 | 1,742,279 | |||||||||
| PR Commonwealth of Puerto Rico Aqueduct & Sewer Authority Series 2004 A, 5.000% 07/01/30 | 1,000,000 | 1,050,330 | |||||||||
| State General Obligations Total | 15,275,470 | ||||||||||
| TAX-BACKED TOTAL | 138,456,633 | ||||||||||
| TRANSPORTATION – 2.6% | |||||||||||
| Airports – 0.5% | |||||||||||
| OR Eugene Airport Refunding, Series 2000, AMT: | |||||||||||
| 5.650% 05/01/07 | 555,000 | 566,250 | |||||||||
| 5.700% 05/01/08 | 515,000 | 533,066 | |||||||||
| OR Port of Portland International Airport Refunding, Series 1998 12B, Insured: FGIC 5.250% 07/01/12 | 1,000,000 | 1,048,190 | |||||||||
| Airports Total | 2,147,506 | ||||||||||
| Ports – 0.7% | |||||||||||
| OR Port Morrow Series 2000, 6.700% 06/01/20 | 2,000,000 | 2,002,180 | |||||||||
| OR Port of St. Helens Series 1999: | |||||||||||
| 5.600% 08/01/14 | 315,000 | 322,034 | |||||||||
| 5.750% 08/01/19 | 425,000 | 435,974 | |||||||||
| Ports Total | 2,760,188 | ||||||||||
| Transportation – 1.4% | |||||||||||
| OR Tri-County Metropolitan Transportation District Series 1999 1, 5.400% 06/01/19 | 4,200,000 | 4,380,810 | |||||||||
| Series 2003 A, 5.000% 09/01/15 | 1,000,000 | 1,073,990 | |||||||||
| Transportation Total | 5,454,800 | ||||||||||
| TRANSPORTATION TOTAL | 10,362,494 | ||||||||||
See Accompanying Notes to Financial Statements.
67
February 28, 2006 (Unaudited) Columbia Oregon Intermediate Municipal Bond Fund
| Par ($) | Value ($) | ||||||||||
| Municipal Bonds – (continued) | |||||||||||
| UTILITIES – 7.3% | |||||||||||
| Investor Owned – 2.2% | |||||||||||
| OR Port of St. Helens Pollution Control Portland General Electric Co.: Series 1985 A, 4.800% 04/01/10 | 5,195,000 | 5,252,457 | |||||||||
| Series 1985 B, 4.800% 06/01/10 | 3,500,000 | 3,540,040 | |||||||||
| Investor Owned Total | 8,792,497 | ||||||||||
| Municipal Electric – 3.2% | |||||||||||
| OR Emerald Peoples Utility District | |||||||||||
| Series 1996, Insured: FGIC: | |||||||||||
| 7.350% 11/01/10 | 2,160,000 | 2,502,792 | |||||||||
| 7.350% 11/01/11 | 2,000,000 | 2,370,780 | |||||||||
| 7.350% 11/01/12 | 2,490,000 | 3,007,621 | |||||||||
| 7.350% 11/01/13 | 2,675,000 | 3,299,051 | |||||||||
| Series 2003 A, Insured: FSA 5.250% 11/01/20 | 605,000 | 658,694 | |||||||||
| OR Eugene Electric Utilities System Refunding, Series 2001 B, Insured: FSA 5.250% 08/01/13 | 1,040,000 | 1,119,133 | |||||||||
| Total Municipal Electric | 12,958,071 | ||||||||||
| Water & Sewer – 1.9% | |||||||||||
| OR Myrtle Point Water Series 2000, 6.000% 12/01/20 | 510,000 | 541,421 | |||||||||
| OR Portland Sewer System Refunding, Series 1997 A, Insured: FGIC 5.000% 06/01/12 | 2,835,000 | 2,885,463 | |||||||||
| OR Sheridan Water Refunding, Series 1998, 5.350% 04/01/18 | 300,000 | 308,532 | |||||||||
| Series 2000: | |||||||||||
| 6.200% 05/01/15 | 625,000 | 666,237 | |||||||||
| 6.450% 05/01/20 | 520,000 | 556,546 | |||||||||
| Par ($) | Value ($) | ||||||||||
| OR Washington County Housing Authority Clean Water Services Sewer, Series 2004 Lien, Insured: MBIA 5.000% 10/01/13 | 2,310,000 | 2,501,545 | |||||||||
| Water & Sewer Total | 7,459,744 | ||||||||||
| UTILITIES TOTAL | 29,210,312 | ||||||||||
| Total Municipal Bonds (cost of $375,648,200) | 393,269,172 | ||||||||||
| Investment Company – 0.0% | Shares | ||||||||||
| Dreyfus Tax-Exempt Cash Management Fund | 1,230 | 1,230 | |||||||||
| Total Investment Company (cost of $1,230) | 1,230 | ||||||||||
| Short-Term Obligations – 1.2% | Par ($) | ||||||||||
| VARIABLE RATE DEMAND NOTES (d) – 1.2% | |||||||||||
| FL Pinellas County Health Facility Authority Pooled Hospital Loan Program, Series 1985, LOC: Wachovia Bank N.A. 2.770% 12/01/15 | 500,000 | 500,000 | |||||||||
| IA Woodbury County Educational Facility Siouxland Medical Educational Foundation, Inc., Series 1996, LOC: U.S. Bank N.A. 3.090% 11/01/16 | 100,000 | 100,000 | |||||||||
| MI Eastern Michigan University Refunding, Series 2001, Insured: FGIC 2.770% 06/01/27 | 200,000 | 200,000 | |||||||||
| MI Health & Educational Facilities Authority Bethesda Health Group, Inc., Series 2001 A, 2.820% 08/01/31 | 100,000 | 100,000 | |||||||||
| MN Higher Education Facilities Authority St. Olaf College, Series 2002 5-M1, LOC: Harris Trust & Savings Bank 2.770% 10/01/32 | 200,000 | 200,000 | |||||||||
See Accompanying Notes to Financial Statements.
68
February 28, 2006 (Unaudited) Columbia Oregon Intermediate Municipal Bond Fund
| Par ($) | Value ($) | ||||||||||
| Short-Term Obligations – (continued) | |||||||||||
| VARIABLE RATE DEMAND NOTES (d) – (continued) | |||||||||||
| MS Jackson County Pollution Control Chevron Corp.: Series 1992, 2.800% 12/01/16 | 100,000 | 100,000 | |||||||||
| Series 1993, 2.800% 06/01/23 | 400,000 | 400,000 | |||||||||
| SD Lawrence County Pollution Control Homestake Mining Company, Refunding, Series 1997 B, LOC: JPMorgan Chase Bank N.A.: | |||||||||||
| 2.700% 07/01/32 | 100,000 | 100,000 | |||||||||
| 2.800% 07/01/32 | 1,000,000 | 1,000,000 | |||||||||
| TX Bell County Health Facilities Development Corp. Series 2000 B-1, SPA: Morgan Guaranty Trust 2.780% 08/15/29 | 1,000,000 | 1,000,000 | |||||||||
| WI Health & Educational Facilities Authority ProHealth Care, Inc., Series 2001 B, 2.770% 08/15/30 | 900,000 | 900,000 | |||||||||
| WY Uinta County Pollution Control Chevron Corp., Series 1993, 2.800% 08/15/20 | 300,000 | 300,000 | |||||||||
| VARIABLE RATE DEMAND NOTES TOTAL | 4,900,000 | ||||||||||
| Total Short-Term Obligations (cost of $4,900,000) | 4,900,000 | ||||||||||
| Total Investments – 99.0% (cost of $380,549,430) (e) | 398,170,402 | ||||||||||
| Other Assets & Liabilities, Net – 1.0% | 3,874,236 | ||||||||||
| Net Assets – 100.0% | 402,044,638 | ||||||||||
Notes to Investment Portfolio:
(a) Zero coupon bond.
(b) Denotes a restricted security, which is subject to restrictions on resale under federal securities laws or in transactions exempt from registration. At February 28, 2006, the value of this security, which is not illiquid, represents 0.9% of net assets.
| Security | Acquisition Date | Acquisition Cost | |||||||||
| OR Health, Housing, Educational & Cultural Facilities Authority, Goodwill Industries Lane County, Series 1998 A, 6.650% 11/15/22 | 06/17/98 | $ | 3,635,000 | ||||||||
(c) The Fund has been informed that each issuer has placed direct obligations of the U.S. Government in an irrevocable trust, solely for the payment of principal and interest.
(d) Variable rate demand notes. These securities are payable upon demand and are secured by letters of credit or other credit support agreements from banks. The interest rates change periodically and the interest rates shown reflect the rates as of February 28, 2006.
(e) Cost for federal income tax purposes is $380,394,292.
At February 28, 2006, the composition of the Fund by revenue source is as follows:
| Holdings By Revenue Source | % of Net Assets | ||||||
| Tax-Backed | 34.4 | % | |||||
| Other | 32.5 | ||||||
| Health Care | 8.9 | ||||||
| Utilities | 7.3 | ||||||
| Education | 5.6 | ||||||
| Housing | 4.3 | ||||||
| Transportation | 2.6 | ||||||
| Other Revenue | 2.2 | ||||||
| Investment Company | 0.0 | ||||||
| Short-Term Obligations | 1.2 | ||||||
| Other Assets & Liabilities, Net | 1.0 | ||||||
| 100.0 | % | ||||||
| Acronym | Name | ||||||
| AMBAC | Ambac Assurance Corp. | ||||||
| AMT | Alternative Minimum Tax | ||||||
| FGIC | Financial Guaranty Insurance Co. | ||||||
| FHA | Federal Housing Administration | ||||||
| FSA | Financial Security Assurance, Inc. | ||||||
| IBC | Insured Bond Certificates | ||||||
| LOC | Letter of Credit | ||||||
| MBIA | MBIA Insurance Corp. | ||||||
| SPA | Stand by Purchase Agreement | ||||||
See Accompanying Notes to Financial Statements.
69
INVESTMENT PORTFOLIO
February 28, 2006 (Unaudited) Columbia Conservative High Yield Fund
| Par ($) | Value ($) | ||||||||||
| Corporate Fixed-Income Bonds & Notes – 95.9% | |||||||||||
| BASIC MATERIALS – 4.9% | |||||||||||
| Chemicals – 2.6% | |||||||||||
| Chemicals-Diversified – 1.2% | |||||||||||
| EquiStar Chemicals LP | |||||||||||
| 10.125% 09/01/08 | 7,270,000 | 7,815,250 | |||||||||
| 10.625% 05/01/11 | 880,000 | 950,400 | |||||||||
| NOVA Chemicals Corp. | |||||||||||
| 6.500% 01/15/12 | 5,025,000 | 4,842,844 | |||||||||
| 7.561% 11/15/13 (a)(b) | 2,260,000 | 2,302,375 | |||||||||
| 15,910,869 | |||||||||||
| Chemicals-Specialty – 0.6% | |||||||||||
| Nalco Co. 7.750% 11/15/11 | 7,595,000 | 7,775,381 | |||||||||
| 7,775,381 | |||||||||||
| Industrial-Gases – 0.8% | |||||||||||
| Airgas, Inc. 9.125% 10/01/11 | 9,423,000 | 10,023,716 | |||||||||
| 10,023,716 | |||||||||||
| Chemicals Total | 33,709,966 | ||||||||||
| Forest Products & Paper – 1.3% | |||||||||||
| Paper & Related Products – 1.3% | |||||||||||
| Boise Cascade LLC 7.125% 10/15/14 | 16,910,000 | 16,191,325 | |||||||||
| 16,191,325 | |||||||||||
| Forest Products & Paper Total | 16,191,325 | ||||||||||
| Iron/Steel – 1.0% | |||||||||||
| Steel-Producers – 1.0% | |||||||||||
| Russel Metals, Inc. 6.375% 03/01/14 | 8,885,000 | 8,740,619 | |||||||||
| United States Steel Corp. 9.750% 05/15/10 | 4,055,000 | 4,404,744 | |||||||||
| 13,145,363 | |||||||||||
| Iron/Steel Total | 13,145,363 | ||||||||||
| BASIC MATERIALS TOTAL | 63,046,654 | ||||||||||
| COMMUNICATIONS – 12.8% | |||||||||||
| Media – 8.6% | |||||||||||
| Cable TV – 4.1% | |||||||||||
| DirecTV Holdings | |||||||||||
| 6.375% 06/15/15 | 2,670,000 | 2,656,650 | |||||||||
| 8.375% 03/15/13 | 9,232,000 | 9,947,480 | |||||||||
| Par ($) | Value ($) | ||||||||||
| EchoStar DBS Corp. | |||||||||||
| 5.750% 10/01/08 | 11,720,000 | 11,588,150 | |||||||||
| 6.625% 10/01/14 | 8,170,000 | 7,945,325 | |||||||||
| Rogers Cable, Inc. | |||||||||||
| 6.250% 06/15/13 | 9,665,000 | 9,616,675 | |||||||||
| 7.875% 05/01/12 | 11,000,000 | 11,825,000 | |||||||||
| 53,579,280 | |||||||||||
| Multimedia – 2.0% | |||||||||||
| Emmis Operating Co. 6.875% 05/15/12 | 8,520,000 | 8,307,000 | |||||||||
| Lamar Media Corp. 7.250% 01/01/13 | 17,123,000 | 17,679,497 | |||||||||
| 25,986,497 | |||||||||||
| Publishing-Periodicals – 1.9% | |||||||||||
| Dex Media West LLC 9.875% 08/15/13 | 7,350,000 | 8,149,313 | |||||||||
| R.H. Donnelley Finance Corp. | |||||||||||
| 10.875% 12/15/12 (a) | 12,235,000 | 13,764,375 | |||||||||
| 10.875% 12/15/12 | 2,150,000 | 2,418,750 | |||||||||
| 24,332,438 | |||||||||||
| Television – 0.6% | |||||||||||
| LIN Television Corp. 6.500% 05/15/13 | 8,025,000 | 7,704,000 | |||||||||
| 7,704,000 | |||||||||||
| Media Total | 111,602,215 | ||||||||||
| Telecommunication Services – 4.2% | |||||||||||
| Cellular Telecommunications – 2.4% | |||||||||||
| Nextel Communications, Inc. 7.375% 08/01/15 | 13,250,000 | 14,027,871 | |||||||||
| Rogers Wireless, Inc. | |||||||||||
| 7.500% 03/15/15 | 7,765,000 | 8,444,437 | |||||||||
| 8.000% 12/15/12 | 7,475,000 | 8,016,938 | |||||||||
| 30,489,246 | |||||||||||
| Telephone-Integrated – 1.5% | |||||||||||
| Citizens Communications Co. 9.000% 08/15/31 | 6,705,000 | 7,157,588 | |||||||||
| Qwest Corp. 8.875% 03/15/12 | 10,995,000 | 12,341,887 | |||||||||
| 19,499,475 | |||||||||||
See Accompanying Notes to Financial Statements.
70
February 28, 2006 (Unaudited) Columbia Conservative High Yield Fund
| Par ($) | Value ($) | ||||||||||
| Corporate Fixed-Income Bonds & Notes – (continued) | |||||||||||
| COMMUNICATIONS – (continued) | |||||||||||
| Telecommunication Services – (continued) | |||||||||||
| Wireless Equipment – 0.3% | |||||||||||
| American Towers, Inc. 7.250% 12/01/11 | 3,565,000 | 3,734,337 | |||||||||
| 3,734,337 | |||||||||||
| Telecommunication Services Total | 53,723,058 | ||||||||||
| COMMUNICATIONS TOTAL | 165,325,273 | ||||||||||
| CONSUMER CYCLICAL – 21.1% | |||||||||||
| Apparel – 0.5% | |||||||||||
| Apparel Manufacturers – 0.5% | |||||||||||
| Phillips-Van Heusen Corp. 7.250% 02/15/11 | 6,125,000 | 6,278,125 | |||||||||
| 6,278,125 | |||||||||||
| Apparel Total | 6,278,125 | ||||||||||
| Auto Manufacturers – 0.4% | |||||||||||
| Auto-Medium & Heavy Duty Trucks – 0.4% | |||||||||||
| Navistar International Corp. 7.500% 06/15/11 | 5,230,000 | 5,269,225 | |||||||||
| 5,269,225 | |||||||||||
| Auto Manufacturers Total | 5,269,225 | ||||||||||
| Auto Parts & Equipment – 0.9% | |||||||||||
| Auto/Truck Parts & Equipment-Original – 0.9% | |||||||||||
| Accuride Corp. 8.500% 02/01/15 | 6,655,000 | 6,588,450 | |||||||||
| TRW Automotive, Inc. 9.375% 02/15/13 | 4,555,000 | 4,953,563 | |||||||||
| 11,542,013 | |||||||||||
| Auto Parts & Equipment Total | 11,542,013 | ||||||||||
| Entertainment – 3.0% | |||||||||||
| Music – 0.9% | |||||||||||
| Warner Music Group 7.375% 04/15/14 | 10,855,000 | 10,909,275 | |||||||||
| 10,909,275 | |||||||||||
| Racetracks – 1.1% | |||||||||||
| Speedway Motorsports, Inc. 6.750% 06/01/13 | 14,183,000 | 14,431,202 | |||||||||
| 14,431,202 | |||||||||||
| Par ($) | Value ($) | ||||||||||
| Theaters – 1.0% | |||||||||||
| Cinemark USA, Inc. 9.000% 02/01/13 | 12,760,000 | 13,461,800 | |||||||||
| 13,461,800 | |||||||||||
| Entertainment Total | 38,802,277 | ||||||||||
| Home Builders – 2.2% | |||||||||||
| Building-Residential/Commercial – 2.2% | |||||||||||
| Beazer Homes USA, Inc. 6.875% 07/15/15 | 7,300,000 | 7,008,000 | |||||||||
| K. Hovnanian Enterprises, Inc. | |||||||||||
| 6.000% 01/15/10 | 4,865,000 | 4,646,075 | |||||||||
| 6.375% 12/15/14 | 4,160,000 | 3,920,800 | |||||||||
| 6.500% 01/15/14 | 6,315,000 | 6,015,037 | |||||||||
| KB Home | |||||||||||
| 5.875% 01/15/15 | 5,730,000 | 5,314,575 | |||||||||
| 8.625% 12/15/08 | 1,665,000 | 1,760,738 | |||||||||
| 28,665,225 | |||||||||||
| Home Builders Total | 28,665,225 | ||||||||||
| Home Furnishings – 0.6% | |||||||||||
| Home Furnishings – 0.6% | |||||||||||
| Sealy Mattress Co. 8.250% 06/15/14 | 7,780,000 | 8,130,100 | |||||||||
| 8,130,100 | |||||||||||
| Home Furnishings Total | 8,130,100 | ||||||||||
| Leisure Time – 2.3% | |||||||||||
| Cruise Lines – 1.6% | |||||||||||
| Royal Caribbean Cruises Ltd. | |||||||||||
| 6.875% 12/01/13 | 6,125,000 | 6,492,500 | |||||||||
| 8.750% 02/02/11 | 12,215,000 | 13,726,606 | |||||||||
| 20,219,106 | |||||||||||
| Leisure & Recreational Products – 0.7% | |||||||||||
| Leslie's Poolmart 7.750% 02/01/13 | 8,630,000 | 8,716,300 | |||||||||
| 8,716,300 | |||||||||||
| Leisure Time Total | 28,935,406 | ||||||||||
| Lodging – 7.7% | |||||||||||
| Casino Hotels – 6.5% | |||||||||||
| Caesars Entertainment, Inc. | |||||||||||
| 7.875% 03/15/10 | 7,460,000 | 7,982,200 | |||||||||
| 9.375% 02/15/07 | 875,000 | 905,625 | |||||||||
See Accompanying Notes to Financial Statements.
71
February 28, 2006 (Unaudited) Columbia Conservative High Yield Fund
| Par ($) | Value ($) | ||||||||||
| Corporate Fixed-Income Bonds & Notes – (continued) | |||||||||||
| CONSUMER CYCLICAL– (continued) | |||||||||||
| Lodging – (continued) | |||||||||||
| Casino Hotels – (continued) | |||||||||||
| CCM Merger, Inc. 8.000% 08/01/13 (a) | 7,575,000 | 7,593,937 | |||||||||
| Chukchansi Economic Development Authority 8.000% 11/15/13 (a) | 4,425,000 | 4,557,750 | |||||||||
| Kerzner International Ltd. 6.750% 10/01/15 (a) | 7,485,000 | 7,428,863 | |||||||||
| MGM Mirage | |||||||||||
| 6.000% 10/01/09 | 21,580,000 | 21,418,150 | |||||||||
| 8.500% 09/15/10 | 3,565,000 | 3,850,200 | |||||||||
| Station Casinos, Inc. 6.875% 03/01/16 | 15,270,000 | 15,499,050 | |||||||||
| Wynn Las Vegas LLC 6.625% 12/01/14 | 13,830,000 | 13,657,125 | |||||||||
| 82,892,900 | |||||||||||
| Hotels & Motels – 1.2% | |||||||||||
| Hilton Hotels Corp. 7.500% 12/15/17 | 3,260,000 | 3,596,111 | |||||||||
| Starwood Hotels & Resorts Worldwide, Inc. 7.875% 05/01/12 | 11,005,000 | 12,119,256 | |||||||||
| 15,715,367 | |||||||||||
| Lodging Total | 98,608,267 | ||||||||||
| Retail – 3.5% | |||||||||||
| Retail-Automobiles – 1.8% | |||||||||||
| AutoNation, Inc. 9.000% 08/01/08 | 14,030,000 | 15,012,100 | |||||||||
| Group 1 Automotive, Inc. 8.250% 08/15/13 | 8,045,000 | 8,045,000 | |||||||||
| 23,057,100 | |||||||||||
| Retail-Convenience Store – 0.8% | |||||||||||
| Couche-Tard 7.500% 12/15/13 | 10,230,000 | 10,664,775 | |||||||||
| 10,664,775 | |||||||||||
| Retail-Propane Distributors – 0.3% | |||||||||||
| AmeriGas Partners LP 7.125% 05/20/16 | 3,240,000 | 3,272,400 | |||||||||
| 3,272,400 | |||||||||||
| Par ($) | Value ($) | ||||||||||
| Retail-Restaurants – 0.6% | |||||||||||
| Domino's, Inc. 8.250% 07/01/11 | 7,680,000 | 7,977,600 | |||||||||
| 7,977,600 | |||||||||||
| Retail Total | 44,971,875 | ||||||||||
| CONSUMER CYCLICAL TOTAL | 271,202,513 | ||||||||||
| CONSUMER NON-CYCLICAL – 17.2% | |||||||||||
| Beverages – 2.9% | |||||||||||
| Beverages-Non-Alcoholic – 1.5% | |||||||||||
| Cott Beverages, Inc. 8.000% 12/15/11 | 19,030,000 | 19,648,475 | |||||||||
| 19,648,475 | |||||||||||
| Beverages-Wine/Spirits – 1.4% | |||||||||||
| Constellation Brands, Inc. | |||||||||||
| 8.000% 02/15/08 | 3,318,000 | 3,459,015 | |||||||||
| 8.125% 01/15/12 | 13,660,000 | 14,360,075 | |||||||||
| 17,819,090 | |||||||||||
| Beverages Total | 37,467,565 | ||||||||||
| Commercial Services – 5.3% | |||||||||||
| Commercial Services – 2.4% | |||||||||||
| Iron Mountain, Inc. | |||||||||||
| 7.750% 01/15/15 | 7,450,000 | 7,580,375 | |||||||||
| 8.625% 04/01/13 | 14,355,000 | 14,893,312 | |||||||||
| Mac-Gray Corp. 7.625% 08/15/15 (a) | 7,825,000 | 7,981,500 | |||||||||
| 30,455,187 | |||||||||||
| Funeral Services & Related Items – 0.6% | |||||||||||
| Stewart Enterprises, Inc. 7.750% 02/15/13 (a) | 8,105,000 | 7,841,588 | |||||||||
| 7,841,588 | |||||||||||
| Private Corrections – 1.4% | |||||||||||
| Corrections Corp. of America | |||||||||||
| 6.250% 03/15/13 | 595,000 | 592,025 | |||||||||
| 7.500% 05/01/11 | 16,505,000 | 17,082,675 | |||||||||
| 17,674,700 | |||||||||||
See Accompanying Notes to Financial Statements.
72
February 28, 2006 (Unaudited) Columbia Conservative High Yield Fund
| Par ($) | Value ($) | ||||||||||
| Corporate Fixed-Income Bonds & Notes – (continued) | |||||||||||
| CONSUMER NON-CYCLICAL – (continued) | |||||||||||
| Commercial Services – (continued) | |||||||||||
| Rental Auto/Equipment – 0.9% | |||||||||||
| NationsRent, Inc. 9.500% 10/15/10 | 4,035,000 | 4,418,325 | |||||||||
| United Rentals, Inc. | |||||||||||
| 7.000% 02/15/14 | 7,100,000 | 6,851,500 | |||||||||
| 7.750% 11/15/13 | 845,000 | 847,113 | |||||||||
| 12,116,938 | |||||||||||
| Commercial Services Total | 68,088,413 | ||||||||||
| Food – 0.6% | |||||||||||
| Food-Miscellaneous/Diversified – 0.6% | |||||||||||
| Del Monte Corp. 6.750% 02/15/15 (a) | 7,705,000 | 7,705,000 | |||||||||
| 7,705,000 | |||||||||||
| Food Total | 7,705,000 | ||||||||||
| Healthcare Services – 6.5% | |||||||||||
| Medical-HMO – 1.2% | |||||||||||
| Coventry Health Care, Inc. 5.875% 01/15/12 | 15,290,000 | 15,309,112 | |||||||||
| 15,309,112 | |||||||||||
| Medical-Hospitals – 3.3% | |||||||||||
| Community Health Systems, Inc. 6.500% 12/15/12 | 2,550,000 | 2,511,750 | |||||||||
| HCA, Inc. 6.950% 05/01/12 | 21,295,000 | 21,893,136 | |||||||||
| Triad Hospitals, Inc. | |||||||||||
| 7.000% 05/15/12 | 14,653,000 | 15,019,325 | |||||||||
| 7.000% 11/15/13 | 2,975,000 | 3,004,750 | |||||||||
| 42,428,961 | |||||||||||
| Medical-Nursing Homes – 0.6% | |||||||||||
| Extendicare Health Services, Inc. | |||||||||||
| 6.875% 05/01/14 | 7,125,000 | 6,840,000 | |||||||||
| 9.500% 07/01/10 | 1,280,000 | 1,331,200 | |||||||||
| 8,171,200 | |||||||||||
| Medical-Outpatient/Home Medical – 0.2% | |||||||||||
| Select Medical Corp. 7.625% 02/01/15 | 2,725,000 | 2,350,313 | |||||||||
| 2,350,313 | |||||||||||
| Par ($) | Value ($) | ||||||||||
| Medical Products – 1.2% | |||||||||||
| Fisher Scientific International, Inc. 6.750% 08/15/14 | 14,060,000 | 14,692,700 | |||||||||
| 14,692,700 | |||||||||||
| Healthcare Services Total | 82,952,286 | ||||||||||
| Household Products/Wares – 0.6% | |||||||||||
| Consumer Products-Miscellaneous – 0.6% | |||||||||||
| Scotts Co. 6.625% 11/15/13 | 7,940,000 | 8,098,800 | |||||||||
| 8,098,800 | |||||||||||
| Household Products/Wares Total | 8,098,800 | ||||||||||
| Pharmaceuticals – 1.3% | |||||||||||
| Medical-Generic Drugs – 0.4% | |||||||||||
| Mylan Laboratories, Inc. 6.375% 08/15/15 | 5,940,000 | 6,029,100 | |||||||||
| 6,029,100 | |||||||||||
| Medical-Wholesale Drug Distribution – 0.6% | |||||||||||
| AmerisourceBergen Corp. 5.625% 09/15/12 (a) | 7,700,000 | 7,661,500 | |||||||||
| 7,661,500 | |||||||||||
| Pharmacy Services – 0.3% | |||||||||||
| Omnicare, Inc. Series 2005 B, 6.750% 12/15/13 | 3,410,000 | 3,461,150 | |||||||||
| 3,461,150 | |||||||||||
| Pharmaceuticals Total | 17,151,750 | ||||||||||
| CONSUMER NON-CYCLICAL TOTAL | 221,463,814 | ||||||||||
| ENERGY – 15.6% | |||||||||||
| Coal – 3.8% | |||||||||||
| Coal – 3.8% | |||||||||||
| Arch Western Finance LLC 6.750% 07/01/13 | 16,320,000 | 16,401,600 | |||||||||
| Massey Energy Co. 6.875% 12/15/13 (a) | 7,475,000 | 7,512,375 | |||||||||
| Peabody Energy Corp. | |||||||||||
| 5.875% 04/15/16 | 2,775,000 | 2,719,500 | |||||||||
| 6.875% 03/15/13 | 21,665,000 | 22,423,275 | |||||||||
| 49,056,750 | |||||||||||
| Coal Total | 49,056,750 | ||||||||||
See Accompanying Notes to Financial Statements.
73
February 28, 2006 (Unaudited) Columbia Conservative High Yield Fund
| Par ($) | Value ($) | ||||||||||
| Corporate Fixed-Income Bonds & Notes – (continued) | |||||||||||
| ENERGY – (continued) | |||||||||||
| Oil & Gas – 6.7% | |||||||||||
| Oil & Gas Drilling – 0.6% | |||||||||||
| Pride International, Inc. 7.375% 07/15/14 | 7,025,000 | 7,516,750 | |||||||||
| 7,516,750 | |||||||||||
| Oil Companies-Exploration & Production – 5.8% | |||||||||||
| Chesapeake Energy Corp. | |||||||||||
| 6.375% 06/15/15 | 18,435,000 | 18,435,000 | |||||||||
| 7.500% 09/15/13 | 6,465,000 | 6,885,225 | |||||||||
| 7.750% 01/15/15 | 425,000 | 451,562 | |||||||||
| Compton Petroleum Corp. 7.625% 12/01/13 | 4,105,000 | 4,187,100 | |||||||||
| Newfield Exploration Co. 6.625% 09/01/14 | 15,240,000 | 15,697,200 | |||||||||
| Plains Exploration & Production Co. 7.125% 06/15/14 | 12,720,000 | 13,324,200 | |||||||||
| Pogo Producing Co. | |||||||||||
| 6.625% 03/15/15 (a) | 6,950,000 | 6,967,375 | |||||||||
| 8.250% 04/15/11 | 2,980,000 | 3,106,650 | |||||||||
| Vintage Petroleum, Inc. | |||||||||||
| 7.875% 05/15/11 | 3,085,000 | 3,208,400 | |||||||||
| 8.250% 05/01/12 | 2,045,000 | 2,188,150 | |||||||||
| 74,450,862 | |||||||||||
| Oil Refining & Marketing – 0.3% | |||||||||||
| Tesoro Corp. 6.625% 11/01/15 (a) | 4,385,000 | 4,428,850 | |||||||||
| 4,428,850 | |||||||||||
| Oil & Gas Total | 86,396,462 | ||||||||||
| Oil & Gas Services – 2.5% | |||||||||||
| Oil-Field Services – 1.6% | |||||||||||
| Hornbeck Offshore Services, Inc. Series B, 6.125% 12/01/14 | 7,975,000 | 7,935,125 | |||||||||
| Universal Compression, Inc. 7.250% 05/15/10 | 12,265,000 | 12,755,600 | |||||||||
| 20,690,725 | |||||||||||
| Oil Field Machinery & Equipment – 0.9% | |||||||||||
| Grant Prideco, Inc. 6.125% 08/15/15 (a) | 11,215,000 | 11,355,188 | |||||||||
| 11,355,188 | |||||||||||
| Oil & Gas Services Total | 32,045,913 | ||||||||||
| Par ($) | Value ($) | ||||||||||
| Pipelines – 2.6% | |||||||||||
| Pipelines – 2.6% | |||||||||||
| Atlas Pipeline Partners LP 8.125% 12/15/15 (a) | 3,245,000 | 3,350,463 | |||||||||
| MarkWest Energy Partners LP 6.875% 11/01/14 (a) | 8,600,000 | 8,062,500 | |||||||||
| Williams Companies, Inc. | |||||||||||
| 6.375% 10/01/10 (a) | 4,090,000 | 4,146,237 | |||||||||
| 8.125% 03/15/12 | 16,370,000 | 18,007,000 | |||||||||
| 33,566,200 | |||||||||||
| Pipelines Total | 33,566,200 | ||||||||||
| ENERGY TOTAL | 201,065,325 | ||||||||||
| FINANCIALS – 1.3% | |||||||||||
| Diversified Financial Services – 0.6% | |||||||||||
| Finance-Investment Banker/Broker – 0.6% | |||||||||||
| E*Trade Financial Corp. 7.375% 09/15/13 | 7,300,000 | 7,537,250 | |||||||||
| LaBranche & Co., Inc. 11.000% 05/15/12 | 745,000 | 828,813 | |||||||||
| 8,366,063 | |||||||||||
| Diversified Financial Services Total | 8,366,063 | ||||||||||
| Real Estate Investment Trusts – 0.7% | |||||||||||
| REITS-Hotels – 0.7% | |||||||||||
| Host Marriott LP 6.375% 03/15/15 | 8,775,000 | 8,796,937 | |||||||||
| 8,796,937 | |||||||||||
| Real Estate Investment Trusts Total | 8,796,937 | ||||||||||
| FINANCIALS TOTAL | 17,163,000 | ||||||||||
| INDUSTRIALS – 16.0% | |||||||||||
| Aerospace & Defense – 2.5% | |||||||||||
| Aerospace/Defense-Equipment – 1.2% | |||||||||||
| DRS Technologies, Inc. 6.625% 02/01/16 | 4,560,000 | 4,605,600 | |||||||||
| Sequa Corp. 9.000% 08/01/09 | 4,970,000 | 5,342,750 | |||||||||
| TransDigm, Inc. 8.375% 07/15/11 | 5,505,000 | 5,766,487 | |||||||||
| 15,714,837 | |||||||||||
| Electronics-Military – 1.3% | |||||||||||
| L-3 Communications Corp. | |||||||||||
| 6.375% 10/15/15 (a) | 6,155,000 | 6,155,000 | |||||||||
| 7.625% 06/15/12 | 9,960,000 | 10,482,900 | |||||||||
| 16,637,900 | |||||||||||
| Aerospace & Defense Total | 32,352,737 | ||||||||||
See Accompanying Notes to Financial Statements.
74
February 28, 2006 (Unaudited) Columbia Conservative High Yield Fund
| Par ($) | Value ($) | ||||||||||
| Corporate Fixed-Income Bonds & Notes – (continued) | |||||||||||
| INDUSTRIALS – (continued) | |||||||||||
| Environmental Control – 1.2% | |||||||||||
| Non-Hazardous Waste Disposal – 1.2% | |||||||||||
| Allied Waste North America, Inc. | |||||||||||
| 5.750% 02/15/11 | 2,400,000 | 2,304,000 | |||||||||
| 6.375% 04/15/11 | 7,600,000 | 7,486,000 | |||||||||
| 6.500% 11/15/10 | 5,475,000 | 5,447,625 | |||||||||
| 15,237,625 | |||||||||||
| Environmental Control Total | 15,237,625 | ||||||||||
| Machinery-Diversified – 1.9% | |||||||||||
| Machinery-General Industry – 1.9% | |||||||||||
| Manitowoc Co., Inc. 7.125% 11/01/13 | 7,365,000 | 7,585,950 | |||||||||
| Westinghouse Air Brake Technologies Corp. 6.875% 07/31/13 | 16,475,000 | 16,804,500 | |||||||||
| 24,390,450 | |||||||||||
| Machinery-Diversified Total | 24,390,450 | ||||||||||
| Miscellaneous Manufacturing – 0.8% | |||||||||||
| Diversified Manufacturing Operators – 0.8% | |||||||||||
| Bombardier, Inc. 6.300% 05/01/14 (a) | 5,805,000 | 5,253,525 | |||||||||
| Trinity Industries, Inc. 6.500% 03/15/14 | 5,800,000 | 5,800,000 | |||||||||
| 11,053,525 | |||||||||||
| Miscellaneous Manufacturing Total | 11,053,525 | ||||||||||
| Packaging & Containers – 5.4% | |||||||||||
| Containers-Metal/Glass – 4.7% | |||||||||||
| Ball Corp. 6.875% 12/15/12 | 20,742,000 | 21,053,130 | |||||||||
| Crown Americas LLC & Crown Americas Capital Corp. 7.750% 11/15/15 (a) | 5,375,000 | 5,603,437 | |||||||||
| Owens-Brockway Glass Container, Inc. 8.875% 02/15/09 | 7,225,000 | 7,541,094 | |||||||||
| Owens-Illinois, Inc. 7.500% 05/15/10 | 11,000,000 | 11,220,000 | |||||||||
| Silgan Holdings, Inc. 6.750% 11/15/13 | 15,100,000 | 15,024,500 | |||||||||
| 60,442,161 | |||||||||||
| Par ($) | Value ($) | ||||||||||
| Containers-Paper/Plastic – 0.7% | |||||||||||
| Jefferson Smurfit Corp. 8.250% 10/01/12 | 3,745,000 | 3,660,738 | |||||||||
| Smurfit-Stone Container Corp. 8.375% 07/01/12 | 5,185,000 | 5,107,225 | |||||||||
| 8,767,963 | |||||||||||
| Packaging & Containers Total | 69,210,124 | ||||||||||
| Transportation – 4.2% | |||||||||||
| Transportation-Marine – 3.2% | |||||||||||
| Overseas Shipholding Group 8.250% 03/15/13 | 9,775,000 | 10,410,375 | |||||||||
| Stena AB 7.500% 11/01/13 | 10,270,000 | 10,103,113 | |||||||||
| Teekay Shipping Corp. 8.875% 07/15/11 | 18,911,000 | 20,943,932 | |||||||||
| 41,457,420 | |||||||||||
| Transportation-Services – 1.0% | |||||||||||
| Offshore Logistics, Inc. 6.125% 06/15/13 | 13,530,000 | 12,752,025 | |||||||||
| 12,752,025 | |||||||||||
| Transportation Total | 54,209,445 | ||||||||||
| INDUSTRIALS TOTAL | 206,453,906 | ||||||||||
| TECHNOLOGY – 1.3% | |||||||||||
| Office/Business Equipment – 0.3% | |||||||||||
| Office Automation & Equipment – 0.3% | |||||||||||
| Xerox Corp. 7.125% 06/15/10 | 3,345,000 | 3,462,075 | |||||||||
| 3,462,075 | |||||||||||
| Office/Business Equipment Total | 3,462,075 | ||||||||||
| Semiconductors – 1.0% | |||||||||||
| Electronic Components-Semiconductors – 1.0% | |||||||||||
| Freescale Semiconductor, Inc. 6.875% 07/15/11 | 12,675,000 | 13,071,094 | |||||||||
| 13,071,094 | |||||||||||
| Semiconductors Total | 13,071,094 | ||||||||||
| TECHNOLOGY TOTAL | 16,533,169 | ||||||||||
See Accompanying Notes to Financial Statements.
75
February 28, 2006 (Unaudited) Columbia Conservative High Yield Fund
| Par ($) | Value ($) | ||||||||||
| Corporate Fixed-Income Bonds & Notes – (continued) | |||||||||||
| UTILITIES – 5.7% | |||||||||||
| Electric – 5.2% | |||||||||||
| Electric-Generation – 1.9% | |||||||||||
| AES Corp. 7.750% 03/01/14 | 17,840,000 | 18,865,800 | |||||||||
| Edison Mission Energy 7.730% 06/15/09 | 4,780,000 | 4,959,250 | |||||||||
| 23,825,050 | |||||||||||
| Electric-Integrated – 2.1% | |||||||||||
| CMS Energy Corp. | |||||||||||
| 6.875% 12/15/15 | 2,630,000 | 2,689,175 | |||||||||
| 8.500% 04/15/11 | 1,645,000 | 1,797,163 | |||||||||
| Nevada Power Co. | |||||||||||
| 5.875% 01/15/15 (a) | 5,000,000 | 5,006,250 | |||||||||
| 6.500% 04/15/12 | 3,950,000 | 4,073,437 | |||||||||
| NorthWestern Corp. 5.875% 11/01/14 (a) | 975,000 | 977,438 | |||||||||
| TECO Energy, Inc. | |||||||||||
| 6.750% 05/01/15 (a) | 6,320,000 | 6,636,000 | |||||||||
| 7.000% 05/01/12 | 5,675,000 | 5,972,937 | |||||||||
| 27,152,400 | |||||||||||
| Independent Power Producer – 1.2% | |||||||||||
| Mirant North America LLC 7.375% 12/31/13 (a) | 6,510,000 | 6,689,025 | |||||||||
| MSW Energy Holdings LLC 7.375% 09/01/10 | 3,780,000 | 3,912,300 | |||||||||
| NRG Energy, Inc. | |||||||||||
| 7.250% 02/01/14 | 2,545,000 | 2,595,900 | |||||||||
| 7.375% 02/01/16 | 2,545,000 | 2,614,987 | |||||||||
| 15,812,212 | |||||||||||
| Electric Total | 66,789,662 | ||||||||||
| Gas – 0.5% | |||||||||||
| Gas-Distribution – 0.5% | |||||||||||
| Colorado Interstate Gas Co. 6.800% 11/15/15 (a) | 6,285,000 | 6,536,400 | |||||||||
| 6,536,400 | |||||||||||
| Gas Total | 6,536,400 | ||||||||||
| UTILITIES TOTAL | 73,326,062 | ||||||||||
| Total Corporate Fixed-Income Bonds & Notes (cost of $1,237,682,748) | 1,235,579,716 | ||||||||||
| Par ($) | Value ($) | ||||||||||
| Short-Term Obligation – 2.9% | |||||||||||
| Repurchase agreement with State Street Bank & Trust Co., dated 02/28/06, due 03/01/06 at 4.440%, collateralized by a U.S. Treasury Note maturing 10/15/09, market value of $38,313,169 (repurchase proceeds $37,562,362) | 37,558,000 | 37,558,000 | |||||||||
| Total Short-Term Obligation (cost of $37,558,000) | 37,558,000 | ||||||||||
| Total Investments – 98.8% (cost of $1,268,870,381) (c) | 1,273,137,716 | ||||||||||
| Other Assets & Liabilities, Net – 1.2% | 15,223,945 | ||||||||||
| Net Assets – 100.0% | 1,288,361,661 | ||||||||||
Notes to Investment Portfolio:
(a) Security exempt from registration pursuant to Rule 144A under the Securities Act of 1933. These securities may be resold in transactions exempt from registration, normally to qualified institutional buyers. At February 28, 2006, these securities, which are not illiquid, amounted to $155,516,951, which represents 12.1% of net assets.
(b) The interest rate shown on floating rate or variable rate securities reflects the rate at February 28, 2006.
(c) Cost for federal income tax purposes is $1,275,240,748.
At February 28,2006, the asset allocation of the fund is as follows;
| Asset Allocation | % of Net Assets | ||||||
| Corporate Fixed-Income Bonds & Notes | 95.9 | % | |||||
| Short-Term Obligation | 2.9 | ||||||
| Other Assets & Liabilities, Net | 1.2 | ||||||
| 100.0 | % | ||||||
| Acronym | Name | ||||||
| REIT | Real Estate Investment Trust | ||||||
See Accompanying Notes to Financial Statements.
76
This page intentionally left blank.
STATEMENTS OF ASSETS AND LIABILITIES
February 28, 2006 (Unaudited) Columbia Funds
| International Stock Fund ($) | Mid Cap Growth Fund ($) | Small Cap Growth Fund I ($) | Real Estate Equity Fund ($) | Technology Fund ($) | |||||||||||||||||||
| Assets: | |||||||||||||||||||||||
| Investments, at identified cost (including short-term obligations) | 1,128,823,646 | 682,297,629 | 152,926,379 | 328,820,376 | 134,497,187 | ||||||||||||||||||
| Investments, at value | 1,366,654,520 | 909,768,804 | 206,189,766 | 653,554,790 | 148,603,706 | ||||||||||||||||||
| Repurchase agreement | 15,197,000 | 21,432,000 | 1,593,000 | 12,155,000 | 8,593,000 | ||||||||||||||||||
| Total investments, at value | 1,381,851,520 | 931,200,804 | 207,782,766 | 665,709,790 | 157,196,706 | ||||||||||||||||||
| Cash | 2,278 | 100 | 171,451 | 915 | 977 | ||||||||||||||||||
| Foreign currency (cost of $4,265,06, $—, $—, $—, $—, $1,466, $—, $— and $—, respectively) | 4,269,700 | — | — | — | — | ||||||||||||||||||
| Receivable for: | |||||||||||||||||||||||
| Investments sold | 18,941,594 | 1,384,504 | 1,195,886 | — | 2,477,900 | ||||||||||||||||||
| Capital stock sold | 443,735 | 1,036,455 | 468,103 | 399,407 | 5,040,189 | ||||||||||||||||||
| Interest | 1,874 | 2,643 | 197 | 1,500 | 1,060 | ||||||||||||||||||
| Dividends | 1,459,650 | 613,325 | 7,225 | 502,703 | 9,366 | ||||||||||||||||||
| Foreign tax reclaim | 347,612 | — | — | — | — | ||||||||||||||||||
| Deferred Trustees' compensation plan | 80,293 | 27,389 | 7,407 | 12,254 | 3,794 | ||||||||||||||||||
| Other assets | 101,043 | 14,114 | 14,455 | 21,326 | — | ||||||||||||||||||
| Total assets | 1,407,499,299 | 934,279,334 | 209,647,490 | 666,647,895 | 164,729,992 | ||||||||||||||||||
| Liabilities: | |||||||||||||||||||||||
| Payable for: | |||||||||||||||||||||||
| Investments purchased | 18,897,825 | 376,118 | 1,270,915 | — | 4,994,657 | ||||||||||||||||||
| Capital stock redeemed | — | — | 615,917 | 1,365,867 | 172,947 | ||||||||||||||||||
| Distributions | 1,905,141 | — | 124 | — | — | ||||||||||||||||||
| Investment advisory fee | 873,549 | 563,544 | 143,155 | 386,059 | 98,887 | ||||||||||||||||||
| Transfer agent fee | 49,807 | 74,781 | 18,380 | 24,823 | — | ||||||||||||||||||
| Pricing and bookkeeping fees | 16,780 | 13,645 | 7,302 | 12,856 | 2,480 | ||||||||||||||||||
| Directors' fees | — | — | — | — | — | ||||||||||||||||||
| Service and distribution fees | 119,436 | 16,857 | 238 | 24,782 | 23,355 | ||||||||||||||||||
| Custody fee | 50,203 | 3,536 | 2,059 | 1,891 | — | ||||||||||||||||||
| Registration fees | — | — | — | — | 5,707 | ||||||||||||||||||
| Reports to shareholders | 53,422 | 76,308 | 21,997 | 73,462 | 4,958 | ||||||||||||||||||
| Chief compliance officer expenses | 2,239 | 1,654 | 869 | 1,534 | 721 | ||||||||||||||||||
| Deferred Trustees' fees | 80,293 | 27,389 | 7,407 | 12,254 | 3,794 | ||||||||||||||||||
| Foreign capital gains tax payable | 623,632 | — | — | — | — | ||||||||||||||||||
| Other liabilities | — | — | — | — | 711 | ||||||||||||||||||
| Total liabilities | 22,672,327 | 1,153,832 | 2,088,363 | 1,903,528 | 5,308,217 | ||||||||||||||||||
| Net Assets | 1,384,826,972 | 933,125,502 | 207,559,127 | 664,744,367 | 159,421,775 | ||||||||||||||||||
| Net Assets consist of: | |||||||||||||||||||||||
| Paid-in capital | 1,176,058,384 | 684,873,573 | 143,259,842 | 275,710,175 | 130,620,420 | ||||||||||||||||||
| Undistributed (overdistributed) net investment income | (65,486 | ) | — | — | (4,566,726 | ) | — | ||||||||||||||||
| Accumulated net investment loss | — | (1,144,532 | ) | (986,916 | ) | — | (459,831 | ) | |||||||||||||||
| Accumulated net realized gain (loss) | (43,565,917 | ) | 493,286 | 10,429,814 | 56,711,504 | 6,562,466 | |||||||||||||||||
| Unrealized appreciation (depreciation) on: | |||||||||||||||||||||||
| Investments | 253,027,874 | 248,903,175 | 54,856,387 | 336,889,414 | 22,699,519 | ||||||||||||||||||
| Foreign currency translations | (4,251 | ) | — | — | — | (799 | ) | ||||||||||||||||
| Foreign capital gains tax | (623,632 | ) | — | — | — | — | |||||||||||||||||
| Net Assets | 1,384,826,972 | 933,125,502 | 207,559,127 | 664,744,367 | 159,421,775 | ||||||||||||||||||
See Accompanying Notes to Financial Statements.
78
Columbia Funds
| Strategic Investor Fund ($) | Balanced Fund ($) | Oregon Intermediate Municipal Bond Fund ($) | Conservative High Yield Fund ($) | ||||||||||||||||
| Assets: | |||||||||||||||||||
| Investments, at identified cost (including short-term obligations) | 390,272,630 | 258,491,246 | 380,549,430 | 1,268,870,381 | |||||||||||||||
| Investments, at value | 405,190,006 | 271,167,576 | 398,170,402 | 1,235,579,716 | |||||||||||||||
| Repurchase agreement | 79,464,000 | 4,400,000 | — | 37,558,000 | |||||||||||||||
| Total investments, at value | 484,654,006 | 275,567,576 | 398,170,402 | 1,273,137,716 | |||||||||||||||
| Cash | 65 | 507 | 38,403 | 729 | |||||||||||||||
| Foreign currency (cost of $4,265,06, $—, $—, $—, $—, $1,466, $—, $— and $—, respectively) | 1,470 | — | — | — | |||||||||||||||
| Receivable for: | |||||||||||||||||||
| Investments sold | 860,509 | 1,921,519 | — | — | |||||||||||||||
| Capital stock sold | 995,232 | 126,642 | 100,926 | 1,212,448 | |||||||||||||||
| Interest | 9,801 | 827,750 | 4,510,746 | 22,928,671 | |||||||||||||||
| Dividends | 545,080 | 164,724 | — | — | |||||||||||||||
| Foreign tax reclaim | 2,537 | 2,231 | — | — | |||||||||||||||
| Deferred Trustees' compensation plan | 20,230 | 7,709 | 8,169 | 20,576 | |||||||||||||||
| Other assets | 7,709 | — | — | 147,087 | |||||||||||||||
| Total assets | 487,096,639 | 278,618,658 | 402,828,646 | 1,297,447,227 | |||||||||||||||
| Liabilities: | |||||||||||||||||||
| Payable for: | |||||||||||||||||||
| Investments purchased | 259,164 | 2,470,143 | — | 1,762,682 | |||||||||||||||
| Capital stock redeemed | 1,156,034 | 896,344 | 211,589 | 2,624,078 | |||||||||||||||
| Distributions | — | — | 333,278 | 3,855,533 | |||||||||||||||
| Investment advisory fee | 277,267 | 114,151 | 155,242 | 566,237 | |||||||||||||||
| Transfer agent fee | 54,913 | 45,721 | 24,865 | — | |||||||||||||||
| Pricing and bookkeeping fees | 15,519 | 20,245 | 19,726 | 18,655 | |||||||||||||||
| Directors' fees | — | 884 | — | — | |||||||||||||||
| Service and distribution fees | 109,734 | 8,578 | 2,444 | 146,277 | |||||||||||||||
| Custody fee | 9,166 | 7,171 | 3,486 | 9,358 | |||||||||||||||
| Registration fees | 13,776 | 8,232 | 9,623 | — | |||||||||||||||
| Reports to shareholders | 37,845 | 24,778 | 11,655 | 79,879 | |||||||||||||||
| Chief compliance officer expenses | 1,223 | 972 | 1,106 | 2,291 | |||||||||||||||
| Deferred Trustees' fees | 20,230 | 7,709 | 8,169 | 20,576 | |||||||||||||||
| Foreign capital gains tax payable | — | — | — | — | |||||||||||||||
| Other liabilities | — | 26,687 | 2,825 | — | |||||||||||||||
| Total liabilities | 1,954,871 | 3,631,615 | �� | 784,008 | 9,085,566 | ||||||||||||||
| Net Assets | 485,141,768 | 274,987,043 | 402,044,638 | 1,288,361,661 | |||||||||||||||
| Net Assets consist of: | |||||||||||||||||||
| Paid-in capital | 371,262,154 | 277,319,367 | 385,097,291 | 1,306,699,343 | |||||||||||||||
| Undistributed (overdistributed) net investment income | 727,315 | 362,130 | 98,697 | (10,110,453 | ) | ||||||||||||||
| Accumulated net investment loss | — | — | — | — | |||||||||||||||
| Accumulated net realized gain (loss) | 18,771,593 | (19,770,784 | ) | (772,322 | ) | (12,494,564 | ) | ||||||||||||
| Unrealized appreciation (depreciation) on: | |||||||||||||||||||
| Investments | 94,381,376 | 17,076,330 | 17,620,972 | 4,267,335 | |||||||||||||||
| Foreign currency translations | (670 | ) | — | — | — | ||||||||||||||
| Foreign capital gains tax | — | — | — | — | |||||||||||||||
| Net Assets | 485,141,768 | 274,987,043 | 402,044,638 | 1,288,361,661 | |||||||||||||||
See Accompanying Notes to Financial Statements.
79
STATEMENTS OF ASSETS AND LIABILITIES
February 28, 2006 (Unaudited) Columbia Funds
| International Stock Fund ($) | Mid Cap Growth Fund (a)($) | Small Cap Growth Fund I (b)($) | Real Estate Equity Fund ($) | Technology Fund ($) | |||||||||||||||||||
| Class A | |||||||||||||||||||||||
| Net assets | 270,328,339 | 10,949,236 | 457,720 | 42,216,094 | 57,750,606 | ||||||||||||||||||
| Shares outstanding | 15,259,465 | 432,913 | 14,526 | 1,596,649 | 5,591,064 | ||||||||||||||||||
| Net asset value per share (c)(d) | 17.72 | 25.29 | 31.51 | 26.44 | 10.33 | ||||||||||||||||||
| Maximum sales charge | 5.75 | 5.75 | 5.75 | 5.75 | 5.75 | ||||||||||||||||||
| Maximum offering price per share (e) | 18.80 | 26.83 | 33.43 | 28.05 | 10.96 | ||||||||||||||||||
| Class B | |||||||||||||||||||||||
| Net assets | 55,026,217 | 7,991,596 | 150,686 | 13,112,556 | 6,478,863 | ||||||||||||||||||
| Shares outstanding | 3,169,772 | 324,045 | 4,790 | 495,532 | 640,919 | ||||||||||||||||||
| Net asset value and offering price per share (c)(d) | 17.36 | 24.66 | 31.46 | 26.46 | 10.11 | ||||||||||||||||||
| Class C | |||||||||||||||||||||||
| Net assets | 28,235,197 | 1,447,378 | 77,878 | 5,055,992 | 13,171,471 | ||||||||||||||||||
| Shares outstanding | 1,620,042 | 58,569 | 2,475 | 191,257 | 1,300,126 | ||||||||||||||||||
| Net asset value and offering price per share (c)(d) | 17.43 | 24.71 | 31.46 | 26.44 | 10.13 | ||||||||||||||||||
| Class D | |||||||||||||||||||||||
| Net assets | 814,602 | 425,929 | — | 3,957,209 | 27,527 | ||||||||||||||||||
| Shares outstanding | 46,592 | 17,257 | — | 149,583 | 2,706 | ||||||||||||||||||
| Net asset value and offering price per share (c)(d) | 17.48 | 24.68 | — | 26.46 | 10.17 | ||||||||||||||||||
| Class G | |||||||||||||||||||||||
| Net assets | 3,281,529 | 756,159 | — | — | — | ||||||||||||||||||
| Shares outstanding | 189,133 | 30,741 | — | — | — | ||||||||||||||||||
| Net asset value and offering price per share (c)(d) | 17.35 | 24.60 | — | — | — | ||||||||||||||||||
| Class R | |||||||||||||||||||||||
| Net assets | — | 10,186 | — | — | — | ||||||||||||||||||
| Shares outstanding | — | 403 | — | — | — | ||||||||||||||||||
| Net asset value and offering price per share (c)(d) | — | 25.28 | — | — | — | ||||||||||||||||||
| Class T | |||||||||||||||||||||||
| Net assets | — | 30,236,599 | — | — | — | ||||||||||||||||||
| Shares outstanding | — | 1,193,665 | — | — | — | ||||||||||||||||||
| Net asset value per share (c) | — | 25.33 | — | — | — | ||||||||||||||||||
| Maximum sales charge | — | 5.75 | — | — | — | ||||||||||||||||||
| Maximum offering price per share (e) | — | 26.88 | — | — | — | ||||||||||||||||||
| Class Z | |||||||||||||||||||||||
| Net assets | 1,027,141,088 | 881,308,419 | 206,872,843 | 600,402,516 | 81,993,308 | ||||||||||||||||||
| Shares outstanding | 57,626,177 | 34,408,005 | 6,558,964 | 22,690,439 | 7,864,425 | ||||||||||||||||||
| Net asset value and offering price per share (d) | 17.82 | 25.61 | 31.54 | 26.46 | 10.43 | ||||||||||||||||||
(a) Class R shares were initially offered on January 23, 2006.
(b) Classes A, B and C were initially offered on November 1, 2005.
(c) Redemption price per share is equal to net asset value less any applicable contingent deferred sales charge.
(d) Redemption price per share is equal to net asset value less any applicable redemption fees.
(e) On sales of $50,000 or more the offering price is reduced.
See Accompanying Notes to Financial Statements.
80
Columbia Funds
| Strategic Investor Fund ($) | Balanced Fund ($) | Oregon Intermediate Municipal Bond Fund ($) | Conservative High Yield Fund ($) | ||||||||||||||||
| Class A | |||||||||||||||||||
| Net assets | 185,022,983 | 3,972,158 | 5,063,653 | 215,333,240 | |||||||||||||||
| Shares outstanding | 8,899,128 | 177,631 | 411,700 | 25,254,642 | |||||||||||||||
| Net asset value per share (c)(d) | 20.79 | 22.36 | 12.30 | 8.53 | |||||||||||||||
| Maximum sales charge | 5.75 | 5.75 | 3.25 | 4.75 | |||||||||||||||
| Maximum offering price per share (e) | 22.06 | 23.72 | 12.71 | 8.96 | |||||||||||||||
| Class B | |||||||||||||||||||
| Net assets | 53,916,987 | 7,893,095 | 1,124,068 | 79,006,420 | |||||||||||||||
| Shares outstanding | 2,633,870 | 353,507 | 91,390 | 9,265,970 | |||||||||||||||
| Net asset value and offering price per share (c)(d) | 20.47 | 22.33 | 12.30 | 8.53 | |||||||||||||||
| Class C | |||||||||||||||||||
| Net assets | 45,615,847 | 1,175,240 | 559,983 | 14,258,955 | |||||||||||||||
| Shares outstanding | 2,227,709 | 52,633 | 45,528 | 1,672,326 | |||||||||||||||
| Net asset value and offering price per share (c)(d) | 20.48 | 22.33 | 12.30 | 8.53 | |||||||||||||||
| Class D | |||||||||||||||||||
| Net assets | 467,904 | 239,638 | 723,859 | 45,214,264 | |||||||||||||||
| Shares outstanding | 22,866 | 10,734 | 58,852 | 5,302,806 | |||||||||||||||
| Net asset value and offering price per share (c)(d) | 20.46 | 22.32 | 12.30 | 8.53 | |||||||||||||||
| Class G | |||||||||||||||||||
| Net assets | — | — | — | — | |||||||||||||||
| Shares outstanding | — | — | — | — | |||||||||||||||
| Net asset value and offering price per share (c)(d) | — | — | — | — | |||||||||||||||
| Class R | |||||||||||||||||||
| Net assets | — | — | — | — | |||||||||||||||
| Shares outstanding | — | — | — | — | |||||||||||||||
| Net asset value and offering price per share (c)(d) | — | — | — | — | |||||||||||||||
| Class T | |||||||||||||||||||
| Net assets | — | — | — | — | |||||||||||||||
| Shares outstanding | — | — | — | — | |||||||||||||||
| Net asset value per share (c) | — | — | — | — | |||||||||||||||
| Maximum sales charge | — | — | — | — | |||||||||||||||
| Maximum offering price per share (e) | — | — | — | — | |||||||||||||||
| Class Z | |||||||||||||||||||
| Net assets | 200,118,047 | 261,706,912 | 394,573,075 | 934,548,782 | |||||||||||||||
| Shares outstanding | 9,607,528 | 11,711,177 | 32,079,912 | 109,603,781 | |||||||||||||||
| Net asset value and offering price per share (d) | 20.83 | 22.35 | 12.30 | 8.53 | |||||||||||||||
See Accompanying Notes to Financial Statements.
81
STATEMENTS OF OPERATIONS
For the Six Months Ended February 28, 2006 (Unaudited) Columbia Funds
| International Stock Fund ($) | Mid Cap Growth Fund ($) | Small Cap Growth Fund I ($) | Real Estate Equity Fund ($) | Technology Fund ($) | |||||||||||||||||||
| Net Investment Income Income | |||||||||||||||||||||||
| Dividends | 6,786,409 | 2,729,495 | 96,715 | 12,837,414 | 109,829 | ||||||||||||||||||
| Interest | 151,666 | 267,916 | 81,980 | 903,523 | 81,984 | ||||||||||||||||||
| Foreign taxes withheld | (316,978 | ) | (3,541 | ) | — | (13,827 | ) | (1,130 | ) | ||||||||||||||
| Total income | 6,621,097 | 2,993,870 | 178,695 | 13,727,110 | 190,683 | ||||||||||||||||||
| Expenses | |||||||||||||||||||||||
| Investment advisory fee | 5,331,555 | 3,412,263 | 893,257 | 2,801,240 | 415,909 | ||||||||||||||||||
| Distribution fee: | |||||||||||||||||||||||
| Class B | 181,235 | 25,733 | 151 | 50,219 | 15,493 | ||||||||||||||||||
| Class C | 81,375 | 3,718 | 103 | 17,748 | 19,088 | ||||||||||||||||||
| Class D | 2,912 | 1,611 | — | 14,976 | 92 | ||||||||||||||||||
| Class G | 12,184 | 2,397 | — | — | — | ||||||||||||||||||
| Class R | — | 6 | — | — | — | ||||||||||||||||||
| Service Fee: | |||||||||||||||||||||||
| Class A | 272,604 | 9,900 | 110 | 53,128 | 36,808 | ||||||||||||||||||
| Class B | 60,412 | 8,577 | 50 | 16,740 | 5,164 | ||||||||||||||||||
| Class C | 27,125 | 1,236 | 34 | 5,915 | 6,307 | ||||||||||||||||||
| Class D | 970 | 537 | — | 4,992 | 31 | ||||||||||||||||||
| Class G | 5,624 | 1,106 | — | — | — | ||||||||||||||||||
| Shareholder services fee – Class T | — | 42,899 | — | — | — | ||||||||||||||||||
| Transfer agent fee | 440,408 | 422,245 | 120,743 | 350,774 | 42,414 | ||||||||||||||||||
| Pricing and bookkeeping fees | 84,273 | 79,444 | 44,645 | 78,388 | 31,702 | ||||||||||||||||||
| Directors' fees | 16,818 | 14,415 | 6,346 | 14,834 | 3,858 | ||||||||||||||||||
| Custody fee | 318,208 | 17,932 | 13,291 | 10,282 | 9,163 | ||||||||||||||||||
| Registration fees | 56,751 | 51,223 | 27,961 | 47,500 | 32,168 | ||||||||||||||||||
| Reports to shareholders | 54,892 | 84,164 | 22,610 | 87,832 | 9,583 | ||||||||||||||||||
| Chief compliance officer expenses (See Note 4) | 7,109 | 6,231 | 3,225 | 6,050 | 2,489 | ||||||||||||||||||
| Non-recurring costs (See Note 9) | 7,937 | 5,217 | 1,264 | 4,613 | 531 | ||||||||||||||||||
| Other expenses | 55,227 | 56,317 | 35,141 | 52,446 | 15,712 | ||||||||||||||||||
| Total Operating Expenses | 7,017,619 | 4,247,171 | 1,168,931 | 3,617,677 | 646,512 | ||||||||||||||||||
| Interest expense | 20,665 | — | 528 | 417 | — | ||||||||||||||||||
| Total Expenses | 7,038,284 | 4,247,171 | 1,169,459 | 3,618,094 | 646,512 | ||||||||||||||||||
| Fees waived by Distributor: | |||||||||||||||||||||||
| Class C | — | — | — | — | — | ||||||||||||||||||
| Class D | — | — | — | — | — | ||||||||||||||||||
| Fees waived by Transfer Agent | (315,273 | ) | (115,187 | ) | (2,454 | ) | (13,205 | ) | (4,659 | ) | |||||||||||||
| Non-recurring costs assumed by Investment | |||||||||||||||||||||||
| Advisor (See Note 9) | (7,937 | ) | (5,217 | ) | (1,264 | ) | (4,613 | ) | (531 | ) | |||||||||||||
| Custody earnings credit | (52,738 | ) | (364 | ) | (130 | ) | (17 | ) | (1,685 | ) | |||||||||||||
| Net Expenses | 6,662,336 | 4,126,403 | 1,165,611 | 3,600,259 | 639,637 | ||||||||||||||||||
| Net Investment Income (Loss) | (41,239 | ) | (1,132,533 | ) | (986,916 | ) | 10,126,851 | (448,954 | ) | ||||||||||||||
See Accompanying Notes to Financial Statements.
82
Columbia Funds
| Strategic Investor Fund ($) | Balanced Fund ($) | Oregon Intermediate Municipal Bond Fund ($) | Conservative High Yield Fund ($) | ||||||||||||||||
| Net Investment Income Income | |||||||||||||||||||
| Dividends | 2,585,135 | 921,361 | — | — | |||||||||||||||
| Interest | 2,078,957 | 2,854,651 | 9,301,282 | 47,724,382 | |||||||||||||||
| Foreign taxes withheld | — | — | — | — | |||||||||||||||
| Total income | 4,664,092 | 3,776,012 | 9,301,282 | 47,724,382 | |||||||||||||||
| Expenses | |||||||||||||||||||
| Investment advisory fee | 1,875,817 | 726,486 | 1,005,643 | 3,863,705 | |||||||||||||||
| Distribution fee: | |||||||||||||||||||
| Class B | 192,958 | 29,845 | 4,346 | 312,140 | |||||||||||||||
| Class C | 158,313 | 3,842 | 2,141 | 59,997 | |||||||||||||||
| Class D | 1,859 | 912 | 2,796 | 190,248 | |||||||||||||||
| Class G | — | — | — | — | |||||||||||||||
| Class R | — | — | — | — | |||||||||||||||
| Service Fee: | |||||||||||||||||||
| Class A | 218,614 | 4,489 | 5,517 | 311,341 | |||||||||||||||
| Class B | 64,319 | 9,948 | 1,449 | 104,047 | |||||||||||||||
| Class C | 52,770 | 1,281 | 714 | 19,999 | |||||||||||||||
| Class D | 620 | 303 | 932 | 63,416 | |||||||||||||||
| Class G | — | — | — | — | |||||||||||||||
| Shareholder services fee – Class T | — | — | — | — | |||||||||||||||
| Transfer agent fee | 309,568 | 165,824 | 83,082 | 432,064 | |||||||||||||||
| Pricing and bookkeeping fees | 76,348 | 68,002 | 76,477 | 88,547 | |||||||||||||||
| Directors' fees | 10,007 | 9,253 | 8,955 | 24,288 | |||||||||||||||
| Custody fee | 28,472 | 17,795 | 10,636 | 29,053 | |||||||||||||||
| Registration fees | 48,855 | 32,565 | 30,850 | 76,503 | |||||||||||||||
| Reports to shareholders | 55,729 | 26,029 | 14,967 | 135,184 | |||||||||||||||
| Chief compliance officer expenses (See Note 4) | 4,798 | 3,711 | 4,246 | 7,186 | |||||||||||||||
| Non-recurring costs (See Note 9) | 3,066 | 1,792 | 2,462 | 8,484 | |||||||||||||||
| Other expenses | 37,596 | 43,686 | 37,623 | 77,037 | |||||||||||||||
| Total Operating Expenses | 3,139,709 | 1,145,763 | 1,292,836 | 5,803,239 | |||||||||||||||
| Interest expense | — | — | — | — | |||||||||||||||
| Total Expenses | 3,139,709 | 1,145,763 | 1,292,836 | 5,803,239 | |||||||||||||||
| Fees waived by Distributor: | |||||||||||||||||||
| Class C | — | — | (999 | ) | (11,999 | ) | |||||||||||||
| Class D | — | — | (1,305 | ) | (38,049 | ) | |||||||||||||
| Fees waived by Transfer Agent | (58,474 | ) | (15,815 | ) | (7,173 | ) | (21,371 | ) | |||||||||||
| Non-recurring costs assumed by Investment | |||||||||||||||||||
| Advisor (See Note 9) | (3,066 | ) | (1,792 | ) | (2,462 | ) | (8,484 | ) | |||||||||||
| Custody earnings credit | (543 | ) | (35 | ) | (1,012 | ) | (19,695 | ) | |||||||||||
| Net Expenses | 3,077,626 | 1,128,121 | 1,279,885 | 5,703,641 | |||||||||||||||
| Net Investment Income (Loss) | 1,586,466 | 2,647,891 | 8,021,397 | 42,020,741 | |||||||||||||||
See Accompanying Notes to Financial Statements.
83
STATEMENTS OF OPERATIONS
For the Six Months Ended February 28, 2006 (Unaudited) Columbia Funds
| International Stock Fund ($) | Mid Cap Growth Fund (a)($) | Small Cap Growth Fund I (b)($) | Real Estate Equity Fund ($) | Technology Fund ($) | |||||||||||||||||||
| Net Realized and Unrealized Gain (Loss) on Investments, Foreign Currency, Foreign Capital Gains Tax, Futures Contracts and Written Options | |||||||||||||||||||||||
| Net realized gain (loss) on: | |||||||||||||||||||||||
| Investments | 109,153,470 | 23,094,371 | 15,056,508 | 71,170,887 | 9,109,901 | ||||||||||||||||||
| Foreign currency transactions | (1,013,654 | ) | (22,030 | ) | (9,755 | ) | — | (2,625 | ) | ||||||||||||||
| Foreign capital gains tax | (992,912 | ) | — | — | — | — | |||||||||||||||||
| Futures contracts | — | — | — | — | — | ||||||||||||||||||
| Written options | — | — | — | — | (4,440 | ) | |||||||||||||||||
| Net realized gain (loss) | 107,146,904 | 23,072,341 | 15,046,753 | 71,170,887 | 9,102,836 | ||||||||||||||||||
| Change in net unrealized appreciation (depreciation) on: | |||||||||||||||||||||||
| Investments | 74,127,741 | 105,745,974 | 17,370,359 | (15,121,907 | ) | 12,318,237 | |||||||||||||||||
| Foreign currency translations | (12,013 | ) | (59 | ) | — | — | (799 | ) | |||||||||||||||
| Foreign capital gains tax | (623,632 | ) | — | — | — | — | |||||||||||||||||
| Futures contracts | — | — | — | — | — | ||||||||||||||||||
| Written options | — | — | — | — | 2,920 | ||||||||||||||||||
| Net change in net unrealized appreciation (depreciation) | 73,492,096 | 105,745,915 | 17,370,359 | (15,121,907 | ) | 12,320,358 | |||||||||||||||||
| Net Gain (Loss) | 180,639,000 | 128,818,256 | 32,417,112 | 56,048,980 | 21,423,194 | ||||||||||||||||||
| Net Increase Resulting From Operations | 180,597,761 | 127,685,723 | 31,430,196 | 66,175,831 | 20,974,240 | ||||||||||||||||||
(a) Class R shares were initially offered on January 23, 2006.
(b) Classes A, B and C were initially offered on November 1, 2005.
See Accompanying Notes to Financial Statements.
84
Columbia Funds
| Strategic Investor Fund ($) | Balanced Fund ($) | Oregon Intermediate Municipal Bond Fund ($) | Conservative High Yield Fund ($) | ||||||||||||||||
| Net Realized and Unrealized Gain (Loss) on Investments, Foreign Currency, Foreign Capital Gains Tax, Futures Contracts and Written Options | |||||||||||||||||||
| Net realized gain (loss) on: | |||||||||||||||||||
| Investments | 27,423,387 | 10,724,338 | 6,550 | (2,918,008 | ) | ||||||||||||||
| Foreign currency transactions | (49,257 | ) | — | — | — | ||||||||||||||
| Foreign capital gains tax | — | — | — | — | |||||||||||||||
| Futures contracts | — | 60,938 | — | — | |||||||||||||||
| Written options | — | — | — | — | |||||||||||||||
| Net realized gain (loss) | 27,374,130 | 10,785,276 | 6,550 | (2,918,008 | ) | ||||||||||||||
| Change in net unrealized appreciation (depreciation) on: | |||||||||||||||||||
| Investments | 167,929 | (2,492,567 | ) | (5,112,162 | ) | (11,888,377 | ) | ||||||||||||
| Foreign currency translations | (2,877 | ) | — | — | — | ||||||||||||||
| Foreign capital gains tax | — | — | — | — | |||||||||||||||
| Futures contracts | — | 5,469 | — | — | |||||||||||||||
| Written options | — | — | — | — | |||||||||||||||
| Net change in net unrealized appreciation (depreciation) | 165,052 | (2,487,098 | ) | (5,112,162 | ) | (11,888,377 | ) | ||||||||||||
| Net Gain (Loss) | 27,539,182 | 8,298,178 | (5,105,612 | ) | (14,806,385 | ) | |||||||||||||
| Net Increase Resulting From Operations | 29,125,648 | 10,946,069 | 2,915,785 | 27,214,356 | |||||||||||||||
See Accompanying Notes to Financial Statements.
85
STATEMENTS OF CHANGES IN NET ASSETS
Columbia Funds
| International Stock Fund | Mid Cap Growth Fund | ||||||||||||||||||
| Increase (Decrease) in Net Assets | (Unaudited) Six Months Ended February 28, 2006 ($) | Year Ended August 31, 2005 (a)($) | (Unaudited) Six Months Ended February 28, 2006 (b)($) | Year Ended August 31, 2005 ($) | |||||||||||||||
| Operations | |||||||||||||||||||
| Net investment income (loss) | (41,239 | ) | 14,193,962 | (1,132,533 | ) | (4,630,893 | ) | ||||||||||||
| Net realized gain on investments and foreign currency transactions, | |||||||||||||||||||
| net of foreign capital gains tax | 107,146,904 | 62,496,349 | 23,072,341 | 119,631,326 | |||||||||||||||
| Net change in unrealized appreciation (depreciation) on | |||||||||||||||||||
| investments and foreign currency translations, net of foreign | |||||||||||||||||||
| capital gains tax | 73,492,096 | 53,053,677 | 105,745,915 | 117,840,750 | |||||||||||||||
| Net increase resulting from operations | 180,597,761 | 129,743,988 | 127,685,723 | 232,841,183 | |||||||||||||||
| Distributions to Shareholders | |||||||||||||||||||
| From net investment income: | |||||||||||||||||||
| Class A | (1,897,373 | ) | (6,207 | ) | — | — | |||||||||||||
| Class B | (28,284 | ) | — | — | — | ||||||||||||||
| Class C | (13,322 | ) | — | — | — | ||||||||||||||
| Class D | (382 | ) | — | — | — | ||||||||||||||
| Class G | (3,482 | ) | — | — | — | ||||||||||||||
| Class Z | (9,672,983 | ) | (3,041,056 | ) | — | — | |||||||||||||
| From net realized gains: | |||||||||||||||||||
| Class A | (2,668,119 | ) | — | (109,235 | ) | — | |||||||||||||
| Class B | (613,184 | ) | — | (92,907 | ) | — | |||||||||||||
| Class C | (289,740 | ) | — | (12,559 | ) | — | |||||||||||||
| Class D | (8,320 | ) | — | (5,866 | ) | — | |||||||||||||
| Class G | (38,588 | ) | — | (10,098 | ) | — | |||||||||||||
| Class T | — | — | (375,814 | ) | — | ||||||||||||||
| Class Z | (10,376,676 | ) | — | (10,607,269 | ) | — | |||||||||||||
| Total distributions to shareholders | (25,610,453 | ) | (3,047,263 | ) | (11,213,748 | ) | — | ||||||||||||
| Net Capital Share Transactions | 176,371,434 | 332,899,857 | (25,110,473 | ) | (253,558,502 | ) | |||||||||||||
| Redemption Fees | 19,207 | 61,174 | — | — | |||||||||||||||
| Net increase (decrease) in net assets | 331,377,949 | 459,657,756 | 91,361,502 | (20,717,319 | ) | ||||||||||||||
| Net Assets | |||||||||||||||||||
| Beginning of period | 1,053,449,023 | 593,791,267 | 841,764,000 | 862,481,319 | |||||||||||||||
| End of period | 1,384,826,972 | 1,053,449,023 | 933,125,502 | 841,764,000 | |||||||||||||||
| Undistributed (overdistributed) net investment income, at end of period | (65,486 | ) | 11,591,579 | — | — | ||||||||||||||
| Accumulated net investment loss, at end of period | — | — | (1,144,532 | ) | (11,999 | ) | |||||||||||||
| Small Cap Growth Fund I | Real Estate Equity Fund | ||||||||||||||||||
| Increase (Decrease) in Net Assets | (Unaudited) Six Months Ended February 28, 2006 (c)($) | Year Ended August 31, 2005 ($) | (Unaudited) Six Months Ended February 28, 2006 ($) | Year Ended August 31, 2005 ($) | |||||||||||||||
| Operations | |||||||||||||||||||
| Net investment income (loss) | (986,916 | ) | (2,978,014 | ) | 10,126,851 | 30,056,402 | |||||||||||||
| Net realized gain on investments and foreign currency transactions, | |||||||||||||||||||
| net of foreign capital gains tax | 15,046,753 | 102,209,847 | 71,170,887 | 81,089,198 | |||||||||||||||
| Net change in unrealized appreciation (depreciation) on | |||||||||||||||||||
| investments and foreign currency translations, net of foreign | |||||||||||||||||||
| capital gains tax | 17,370,359 | (3,864,358 | ) | (15,121,907 | ) | 74,511,099 | |||||||||||||
| Net increase resulting from operations | 31,430,196 | 95,367,475 | 66,175,831 | 185,656,699 | |||||||||||||||
| Distributions to Shareholders | |||||||||||||||||||
| From net investment income: | |||||||||||||||||||
| Class A | — | — | (780,384 | ) | (1,382,574 | ) | |||||||||||||
| Class B | — | — | (193,571 | ) | (366,492 | ) | |||||||||||||
| Class C | — | — | (66,659 | ) | (94,718 | ) | |||||||||||||
| Class D | — | — | (56,587 | ) | (117,799 | ) | |||||||||||||
| Class G | — | — | — | — | |||||||||||||||
| Class Z | — | — | (13,591,537 | ) | (32,021,396 | ) | |||||||||||||
| From net realized gains: | |||||||||||||||||||
| Class A | (955 | ) | — | (5,027,442 | ) | (3,329,894 | ) | ||||||||||||
| Class B | (1,289 | ) | — | (1,591,961 | ) | (1,146,743 | ) | ||||||||||||
| Class C | (452 | ) | — | (555,755 | ) | (270,229 | ) | ||||||||||||
| Class D | — | — | (462,275 | ) | (366,470 | ) | |||||||||||||
| Class G | — | — | — | — | |||||||||||||||
| Class T | — | — | — | — | |||||||||||||||
| Class Z | (6,483,989 | ) | — | (82,518,380 | ) | (77,132,968 | ) | ||||||||||||
| Total distributions to shareholders | (6,486,685 | ) | — | (104,844,551 | ) | (116,229,283 | ) | ||||||||||||
| Net Capital Share Transactions | (32,043,158 | ) | (423,725,008 | ) | (123,967,333 | ) | (165,370,335 | ) | |||||||||||
| Redemption Fees | — | — | — | — | |||||||||||||||
| Net increase (decrease) in net assets | (7,099,647 | ) | (328,357,533 | ) | (162,636,053 | ) | (95,942,919 | ) | |||||||||||
| Net Assets | |||||||||||||||||||
| Beginning of period | 214,658,774 | 543,016,307 | 827,380,420 | 923,323,339 | |||||||||||||||
| End of period | 207,559,127 | 214,658,774 | 664,744,367 | 827,380,420 | |||||||||||||||
| Undistributed (overdistributed) net investment income, at end of period | — | — | (4,566,726 | ) | (4,839 | ) | |||||||||||||
| Accumulated net investment loss, at end of period | (986,916 | ) | — | — | — | ||||||||||||||
(a) Class G shares were initially offered on March 18, 2005.
(b) Class R shares were initially offered on January 23, 2006.
(c) Classes A, B and C were initially offered on November 1, 2005.
See Accompanying Notes to Financial Statements.
86
Columbia Funds
See Accompanying Notes to Financial Statements.
87
STATEMENTS OF CHANGES IN NET ASSETS
Columbia Funds
| Technology Fund | Strategic Investor Fund | Balanced Fund | |||||||||||||||||||||||||
| Increase (Decrease) in Net Assets | (Unaudited) Six Months Ended February 28, 2006 ($) | Year Ended August 31, 2005 ($) | (Unaudited) Six Months Ended February 28, 2006 ($) | Year Ended August 31, 2005 ($) | (Unaudited) Six Months Ended February 28, 2006 ($) | Year Ended August 31, 2005 ($) | |||||||||||||||||||||
| Operations | |||||||||||||||||||||||||||
| Net investment income (loss) | (448,954 | ) | (646,865 | ) | 1,586,466 | 3,249,223 | 2,647,891 | 8,190,456 | |||||||||||||||||||
| Net realized gain on investments, foreign currency transactions, | |||||||||||||||||||||||||||
| futures contracts and written options | 9,102,836 | 6,350,610 | 27,374,130 | 28,598,770 | 10,785,276 | 37,568,398 | |||||||||||||||||||||
| Net change in unrealized appreciation (depreciation) on investments, | |||||||||||||||||||||||||||
| foreign currency translations, futures contracts and written options | 12,320,358 | 8,212,267 | 165,052 | 41,410,600 | (2,487,098 | ) | 666,125 | ||||||||||||||||||||
| Net increase resulting from operations | 20,974,240 | 13,916,012 | 29,125,648 | 73,258,593 | 10,946,069 | 46,424,979 | |||||||||||||||||||||
| Distributions to Shareholders | |||||||||||||||||||||||||||
| From net investment income: | |||||||||||||||||||||||||||
| Class A | — | — | (1,141,064 | ) | (167,034 | ) | (32,868 | ) | (56,637 | ) | |||||||||||||||||
| Class B | — | — | — | — | (44,349 | ) | (95,456 | ) | |||||||||||||||||||
| Class C | — | — | — | — | (5,455 | ) | (10,210 | ) | |||||||||||||||||||
| Class D | — | — | — | — | (1,299 | ) | (4,166 | ) | |||||||||||||||||||
| Class Z | — | — | (2,001,898 | ) | (1,065,517 | ) | (3,013,106 | ) | (8,917,704 | ) | |||||||||||||||||
| From net realized gains: | |||||||||||||||||||||||||||
| Class A | (1,565,194 | ) | — | (12,351,692 | ) | (1,363,900 | ) | — | — | ||||||||||||||||||
| Class B | (208,799 | ) | — | (3,757,530 | ) | (348,215 | ) | — | — | ||||||||||||||||||
| Class C | (235,437 | ) | — | (3,083,517 | ) | (284,992 | ) | — | — | ||||||||||||||||||
| Class D | (1,272 | ) | — | (35,525 | ) | (6,971 | ) | — | — | ||||||||||||||||||
| Class Z | (3,469,745 | ) | — | (15,890,662 | ) | (3,186,369 | ) | — | — | ||||||||||||||||||
| Total distributions to shareholders | (5,480,447 | ) | — | (38,261,888 | ) | (6,422,998 | ) | (3,097,077 | ) | (9,084,173 | ) | ||||||||||||||||
| Net Capital Share Transactions | 83,107,396 | 11,109,769 | (31,539,051 | ) | 49,610,948 | (46,770,072 | ) | (218,132,925 | ) | ||||||||||||||||||
| Net increase (decrease) in net assets | 98,601,189 | 25,025,781 | (40,675,291 | ) | 116,446,543 | (38,921,080 | ) | (180,792,119 | ) | ||||||||||||||||||
| Net Assets | |||||||||||||||||||||||||||
| Beginning of period | 60,820,586 | 35,794,805 | 525,817,059 | 409,370,516 | 313,908,123 | 494,700,242 | |||||||||||||||||||||
| End of period | 159,421,775 | 60,820,586 | 485,141,768 | 525,817,059 | 274,987,043 | 313,908,123 | |||||||||||||||||||||
| Undistributed (overdistributed) net investment income, at end of period | — | — | 727,315 | 2,283,811 | 362,130 | 811,316 | |||||||||||||||||||||
| Accumulated net investment loss, at end of period | (459,831 | ) | (10,877 | ) | — | — | — | — | |||||||||||||||||||
| Oregon Intermediate Municipal Bond Fund | Conservative High Yield Fund | ||||||||||||||||||
| Increase (Decrease) in Net Assets | (Unaudited) Six Months Ended February 28, 2006 ($) | Year Ended August 31, 2005 ($) | (Unaudited) Six Months Ended February 28, 2006 ($) | Year Ended August 31, 2005 ($) | |||||||||||||||
| Operations | |||||||||||||||||||
| Net investment income (loss) | 8,021,397 | 16,832,262 | 42,020,741 | 95,740,819 | |||||||||||||||
| Net realized gain on investments, foreign currency transactions, | |||||||||||||||||||
| futures contracts and written options | 6,550 | (785,271 | ) | (2,918,008 | ) | 15,204,376 | |||||||||||||
| Net change in unrealized appreciation (depreciation) on investments, | |||||||||||||||||||
| foreign currency translations, futures contracts and written options | (5,112,162 | ) | 1,892,472 | (11,888,377 | ) | (23,698,367 | ) | ||||||||||||
| Net increase resulting from operations | 2,915,785 | 17,939,463 | 27,214,356 | 87,246,828 | |||||||||||||||
| Distributions to Shareholders | |||||||||||||||||||
| From net investment income: | |||||||||||||||||||
| Class A | (82,556 | ) | (147,260 | ) | (7,902,806 | ) | (20,080,465 | ) | |||||||||||
| Class B | (17,351 | ) | (36,249 | ) | (2,332,502 | ) | (5,162,031 | ) | |||||||||||
| Class C | (9,552 | ) | (14,421 | ) | (460,668 | ) | (1,139,377 | ) | |||||||||||
| Class D | (12,468 | ) | (25,822 | ) | (1,461,535 | ) | (3,908,977 | ) | |||||||||||
| Class Z | (7,889,429 | ) | (16,563,180 | ) | (32,392,148 | ) | (72,953,508 | ) | |||||||||||
| From net realized gains: | |||||||||||||||||||
| Class A | — | (11,016 | ) | — | — | ||||||||||||||
| Class B | — | (3,546 | ) | — | — | ||||||||||||||
| Class C | — | (1,075 | ) | — | — | ||||||||||||||
| Class D | — | (2,262 | ) | — | — | ||||||||||||||
| Class Z | — | (1,212,920 | ) | — | — | ||||||||||||||
| Total distributions to shareholders | (8,011,356 | ) | (18,017,751 | ) | (44,549,659 | ) | (103,244,358 | ) | |||||||||||
| Net Capital Share Transactions | (10,457,127 | ) | (22,772,356 | ) | (255,442,234 | ) | (154,177,592 | ) | |||||||||||
| Net increase (decrease) in net assets | (15,552,698 | ) | (22,850,644 | ) | (272,777,537 | ) | (170,175,122 | ) | |||||||||||
| Net Assets | |||||||||||||||||||
| Beginning of period | 417,597,336 | 440,447,980 | 1,561,139,198 | 1,731,314,320 | |||||||||||||||
| End of period | 402,044,638 | 417,597,336 | 1,288,361,661 | 1,561,139,198 | |||||||||||||||
| Undistributed (overdistributed) net investment income, at end of period | 98,697 | 88,656 | (10,110,453 | ) | (7,581,535 | ) | |||||||||||||
| Accumulated net investment loss, at end of period | — | — | — | — | |||||||||||||||
See Accompanying Notes to Financial Statements.
88
Columbia Funds
See Accompanying Notes to Financial Statements.
89
STATEMENTS OF CHANGES IN NET ASSETS – CAPITAL STOCK ACTIVITY
Columbia Funds
| International Stock Fund | |||||||||||||||||||
| (Unaudited) Six Months Ended February 28, 2006 | Year Ended August 31, 2005 (a) | ||||||||||||||||||
| Shares | Dollars ($) | Shares | Dollars ($) | ||||||||||||||||
| Class A | |||||||||||||||||||
| Subscriptions | 894,942 | 14,919,889 | 279,759 | 4,113,764 | |||||||||||||||
| Proceeds received in connection with merger | 11,502,364 | 184,602,426 | 2,958,672 | 45,540,845 | |||||||||||||||
| Distributions reinvested | 241,749 | 4,066,220 | 376 | 5,548 | |||||||||||||||
| Redemptions | (1,902,830 | ) | (31,573,236 | ) | (565,273 | ) | (8,373,600 | ) | |||||||||||
| Net increase | 10,736,225 | 172,015,299 | 2,673,534 | 41,286,557 | |||||||||||||||
| Class B | |||||||||||||||||||
| Subscriptions | 77,659 | 1,279,577 | 189,308 | 2,728,980 | |||||||||||||||
| Proceeds received in connection with merger | 3,265,239 | 51,112,688 | 63,132 | 950,545 | |||||||||||||||
| Distributions reinvested | 33,513 | 552,961 | — | — | |||||||||||||||
| Redemptions | (989,154 | ) | (16,164,525 | ) | (267,694 | ) | (3,839,600 | ) | |||||||||||
| Net increase (decrease) | 2,387,257 | 36,780,701 | (15,254 | ) | (160,075 | ) | |||||||||||||
| Class C | |||||||||||||||||||
| Subscriptions | 40,240 | 667,890 | 26,606 | 389,968 | |||||||||||||||
| Proceeds received in connection with merger | 1,684,650 | 26,472,752 | 6,046 | 91,380 | |||||||||||||||
| Distributions reinvested | 14,227 | 235,742 | — | — | |||||||||||||||
| Redemptions | (177,651 | ) | (2,924,860 | ) | (23,189 | ) | (336,954 | ) | |||||||||||
| Net increase | 1,561,466 | 24,451,524 | 9,463 | 144,394 | |||||||||||||||
| Class D | |||||||||||||||||||
| Subscriptions | 1,439 | 23,282 | 3,721 | 53,487 | |||||||||||||||
| Distributions reinvested | 504 | 8,373 | — | — | |||||||||||||||
| Redemptions | (3,160 | ) | (52,896 | ) | (13,060 | ) | (187,460 | ) | |||||||||||
| Net decrease | (1,217 | ) | (21,241 | ) | (9,339 | ) | (133,973 | ) | |||||||||||
| Class G | |||||||||||||||||||
| Subscriptions | 1,258 | 21,020 | 1,434 | 20,898 | |||||||||||||||
| Proceeds received in connection with merger | — | — | 317,111 | 4,776,315 | |||||||||||||||
| Distributions reinvested | 2,531 | 41,730 | — | — | |||||||||||||||
| Redemptions | (75,856 | ) | (1,245,260 | ) | (57,345 | ) | (839,582 | ) | |||||||||||
| Net increase (decrease) | (72,067 | ) | (1,182,510 | ) | 261,200 | 3,957,631 | |||||||||||||
| Class R | |||||||||||||||||||
| Subscriptions | — | — | — | — | |||||||||||||||
| Net increase | — | — | — | — | |||||||||||||||
| Class T | |||||||||||||||||||
| Subscriptions | — | — | — | — | |||||||||||||||
| Distributions reinvested | — | — | — | — | |||||||||||||||
| Redemptions | — | — | — | — | |||||||||||||||
| Net decrease | — | — | — | — | |||||||||||||||
| Class Z | |||||||||||||||||||
| Subscriptions | 1,803,432 | 30,360,463 | 11,577,399 | 169,031,615 | |||||||||||||||
| Proceeds received in connection with merger | 1,164,515 | 18,806,658 | 27,533,402 | 425,784,235 | |||||||||||||||
| Distributions reinvested | 345,288 | 5,838,832 | 61,891 | 916,609 | |||||||||||||||
| Redemptions | (6,553,869 | ) | (110,678,292 | ) | (20,776,995 | ) | (307,927,136 | ) | |||||||||||
| Net increase (decrease) | (3,240,634 | ) | (55,672,339 | ) | 18,395,697 | 287,805,323 | |||||||||||||
(a) Class G shares were initially offered on March 18, 2005.
(b) Class R shares were initially offered on January 23, 2006.
See Accompanying Notes to Financial Statements.
90
Columbia Funds
| Mid Cap Growth Fund | |||||||||||||||||||
| (Unaudited) Six Months Ended February 28, 2006 (b) | Year Ended August 31, 2005 | ||||||||||||||||||
| Shares | Dollars ($) | Shares | Dollars ($) | ||||||||||||||||
| Class A | |||||||||||||||||||
| Subscriptions | 189,745 | 4,518,891 | 132,045 | 2,663,508 | |||||||||||||||
| Proceeds received in connection with merger | — | — | — | — | |||||||||||||||
| Distributions reinvested | 4,318 | 102,596 | — | — | |||||||||||||||
| Redemptions | (35,376 | ) | (831,739 | ) | (118,711 | ) | (2,353,815 | ) | |||||||||||
| Net increase | 158,687 | 3,789,748 | 13,334 | 309,693 | |||||||||||||||
| Class B | |||||||||||||||||||
| Subscriptions | 62,126 | 1,450,520 | 61,503 | 1,216,834 | |||||||||||||||
| Proceeds received in connection with merger | — | — | — | — | |||||||||||||||
| Distributions reinvested | 3,617 | 83,953 | — | — | |||||||||||||||
| Redemptions | (35,709 | ) | (814,001 | ) | (70,619 | ) | (1,352,521 | ) | |||||||||||
| Net increase (decrease) | 30,034 | 720,472 | (9,116 | ) | (135,687 | ) | |||||||||||||
| Class C | |||||||||||||||||||
| Subscriptions | 41,698 | 964,086 | 15,372 | 305,772 | |||||||||||||||
| Proceeds received in connection with merger | — | — | — | — | |||||||||||||||
| Distributions reinvested | 380 | 8,826 | — | — | |||||||||||||||
| Redemptions | (14,503 | ) | (342,841 | ) | (14,200 | ) | (278,993 | ) | |||||||||||
| Net increase | 27,575 | 630,071 | 1,172 | 26,779 | |||||||||||||||
| Class D | |||||||||||||||||||
| Subscriptions | 189 | 4,115 | 776 | 14,660 | |||||||||||||||
| Distributions reinvested | 226 | 5,257 | — | — | |||||||||||||||
| Redemptions | (3,308 | ) | (76,532 | ) | (16,346 | ) | (318,047 | ) | |||||||||||
| Net decrease | (2,893 | ) | (67,160 | ) | (15,570 | ) | (303,387 | ) | |||||||||||
| Class G | |||||||||||||||||||
| Subscriptions | 852 | 19,855 | 802 | 15,464 | |||||||||||||||
| Proceeds received in connection with merger | — | — | — | — | |||||||||||||||
| Distributions reinvested | 435 | 10,076 | — | — | |||||||||||||||
| Redemptions | (3,997 | ) | (94,017 | ) | (6,064 | ) | (116,633 | ) | |||||||||||
| Net increase (decrease) | (2,710 | ) | (64,086 | ) | (5,262 | ) | (101,169 | ) | |||||||||||
| Class R | |||||||||||||||||||
| Subscriptions | 403 | 10,000 | — | — | |||||||||||||||
| Net increase | 403 | 10,000 | — | — | |||||||||||||||
| Class T | |||||||||||||||||||
| Subscriptions | 10,148 | 240,223 | 15,597 | 312,764 | |||||||||||||||
| Distributions reinvested | 15,447 | 367,640 | — | — | |||||||||||||||
| Redemptions | (91,812 | ) | (2,164,236 | ) | (237,908 | ) | (4,717,219 | ) | |||||||||||
| Net decrease | (66,217 | ) | (1,556,373 | ) | (222,311 | ) | (4,404,455 | ) | |||||||||||
| Class Z | |||||||||||||||||||
| Subscriptions | 2,038,304 | 49,722,471 | 3,792,797 | 75,115,004 | |||||||||||||||
| Proceeds received in connection with merger | — | — | — | — | |||||||||||||||
| Distributions reinvested | 356,875 | 8,582,854 | — | — | |||||||||||||||
| Redemptions | (3,661,582 | ) | (86,878,470 | ) | (16,316,370 | ) | (324,065,280 | ) | |||||||||||
| Net increase (decrease) | (1,266,403 | ) | (28,573,145 | ) | (12,523,573 | ) | (248,950,276 | ) | |||||||||||
See Accompanying Notes to Financial Statements.
91
STATEMENTS OF CHANGES IN NET ASSETS – CAPITAL STOCK ACTIVITY
Columbia Funds
| Small Cap Growth Fund I | |||||||||||||||||||
| (Unaudited) Six Months Ended February 28, 2006 (c) | Year Ended August 31, 2005 | ||||||||||||||||||
| Shares | Dollars ($) | Shares | Dollars ($) | ||||||||||||||||
| Class A | |||||||||||||||||||
| Subscriptions | 14,874 | 448,713 | — | — | |||||||||||||||
| Distributions reinvested | 33 | 955 | — | — | |||||||||||||||
| Redemptions | (381 | ) | (11,928 | ) | — | — | |||||||||||||
| Net increase (decrease) | 14,526 | 437,740 | — | — | |||||||||||||||
| Class B | |||||||||||||||||||
| Subscriptions | 5,129 | 153,664 | — | — | |||||||||||||||
| Distributions reinvested | 46 | 1,289 | — | — | |||||||||||||||
| Redemptions | (385 | ) | (12,021 | ) | — | — | |||||||||||||
| Net increase (decrease) | 4,790 | 142,932 | — | — | |||||||||||||||
| Class C | |||||||||||||||||||
| Subscriptions | 2,464 | 71,204 | — | — | |||||||||||||||
| Distributions reinvested | 11 | 328 | — | — | |||||||||||||||
| Redemptions | — | — | — | — | |||||||||||||||
| Net increase | 2,475 | 71,532 | — | — | |||||||||||||||
| Class D | |||||||||||||||||||
| Subscriptions | — | — | — | — | |||||||||||||||
| Distributions reinvested | — | — | — | — | |||||||||||||||
| Redemptions | — | — | — | — | |||||||||||||||
| Net decrease | — | — | — | — | |||||||||||||||
| Class Z | |||||||||||||||||||
| Subscriptions | 1,090,684 | 32,755,842 | 1,826,694 | 44,583,055 | |||||||||||||||
| Distributions reinvested | 223,906 | 6,341,015 | — | — | |||||||||||||||
| Redemptions | (2,476,250 | ) | (71,792,219 | ) | (19,575,324 | ) | (468,308,063 | ) | |||||||||||
| Net decrease | (1,161,660 | ) | (32,695,362 | ) | (17,748,630 | ) | (423,725,008 | ) | |||||||||||
(c) Classes A, B and C shares were initially offered on November 1, 2005.
See Accompanying Notes to Financial Statements.
92
Columbia Funds
| Real Estate Equity Fund | |||||||||||||||||||
| (Unaudited) Six Months Ended February 28, 2006 | Year Ended August 31, 2005 | ||||||||||||||||||
| Shares | Dollars ($) | Shares | Dollars ($) | ||||||||||||||||
| Class A | |||||||||||||||||||
| Subscriptions | 198,146 | 5,279,210 | 837,311 | 22,058,971 | |||||||||||||||
| Distributions reinvested | 215,657 | 5,386,645 | 163,062 | 4,273,318 | |||||||||||||||
| Redemptions | (460,789 | ) | (12,084,341 | ) | (634,655 | ) | (16,663,423 | ) | |||||||||||
| Net increase (decrease) | (46,986 | ) | (1,418,486 | ) | 365,718 | 9,668,866 | |||||||||||||
| Class B | |||||||||||||||||||
| Subscriptions | 22,915 | 613,133 | 167,187 | 4,458,167 | |||||||||||||||
| Distributions reinvested | 56,893 | 1,422,268 | 43,178 | 1,134,109 | |||||||||||||||
| Redemptions | (101,111 | ) | (2,662,140 | ) | (132,394 | ) | (3,513,324 | ) | |||||||||||
| Net increase (decrease) | (21,303 | ) | (626,739 | ) | 77,971 | 2,078,952 | |||||||||||||
| Class C | |||||||||||||||||||
| Subscriptions | 25,809 | 679,258 | 102,777 | 2,696,606 | |||||||||||||||
| Distributions reinvested | 22,048 | 550,568 | 12,459 | 327,172 | |||||||||||||||
| Redemptions | (29,840 | ) | (791,279 | ) | (35,984 | ) | (961,897 | ) | |||||||||||
| Net increase | 18,017 | 438,547 | 79,252 | 2,061,881 | |||||||||||||||
| Class D | |||||||||||||||||||
| Subscriptions | 1,028 | 26,403 | 5,615 | 154,473 | |||||||||||||||
| Distributions reinvested | 17,334 | 433,419 | 14,938 | 392,365 | |||||||||||||||
| Redemptions | (21,891 | ) | (587,324 | ) | (26,025 | ) | (701,268 | ) | |||||||||||
| Net decrease | (3,529 | ) | (127,502 | ) | (5,472 | ) | (154,430 | ) | |||||||||||
| Class Z | |||||||||||||||||||
| Subscriptions | 1,196,539 | 31,531,986 | 5,988,150 | 158,289,129 | |||||||||||||||
| Distributions reinvested | 2,898,653 | 72,404,270 | 3,174,740 | 83,157,572 | |||||||||||||||
| Redemptions | (8,621,276 | ) | (226,169,409 | ) | (16,041,455 | ) | (420,472,305 | ) | |||||||||||
| Net decrease | (4,526,084 | ) | (122,233,153 | ) | (6,878,565 | ) | (179,025,604 | ) | |||||||||||
See Accompanying Notes to Financial Statements.
93
STATEMENTS OF CHANGES IN NET ASSETS – CAPITAL STOCK ACTIVITY
Columbia Funds
| Technology Fund | |||||||||||||||||||
| (Unaudited) Six Months Ended February 28, 2006 | Year Ended August 31, 2005 | ||||||||||||||||||
| Shares | Dollars ($) | Shares | Dollars ($) | ||||||||||||||||
| Class A | |||||||||||||||||||
| Subscriptions | 4,499,285 | 43,845,988 | 1,524,022 | 12,081,354 | |||||||||||||||
| Distributions reinvested | 99,164 | 928,177 | — | — | |||||||||||||||
| Redemptions | (683,548 | ) | (6,494,811 | ) | (281,238 | ) | (2,203,178 | ) | |||||||||||
| Net increase | 3,914,901 | 38,279,354 | 1,242,784 | 9,878,176 | |||||||||||||||
| Class B | |||||||||||||||||||
| Subscriptions | 312,610 | 3,007,375 | 209,759 | 1,613,063 | |||||||||||||||
| Distributions reinvested | 19,481 | 178,643 | — | — | |||||||||||||||
| Redemptions | (62,782 | ) | (558,032 | ) | (181,799 | ) | (1,399,566 | ) | |||||||||||
| Net increase | 269,309 | 2,627,986 | 27,960 | 213,497 | |||||||||||||||
| Class C | |||||||||||||||||||
| Subscriptions | 1,097,536 | 10,690,164 | 199,364 | 1,564,179 | |||||||||||||||
| Distributions reinvested | 15,775 | 144,978 | — | — | |||||||||||||||
| Redemptions | (42,862 | ) | (396,843 | ) | (45,764 | ) | (337,505 | ) | |||||||||||
| Net increase | 1,070,449 | 10,438,299 | 153,600 | 1,226,674 | |||||||||||||||
| Class D | |||||||||||||||||||
| Subscriptions | 80 | 743 | 189 | 1,409 | |||||||||||||||
| Distributions reinvested | 138 | 1,272 | — | — | |||||||||||||||
| Redemptions | (92 | ) | (887 | ) | (929 | ) | (7,079 | ) | |||||||||||
| Net increase (decrease) | 126 | 1,128 | (740 | ) | (5,670 | ) | |||||||||||||
| Class Z | |||||||||||||||||||
| Subscriptions | 3,786,086 | 37,102,645 | 2,763,431 | 21,422,105 | |||||||||||||||
| Distributions reinvested | 349,850 | 3,302,585 | — | — | |||||||||||||||
| Redemptions | (895,643 | ) | (8,644,601 | ) | (2,761,350 | ) | (21,625,013 | ) | |||||||||||
| Net increase (decrease) | 3,240,293 | 31,760,629 | 2,081 | (202,908 | ) | ||||||||||||||
See Accompanying Notes to Financial Statements.
94
Columbia Funds
| Strategic Investor Fund | |||||||||||||||||||
| (Unaudited) Six Months Ended February 28, 2006 | Year Ended August 31, 2005 | ||||||||||||||||||
| Shares | Dollars ($) | Shares | Dollars ($) | ||||||||||||||||
| Class A | |||||||||||||||||||
| Subscriptions | 1,141,357 | 23,857,856 | 3,503,422 | 69,841,011 | |||||||||||||||
| Distributions reinvested | 629,369 | 12,719,556 | 73,076 | 1,460,064 | |||||||||||||||
| Redemptions | (856,951 | ) | (17,965,531 | ) | (1,012,041 | ) | (20,387,801 | ) | |||||||||||
| Net increase | 913,775 | 18,611,881 | 2,564,457 | 50,913,274 | |||||||||||||||
| Class B | |||||||||||||||||||
| Subscriptions | 306,713 | 6,335,684 | 1,402,288 | 27,555,529 | |||||||||||||||
| Distributions reinvested | 169,550 | 3,377,438 | 15,739 | 310,686 | |||||||||||||||
| Redemptions | (208,626 | ) | (4,282,947 | ) | (266,308 | ) | (5,272,198 | ) | |||||||||||
| Net increase | 267,637 | 5,430,175 | 1,151,719 | 22,594,017 | |||||||||||||||
| Class C | |||||||||||||||||||
| Subscriptions | 389,794 | 8,034,664 | 1,185,138 | 23,122,317 | |||||||||||||||
| Distributions reinvested | 136,920 | 2,728,810 | 12,557 | 248,001 | |||||||||||||||
| Redemptions | (181,739 | ) | (3,738,402 | ) | (130,193 | ) | (2,596,010 | ) | |||||||||||
| Net increase | 344,975 | 7,025,072 | 1,067,502 | 20,774,308 | |||||||||||||||
| Class D | |||||||||||||||||||
| Subscriptions | 1,096 | 22,458 | 431 | 8,429 | |||||||||||||||
| Distributions reinvested | 1,587 | 31,620 | 318 | 6,281 | |||||||||||||||
| Redemptions | (5,026 | ) | (102,912 | ) | (13,676 | ) | (270,375 | ) | |||||||||||
| Net increase (decrease) | (2,343 | ) | (48,834 | ) | (12,927 | ) | (255,665 | ) | |||||||||||
| Class Z | |||||||||||||||||||
| Subscriptions | 535,284 | 11,230,232 | 3,419,506 | 68,011,658 | |||||||||||||||
| Distributions reinvested | 858,956 | 17,376,682 | 206,006 | 4,120,033 | |||||||||||||||
| Redemptions | (4,359,431 | ) | (91,164,259 | ) | (5,826,486 | ) | (116,546,677 | ) | |||||||||||
| Net increase (decrease) | (2,965,191 | ) | (62,557,345 | ) | (2,200,974 | ) | (44,414,986 | ) | |||||||||||
See Accompanying Notes to Financial Statements.
95
STATEMENTS OF CHANGES IN NET ASSETS – CAPITAL STOCK ACTIVITY
Columbia Funds
| Balanced Fund | |||||||||||||||||||
| (Unaudited) Six Months Ended February 28, 2006 | Year Ended August 31, 2005 | ||||||||||||||||||
| Shares | Dollars ($) | Shares | Dollars ($) | ||||||||||||||||
| Class A | |||||||||||||||||||
| Subscriptions | 39,374 | 863,210 | 78,005 | 1,630,459 | |||||||||||||||
| Distributions reinvested | 1,340 | 29,241 | 2,421 | 50,125 | |||||||||||||||
| Redemptions | (18,376 | ) | (400,398 | ) | (54,929 | ) | (1,142,204 | ) | |||||||||||
| Net increase | 22,338 | 492,053 | 25,497 | 538,380 | |||||||||||||||
| Class B | |||||||||||||||||||
| Subscriptions | 31,212 | 682,526 | 92,055 | 1,914,875 | |||||||||||||||
| Distributions reinvested | 1,763 | 38,498 | 3,941 | 81,752 | |||||||||||||||
| Redemptions | (54,648 | ) | (1,197,117 | ) | (88,265 | ) | (1,827,580 | ) | |||||||||||
| Net increase (decrease) | (21,673 | ) | (476,093 | ) | 7,731 | 169,047 | |||||||||||||
| Class C | |||||||||||||||||||
| Subscriptions | 12,408 | 273,020 | 21,016 | 432,954 | |||||||||||||||
| Distributions reinvested | 204 | 4,452 | 399 | 8,303 | |||||||||||||||
| Redemptions | (3,807 | ) | (83,317 | ) | (14,395 | ) | (301,955 | ) | |||||||||||
| Net increase (decrease) | 8,805 | 194,155 | 7,020 | 139,302 | |||||||||||||||
| Class D | |||||||||||||||||||
| Subscriptions | 238 | 5,124 | 60 | 1,264 | |||||||||||||||
| Distributions reinvested | 50 | 1,096 | 158 | 3,261 | |||||||||||||||
| Redemptions | (4,280 | ) | (93,521 | ) | (3,702 | ) | (75,016 | ) | |||||||||||
| Net decrease | (3,992 | ) | (87,301 | ) | (3,484 | ) | (70,491 | ) | |||||||||||
| Class Z | |||||||||||||||||||
| Subscriptions | 414,324 | 9,094,589 | 1,751,820 | 36,254,816 | |||||||||||||||
| Distributions reinvested | 135,770 | 2,959,110 | 423,331 | 8,735,210 | |||||||||||||||
| Redemptions | (2,691,492 | ) | (58,946,585 | ) | (12,705,031 | ) | (263,899,189 | ) | |||||||||||
| Net decrease | (2,141,398 | ) | (46,892,886 | ) | (10,529,880 | ) | (218,909,163 | ) | |||||||||||
See Accompanying Notes to Financial Statements.
96
Columbia Funds
| Oregon Intermediate Municipal Bond Fund | |||||||||||||||||||
| (Unaudited) Six Months Ended February 28, 2006 | Year Ended August 31, 2005 | ||||||||||||||||||
| Shares | Dollars ($) | Shares | Dollars ($) | ||||||||||||||||
| Class A | |||||||||||||||||||
| Subscriptions | 77,735 | 954,066 | 65,259 | 807,387 | |||||||||||||||
| Distributions reinvested | 3,243 | 39,829 | 6,390 | 79,331 | |||||||||||||||
| Redemptions | (14,660 | ) | (180,461 | ) | (21,845 | ) | (270,629 | ) | |||||||||||
| Net increase | 66,318 | 813,434 | 49,804 | 616,089 | |||||||||||||||
| Class B | |||||||||||||||||||
| Subscriptions | 1,269 | 15,595 | 7,732 | 96,051 | |||||||||||||||
| Distributions reinvested | 728 | 8,934 | 1,677 | 20,819 | |||||||||||||||
| Redemptions | (9,106 | ) | (111,994 | ) | (6,506 | ) | (80,715 | ) | |||||||||||
| Net increase (decrease) | (7,109 | ) | (87,465 | ) | 2,903 | 36,155 | |||||||||||||
| Class C | |||||||||||||||||||
| Subscriptions | 2,008 | 24,813 | 29,016 | 360,635 | |||||||||||||||
| Distributions reinvested | 627 | 7,696 | 814 | 10,104 | |||||||||||||||
| Redemptions | (5,350 | ) | (66,080 | ) | (3,931 | ) | (48,966 | ) | |||||||||||
| Net increase (decrease) | (2,715 | ) | (33,571 | ) | 25,899 | 321,773 | |||||||||||||
| Class D | |||||||||||||||||||
| Subscriptions | — | — | — | — | |||||||||||||||
| Distributions reinvested | 699 | 8,578 | 1,550 | 19,245 | |||||||||||||||
| Redemptions | (3,200 | ) | (39,337 | ) | (3,669 | ) | (45,705 | ) | |||||||||||
| Net decrease | (2,501 | ) | (30,759 | ) | (2,119 | ) | (26,460 | ) | |||||||||||
| Class Z | |||||||||||||||||||
| Subscriptions | 1,012,417 | 12,452,595 | 2,480,673 | 30,813,256 | |||||||||||||||
| Distributions reinvested | 481,885 | 5,917,534 | 1,089,490 | 13,526,156 | |||||||||||||||
| Redemptions | (2,400,142 | ) | (29,488,895 | ) | (5,480,491 | ) | (68,059,325 | ) | |||||||||||
| Net decrease | (905,840 | ) | (11,118,766 | ) | (1,910,328 | ) | (23,719,913 | ) | |||||||||||
See Accompanying Notes to Financial Statements.
97
STATEMENTS OF CHANGES IN NET ASSETS – CAPITAL STOCK ACTIVITY
Columbia Funds
| Conservative High Yield Fund | |||||||||||||||||||
| (Unaudited) Six Months Ended February 28, 2006 | Year Ended August 31, 2005 | ||||||||||||||||||
| Shares | Dollars ($) | Shares | Dollars ($) | ||||||||||||||||
| Class A | |||||||||||||||||||
| Subscriptions | 2,273,411 | 19,349,231 | 13,423,846 | 117,028,635 | |||||||||||||||
| Distributions reinvested | 826,678 | 7,021,666 | 2,065,131 | 17,948,131 | |||||||||||||||
| Redemptions | (15,144,981 | ) | (128,619,644 | ) | (16,837,776 | ) | (146,110,417 | ) | |||||||||||
| Net decrease | (12,044,892 | ) | (102,248,747 | ) | (1,348,799 | ) | (11,133,651 | ) | |||||||||||
| Class B | |||||||||||||||||||
| Subscriptions | 161,382 | 1,373,830 | 862,559 | 7,531,933 | |||||||||||||||
| Distributions reinvested | 184,250 | 1,565,006 | 389,458 | 3,385,348 | |||||||||||||||
| Redemptions | (1,420,107 | ) | (12,074,737 | ) | (2,653,951 | ) | (23,007,017 | ) | |||||||||||
| Net decrease | (1,074,475 | ) | (9,135,901 | ) | (1,401,934 | ) | (12,089,736 | ) | |||||||||||
| Class C | |||||||||||||||||||
| Subscriptions | 64,330 | 548,328 | 762,137 | 6,674,038 | |||||||||||||||
| Distributions reinvested | 30,365 | 257,908 | 71,725 | 623,538 | |||||||||||||||
| Redemptions | (511,565 | ) | (4,348,774 | ) | (1,060,783 | ) | (9,187,204 | ) | |||||||||||
| Net decrease | (416,870 | ) | (3,542,538 | ) | (226,921 | ) | (1,889,628 | ) | |||||||||||
| Class D | |||||||||||||||||||
| Subscriptions | 19,457 | 165,333 | 146,777 | 1,283,654 | |||||||||||||||
| Distributions reinvested | 105,766 | 898,324 | 265,523 | 2,309,840 | |||||||||||||||
| Redemptions | (1,639,215 | ) | (13,932,450 | ) | (3,590,651 | ) | (31,251,310 | ) | |||||||||||
| Net decrease | (1,513,992 | ) | (12,868,793 | ) | (3,178,351 | ) | (27,657,816 | ) | |||||||||||
| Class Z | |||||||||||||||||||
| Subscriptions | 9,778,775 | 83,070,031 | 32,414,551 | 282,996,586 | |||||||||||||||
| Distributions reinvested | 1,430,233 | 12,148,251 | 3,631,192 | 31,579,944 | |||||||||||||||
| Redemptions | (26,232,882 | ) | (222,864,537 | ) | (47,950,763 | ) | (415,983,291 | ) | |||||||||||
| Net decrease | (15,023,874 | ) | (127,646,255 | ) | (11,905,020 | ) | (101,406,761 | ) | |||||||||||
See Accompanying Notes to Financial Statements.
98
FINANCIAL HIGHLIGHTS
Columbia International Stock Fund
For a fund share outstanding throughout each period
| (Unaudited) Six Months Ended February 28, | Year Ended August 31, | Period Ended August 31, | Period Ended December 31, | ||||||||||||||||||||
| Class A Shares | 2006 | 2005 | 2004 | 2003 (a) | 2002 (b) | ||||||||||||||||||
| Net asset value, beginning of period | $ | 15.76 | $ | 13.04 | $ | 11.34 | $ | 10.05 | $ | 10.04 | |||||||||||||
| Income from investment operations: | |||||||||||||||||||||||
| Net investment income (loss) (c) | (0.02 | ) | 0.25 | 0.01 | 0.04 | (0.02 | ) | ||||||||||||||||
| Net realized and unrealized gain on investments and foreign currency, net of foreign capital gains tax | 2.28 | 2.47 | 1.69 | 1.25 | 0.03 | ||||||||||||||||||
| Total from investment operations | 2.26 | 2.72 | 1.70 | 1.29 | 0.01 | ||||||||||||||||||
| Less distributions: | |||||||||||||||||||||||
| From net investment income | (0.13 | ) | — | (d) | — | — | — | ||||||||||||||||
| From net realized gains | (0.17 | ) | — | — | — | — | |||||||||||||||||
| Total distributions | (0.30 | ) | — | (d) | — | — | — | ||||||||||||||||
| Redemption fees: | |||||||||||||||||||||||
| Redemption fees added to paid-in-capital | — | (c)(d) | — | (c)(d) | — | (c)(d) | — | — | |||||||||||||||
| Net asset value, end of period | $ | 17.72 | $ | 15.76 | $ | 13.04 | $ | 11.34 | $ | 10.05 | |||||||||||||
| Total return (e) | 14.43 | %(f)(g) | 20.89 | %(f) | 14.99 | %(f) | 12.84 | %(g) | 0.10 | %(g) | |||||||||||||
| Ratios/Supplemental data: | |||||||||||||||||||||||
| Net assets, end of period (in thousands) | $ | 270,328 | $ | 71,270 | $ | 24,119 | $ | 21,664 | $ | 20,178 | |||||||||||||
| Ratio of operating expenses to average net assets (h) | 1.18 | %(i) | 1.25 | % | 1.72 | % | 1.90 | %(i) | 1.86 | %(i) | |||||||||||||
| Ratio of interest expense to average net assets | — | %(i)(j) | — | — | — | — | |||||||||||||||||
| Ratio of net expenses to average net assets (h) | 1.18 | %(i) | 1.25 | % | 1.72 | % | 1.90 | %(i) | 1.86 | %(i) | |||||||||||||
| Ratio of net investment income (loss) to average net assets (h) | (0.21 | )%(i) | 1.71 | % | 0.10 | % | 0.61 | %(i) | (0.39 | )%(i) | |||||||||||||
| Waiver | 0.05 | %(i) | 0.09 | % | 0.09 | % | — | — | |||||||||||||||
| Portfolio turnover rate | 60 | %(g) | 66 | % | 90 | % | 43 | %(g) | 96 | % | |||||||||||||
(a) The Fund changed its fiscal year end from December 31 to August 31.
(b) Class A shares were initially offered on November 1, 2002. Per share data and total return reflect activity from that date.
(c) Per share data was calculated using average shares outstanding during the period.
(d) Rounds to less than $0.01 per share.
(e) Total return at net asset value assuming all distributions reinvested and no initial sales charge or contingent deferred sales charge.
(f) Had the Investment Advisor and/or Transfer Agent not waived a portion of expenses, total return would have been reduced.
(g) Not annualized.
(h) The benefits derived from custody credits had an impact of less than 0.01%, except for the six months ended February 28, 2006, which had an impact of 0.01%.
(i) Annualized.
(j) Rounds to less than 0.01%.
See Accompanying Notes to Financial Statements.
99
FINANCIAL HIGHLIGHTS
Columbia International Stock Fund
For a fund share outstanding throughout each period
| (Unaudited) Six Months Ended February 28, | Year Ended August 31, | Period Ended August 31, | Period Ended December 31, | ||||||||||||||||||||
| Class B Shares | 2006 | 2005 | 2004 | 2003 (a) | 2002 (b) | ||||||||||||||||||
| Net asset value, beginning of period | $ | 15.37 | $ | 12.81 | $ | 11.23 | $ | 10.02 | $ | 10.04 | |||||||||||||
| Income from investment operations: | |||||||||||||||||||||||
| Net investment income (loss) (c) | (0.08 | ) | 0.07 | (0.09 | ) | (0.03 | ) | (0.05 | ) | ||||||||||||||
| Net realized and unrealized gain on investments and foreign currency, net of foreign capital gains tax | 2.25 | 2.49 | 1.67 | 1.24 | 0.03 | ||||||||||||||||||
| Total from investment operations | 2.17 | 2.56 | 1.58 | 1.21 | (0.02 | ) | |||||||||||||||||
| Less distributions: | |||||||||||||||||||||||
| From net investment income | (0.01 | ) | — | — | — | — | |||||||||||||||||
| From net realized gains | (0.17 | ) | — | — | — | — | |||||||||||||||||
| Total distributions | (0.18 | ) | — | — | — | — | |||||||||||||||||
| Redemption fees: | |||||||||||||||||||||||
| Redemption fees added to paid-in-capital | — | (c)(d) | — | (c)(d) | — | (c)(d) | — | — | |||||||||||||||
| Net asset value, end of period | $ | 17.36 | $ | 15.37 | $ | 12.81 | $ | 11.23 | $ | 10.02 | |||||||||||||
| Total return (e)(f) | 14.19 | %(g) | 19.98 | % | 14.07 | % | 12.08 | %(g) | (0.20 | )%(g) | |||||||||||||
| Ratios/Supplemental data: | |||||||||||||||||||||||
| Net assets, end of period (in thousands) | $ | 55,026 | $ | 12,026 | $ | 10,221 | $ | 10,316 | $ | 10,920 | |||||||||||||
| Ratio of operating expenses to average net assets (h) | 1.93 | %(i) | 2.01 | % | 2.50 | % | 2.98 | %(i) | 3.64 | %(i) | |||||||||||||
| Ratio of interest expense to average net assets | — | %(i)(j) | — | — | — | — | |||||||||||||||||
| Ratio of net expenses to average net assets (h) | 1.93 | %(i) | 2.01 | % | 2.50 | % | 2.98 | %(i) | 3.64 | %(i) | |||||||||||||
| Ratio of net investment income (loss) to average net assets (h) | (0.96 | )%(i) | 0.47 | % | (0.69 | )% | (0.47 | )%(i) | (2.17 | )%(i) | |||||||||||||
| Waiver | 0.05 | %(i) | 0.10 | % | 0.18 | % | 0.11 | %(i) | 0.11 | %(i) | |||||||||||||
| Portfolio turnover rate | 60 | %(g) | 66 | % | 90 | % | 43 | %(g) | 96 | % | |||||||||||||
(a) The Fund changed its fiscal year end from December 31 to August 31.
(b) Class B shares were initially offered on November 1, 2002. Per share data and total return reflect activity from that date.
(c) Per share data was calculated using average shares outstanding during the period.
(d) Rounds to less than $0.01 per share.
(e) Total return at net asset value assuming no contingent deferred sales charge.
(f) Had the Investment Advisor and/or Transfer Agent not waived a portion of expenses, total return would have been reduced.
(g) Not annualized.
(h) The benefits derived from custody credits had an impact of less than 0.01%, except for the six months ended February 28, 2006, which had an impact of 0.01%.
(i) Annualized.
(j) Rounds to less than 0.01%.
See Accompanying Notes to Financial Statements.
100
FINANCIAL HIGHLIGHTS
Columbia International Stock Fund
For a fund share outstanding throughout each period
| Class C Shares | (Unaudited) Six Months Ended February 28, 2006 | Year Ended August 31, 2005 | Period Ended August 31, 2004 (a) | ||||||||||||
| Net asset value, beginning of period | $ | 15.43 | $ | 12.86 | $ | 12.27 | |||||||||
| Income from investment operations: | |||||||||||||||
| Net investment income (loss) (b) | (0.08 | ) | 0.07 | (0.01 | ) | ||||||||||
| Net realized and unrealized gain on investments and foreign currency, net of foreign capital gains tax | 2.26 | 2.50 | 0.60 | ||||||||||||
| Total from investment operations | 2.18 | 2.57 | 0.59 | ||||||||||||
| Less distributions: | |||||||||||||||
| From net investment income | (0.01 | ) | — | — | |||||||||||
| From net realized gains | (0.17 | ) | — | — | |||||||||||
| Total distributions | (0.18 | ) | — | — | |||||||||||
| Redemption fees: | |||||||||||||||
| Redemption fees added to paid-in-capital (b)(c) | — | — | — | ||||||||||||
| Net asset value, end of period | $ | 17.43 | $ | 15.43 | $ | 12.86 | |||||||||
| Total return (d)(e) | 14.20 | %(f) | 19.98 | % | 4.81 | %(f) | |||||||||
| Ratios/Supplemental data: | |||||||||||||||
| Net assets, end of period (in thousands) | $ | 28,235 | $ | 904 | $ | 632 | |||||||||
| Ratio of operating expenses to average net assets (g) | 1.93 | %(h) | 2.01 | % | 2.11 | %(h) | |||||||||
| Ratio of interest expense to average net assets | — | %(h)(i) | — | — | |||||||||||
| Ratio of net expenses to average net assets (g) | 1.93 | %(h) | 2.01 | % | 2.11 | %(h) | |||||||||
| Ratio of net investment income (loss) to average net assets (g) | (0.99 | )%(h) | 0.46 | % | (0.05 | )%(h) | |||||||||
| Waiver | 0.05 | %(h) | 0.10 | % | 0.35 | %(h) | |||||||||
| Portfolio turnover rate | 60 | %(f) | 66 | % | 90 | % | |||||||||
(a) Class C shares were initially offered on October 13, 2003. Per share data and total return reflect activity from that date.
(b) Per share data was calculated using average shares outstanding during the period.
(c) Rounds to less than $0.01 per share.
(d) Total return at net asset value assuming no contingent deferred sales charge.
(e) Had the Investment Advisor and/or Transfer Agent not waived a portion of expenses, total return would have been reduced.
(f) Not annualized.
(g) The benefits derived from custody credits had an impact of less than 0.01%, except for the six months ended February 28, 2006, which had an impact of 0.01%.
(h) Annualized.
(i) Rounds to less than 0.01%.
See Accompanying Notes to Financial Statements.
101
FINANCIAL HIGHLIGHTS
Columbia International Stock Fund
For a fund share outstanding throughout each period
| (Unaudited) Six Months Ended February 28, | Year Ended August 31, | Period Ended August 31, | Period Ended December 31, | ||||||||||||||||||||
| Class D Shares | 2006 | 2005 | 2004 | 2003 (a) | 2002 (b) | ||||||||||||||||||
| Net asset value, beginning of period | $ | 15.48 | $ | 12.91 | $ | 11.27 | $ | 10.02 | $ | 10.04 | |||||||||||||
| Income from investment operations: | |||||||||||||||||||||||
| Net investment income (loss) (c) | (0.07 | ) | 0.06 | (0.04 | ) | — | (d) | (0.04 | ) | ||||||||||||||
| Net realized and unrealized gain on investments and foreign currency, net of foreign capital gains tax | 2.25 | 2.51 | 1.68 | 1.25 | 0.02 | ||||||||||||||||||
| Total from investment operations | 2.18 | 2.57 | 1.64 | 1.25 | (0.02 | ) | |||||||||||||||||
| Less distributions: | |||||||||||||||||||||||
| From net investment income | (0.01 | ) | — | — | — | — | |||||||||||||||||
| From net realized gains | (0.17 | ) | — | — | — | — | |||||||||||||||||
| Total distributions | (0.18 | ) | — | — | — | — | |||||||||||||||||
| Redemption fees: | |||||||||||||||||||||||
| Redemption fees added to paid-in-capital | — | (c)(d) | — | (c)(d) | — | (c)(d) | — | — | |||||||||||||||
| Net asset value, end of period | $ | 17.48 | $ | 15.48 | $ | 12.91 | $ | 11.27 | $ | 10.02 | |||||||||||||
| Total return (e)(f) | 14.16 | %(g) | 19.91 | % | 14.55 | % | 12.48 | %(g) | (0.20 | )%(g) | |||||||||||||
| Ratios/Supplemental data: | |||||||||||||||||||||||
| Net assets, end of period (in thousands) | $ | 815 | $ | 740 | $ | 738 | $ | 633 | $ | 542 | |||||||||||||
| Ratio of operating expenses to average net assets (h) | 1.93 | %(i) | 2.01 | % | 2.10 | % | 2.49 | %(i) | 3.48 | %(i) | |||||||||||||
| Ratio of interest expense to average net assets | — | %(i)(j) | — | — | — | — | |||||||||||||||||
| Ratio of net expenses to average net assets (h) | 1.93 | %(i) | 2.01 | % | 2.10 | % | 2.49 | %(i) | 3.48 | %(i) | |||||||||||||
| Ratio of net investment income (loss) to average net assets (h) | (0.89 | )%(i) | 0.40 | % | (0.27 | )% | 0.02 | %(i) | (2.01 | )%(i) | |||||||||||||
| Waiver | 0.05 | %(i) | 0.10 | % | 0.57 | % | 0.75 | %(i) | 0.75 | %(i) | |||||||||||||
| Portfolio turnover rate | 60 | %(g) | 66 | % | 90 | % | 43 | %(g) | 96 | % | |||||||||||||
(a) The Fund changed its fiscal year end from December 31 to August 31.
(b) Class D shares were initially offered on November 1, 2002. Per share data and total return reflect activity from that date.
(c) Per share data was calculated using average shares outstanding during the period.
(d) Rounds to less than $0.01 per share.
(e) Total return at net asset value assuming no contingent deferred sales charge.
(f) Had the Investment Advisor and/or Transfer Agent not waived a portion of expenses, total return would have been reduced.
(g) Not annualized.
(h) The benefits derived from custody credits had an impact of less than 0.01%, except for the six months ended February 28, 2006, which had an impact of 0.01%.
(i) Annualized.
(j) Rounds to less than 0.01%.
See Accompanying Notes to Financial Statements.
102
FINANCIAL HIGHLIGHTS
Columbia International Stock Fund
For a fund share outstanding throughout each period
| Class G Shares | (Unaudited) Six Months Ended February 28, 2006 | Period Ended August 31, 2005 (a) | |||||||||
| Net asset value, beginning of period | $ | 15.37 | $ | 15.06 | |||||||
| Income from investment operations: | |||||||||||
| Net investment income (loss) (b) | (0.07 | ) | 0.12 | ||||||||
| Net realized and unrealized gain on investments and foreign currency, net of foreign capital gains tax | 2.24 | 0.19 | |||||||||
| Total from investment operations | 2.17 | 0.31 | |||||||||
| Less distributions: | |||||||||||
| From net investment income | (0.02 | ) | — | ||||||||
| From net realized gains | (0.17 | ) | — | ||||||||
| Total distributions | (0.19 | ) | — | ||||||||
| Redemption fees: | |||||||||||
| Redemption fees added to paid-in-capital (b)(c) | — | — | |||||||||
| Net asset value, end of period | $ | 17.35 | $ | 15.37 | |||||||
| Total return (d)(e)(f) | 14.18 | % | 2.06 | % | |||||||
| Ratios/Supplemental data: | |||||||||||
| Net assets, end of period (in thousands) | $ | 3,282 | $ | 4,015 | |||||||
| Ratio of operating expenses to average net assets (g)(h) | 1.88 | % | 1.93 | % | |||||||
| Ratio of interest expense to average net assets (h) | — | %(i) | — | ||||||||
| Ratio of net expenses to average net assets (g)(h) | 1.88 | % | 1.93 | % | |||||||
| Ratio of net investment income (loss) to average net assets (g)(h) | (0.83 | )% | 0.81 | % | |||||||
| Waiver (h) | 0.05 | % | 0.08 | % | |||||||
| Portfolio turnover rate | 60 | % | 66 | % | |||||||
(a) Class G shares were initially offered on March 18, 2005. Per share data and total return reflect activity from that date.
(b) Per share data was calculated using average shares outstanding during the period.
(c) Rounds to less than $0.01 per share.
(d) Total return at net asset value assuming no contingent deferred sales charge.
(e) Had the Investment Advisor and/or Transfer Agent not waived a portion of expenses, total return would have been reduced.
(f) Not annualized.
(g) The benefits derived from custody credits had an impact of less than 0.01%, except for the six months ended February 28, 2006, which had an impact of 0.01%.
(h) Annualized.
(i) Rounds to less than 0.01%.
See Accompanying Notes to Financial Statements.
103
FINANCIAL HIGHLIGHTS
Columbia International Stock Fund
For a fund share outstanding throughout each period
| (Unaudited) Six Months Ended February 28, | Year Ended August 31, | Period Ended August 31, | Year Ended August 31, | ||||||||||||||||||||||||||||
| Class Z Shares | 2006 | 2005 | 2004 | 2003 (a) | 2002 (b) | 2001 | 2000 | ||||||||||||||||||||||||
| Net asset value, beginning of period | $ | 15.85 | $ | 13.14 | $ | 11.40 | $ | 10.05 | $ | 12.03 | $ | 14.77 | $ | 22.81 | |||||||||||||||||
| Income from investment operations: | |||||||||||||||||||||||||||||||
| Net investment income (loss) | 0.01 | (c) | 0.25 | (c) | 0.11 | (c) | 0.07 | (c) | — | (c)(d) | 0.01 | (0.04 | ) | ||||||||||||||||||
| Net realized and unrealized gain (loss) on investments and foreign currency, net of foreign capital gains tax | 2.30 | 2.53 | 1.67 | 1.27 | (1.94 | ) | (2.74 | ) | (5.17 | ) | |||||||||||||||||||||
| Total from investment operations | 2.31 | 2.78 | 1.78 | 1.34 | (1.94 | ) | (2.73 | ) | (5.21 | ) | |||||||||||||||||||||
| Less distributions: | |||||||||||||||||||||||||||||||
| From net investment income | (0.17 | ) | (0.07 | ) | (0.04 | ) | — | (0.01 | ) | (0.01 | ) | — | |||||||||||||||||||
| From net realized gains | (0.17 | ) | — | — | — | — | — | (2.83 | ) | ||||||||||||||||||||||
| Return of capital | — | — | — | — | (0.03 | ) | — | — | |||||||||||||||||||||||
| Total distributions | (0.34 | ) | (0.07 | ) | (0.04 | ) | — | (0.04 | ) | (0.01 | ) | (2.83 | ) | ||||||||||||||||||
| Redemption fees: | |||||||||||||||||||||||||||||||
| Redemption fees added to paid-in-capital | — | (c)(d) | — | (c)(d) | — | (c)(d) | 0.01 | (c) | — | — | — | ||||||||||||||||||||
| Net asset value, end of period | $ | 17.82 | $ | 15.85 | $ | 13.14 | $ | 11.40 | $ | 10.05 | $ | 12.03 | $ | 14.77 | |||||||||||||||||
| Total return (e) | 14.66 | %(f)(g) | 21.20 | %(f) | 15.65 | %(f) | 13.43 | %(f)(g) | (16.10 | )%(f) | (18.47 | )% | (22.64 | )% | |||||||||||||||||
| Ratios/Supplemental data: | |||||||||||||||||||||||||||||||
| Net assets, end of period (in thousands) | $ | 1,027,141 | $ | 964,495 | $ | 558,082 | $ | 248,718 | $ | 143,332 | $ | 135,626 | $ | 175,316 | |||||||||||||||||
| Ratio of operating expenses to average net assets (h) | 0.93 | %(i) | 1.00 | % | 1.10 | % | 1.47 | %(i) | 1.49 | % | 1.56 | % | 1.42 | % | |||||||||||||||||
| Ratio of interest expense to average net assets | — | %(i)(j) | — | — | — | — | — | — | |||||||||||||||||||||||
| Ratio of net expenses to average net assets (h) | 0.93 | %(i) | 1.00 | % | 1.10 | % | 1.47 | %(i) | 1.49 | % | 1.56 | % | 1.42 | % | |||||||||||||||||
| Ratio of net investment income (loss) to average net assets (h) | 0.11 | %(i) | 1.71 | % | 0.81 | % | 1.03 | %(i) | (0.02 | )% | 0.06 | % | (0.19 | )% | |||||||||||||||||
| Waiver | 0.05 | %(i) | 0.10 | % | 0.18 | % | 0.12 | %(i) | 0.12 | % | — | — | |||||||||||||||||||
| Portfolio turnover rate | 60 | %(g) | 66 | % | 90 | % | 43 | %(g) | 96 | % | 130 | % | 112 | % | |||||||||||||||||
(a) The Fund changed its fiscal year end from December 31 to August 31.
(b) On November 1, 2002, the existing Fund shares were renamed Class Z shares.
(c) Per share data was calculated using average shares outstanding during the period.
(d) Rounds to less than $0.01 per share.
(e) Total return at net asset value assuming all distributions reinvested.
(f) Had the Investment Advisor and/or Transfer Agent not waived a portion of expenses, total return would have been reduced.
(g) Not annualized.
(h) The benefits derived from custody credits had an impact of less than 0.01%, except for the six months ended February 28, 2006, which had an impact of 0.01%.
(i) Annualized.
(j) Rounds to less than 0.01%.
See Accompanying Notes to Financial Statements.
104
FINANCIAL HIGHLIGHTS
Columbia Mid Cap Growth Fund
For a fund share outstanding throughout each period
| (Unaudited) Six Months Ended February 28, | Year Ended August 31, | Period Ended August 31, | Period Ended December 31, | ||||||||||||||||||||
| Class A Shares | 2006 | 2005 | 2004 | 2003 (a) | 2002 (b) | ||||||||||||||||||
| Net asset value, beginning of period | $ | 22.16 | $ | 16.99 | $ | 18.09 | $ | 14.77 | $ | 15.15 | |||||||||||||
| Income from investment operations: | |||||||||||||||||||||||
| Net investment loss (c) | (0.06 | ) | (0.15 | ) | (0.23 | ) | (0.14 | ) | (0.02 | ) | |||||||||||||
| Net realized and unrealized gain (loss) on investments and foreign currency | 3.50 | 5.32 | (0.87 | ) | 3.46 | (0.36 | ) | ||||||||||||||||
| Total from investment operations | 3.44 | 5.17 | (1.10 | ) | 3.32 | (0.38 | ) | ||||||||||||||||
| Less distributions: | |||||||||||||||||||||||
| From net realized gains | (0.31 | ) | — | — | — | — | |||||||||||||||||
| Net asset value, end of period | $ | 25.29 | $ | 22.16 | $ | 16.99 | $ | 18.09 | $ | 14.77 | |||||||||||||
| Total return (d)(e) | 15.61 | %(f) | 30.43 | % | (6.08 | )% | 22.48 | %(f) | (2.51 | )%(f) | |||||||||||||
| Ratios/Supplemental data: | |||||||||||||||||||||||
| Net assets, end of period (in thousands) | $ | 10,949 | $ | 6,078 | $ | 4,432 | $ | 4,525 | $ | 1,180 | |||||||||||||
| Ratio of operating expenses to average net assets (g) | 1.18 | %(h) | 1.23 | % | 1.53 | % | 1.60 | %(h) | 1.49 | %(h) | |||||||||||||
| Ratio of interest expense to average net assets | — | — | %(i) | — | — | — | |||||||||||||||||
| Ratio of net expenses to average net assets (g) | 1.18 | %(h) | 1.23 | % | 1.53 | % | 1.60 | %(h) | 1.49 | %(h) | |||||||||||||
| Ratio of net investment loss to average net assets (g) | (0.48 | )%(h) | (0.76 | )% | (1.21 | )% | (1.31 | )%(h) | (1.22 | )%(h) | |||||||||||||
| Waiver | 0.03 | %(h) | 0.05 | % | 0.02 | % | 0.01 | %(h) | 0.01 | %(h) | |||||||||||||
| Portfolio turnover rate | 20 | %(f) | 104 | % | 139 | % | 78 | %(f) | 88 | % | |||||||||||||
(a) The Fund changed its fiscal year end from December 31 to August 31.
(b) Class A shares were initially offered on November 1, 2002. Per share data and total return reflect activity from that date.
(c) Per share data was calculated using average shares outstanding during the period.
(d) Total return at net asset value assuming no initial sales charge or contingent deferred sales charge.
(e) Had the Investment Advisor and/or Transfer Agent not waived a portion of expenses, total return would have been reduced.
(f) Not annualized.
(g) The benefits derived from custody credits had an impact of less than 0.01%.
(h) Annualized.
(i) Rounds to less than 0.01%.
See Accompanying Notes to Financial Statements.
105
FINANCIAL HIGHLIGHTS
Columbia Mid Cap Growth Fund
For a fund share outstanding throughout each period
| (Unaudited) Six Months Ended February 28, | Year Ended August 31, | Period Ended August 31, | Period Ended December 31, | ||||||||||||||||||||
| Class B Shares | 2006 | 2005 | 2004 | 2003 (a) | 2002 (b) | ||||||||||||||||||
| Net asset value, beginning of period | $ | 21.69 | $ | 16.75 | $ | 17.98 | $ | 14.76 | $ | 15.15 | |||||||||||||
| Income from investment operations: | |||||||||||||||||||||||
| Net investment loss (c) | (0.14 | ) | (0.30 | ) | (0.36 | ) | (0.22 | ) | (0.04 | ) | |||||||||||||
| Net realized and unrealized gain (loss) on investments and foreign currency | 3.42 | 5.24 | (0.87 | ) | 3.44 | (0.35 | ) | ||||||||||||||||
| Total from investment operations | 3.28 | 4.94 | (1.23 | ) | 3.22 | (0.39 | ) | ||||||||||||||||
| Less distributions: | |||||||||||||||||||||||
| From net realized gains | (0.31 | ) | — | — | — | — | |||||||||||||||||
| Net asset value, end of period | $ | 24.66 | $ | 21.69 | $ | 16.75 | $ | 17.98 | $ | 14.76 | |||||||||||||
| Total return (d)(e) | 15.21 | %(f) | 29.49 | % | (6.84 | )% | 21.82 | %(f) | (2.57 | )%(f) | |||||||||||||
| Ratios/Supplemental data: | |||||||||||||||||||||||
| Net assets, end of period (in thousands) | $ | 7,992 | $ | 6,377 | $ | 5,079 | $ | 4,242 | $ | 3,383 | |||||||||||||
| Ratio of operating expenses to average net assets (g) | 1.93 | %(h) | 1.98 | % | 2.29 | % | 2.36 | %(h) | 2.32 | %(h) | |||||||||||||
| Ratio of interest expense to average net assets | — | — | %(i) | — | — | — | |||||||||||||||||
| Ratio of net expenses to average net assets (g) | 1.93 | %(h) | 1.98 | % | 2.29 | % | 2.36 | %(h) | 2.32 | %(h) | |||||||||||||
| Ratio of net investment loss to average net assets (g) | (1.23 | )%(h) | (1.51 | )% | (1.97 | )% | (2.06 | )%(h) | (2.05 | )%(h) | |||||||||||||
| Waiver | 0.03 | %(h) | 0.05 | % | 0.10 | % | 0.12 | %(h) | 0.12 | %(h) | |||||||||||||
| Portfolio turnover rate | 20 | %(f) | 104 | % | 139 | % | 78 | %(f) | 88 | % | |||||||||||||
(a) The Fund changed its fiscal year end from December 31 to August 31.
(b) Class B shares were initially offered on November 1, 2002. Per share data and total return reflect activity from that date.
(c) Per share data was calculated using average shares outstanding during the period.
(d) Total return at net asset value assuming no contingent deferred sales charge.
(e) Had the Investment Advisor and/or Transfer Agent not waived a portion of expenses, total return would have been reduced.
(f) Not annualized.
(g) The benefits derived from custody credits had an impact of less than 0.01%.
(h) Annualized.
(i) Rounds to less than 0.01%.
See Accompanying Notes to Financial Statements.
106
FINANCIAL HIGHLIGHTS
Columbia Mid Cap Growth Fund
For a fund share outstanding throughout each period
| Class C Shares | (Unaudited) Six Months Ended February 28, 2006 | Year Ended August 31, 2005 | Period Ended August 31, 2004 (a) | ||||||||||||
| Net asset value, beginning of period | $ | 21.74 | $ | 16.79 | $ | 17.88 | |||||||||
| Income from investment operations: | |||||||||||||||
| Net investment loss (b) | (0.14 | ) | (0.30 | ) | (0.30 | ) | |||||||||
| Net realized and unrealized gain (loss) on investments and foreign currency | 3.42 | 5.25 | (0.79 | ) | |||||||||||
| Total from investment operations | 3.28 | 4.95 | (1.09 | ) | |||||||||||
| Less distributions: | |||||||||||||||
| From net realized gains | (0.31 | ) | — | — | |||||||||||
| Net asset value, end of period | $ | 24.71 | $ | 21.74 | $ | 16.79 | |||||||||
| Total return (c)(d) | 15.18 | %(e) | 29.48 | % | (6.10 | )%(e) | |||||||||
| Ratios/Supplemental data: | |||||||||||||||
| Net assets, end of period (in thousands) | $ | 1,447 | $ | 674 | $ | 501 | |||||||||
| Ratio of operating expenses to average net assets (f) | 1.93 | %(g) | 1.98 | % | 2.18 | %(g) | |||||||||
| Ratio of interest expense to average net assets | — | — | %(h) | — | |||||||||||
| Ratio of net expenses to average net assets (f) | 1.93 | %(g) | 1.98 | % | 2.18 | %(g) | |||||||||
| Ratio of net investment loss to average net assets (f) | (1.21 | )%(g) | (1.52 | )% | (1.83 | )%(g) | |||||||||
| Waiver | 0.03 | %(g) | 0.05 | % | 0.08 | %(g) | |||||||||
| Portfolio turnover rate | 20 | %(f) | 104 | % | 139 | % | |||||||||
(a) Class C shares were initially offered on October 13, 2003. Per share data and total return reflect activity from that date.
(b) Per share data was calculated using average shares outstanding during the period.
(c) Total return at net asset value assuming no contingent deferred sales charge.
(d) Had the Investment Advisor and/or Transfer Agent not waived a portion of expenses, total return would have been reduced.
(e) Not annualized.
(f) The benefits derived from custody credits had an impact of less than 0.01%.
(g) Annualized.
(h) Rounds to less than 0.01%.
See Accompanying Notes to Financial Statements.
107
FINANCIAL HIGHLIGHTS
Columbia Mid Cap Growth Fund
For a fund share outstanding throughout each period
| (Unaudited) Six Months Ended February 28, | Year Ended August 31, | Period Ended August 31, | Period Ended December 31, | ||||||||||||||||||||
| Class D Shares | 2006 | 2005 | 2004 | 2003 (a) | 2002 (b) | ||||||||||||||||||
| Net asset value, beginning of period | $ | 21.71 | $ | 16.77 | $ | 17.98 | $ | 14.76 | $ | 15.15 | |||||||||||||
| Income from investment operations: | |||||||||||||||||||||||
| Net investment loss (c) | (0.14 | ) | (0.30 | ) | (0.34 | ) | (0.21 | ) | (0.04 | ) | |||||||||||||
| Net realized and unrealized gain (loss) on investments and foreign currency | 3.42 | 5.24 | (0.87 | ) | 3.43 | (0.35 | ) | ||||||||||||||||
| Total from investment operations | 3.28 | 4.94 | (1.21 | ) | 3.22 | (0.39 | ) | ||||||||||||||||
| Less distributions: | |||||||||||||||||||||||
| From net realized gains | (0.31 | ) | — | — | — | — | |||||||||||||||||
| Net asset value, end of period | $ | 24.68 | $ | 21.71 | $ | 16.77 | $ | 17.98 | $ | 14.76 | |||||||||||||
| Total return (d)(e) | 15.20 | %(f) | 29.46 | % | (6.73 | )% | 21.82 | %(f) | (2.57 | )%(f) | |||||||||||||
| Ratios/Supplemental data: | |||||||||||||||||||||||
| Net assets, end of period (in thousands) | $ | 426 | $ | 438 | $ | 599 | $ | 737 | $ | 433 | |||||||||||||
| Ratio of operating expenses to average net assets (g) | 1.93 | %(h) | 1.98 | % | 2.19 | % | 2.27 | %(h) | 2.32 | %(h) | |||||||||||||
| Ratio of interest expense to average net assets | — | — | %(i) | — | — | — | |||||||||||||||||
| Ratio of net expenses to average net assets (g) | 1.93 | %(h) | 1.98 | % | 2.19 | % | 2.27 | %(h) | 2.32 | %(h) | |||||||||||||
| Ratio of net investment loss to average net assets (g) | (1.24 | )%(h) | (1.54 | )% | (1.87 | )% | (1.97 | )%(h) | (2.05 | )%(h) | |||||||||||||
| Waiver | 0.03 | %(h) | 0.05 | % | 0.08 | % | 0.09 | %(h) | 0.09 | %(h) | |||||||||||||
| Portfolio turnover rate | 20 | %(f) | 104 | % | 139 | % | 78 | %(f) | 88 | % | |||||||||||||
(a) The Fund changed its fiscal year end from December 31 to August 31.
(b) Class D shares were initially offered on November 1, 2002. Per share data and total return reflect activity from that date.
(c) Per share data was calculated using average shares outstanding during the period.
(d) Total return at net asset value assuming no contingent deferred sales charge.
(e) Had the Investment Advisor and/or Transfer Agent not waived a portion of expenses, total return would have been reduced.
(f) Not annualized.
(g) The benefits derived from custody credits had an impact of less than 0.01%.
(h) Annualized.
(i) Rounds to less than 0.01%.
See Accompanying Notes to Financial Statements.
108
FINANCIAL HIGHLIGHTS
Columbia Mid Cap Growth Fund
For a fund share outstanding throughout each period
| (Unaudited) Six Months Ended February 28, | Year Ended August 31, | Period Ended August 31, | Period Ended December 31, | ||||||||||||||||||||
| Class G Shares | 2006 | 2005 | 2004 | 2003 (a) | 2002 (b) | ||||||||||||||||||
| Net asset value, beginning of period | $ | 21.63 | $ | 16.70 | $ | 17.98 | $ | 14.77 | $ | 15.15 | |||||||||||||
| Income from investment operations: | |||||||||||||||||||||||
| Net investment loss (c) | (0.13 | ) | (0.29 | ) | (0.41 | ) | (0.23 | ) | (0.04 | ) | |||||||||||||
| Net realized and unrealized gain (loss) on investments and foreign currency | 3.41 | 5.22 | (0.87 | ) | 3.44 | (0.34 | ) | ||||||||||||||||
| Total from investment operations | 3.28 | 4.93 | (1.28 | ) | 3.21 | (0.38 | ) | ||||||||||||||||
| Less distributions: | |||||||||||||||||||||||
| From net realized gains | (0.31 | ) | — | — | — | — | |||||||||||||||||
| Net asset value, end of period | $ | 24.60 | $ | 21.63 | $ | 16.70 | $ | 17.98 | $ | 14.77 | |||||||||||||
| Total return (d) | 15.25 | %(e)(f) | 29.52 | %(e) | (7.12 | )%(e) | 21.73 | %(f) | (2.51 | )%(f) | |||||||||||||
| Ratios/Supplemental data: | |||||||||||||||||||||||
| Net assets, end of period (in thousands) | $ | 756 | $ | 724 | $ | 647 | $ | 806 | $ | 753 | |||||||||||||
| Ratio of operating expenses to average net assets (g) | 1.88 | %(h) | 1.93 | % | 2.57 | % | 2.47 | %(h) | 2.35 | %(h) | |||||||||||||
| Ratio of interest expense to average net assets | — | — | %(i) | — | — | — | |||||||||||||||||
| Ratio of net expenses to average net assets (g) | 1.88 | %(h) | 1.93 | % | 2.57 | % | 2.47 | %(h) | 2.35 | %(h) | |||||||||||||
| Ratio of net investment loss to average net assets (g) | (1.19 | )%(h) | (1.47 | )% | (2.25 | )% | (2.17 | )%(h) | (2.08 | )%(h) | |||||||||||||
| Waiver | 0.03 | %(h) | 0.05 | % | 0.01 | % | — | — | |||||||||||||||
| Portfolio turnover rate | 20 | %(f) | 104 | % | 139 | % | 78 | %(f) | 88 | % | |||||||||||||
(a) The Fund changed its fiscal year end from December 31 to August 31.
(b) Class G shares were initially offered on November 1, 2002. Per share data and total return reflect activity from that date.
(c) Per share data was calculated using average shares outstanding during the period.
(d) Total return at net asset value assuming no contingent deferred sales charge.
(e) Had the Investment Advisor and/or Transfer Agent not waived a portion of expenses, total return would have been reduced.
(f) Not annualized.
(g) The benefits derived from custody credits had an impact of less than 0.01%.
(h) Annualized.
(i) Rounds to less than 0.01%.
See Accompanying Notes to Financial Statements.
109
FINANCIAL HIGHLIGHTS
Columbia Mid Cap Growth Fund
Fund share outstanding throughout the period
| Class R Shares | (Unaudited) Period Ended February 28, 2006 (a) | ||||||
| Net asset value, beginning of period | $ | 24.44 | |||||
| Income from investment operations: | |||||||
| Net investment loss (b) | (0.01 | ) | |||||
| Net realized and unrealized gain on investments and foreign currency | 0.85 | ||||||
| Total from investment operations | 0.84 | ||||||
| Net asset value, end of period | $ | 25.28 | |||||
| Total return (c)(d) | 3.44 | % | |||||
| Ratios/Supplemental data: | |||||||
| Net assets, end of period (in thousands) | $ | 10 | |||||
| Ratio of expenses to average net assets (e)(f) | 1.46 | % | |||||
| Ratio of net investment loss to average net assets (e)(f) | (0.54 | )% | |||||
| Portfolio turnover rate (d) | 20 | % | |||||
(a) Class R shares were initially offered on January 23, 2006. Total return reflects activity from that date.
(b) Per share data was calculated using average shares outstanding during the period.
(c) Total return at net asset value assuming no contingent deferred sales charge.
(d) Not annualized.
(e) The benefits derived from custody credits had an impact of less than 0.01%.
(f) Annualized.
See Accompanying Notes to Financial Statements.
110
FINANCIAL HIGHLIGHTS
Columbia Mid Cap Growth Fund
For a fund share outstanding throughout each period
| (Unaudited) Six Months Ended February 28, | Year Ended August 31, | Period Ended August 31, | Period Ended December 31, | ||||||||||||||||||||
| Class T Shares | 2006 | 2005 | 2004 | 2003 (a) | 2002 (b) | ||||||||||||||||||
| Net asset value, beginning of period | $ | 22.20 | $ | 17.03 | $ | 18.12 | $ | 14.79 | $ | 15.15 | |||||||||||||
| Income from investment operations: | |||||||||||||||||||||||
| Net investment loss (c) | (0.06 | ) | (0.16 | ) | (0.22 | ) | (0.12 | ) | (0.02 | ) | |||||||||||||
| Net realized and unrealized gain (loss) on investments and foreign currency | 3.50 | 5.33 | (0.87 | ) | 3.45 | (0.34 | ) | ||||||||||||||||
| Total from investment operations | 3.44 | 5.17 | (1.09 | ) | 3.33 | (0.36 | ) | ||||||||||||||||
| Less distributions: | |||||||||||||||||||||||
| From net realized gains | (0.31 | ) | — | — | — | — | |||||||||||||||||
| Net asset value, end of period | $ | 25.33 | $ | 22.20 | $ | 17.03 | $ | 18.12 | $ | 14.79 | |||||||||||||
| Total return (d) | 15.59 | %(e)(f) | 30.36 | %(e) | (6.02 | )%(e) | 22.52 | %(f) | (2.38 | )%(f) | |||||||||||||
| Ratios/Supplemental data: | |||||||||||||||||||||||
| Net assets, end of period (in thousands) | $ | 30,237 | $ | 27,969 | $ | 25,236 | $ | 29,920 | $ | 25,966 | |||||||||||||
| Ratio of operating expenses to average net assets (g) | 1.23 | %(h) | 1.28 | % | 1.50 | % | 1.46 | %(h) | 1.45 | %(h) | |||||||||||||
| Ratio of interest expense to average net assets | — | — | %(i) | — | — | — | |||||||||||||||||
| Ratio of net expenses to average net assets (g) | 1.23 | %(h) | 1.28 | % | 1.50 | % | 1.46 | %(h) | 1.45 | %(h) | |||||||||||||
| Ratio of net investment loss to average net assets (g) | (0.54 | )%(h) | (0.82 | )% | (1.19 | )% | (1.16 | )%(h) | (1.18 | )%(h) | |||||||||||||
| Waiver | 0.03 | %(h) | 0.05 | % | 0.01 | % | — | — | |||||||||||||||
| Portfolio turnover rate | 20 | %(f) | 104 | % | 139 | % | 78 | %(f) | 88 | % | |||||||||||||
(a) The Fund changed its fiscal year end from December 31 to August 31.
(b) Class T shares were initially offered on November 1, 2002. Per share data and total return reflect activity from that date.
(c) Per share data was calculated using average shares outstanding during the period.
(d) Total return at net asset value assuming no initial sales charge or contingent deferred sales charge.
(e) Had the Investment Advisor and/or Transfer Agent not waived a portion of expenses, total return would have been reduced.
(f) Not annualized.
(g) The benefits derived from custody credits had an impact of less than 0.01%.
(h) Annualized.
(i) Rounds to less than 0.01%.
See Accompanying Notes to Financial Statements.
111
FINANCIAL HIGHLIGHTS
Columbia Mid Cap Growth Fund
For a fund share outstanding throughout each period
| (Unaudited) Six Months Ended February 28, | Year Ended August 31, | Period Ended August 31, | Year Ended December 31, | ||||||||||||||||||||||||||||
| Class Z Shares | 2006 | 2005 | 2004 | 2003 (a) | 2002 (b) | 2001 | 2000 | ||||||||||||||||||||||||
| Net asset value, beginning of period | $ | 22.41 | $ | 17.14 | $ | 18.17 | $ | 14.79 | $ | 19.60 | $ | 25.99 | $ | 29.93 | |||||||||||||||||
| Income from investment operations: | |||||||||||||||||||||||||||||||
| Net investment loss | (0.03 | )(c) | (0.10 | )(c) | (0.14 | )(c) | (0.08 | )(c) | (0.13 | )(c) | (0.11 | ) | (0.10 | ) | |||||||||||||||||
| Net realized and unrealized gain (loss) on investments and foreign currency | 3.54 | 5.37 | (0.89 | ) | 3.46 | (4.68 | ) | (5.35 | ) | 4.45 | |||||||||||||||||||||
| Total from investment operations | 3.51 | 5.27 | (1.03 | ) | 3.38 | (4.81 | ) | (5.46 | ) | 4.35 | |||||||||||||||||||||
| Less distributions: | |||||||||||||||||||||||||||||||
| From net realized gains | (0.31 | ) | — | — | — | — | (0.93 | ) | (8.29 | ) | |||||||||||||||||||||
| Net asset value, end of period | $ | 25.61 | $ | 22.41 | $ | 17.14 | $ | 18.17 | $ | 14.79 | $ | 19.60 | $ | 25.99 | |||||||||||||||||
| Total return (d) | 15.75 | %(e)(f) | 30.75 | %(e) | (5.67 | )%(e) | 22.85 | %(e)(f) | (24.54 | )%(e) | (20.98 | )% | 13.84 | % | |||||||||||||||||
| Ratios/Supplemental data: | |||||||||||||||||||||||||||||||
| Net assets, end of period (in thousands) | $ | 881,308 | $ | 799,505 | $ | 825,988 | $ | 998,943 | $ | 807,342 | $ | 786,071 | $ | 1,095,525 | |||||||||||||||||
| Ratio of operating expenses to average net assets (g) | 0.93 | %(h) | 0.98 | % | 1.07 | % | 1.09 | %(h) | 1.12 | % | 1.08 | % | 0.99 | % | |||||||||||||||||
| Ratio of interest expense to average net assets | — | — | %(i) | — | — | — | — | — | |||||||||||||||||||||||
| Ratio of net expenses to average net assets (g) | 0.93 | %(h) | 0.98 | % | 1.07 | % | 1.09 | %(h) | 1.12 | % | 1.08 | % | 0.99 | % | |||||||||||||||||
| Ratio of net investment loss to average net assets (g) | (0.24 | )%(h) | (0.52 | )% | (0.75 | )% | (0.80 | )%(h) | (0.85 | )% | (0.49 | )% | (0.38 | )% | |||||||||||||||||
| Waiver | 0.03 | %(h) | 0.05 | % | 0.05 | % | 0.05 | %(h) | 0.05 | % | — | — | |||||||||||||||||||
| Portfolio turnover rate | 20 | %(f) | 104 | % | 139 | % | 78 | %(f) | 88 | % | 186 | % | 169 | % | |||||||||||||||||
(a) The Fund changed its fiscal year end from December 31 to August 31.
(b) On November 1, 2002, the existing Fund shares were renamed Class Z shares.
(c) Per share data was calculated using average shares outstanding during the period.
(d) Total return at net asset value assuming all distributions reinvested.
(e) Had the Investment Advisor and/or Transfer Agent not waived a portion of expenses, total return would have been reduced.
(f) Not annualized.
(g) The benefits derived from custody credits had an impact of less than 0.01%.
(h) Annualized.
(i) Rounds to less than 0.01%.
See Accompanying Notes to Financial Statements.
112
FINANCIAL HIGHLIGHTS
Columbia Small Cap Growth Fund I
For a fund share outstanding throughout the period
| Class A Shares (Unaudited) | Period Ended February 28, 2006 (a) | ||||||
| Net asset value, beginning of period | $ | 27.47 | |||||
| Income from investment operations: | |||||||
| Net investment loss (b) | (0.12 | ) | |||||
| Net realized and unrealized gain (loss) on investments and foreign currency | 5.05 | ||||||
| Total from investment operations | 4.93 | ||||||
| Less distributions: | |||||||
| From net realized gains | (0.89 | ) | |||||
| Net asset value, end of period | $ | 31.51 | |||||
| Total return (c)(d) | 18.31 | % | |||||
| Ratios/Supplemental data: | |||||||
| Net assets, end of period (in thousands) | $ | 458 | |||||
| Ratio of operating expenses to average net assets (e)(f) | 1.40 | % | |||||
| Ratio of interest expense to average net assets (f)(g) | — | % | |||||
| Ratio of net expenses to average net assets (e)(f) | 1.40 | % | |||||
| Ratio of net investment loss to average net assets (e)(f) | (1.24 | )% | |||||
| Portfolio turnover rate (d) | 60 | % | |||||
(a) Class A shares were initially offered November 1, 2005.
(b) Per share data was calculated using average shares outstanding during the period.
(c) Total return at net asset value assuming all distributions reinvested.
(d) Not annualized.
(e) The benefits derived from custody credits had an impact of less than 0.01%.
(f) Annualized.
(g) Rounds to less than 0.01%.
| Class B Shares | (Unaudited) Period Ended February 28, 2006 (a) | ||||||
| Net asset value, beginning of period | $ | 27.47 | |||||
| Income from investment operations: | |||||||
| Net investment loss (b) | (0.20 | ) | |||||
| Net realized and unrealized gain (loss) on investments and foreign currency | 5.08 | ||||||
| Total from investment operations | 4.88 | ||||||
| Less distributions: | |||||||
| From net realized gains | (0.89 | ) | |||||
| Net asset value, end of period | $ | 31.46 | |||||
| Total return (c)(d) | 18.12 | % | |||||
| Ratios/Supplemental data: | |||||||
| Net assets, end of period (in thousands) | $ | 151 | |||||
| Ratio of operating expenses to average net assets (e)(f) | 2.15 | % | |||||
| Ratio of interest expense to average net assets (f)(g) | — | % | |||||
| Ratio of net expenses to average net assets (e)(f) | 2.15 | % | |||||
| Ratio of net investment loss to average net assets (e)(f) | (1.99 | )% | |||||
| Portfolio turnover rate (d) | 60 | % | |||||
(a) Class B shares were initially offered November 1, 2005.
(b) Per share data was calculated using average shares outstanding during the period.
(c) Total return at net asset value assuming no contingent deferred sales charge.
(d) Not annualized.
(e) The benefits derived from custody credits had an impact of less than 0.01%.
(f) Annualized.
(g) Rounds to less than 0.01%.
See Accompanying Notes to Financial Statements.
113
FINANCIAL HIGHLIGHTS
Columbia Small Cap Growth Fund I
For a fund share outstanding throughout the period
| Class C Shares (Unaudited) | Period Ended February 28, 2006 (a) | ||||||
| Net asset value, beginning of period | $ | 27.47 | |||||
| Income from investment operations: | |||||||
| Net investment loss (b) | (0.20 | ) | |||||
| Net realized and unrealized gain on investments and foreign currency | 5.08 | ||||||
| Total from investment operations | 4.88 | ||||||
| Less distributions: | |||||||
| From net realized gains | (0.89 | ) | |||||
| Net asset value, end of period | $ | 31.46 | |||||
| Total return (c)(d) | 18.12 | % | |||||
| Ratios/Supplemental data: | |||||||
| Net assets, end of period (in thousands) | $ | 78 | |||||
| Ratio of operating expenses to average net assets (e)(f) | 2.15 | % | |||||
| Ratio of interest expense to average net assets (f)(g) | — | % | |||||
| Ratio of net expenses to average net assets (e)(f) | 2.15 | % | |||||
| Ratio of net investment loss to average net assets (e)(f) | (1.99 | )% | |||||
| Portfolio turnover rate (d) | 60 | % | |||||
(a) Class C shares were initially offered November 1, 2005.
(b) Per share data was calculated using average shares outstanding during the period.
(c) Total return at net asset value assuming no contingent deferred sales charge.
(d) Not annualized.
(e) The benefits derived from custody credits had an impact of less than 0.01%.
(f) Annualized.
(g) Rounds to less than 0.01%.
See Accompanying Notes to Financial Statements.
114
FINANCIAL HIGHLIGHTS
Columbia Small Cap Growth Fund I
For a fund share outstanding throughout each period
| (Unaudited) Six Months Ended February 28, | Year Ended August 31, | Period Ended August 31, | Year Ended December 31, | ||||||||||||||||||||||||||||
| Class Z Shares | 2006 | 2005 | 2004 | 2003 (a) | 2002 (b) | 2001 | 2000 | ||||||||||||||||||||||||
| Net asset value, beginning of period | $ | 27.80 | $ | 21.32 | $ | 21.62 | $ | 16.30 | $ | 22.20 | $ | 25.87 | $ | 27.26 | |||||||||||||||||
| Income from investment operations: | |||||||||||||||||||||||||||||||
| Net investment loss | (0.14 | )(c) | (0.24 | )(c) | (0.24 | )(c) | (0.13 | )(c) | (0.17 | )(c) | (0.13 | ) | (0.10 | ) | |||||||||||||||||
| Net realized and unrealized gain (loss) on investments and foreign currency | 4.77 | 6.72 | (0.06 | ) | 5.45 | (5.73 | ) | (3.54 | ) | 1.75 | |||||||||||||||||||||
| Total from investment operations | 4.63 | 6.48 | (0.30 | ) | 5.32 | (5.90 | ) | (3.67 | ) | 1.65 | |||||||||||||||||||||
| Less distributions: | |||||||||||||||||||||||||||||||
| From net realized gains | (0.89 | ) | — | — | — | — | — | (3.04 | ) | ||||||||||||||||||||||
| Net asset value, end of period | $ | 31.54 | $ | 27.80 | $ | 21.32 | $ | 21.62 | $ | 16.30 | $ | 22.20 | $ | 25.87 | |||||||||||||||||
| Total return (d) | 17.02 | %(e)(f) | 30.39 | %(g) | (1.39 | )% | 32.64 | %(f) | (26.58 | )% | (14.19 | )% | 5.85 | % | |||||||||||||||||
| Ratios/Supplemental data: | |||||||||||||||||||||||||||||||
| Net assets, end of period (in thousands) | $ | 206,873 | $ | 214,659 | $ | 543,016 | $ | 637,616 | $ | 493,031 | $ | 617,966 | $ | 518,970 | |||||||||||||||||
| Ratio of operating expenses to average net assets (h) | 1.13 | %(i) | 1.16 | % | 1.18 | % | 1.28 | %(i) | 1.24 | % | 1.23 | % | 1.22 | % | |||||||||||||||||
| Ratio of interest expense to average net assets | — | %(i)(j) | — | %(j) | — | — | — | — | — | ||||||||||||||||||||||
| Ratio of net expenses to average net assets (h) | 1.13 | %(i) | 1.16 | % | 1.18 | % | 1.28 | %(i) | 1.24 | % | 1.23 | % | 1.22 | % | |||||||||||||||||
| Ratio of net investment loss to average net assets (h) | (0.96 | )%(i) | (0.99 | )% | (1.01 | )% | (1.09 | )%(i) | (0.90 | )% | (0.71 | )% | (0.44 | )% | |||||||||||||||||
| Waiver | — | %(i)(j) | — | — | — | — | — | — | |||||||||||||||||||||||
| Portfolio turnover rate | 60 | %(f) | 114 | % | 118 | % | 79 | %(f) | 109 | % | 129 | % | 145 | % | |||||||||||||||||
(a) The Fund changed its fiscal year end from December 31 to August 31.
(b) On November 1, 2002, the existing Fund shares were renamed Class Z shares.
(c) Per share data was calculated using average shares outstanding during the period.
(d) Total return at net asset value assuming all distributions reinvested.
(e) Had the Transfer Agent not waived a portion of expenses, total return would have been reduced.
(f) Not annualized.
(g) Total return includes a reimbursement of loss experienced by the Fund due to a compliance violation. This reimbursement had an impact of less than 0.01% on the Fund's total return.
(h) The benefits derived from custody credits had an impact of less than 0.01%.
(i) Annualized.
(j) Rounds to less than 0.01%.
See Accompanying Notes to Financial Statements.
115
FINANCIAL HIGHLIGHTS
Columbia Real Estate Equity Fund
For a fund share outstanding throughout each period
| (Unaudited) Six Months Ended February 28, | Year Ended August 31, | Period Ended August 31, | Period Ended December 31, | ||||||||||||||||||||
| Class A Shares | 2006 | 2005 | 2004 | 2003 (a) | 2002 (b) | ||||||||||||||||||
| Net asset value, beginning of period | $ | 27.84 | $ | 25.59 | $ | 21.04 | $ | 17.80 | $ | 17.01 | |||||||||||||
| Income from investment operations: | |||||||||||||||||||||||
| Net investment income (c) | 0.33 | 0.79 | (d) | 0.77 | 0.36 | (e) | 0.26 | ||||||||||||||||
| Net realized and unrealized gain on investments | 2.04 | 4.73 | 4.67 | 3.11 | (e) | 0.78 | |||||||||||||||||
| Total from investment operations | 2.37 | 5.52 | 5.44 | 3.47 | 1.04 | ||||||||||||||||||
| Less distributions: | |||||||||||||||||||||||
| From net investment income | (0.49 | ) | (0.75 | ) | (0.70 | ) | (0.23 | ) | (0.25 | ) | |||||||||||||
| From net realized gains | (3.28 | ) | (2.52 | ) | (0.19 | ) | — | — | |||||||||||||||
| Total distributions | (3.77 | ) | (3.27 | ) | (0.89 | ) | (0.23 | ) | (0.25 | ) | |||||||||||||
| Net asset value, end of period | $ | 26.44 | $ | 27.84 | $ | 25.59 | $ | 21.04 | $ | 17.80 | |||||||||||||
| Total return (f) | 9.51 | %(g) | 22.65 | % | 26.42 | % | 19.62 | %(g) | 6.10 | %(g) | |||||||||||||
| Ratios/Supplemental data: | |||||||||||||||||||||||
| Net assets, end of period (in thousands) | $ | 42,216 | $ | 45,756 | $ | 32,703 | $ | 12,364 | $ | 905 | |||||||||||||
| Ratio of operating expenses to average net assets (h) | 1.17 | %(i) | 1.18 | % | 1.20 | % | 1.55 | %(i) | 1.43 | %(i) | |||||||||||||
| Ratio of interest expense to average net assets | — | %(i)(j) | — | — | — | — | |||||||||||||||||
| Ratio of net expenses to average net assets (h) | 1.17 | %(i) | 1.18 | % | 1.20 | % | 1.55 | %(i) | 1.43 | %(i) | |||||||||||||
| Ratio of net investment income to average net assets (h) | 2.50 | %(i) | 2.98 | % | 3.27 | % | 2.70 | %(e)(i) | 4.81 | %(i) | |||||||||||||
| Waiver | — | %(i)(j) | — | — | — | — | |||||||||||||||||
| Portfolio turnover rate | 5 | %(g) | 10 | % | 28 | % | 33 | %(g) | 53 | % | |||||||||||||
(a) The Fund changed its fiscal year end from December 31 to August 31.
(b) Class A shares were initially offered on November 1, 2002. Per share data and total return reflect activity from that date.
(c) Per share data was calculated using average shares outstanding during the period.
(d) Net investment income per share reflects a special dividend. The effect of this dividend amounted to $0.24 per share.
(e) Effective January 1, 2003, the Fund adopted the policy to reduce cost of investments for financial statement purposes by the distributions received in excess of income from Real Estate Investment Trusts. The effect of this change for the eight months ended August 31, 2003 was to decrease the net investment income per share by $0.05, increase net realized and unrealized gain on investments per share by $0.05 and decrease the ratio of net investment income to average net assets from 3.12% to 2.70%. Per share data and ratios for the period prior to August 31, 2003 have not been restated to reflect this change in policy.
(f) Total return at net asset value assuming all distributions reinvested and no initial sales charge or contingent deferred sales charge.
(g) Not annualized.
(h) The benefits derived from custody credits had an impact of less than 0.01%.
(i) Annualized.
(j) Rounds to less than 0.01%.
See Accompanying Notes to Financial Statements.
116
FINANCIAL HIGHLIGHTS
Columbia Real Estate Equity Fund
For a fund share outstanding throughout each period
| (Unaudited) Six Months Ended February 28, | Year Ended August 31, | Period Ended August 31, | Period Ended December 31, | ||||||||||||||||||||
| Class B Shares | 2006 | 2005 | 2004 | 2003 (a) | 2002 (b) | ||||||||||||||||||
| Net asset value, beginning of period | $ | 27.85 | $ | 25.60 | $ | 21.03 | $ | 17.82 | $ | 17.01 | |||||||||||||
| Income from investment operations: | |||||||||||||||||||||||
| Net investment income (c) | 0.23 | 0.60 | (d) | 0.58 | 0.24 | (e) | 0.22 | ||||||||||||||||
| Net realized and unrealized gain on investments | 2.05 | 4.73 | 4.70 | 3.12 | (e) | 0.81 | |||||||||||||||||
| Total from investment operations | 2.28 | 5.33 | 5.28 | 3.36 | 1.03 | ||||||||||||||||||
| Less distributions: | |||||||||||||||||||||||
| From net investment income | (0.39 | ) | (0.56 | ) | (0.52 | ) | (0.15 | ) | (0.22 | ) | |||||||||||||
| From net realized gains | (3.28 | ) | (2.52 | ) | (0.19 | ) | — | — | |||||||||||||||
| Total distributions | (3.67 | ) | (3.08 | ) | (0.71 | ) | (0.15 | ) | (0.22 | ) | |||||||||||||
| Net asset value, end of period | $ | 26.46 | $ | 27.85 | $ | 25.60 | $ | 21.03 | $ | 17.82 | |||||||||||||
| Total return (f) | 9.12 | %(g) | 21.74 | % | 25.53 | % | 18.97 | %(g) | 6.09 | %(g) | |||||||||||||
| Ratios/Supplemental data: | |||||||||||||||||||||||
| Net assets, end of period (in thousands) | $ | 13,113 | $ | 14,393 | $ | 11,234 | $ | 4,776 | $ | 1,074 | |||||||||||||
| Ratio of operating expenses to average net assets (h) | 1.92 | %(i) | 1.93 | % | 1.98 | % | 2.37 | %(i) | 2.18 | %(i) | |||||||||||||
| Ratio of interest expense to average net assets | — | %(i)(j) | — | — | — | — | |||||||||||||||||
| Ratio of net expenses to average net assets (h) | 1.92 | %(i) | 1.93 | % | 1.98 | % | 2.37 | %(i) | 2.18 | %(i) | |||||||||||||
| Ratio of net investment income to average net assets (h) | 1.74 | %(i) | 2.26 | % | 2.47 | % | 1.86 | %(e)(i) | 4.06 | %(i) | |||||||||||||
| Waiver | — | %(i)(j) | — | — | — | — | |||||||||||||||||
| Portfolio turnover rate | 5 | %(g) | 10 | % | 28 | % | 33 | %(g) | 53 | % | |||||||||||||
(a) The Fund changed its fiscal year end from December 31 to August 31.
(b) Class B shares were initially offered on November 1, 2002. Per share data and total return reflect activity from that date.
(c) Per share data was calculated using average shares outstanding during the period.
(d) Net investment income per share reflects a special dividend. The effect of this dividend amounted to $0.24 per share.
(e) Effective January 1, 2003, the Fund adopted the policy to reduce cost of investments for financial statement purposes by the distributions received in excess of income from Real Estate Investment Trusts. The effect of this change for the eight months ended August 31, 2003 was to decrease the net investment income per share by $0.05, increase net realized and unrealized gain on investments per share by $0.05 and decrease the ratio of net investment income to average net assets from 2.28% to 1.86%. Per share data and ratios for the period prior to August 31, 2003 have not been restated to reflect this change in policy.
(f) Total return at net asset value assuming all distributions reinvested and no contingent deferred sales charge.
(g) Not annualized.
(h) The benefits derived from custody credits had an impact of less than 0.01%.
(i) Annualized.
(j) Rounds to less than 0.01%.
See Accompanying Notes to Financial Statements.
117
FINANCIAL HIGHLIGHTS
Columbia Real Estate Equity Fund
For a fund share outstanding throughout each period
| (Unaudited) Six Months Ended February 28, | Year Ended August 31, | ||||||||||||||
| Class C Shares | 2006 | 2005 | 2004 (a) | ||||||||||||
| Net asset value, beginning of period | $ | 27.83 | $ | 25.58 | $ | 21.99 | |||||||||
| Income from investment operations: | |||||||||||||||
| Net investment income (b) | 0.22 | 0.55 | (c) | 0.41 | |||||||||||
| Net realized and unrealized gain on investments | 2.06 | 4.78 | 3.72 | ||||||||||||
| Total from investment operations | 2.28 | 5.33 | 4.13 | ||||||||||||
| Less distributions: | |||||||||||||||
| From net investment income | (0.39 | ) | (0.56 | ) | (0.35 | ) | |||||||||
| From net realized gains | (3.28 | ) | (2.52 | ) | (0.19 | ) | |||||||||
| Total distributions | (3.67 | ) | (3.08 | ) | (0.54 | ) | |||||||||
| Net asset value, end of period | $ | 26.44 | $ | 27.83 | $ | 25.58 | |||||||||
| Total return (d) | 9.13 | %(e) | 21.75 | % | 18.99 | %(e) | |||||||||
| Ratios/Supplemental data: | |||||||||||||||
| Net assets, end of period (in thousands) | $ | 5,056 | $ | 4,821 | $ | 2,404 | |||||||||
| Ratio of operating expenses to average net assets (f) | 1.92 | %(g) | 1.93 | % | 1.95 | %(g) | |||||||||
| Ratio of interest expense to average net assets | — | %(g)(h) | — | — | |||||||||||
| Ratio of net expenses to average net assets (f) | 1.92 | %(g) | 1.93 | % | 1.95 | %(g) | |||||||||
| Ratio of net investment income to average net assets (f) | 1.71 | %(g) | 2.08 | % | 1.93 | %(g) | |||||||||
| Waiver | — | %(g)(h) | — | — | |||||||||||
| Portfolio turnover rate | 5 | %(e) | 10 | % | 28 | % | |||||||||
(a) Class C shares were initially offered on October 13, 2003. Per share data and total return reflect activity from that date.
(b) Per share data was calculated using average shares outstanding during the period.
(c) Net investment income per share reflects a special dividend. The effect of this dividend amounted to $0.24 per share.
(d) Total return at net asset value assuming all distributions reinvested and no contingent deferred sales charge.
(e) Not annualized.
(f) The benefits derived from custody credits had an impact of less than 0.01%.
(g) Annualized.
(h) Rounds to less than 0.01%.
See Accompanying Notes to Financial Statements.
118
FINANCIAL HIGHLIGHTS
Columbia Real Estate Equity Fund
For a fund share outstanding throughout each period
| (Unaudited) Six Months Ended February 28, | Year Ended August 31, | Period Ended August 31, | Period Ended December 31, | ||||||||||||||||||||
| Class D Shares | 2006 | 2005 | 2004 | 2003 (a) | 2002 (b) | ||||||||||||||||||
| Net asset value, beginning of period | $ | 27.84 | $ | 25.59 | $ | 21.03 | $ | 17.82 | $ | 17.01 | |||||||||||||
| Income from investment operations: | |||||||||||||||||||||||
| Net investment income (c) | 0.23 | 0.60 | (d) | 0.65 | 0.27 | (e) | 0.21 | ||||||||||||||||
| Net realized and unrealized gain on investments | 2.06 | 4.73 | 4.63 | 3.10 | (e) | 0.82 | |||||||||||||||||
| Total from investment operations | 2.29 | 5.33 | 5.28 | 3.37 | 1.03 | ||||||||||||||||||
| Less distributions: | |||||||||||||||||||||||
| From net investment income | (0.39 | ) | (0.56 | ) | (0.53 | ) | (0.16 | ) | (0.22 | ) | |||||||||||||
| From net realized gains | (3.28 | ) | (2.52 | ) | (0.19 | ) | — | — | |||||||||||||||
| Total distributions | (3.67 | ) | (3.08 | ) | (0.72 | ) | (0.16 | ) | (0.22 | ) | |||||||||||||
| Net asset value, end of period | $ | 26.46 | $ | 27.84 | $ | 25.59 | $ | 21.03 | $ | 17.82 | |||||||||||||
| Total return (f) | 9.16 | %(g) | 21.75 | % | 25.55 | % | 18.99 | %(g) | 6.09 | %(g) | |||||||||||||
| Ratios/Supplemental data: | |||||||||||||||||||||||
| Net assets, end of period (in thousands) | $ | 3,957 | $ | 4,263 | $ | 4,059 | $ | 3,466 | $ | 365 | |||||||||||||
| Ratio of operating expenses to average net assets (h) | 1.92 | %(i) | 1.93 | % | 1.96 | % | 2.30 | %(i) | 2.18 | %(i) | |||||||||||||
| Ratio of interest expense to average net assets | — | %(i)(j) | — | — | — | — | |||||||||||||||||
| Ratio of net expenses to average net assets (h) | 1.92 | %(i) | 1.93 | % | 1.96 | % | 2.30 | %(i) | 2.18 | %(i) | |||||||||||||
| Ratio of net investment income to average net assets (h) | 1.73 | %(i) | 2.28 | % | 2.81 | % | 2.02 | %(e)(i) | 4.06 | %(i) | |||||||||||||
| Waiver | — | %(i)(j) | — | — | — | — | |||||||||||||||||
| Portfolio turnover rate | 5 | %(g) | 10 | % | 28 | % | 33 | %(g) | 53 | % | |||||||||||||
(a) The Fund changed its fiscal year end from December 31 to August 31.
(b) Class D shares were initially offered on November 1, 2002. Per share data and total return reflect activity from that date.
(c) Per share data was calculated using average shares outstanding during the period.
(d) Net investment income per share reflects a special dividend. The effect of this dividend amounted to $0.24 per share.
(e) Effective January 1, 2003, the Fund adopted the policy to reduce cost of investments for financial statement purposes by the distributions received in excess of income from Real Estate Investment Trusts. The effect of this change for the eight months ended August 31, 2003 was to decrease the net investment income per share by $0.05, increase net realized and unrealized gain on investments per share by $0.05 and decrease the ratio of net investment income to average net assets from 2.44% to 2.02%. Per share data and ratios for the period prior to August 31, 2003 have not been restated to reflect this change in policy.
(f) Total return at net asset value assuming all distributions reinvested and no contingent deferred sales charge.
(g) Not annualized.
(h) The benefits derived from custody credits had an impact of less than 0.01%.
(i) Annualized.
(j) Rounds to less than 0.01%.
See Accompanying Notes to Financial Statements.
119
FINANCIAL HIGHLIGHTS
Columbia Real Estate Equity Fund
For a fund share outstanding throughout each period
| (Unaudited) Six Months Ended February 28, | Year Ended August 31, | Period Ended August 31, | Year Ended December 31, | ||||||||||||||||||||||||||||
| Class Z Shares | 2006 | 2005 | 2004 | 2003 (a) | 2002 (b) | 2001 | 2000 | ||||||||||||||||||||||||
| Net asset value, beginning of period | $ | 27.86 | $ | 25.60 | $ | 21.06 | $ | 17.81 | $ | 18.04 | $ | 17.89 | $ | 14.57 | |||||||||||||||||
| Income from investment operations: | |||||||||||||||||||||||||||||||
| Net investment income | 0.36 | (c) | 0.90 | (c)(d) | 0.88 | (c) | 0.39 | (c)(e) | 0.82 | (c) | 0.79 | 0.81 | |||||||||||||||||||
| Net realized and unrealized gain (loss) on investments | 2.04 | 4.70 | 4.62 | 3.14 | (e) | (0.25 | ) | 0.15 | 3.32 | ||||||||||||||||||||||
| Total from investment operations | 2.40 | 5.60 | 5.50 | 3.53 | 0.57 | 0.94 | 4.13 | ||||||||||||||||||||||||
| Less distributions: | |||||||||||||||||||||||||||||||
| From net investment income | (0.52 | ) | (0.82 | ) | (0.77 | ) | (0.28 | ) | (0.71 | ) | (0.72 | ) | (0.75 | ) | |||||||||||||||||
| From net realized gains | (3.28 | ) | (2.52 | ) | (0.19 | ) | — | (0.09 | ) | (0.07 | ) | (0.06 | ) | ||||||||||||||||||
| Total distributions | (3.80 | ) | (3.34 | ) | (0.96 | ) | (0.28 | ) | (0.80 | ) | (0.79 | ) | (0.81 | ) | |||||||||||||||||
| Net asset value, end of period | $ | 26.46 | $ | 27.86 | $ | 25.60 | $ | 21.06 | $ | 17.81 | $ | 18.04 | $ | 17.89 | |||||||||||||||||
| Total return (f) | 9.65 | %(g) | 22.99 | % | 26.72 | % | 20.01 | %(g) | 3.12 | % | 5.41 | % | 28.84 | % | |||||||||||||||||
| Ratios/Supplemental data: | |||||||||||||||||||||||||||||||
| Net assets, end of period (in thousands) | $ | 600,403 | $ | 758,147 | $ | 872,924 | $ | 884,747 | $ | 774,646 | $ | 621,590 | $ | 436,764 | |||||||||||||||||
| Ratio of operating expenses to average net assets (h) | 0.92 | %(i) | 0.93 | % | 0.97 | % | 1.08 | %(i) | 0.94 | % | 0.95 | % | 0.96 | % | |||||||||||||||||
| Ratio of interest expense to average net assets | — | %(i)(j) | — | — | — | — | — | — | |||||||||||||||||||||||
| Ratio of net expenses to average net assets (h) | 0.92 | %(i) | 0.93 | % | 0.97 | % | 1.08 | %(i) | 0.94 | % | 0.95 | % | 0.96 | % | |||||||||||||||||
| Ratio of net investment income to average net assets (h) | 2.76 | %(i) | 3.40 | % | 3.78 | % | 3.09 | %(e)(i) | 5.30 | % | 4.65 | % | 5.16 | % | |||||||||||||||||
| Waiver | — | %(i)(j) | — | — | — | — | — | — | |||||||||||||||||||||||
| Portfolio turnover rate | 5 | %(g) | 10 | % | 28 | % | 33 | %(g) | 53 | % | 41 | % | 25 | % | |||||||||||||||||
(a) The Fund changed its fiscal year end from December 31 to August 31.
(b) On November 1, 2002, the existing Fund shares were renamed Class Z shares.
(c) Per share data was calculated using average shares outstanding during the period.
(d) Net investment income per share reflects a special dividend. The effect of this dividend amounted to $0.24 per share.
(e) Effective January 1, 2003, the Fund adopted the policy to reduce cost of investments for financial statement purposes by the distributions received in excess of income from Real Estate Investment Trusts. The effect of this change for the eight months ended August 31, 2003 was to decrease the net investment income per share by $0.05, increase net realized and unrealized gain on investments per share by $0.05 and decrease the ratio of net investment income to average net assets from 3.51% to 3.09%. Per share data and ratios for the period prior to August 31, 2003 have not been restated to reflect this change in policy.
(f) Total return at net asset value assuming all distributions reinvested.
(g) Not annualized.
(h) The benefits derived from custody credits had an impact of less than 0.01%.
(i) Annualized.
(j) Rounds to less than 0.01%.
See Accompanying Notes to Financial Statements.
120
FINANCIAL HIGHLIGHTS
Columbia Technology Fund
For a fund share outstanding throughout each period
| (Unaudited) Six Months Ended February 28, | Year Ended August 31, | Period Ended August 31, | Period Ended December 31, | ||||||||||||||||||||
| Class A Shares | 2006 | 2005 | 2004 | 2003 (a) | 2002 (b) | ||||||||||||||||||
| Net asset value, beginning of period | $ | 8.77 | $ | 6.50 | $ | 5.91 | $ | 3.79 | $ | 3.82 | |||||||||||||
| Income from investment operations: | |||||||||||||||||||||||
| Net investment loss (c) | (0.05 | ) | (0.04 | ) | (0.11 | ) | (0.04 | ) | (0.01 | ) | |||||||||||||
| Net realized and unrealized gain (loss) on investments, futures contracts and written options | 2.17 | 2.31 | 0.70 | 2.16 | (0.02 | ) | |||||||||||||||||
| Total from investment operations | 2.12 | 2.27 | 0.59 | 2.12 | (0.03 | ) | |||||||||||||||||
| Less distributions: | |||||||||||||||||||||||
| From net realized gains | (0.56 | ) | — | — | — | — | |||||||||||||||||
| Net asset value, end of period | $ | 10.33 | $ | 8.77 | $ | 6.50 | $ | 5.91 | $ | 3.79 | |||||||||||||
| Total return (d)(e) | 24.87 | %(f) | 34.92 | % | 9.98 | % | 55.94 | %(f) | (0.79 | )%(f) | |||||||||||||
| Ratios/Supplemental data: | |||||||||||||||||||||||
| Net assets, end of period (in thousands) | $ | 57,751 | $ | 14,696 | $ | 2,818 | $ | 376 | $ | 1 | |||||||||||||
| Ratio of expenses to average net assets (g) | 1.41 | %(h) | 1.85 | % | 1.90 | % | 1.90 | %(h) | 1.76 | %(h) | |||||||||||||
| Ratio of net investment loss to average net assets (g) | (1.01 | )%(h) | (1.47 | )% | (1.51 | )% | (1.35 | )%(h) | (1.35 | )%(h) | |||||||||||||
| Waiver/Reimbursement | 0.01 | %(h) | 0.06 | % | 0.53 | % | 3.06 | %(h) | 1.24 | %(h) | |||||||||||||
| Portfolio turnover rate | 144 | %(f) | 328 | % | 488 | % | 523 | %(f) | 512 | % | |||||||||||||
(a) The Fund changed its fiscal year end from December 31 to August 31.
(b) Class A shares were initially offered on November 1, 2002. Per share data and total return reflect activity from that date.
(c) Per share data was calculated using average shares outstanding during the period.
(d) Total return at net asset value assuming no initial sales charge or contingent deferred sales charge.
(e) Had the Investment Advisor and/or Transfer Agent not reimbursed a portion of expenses, total return would have been reduced.
(f) Not annualized.
(g) The benefits derived from custody credits had an impact of less than 0.01%.
(h) Annualized.
| (Unaudited) Six Months Ended February 28, | Year Ended August 31, | Period Ended August 31, | Period Ended December 31, | ||||||||||||||||||||
| Class B Shares | 2006 | 2005 | 2004 | 2003 (a) | 2002 (b) | ||||||||||||||||||
| Net asset value, beginning of period | $ | 8.57 | $ | 6.40 | $ | 5.86 | $ | 3.78 | $ | 3.82 | |||||||||||||
| Income from investment operations: | |||||||||||||||||||||||
| Net investment loss (c) | (0.08 | ) | (0.17 | ) | (0.16 | ) | (0.07 | ) | (0.01 | ) | |||||||||||||
| Net realized and unrealized gain (loss) on investments, futures contracts and written options | 2.12 | 2.34 | 0.70 | 2.15 | (0.03 | ) | |||||||||||||||||
| Total from investment operations | 2.04 | 2.17 | 0.54 | 2.08 | (0.04 | ) | |||||||||||||||||
| Less distributions: | |||||||||||||||||||||||
| From net realized gains | (0.50 | ) | — | — | — | — | |||||||||||||||||
| Net asset value, end of period | $ | 10.11 | $ | 8.57 | $ | 6.40 | $ | 5.86 | $ | 3.78 | |||||||||||||
| Total return (d)(e) | 24.40 | %(f) | 33.91 | % | 9.22 | % | 55.03 | %(f) | (1.05 | )%(f) | |||||||||||||
| Ratios/Supplemental data: | |||||||||||||||||||||||
| Net assets, end of period (in thousands) | $ | 6,479 | $ | 3,183 | $ | 2,200 | $ | 1,246 | $ | 7 | |||||||||||||
| Ratio of expenses to average net assets (g) | 2.16 | %(h) | 2.60 | % | 2.65 | % | 2.65 | %(h) | 2.51 | %(h) | |||||||||||||
| Ratio of net investment loss to average net assets (g) | (1.77 | )%(h) | (2.29 | )% | (2.30 | )% | (2.11 | )%(h) | (2.10 | )%(h) | |||||||||||||
| Waiver/Reimbursement | 0.01 | %(h) | 0.06 | % | 0.48 | % | 2.40 | %(h) | 1.24 | %(h) | |||||||||||||
| Portfolio turnover rate | 144 | %(f) | 328 | % | 488 | % | 523 | %(f) | 512 | % | |||||||||||||
(a) The Fund changed its fiscal year end from December 31 to August 31.
(b) Class B shares were initially offered on November 1, 2002. Per share data and total return reflect activity from that date.
(c) Per share data was calculated using average shares outstanding during the period.
(d) Total return at net asset value assuming no initial sales charge or contingent deferred sales charge.
(e) Had the Investment Advisor and/or Transfer Agent not reimbursed a portion of expenses, total return would have been reduced.
(f) Not annualized.
(g) The benefits derived from custody credits had an impact of less than 0.01%.
(h) Annualized.
See Accompanying Notes to Financial Statements.
121
FINANCIAL HIGHLIGHTS
Columbia Technology Fund
For a fund share outstanding throughout each period
| (Unaudited) Six Months Ended February 28, | Year Ended August 31, | ||||||||||||||
| Class C Shares | 2006 | 2005 | 2004 (a) | ||||||||||||
| Net asset value, beginning of period | $ | 8.59 | $ | 6.41 | $ | 6.48 | |||||||||
| Income from investment operations: | |||||||||||||||
| Net investment loss (b) | (0.08 | ) | (0.17 | ) | (0.14 | ) | |||||||||
| Net realized and unrealized gain on investments, futures contracts and written options | 2.12 | 2.35 | 0.07 | ||||||||||||
| Total from investment operations | 2.04 | 2.18 | (0.07 | ) | |||||||||||
| Less distributions: | |||||||||||||||
| From net realized gains | (0.50 | ) | — | — | |||||||||||
| Net asset value, end of period | $ | 10.13 | $ | 8.59 | $ | 6.41 | |||||||||
| Total return (c)(d) | 24.35 | %(e) | 34.01 | % | (1.08 | )%(e) | |||||||||
| Ratios/Supplemental data: | |||||||||||||||
| Net assets, end of period (in thousands) | $ | 13,171 | $ | 1,972 | $ | 488 | |||||||||
| Ratio of expenses to average net assets (f) | 2.16 | %(g) | 2.60 | % | 2.65 | %(g) | |||||||||
| Ratio of net investment loss to average net assets (f) | (1.74 | )%(g) | (2.23 | )% | (2.18 | )%(g) | |||||||||
| Waiver/Reimbursement | 0.01 | %(g) | 0.06 | % | 0.68 | %(g) | |||||||||
| Portfolio turnover rate | 144 | %(e) | 328 | % | 488 | % | |||||||||
(a) Class C shares were initially offered on October 13, 2003. Per share data and total return reflect activity from that date.
(b) Per share data was calculated using average shares outstanding during the period.
(c) Total return at net asset value assuming no contingent deferred sales charge.
(d) Had the Investment Advisor and/or Transfer Agent not reimbursed a portion of expenses, total return would have been reduced.
(e) Not annualized.
(f) The benefits derived from custody credits had an impact of less than 0.01%.
(g) Annualized.
| (Unaudited) Six Months Ended February 28, | Year Ended August 31, | Period Ended August 31, | Period Ended December 31, | ||||||||||||||||||||
| Class D Shares | 2006 | 2005 | 2004 | 2003 (a) | 2002 (b) | ||||||||||||||||||
| Net asset value, beginning of period | $ | 8.62 | $ | 6.43 | $ | 5.88 | $ | 3.78 | $ | 3.82 | |||||||||||||
| Income from investment operations: | |||||||||||||||||||||||
| Net investment loss (c) | (0.08 | ) | (0.18 | ) | (0.16 | ) | (0.07 | ) | (0.01 | ) | |||||||||||||
| Net realized and unrealized gain(loss) on investments, futures contracts and written options | 2.13 | 2.37 | 0.71 | 2.17 | (0.03 | ) | |||||||||||||||||
| Total from investment operations | 2.05 | 2.19 | 0.55 | 2.10 | (0.04 | ) | |||||||||||||||||
| Less distributions: | |||||||||||||||||||||||
| From net realized gains | (0.50 | ) | — | — | — | — | |||||||||||||||||
| Net asset value, end of period | $ | 10.17 | $ | 8.62 | $ | 6.43 | $ | 5.88 | $ | 3.78 | |||||||||||||
| Total return (d)(e) | 24.37 | %(f) | 34.06 | % | 9.35 | % | 55.56 | %(f) | (1.05 | )%(f) | |||||||||||||
| Ratios/Supplemental data: | |||||||||||||||||||||||
| Net assets, end of period (in thousands) | $ | 28 | $ | 22 | $ | 21 | $ | 15 | $ | 1 | |||||||||||||
| Ratio of expenses to average net assets (g) | 2.16 | %(h) | 2.60 | % | 2.65 | % | 2.65 | %(h) | 2.51 | %(h) | |||||||||||||
| Ratio of net investment loss to average net assets (g) | (1.78 | )%(h) | (2.30 | )% | (2.31 | )% | (2.13 | )%(h) | (2.10 | )%(h) | |||||||||||||
| Waiver/Reimbursement | 0.01 | %(h) | 0.06 | % | 0.77 | % | 4.00 | %(h) | 1.24 | %(h) | |||||||||||||
| Portfolio turnover rate | 144 | %(f) | 328 | % | 488 | % | 523 | %(f) | 512 | % | |||||||||||||
(a) The Fund changed its fiscal year end from December 31 to August 31.
(b) Class D shares were initially offered on November 1, 2002. Per share data and total return reflect activity from that date.
(c) Per share data was calculated using average shares outstanding during the period.
(d) Total return at net asset value assuming no contingent deferred sales charge.
(e) Had the Investment Advisor and/or Transfer Agent not reimbursed a portion of expenses, total return would have been reduced.
(f) Not annualized.
(g) The benefits derived from custody credits had an impact of less than 0.01%.
(h) Annualized.
See Accompanying Notes to Financial Statements.
122
FINANCIAL HIGHLIGHTS
Columbia Technology Fund
For a fund share outstanding throughout each period
| (Unaudited) Six Months Ended February 28, | Year Ended August 31, | Period Ended August 31, | Year Ended December 31, | Period Ended December 31, | |||||||||||||||||||||||||||
| Class Z Shares | 2006 | 2005 | 2004 | 2003 (a) | 2002 (b) | 2001 | 2000 (c) | ||||||||||||||||||||||||
| Net asset value, beginning of period | $ | 8.86 | $ | 6.55 | $ | 5.93 | $ | 3.79 | $ | 6.13 | $ | 8.63 | $ | 10.00 | |||||||||||||||||
| Income from investment operations: | |||||||||||||||||||||||||||||||
| Net investment income (loss) | (0.04 | )(d) | (0.10 | )(d) | (0.09 | )(d) | (0.04 | )(d) | (0.06 | )(d) | (0.08 | ) | 0.01 | ||||||||||||||||||
| Net realized and unrealized gain (loss) on investments, futures contracts and written options | 2.19 | 2.41 | 0.71 | 2.18 | (2.28 | ) | (2.42 | ) | (1.37 | ) | |||||||||||||||||||||
| Total from investment operations | 2.15 | 2.31 | 0.62 | 2.14 | (2.34 | ) | (2.50 | ) | (1.36 | ) | |||||||||||||||||||||
| Less distributions: | |||||||||||||||||||||||||||||||
| From net investment income | — | — | — | — | — | — | (0.01 | ) | |||||||||||||||||||||||
| From net realized gains | (0.58 | ) | — | — | — | — | — | — | |||||||||||||||||||||||
| Total distributions | (0.58 | ) | — | — | — | — | — | (0.01 | ) | ||||||||||||||||||||||
| Net asset value, end of period | $ | 10.43 | $ | 8.86 | $ | 6.55 | $ | 5.93 | $ | 3.79 | $ | 6.13 | $ | 8.63 | |||||||||||||||||
| Total return (e)(f) | 24.99 | %(g) | 35.27 | % | 10.46 | % | 56.46 | %(g) | (38.17 | )% | (28.97 | )% | (13.78 | )%(g) | |||||||||||||||||
| Ratios/Supplemental data: | |||||||||||||||||||||||||||||||
| Net assets, end of period (in thousands) | $ | 81,993 | $ | 40,947 | $ | 30,268 | $ | 19,663 | $ | 8,055 | $ | 10,385 | $ | 4,327 | |||||||||||||||||
| Ratio of expenses to average net assets (h) | 1.16 | %(i) | 1.60 | % | 1.65 | % | 1.65 | %(i) | 1.65 | % | 1.69 | % | 1.48 | %(i) | |||||||||||||||||
| Ratio of net investment income (loss) to average net assets (h) | (0.77 | )%(i) | (1.29 | )% | (1.30 | )% | (1.19 | )%(i) | (1.24 | )% | (1.26 | )% | 0.99 | %(i) | |||||||||||||||||
| Waiver/Reimbursement | 0.01 | %(i) | 0.06 | % | 0.53 | % | 2.73 | %(i) | 1.33 | % | 1.13 | % | 7.49 | %(i) | |||||||||||||||||
| Portfolio turnover rate | 144 | %(g) | 328 | % | 488 | % | 523 | %(g) | 512 | % | 413 | % | 63 | %(g) | |||||||||||||||||
(a) The Fund changed its fiscal year end from December 31 to August 31.
(b) On November 1, 2002, the existing Fund shares were renamed Class Z shares.
(c) The Fund commenced investment operations on October 27, 2000. Per share data, total return and portfolio turnover rate reflect activity from that date.
(d) Per share data was calculated using average shares outstanding during the period.
(e) Total return at net asset value assuming all distributions reinvested.
(f) Had the Investment Advisor and/or Transfer Agent not reimbursed a portion of expenses, total return would have been reduced.
(g) Not annualized.
(h) The benefits derived from custody credits had an impact of less than 0.01%.
(i) Annualized.
See Accompanying Notes to Financial Statements.
123
FINANCIAL HIGHLIGHTS
Columbia Strategic Investor Fund
For a fund share outstanding throughout each period
| (Unaudited) Six Months Ended February 28, | Year Ended August 31, | Period Ended August 31, | Period Ended December 31, | ||||||||||||||||||||
| Class A Shares | 2006 | 2005 | 2004 | 2003 (a) | 2002 (b) | ||||||||||||||||||
| Net asset value, beginning of period | $ | 21.21 | $ | 18.37 | $ | 15.95 | $ | 13.13 | $ | 12.72 | |||||||||||||
| Income from investment operations: | |||||||||||||||||||||||
| Net investment income (c) | 0.07 | 0.01 | 0.03 | 0.06 | 0.01 | ||||||||||||||||||
| Net realized and unrealized gain on investments and foreign currency | 1.17 | 3.08 | 2.46 | 2.76 | 0.40 | ||||||||||||||||||
| Total from investment operations | 1.24 | 3.09 | 2.49 | 2.82 | 0.41 | ||||||||||||||||||
| Less distributions: | |||||||||||||||||||||||
| From net investment income | (0.14 | ) | (0.03 | ) | (0.07 | ) | — | — | |||||||||||||||
| From net realized gains | (1.52 | ) | (0.22 | ) | — | — | — | ||||||||||||||||
| Total distributions | (1.66 | ) | (0.25 | ) | (0.07 | ) | — | — | |||||||||||||||
| Net asset value, end of period | $ | 20.79 | $ | 21.21 | $ | 18.37 | $ | 15.95 | $ | 13.13 | |||||||||||||
| Total return (d) | 6.06 | %(f)(e) | 16.88 | %(e) | 15.64 | %(e) | 21.48 | %(f) | 3.22 | %(f) | |||||||||||||
| Ratios/Supplemental data: | |||||||||||||||||||||||
| Net assets, end of period (in thousands) | $ | 185,023 | $ | 169,340 | $ | 99,608 | $ | 60,112 | $ | 53,526 | |||||||||||||
| Ratio of expenses to average net assets (g) | 1.21 | %(h) | 1.24 | % | 1.27 | % | 1.30 | %(h) | 1.21 | %(h) | |||||||||||||
| Ratio of net investment income to average net assets (g) | 0.66 | %(h) | 0.64 | % | 0.19 | % | 0.60 | %(h) | 0.64 | %(h) | |||||||||||||
| Waiver | 0.02 | %(h) | 0.03 | % | 0.01 | % | — | — | |||||||||||||||
| Portfolio turnover rate | 31 | %(f) | 80 | % | 106 | % | 68 | %(f) | 188 | % | |||||||||||||
(a) The Fund changed its fiscal year end from December 31 to August 31.
(b) Class A shares were initially offered on November 1, 2002. Per share data and total return reflect activity from that date.
(c) Per share data was calculated using average shares outstanding during the period.
(d) Total return at net asset value assuming all distributions reinvested and no initial sales charge or contingent deferred sales charge.
(e) Had the Investment Advisor and/or Transfer Agent not waived a portion of expenses, total return would have been reduced.
(f) Not annualized.
(g) The benefits derived from custody credits had an impact of less than 0.01%.
(h) Annualized.
| (Unaudited) Six Months Ended February 28, | Year Ended August 31, | Period Ended August 31, | Period Ended December 31, | ||||||||||||||||||||
| Class B Shares | 2006 | 2005 | 2004 | 2003 (a) | 2002 (b) | ||||||||||||||||||
| Net asset value, beginning of period | $ | 20.84 | $ | 18.17 | $ | 15.82 | $ | 13.10 | $ | 12.72 | |||||||||||||
| Income from investment operations: | |||||||||||||||||||||||
| Net investment loss (c) | (0.01 | ) | — | (d) | (0.10 | ) | (0.03 | ) | (0.01 | ) | |||||||||||||
| Net realized and unrealized gain on investments and foreign currency | 1.16 | 2.89 | 2.45 | 2.75 | 0.39 | ||||||||||||||||||
| Total from investment operations | 1.15 | 2.89 | 2.35 | 2.72 | 0.38 | ||||||||||||||||||
| Less distributions: | |||||||||||||||||||||||
| From net realized gains | (1.52 | ) | (0.22 | ) | — | — | — | ||||||||||||||||
| Net asset value, end of period | $ | 20.47 | $ | 20.84 | $ | 18.17 | $ | 15.82 | $ | 13.10 | |||||||||||||
| Total return (e)(f) | 5.71 | %(g) | 15.97 | % | 14.85 | % | 20.76 | %(g) | 2.99 | %(g) | |||||||||||||
| Ratios/Supplemental data: | |||||||||||||||||||||||
| Net assets, end of period (in thousands) | $ | 53,917 | $ | 49,318 | $ | 22,071 | $ | 3,398 | $ | 2,350 | |||||||||||||
| Ratio of expenses to average net assets (h) | 1.96 | %(i) | 1.99 | % | 2.02 | % | 2.22 | %(i) | 2.36 | %(i) | |||||||||||||
| Ratio of net investment loss to average net assets (h) | (0.09 | )%(i) | (0.09 | )% | (0.57 | )% | (0.33 | )%(i) | (0.51 | )%(i) | |||||||||||||
| Waiver | 0.02 | %(i) | 0.03 | % | 0.14 | % | 0.23 | %(i) | 0.23 | %(i) | |||||||||||||
| Portfolio turnover rate | 31 | %(g) | 80 | % | 106 | % | 68 | %(g) | 188 | % | |||||||||||||
(a) The Fund changed its fiscal year end from December 31 to August 31.
(b) Class B shares were initially offered on November 1, 2002. Per share data and total return reflect activity from that date.
(c) Per share data was calculated using average shares outstanding during the period.
(d) Rounds to less than $0.01 per share.
(e) Total return at net asset value assuming all distributions reinvested and no contingent deferred sales charge.
(f) Had the Investment Advisor and/or Transfer Agent not waived a portion of expenses, total return would have been reduced.
(g) Not annualized.
(h) The benefits derived from custody credits had an impact of less than 0.01%.
(i) Annualized.
See Accompanying Notes to Financial Statements.
124
FINANCIAL HIGHLIGHTS
Columbia Strategic Investor Fund
For a fund share outstanding throughout each period
| Class C Shares | (Unaudited) Six Months Ended February 28, 2006 | Year Ended August 31, 2005 | Period Ended August 31, 2004 (a) | ||||||||||||
| Net asset value, beginning of period | $ | 20.85 | $ | 18.18 | $ | 16.42 | |||||||||
| Income from investment operations: | |||||||||||||||
| Net investment loss (b) | (0.01 | ) | — | (c) | (0.09 | ) | |||||||||
| Net realized and unrealized gain on investments and foreign currency | 1.16 | 2.89 | 1.85 | ||||||||||||
| Total from investment operations | 1.15 | 2.89 | 1.76 | ||||||||||||
| Less distributions: | |||||||||||||||
| From net realized gains | (1.52 | ) | (0.22 | ) | — | ||||||||||
| Net asset value, end of period | $ | 20.48 | $ | 20.85 | $ | 18.18 | |||||||||
| Total return (d)(e) | 5.71 | %(f) | 15.96 | % | 10.72 | %(f) | |||||||||
| Ratios/Supplemental data: | |||||||||||||||
| Net assets, end of period (in thousands) | $ | 45,616 | $ | 39,253 | $ | 14,821 | |||||||||
| Ratio of expenses to average net assets (g) | 1.96 | %(h) | 1.99 | % | 2.05 | %(h) | |||||||||
| Ratio of net investment loss to average net assets (g) | (0.08 | )%(h) | (0.09 | )% | (0.57 | )%(h) | |||||||||
| Waiver | 0.02 | %(h) | 0.03 | % | 0.07 | %(h) | |||||||||
| Portfolio turnover rate | 31 | %(f) | 80 | % | 106 | % | |||||||||
(a) Class C shares were initially offered on October 13, 2003. Per share data and total return reflect activity from that date.
(b) Per share data was calculated using average shares outstanding during the period.
(c) Rounds to less than $0.01 per share.
(d) Total return at net asset value assuming all distributions reinvested and no contingent deferred sales charge.
(e) Had the Investment Advisor and/or Transfer Agent not waived a portion of expenses, total return would have been reduced.
(f) Not annualized.
(g) The benefits derived from custody credits had an impact of less than 0.01%.
(h) Annualized.
| (Unaudited) Six Months Ended February 28, | Year Ended August 31, | Period Ended August 31, | Period Ended December 31, | ||||||||||||||||||||
| Class D Shares | 2006 | 2005 | 2004 | 2003 (a) | 2002 (b) | ||||||||||||||||||
| Net asset value, beginning of period | $ | 20.84 | $ | 18.17 | $ | 15.81 | $ | 13.11 | $ | 12.72 | |||||||||||||
| Income from investment operations: | |||||||||||||||||||||||
| Net investment loss (c) | (0.01 | ) | — | (d) | (0.08 | ) | (0.05 | ) | (0.01 | ) | |||||||||||||
| Net realized and unrealized gain on investments and foreign currency | 1.15 | 2.89 | 2.44 | 2.75 | 0.40 | ||||||||||||||||||
| Total from investment operations | 1.14 | 2.89 | 2.36 | 2.70 | 0.39 | ||||||||||||||||||
| Less distributions: | |||||||||||||||||||||||
| From net realized gains | (1.52 | ) | (0.22 | ) | |||||||||||||||||||
| Net asset value, end of period | $ | 20.46 | $ | 20.84 | $ | 18.17 | $ | 15.81 | $ | 13.11 | |||||||||||||
| Total return (e)(f) | 5.66 | %(g) | 15.97 | % | 14.93 | % | 20.59 | %(g) | 3.07 | %(g) | |||||||||||||
| Ratios/Supplemental data: | |||||||||||||||||||||||
| Net assets, end of period (in thousands) | $ | 468 | $ | 525 | $ | 693 | $ | 704 | $ | 355 | |||||||||||||
| Ratio of expenses to average net assets (h) | 1.96 | %(i) | 1.99 | % | 1.94 | % | 2.34 | %(i) | 2.28 | %(i) | |||||||||||||
| Ratio of net investment loss to average net assets (h) | (0.09 | )%(i) | (0.14 | )% | (0.48 | )% | (0.48 | )%(i) | (0.43 | )%(i) | |||||||||||||
| Waiver | 0.02 | %(i) | 0.03 | % | 0.12 | % | 0.15 | %(i) | 0.15 | %(i) | |||||||||||||
| Portfolio turnover rate | 31 | %(g) | 80 | % | 106 | % | 68 | %(g) | 188 | % | |||||||||||||
(a) The Fund changed its fiscal year end from December 31 to August 31.
(b) Class D shares were initially offered on November 1, 2002. Per share data and total return reflect activity from that date.
(c) Per share data was calculated using average shares outstanding during the period.
(d) Rounds to less than $0.01 per share.
(e) Total return at net asset value assuming all distributions reinvested and no contingent deferred sales charge.
(f) Had the Investment Advisor and/or Transfer Agent not waived a portion of expenses, total return would have been reduced.
(g) Not annualized.
(h) The benefits derived from custody credits had an impact of less than 0.01%.
(i) Annualized.
See Accompanying Notes to Financial Statements.
125
FINANCIAL HIGHLIGHTS
Columbia Strategic Investor Fund
For a fund share outstanding throughout each period
| (Unaudited) Six Months Ended February 28, | Year Ended August 31, | Period Ended August 31, | Year Ended December 31, | Period Ended December 31, | |||||||||||||||||||||||||||
| Class Z Shares | 2006 | 2005 | 2004 | 2003 (a) | 2002 (b) | 2001 | 2000 (c) | ||||||||||||||||||||||||
| Net asset value, beginning of period | $ | 21.27 | $ | 18.42 | $ | 15.98 | $ | 13.14 | $ | 14.52 | $ | 11.23 | $ | 10.00 | |||||||||||||||||
| Income from investment operations: | |||||||||||||||||||||||||||||||
| Net investment income | 0.09 | (d) | 0.01 | (d) | 0.08 | (d) | 0.08 | (d) | 0.10 | (d) | 0.05 | 0.02 | |||||||||||||||||||
| Net realized and unrealized gain (loss) on investments and foreign currency | 1.18 | 3.13 | 2.47 | 2.76 | (1.35 | ) | 3.29 | 1.23 | |||||||||||||||||||||||
| Total from investment operations | 1.27 | 3.14 | 2.55 | 2.84 | (1.25 | ) | 3.34 | 1.25 | |||||||||||||||||||||||
| Less distributions: | |||||||||||||||||||||||||||||||
| From net investment income | (0.19 | ) | (0.07 | ) | (0.11 | ) | — | (0.11 | ) | (0.05 | ) | (0.02 | ) | ||||||||||||||||||
| From net realized gains | (1.52 | ) | (0.22 | ) | — | — | (0.02 | ) | — | — | |||||||||||||||||||||
| Total distributions | (1.71 | ) | (0.29 | ) | (0.11 | ) | — | (0.13 | ) | (0.05 | ) | (0.02 | ) | ||||||||||||||||||
| Net asset value, end of period | $ | 20.83 | $ | 21.27 | $ | 18.42 | $ | 15.98 | $ | 13.14 | $ | 14.52 | $ | 11.23 | |||||||||||||||||
| Total return (e) | 6.21 | %(f)(g) | 17.16 | %(f) | 15.98 | %(f) | 21.61 | %(f)(g) | (8.56 | )%(f) | 29.76 | % | 12.25 | %(f)(g) | |||||||||||||||||
| Ratios/Supplemental data: | |||||||||||||||||||||||||||||||
| Net assets, end of period (in thousands) | $ | 200,118 | $ | 267,380 | $ | 272,178 | $ | 227,454 | $ | 209,610 | $ | 139,504 | $ | 9,526 | |||||||||||||||||
| Ratio of expenses to average net assets (h) | 0.96 | %(i) | 0.99 | % | 1.02 | % | 1.08 | %(i) | 1.23 | % | 1.13 | % | 1.34 | %(i) | |||||||||||||||||
| Ratio of net investment income to average net assets (h) | 0.91 | %(i) | 0.86 | % | 0.44 | % | 0.82 | %(i) | 0.62 | % | 0.71 | % | 1.92 | %(i) | |||||||||||||||||
| Waiver | 0.02 | %(i) | 0.03 | % | 0.03 | % | 0.03 | %(i) | 0.03 | % | — | 3.97 | %(i) | ||||||||||||||||||
| Portfolio turnover rate | 31 | %(g) | 80 | % | 106 | % | 68 | %(g) | 188 | % | 278 | % | 64 | %(g) | |||||||||||||||||
(a) The Fund changed its fiscal year end from December 31 to August 31.
(b) On November 1, 2002, the existing Fund shares were renamed Class Z shares.
(c) The Fund commenced investment operations on October 27, 2000. Per share data, total return and portfolio turnover rate reflect activity from that date.
(d) Per share data was calculated using average shares outstanding during the period.
(e) Total return at net asset value assuming all distributions reinvested.
(f) Had the Investment Advisor and/or Transfer Agent not waived a portion of expenses, total return would have been reduced.
(g) Not annualized.
(h) The benefits derived from custody credits had an impact of less than 0.01%.
(i) Annualized.
See Accompanying Notes to Financial Statements.
126
FINANCIAL HIGHLIGHTS
Columbia Balanced Fund
For a fund share outstanding throughout each period
| (Unaudited) Period Ended February 28, | Year Ended August 31, | Period Ended August 31, | Period Ended December 31, | ||||||||||||||||||||
| Class A Shares | 2006 | 2005 | 2004 | 2003 (a) | 2002 (b) | ||||||||||||||||||
| Net asset value, beginning of period | $ | 21.75 | $ | 19.86 | $ | 19.18 | $ | 17.52 | $ | 17.58 | |||||||||||||
| Income from investment operations: | |||||||||||||||||||||||
| Net investment income (c) | 0.18 | 0.02 | (d) | 0.29 | 0.16 | 0.03 | |||||||||||||||||
| Net realized and unrealized gain on investments and futures contracts | 0.63 | 2.28 | 0.67 | 1.64 | — | (e) | |||||||||||||||||
| Total from investment operations | 0.81 | 2.30 | 0.96 | 1.80 | 0.03 | ||||||||||||||||||
| Less distributions: | |||||||||||||||||||||||
| From net investment income | (0.20 | ) | (0.41 | ) | (0.28 | ) | (0.14 | ) | (0.09 | ) | |||||||||||||
| Net asset value, end of period | $ | 22.36 | $ | 21.75 | $ | 19.86 | $ | 19.18 | $ | 17.52 | |||||||||||||
| Total return (f) | 3.76 | %(g)(h) | 11.72 | % | 4.99 | % | 10.35 | %(h) | 0.19 | %(h) | |||||||||||||
| Ratios/Supplemental data: | |||||||||||||||||||||||
| Net assets, end of period (in thousands) | $ | 3,972 | $ | 3,378 | $ | 2,577 | $ | 670 | $ | 146 | |||||||||||||
| Ratio of expenses to average net assets (i) | 0.99 | %(j) | 1.02 | % | 1.02 | % | 1.42 | %(j) | 1.17 | %(j) | |||||||||||||
| Ratio of net investment income to average net assets (i) | 1.62 | %(j) | 1.80 | % | 1.45 | % | 1.32 | %(j) | 2.03 | %(j) | |||||||||||||
| Waiver | 0.01 | %(j) | — | — | — | — | |||||||||||||||||
| Portfolio turnover rate | 25 | %(h) | 63 | % | 158 | % | 110 | %(h) | 98 | % | |||||||||||||
(a) The Fund changed its fiscal year end from December 31 to August 31.
(b) Class A shares were initially offered on November 1, 2002. Per share data and total return reflect activity from that date.
(c) Per share data was calculated using average shares outstanding during the period.
(d) Net investment income per share reflects a special dividend. The effect of this dividend amounted to $0.06 per share.
(e) Rounds to less than $0.01 per share.
(f) Total return at net asset value assuming all distributions reinvested and no initial sales charge or contingent deferred sales charge.
(g) Had the Transfer Agent not waived a portion of expenses, total return would have been reduced.
(h) Not annualized.
(i) The benefits derived from custody credits had an impact of less than 0.01%.
(j) Annualized.
| (Unaudited) Period Ended February 28, | Year Ended August 31, | Period Ended August 31, | Period Ended December 31, | ||||||||||||||||||||
| Class B Shares | 2006 | 2005 | 2004 | 2003 (a) | 2002 (b) | ||||||||||||||||||
| Net asset value, beginning of period | $ | 21.72 | $ | 19.83 | $ | 19.16 | $ | 17.52 | $ | 17.58 | |||||||||||||
| Income from investment operations: | |||||||||||||||||||||||
| Net investment income (c) | 0.09 | 0.01 | (d) | 0.14 | 0.07 | 0.02 | |||||||||||||||||
| Net realized and unrealized gain (loss) on investments and futures contracts | 0.64 | 2.14 | 0.66 | 1.65 | (0.01 | ) | |||||||||||||||||
| Total from investment operations | 0.73 | 2.15 | 0.80 | 1.72 | 0.01 | ||||||||||||||||||
| Less distributions: | |||||||||||||||||||||||
| From net investment income | (0.12 | ) | (0.26 | ) | (0.13 | ) | (0.08 | ) | (0.07 | ) | |||||||||||||
| Net asset value, end of period | $ | 22.33 | $ | 21.72 | $ | 19.83 | $ | 19.16 | $ | 17.52 | |||||||||||||
| Total return (e) | 3.38 | %(f)(g) | 10.91 | % | 4.17 | % | 9.83 | %(g) | 0.06 | %(g) | |||||||||||||
| Ratios/Supplemental data: | |||||||||||||||||||||||
| Net assets, end of period (in thousands) | $ | 7,893 | $ | 8,149 | $ | 7,286 | $ | 3,349 | $ | 608 | |||||||||||||
| Ratio of expenses to average net assets (h) | 1.74 | %(i) | 1.77 | % | 1.77 | % | 2.17 | %(i) | 1.92 | %(i) | |||||||||||||
| Ratio of net investment income to average net assets (h) | 0.86 | %(i) | 1.07 | % | 0.71 | % | 0.59 | %(i) | 1.28 | %(i) | |||||||||||||
| Waiver | 0.01 | %(i) | — | — | — | — | |||||||||||||||||
| Portfolio turnover rate | 25 | %(g) | 63 | % | 158 | % | 110 | %(g) | 98 | % | |||||||||||||
(a) The Fund changed its fiscal year end from December 31 to August 31.
(b) Class B shares were initially offered on November 1, 2002. Per share data and total return reflect activity from that date.
(c) Per share data was calculated using average shares outstanding during the period.
(d) Net investment income per share reflects a special dividend. The effect of this dividend amounted to $0.06 per share.
(e) Total return at net asset value assuming all distributions reinvested and no contingent deferred sales charge.
(f) Had the Transfer Agent not waived a portion of expenses, total return would have been reduced.
(g) Not annualized.
(h) The benefits derived from custody credits had an impact of less than 0.01%.
(i) Annualized.
See Accompanying Notes to Financial Statements.
127
FINANCIAL HIGHLIGHTS
Columbia Balanced Fund
For a fund share outstanding throughout each period
| Class C Shares | (Unaudited) Period Ended February 28, 2006 | Year Ended August 31, 2005 | Period Ended August 31, 2004 (a) | ||||||||||||
| Net asset value, beginning of period | $ | 21.72 | $ | 19.83 | $ | 19.59 | |||||||||
| Income from investment operations: | |||||||||||||||
| Net investment income (b) | 0.09 | 0.01 | (c) | 0.13 | |||||||||||
| Net realized and unrealized gain on investments and futures contracts | 0.64 | 2.14 | 0.23 | ||||||||||||
| Total from investment operations | 0.73 | 2.15 | 0.36 | ||||||||||||
| Less distributions: | |||||||||||||||
| From net investment income | (0.12 | ) | (0.26 | ) | (0.12 | ) | |||||||||
| Net asset value, end of period | $ | 22.33 | $ | 21.72 | $ | 19.83 | |||||||||
| Total return (d) | 3.38 | %(e)(f) | 10.91 | % | 1.82 | %(f) | |||||||||
| Ratios/Supplemental data: | |||||||||||||||
| Net assets, end of period (in thousands) | $ | 1,175 | $ | 952 | $ | 730 | |||||||||
| Ratio of expenses to average net assets (g) | 1.74 | %(h) | 1.77 | % | 1.80 | %(h) | |||||||||
| Ratio of net investment income to average net assets (g) | 0.87 | %(h) | 1.06 | % | 0.72 | %(h) | |||||||||
| Waiver | 0.01 | %(h) | — | — | |||||||||||
| Portfolio turnover rate | 25 | %(f) | 63 | % | 158 | %(f) | |||||||||
(a) Class C shares were initially offered on October 13, 2003. Per share data and total return reflect activity from that date.
(b) Per share data was calculated using average shares outstanding during the period.
(c) Net investment income per share reflects a special dividend. The effect of this dividend amounted to $0.06 per share.
(d) Total return at net asset value assuming all distributions reinvested and no contingent deferred sales charge.
(e) Had the Transfer Agent not waived a portion of expenses, total return would have been reduced.
(f) Not annualized.
(g) The benefits derived from custody credits had an impact of less than 0.01%.
(h) Annualized.
| (Unaudited) Period Ended February 28, | Year Ended August 31, | Period Ended August 31, | Period Ended December 31, | ||||||||||||||||||||
| Class D Shares | 2006 | 2005 | 2004 | 2003 (a) | 2002 (b) | ||||||||||||||||||
| Net asset value, beginning of period | $ | 21.72 | $ | 19.82 | $ | 19.17 | $ | 17.51 | $ | 17.58 | |||||||||||||
| Income from investment operations: | |||||||||||||||||||||||
| Net investment income (c) | 0.09 | 0.01 | (d) | 0.15 | 0.11 | 0.02 | |||||||||||||||||
| Net realized and unrealized gain (loss) on investments and futures contracts | 0.63 | 2.15 | 0.65 | 1.64 | (0.02 | ) | |||||||||||||||||
| Total from investment operations | 0.72 | 2.16 | 0.80 | 1.75 | — | ||||||||||||||||||
| Less distributions: | |||||||||||||||||||||||
| From net investment income | (0.12 | ) | (0.26 | ) | (0.15 | ) | (0.09 | ) | (0.07 | ) | |||||||||||||
| Net asset value, end of period | $ | 22.32 | $ | 21.72 | $ | 19.82 | $ | 19.17 | $ | 17.51 | |||||||||||||
| Total return (e) | 3.33 | %(f)(g) | 10.97 | % | 4.14 | % | 10.01 | %(g) | 0.01 | %(g) | |||||||||||||
| Ratios/Supplemental data: | |||||||||||||||||||||||
| Net assets, end of period (in thousands) | $ | 240 | $ | 320 | $ | 361 | $ | 770 | $ | 446 | |||||||||||||
| Ratio of expenses to average net assets (h) | 1.74 | %(i) | 1.77 | % | 1.77 | % | 1.87 | %(i) | 1.92 | %(i) | |||||||||||||
| Ratio of net investment income to average net assets (h) | 0.85 | %(i) | 1.07 | % | 0.74 | % | 0.89 | %(i) | 1.28 | %(i) | |||||||||||||
| Waiver | 0.01 | %(i) | — | — | — | — | |||||||||||||||||
| Portfolio turnover rate | 25 | %(g) | 63 | % | 158 | % | 110 | %(g) | 98 | % | |||||||||||||
(a) The Fund changed its fiscal year end from December 31 to August 31.
(b) Class D shares were initially offered on November 1, 2002. Per share data and total return reflect activity from that date.
(c) Per share data was calculated using average shares outstanding during the period.
(d) Net investment income per share reflects a special dividend. The effect of this dividend amounted to $0.06 per share.
(e) Total return at net asset value assuming all distributions reinvested and no contingent deferred sales charge.
(f) Had the Transfer Agent not waived a portion of expenses, total return would have been reduced.
(g) Not annualized.
(h) The benefits derived from custody credits had an impact of less than 0.01%.
(i) Annualized.
See Accompanying Notes to Financial Statements.
128
FINANCIAL HIGHLIGHTS
Columbia Balanced Fund
For a fund share outstanding throughout each period
| (Unaudited) Period Ended February 28, | Year Ended August 31, | Period Ended August 31, | Year Ended December 31, | ||||||||||||||||||||||||||||
| Class Z Shares | 2006 | 2005 | 2004 | 2003 (a) | 2002 (b) | 2001 | 2000 | ||||||||||||||||||||||||
| Net asset value, beginning of period | $ | 21.74 | $ | 19.84 | $ | 19.19 | $ | 17.51 | $ | 20.67 | $ | 22.96 | $ | 24.72 | |||||||||||||||||
| Income from investment operations: | |||||||||||||||||||||||||||||||
| Net investment income | 0.20 | (c) | 0.01 | (c)(d) | 0.35 | (c) | 0.24 | (c) | 0.47 | (c) | 0.57 | (e) | 0.67 | ||||||||||||||||||
| Net realized and unrealized gain (loss) on investments and futures contracts | 0.64 | 2.36 | 0.66 | 1.64 | (3.13 | ) | (2.27 | )(e) | (0.41 | ) | |||||||||||||||||||||
| Total from investment operations | 0.84 | 2.37 | 1.01 | 1.88 | (2.66 | ) | (1.70 | ) | 0.26 | ||||||||||||||||||||||
| Less distributions: | |||||||||||||||||||||||||||||||
| From net investment income | (0.23 | ) | (0.47 | ) | (0.36 | ) | (0.20 | ) | (0.50 | ) | (0.59 | ) | (0.68 | ) | |||||||||||||||||
| From net realized gains | — | — | — | — | — | — | (1.34 | ) | |||||||||||||||||||||||
| Total distributions | (0.23 | ) | (0.47 | ) | (0.36 | ) | (0.20 | ) | (0.50 | ) | (0.59 | ) | (2.02 | ) | |||||||||||||||||
| Net asset value, end of period | $ | 22.35 | $ | 21.74 | $ | 19.84 | $ | 19.19 | $ | 17.51 | $ | 20.67 | $ | 22.96 | |||||||||||||||||
| Total return (f) | 3.89 | %(g)(h) | 12.06 | % | 5.27 | % | 10.81 | %(h) | (12.97 | )% | (7.40 | )% | 0.82 | % | |||||||||||||||||
| Ratios/Supplemental data: | |||||||||||||||||||||||||||||||
| Net assets, end of period (in thousands) | $ | 261,707 | $ | 301,109 | $ | 483,746 | $ | 640,402 | $ | 668,290 | $ | 983,749 | $ | 1,126,854 | |||||||||||||||||
| Ratio of expenses to average net assets (i) | 0.74 | %(j) | 0.77 | % | 0.77 | % | 0.77 | %(j) | 0.70 | % | 0.67 | % | 0.65 | % | |||||||||||||||||
| Ratio of net investment income to average net assets (i) | 1.86 | %(j) | 2.11 | % | 1.73 | % | 2.03 | %(j) | 2.50 | % | 2.70 | %(e) | 2.73 | % | |||||||||||||||||
| Waiver | 0.01 | %(j) | — | — | — | — | — | — | |||||||||||||||||||||||
| Portfolio turnover rate | 25 | %(h) | 63 | % | 158 | % | 110 | %(h) | 98 | % | 111 | % | 105 | % | |||||||||||||||||
(a) The Fund changed its fiscal year end from December 31 to August 31.
(b) On November 1, 2002, the existing Fund shares were renamed Class Z shares.
(c) Per share data was calculated using average shares outstanding during the period.
(d) Net investment income per share reflects a special dividend. The effect of this dividend amounted to $0.06 per share.
(e) Effective January 1, 2001, the Fund adopted the provisions of the AICPA Audit and Accounting Guide for Investment Companies and began amortizing premium and accreting discount on all debt securities. The effect of this change for the year ended December 31, 2001 was to decrease net investment income per share by $0.01, decrease net realized and unrealized loss per share by $0.01 and decrease the ratio of net investment income to average net assets from 2.73% to 2.70%. Per share data and ratios for periods prior to December 31, 2001 have not been restated to reflect this change in presentation.
(f) Total return at net asset value assuming all distributions reinvested.
(g) Had the Transfer Agent not waived a portion of expenses, total return would have been reduced.
(h) Not annualized.
(i) The benefits derived from custody credits had an impact of less than 0.01%.
(j) Annualized.
See Accompanying Notes to Financial Statements.
129
FINANCIAL HIGHLIGHTS
Columbia Oregon Intermediate Municipal Bond Fund
For a fund share outstanding throughout each period
| (Unaudited) Period Ended February 28, | Year Ended August 31, | Period Ended August 31, | Period Ended December 31, | ||||||||||||||||||||
| Class A Shares | 2006 | 2005 | 2004 | 2003 (a) | 2002 (b) | ||||||||||||||||||
| Net asset value, beginning of period | $ | 12.45 | $ | 12.45 | $ | 12.25 | $ | 12.50 | $ | 12.52 | |||||||||||||
| Income from investment operations: | |||||||||||||||||||||||
| Net investment income (c) | 0.23 | 0.46 | 0.46 | 0.29 | 0.08 | ||||||||||||||||||
| Net realized and unrealized gain (loss) on investments | (0.15 | ) | 0.03 | 0.34 | (0.22 | ) | 0.07 | ||||||||||||||||
| Total from investment operations | 0.08 | 0.49 | 0.80 | 0.07 | 0.15 | ||||||||||||||||||
| Less distributions: | |||||||||||||||||||||||
| From net investment income | (0.23 | ) | (0.45 | ) | (0.46 | ) | (0.31 | ) | (0.08 | ) | |||||||||||||
| From net realized gains | — | (0.04 | ) | (0.14 | ) | (0.01 | ) | (0.09 | ) | ||||||||||||||
| Total distributions | (0.23 | ) | (0.49 | ) | (0.60 | ) | (0.32 | ) | (0.17 | ) | |||||||||||||
| Net asset value, end of period | $ | 12.30 | $ | 12.45 | $ | 12.45 | $ | 12.25 | $ | 12.50 | |||||||||||||
| Total return (d) | 0.65 | %(e)(f) | 4.05 | % | 6.68 | % | 0.56 | %(f) | 1.19 | %(f) | |||||||||||||
| Ratios/Supplemental data: | |||||||||||||||||||||||
| Net assets, end of period (in thousands) | $ | 5,064 | $ | 4,300 | $ | 3,680 | $ | 2,138 | $ | 477 | |||||||||||||
| Ratio of expenses to average net assets (g) | 0.88 | %(h) | 0.89 | % | 0.92 | % | 1.16 | %(h) | 0.92 | %(h) | |||||||||||||
| Ratio of net investment income to average net assets (g) | 3.74 | %(h) | 3.71 | % | 3.73 | % | 3.52 | %(h) | 4.11 | %(h) | |||||||||||||
| Waiver | — | %(h)(i) | — | — | — | — | |||||||||||||||||
| Portfolio turnover rate | 1 | %(f) | 9 | % | 11 | % | 10 | %(f) | 21 | % | |||||||||||||
(a) The Fund changed its fiscal year end from December 31 to August 31.
(b) Class A shares were initially offered on November 1, 2002. Per share data and total return reflect activity from that date.
(c) Per share data was calculated using average shares outstanding during the period.
(d) Total return at net asset value assuming all distributions reinvested and no initial sales charge or contingent deferred sales charge.
(e) Had the Transfer Agent not waived a portion of expenses, total return would have been reduced.
(f) Not annualized.
(g) The benefits derived from custody credits had an impact of less than 0.01%.
(h) Annualized.
(i) Rounds to less than 0.01%.
| (Unaudited) Period Ended February 28, | Year Ended August 31, | Period Ended August 31, | Period Ended December 31, | ||||||||||||||||||||
| Class B Shares | 2006 | 2005 | 2004 | 2003 (a) | 2002 (b) | ||||||||||||||||||
| Net asset value, beginning of period | $ | 12.45 | $ | 12.45 | $ | 12.25 | $ | 12.50 | $ | 12.52 | |||||||||||||
| Income from investment operations: | |||||||||||||||||||||||
| Net investment income (c) | 0.18 | 0.37 | 0.37 | 0.24 | 0.06 | ||||||||||||||||||
| Net realized and unrealized gain (loss) on investments | (0.15 | ) | 0.03 | 0.34 | (0.23 | ) | 0.08 | ||||||||||||||||
| Total from investment operations | 0.03 | 0.40 | 0.71 | 0.01 | 0.14 | ||||||||||||||||||
| Less distributions: | |||||||||||||||||||||||
| From net investment income | (0.18 | ) | (0.36 | ) | (0.37 | ) | (0.25 | ) | (0.07 | ) | |||||||||||||
| From net realized gains | — | (0.04 | ) | (0.14 | ) | (0.01 | ) | (0.09 | ) | ||||||||||||||
| Total distributions | (0.18 | ) | (0.40 | ) | (0.51 | ) | (0.26 | ) | (0.16 | ) | |||||||||||||
| Net asset value, end of period | $ | 12.30 | $ | 12.45 | $ | 12.45 | $ | 12.25 | $ | 12.50 | |||||||||||||
| Total return (d) | 0.27 | %(e)(f) | 3.26 | % | 5.87 | % | 0.05 | %(f) | 1.10 | %(f) | |||||||||||||
| Ratios/Supplemental data: | |||||||||||||||||||||||
| Net assets, end of period (in thousands) | $ | 1,124 | $ | 1,226 | $ | 1,190 | $ | 999 | $ | 373 | |||||||||||||
| Ratio of expenses to average net assets (g) | 1.63 | %(h) | 1.64 | % | 1.68 | % | 1.86 | %(h) | 1.67 | %(h) | |||||||||||||
| Ratio of net investment income to average net assets (g) | 3.00 | %(h) | 2.96 | % | 2.97 | % | 2.83 | %(h) | 3.36 | %(h) | |||||||||||||
| Waiver | — | %(h)(i) | — | — | — | — | |||||||||||||||||
| Portfolio turnover rate | 1 | %(f) | 9 | % | 11 | % | 10 | %(f) | 21 | % | |||||||||||||
(a) The Fund changed its fiscal year end from December 31 to August 31.
(b) Class B shares were initially offered on November 1, 2002. Per share data and total return reflect activity from that date.
(c) Per share data was calculated using average shares outstanding during the period.
(d) Total return at net asset value assuming all distributions reinvested and no contingent deferred sales charge.
(e) Had the Transfer Agent not waived a portion of expenses, total return would have been reduced.
(f) Not annualized.
(g) The benefits derived from custody credits had an impact of less than 0.01%.
(h) Annualized.
(i) Rounds to less than 0.01%.
See Accompanying Notes to Financial Statements.
130
FINANCIAL HIGHLIGHTS
Columbia Oregon Intermediate Municipal Bond Fund
For a fund share outstanding throughout each period
| Class C Shares | (Unaudited) Period Ended February 28, 2006 | Year Ended August 31, 2005 | Period Ended August 31, 2004 (a) | ||||||||||||
| Net asset value, beginning of period | $ | 12.45 | $ | 12.45 | $ | 12.42 | |||||||||
| Income from investment operations: | |||||||||||||||
| Net investment income (b) | 0.20 | 0.41 | 0.36 | ||||||||||||
| Net realized and unrealized gain on investments | (0.15 | ) | 0.03 | 0.18 | |||||||||||
| Total from investment operations | 0.05 | 0.44 | 0.54 | ||||||||||||
| Less distributions: | |||||||||||||||
| From net investment income | (0.20 | ) | (0.40 | ) | (0.37 | ) | |||||||||
| From net realized gains | — | (0.04 | ) | (0.14 | ) | ||||||||||
| Total distributions | (0.20 | ) | (0.44 | ) | (0.51 | ) | |||||||||
| Net asset value, end of period | $ | 12.30 | $ | 12.45 | $ | 12.45 | |||||||||
| Total return (c)(d) | 0.44 | %(e) | 3.64 | % | 4.41 | %(e) | |||||||||
| Ratios/Supplemental data: | |||||||||||||||
| Net assets, end of period (in thousands) | $ | 560 | $ | 601 | $ | 278 | |||||||||
| Ratio of expenses to average net assets (f) | 1.28 | %(g) | 1.29 | % | 1.30 | %(g) | |||||||||
| Ratio of net investment income to average net assets (f) | 3.35 | %(g) | 3.31 | % | 3.28 | %(g) | |||||||||
| Waiver (h) | 0.35 | %(g) | 0.35 | % | 0.35 | %(g) | |||||||||
| Portfolio turnover rate | 1 | %(e) | 9 | % | 11 | % | |||||||||
(a) Class C shares were initially offered on October 13, 2003. Per share data and total return reflect activity from that date.
(b) Per share data was calculated using average shares outstanding during the period.
(c) Total return at net asset value assuming all distributions reinvested and no contingent deferred sales charge.
(d) Had the Distributor and/or Transfer Agent not waived a portion of expenses, total return would have been reduced.
(e) Not annualized.
(f) The benefits derived from custody credits had an impact of less than 0.01%.
(g) Annualized.
(h) Amounts represent voluntary waivers of service and distribution fees.
| (Unaudited) Period Ended February 28, | Year Ended August 31, | Period Ended August 31, | Period Ended December 31, | ||||||||||||||||||||
| Class D Shares | 2006 | 2005 | 2004 | 2003 (a) | 2002 (b) | ||||||||||||||||||
| Net asset value, beginning of period | $ | 12.45 | $ | 12.45 | $ | 12.25 | $ | 12.50 | $ | 12.52 | |||||||||||||
| Income from investment operations: | |||||||||||||||||||||||
| Net investment income (c) | 0.20 | 0.41 | 0.41 | 0.27 | 0.07 | ||||||||||||||||||
| Net realized and unrealized gain (loss) on investments | (0.15 | ) | 0.03 | 0.34 | (0.23 | ) | 0.07 | ||||||||||||||||
| Total from investment operations | 0.05 | 0.44 | 0.75 | 0.04 | 0.14 | ||||||||||||||||||
| Less distributions: | |||||||||||||||||||||||
| From net investment income | (0.20 | ) | (0.40 | ) | (0.41 | ) | (0.28 | ) | (0.07 | ) | |||||||||||||
| From net realized gains | — | (0.04 | ) | (0.14 | ) | (0.01 | ) | (0.09 | ) | ||||||||||||||
| Total distributions | (0.20 | ) | (0.44 | ) | (0.55 | ) | (0.29 | ) | (0.16 | ) | |||||||||||||
| Net asset value, end of period | $ | 12.30 | $ | 12.45 | $ | 12.45 | $ | 12.25 | $ | 12.50 | |||||||||||||
| Total return (d)(e) | 0.45 | %(f) | 3.62 | % | 6.25 | % | 0.32 | %(f) | 1.14 | %(f) | |||||||||||||
| Ratios/Supplemental data: | |||||||||||||||||||||||
| Net assets, end of period (in thousands) | $ | 724 | $ | 764 | $ | 790 | $ | 700 | $ | 488 | |||||||||||||
| Ratio of expenses to average net assets (g) | 1.28 | %(h) | 1.29 | % | 1.33 | % | 1.43 | %(h) | 1.32 | %(h) | |||||||||||||
| Ratio of net investment income to average net assets (g) | 3.35 | %(h) | 3.31 | % | 3.34 | % | 3.30 | %(h) | 3.71 | %(h) | |||||||||||||
| Waiver (i) | 0.35 | %(h) | 0.35 | % | 0.35 | % | 0.35 | %(h) | 0.35 | %(h) | |||||||||||||
| Portfolio turnover rate | 1 | %(f) | 9 | % | 11 | % | 10 | %(f) | 21 | % | |||||||||||||
(a) The Fund changed its fiscal year end from December 31 to August 31.
(b) Class D shares were initially offered on November 1, 2002. Per share data and total return reflect activity from that date.
(c) Per share data was calculated using average shares outstanding during the period.
(d) Total return at net asset value assuming all distributions reinvested and no contingent deferred sales charge.
(e) Had the Distributor and/or Transfer Agent not waived a portion of expenses, total return would have been reduced.
(f) Not annualized.
(g) The benefits derived from custody credits had an impact of less than 0.01%.
(h) Annualized.
(i) Amounts represent voluntary waivers of service and distribution fees.
See Accompanying Notes to Financial Statements.
131
FINANCIAL HIGHLIGHTS
Columbia Oregon Intermediate Municipal Bond Fund
For a fund share outstanding throughout each period
| (Unaudited) Period Ended February 28, | Year Ended August 31, | Period Ended August 31, | Year Ended December 31, | ||||||||||||||||||||||||||||
| Class Z Shares | 2006 | 2005 | 2004 | 2003 (a) | 2002 (b) | 2001 | 2000 | ||||||||||||||||||||||||
| Net asset value, beginning of period | $ | 12.45 | $ | 12.45 | $ | 12.25 | $ | 12.50 | $ | 12.08 | $ | 12.13 | $ | 11.56 | |||||||||||||||||
| Income from investment operations: | |||||||||||||||||||||||||||||||
| Net investment income | 0.24 | (c) | 0.49 | (c) | 0.50 | (c) | 0.34 | (c) | 0.55 | (c) | 0.57 | (d) | 0.58 | ||||||||||||||||||
| Net realized and unrealized gain (loss) on investments | (0.15 | ) | 0.03 | 0.34 | (0.23 | ) | 0.54 | (0.02 | )(d) | 0.58 | |||||||||||||||||||||
| Total from investment operations | 0.09 | 0.52 | 0.84 | 0.11 | 1.09 | 0.55 | 1.16 | ||||||||||||||||||||||||
| Less distributions: | |||||||||||||||||||||||||||||||
| From net investment income | (0.24 | ) | (0.48 | ) | (0.50 | ) | (0.35 | ) | (0.55 | ) | (0.57 | ) | (0.58 | ) | |||||||||||||||||
| From net realized gains | — | (0.04 | ) | (0.14 | ) | (0.01 | ) | (0.12 | ) | (0.03 | ) | (0.01 | ) | ||||||||||||||||||
| Total distributions | (0.24 | ) | (0.52 | ) | (0.64 | ) | (0.36 | ) | (0.67 | ) | (0.60 | ) | (0.59 | ) | |||||||||||||||||
| Net asset value, end of period | $ | 12.30 | $ | 12.45 | $ | 12.45 | $ | 12.25 | $ | 12.50 | $ | 12.08 | $ | 12.13 | |||||||||||||||||
| Total return (e) | 0.77 | %(f)(g) | 4.31 | % | 6.97 | % | 0.83 | %(g) | 9.24 | % | 4.55 | % | 10.28 | % | |||||||||||||||||
| Ratios/Supplemental data: | |||||||||||||||||||||||||||||||
| Net assets, end of period (in thousands) | $ | 394,573 | $ | 410,706 | $ | 434,509 | $ | 485,427 | $ | 508,865 | $ | 491,638 | $ | 436,544 | |||||||||||||||||
| Ratio of expenses to average net assets (h) | 0.63 | %(i) | 0.64 | % | 0.65 | % | 0.68 | %(i) | 0.58 | % | 0.57 | % | 0.58 | % | |||||||||||||||||
| Ratio of net investment income to average net assets (h) | 4.00 | %(i) | 3.96 | % | 4.03 | % | 4.13 | %(i) | 4.45 | % | 4.64 | %(d) | 4.92 | % | |||||||||||||||||
| Waiver | — | %(i)(j) | — | — | — | — | — | — | |||||||||||||||||||||||
| Portfolio turnover rate | 1 | %(g) | 9 | % | 11 | % | 10 | %(g) | 21 | % | 14 | % | 22 | % | |||||||||||||||||
(a) The Fund changed its fiscal year end from December 31 to August 31.
(b) On November 1, 2002, the existing Fund shares were renamed Class Z shares.
(c) Per share data was calculated using average shares outstanding during the period.
(d) Effective January 1, 2001, the Fund adopted the provisions of the AICPA Audit and Accounting Guide for Investment Companies and began amortizing premium and accreting discount on all debt securities. The effect of this change for the year ended December 31, 2001 was less than $0.01 to net investment income and net realized and unrealized loss per share and less than 0.01% to the ratio of net investment income to average net assets. Per share data and ratios for the periods prior to December 31, 2001 have not been restated to reflect this change in presentation.
(e) Total return at net asset value assuming all distributions reinvested.
(f) Had the Transfer Agent not waived a portion of expenses, total return would have been reduced.
(g) Not annualized.
(h) The benefits derived from custody credits had an impact of less than 0.01%.
(i) Annualized.
(j) Rounds to less than 0.01%.
See Accompanying Notes to Financial Statements.
132
FINANCIAL HIGHLIGHTS
Columbia Conservative High Yield Fund
For a fund share outstanding throughout each period
| (Unaudited) Six Months Ended February 28, | Year Ended August 31, | Period Ended August 31, | Period Ended December 31, | ||||||||||||||||||||
| Class A Shares | 2006 | 2005 | 2004 | 2003 (a) | 2002 (b) | ||||||||||||||||||
| Net asset value, beginning of period | $ | 8.62 | $ | 8.69 | $ | 8.49 | $ | 8.37 | $ | 8.17 | |||||||||||||
| Income from investment operations: | |||||||||||||||||||||||
| Net investment income (c) | 0.25 | 0.48 | 0.50 | 0.33 | 0.09 | ||||||||||||||||||
| Net realized and unrealized gain (loss) on investments | (0.07 | ) | (0.03 | ) | 0.24 | 0.15 | 0.20 | ||||||||||||||||
| Total from investment operations | 0.18 | 0.45 | 0.74 | 0.48 | 0.29 | ||||||||||||||||||
| Less distributions: | |||||||||||||||||||||||
| From net investment income | (0.27 | ) | (0.52 | ) | (0.54 | ) | (0.36 | ) | (0.09 | ) | |||||||||||||
| Net asset value, end of period | $ | 8.53 | $ | 8.62 | $ | 8.69 | $ | 8.49 | $ | 8.37 | |||||||||||||
| Total return (d) | 2.12 | %(e)(f) | 5.31 | % | 8.90 | % | 5.81 | %(e) | 3.50 | %(e) | |||||||||||||
| Ratios/Supplemental data: | |||||||||||||||||||||||
| Net assets, end of period (in thousands) | $ | 215,333 | $ | 321,402 | $ | 335,841 | $ | 193,267 | $ | 33,992 | |||||||||||||
| Ratio of expenses to average net assets (g) | 0.93 | %(h) | 0.95 | % | 1.01 | % | 1.07 | %(h) | 1.15 | %(h) | |||||||||||||
| Ratio of net investment income to average net assets (g) | 6.01 | %(h) | 5.55 | % | 5.74 | % | 5.82 | %(h) | 6.46 | %(h) | |||||||||||||
| Waiver | — | %(h)(i) | — | — | — | — | |||||||||||||||||
| Portfolio turnover rate | 16 | %(e) | 40 | % | 41 | % | 38 | %(e) | 42 | % | |||||||||||||
(a) The Fund changed its fiscal year end from December 31 to August 31.
(b) Class A shares were initially offered on November 1, 2002. Per share data and total return reflect activity from that date.
(c) Per share data was calculated using average shares outstanding during the period.
(d) Total return at net asset value assuming all distributions reinvested and no initial sales charge or contingent deferred sales charge.
(e) Not annualized.
(f) Had the Transfer Agent not waived a portion of expenses, total return would have been reduced.
(g) The benefits derived from custody credits had an impact of less than 0.01%.
(h) Annualized.
(i) Rounds to less than 0.01%.
| (Unaudited) Six Months Ended February 28, | Year Ended August 31, | Period Ended August 31, | Period Ended December 31, | ||||||||||||||||||||
| Class B Shares | 2006 | 2005 | 2004 | 2003 (a) | 2002 (b) | ||||||||||||||||||
| Net asset value, beginning of period | $ | 8.62 | $ | 8.69 | $ | 8.49 | $ | 8.37 | $ | 8.17 | |||||||||||||
| Income from investment operations: | |||||||||||||||||||||||
| Net investment income (c) | 0.22 | 0.42 | 0.43 | 0.28 | 0.07 | ||||||||||||||||||
| Net realized and unrealized gain (loss) on investments | (0.07 | ) | (0.03 | ) | 0.24 | 0.15 | 0.20 | ||||||||||||||||
| Total from investment operations | 0.15 | 0.39 | 0.67 | 0.43 | 0.27 | ||||||||||||||||||
| Less distributions: | |||||||||||||||||||||||
| From net investment income | (0.24 | ) | (0.46 | ) | (0.47 | ) | (0.31 | ) | (0.07 | ) | |||||||||||||
| Net asset value, end of period | $ | 8.53 | $ | 8.62 | $ | 8.69 | $ | 8.49 | $ | 8.37 | |||||||||||||
| Total return (d) | 1.74 | %(e)(f) | 4.53 | % | 8.07 | % | 5.20 | %(e) | 3.33 | %(e) | |||||||||||||
| Ratios/Supplemental data: | |||||||||||||||||||||||
| Net assets, end of period (in thousands) | $ | 79,006 | $ | 89,101 | $ | 102,038 | $ | 89,950 | $ | 16,701 | |||||||||||||
| Ratio of expenses to average net assets (g) | 1.68 | %(h) | 1.70 | % | 1.77 | % | 1.94 | %(h) | 1.90 | %(h) | |||||||||||||
| Ratio of net investment income to average net assets (g) | 5.24 | %(h) | 4.80 | % | 4.97 | % | 4.93 | %(h) | 5.71 | %(h) | |||||||||||||
| Waiver | — | %(h)(i) | — | — | — | — | |||||||||||||||||
| Portfolio turnover rate | 16 | %(e) | 40 | % | 41 | % | 38 | %(e) | 42 | % | |||||||||||||
(a) The Fund changed its fiscal year end from December 31 to August 31.
(b) Class B shares were initially offered on November 1, 2002. Per share data and total return reflect activity from that date.
(c) Per share data was calculated using average shares outstanding during the period.
(d) Total return at net asset value assuming all distributions reinvested and no contingent deferred sales charge.
(e) Not annualized.
(f) Had the Transfer Agent not waived a portion of expenses, total return would have been reduced.
(g) The benefits derived from custody credits had an impact of less than 0.01%.
(h) Annualized.
(i) Rounds to less than 0.01%.
See Accompanying Notes to Financial Statements.
133
FINANCIAL HIGHLIGHTS
Columbia Conservative High Yield Fund
For a fund share outstanding throughout each period
| Class C Shares | (Unaudited) Six Months Ended February 28, 2006 | Year Ended August 31, 2005 | Period Ended August 31, 2004 (a) | ||||||||||||
| Net asset value, beginning of period | $ | 8.62 | $ | 8.69 | $ | 8.64 | |||||||||
| Income from investment operations: | |||||||||||||||
| Net investment income (b) | 0.23 | 0.43 | 0.39 | ||||||||||||
| Net realized and unrealized gain (loss) on investments | (0.08 | ) | (0.03 | ) | 0.09 | ||||||||||
| Total from investment operations | 0.15 | 0.40 | 0.48 | ||||||||||||
| Less distributions: | |||||||||||||||
| From net investment income | (0.24 | ) | (0.47 | ) | (0.43 | ) | |||||||||
| Net asset value, end of period | $ | 8.53 | $ | 8.62 | $ | 8.69 | |||||||||
| Total return (c)(d) | 1.82 | %(e) | 4.69 | % | 5.65 | %(e) | |||||||||
| Ratios/Supplemental data: | |||||||||||||||
| Net assets, end of period (in thousands) | $ | 14,259 | $ | 18,002 | $ | 20,126 | |||||||||
| Ratio of expenses to average net assets (f) | 1.53 | %(g) | 1.55 | % | 1.61 | %(g) | |||||||||
| Ratio of net investment income to average net assets (f) | 5.40 | %(g) | 4.95 | % | 5.03 | %(g) | |||||||||
| Waiver (h) | 0.15 | %(g) | 0.15 | % | 0.15 | %(g) | |||||||||
| Portfolio turnover rate | 16 | %(e) | 40 | % | 41 | % | |||||||||
(a) Class C shares were initially offered on October 13, 2003. Per share data and total return reflect activity from that date.
(b) Per share data was calculated using average shares outstanding during the period.
(c) Total return at net asset value assuming all distributions reinvested and no contingent deferred sales charge.
(d) Had the Distributor and/or Transfer Agent not waived a portion of expenses, total return would have been reduced.
(e) Not annualized.
(f) The benefits derived from custody credits had an impact of less than 0.01%.
(g) Annualized.
(h) Amounts represent voluntary waivers of service and distribution fees.
| (Unaudited) Six Months Ended February 28, | Year Ended August 31, | Period Ended August 31, | Period Ended December 31, | ||||||||||||||||||||
| Class D Shares | 2006 | 2005 | 2004 | 2003 (a) | 2002 (b) | ||||||||||||||||||
| Net asset value, beginning of period | $ | 8.62 | $ | 8.69 | $ | 8.49 | $ | 8.37 | $ | 8.17 | |||||||||||||
| Income from investment operations: | |||||||||||||||||||||||
| Net investment income (c) | 0.23 | 0.43 | 0.44 | 0.29 | 0.07 | ||||||||||||||||||
| Net realized and unrealized gain (loss) on investments | (0.08 | ) | (0.03 | ) | 0.24 | 0.15 | 0.20 | ||||||||||||||||
| Total from investment operations | 0.15 | 0.40 | 0.68 | 0.44 | 0.27 | ||||||||||||||||||
| Less distributions: | |||||||||||||||||||||||
| From net investment income | (0.24 | ) | (0.47 | ) | (0.48 | ) | (0.32 | ) | (0.07 | ) | |||||||||||||
| Net asset value, end of period | $ | 8.53 | $ | 8.62 | $ | 8.69 | $ | 8.49 | $ | 8.37 | |||||||||||||
| Total return (d)(e) | 1.82 | %(f) | 4.69 | % | 8.23 | % | 5.35 | %(f) | 3.35 | %(f) | |||||||||||||
| Ratios/Supplemental data: | |||||||||||||||||||||||
| Net assets, end of period (in thousands) | $ | 45,214 | $ | 58,739 | $ | 86,854 | $ | 103,559 | $ | 18,035 | |||||||||||||
| Ratio of expenses to average net assets (g) | 1.53 | %(h) | 1.55 | % | 1.62 | % | 1.73 | %(h) | 1.75 | %(h) | |||||||||||||
| Ratio of net investment income to average net assets (g) | 5.41 | %(h) | 4.95 | % | 5.12 | % | 5.12 | %(h) | 5.86 | %(h) | |||||||||||||
| Waiver (i) | 0.15 | %(h) | 0.15 | % | 0.15 | % | 0.15 | %(h) | 0.15 | %(h) | |||||||||||||
| Portfolio turnover rate | 16 | %(f) | 40 | % | 41 | % | 38 | %(f) | 42 | % | |||||||||||||
(a) The Fund changed its fiscal year end from December 31 to August 31.
(b) Class D shares were initially offered on November 1, 2002. Per share data and total return reflect activity from that date.
(c) Per share data was calculated using average shares outstanding during the period.
(d) Total return at net asset value assuming all distributions reinvested and no contingent deferred sales charge.
(e) Had the Distributor and/or Transfer Agent not waived a portion of expenses, total return would have been reduced.
(f) Not annualized.
(g) The benefits derived from custody credits had an impact of less than 0.01%.
(h) Annualized.
(i) Amounts represent voluntary waivers of service and distribution fees.
See Accompanying Notes to Financial Statements.
134
FINANCIAL HIGHLIGHTS
Columbia Conservative High Yield Fund
For a fund share outstanding throughout each period
| (Unaudited) Six Months Ended February 28, | Year Ended August 31, | Period Ended August 31, | Year Ended December 31, | ||||||||||||||||||||||||||||
| Class Z Shares | 2006 | 2005 | 2004 | 2003 (a) | 2002 (b) | 2001 | 2000 | ||||||||||||||||||||||||
| Net asset value, beginning of period | $ | 8.62 | $ | 8.69 | $ | 8.49 | $ | 8.37 | $ | 8.87 | $ | 8.98 | $ | 9.32 | |||||||||||||||||
| Income from investment operations: | |||||||||||||||||||||||||||||||
| Net investment income | 0.26 | (c) | 0.50 | (c) | 0.52 | (c) | 0.35 | (c) | 0.57 | (c) | 0.67 | (d) | 0.75 | ||||||||||||||||||
| Net realized and unrealized gain (loss) on investments | (0.07 | ) | (0.03 | ) | 0.24 | 0.15 | (0.48 | ) | (0.09 | )(d) | (0.34 | ) | |||||||||||||||||||
| Total from investment operations | 0.19 | 0.47 | 0.76 | 0.50 | 0.09 | 0.58 | 0.41 | ||||||||||||||||||||||||
| Less distributions: | |||||||||||||||||||||||||||||||
| From net investment income | (0.28 | ) | (0.54 | ) | (0.56 | ) | (0.38 | ) | (0.59 | ) | (0.69 | ) | (0.75 | ) | |||||||||||||||||
| Net asset value, end of period | $ | 8.53 | $ | 8.62 | $ | 8.69 | $ | 8.49 | $ | 8.37 | $ | 8.87 | $ | 8.98 | |||||||||||||||||
| Total return (e) | 2.24 | %(f) | 5.54 | % | 9.16 | % | 6.04 | %(f) | 1.17 | % | 6.63 | % | 4.61 | % | |||||||||||||||||
| Ratios/Supplemental data: | |||||||||||||||||||||||||||||||
| Net assets, end of period (in thousands) | $ | 934,549 | $ | 1,073,894 | $ | 1,186,454 | $ | 1,197,340 | $ | 702,785 | $ | 238,994 | $ | 97,575 | |||||||||||||||||
| Ratio of expenses to average net assets (g) | 0.68 | %(h) | 0.70 | % | 0.77 | % | 0.82 | %(h) | 0.77 | % | 0.85 | % | 0.93 | % | |||||||||||||||||
| Ratio of net investment income to average net assets (g) | 6.23 | %(h) | 5.80 | % | 5.97 | % | 6.19 | %(h) | 6.84 | % | 7.47 | %(d) | 8.22 | % | |||||||||||||||||
| Portfolio turnover rate | 16 | %(f) | 40 | % | 41 | % | 38 | %(f) | 42 | % | 69 | % | 50 | % | |||||||||||||||||
(a) The Fund changed its fiscal year end from December 31 to August 31.
(b) On November 1, 2002, the existing Fund shares were renamed Class Z shares.
(c) Per share data was calculated using average shares outstanding during the period.
(d) Effective January 1, 2001, the Fund adopted the provisions of the AICPA Audit and Accounting Guide for Investment Companies and began amortizing premium and accreting discount on all debt securities. The effect of this change for the year ended December 31, 2001 was to decrease net investment income per share by $0.02, decrease net realized and unrealized loss per share by $0.02 and decrease the ratio of net investment income to average net assets from 7.64% to 7.47%. Per share data and ratios for periods prior to
(e) Total return at net asset value assuming all distributions reinvested.
(f) Not annualized.
(g) The benefits derived from custody credits had an impact of less than 0.01%.
(h) Annualized.
See Accompanying Notes to Financial Statements.
135
NOTES TO FINANCIAL STATEMENTS
February 28, 2006 (Unaudited) Columbia Funds
Note 1. Organization
The Columbia Funds are registered under the Investment Company Act of 1940 (the "1940 Act"), as amended, as open-end management investment companies. Information presented in these financial statements pertains to the following Funds (individually referred to as a "Fund", collectively referred to as the "Funds"):
Columbia International Stock Fund
Columbia Mid Cap Growth Fund
Columbia Small Cap Growth Fund I
Columbia Real Estate Equity Fund
Columbia Technology Fund
Columbia Strategic Investor Fund
Columbia Balanced Fund
Columbia Oregon Intermediate Municipal Bond Fund
Columbia Conservative High Yield Fund
All Funds are diversified except for the Columbia Real Estate Equity Fund, Columbia Technology Fund and Columbia Oregon Intermediate Municipal Bond Fund, which are non-diversified.
Investment Goals
Columbia International Stock Fund seeks long-term capital appreciation by investing in stocks issued by companies from at least three countries outside the United States. Columbia Mid Cap Growth Fund seeks significant capital appreciation by investing in stocks of companies with a market capitalization, at the time of initial purchase, equal to or less than the largest stock in the Russell Midcap Index. Columbia Small Cap Growth Fund I seeks capital appreciation by investing in stocks of companies with a market capitalization, at the time of initial purchase, equal to or less than the largest stock in the Standard & Poor's SmallCap 600 Index. Columbia Real Estate Equity Fund seeks capital appreciation and above-average income by investing in stocks of companies principally engaged in the real estate industry, including real estate investment trusts (REITs). Columbia Technology Fund seeks capital appreciation by investing in stocks of technology companies that may benefit from technological improvements, advancements or developments. Columbia Strategic Investor Fund seeks long-term growth of capital by using a "value" approach to investing primarily in common stocks. Columbia Balanced Fund seeks high total return by investing in common stocks and debt securities. Columbia Oregon Intermediate Municipal Bond Fund seeks a high level of income exempt from federal and Oregon income tax by investing primarily in municipal securities issued by the state of Oregon. Columbia Conservative High Yield Fund seeks a high level of income, with capital appreciation as a secondary goal, by investing in non-investment-grade, corporate debt securities.
Fund Shares
Each Fund may issue an unlimited number of shares. Each of the Funds, except the Columbia International Stock Fund, Columbia Mid Cap Growth Fund and Columbia Small Cap Growth Fund I, offer five classes of shares: Class A, Class B, Class C, Class D and Class Z. Columbia Small Cap Growth Fund I offers four classes of shares: Class A, Class B, Class C and Class Z shares. Columbia Small Cap Growth Fund I commenced offering Class A, Class B and Class C shares on November 1, 2005. Columbia International Stock Fund offers six classes of shares: Class A, Class B, Class C, Class D, Class G and Class Z. Columbia Mid Cap Growth Fund offers eight classes of shares: Class A, Class B, Class C, Class D, Class G, Class R, Class T and Class Z. Effective January 23, 2006, the Columbia Mid Cap Growth Fund is authorized to issue Class R shares. Each share class has its own expense structure.
Class A and Class T shares are subject to a front-end sales charge based on the amount of initial investment. Class A and Class T shares purchased without an initial sales charge in accounts aggregating up to $50 million at the time of purchase are subject to a 1.00% contingent deferred sales charge ("CDSC") on shares sold within twelve months of the time of purchase. Class B and Class G shares are subject to a maximum CDSC of 5.00% based upon the holding period after purchase. Class B shares will convert to Class A shares in eight years after purchase. Class G shares will convert to Class T shares eight years after purchase. Class C shares are subject to a 1.00% CDSC on shares sold within one year after purchase. Class D shares are closed to new investors. Class D shares are subject to a front-end sales charge of 1.00% (which is currently being waived) and a 1.00% CDSC on shares sold within one year after purchase. Class R and Class Z shares are offered continuously at net asset value. There are certain restrictions on the purchase of Class R and Class Z shares, as described in each Fund's prospectus.
136
February 28, 2006 (Unaudited) Columbia Funds
Note 2. Significant Accounting Policies
Use of Estimates
The preparation of financial statements in conformity with accounting principles generally accepted in the United States of America ("GAAP") requires management to make estimates and assumptions that affect the reported amounts of assets and liabilities, the disclosure of contingent assets and liabilities at the date of the financial statements and the reported amounts of revenue and expenses during the reporting period. Actual results could differ from those estimates. The following is a summary of significant accounting policies consistently followed by the Funds in the preparation of their financial statements.
Security Valuation
Equity securities and certain investment companies are valued at the last sale price on the principal exchange on which they trade, except for securities traded on the NASDAQ, which are valued at the NASDAQ official close price. Unlisted securities or listed securities for which there were no sales during the day are valued at the closing bid price on such exchanges or over-the-counter markets.
Debt securities generally are valued by pricing services approved by the Funds' Board of Trustees, based upon market transactions for normal, institutional-size trading units of similar securities. The services may use various pricing techniques which take into account appropriate factors such as yield, quality, coupon rate, maturity, type of issue, trading characteristics and other data, as well as broker quotes. Debt securities for which quotations are readily available are valued at an over-the-counter or exchange bid quotation. Certain debt securities, which tend to be more thinly traded and of lesser quality, are priced based on fundamental analysis of the financial condition of the issuer and the estimated value of any collateral. Valuations developed through pricing techniques may vary from the actual amounts realized upon sale of the securities, and the potential variation may be greater for those securities valued using fundamental analysis.
Short-term debt obligations maturing within 60 days are valued at amortized cost, which approximates market value.
Investments in other open-end investment companies are valued at net asset value.Futures contracts are valued at the settlement price established each day by the board of trade or exchange on which they are traded.
Options are valued at the last reported sale price, or in the absence of a sale, the mean between the last quoted bid and ask price.
Foreign securities are generally valued at the last sale price on the foreign exchange or market on which they trade. If any foreign share prices are not readily available as a result of limited share activity, the securities are valued at the last sale price of the local shares in the principal market in which such securities are normally traded.
Generally, trading in foreign securities is substantially completed each day at various times prior to the close of the New York Stock Exchange ("NYSE"). The values of such securities used in computing the net asset value of the Fund's shares are determined as of such times. Foreign currency exchange rates are generally determined at 4:00 p.m. Eastern (U.S.) time. Occasionally, events affecting the values of such foreign securities and such exchange rates may occur between the times at which they are determined and the close of the customary trading session of the NYSE, which would not be reflected in the computation of the Fund's net asset value. If events materially affecting the values of such foreign securities occur and it is determined that market quotations are not reliable, then these foreign securities will be valued at their fair value using procedures approved by the Board of Trustees. The Fund may use a systematic fa ir valuation model provided by an independent third party to value securities principally traded in foreign markets in order to adjust for possible stale pricing that may occur between the close of the foreign exchanges and the time for valuation. If a security is valued at a "fair value", such value is likely to be different from the last quoted market price for the security.
Investments for which market quotations are not readily available, or that have quotations which management believes are not appropriate, are valued at fair value as determined in good faith under consistently applied procedures established by and under the general supervision of the Board of Trustees.
Security Transactions
Security transactions are accounted for on the trade date. Cost is determined and gains (losses) are based
137
February 28, 2006 (Unaudited) Columbia Funds
upon the specific identification method for both financial statement and federal income tax purposes.
Futures Contracts
Certain Funds may invest in municipal and U.S. Treasury futures contracts. The Funds will invest in these instruments to hedge against the effects of changes in the value of portfolio securities due to anticipated changes in interest rates and/or market conditions, for duration management, or when the transactions are economically appropriate to the reduction of risk inherent in the management of the Funds and not for trading purposes. The use of futures contracts involves certain risks, which include: (1) imperfect correlation between the price movement of the instruments and the underlying securities, (2) inability to close out positions due to differing trading hours, or the temporary absence of a liquid market, for either the instrument or the underlying securities, or (3) an inaccurate prediction by Columbia Management Advisors, LLC of the future direction of interest rates. Any of these risks may involve amounts exceeding the variation margin recorded in the Funds' Statement of Assets and Liabilities at any given time.
Upon entering into a futures contract, each Fund deposits cash or securities with the broker in an amount sufficient to meet the initial margin requirement. Subsequent payments are made or received by the Funds equal to the daily change in the contract value and are recorded as variation margin receivable or payable and offset in unrealized gains or losses. Each Fund also identifies portfolio securities as segregated with the broker in a separate account in an amount equal to the futures contract. The Funds recognize a realized gain or loss when the contract is closed or expires.
Options
Certain Funds may write call and put options on futures they own or in which they may invest. Writing put options tends to increase the Funds' exposure to the underlying instrument. Writing call options tends to decrease the Funds' exposure to the underlying instrument. When the Fund writes a call or put option, an amount equal to the premium received is recorded as a liability and subsequently marked-to-market to reflect the current value of the option written. Premiums received from writing options which expire are treated as realized gains. Premiums received from writing options which are exercised or closed are added to the proceeds or offset against the amounts paid on the underlying future transaction to determine the realized gain or loss. Each Fund as a writer of an option has no control over whether the underlying future may be sold (call) or purcha sed (put) and as a result bears the market risk of an unfavorable change in the price of the future underlying the written option. There is the risk the Funds may not be able to enter into a closing transaction because of an illiquid market. The Funds' custodian will set aside cash or liquid portfolio securities equal to the amount of the written options contract commitment in a separate account.
Certain Funds may also write call options on a security the Funds own. Writing call options tends to decrease a Fund's exposure to the underlying security. When a Fund writes a call option, an amount equal to the premium received is recorded as a liability. Premiums received from writing call options which have expired are treated as realized gains.
Certain Funds may also purchase put and call options. Purchasing call options tends to increase the Funds' exposure to the underlying instrument. Purchasing put options tends to decrease the Funds' exposure to the underlying instrument. Each Fund pays a premium, which is included in the Funds' Statement of Assets and Liabilities as an investment and subsequently marked-to-market to reflect the current value of the option. The risk associated with purchasing put and call options is limited to the premium paid. Premiums paid for purchasing options which expire are treated as realized losses. Premiums paid for purchasing options which are exercised or closed are added to the amounts paid or offset against the proceeds on the underlying future transaction to determine the realized gain or loss.
Forward Foreign Currency Exchange Contracts
Forward foreign currency exchange contracts are agreements to exchange one currency for another at a future date at a specified price. These contracts are used to minimize the exposure to foreign exchange rate fluctuations during the period between trade and settlement date of the contracts. Certain Funds may utilize forward foreign currency exchange contracts in connection with the settlement of purchases and sales of securities. Certain Funds may also enter into these contracts to hedge certain other foreign currency denominated assets. Contracts to buy generally are used to acquire exposure to foreign currencies, while
138
February 28, 2006 (Unaudited) Columbia Funds
contracts to sell are used to hedge the Funds' investments against currency fluctuations. Forward currency contracts are valued daily at the current exchange rate of the underlying currency, resulting in unrealized gains (losses) which become realized at the time the foreign currency contracts are closed or mature. Realized and unrealized gains (losses) arising from such transactions are included in net realized and unrealized gains (losses) on foreign currency transactions. The use of forward currency contracts does not eliminate fluctuations in the prices of the Funds' portfolio securities. While the maximum potential loss from such contracts is the aggregate face value in U.S. dollars at the time the contract was opened, exposure is typically limited to the change in value of the contract (in U.S. dollars) over the period it remains open. The Funds could also be exposed to risk if the counterparties of the contracts are unabl e to fulfill the terms of the contracts.
Treasury Inflation Protected Securities
The Fund may invest in Treasury Inflation Protected Securities ("TIPS"). The principal amount of TIPS is adjusted periodically for inflation based on a monthly published index. Interest payments are based on the inflation-adjusted principal at the time the interest is paid.
Repurchase Agreements
Each Fund may engage in repurchase agreement transactions with institutions that the Funds' investment advisor has determined are creditworthy. Each Fund, through its custodian, receives delivery of underlying securities collateralizing a repurchase agreement. Collateral is at least equal, at all times, to the value of the repurchase obligation including interest. A repurchase agreement transaction involves certain risks in the event of default or insolvency of the counterparty. These risks include possible delays or restrictions upon each Fund's ability to dispose of the underlying securities and a possible decline in the value of the underlying securities during the period while the Funds seek to assert their rights.
Income Recognition
Interest income is recorded on the accrual basis. Premium and discount are amortized and accreted, respectively, on all debt securities. Original issue discount is accreted to interest income over the life of the security with a corresponding increase in the cost basis. Corporate actions and dividend income are recorded on the ex-date, except for certain foreign securities which are recorded as soon after ex-date as the Funds become aware of such, net of non-reclaimable tax withholdings. Awards from class action litigation are recorded as a reduction of cost if the Funds still own the applicable securities on the payment date. If the Funds no longer own the applicable securities, the proceeds are recorded as realized gains.
The Funds estimate components of distributions from real estate investment trusts (REITs). Distributions received in excess of income are recorded as a reduction of the cost of the related investments. If the Funds no longer own the applicable securities, any distributions received in excess of income are recorded as realized gains.
Foreign Currency Transactions
The values of all assets and liabilities quoted in foreign currencies are translated into U.S. dollars at that day's exchange rates. Net realized and unrealized gains (losses) on foreign currency transactions include gains (losses) arising from the fluctuation in exchange rates between trade and settlement dates on securities transactions, gains (losses) arising from the disposition of foreign currency and currency gains (losses) between the accrual and payment dates on dividends, interest income and foreign withholding taxes.
For financial statement purposes, the Funds do not distinguish that portion of gains (losses) on investments which is due to changes in foreign exchange rates from that which is due to changes in market prices of the investments. Such fluctuations are included with the net realized and unrealized gains (losses) on investments.
Determination of Class Net Asset Values
All income, expenses (other than class-specific expenses, as shown on the Statements of Operations) and realized and unrealized gains (losses) are allocated to each class of a Fund on a daily basis for purposes of determining the net asset value of each class. Income and expenses are allocated to each class based on the settled shares method, while realized and unrealized gains (losses) are allocated based on the relative net assets of each class for the Columbia Oregon Intermediate Municipal Bond Fund and Columbia
139
February 28, 2006 (Unaudited) Columbia Funds
Conservative High Yield Fund. For all other Funds, income, expenses (other than class-specific expenses, as shown on the Statements of Operations), and realized and unrealized gains (losses) are allocated to each class of a Fund based on the relative net assets of each class of that Fund.
Federal Income Tax Status
Each Fund intends to qualify each year as a "regulated investment company" under Subchapter M of the Internal Revenue Code, as amended, and will distribute substantially all of its taxable income, if any, for its tax year, and as such will not be subject to federal income taxes. In addition, each Fund intends to distribute in each calendar year substantially all of its net investment income, capital gains and certain other amounts, if any, such that each Fund should not be subject to federal excise tax. Therefore, no federal income or excise tax provision is recorded.
Foreign Capital Gains Taxes
Realized gains in certain countries may be subject to foreign taxes at the fund level, at rates ranging from approximately 10% to 15%. The Funds accrue for such foreign taxes on net realized and unrealized gains at the appropriate rate for each jurisdiction.
Dividends and Distributions to Shareholders
Dividends from net investment income of the Columbia International Stock Fund, Columbia Mid Cap Growth Fund, Columbia Small Cap Growth Fund I, Columbia Technology Fund and Columbia Strategic Investor Fund are declared and paid annually. Dividends from net investment income of the Columbia Real Estate Equity Fund and Columbia Balanced Fund are declared and paid quarterly. Dividends from net investment income of the Columbia Oregon Intermediate Municipal Bond Fund and Columbia Conservative High Yield Fund are declared daily and paid monthly. Net realized capital gains, if any, are distributed at least annually for all Funds. Additional distributions of net investment income and capital gains for each Fund may be made at the discretion of the Board of Trustees in accordance with federal income tax regulations.
Note 3. Federal Tax Information
The tax character of distributions paid during the year ended August 31, 2005 was as follows:
| Tax-Exempt Income | Ordinary Income* | Long-Term Capital Gains | Total | ||||||||||||||||
| Columbia International Stock Fund | $ | — | $ | 3,047,263 | $ | — | $ | 3,047,263 | |||||||||||
| Columbia Real Estate Equity Fund | — | 34,548,337 | 81,680,946 | 116,229,283 | |||||||||||||||
| Columbia Strategic Investor Fund | — | 1,232,551 | 5,190,447 | 6,422,998 | |||||||||||||||
| Columbia Balanced Fund | — | 9,084,173 | — | 9,084,173 | |||||||||||||||
| Columbia Oregon Intermediate Municipal Bond Fund | 16,838,804 | 226,449 | 952,497 | 18,017,750 | |||||||||||||||
| Columbia Conservative High Yield Fund | — | 103,244,359 | — | 103,244,359 | |||||||||||||||
* For tax purposes short-term capital gains distributions, if any, are considered ordinary income distributions.
140
February 28, 2006 (Unaudited) Columbia Funds
Unrealized appreciation and depreciation at February 28, 2006, based on cost of investments for federal income tax purposes, and excluding any unrealized appreciation and depreciation from changes in the value of other assets and liabilities resulting from changes in exchange rates, was:
| Unrealized Appreciation | Unrealized Depreciation | Net Unrealized Appreciation (Depreciation) | |||||||||||||
| Columbia International Stock Fund | $ | 267,761,415 | $ | (14,733,541 | ) | $ | 253,027,874 | ||||||||
| Columbia Mid Cap Growth Fund | 259,922,967 | (11,019,792 | ) | 248,903,175 | |||||||||||
| Columbia Small Cap Growth Fund I | 58,802,688 | (3,946,301 | ) | 54,856,387 | |||||||||||
| Columbia Real Estate Equity Fund | 337,765,092 | (875,678 | ) | 336,889,414 | |||||||||||
| Columbia Technology Fund | 25,735,157 | (3,035,638 | ) | 22,699,519 | |||||||||||
| Columbia Strategic Investor Fund | 98,395,695 | (4,014,319 | ) | 94,381,376 | |||||||||||
| Columbia Balanced Fund | 23,644,397 | (6,853,427 | ) | 16,790,970 | |||||||||||
| Columbia Oregon Intermediate Municipal Bond Fund | 18,101,811 | (325,701 | ) | 17,776,110 | |||||||||||
| Columbia Conservative High Yield Fund | 15,374,641 | (17,477,673 | ) | (2,103,032 | ) | ||||||||||
The following capital loss carryforwards, determined as of August 31, 2005, may be available to reduce taxable income arising from future net realized gains on investments, if any, to the extent permitted by the Internal Revenue Code:
| Year of Expiration | |||||||||||||||||||||||||||||||||||
| 2006 | 2007 | 2008 | 2009 | 2010 | 2011 | 2013 | Total | ||||||||||||||||||||||||||||
| Columbia International Stock Fund | $ | — | $ | 2,960,252 | $ | 3,458,899 | $ | 123,580,370 | $ | 20,382,060 | $ | — | $ | — | $ | 150,381,581 | |||||||||||||||||||
| Columbia Mid Cap Growth Fund | — | — | 5,414,380 | 13,422,695 | — | — | — | 18,837,075 | |||||||||||||||||||||||||||
| Columbia Balanced Fund | — | — | — | — | 19,909,041 | 10,165,186 | — | 30,074,227 | |||||||||||||||||||||||||||
| Columbia Oregon Intermediate Municipal Bond Fund | — | — | — | — | — | — | 751,457 | 751,457 | |||||||||||||||||||||||||||
| Columbia Conservative High Yield Fund | — | — | — | — | 9,535,110 | — | — | 9,535,110 | |||||||||||||||||||||||||||
Of the capital loss carryforwards attributable to Columbia International Stock Fund, $4,440,378 ($2,960,252 expiring August 31, 2007 and $1,480,126 expiring August 31, 2008), $2,638,364 ($1,978,773 expiring August 31, 2008 and $659,591 expiring August 31, 2009) and $143,302,839 ($122,920,779 expiring August 31, 2009 and $20,382,060 expiring August 31, 2010) remain from the Columbia International Stock Fund's merger with Liberty Newport International Equity Fund, Stein Roe International Fund and Columbia International Equity Fund, respectively. Total capital loss carryforwards acquired in the current year from the Columbia International Equity Fund were $252,270,656, of which $83,010,689 were permanently lost and $25,957,128 were utilized to offset current year gains. The availability of a portion of the remaining capital loss carryforwards from the Columbia International Equity Fund may be limited in a given year.
Of the capital loss carryforwards attributable to Columbia Mid Cap Growth Fund, $5,507,368 ($4,130,526 expiring August 31, 2008 and $1,376,842 expiring August 31, 2009) and $13,329,707 ($1,283,854 expiring August 31, 2008 and $12,045,853 expiring August 31, 2009) remain from the Columbia Mid Cap Growth Fund's merger with Liberty Mid Cap Growth Fund and Stein Roe Capital Opportunities Fund, respectively.
141
February 28, 2006 (Unaudited) Columbia Funds
The following capital loss carryforwards were utilized or lost during the year ended August 31, 2005:
| Columbia International Stock Fund | $ | 131,879,054 | |||||
| Columbia Mid Cap Growth Fund | 110,264,080 | ||||||
| Columbia Small Cap Growth Fund I | 97,865,374 | ||||||
| Columbia Technology Fund | 1,968,835 | ||||||
| Columbia Balanced Fund | 36,095,807 | ||||||
| Columbia Conservative High Yield Fund | 6,755,468 | ||||||
Under current tax rules, certain currency and capital losses realized after October 31 may be deferred and treated as occurring on the first day of the following fiscal year. As of August 31, 2005, post-October currency losses and capital losses attributed to security transactions were deferred to September 1, 2005, as follows:
| Currency Losses | Capital Losses | ||||||||||
| Columbia Mid Cap Growth Fund | $ | 99 | $ | — | |||||||
| Columbia Technology Fund | 5,295 | — | |||||||||
Note 4. Fees and Compensation Paid to Affiliates
Investment Advisory Fee
Columbia Management Advisors, LLC ("Columbia"), an indirect, wholly-owned subsidiary of Bank of America Corporation ("BOA"), is the investment advisor to the Funds and provides administrative and other services to the Funds. Prior to September 30, 2005, Columbia Management Advisors, Inc. was investment advisor to the Funds under the same fee structure. On September 30, 2005, Columbia Management Advisors, Inc. merged into Banc of America Capital Management, LLC. At that time, the investment advisor was then renamed Columbia Management Advisors, LLC. Columbia receives a monthly investment advisory fee based on each Fund's average daily net assets at the following annual rates:
| First $200 Million | $200 Million to $500 Million | $500 Million to $1 Billion | $1 Billion to $1.5 Billion | $1.5 Billion to $3 Billion | $3 Billion to $6 Billion | Over $6 Billion | |||||||||||||||||||||||||
| Columbia International Stock Fund | 0.87 | % | 0.87 | % | 0.82 | % | 0.77 | % | 0.72 | % | 0.70 | % | 0.68 | % | |||||||||||||||||
| Columbia Mid Cap Growth Fund | 0.82 | % | 0.82 | % | 0.75 | % | 0.72 | % | 0.67 | % | 0.67 | % | 0.67 | % | |||||||||||||||||
| Columbia Small Cap Growth Fund I | 0.87 | % | 0.87 | % | 0.82 | % | 0.77 | % | 0.77 | % | 0.77 | % | 0.77 | % | |||||||||||||||||
| Columbia Real Estate Equity Fund | 0.75 | % | 0.75 | % | 0.75 | % | 0.75 | % | 0.75 | % | 0.75 | % | 0.75 | % | |||||||||||||||||
| Columbia Technology Fund | 0.87 | % | 0.87 | % | 0.82 | % | 0.77 | % | 0.77 | % | 0.77 | % | 0.77 | % | |||||||||||||||||
| Columbia Strategic Investor Fund | 0.75 | % | 0.75 | % | 0.75 | % | 0.75 | % | 0.75 | % | 0.75 | % | 0.75 | % | |||||||||||||||||
| Columbia Balanced Fund | 0.50 | % | 0.50 | % | 0.50 | % | 0.50 | % | 0.50 | % | 0.50 | % | 0.50 | % | |||||||||||||||||
| Columbia Oregon Intermediate Municipal Bond Fund | 0.50 | % | 0.50 | % | 0.50 | % | 0.50 | % | 0.50 | % | 0.50 | % | 0.50 | % | |||||||||||||||||
| Columbia Conservative High Yield Fund | 0.60 | % | 0.60 | % | 0.55 | % | 0.52 | % | 0.49 | % | 0.49 | % | 0.49 | % | |||||||||||||||||
142
February 28, 2006 (Unaudited) Columbia Funds
For the six months ended February 28, 2006, the annualized effective investment advisory fee rates for the Funds, as a percentage of the Funds' average daily net assets, were as follows:
| Effective Fee Rate | |||||||
| Columbia International Stock Fund | 0.83 | % | |||||
| Columbia Mid Cap Growth Fund | 0.79 | % | |||||
| Columbia Small Cap Growth Fund I | 0.87 | % | |||||
| Columbia Real Estate Equity Fund | 0.75 | % | |||||
| Columbia Technology Fund | 0.87 | % | |||||
| Columbia Strategic Investor Fund | 0.75 | % | |||||
| Columbia Balanced Fund | 0.50 | % | |||||
| Columbia Oregon Intermediate Municipal Bond Fund | 0.50 | % | |||||
| Columbia Conservative High Yield Fund | 0.56 | % | |||||
Pricing and Bookkeeping Fees
Columbia is responsible for providing pricing and bookkeeping services to the Funds under a pricing and bookkeeping agreement. Under a separate agreement (the "Outsourcing Agreement"), Columbia has delegated those functions to State Street Corporation ("State Street"). As a result, the total fees payable under the pricing and bookkeeping agreement are paid by Columbia to State Street.
Under its pricing and bookkeeping agreement with the Funds, Columbia receives an annual fee of $38,000 paid monthly plus an additional monthly fee based on the level of average daily net assets for the month; provided that during any 12-month period, the aggregate fee shall not exceed $140,000.
Prior to November 1, 2005, Columbia received from each Fund an annual financial accounting fee of $25,000, an annual financial reporting fee of $19,965 and a monthly financial accounting fee at the annual rate of 0.02% of the average daily net assets of each Fund. The combined financial accounting and financial reporting fee for a Fund in any year did not exceed $150,000.
The Funds also reimburse Columbia and State Street for out-of-pocket expenses and charges, including fees payable to third parties for pricing each Fund's portfolio securities and direct internal costs incurred by Columbia in connection with providing fund accounting oversight and monitoring and certain other services. For the six months ended February 28, 2006, the annualized effective pricing and bookkeeping fee rates for the Funds, inclusive of out-of-pocket expenses, as a percentage of the Funds' average daily net assets, were as follows:
| Columbia International Stock Fund | 0.013 | % | |||||
| Columbia Mid Cap Growth Fund | 0.018 | % | |||||
| Columbia Small Cap Growth Fund I | 0.043 | % | |||||
| Columbia Real Estate Equity Fund | 0.021 | % | |||||
| Columbia Technology Fund | 0.066 | % | |||||
| Columbia Strategic Investor Fund | 0.031 | % | |||||
| Columbia Balanced Fund | 0.047 | % | |||||
| Columbia Oregon Intermediate Municipal Bond Fund | 0.038 | % | |||||
| Columbia Conservative High Yield Fund | 0.013 | % | |||||
Transfer Agent Fee
Columbia Management Services, Inc. (formerly Columbia Funds Services, Inc.) (the "Transfer Agent"), an affiliate of Columbia and an indirect, wholly-owned subsidiary of BOA, provides shareholder services to the Funds and has contracted with Boston Financial Data Services ("BFDS") to serve as sub-transfer agent. The Transfer Agent is entitled to receive a fee, paid monthly, at the annual rate of $15.23 per open account plus sub-transfer agent fees (exclusive of BFDS fees) calculated based on assets held in omnibus accounts and intended to recover the cost of payments to third parties for services to those accounts. The Transfer Agent may also retain, as additional compensation for its services, fees for wire, telephone and redemption orders, IRA trustee agent fees and account transcript fees due the Transfer Agent from shareholders of th e Fund and credits (net of bank charges) earned with respect to balances in accounts the Transfer Agent
143
February 28, 2006 (Unaudited) Columbia Funds
maintains in connection with its services to the Funds. The Transfer Agent also receives reimbursement for certain out-of-pocket expenses. Prior to November 1, 2005, the Transfer Agent received a monthly fee at the annual rate of $28.00 per open account for each Fund except Columbia Oregon Intermediate Municipal Bond Fund and Columbia Conservative High Yield Fund, which paid $34.00 per open account. The Transfer Agent was also reimbursed for certain out-of-pocket expenses.
Columbia has voluntarily agreed to waive a portion of the transfer agent fees for the Columbia International Stock Fund, Columbia Mid Cap Growth Fund and Columbia Strategic Investor Fund. For the period September 1, 2005 through October 31, 2005, the Transfer Agent voluntarily waived a portion of its fees to reflect the reduced contractual fees charged to the Funds effective November 1, 2005. For the six months ended February 28, 2006, fees waived by the Transfer Agent and the annualized effective fee rates for the Funds, inclusive of out-of-pocket expenses and net of fee waivers, as a percentage of the Funds' average daily net assets, were as follows:
| Transfer Agent Fees Waived | Annualized Effective Fee Rates | ||||||||||
| Columbia International Stock Fund | $ | 315,273 | 0.02 | % | |||||||
| Columbia Mid Cap Growth Fund | 115,187 | 0.07 | % | ||||||||
| Columbia Small Cap Growth Fund I | 2,454 | 0.12 | % | ||||||||
| Columbia Real Estate Equity Fund | 13,205 | 0.09 | % | ||||||||
| Columbia Technology Fund | 4,659 | 0.08 | % | ||||||||
| Columbia Strategic Investor Fund | 58,474 | 0.10 | % | ||||||||
| Columbia Balanced Fund | 15,815 | 0.10 | % | ||||||||
| Columbia Oregon Intermediate Municipal Bond Fund | 7,173 | 0.04 | % | ||||||||
| Columbia Conservative High Yield Fund | 21,371 | 0.06 | % | ||||||||
Underwriting Discounts, Service and Distribution Fees
Columbia Management Distributors, Inc. (the "Distributor"), a subsidiary of Columbia and an indirect, wholly-owned subsidiary of BOA, is the principal underwriter of the Funds. For the six months ended February 28, 2006, the Distributor has retained net underwriting discounts and net CDSC fees as follows:
| Front-End Sales Charge | Contingent Deferred Sales Charge (CDSC) | ||||||||||||||||||||||||||||||||||
| Class A | Class T | Class A | Class B | Class C | Class D | Class G | Class T | ||||||||||||||||||||||||||||
| Columbia International Stock Fund | $ | 10,733 | $ | — | $ | 62 | $ | 26,484 | $ | 2,340 | $ | 25 | $ | 2,094 | $ | — | |||||||||||||||||||
| Columbia Mid Cap Growth Fund | 9,849 | 96 | 1 | 6,029 | 342 | 10 | 569 | — | |||||||||||||||||||||||||||
| Columbia Small Cap Growth Fund I | 971 | — | 100 | — | — | — | — | — | |||||||||||||||||||||||||||
| Columbia Real Estate Equity Fund | 8,261 | — | 3 | 27,503 | 1,454 | 179 | — | — | |||||||||||||||||||||||||||
| Columbia Technology Fund | 41,902 | — | 2,057 | 819 | — | — | — | — | |||||||||||||||||||||||||||
| Columbia Strategic Investor Fund | 67,078 | — | 12 | 56,393 | 4,882 | — | — | — | |||||||||||||||||||||||||||
| Columbia Balanced Fund | 2,771 | — | 1 | 7,429 | 148 | — | — | — | |||||||||||||||||||||||||||
| Columbia Oregon Intermediate Municipal Bond Fund | 655 | — | — | 2,775 | 50 | — | — | — | |||||||||||||||||||||||||||
| Columbia Conservative High Yield Fund | 5,566 | — | 151,169 | 3,080 | 1,113 | — | — | — | |||||||||||||||||||||||||||
144
February 28, 2006 (Unaudited) Columbia Funds
The Funds have adopted a 12b-1 plan (the "Plan") which allows the payment of a monthly service and distribution fee to the Distributor based on the average daily net assets of each Fund at the following annual rates:
| Distribution Fee | |||||||||||||||||||||||||||
| Class A(a) | Class B | Class C | Class D | Class G | Class R | ||||||||||||||||||||||
| Columbia International Stock Fund | — | 0.75 | % | 0.75 | % | 0.75 | % | — | — | ||||||||||||||||||
| Columbia Mid Cap Growth Fund | 0.10 | % | 0.75 | % | 0.75 | % | 0.75 | % | 0.65 | %(b) | 0.50 | % | |||||||||||||||
| Columbia Real Estate Equity Fund | 0.10 | % | 0.75 | % | 0.75 | % | 0.75 | % | — | — | |||||||||||||||||
| Columbia Technology Fund | 0.10 | % | 0.75 | % | 0.75 | % | 0.75 | % | — | — | |||||||||||||||||
| Columbia Strategic Investor Fund | — | 0.75 | % | 0.75 | % | 0.75 | % | — | — | ||||||||||||||||||
| Columbia Balanced Fund | 0.10 | % | 0.75 | % | 0.75 | % | 0.75 | % | — | — | |||||||||||||||||
| Columbia Oregon Intermediate Municipal Bond Fund | 0.10 | % | 0.75 | % | 0.75 | % | 0.75 | % | — | — | |||||||||||||||||
| Columbia Conservative High Yield Fund | 0.10 | % | 0.75 | % | 0.75 | % | 0.75 | % | — | — | |||||||||||||||||
| Service Fee | |||||||||||||||||||||||
| Class A(a) | Class B | Class C | Class D | Class G | |||||||||||||||||||
| Columbia International Stock Fund | 0.25 | % | 0.25 | % | 0.25 | % | 0.25 | % | — | ||||||||||||||
| Columbia Mid Cap Growth Fund | 0.25 | % | 0.25 | % | 0.25 | % | 0.25 | % | 0.50 | %(b) | |||||||||||||
| Columbia Real Estate Equity Fund | 0.25 | % | 0.25 | % | 0.25 | % | 0.25 | % | — | ||||||||||||||
| Columbia Technology Fund | 0.25 | % | 0.25 | % | 0.25 | % | 0.25 | % | — | ||||||||||||||
| Columbia Strategic Investor Fund | 0.25 | % | 0.25 | % | 0.25 | % | 0.25 | % | — | ||||||||||||||
| Columbia Balanced Fund | 0.25 | % | 0.25 | % | 0.25 | % | 0.25 | % | — | ||||||||||||||
| Columbia Oregon Intermediate Municipal Bond Fund | 0.25 | % | 0.25 | % | 0.25 | % | 0.25 | % | — | ||||||||||||||
| Columbia Conservative High Yield Fund | 0.25 | % | 0.25 | % | 0.25 | % | 0.25 | % | — | ||||||||||||||
(a) The Fund's Board of Directors currently limits payments under the Plan for Class A shares to 0.25% annually of the Class A average daily net assets.
(b) The Distributor has contractually agreed to limit a portion of the Class G distribution and service fees so that combined the fee does exceed 0.95% annually of the Class G shares average daily net assets. Of the 0.50% service fee, 0.25% relates to shareholder liaison fees and 0.25% relates to administration support fees.
The Distributor has voluntarily agreed to waive a portion of the Class C and Class D distribution and service fees so that combined these fees do not exceed the annual rates on the average daily net assets of Class C and Class D shares of each Fund as follows:
| Columbia Oregon Intermediate Municipal Bond Fund | 0.65 | % | |||||
| Columbia Conservative High Yield Fund | 0.85 | % | |||||
The CDSC and the distribution fees received from the Plan are used principally as repayment to the Distributor for amounts paid by the Distributor to dealers who sold such shares.
Shareholder Services Fees
The Columbia Mid Cap Growth Fund has adopted shareholder services plans that permit the Fund to pay for certain services provided to Class T shareholders by its financial advisors. The annual service fee may equal up to 0.50% annually for Class T shares, but will not exceed the Fund's net investment income attributable to Class T shares. The Columbia Mid Cap Growth Fund does not intend to pay more than 0.30% for annual Class T shareholder services fees.
Expense Limits and Fee Reimbursements
Columbia has voluntarily agreed to waive fees and reimburse the Columbia Technology Fund for certain expenses so that total expenses (exclusive of service fees, distribution fees, brokerage commissions, interest, taxes and extraordinary expenses, if any) will not exceed 1.65% annually of the Fund's average daily net assets. This arrangement may be revised or discontinued by Columbia at any time.
Custody Credits
Each Fund has an agreement with its custodian bank under which custody fees may be reduced by balance credits. These credits are recorded as a reduction of total expenses on the Statement of Operations. The Funds could have invested a portion of the assets utilized in connection with the expense offset arrangement in an income-producing asset if they had not entered into such an agreement.
145
February 28, 2006 (Unaudited) Columbia Funds
Fees Paid to Officers and Directors
All officers of the Funds, with the exception of the Funds' Chief Compliance Officer, are employees of Columbia or its affiliates and receive no compensation from the Funds. The Board of Trustees has appointed a Chief Compliance Officer to the Funds in accordance with federal securities regulations. The Funds, along with other affiliated funds, pay their pro-rata share of the expenses associated with the Chief Compliance Officer. Each Fund's expenses for the Chief Compliance Officer will not exceed $15,000 per year.
The Funds' Trustees may participate in a deferred compensation plan which may be terminated at any time. Obligations of the plan will be paid solely out of the Funds' assets.
Other
Columbia provides certain services to the Funds related to Sarbanes-Oxley compliance. This amount is included in "Other expenses" on the Statements of Operations. For the six months ended February 28, 2006, the Funds paid fees to Columbia for such services as follows:
| Columbia International Stock Fund | $ | 1,537 | |||||
| Columbia Mid Cap Growth Fund | 1,295 | ||||||
| Columbia Small Cap Growth Fund I | 827 | ||||||
| Columbia Real Estate Equity Fund | 1,244 | ||||||
| Columbia Technology Fund | 1,547 | ||||||
| Columbia Strategic Investor Fund | 1,048 | ||||||
| Columbia Balanced Fund | 892 | ||||||
| Columbia Oregon Intermediate Municipal Bond Fund | 968 | ||||||
| Columbia Conservative High Yield Fund | 1,721 | ||||||
Note 5. Portfolio Information
For the six months ended February 28, 2006, the cost of purchases and proceeds from sales of securities, excluding short-term obligations, were as follows:
| U.S. Government Securities | Other Investment Securities | ||||||||||||||||||
| Purchases | Sales | Purchases | Sales | ||||||||||||||||
| Columbia International Stock Fund | $ | — | $ | — | $ | 804,830,754 | $ | 766,576,473 | |||||||||||
| Columbia Mid Cap Growth Fund | — | — | 172,742,993 | 226,820,280 | |||||||||||||||
| Columbia Small Cap Growth Fund I | — | — | 119,968,051 | 156,055,713 | |||||||||||||||
| Columbia Real Estate Equity Fund | — | — | 35,538,162 | 235,529,432 | |||||||||||||||
| Columbia Technology Fund | — | — | 202,563,256 | 135,553,643 | |||||||||||||||
| Columbia Strategic Investor Fund | — | — | 121,577,660 | 139,540,657 | |||||||||||||||
| Columbia Balanced Fund | 15,325,781 | 23,117,769 | 57,142,199 | 88,400,449 | |||||||||||||||
| Columbia Oregon Intermediate Municipal Bond Fund | — | — | 5,769,848 | 17,416,276 | |||||||||||||||
| Columbia Conservative High Yield Fund | — | — | 210,034,085 | 427,231,493 | |||||||||||||||
For the six months ended February 28, 2006, Columbia Technology Fund had transactions in written options as follows:
| Number of Contracts | Premium Received | ||||||||||
| Options Outstanding at August 31, 2005 | 40 | $ | 3,680 | ||||||||
| Options Closed | (40 | ) | (3,680 | ) | |||||||
| Options Outstanding at February 28, 2006 | — | $ | — | ||||||||
Note 6. Redemption Fees
The Columbia International Stock Fund imposes a 2.00% redemption fee to shareholders of the Fund who redeem shares held for 60 days or less. Redemption fees, which are retained by the Fund, are accounted for as an addition to paid-in capital and are allocated to each class proportionately for purposes of determining the net asset value of each class. For the six months ended February 28, 2006, the redemption fees for the Class A, Class B, Class C, Class D, Class G and Class Z shares of the Columbia International Stock Fund amounted to $2,893, $635, $268, $12, $59 and $15,340 respectively.
146
February 28, 2006 (Unaudited) Columbia Funds
Note 7. Line of Credit
The Funds and other affiliated funds participate in a $350,000,000 committed unsecured revolving line of credit provided by State Street Bank and Trust Company. Borrowings are used for temporary or emergency purposes to facilitate portfolio liquidity. Interest is charged to each participating fund based on its borrowings at a rate per annum equal to the Federal Funds rate plus 0.50%. In addition, a commitment fee of 0.10% per annum is accrued and apportioned among the participating funds based on their pro-rata portion of the unutilized line of credit. The commitment fee is included in "Other expenses" on the Statements of Operations.
For the six months ended February 28, 2006, the average daily loan balance outstanding on days where borrowings existed for the International Stock Fund was $5,535,714 at a weighted average interest rate of 4.80%.
For the six months ended February 28, 2006, the average daily loan balance outstanding on days where borrowings existed for the Columbia Small Cap Growth Fund I was $1,000,000 at a weighted average interest rate of 4.75%.
For the six months ended February 28, 2006, the average daily loan balance outstanding on days where borrowings existed for the Columbia Real Estate Equity Fund was $3,000,000 at a weighted average interest rate of 5.00%.
For the six months ended February 28, 2006, the Funds, other than the Columbia International Stock Fund, Columbia Small Cap Growth Fund I and Columbia Real Estate Equity Fund did not borrow under this arrangement.
Note 8. Shares of Beneficial Interest
As of February 28, 2006, the Funds had shareholders whose shares were beneficially owned by participant accounts over which Bank of America and/or its affiliates had either sole or joint investment discretion.
Subscription and redemption activity in these accounts may have a significant effect on the operations of the Funds. The numbers of such accounts and the percentage of shares of beneficial interest outstanding held therein are as follows:
| Number of Shareholders | % of Shares Outstanding Held | ||||||||||
| Columbia International Stock Fund | 1 | 63.0 | % | ||||||||
| Columbia Mid Cap Growth Fund | 1 | 23.9 | |||||||||
| Columbia Small Cap Growth Fund I | 1 | 6.0 | |||||||||
| Columbia Real Estate Equity Fund | 1 | 24.3 | |||||||||
| Columbia Strategic Investor Fund | 1 | 5.3 | |||||||||
| Columbia Conservative High Yield Fund | 1 | 44.8 | |||||||||
In addition, as of February 28, 2006, several of the Funds had other shareholders that held greater than 5% of the shares outstanding. Subscription and redemption activity of these accounts may have a significant effect on the operations of the Funds. The number of such accounts and the percentage of shares of beneficial interest outstanding held therein are as follows:
| Number of Shareholders | % of Shares Outstanding Held | ||||||||||
| Columbia Mid Cap Growth Fund | 1 | 11.8 | % | ||||||||
| Columbia Small Cap Growth Fund I | 1 | 20.8 | |||||||||
| Columbia Real Estate Equity Fund | 2 | 26.3 | |||||||||
| Columbia Strategic Investor Fund | 1 | 15.4 | |||||||||
| Columbia Balanced Fund | 1 | 16.1 | |||||||||
| Columbia Conservative High Yield Fund | 3 | 17.0 | |||||||||
147
February 28, 2006 (Unaudited) Columbia Funds
Note 9. Disclosure of Significant Risks and Contingencies
Concentration of Credit Risk
Columbia Oregon Intermediate Municipal Bond Fund holds investments that are insured by private insurers who guarantee the payment of principal and interest in the event of default or that are supported by a letter of credit. The insurers are rated Aaa by Moody's Investors Services, Inc.
At February 28, 2006, private insurers who insured greater than 5% of the total investments of the Columbia Oregon Intermediate Municipal Bond Fund were as follows:
| Columbia Oregon Municipal Bond Fund | |||
Insurer | % of Total Investments | ||||||
| Financial Guaranty Insurance Co. | 13.7 | % | |||||
| MBIA Insurance Corp. | 12.1 | ||||||
| Financial Security Assurance, Inc. | 11.7 | ||||||
| Ambac Assurance Corp. | 6.7 | ||||||
Foreign Securities
There are certain additional risks involved when investing in foreign securities that are not inherent with investments in domestic securities. These risks may involve foreign currency exchange rate fluctuations, adverse political and economic developments and the possible prevention of currency exchange or other foreign governmental laws or restrictions. In addition, the liquidity of foreign securities may be more limited than that of domestic securities.
Investments in emerging market countries are subject to additional risk. The risk of foreign investments is typically increased in less developed countries. These countries are also more likely to experience high levels of inflation, deflation or currency devaluation which could hurt their economies and securities markets.
Geographic Concentration
Columbia Oregon Intermediate Municipal Bond Fund has greater than 5% of its total investments on February 28, 2006 invested in debt obligations issued by the state of Oregon and its political subdivisions, agencies and public authorities. This Fund is more susceptible to economic and political factors adversely affecting issuers of the state's municipal securities than are municipal bond funds that are not concentrated to the same extent in these issuers.
High-Yield Securities
Investing in high-yield securities may involve greater credit risk and considerations not typically associated with investing in U.S. government bonds and other higher quality fixed income securities. These securities are non-investment grade securities, often referred to as "junk" bonds. Economic downturns may disrupt the high yield market and impair the ability of issuers to repay principal and interest. Also, an increase in interest rates would likely have an adverse impact on the value of such obligations. Moreover, high-yield securities may be less liquid to the extent that there is no established secondary market.
Industry Focus
The Funds may focus its investments in certain industries, subjecting them to greater risk than a fund that is more diversified.
Issuer Focus
As non-diversified funds, the Columbia Real Estate Equity Fund, the Columbia Technology Fund and the Columbia Oregon Intermediate Municipal Bond Fund may invest a greater percentage of their total assets in the securities of fewer issuers than a diversified fund. The Funds may, therefore, have a greater risk of loss from a few issuers than a similar fund that invests more broadly.
Legal Proceedings
On February 9, 2005, Columbia Management Advisors, Inc. (which has since merged into Banc of America Capital Management, LLC (now named Columbia Management Advisors, LLC)) ("Columbia") and Columbia Funds Distributor, Inc. (which has been renamed Columbia Management Distributors, Inc.) (the "Distributor") (collectively, the "Columbia Group") entered into an Assurance of Discontinuance with the New York Attorney General ("NYAG") (the "NYAG Settlement") and consented to the entry of a cease-and-desist order by the Securities and Exchange Commission ("SEC") (the "SEC Order"). The SEC Order and the NYAG Settlement are referred to collectively as the "Settlements". The Settlements contain substantially the same terms and conditions as
148
February 28, 2006 (Unaudited) Columbia Funds
outlined in the agreements in principle which Columbia Group entered into with the SEC and NYAG in March 2004.
Under the terms of the SEC Order, the Columbia Group has agreed among other things, to: pay $70 million in disgorgement and $70 million in civil money penalties; cease and desist from violations of the antifraud provisions and certain other provisions of the federal securities laws; maintain certain compliance and ethics oversight structures; retain an independent consultant to review the Columbia Group's applicable supervisory, compliance, control and other policies and procedures; and retain an independent distribution consultant (see below). The Columbia Funds have also voluntarily undertaken to implement certain governance measures designed to maintain the independence of their boards of trustees. The NYAG Settlement also, among other things, requires Columbia and its affiliates to reduce certain Columbia Funds (including the former Nations Funds) and other mutual funds management fees collectively by $32 million per year fo r five years, for a projected total of $160 million in management fee reductions.
Pursuant to the procedures set forth in the SEC order, the $140 million in settlement amounts described above will be distributed in accordance with a distribution plan developed by an independent distribution consultant and agreed to by the staff of the SEC. The independent distribution consultant has been in consultation with the Staff, and has submitted a draft proposed plan of distribution, but has not yet submitted a final proposed plan of distribution.
As a result of these matters or any adverse publicity or other developments resulting from them, there may be increased redemptions or reduced sales of fund shares, which could increase transaction costs or operating expenses, or have other adverse consequences for the funds.
A copy of the SEC Order is available on the SEC website at http://www.sec.gov. A copy of the NYAG Settlement is available as part of the Bank of America Corporation Form 8-K filing on February 10, 2005.
In connection with the events described in detail above, various parties have filed suit against certain funds, the Trustees of the Columbia Funds, FleetBoston Financial Corporation and its affiliated entities and/or Bank of America and its affiliated entities.
On February 20, 2004, the Judicial Panel on Multidistrict Litigation transferred these cases and cases against several other mutual fund companies based on similar allegations to the United States District Court in Maryland for consolidated or coordinated pretrial proceedings (the "MDL"). Subsequently, additional related cases were transferred to the MDL. On September 29, 2004, the plaintiffs in the MDL filed amended and consolidated complaints. One of these amended complaints is a putative class action that includes claims under the federal securities laws and state common law, and that names Columbia, the Distributor, the Trustees of the Columbia Funds, Bank of America Corporation and others as defendants. Another of the amended complaints is a derivative action purportedly on behalf of the Columbia Funds that asserts claims under federal securities laws and state common law.
On February 25, 2005, Columbia and other defendants filed motions to dismiss the claims in the pending cases. On March 1, 2006, for reasons stated in the court's memoranda dated November 3, 2005, the U.S. District Court for the District of Maryland granted in part and denied in part the defendants' motions to dismiss. The court dismissed all of the class action claims pending against the Columbia Funds. As to Columbia, the Distributor and the Trustees of the Columbia Funds, the claims under the Securities Act of 1933, the claims under Sections 34(b) and 36(a) of the Investment Company Act of 1940 (ICA) and the state law claims were dismissed. The claims under Sections 10(b) and 20(a) of the Securities Exchange Act of 1934 and claims under Section 36(b) of the ICA along with related claims under Section 48(a) of the ICA were not dismissed.
On March 21, 2005 purported class action plaintiffs filed suit in Massachusetts state court alleging that the conduct, including market timing, entitles Class B shareholders in certain Columbia funds to an exemption from contingent deferred sales charges upon early redemption ("the CDSC Lawsuit"). The CDSC Lawsuit has been removed to federal court in Massachusetts and the federal Judicial Panel has transferred the CDSC Lawsuit to the MDL.
The MDL is ongoing. Accordingly, an estimate of the financial impact of this litigation on any fund, if any, cannot currently be made.
In 2004, certain Columbia funds, the Trustees of the Columbia Funds, advisers and affiliated entities were named as defendants in certain purported shareholder
149
February 28, 2006 (Unaudited) Columbia Funds
class and derivative actions making claims, including claims under the Investment Company and the Investment Advisers Acts of 1940 and state law. The suits allege, inter alia, that the fees and expenses paid by the funds are excessive and that the advisers and their affiliates inappropriately used fund assets to distribute the funds and for other improper purpose. On March 2, 2005, the actions were consolidated in the Massachusetts federal court as In re Columbia Entities Litigation. The plaintiffs filed a consolidated amended complaint on June 9, 2005. On November 30, 2005, the judge dismissed all claims by plaintiffs and ordered that the case be closed. The plaintiffs filed a notice of appeal on December 30, 2005 and this appeal is pending.
For the six months ended February 28, 2006, Columbia has assumed legal, consulting services and Trustees' fees incurred by the Funds in connection with these matters as follows:
| Columbia International Stock Fund | $ | 7,937 | |||||
| Columbia Mid Cap Growth Fund | 5,217 | ||||||
| Columbia Small Cap Growth Fund I | 1,264 | ||||||
| Columbia Real Estate Equity Fund | 4,613 | ||||||
| Columbia Technology Fund | 531 | ||||||
| Columbia Strategic Investor Fund | 3,066 | ||||||
| Columbia Balanced Fund | 1,792 | ||||||
| Columbia Oregon Intermediate Municipal Bond Fund | 2,462 | ||||||
| Columbia Conservative High Yield Fund | 8,484 | ||||||
Note 10. Business Combinations & Mergers
Business Combinations and Mergers
On October 7, 2005, the Columbia Newport Tiger Fund, a series of a separate Massachusetts business trust, merged into the Columbia International Stock Fund. The Columbia International Stock Fund received a tax-free transfer of assets from the Columbia Newport Tiger Fund as follows:
| Shares Issued | Net Assets Received | Unrealized Appreciation1 | |||||||||
| 17,616,768 | $ | 280,994,524 | $ | 21,800,458 | |||||||
| Net Assets of Columbia International Stock Fund Prior to Combination | Net Assets of Columbia Newport Tiger Fund Immediately Prior to Combination | Net Assets of Columbia International Stock Fund Immediately After Combination | |||||||||
| $ | 1,061,242,112 | $ | 280,994,524 | $ | 1,342,236,636 | ||||||
1 Unrealized appreciation is included in the Net Assets Received amount shown above.
Note 11. Subsequent Event
After the close of business on March 24, 2006, the Funds will be re-domiciled as a new series of the Columbia Funds Series Trust I. Columbia Funds Series Trust I is a Massachusetts business trust registered under the Investment Company Act of 1940, as amended, as an open-end management investment company.
150
BOARD CONSIDERATION AND APPROVAL OF INVESTMENT ADVISORY AGREEMENTS
Columbia Funds
The Advisory Fees and Expenses Committee of the Board of Trustees meets one or more times annually, usually in late summer, to review the advisory agreements (collectively, the "Agreements") of the funds for which the Trustees serve as trustees or directors (each a "fund") and determine whether to recommend that the full Board approve the continuation of the Agreements for an additional one-year period. After the Committee has made its recommendation, the full Board, including the Independent Trustees, determines whether to approve the continuation of the Agreements. In addition, the Board, including the Independent Trustees, considers matters bearing on the Agreements at most of its other meetings throughout the year and meets regularly with the heads of each investment area within Columbia. The Trustees also meet with selected fund portfolio managers at various times throughout the year.
The Trustees receive and review all materials that they, their legal counsel or Columbia, the funds' investment adviser, believe to be reasonably necessary for the Trustees to evaluate the Agreements and determine whether to approve the continuation of the Agreements. Those materials generally include, among other items, (i) information on the investment performance of each fund relative to the performance of peer groups of mutual funds and the fund's performance benchmarks, (ii) information on each fund's advisory fees and other expenses, including information comparing the fund's expenses to those of peer groups of mutual funds and information about any applicable expense caps and fee "breakpoints," (iii) sales and redemption data, (iv) information about the profitability of the Agreements to Columbia, and potential "fall-out" or ancillary benefits that Columbia and its affiliates may receive as a result of their relationships with the funds and (v) information obtained through Columbia's response to a questionnaire prepared at the request of the Trustees by counsel to the funds and independent legal counsel to the Independent Trustees. The Trustees also consider other information such as (vi) Columbia's financial results and financial condition, (vii) each fund's investment objective and strategies and the size, education and experience of Columbia's investment staffs and their use of technology, external research and trading cost measurement tools, (viii) the allocation of the funds' brokerage, if any, including allocations to brokers affiliated with Columbia and the use of "soft" commission dollars to pay fund expenses and to pay for research products and services, (ix) Columbia's resources devoted to, and its record of compliance with, the funds' investment policies and restrictions, policies on personal securities transactions and other compliance polici es, (x) Columbia's response to various legal and regulatory proceedings since 2003 and (xi) the economic outlook generally and for the mutual fund industry in particular. In addition, the Trustees confer with their independent fee consultant and review materials relating to the Agreements that the independent fee consultant provides. Throughout the process, the Trustees have the opportunity to ask questions of and request additional materials from Columbia and to consult independent legal counsel to the Independent Trustees.
The Board of Trustees most recently approved the continuation of the Agreements at its October, 2005 meeting, following meetings of the Advisory Fees and Expenses Committee held in August, September, and October, 2005. In considering whether to approve the continuation of the Agreements, the Trustees, including the Independent Trustees, did not identify any single factor as determinative, and each weighed various factors as he or she deemed appropriate. The Trustees considered the following matters in connection with their approval of the continuation of the Agreements:
The nature, extent and quality of the services provided to the funds under the Agreements. The Trustees considered the nature, extent and quality of the services provided by Columbia and its affiliates to the funds and the resources dedicated to the funds by Columbia and its affiliates. Among other things, the Trustees considered (i) Columbia's ability, including its resources, compensation programs for personnel involved in fund management, reputation and other attributes, to attract and retain highly qualified research, advisory and supervisory investment professionals; (ii) the portfolio management services provided by those investment professionals; and (iii) the trade execution services provided on behalf of the funds. For each fund, the Trustees also considered the benefits to shareholders of investing in a mutual fund that is part of a family o f funds offering exposure to a variety of asset classes and investment disciplines and providing for a variety of fund and shareholder services. After reviewing those and related factors, the Trustees concluded, within the context of their overall conclusions regarding each of the Agreements, that the
151
Columbia Funds
nature, extent and quality of services provided supported the continuation of the Agreements.
Investment performance of the funds and Columbia. The Trustees reviewed information about the performance of each fund over various time periods, including information prepared by an independent third party that compared the performance of each fund to the performance of peer groups of mutual funds and performance benchmarks. The Trustees also reviewed a description of the third party's methodology for identifying each fund's peer group for purposes of performance and expense comparisons. The Trustees also considered additional information that the Advisory Fees and Expenses Committee requested from Columbia relating to funds that presented relatively weaker performance and/or relatively higher expenses.
In the case of each fund that had performance that lagged that of a relevant peer group for certain (although not necessarily all) periods, the Trustees concluded that other factors relevant to performance were sufficient, in light of other considerations, to warrant continuation of the fund's Agreements. Those factors varied from fund to fund, but included one or more of the following: (i) that the fund's performance, although lagging in certain recent periods, was stronger over the longer term; (ii) that the underperformance was attributable, to a significant extent, to investment decisions that were reasonable and consistent with the fund's investment strategy and policies and that the fund was performing as expected, given market conditions and the fund's investment strategy; (iii) that the fund's performance was competitive when compared to other relevant performance benchmarks or peer groups; (iv) that Columbia had taken o r was taking steps designed to help improve the fund's investment performance, including, but not limited to, replacing portfolio managers or modifying investment strategies; (v) that the fund's advisory fee had recently been, or was proposed to be, reduced, with the goal of helping the fund's net return to shareholders become more competitive; and (vi) that other fund expenses, such as transfer agency or fund accounting fees, have recently been reduced, with the goal of helping the fund's net return to shareholders become more competitive.
The Trustees also considered Columbia's performance and reputation generally, the funds' performance as a fund family generally, and Columbia's historical responsiveness to Trustee concerns about performance and Columbia's willingness to take steps intended to improve performance.
After reviewing those and related factors, the Trustees concluded, within the context of their overall conclusions regarding each of the Agreements, that the performance of each fund and Columbia was sufficient, in light of other considerations, to warrant the continuation of the Agreements.
The costs of the services provided and profits realized by Columbia and its affiliates from their relationships with the funds. The Trustees considered the fees charged to the funds for advisory services as well as the total expense levels of the funds. That information included comparisons (provided both by management and by an independent third party) of the funds' advisory fees and total expense levels to those of their peer groups and information about the advisory fees charged by Columbia to comparable accounts. In considering the fees charged to comparable accounts, the Trustees took into account, among other things, management's representations about the differences between managing mutual funds as compared to other types of accounts, including the additional resources required to effectively manage mutual funds and distribute mutual fund share s. In evaluating each fund's advisory fees, the Trustees also took into account the demands, complexity and quality of the investment management of the fund. The Trustees considered reductions in advisory fee rates, implementation of advisory fee breakpoints, institution of advisory fee waivers, and changes to expense caps, which benefited a number of the funds. Furthermore, the Trustees considered the projected impact on expenses resulting from the overall cost reductions that management anticipated would result from the shift to a common group of service providers for transfer agency, fund accounting and custody services for mutual funds advised by Bank of America affiliates. The Trustees also noted management's stated justification for the fees charged to the funds, which included information about the performance of the funds, the services provided to the funds and management's view as to why it was appropriate that some funds bear advisory fees or total expenses greater than their peer group medians.
The Trustees also considered the compensation directly or indirectly received by Columbia and its affiliates from their relationships with the funds. The Trustees reviewed information provided by management as to
152
Columbia Funds
the profitability to Columbia and its affiliates of their relationships with the funds, and information about the allocation of expenses used to calculate profitability. When reviewing profitability, the Trustees also considered court cases in which adviser profitability was an issue in whole or in part, the performance of the relevant funds, the expense levels of the funds, and whether Columbia had implemented breakpoints and/or expense caps with respect to the funds.
After reviewing those and related factors, the Trustees concluded, within the context of their overall conclusions regarding each of the Agreements, that the advisory fees charged to each of the funds were fair and reasonable, and that the costs of the advisory services generally, and the related profitability to Columbia and its affiliates of their relationships with the funds, supported the continuation of the Agreements.
Economies of Scale. The Trustees considered the existence of any economies of scale in the provision of services by Columbia to each fund and whether those economies were shared with the fund through breakpoints in the investment advisory fees or other means, such as expense waivers. The Trustees noted that many of the funds benefited from breakpoints, expense caps, or both. In considering those issues, the Trustees also took note of the costs of the services provided (both on an absolute and a relative basis) and the profitability to Columbia and its affiliates of their relationships with the funds, as discussed above.
After reviewing those and related factors, the Trustees concluded, within the context of their overall conclusions regarding each of the Agreements, that the extent to which economies of scale were shared with the funds supported the continuation of the Agreements.
Other Factors. The Trustees also considered other factors, which included but were not limited to the following:
• the extent to which each fund had operated in accordance with its investment objective and its record of compliance with its investment restrictions, and the compliance programs of the funds and Columbia. They also considered the compliance-related resources that Columbia and its affiliates were providing to the funds.
• the nature, quality, cost and extent of administrative and shareholder services performed by Columbia and its affiliates, both under the Agreements and under separate agreements for the provision of transfer agency and administrative services.
• so-called "fall-out benefits" to Columbia, such as the engagement of its affiliates to provide distribution, brokerage and transfer agency services to the funds, and the benefits of research made available to Columbia by reason of brokerage commissions generated by the funds' securities transactions, as well as possible conflicts of interest associated with those fall-out and other benefits, and the reporting, disclosure and other processes in place to disclose and monitor those possible conflicts of interest.
• the draft report provided by the independent fee consultant, which included information about and analysis of the funds' fees, expenses and performance.
Based on their evaluation of all factors that they deemed to be material, including those factors described above, and assisted by the advice of independent counsel and the independent fee consultant, the Trustees, including the Independent Trustees, approved the continuance of each of the Agreements through October 31, 2006.
153
SUMMARY OF MANAGEMENT FEE EVALUATION
BY INDEPENDENT FEE CONSULTANT
Columbia Funds
Prepared Pursuant to the February 9, 2005
Assurance of Discontinuance
between the Office of
Attorney General of New York State and
Columbia Management Advisors, Inc. and
Columbia Funds Distributor, Inc.
October 11, 2005
I. Overview
Columbia Management Advisors, Inc. ("CMA") and Columbia Funds Distributors, Inc. ("CFD") (CFD together with CMA referred to herein as Columbia Management Group or "CMG1"), entered into an agreement with the New York Attorney General's Office in the form of an Assurance of Discontinuance (the "AOD"). The AOD stipulated that CMA would be permitted to manage or advise the Columbia Funds only if the Independent Members (as such term is defined in the AOD) of the Columbia Funds' Board of Trustees/Directors (collectively the "Trustees") appointed a Senior Officer or an Independent Fee Consultant ("IFC") who, among other things, is to manage the process by which management fees are negotiated. On May 15, 2005, the Independent Members of the Board appointed me as the IFC for the Columbia Funds. This report is the annual written evaluation of the Columbia Funds for 2005 that I have prepared in my capacity as IFC, as required b y the AOD.
A. Duties of the Independent Fee Consultant
As part of the AOD, the Independent Members of the Columbia Funds' Board of Trustees/Directors agreed to retain an independent fee consultant who was to participate in the management fee negotiation process. The IFC is charged with "... duties and responsibilities [that] include managing the process by which proposed management fees (including, but not limited to, advisory fees) to be charged the Columbia Fund[s] are negotiated so that they are negotiated in a manner which is at arms length and reasonable and consistent with this Assurance of Discontinuance." However, the IFC does not replace the Trustees in their role of negotiating management and other fees with CMG and its affiliates. In particular, the AOD states that "Columbia Advisors may manage or advise a Columbia Fund only if the reasonableness of the proposed management fees is determined by the Bo ard of Trustees of the Columbia Fund using ... an annual independent written evaluation prepared by or under the direction of the ... Independent Fee Consultant...." This report, pursuant to the AOD, constitutes the "annual independent written evaluation prepared by or under the direction of the... Independent Fee Consultant."
The AOD requires the IFC report to consider at least the following:
a) Management fees (including any components thereof) charged by other mutual fund companies for like services;
b) Management fees (including any components thereof) charged to institutional and other clients of CMA for like services;
c) Costs to CMA and its affiliates of supplying services pursuant to the management fee agreements, excluding any intra-corporate profit;
d) Profit margins of CMA and its affiliates from supplying such services;
e) Possible economies of scale as the CMA fund grows larger; and
f) The nature and quality of CMA services, including Columbia Funds' performance.
This report is designed to assist the Board in evaluating the 2005 contract renewal for Columbia Funds. In addition, this report points out areas where the Board may deem additional information and analysis to be appropriate over time.
B. Sources of Information Used in My Evaluation
I have requested data from CMG and various third party industry data sources or independent research companies that work in the mutual fund arena. The following list generally describes the types of information I requested.
1. I collected data on performance, management fees, and expense ratios of both Columbia Funds and
1 Prior to the date of this report, CMA merged into an affiliated entity, Banc of America Capital Management, LLC ("BACAP"), and BACAP then changed its name to Columbia Management Advisors, LLC which carries on the business of CMA, and CFD changed its name to Columbia Management Distributors, Inc.
154
Columbia Funds
comparable non-Columbia Funds. The sources of this information were CMG, Lipper Inc. ("Lipper") and Morningstar Inc. ("Morningstar"). While Lipper and Morningstar each selected a different group of peer funds it deemed appropriate against which to measure the relative performance and fees of Columbia Funds, I conducted an independent review of the appropriateness of each peer group.
2. I reviewed data on CMG's expense and profitability that I obtained from CMA directly.
3. I have reviewed data on the organizational structure of CMG in general.
4. I collected information on profitability from Strategic Insight Mutual Fund Research and Consulting, LLC ("Strategic Insight"). I used this third-party independent research as an additional method to gauge the accuracy of the data collected in (2) above.
5. I conducted interviews with various CMG staff, including members of the senior management team, legal staff, heads of affiliates, portfolio managers, and financial personnel.
6. I reviewed current 2005 Section 15(c) material provided to the Board and material presented to the Board in the 2004 fee and performance evaluation.
7. I have reviewed various academic research papers, industry publications, and other available literature dealing with mutual fund operations, profitability, and other issues. In addition, I have reviewed SEC releases and studies of mutual fund expenses.
8. I have reviewed documents pertaining to recent mutual fund litigation in general and publicly available information about litigation where CMG has been involved.
In addition, I have engaged NERA Economic Consulting ("NERA") and independent consultant Dr. John Rea to assist me in data management and analysis. Both NERA and Dr. Rea have extensive experience in the mutual fund industry through consulting, government positions, or industry trade groups that provide unique insights and special knowledge pertaining to my independent analysis of fees, performance, and profitability. I have also retained Shearman & Sterling LLP as outside counsel to advise me in connection with my review.
C. Qualifications and Independence
I am the Walter H. Carpenter Chair and Professor of Finance at Babson College. Before this I was the Chief Economist of the U.S. Securities and Exchange Commission. I have no material relationship with Bank of America or CMG aside from acting as IFC, and am aware of no relationship with any of their affiliates. [Resume omitted]
II. EVALUATION OF THE GENERAL PROCESS USED TO NEGOTIATE THE ADVISORY CONTRACT
A. General Considerations
My analysis considered all factors and information I reviewed on the finances and operations of Columbia Funds. I gave each factor an appropriate weight in my overall findings, and no single factor was in itself the sole criterion for a finding or conclusion. My objective was to assess all of the information provided and conduct a robust evaluation of Columbia Funds' operations, fees, and performance.
My analysis and thought processes will and, I believe, should, differ in certain ways from the processes used by Trustees in their evaluation of the management agreements. In particular, because of my technical and quantitative background, I may use techniques and data that Trustees have not previously felt would be useful. I view this supplemental analysis as appropriate because my role is to assist Trustees in their decisions, and to the extent that I bring new ideas or analysis to the evaluation, I believe this improves the process by which management fees for the Columbia Funds may be negotiated in accordance with the AOD.
Finally, as part of my role as IFC, I have, from time to time, sent to Trustees additional papers and reports produced by third parties that I felt had bearing on the fee negotiation process. I viewed these materials as educational in nature and felt they would aid Trustees in placing their work in context.
B. CMG Management Interviews
As a starting point of my analysis, I have met with members of CMG staff to gain an understanding of the organizational structure and personnel involved in running the Columbia fund family.
I have had general discussions and have received information about the management structure of CMG.
155
Columbia Funds
My conversations with management have been informative. In addition, I have participated in Board meetings where Trustees and management have discussed issues relating to management agreements and performance of Columbia Funds. When I felt it was appropriate, I added my opinions on particular matters, such as fund performance or fee levels, to the discussion.
C. Trustees' Fee and Performance Evaluation Process
After making initial requests for information, members of the Trustees of the Columbia Funds met in advance of the October Section 15(c) contract approval meeting to review certain fee, performance and other data for the Columbia Funds and to ask questions and make requests of management. Trustees have developed a process to evaluate the fee and expense levels and performance of Columbia Funds. This process is used to highlight those funds that have been performing poorly, may have had higher management fees or expense ratios, or both.
The process involves providing instructions to Lipper to prepare specific data analyses tailored to the Trustees review framework. These instructions include highlighting funds that hit one or more fee performance "screens." The six screens the Trustees use are as follows:
a. 5th Lipper quintile in actual management fee;
b. 5th Lipper quintile in total expense ratio;
c. Three or more 5th Lipper quintile rankings in the 1-, 3-, 5- or 10-year performance rankings;
d. Sum of the Lipper Quintile Rank (1-year performance) and the Lipper Quintile Rank (actual management fee) totals a number equal to or higher than 8;
e. Sum of the Lipper Quintile Rank (1-year performance) and the Lipper Quintile Rank (total expense ratio) totals a number equal to or higher than 8; and
f. Sum of the Lipper Quintile Rank (3-year performance) and the Lipper Quintile Rank (total expense ratio) totals a number equal to or higher than 8.
If a fund hits one or more of these screens, it is highlighted for additional review by the Trustees. This method is only used as an aid for Trustees to highlight funds and is not the sole test of whether the Board will determine to take particular actions concerning fees or performance. Funds that have not been flagged by this screen also may be singled out for fee and performance reasons, and the Trustees may determine not to take action with respect to the fees or performance of funds that have been flagged by the screen. These screens contribute to the basis for discussions on Trustees' views on the Columbia Funds.
III. FINDINGS
My findings based on my work as IFC are as follows:
1. The Trustees have the relevant information necessary to form an opinion on the reasonableness of fees and evaluate the performance of the Columbia Funds. The process the Trustees used in preparing to reach their determination has been open and informative. In my view, the 2005 process by which the management fees of the Columbia Funds have been negotiated thus far has been, to the extent practicable, at arm's length and reasonable and consistent with the AOD.
2. Columbia Funds demonstrated a range of performance relative to their peers. I find that across the fund complex, 54.26 percent of Columbia Funds have performance higher than the median of their respective Lipper performance universe, and 42.55 percent of Columbia Funds have performance higher than the median of their respective Lipper performance group. In addition, Lipper performance universe and group comparison showed that Columbia Funds were distributed roughly evenly across these quintiles. The Trustees have worked with management to address issues of funds that have demonstrated consistent or significant underperformance.
3. Columbia Funds demonstrate a range of management fees and expense ratios relative to their peers. I find that across the fund complex, 58.51 percent of Columbia Funds have expenses below the median of their Lipper expense universe, and 53.19 percent of Columbia Funds have expenses below the median of their Lipper expense group. In addition, Lipper expense universe and group comparisons show that Columbia Funds are distributed roughly evenly across these quintiles. The Trustees have taken steps to limit shareholder expenses for certain funds having management fees significantly above their peers, often though the use of fee waivers to which CMG has agreed.
156
Columbia Funds
Consolidation of various funds and fund families managed by CMG has resulted in substantial savings in non-advisory expenses.
4. Profitability to CMG of the individual funds ranges widely, but the overall profitability to CMG of its relationship with the Columbia Funds appears to fall within a reasonable range. The method of cost allocation to funds is addressed in the material provided by CMG to the Trustees, but additional information may be necessary to make a judgment on fund level profitability. My review of profitability and cost allocation is ongoing, and I plan to continue to develop my views with regard to fund level profitability.
5. Columbia Funds have instituted fee schedules with breakpoints designed to enable investors to benefit from fund economies of scale, although 71% of the funds have not yet reached their first breakpoint. My analysis of the appropriateness of the breakpoint levels, which I expect will take into account the cost and profitability of the individual funds, is ongoing.
My work is ongoing and my views may develop over time in light of new information and analysis.
Respectfully submitted,
Erik R. Sirri
157
COLUMBIA FUNDS
Columbia Funds
| Growth funds | Columbia Acorn Fund | ||||||
| Columbia Acorn Select | |||||||
| Columbia Acorn USA | |||||||
| Columbia Growth Stock Fund | |||||||
| Columbia Large Cap Growth Fund | |||||||
| Columbia Marsico 21st Century Fund | |||||||
| Columbia Marsico Focused Equities Fund | |||||||
| Columbia Marsico Growth Fund | |||||||
| Columbia Marsico Mid Cap Growth Fund | |||||||
| Columbia Mid Cap Growth Fund | |||||||
| Columbia Small Cap Growth Fund I | |||||||
| Columbia Small Cap Growth Fund II | |||||||
| Columbia Small Company Equity Fund | |||||||
| Core funds | Columbia Common Stock Fund | ||||||
| Columbia Large Cap Core Fund | |||||||
| Columbia Small Cap Core Fund | |||||||
| Columbia Young Investor Fund | |||||||
| Value funds | Columbia Disciplined Value Fund | ||||||
| Columbia Dividend Income Fund | |||||||
| Columbia Large Cap Value Fund | |||||||
| Columbia Mid Cap Value Fund | |||||||
| Columbia Small Cap Value Fund I | |||||||
| Columbia Small Cap Value Fund II | |||||||
| Columbia Strategic Investor Fund | |||||||
| Asset Allocation/Hybrid funds | Columbia Asset Allocation Fund | ||||||
| Columbia Asset Allocation Fund II | |||||||
| Columbia Balanced Fund | |||||||
| Columbia Liberty Fund | |||||||
| Columbia LifeGoalTM Balanced Growth Portfolio | |||||||
| Columbia LifeGoalTM Growth Portfolio | |||||||
| Columbia LifeGoalTM Income Portfolio | |||||||
| Columbia LifeGoalTM Income and Growth Portfolio | |||||||
| Columbia Thermostat Fund | |||||||
| Index funds | Columbia Large Cap Enhanced Core Fund | ||||||
| Columbia Large Cap Index Fund | |||||||
| Columbia Mid Cap Index Fund | |||||||
| Columbia Small Cap Index Fund | |||||||
| Tax-Managed fund | Columbia Tax-Managed Growth Fund | ||||||
| Specialty funds | Columbia Convertible Securities Fund | ||||||
| Columbia Real Estate Equity Fund | |||||||
| Columbia Technology Fund | |||||||
| Columbia Utilities Fund | |||||||
| Global/International funds | Columbia Acorn International | ||||||
| Columbia Acorn International Select | |||||||
| Columbia Global Value Fund | |||||||
| Columbia Greater China Fund | |||||||
| Columbia International Stock Fund | |||||||
| Columbia International Value Fund | |||||||
| Columbia Marsico International Opportunities Fund | |||||||
| Columbia Multi-Advisor International Equity Fund | |||||||
| Columbia World Equity Fund | |||||||
| Taxable Bond funds | Columbia Conservative High Yield Fund | ||||||
| Columbia Core Bond Fund | |||||||
| Columbia Federal Securities Fund | |||||||
| Columbia High Income Fund | |||||||
| Columbia High Yield Opportunity Fund | |||||||
| Columbia Income Fund | |||||||
| Columbia Intermediate Bond Fund | |||||||
| Columbia Intermediate Core Bond Fund | |||||||
| Columbia Short Term Bond Fund | |||||||
| Columbia Strategic Income Fund | |||||||
| Columbia Total Return Bond Fund | |||||||
| Columbia U.S. Treasury Index Fund | |||||||
158
Columbia Funds
| Tax-Exempt Bond funds | Columbia California Tax-Exempt Fund | ||||||
| Columbia California Intermediate Municipal Bond Fund | |||||||
| Columbia Connecticut Tax-Exempt Fund | |||||||
| Columbia Connecticut Intermediate Municipal Bond Fund | |||||||
| Columbia Florida Intermediate Municipal Bond Fund | |||||||
| Columbia Georgia Intermediate Municipal Bond Fund | |||||||
| Columbia High Yield Municipal Fund | |||||||
| Columbia Intermediate Municipal Bond Fund | |||||||
| Columbia Massachusetts Intermediate Municipal Bond Fund | |||||||
| Columbia Massachusetts Tax-Exempt Fund | |||||||
| Columbia Maryland Intermediate Municipal Bond Fund | |||||||
| Columbia Municipal Income Fund | |||||||
| Columbia North Carolina Intermediate Municipal Bond Fund | |||||||
| Columbia New York Tax-Exempt Fund | |||||||
| Columbia New Jersey Intermediate Municipal Bond Fund | |||||||
| Columbia New York Intermediate Municipal Bond Fund | |||||||
| Columbia Oregon Intermediate Municipal Bond Fund | |||||||
| Columbia Rhode Island Intermediate Municipal Bond Fund | |||||||
| Columbia South Carolina Intermediate Municipal Bond Fund | |||||||
| Columbia Short Term Municipal Bond Fund | |||||||
| Columbia Tax-Exempt Fund | |||||||
| Columbia Tax-Exempt Insured Fund | |||||||
| Columbia Texas Intermediate Municipal Bond Fund | |||||||
| Columbia Virginia Intermediate Municipal Bond Fund | |||||||
| Money Market funds | Columbia California Tax-Exempt Reserves | ||||||
| Columbia Cash Reserves | |||||||
| Columbia Connecticut Municipal Reserves | |||||||
| Columbia Government Plus Reserves | |||||||
| Columbia Government Reserves | |||||||
| Columbia Massachusetts Municipal Reserves | |||||||
| Columbia Money Market Reserves | |||||||
| Columbia Municipal Reserves | |||||||
| Columbia New York Tax-Exempt Reserves | |||||||
| Columbia Prime Reserves | |||||||
| Columbia Tax-Exempt Reserves | |||||||
| Columbia Treasury Reserves | |||||||
For complete product information on any Columbia fund, visit our website at www.columbiafunds.com.
Columbia Management is the primary investment management division of Bank of America Corporation. Columbia Management entities furnish investment management services and advise institutional and mutual fund portfolios. Columbia Funds are distributed by Columbia Management Distributors, Inc., member of NASD, SIPC, part of Columbia Management and an affiliate of Bank of America Corporation.
159
This page intentionally left blank.
IMPORTANT INFORMATION ABOUT THIS REPORT
Columbia Funds
Transfer Agent
Columbia Management Services, Inc.
P.O. Box 8081
Boston MA 02266-8081
800-345-6611
Distributor
Columbia Management
Distributors, Inc.
One Financial Center
Boston MA 02111
Investment Advisor
Columbia Management Advisors, LLC 100 Federal Street
Boston MA 02110
The funds mail one shareholder report to each shareholder address. If you would like more than one report, please call shareholder services at 800-345-6611 and additional reports will be sent to you.
This report has been prepared for shareholders of Columbia Funds. This report may also be used as sales literature when preceded or accompanied by the current prospectus which provides details of sales charges, investment objectives and operating policies of the funds and with the most recent copy of the Columbia Funds Performance Update.
A description of the policies and procedures that each fund uses to determine how to vote proxies and a copy of each fund's voting record are available (i) at www.columbiamanagement.com; (ii) on the Securities and Exchange Commission's website at www.sec.gov, and (iii) without charge, upon request, by calling 800-368-0346. Information regarding how each fund voted proxies relating to portfolio securities during the 12-month period ended June 30 is available from the SEC's website. Information regarding how each fund voted proxies relating to portfolio securities is also available from the funds' website.
Each fund files a complete schedule of portfolio holdings with the SEC for the first and third quarters of each fiscal year on Form N-Q. Each fund's Form N-Q is available on the SEC's website at www.sec.gov and may be reviewed and copied at the SEC's Public Reference Room in Washington, D.C. Information on the operation of the Public Reference Room may be obtained by calling 1-800-SEC-0330.
Columbia Management is the primary investment management division of Bank of America Corporation. Columbia Management entities furnish investment management services and advise institutional and mutual fund portfolios. Columbia Funds are distributed by Columbia Management Distributors, Inc., member of NASD, SIPC, part of Columbia Management and an affiliate of Bank of America Corporation.
161

Help your fund reduce printing and postage costs! Elect to get your shareholder reports by electronic delivery. With Columbia's eDelivery program, you receive an
e-mail message when your shareholder report becomes available online. If your fund account is registered with Columbia Funds, you can sign up quickly and easily on our website at www.columbiafunds.com.
Please note — if you own your fund shares through a financial institution, contact the institution to see if it offers electronic delivery. If you own your fund shares through a retirement plan, electronic delivery may not be available to you.
Columbia Funds Semiannual Report, February 28, 2006
Columbia Management.
©2006 Columbia Management Distributors, Inc.
One Financial Center, Boston, MA 02111-2621
800.345.6611 www.columbiafunds.com
PRSRT STD
U.S. Postage
PAID
Holliston, MA
Permit NO. 20
SHC-44/107435-0206 (04/06) 06/10741
Item 2. Code of Ethics.
Not applicable at this time.
Item 3. Audit Committee Financial Expert.
Not applicable at this time.
Item 4. Principal Accountant Fees and Services.
Not applicable at this time.
Item 5. Audit Committee of Listed Registrants.
Not applicable.
Item 6. Schedule of Investments
The registrant’s “Schedule I – Investments in securities of unaffiliated issuers” (as set forth in 17 CFR 210.12-12) is included in Item 1 of this Form N-CSR.
Item 7. Disclosure of Proxy Voting Policies and Procedures for Closed-End Management Investment Companies.
Not applicable.
Item 8. Portfolio Managers of Closed-End Management Investment Companies.
Not applicable.
Item 9. Purchases of Equity Securities by Closed-End Management Investment Company and Affiliated Purchasers.
Not applicable.
Item 10. Submission of Matters to a Vote of Security Holders.
There have not been any material changes to the procedures by which shareholders may recommend nominees to the registrant’s board of directors, since those procedures were
last disclosed in response to the requirements of Item 7(d)(2)(ii)(G) of Schedule 14A or this Item.
Item 11. Controls and Procedures.
(a) The registrant’s principal executive officer and principal financial officers, based on their evaluation of the registrant’s disclosure controls and procedures as of a date within 90 days of the filing of this report, have concluded that such controls and procedures are adequately designed to ensure that information required to be disclosed by the registrant in Form N-CSR is accumulated and communicated to the registrant’s management, including the principal executive officer and principal financial officer, or persons performing similar functions, as appropriate to allow timely decisions regarding required disclosure.
(b) There were no changes in the registrant’s internal control over financial reporting that occurred during the registrant’s second fiscal quarter of the period covered by this report that has materially affected, or is reasonably likely to materially affect, the registrant’s internal control over financial reporting.
Item 12. Exhibits.
(a)(1) Code of ethics required to be disclosed under Item 2 of Form N-CSR: Not applicable at this time.
(a)(2) Certifications pursuant to Rule 30a-2(a) under the Investment Company Act of 1940 (17 CFR 270.30a-2(a)) attached hereto as Exhibit 99.CERT.
(a)(3) Not applicable.
(b) Certification pursuant to Rule 30a-2(b) under the Investment Company Act of 1940 (17 CFR 270.30a-2(b)) attached hereto as Exhibit 99.906CERT.
SIGNATURES
Pursuant to the requirements of the Securities Exchange Act of 1934 and the Investment Company Act of 1940, the registrant has duly caused this report to be signed on its behalf by the undersigned, thereunto duly authorized.
(registrant) |
| Columbia Balanced Fund, Inc. |
| ||
| |||||
| |||||
By (Signature and Title) |
| /S/ Christopher L. Wilson |
| ||
|
| Christopher L. Wilson, President |
| ||
| |||||
| |||||
Date |
| April 26, 2006 |
| ||
Pursuant to the requirements of the Securities Exchange Act of 1934 and the Investment Company Act of 1940, this report has been signed below by the following persons on behalf of the registrant and in the capacities and on the dates indicated.
By (Signature and Title) |
| /S/ Christopher L. Wilson |
| |
|
| Christopher L. Wilson, President |
| |
| ||||
| ||||
Date |
| April 26, 2006 |
| |
| ||||
| ||||
By (Signature and Title) |
| /S/ J. Kevin Connaughton |
| |
|
| J. Kevin Connaughton, Treasurer |
| |
| ||||
| ||||
Date |
| April 26, 2006 |
| |