
Fourth Quarter & Full Year 2021 EARNINGS PRESENTATION MARCH 8 | 2022
This presentation contains forward-looking statements. Statements in this presentation that are not historical facts, including without limitation the information under the heading "Financial Outlook" and statements about the Company’s beliefs and expectations, earnings (loss) guidance, recent business and economic trends, potential acquisitions, and estimates of amounts for redeemable noncontrolling interests and deferred acquisition consideration, constitute forward-looking statements. Words such as “estimates”, “expects”, “contemplates”, “will”, “anticipates”, “projects”, “plans”, “intends”, “believes”, “forecasts”, “may”, “should”, and variations of such words or similar expressions are intended to identify forward-looking statements. These statements are based on current plans, estimates and projections, and are subject to change based on a number of factors, including those outlined in this section. Forward-looking statements speak only as of the date they are made, and the Company undertakes no obligation to update publicly any of them in light of new information or future events, if any. Forward-looking statements involve inherent risks and uncertainties. A number of important factors could cause actual results to differ materially from those contained in any forward-looking statements. Such risk factors include, but are not limited to, the following: • risks associated with international, national and regional unfavorable economic conditions that could affect the Company or its clients, including as a result of the novel coronavirus pandemic (“COVID-19”); • the effects of the outbreak of COVID-19, including the measures to reduce its spread, and the impact on the economy and demand for our services, which may precipitate or exacerbate other risks and uncertainties; • an inability to realize expected benefits of the combination of the Company’s business with the business of MDC (the “Business Combination” and, together with the related transactions, the “Transactions”); • adverse tax consequences in connection with the Transactions for the Company, its operations and its shareholders, that may differ from the expectations of the Company, including that future changes in tax law, potential increases to corporate tax rates in the United States and disagreements with the tax authorities on the Company’s determination of value and computations of its attributes may result in increased tax costs; • the occurrence of material Canadian federal income tax (including material “emigration tax”) as a result of the Transactions; • direct or indirect costs associated with the Transactions, which could be greater than expected; • risks associated with severe effects of international, national and regional economic conditions; • the Company’s ability to attract new clients and retain existing clients; • reduction in client spending and changes in client advertising, marketing and corporate communications requirements; • financial failure of the Company’s clients; • the Company’s ability to retain and attract key employees; • the Company’s ability to achieve the full amount of its stated cost saving initiatives; • the Company’s implementation of strategic initiatives; • the Company’s ability to remain in compliance with its debt agreements and the Company’s ability to finance its contingent payment obligations when due and payable, including but not limited to those relating to redeemable noncontrolling interests and deferred acquisition consideration; • the successful completion and integration of acquisitions which complement and expand the Company’s business capabilities; and • foreign currency fluctuations. Investors should carefully consider these risk factors and the additional risk factors outlined in more detail under the caption “Risk Factors” in Exhibit 99.2 to our Current Report on Form 8-K, filed with the Securities and Exchange Commission (the “SEC”) on August 10, 2021, and accessible on the SEC’s website at www.sec.gov., and in the Company’s other SEC filings. FORWARD LOOKING INFORMATION & OTHER INFORMATION 2
Non-GAAP Financial Measures: In addition to its reported results, Stagwell Inc has included in this presentation certain financial results that the Securities and Exchange Commission (SEC) defines as "non-GAAP Financial Measures." Management believes that such non-GAAP financial measures, when read in conjunction with the Company's reported results, can provide useful supplemental information for investors analyzing period to period comparisons of the Company's results. Such non-GAAP financial measures include the following: Pro Forma Results: Unless otherwise noted, financial results are presented on a Pro Forma basis giving effect to the combination as if it was completed on January 1, 2019. The Pro Forma amounts presented for each period were prepared by combining the historical standalone statements of operations for each of legacy MDC and SMG. The unaudited pro forma results are provided for illustrative purposes only and do not purport to represent what the actual consolidated results of operations or consolidated financial condition would have been had the combination actually occurred on the date indicated, nor do they purport to project the future consolidated results of operations or consolidated financial condition for any future period or as of any future date. The Company has excluded a quantitative reconciliation of adjusted Pro Forma EBITDA to net income under the “unreasonable efforts” exception in Item 10(e)(1)(i)(B) of Regulation S-K. Net Revenue: GAAP Revenue adjusted to exclude certain third-party direct costs when the Company acts as principal for the services rendered in the client arrangement Organic Net Revenue: “Organic net revenue growth” and “organic net revenue decline” refer to the positive or negative results, respectively, of subtracting both the foreign exchange and acquisition (disposition) components from total net revenue growth. The acquisition (disposition) component is calculated by aggregating prior period revenue for any acquired businesses, less the prior period revenue of any businesses that were disposed of during the current period. The organic revenue growth (decline) component reflects the constant currency impact of (a) the change in revenue of the partner firms that the Company has held throughout each of the comparable periods presented, and (b) “non-GAAP acquisitions (dispositions), net”. Non-GAAP acquisitions (dispositions), net consists of (i) for acquisitions during the current year, the revenue effect from such acquisition as if the acquisition had been owned during the equivalent period in the prior year and (ii) for acquisitions during the previous year, the revenue effect from such acquisitions as if they had been owned during that entire year (or same period as the current reportable period), taking into account their respective pre-acquisition revenues for the applicable periods, and (iii) for dispositions, the revenue effect from such disposition as if they had been disposed of during the equivalent period in the prior year. Adjusted EBITDA: Adjusted EBITDA is defined as Net income excluding non-operating income or expense to achieve operating income, plus depreciation and amortization, stock-based compensation, deferred acquisition consideration adjustments, and other items. Other items include restructuring costs, acquisition-related expenses, and non-recurring items. Pro Forma Free Cash Flow: Pro Forma Free Cash Flow is a non-GAAP measure defined as Adjusted EBITDA less capital expenditures, change in net working capital, cash taxes, interest, and distributions to minority interests, but excludes M&A payments. Financial Guidance: The Company provides guidance on a non-GAAP basis as it cannot predict certain elements which are included in reported GAAP results. Net New Business: Estimate of annualized revenue for new wins less annualized revenue for losses incurred in the period. Net Debt: defined as bonds plus revolver balance less cash. Net Leverage Ratio: defined as Net Debt divided by Last-Twelve-Months Adjusted EBITDA. DEFINITIONS OF NON-GAAP FINANCIAL MEASURES 3
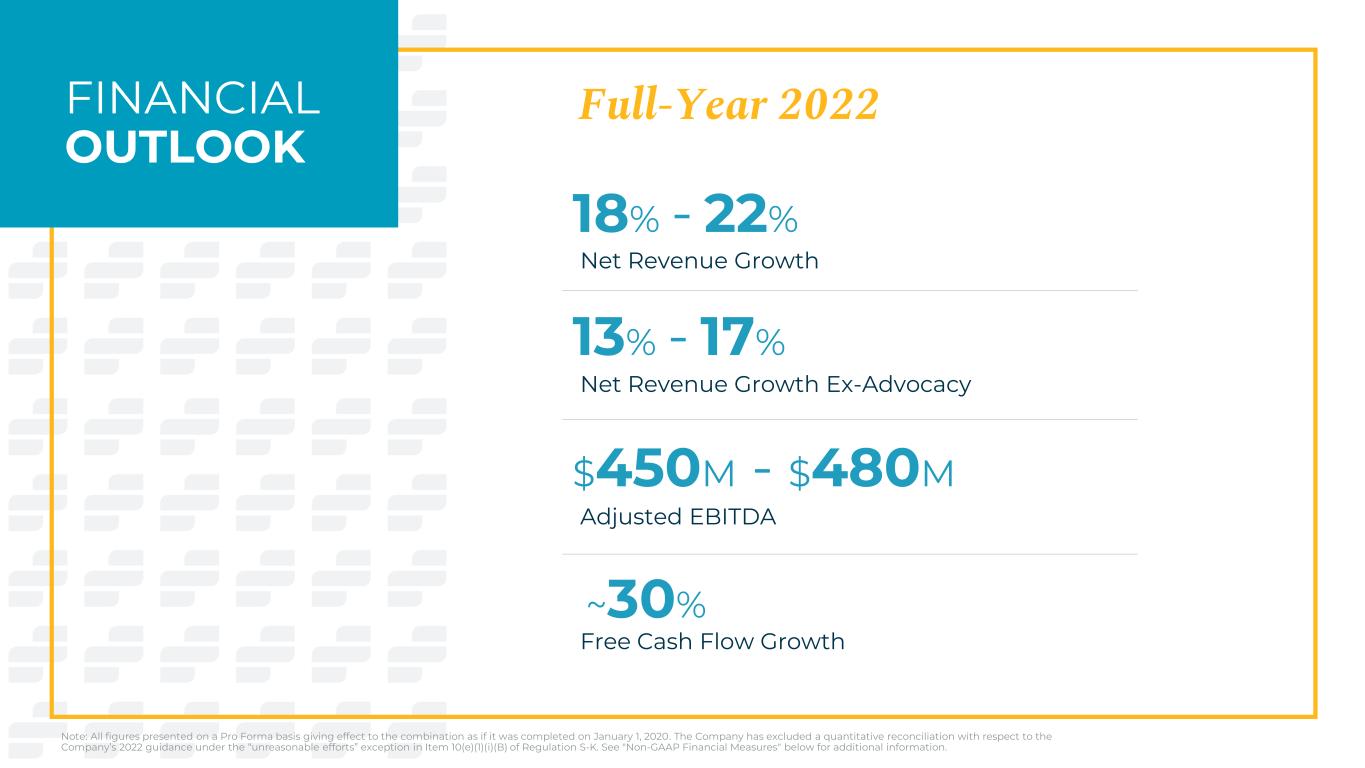
FINANCIAL OUTLOOK Full-Year 2022 Net Revenue Growth Net Revenue Growth Ex-Advocacy Adjusted EBITDA 18% - 22% 13% - 17% $450M - $480M Note: All figures presented on a Pro Forma basis giving effect to the combination as if it was completed on January 1, 2020. The Company has excluded a quantitative reconciliation with respect to the Company’s 2022 guidance under the “unreasonable efforts” exception in Item 10(e)(1)(i)(B) of Regulation S-K. See "Non-GAAP Financial Measures" below for additional information. ~30% Free Cash Flow Growth
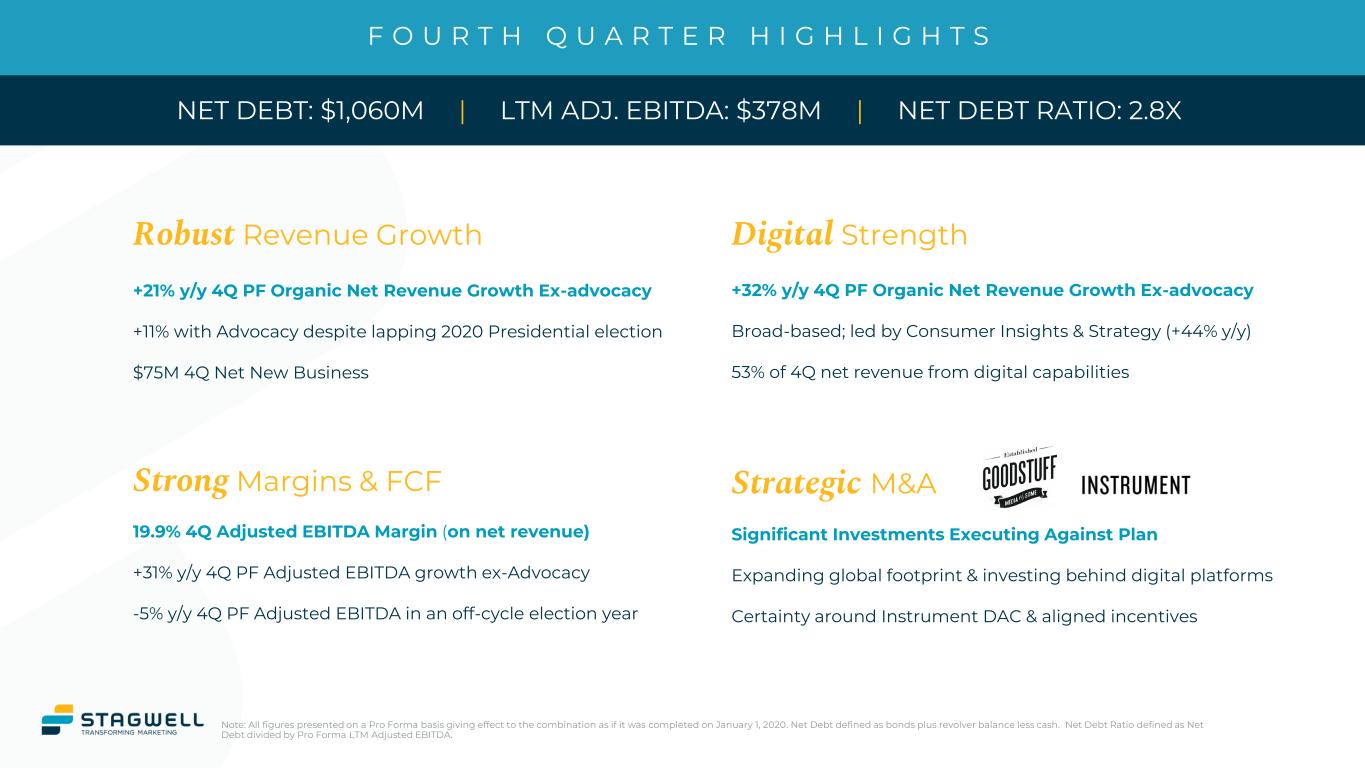
F O U R T H Q U A R T E R H I G H L I G H T S Strategic M&A Robust Revenue Growth Strong Margins & FCF Digital Strength Significant Investments Executing Against Plan Expanding global footprint & investing behind digital platforms Certainty around Instrument DAC & aligned incentives +32% y/y 4Q PF Organic Net Revenue Growth Ex-advocacy Broad-based; led by Consumer Insights & Strategy (+44% y/y) 53% of 4Q net revenue from digital capabilities +21% y/y 4Q PF Organic Net Revenue Growth Ex-advocacy +11% with Advocacy despite lapping 2020 Presidential election $75M 4Q Net New Business 19.9% 4Q Adjusted EBITDA Margin (on net revenue) +31% y/y 4Q PF Adjusted EBITDA growth ex-Advocacy -5% y/y 4Q PF Adjusted EBITDA in an off-cycle election year NET DEBT: $1,060M | LTM ADJ. EBITDA: $378M | NET DEBT RATIO: 2.8X Note: All figures presented on a Pro Forma basis giving effect to the combination as if it was completed on January 1, 2020. Net Debt defined as bonds plus revolver balance less cash. Net Debt Ratio defined as Net Debt divided by Pro Forma LTM Adjusted EBITDA.
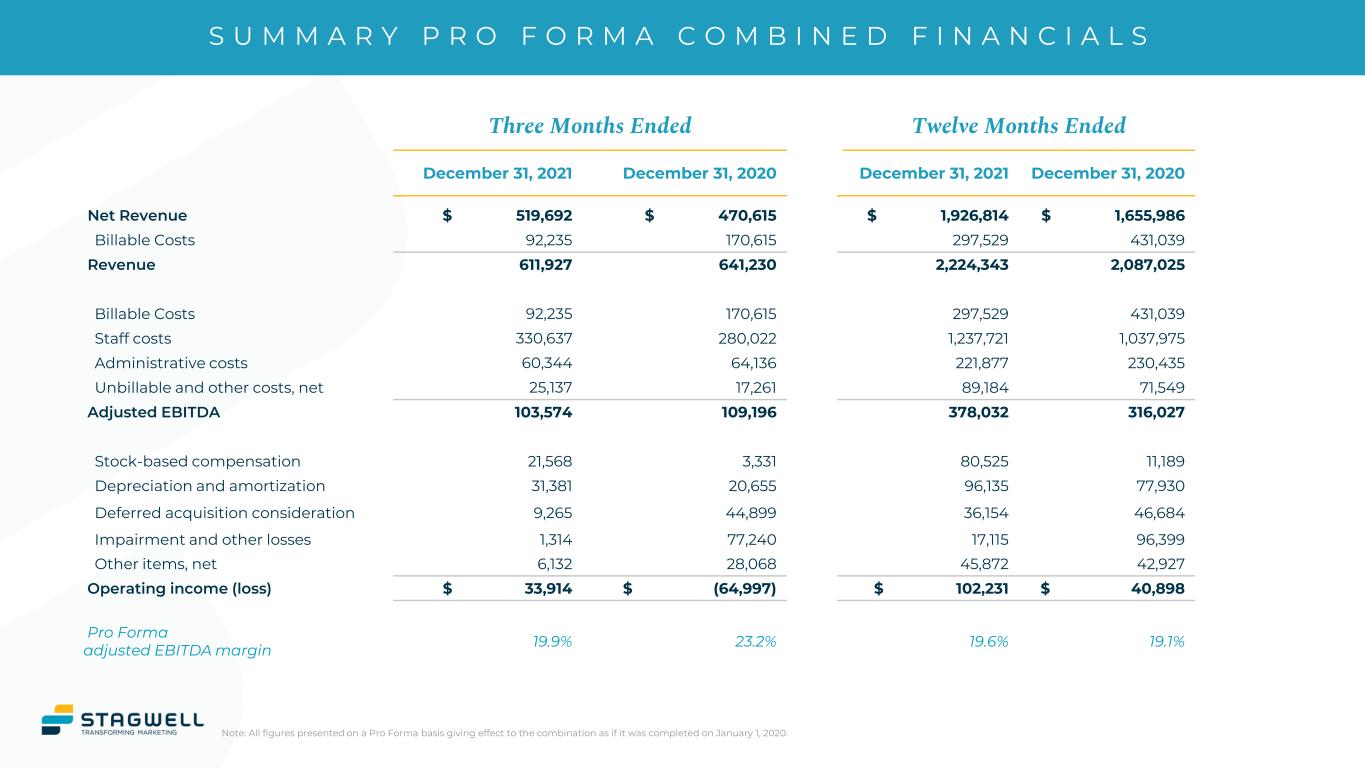
S U M M A R Y P R O F O R M A C O M B I N E D F I N A N C I A L S Note: All figures presented on a Pro Forma basis giving effect to the combination as if it was completed on January 1, 2020. Three Months Ended Twelve Months Ended December 31, 2021 December 31, 2020 December 31, 2021 December 31, 2020 Net Revenue $ 519,692 $ 470,615 $ 1,926,814 $ 1,655,986 Billable Costs 92,235 170,615 297,529 431,039 Revenue 611,927 641,230 2,224,343 2,087,025 Billable Costs 92,235 170,615 297,529 431,039 Staff costs 330,637 280,022 1,237,721 1,037,975 Administrative costs 60,344 64,136 221,877 230,435 Unbillable and other costs, net 25,137 17,261 89,184 71,549 Adjusted EBITDA 103,574 109,196 378,032 316,027 Stock-based compensation 21,568 3,331 80,525 11,189 Depreciation and amortization 31,381 20,655 96,135 77,930 Deferred acquisition consideration 9,265 44,899 36,154 46,684 Impairment and other losses 1,314 77,240 17,115 96,399 Other items, net 6,132 28,068 45,872 42,927 Operating income (loss) $ 33,914 $ (64,997) $ 102,231 $ 40,898 Pro Forma adjusted EBITDA margin 19.9% 23.2% 19.6% 19.1%
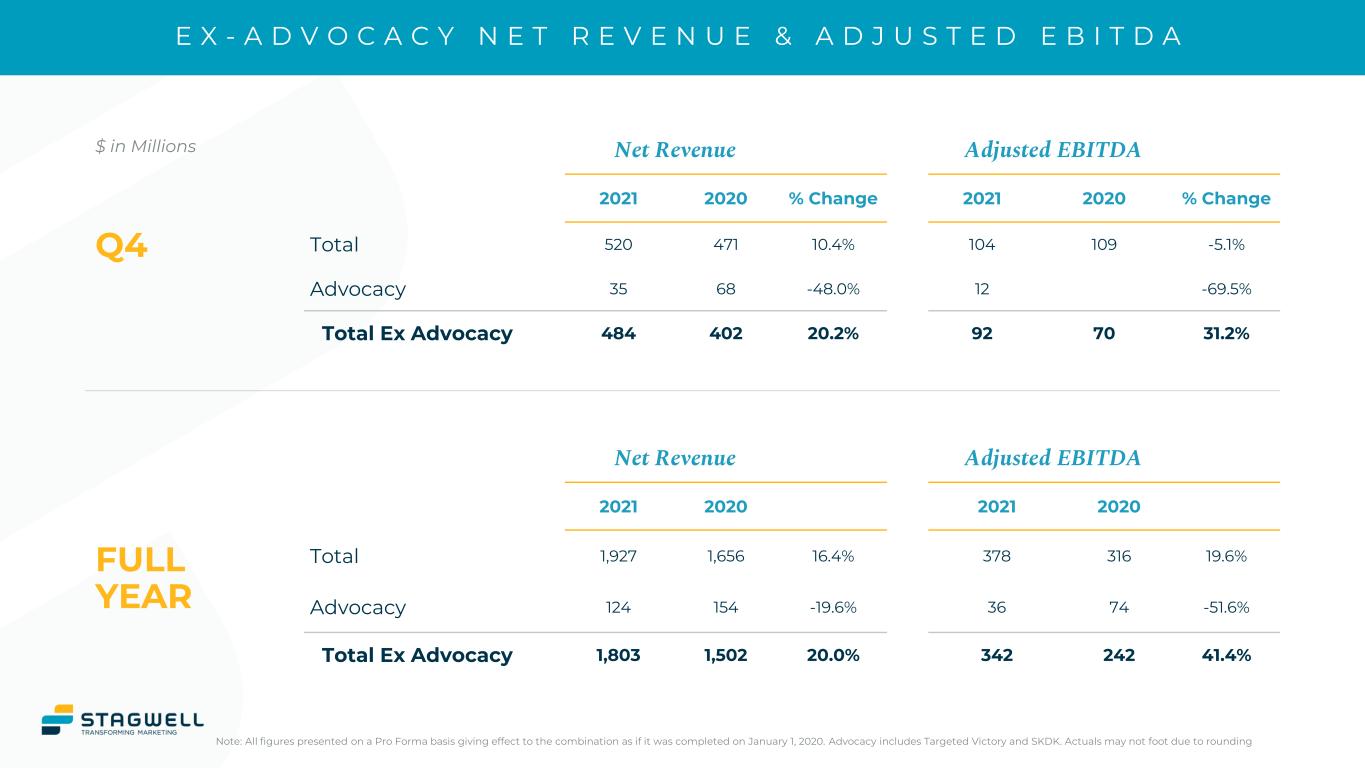
Net Revenue Adjusted EBITDA 2021 2020 % Change 2021 2020 % Change Total 520 471 10.4% 104 109 -5.1% Advocacy 35 68 -48.0% 12 -69.5% Total Ex Advocacy 484 402 20.2% 92 70 31.2% Net Revenue Adjusted EBITDA 2021 2020 2021 2020 Total 1,927 1,656 16.4% 378 316 19.6% Advocacy 124 154 -19.6% 36 74 -51.6% Total Ex Advocacy 1,803 1,502 20.0% 342 242 41.4% E X - A D V O C A C Y N E T R E V E N U E & A D J U S T E D E B I T D A Note: All figures presented on a Pro Forma basis giving effect to the combination as if it was completed on January 1, 2020. Advocacy includes Targeted Victory and SKDK. Actuals may not foot due to rounding $ in Millions Q4 FULL YEAR
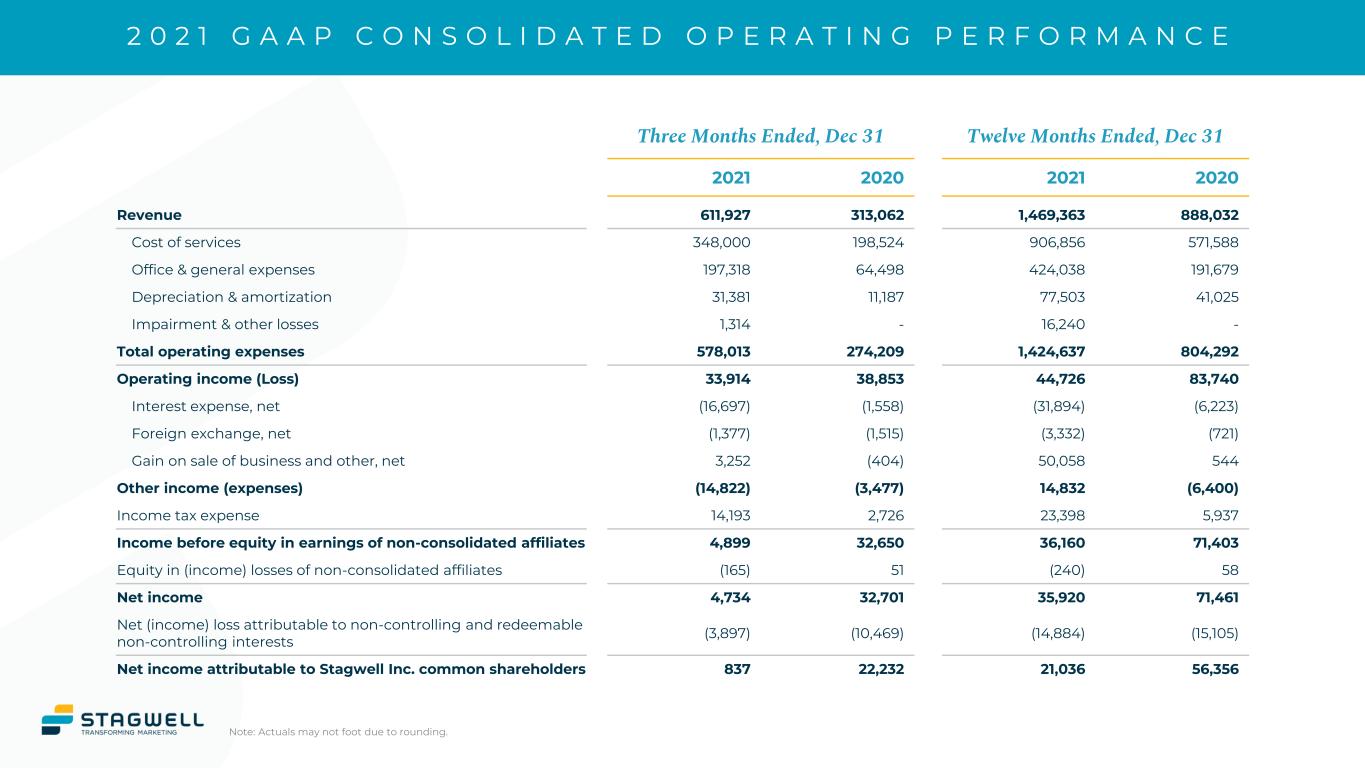
2 0 2 1 G A A P C O N S O L I D A T E D O P E R A T I N G P E R F O R M A N C E Three Months Ended, Dec 31 Twelve Months Ended, Dec 31 2021 2020 2021 2020 Revenue 611,927 313,062 1,469,363 888,032 Cost of services 348,000 198,524 906,856 571,588 Office & general expenses 197,318 64,498 424,038 191,679 Depreciation & amortization 31,381 11,187 77,503 41,025 Impairment & other losses 1,314 - 16,240 - Total operating expenses 578,013 274,209 1,424,637 804,292 Operating income (Loss) 33,914 38,853 44,726 83,740 Interest expense, net (16,697) (1,558) (31,894) (6,223) Foreign exchange, net (1,377) (1,515) (3,332) (721) Gain on sale of business and other, net 3,252 (404) 50,058 544 Other income (expenses) (14,822) (3,477) 14,832 (6,400) Income tax expense 14,193 2,726 23,398 5,937 Income before equity in earnings of non-consolidated affiliates 4,899 32,650 36,160 71,403 Equity in (income) losses of non-consolidated affiliates (165) 51 (240) 58 Net income 4,734 32,701 35,920 71,461 Net (income) loss attributable to non-controlling and redeemable non-controlling interests (3,897) (10,469) (14,884) (15,105) Net income attributable to Stagwell Inc. common shareholders 837 22,232 21,036 56,356 Note: Actuals may not foot due to rounding.
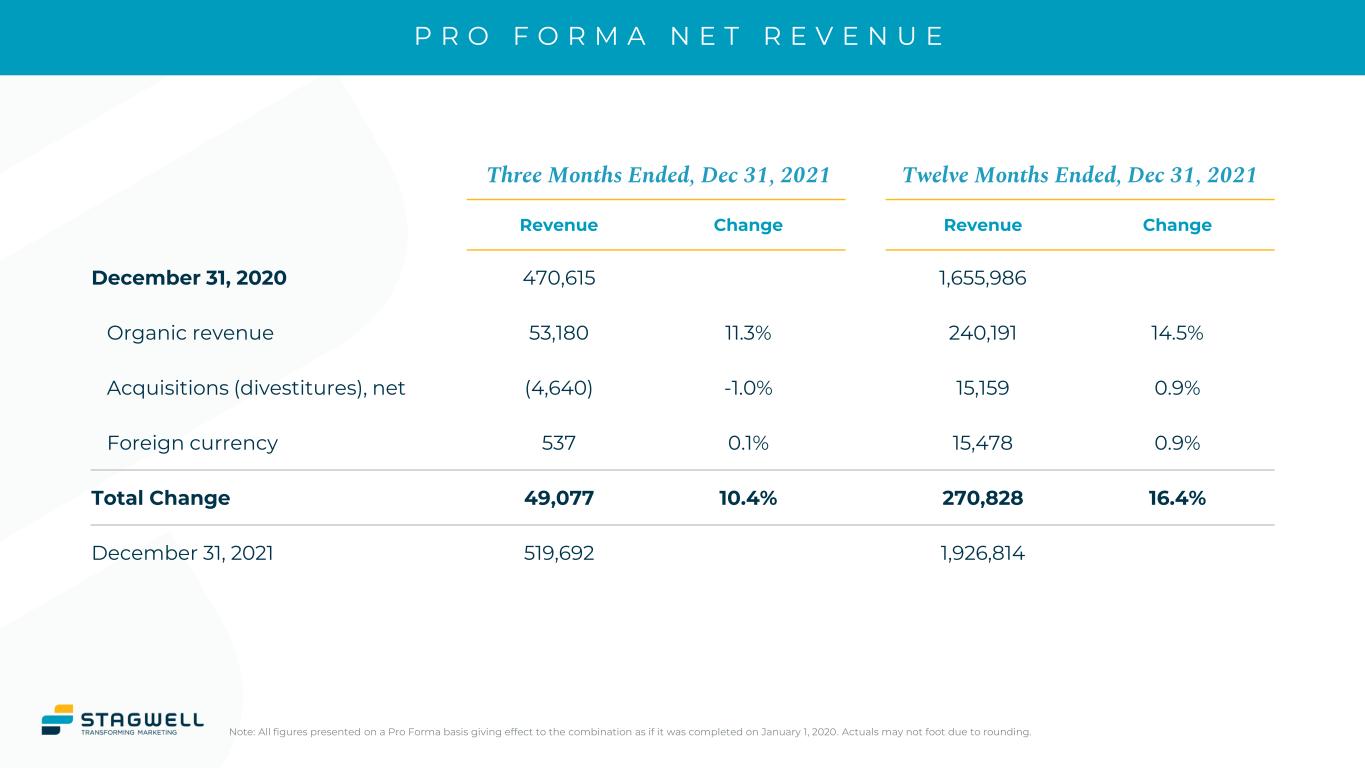
P R O F O R M A N E T R E V E N U E Note: All figures presented on a Pro Forma basis giving effect to the combination as if it was completed on January 1, 2020. Actuals may not foot due to rounding. Three Months Ended, Dec 31, 2021 Twelve Months Ended, Dec 31, 2021 Revenue Change Revenue Change December 31, 2020 470,615 1,655,986 Organic revenue 53,180 11.3% 240,191 14.5% Acquisitions (divestitures), net (4,640) -1.0% 15,159 0.9% Foreign currency 537 0.1% 15,478 0.9% Total Change 49,077 10.4% 270,828 16.4% December 31, 2021 519,692 1,926,814
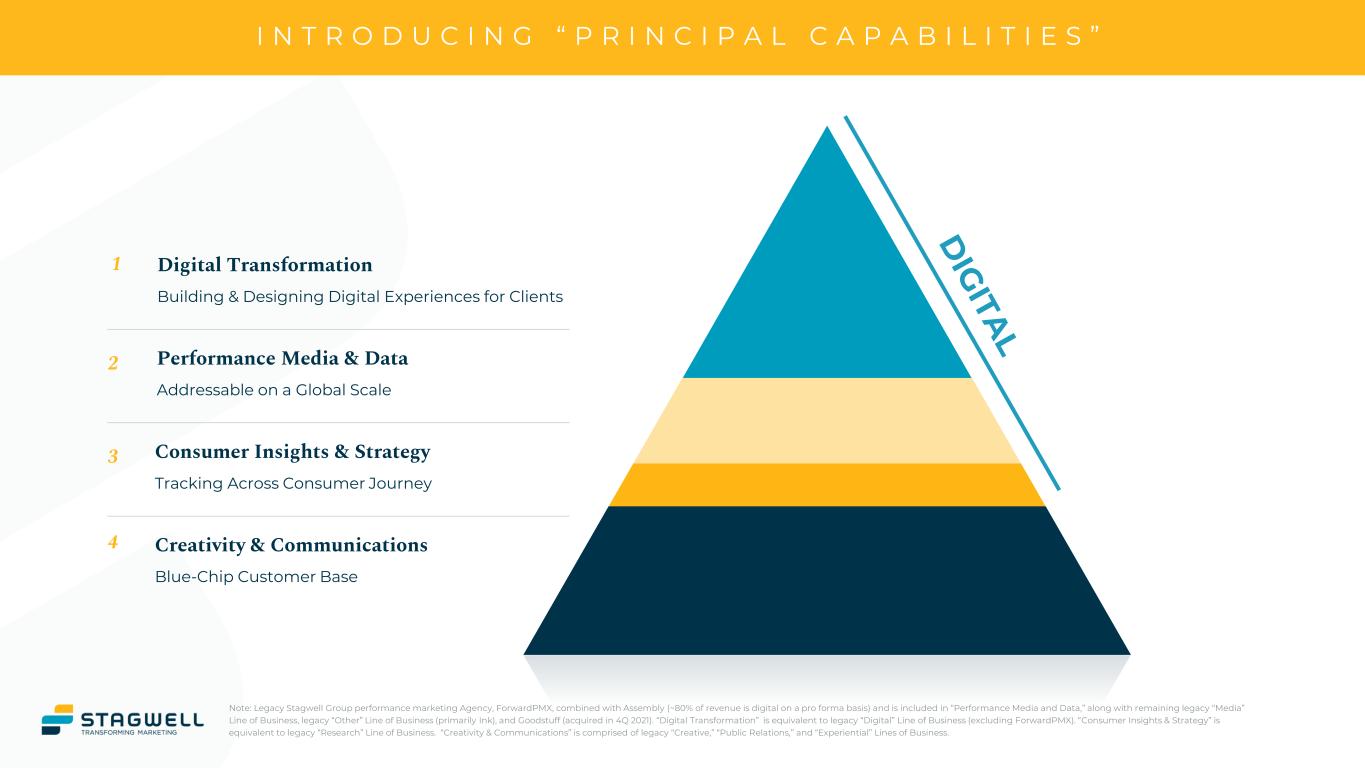
I N T R O D U C I N G “ P R I N C I P A L C A P A B I L I T I E S ” Note: Legacy Stagwell Group performance marketing Agency, ForwardPMX, combined with Assembly (~80% of revenue is digital on a pro forma basis) and is included in “Performance Media and Data,” along with remaining legacy “Media” Line of Business, legacy “Other” Line of Business (primarily Ink), and Goodstuff (acquired in 4Q 2021). “Digital Transformation” is equivalent to legacy “Digital” Line of Business (excluding ForwardPMX). “Consumer Insights & Strategy” is equivalent to legacy “Research” Line of Business. “Creativity & Communications” is comprised of legacy “Creative,” “Public Relations,” and “Experiential” Lines of Business. Creativity & Communications Blue-Chip Customer Base Performance Media & Data Addressable on a Global Scale Consumer Insights & Strategy Tracking Across Consumer Journey Digital Transformation Building & Designing Digital Experiences for Clients 1 2 3 4
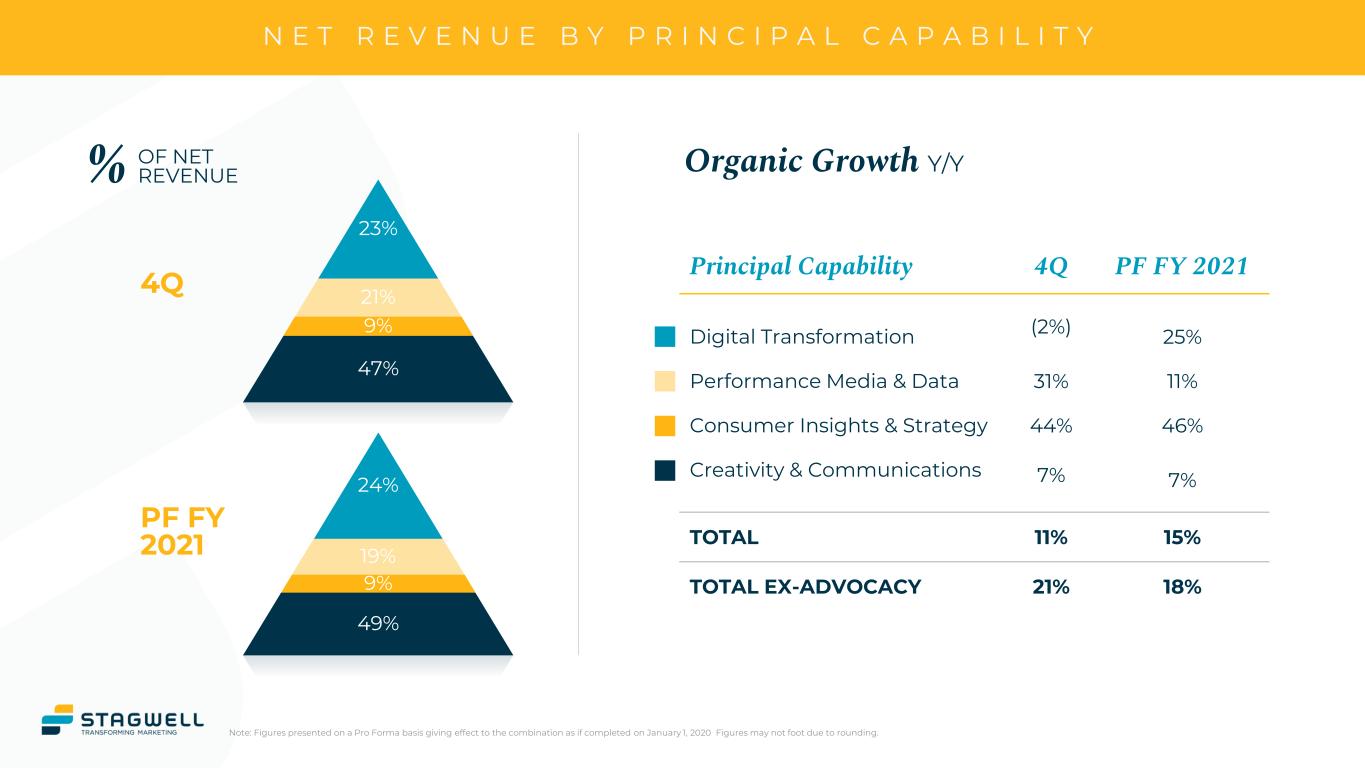
N E T R E V E N U E B Y P R I N C I P A L C A P A B I L I T Y Note: Figures presented on a Pro Forma basis giving effect to the combination as if completed on January 1, 2020 Figures may not foot due to rounding. Principal Capability 4Q PF FY 2021 Digital Transformation (2%) 25% Performance Media & Data 31% 11% Consumer Insights & Strategy 44% 46% Creativity & Communications 7% 7% TOTAL 11% 15% TOTAL EX-ADVOCACY 21% 18% % OF NET REVENUE 4Q PF FY 2021 Organic Growth Y/Y 23% 21% 9% 47% 24% 19% 9% 49%
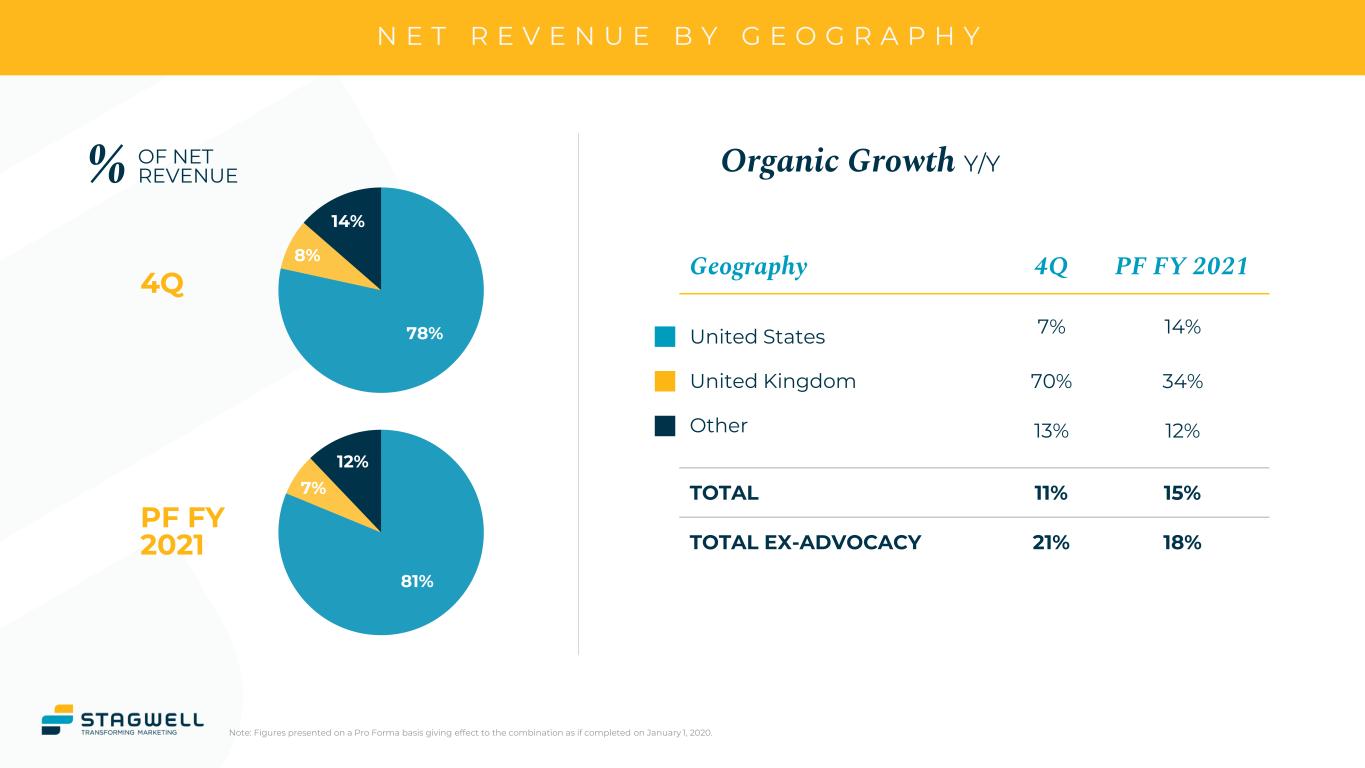
N E T R E V E N U E B Y G E O G R A P H Y Note: Figures presented on a Pro Forma basis giving effect to the combination as if completed on January 1, 2020. 81% 7% 12% % OF NET REVENUE 4Q PF FY 2021 Organic Growth Y/Y 78% 8% 14% Geography 4Q PF FY 2021 United States 7% 14% United Kingdom 70% 34% Other 13% 12% TOTAL 11% 15% TOTAL EX-ADVOCACY 21% 18%
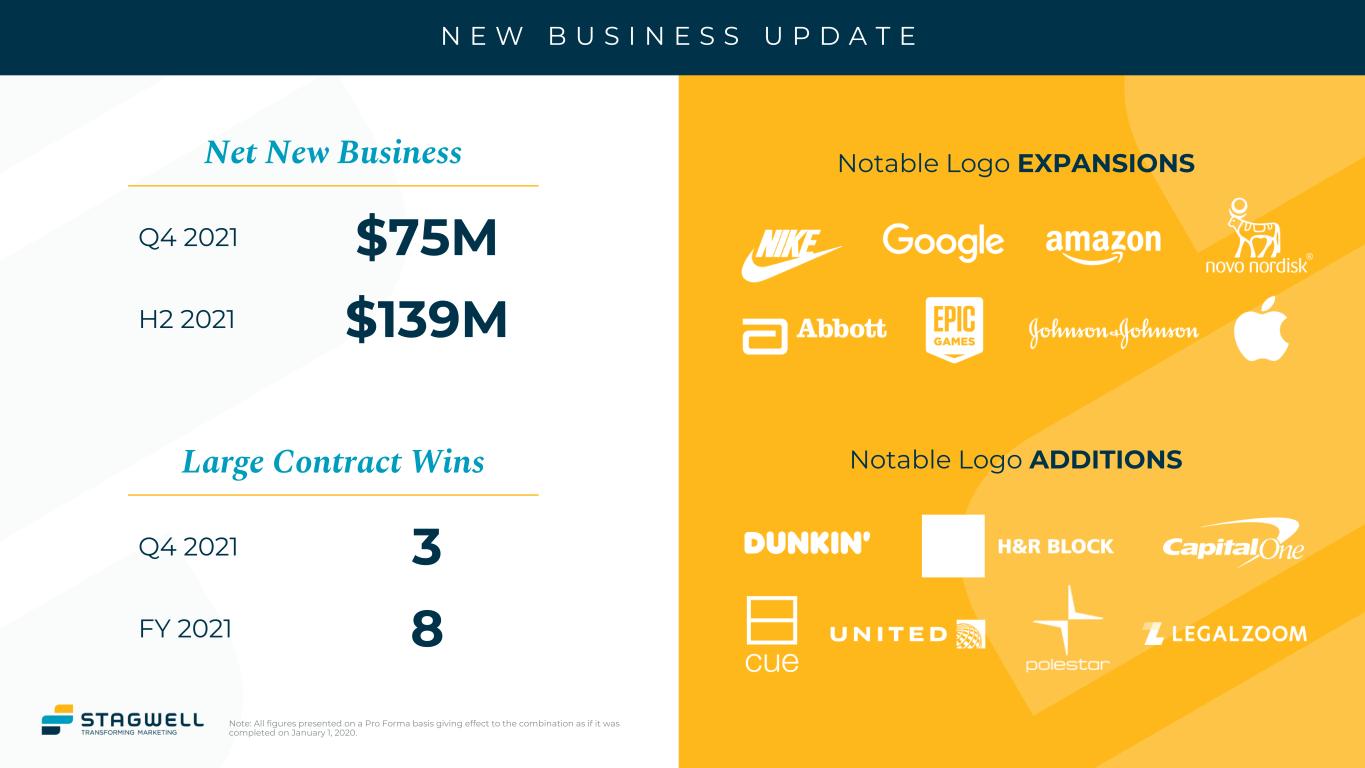
N E W B U S I N E S S U P D A T E Notable Logo EXPANSIONS Note: All figures presented on a Pro Forma basis giving effect to the combination as if it was completed on January 1, 2020. Net New Business Q4 2021 $75M H2 2021 $139M Large Contract Wins Q4 2021 3 FY 2021 8 Notable Logo ADDITIONS
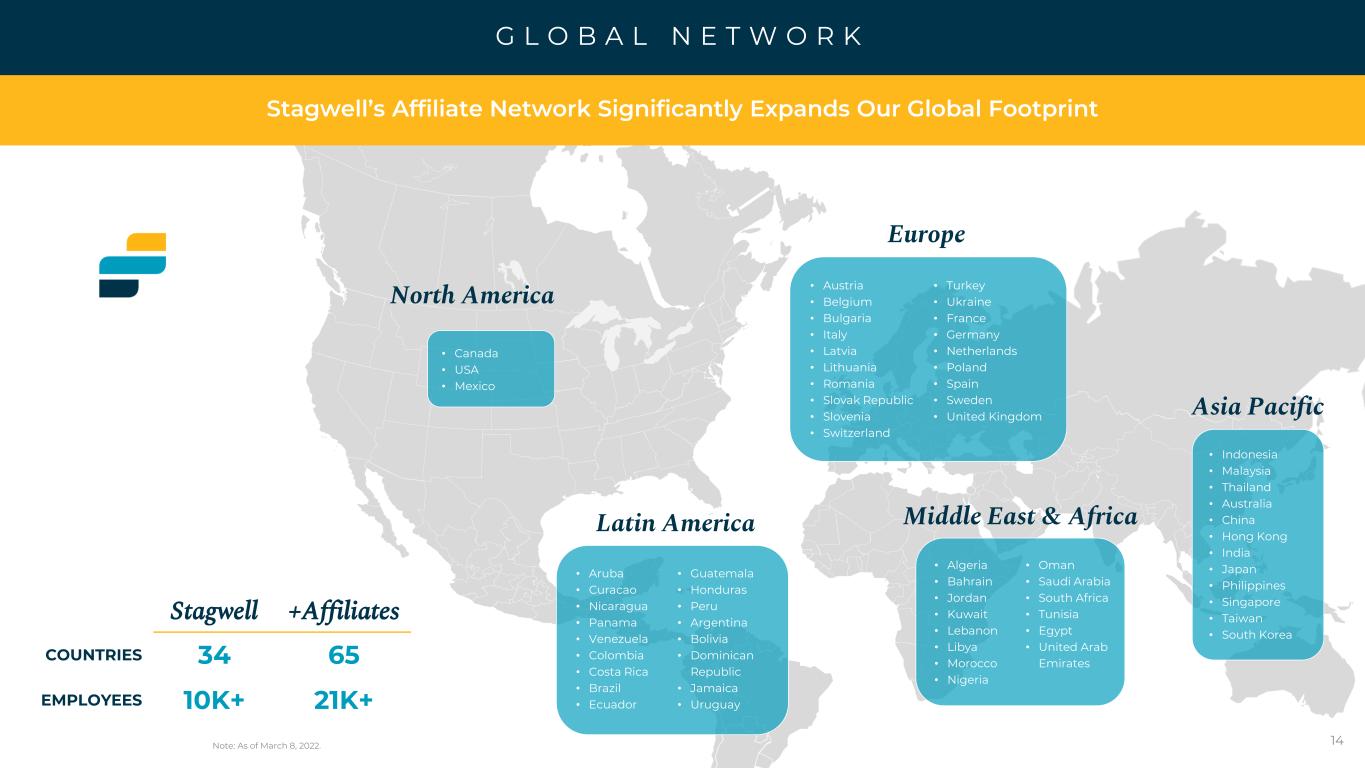
G L O B A L N E T W O R K 14 North America Latin America Europe Asia Pacific • Indonesia • Malaysia • Thailand • Australia • China • Hong Kong • India • Japan • Philippines • Singapore • Taiwan • South Korea Middle East & Africa • Austria • Belgium • Bulgaria • Italy • Latvia • Lithuania • Romania • Slovak Republic • Slovenia • Switzerland • Turkey • Ukraine • France • Germany • Netherlands • Poland • Spain • Sweden • United Kingdom • Aruba • Curacao • Nicaragua • Panama • Venezuela • Colombia • Costa Rica • Brazil • Ecuador • Guatemala • Honduras • Peru • Argentina • Bolivia • Dominican Republic • Jamaica • Uruguay • Algeria • Bahrain • Jordan • Kuwait • Lebanon • Libya • Morocco • Nigeria • Oman • Saudi Arabia • South Africa • Tunisia • Egypt • United Arab Emirates Stagwell +Affiliates COUNTRIES 34 65 EMPLOYEES 10K+ 21K+ Stagwell’s Affiliate Network Significantly Expands Our Global Footprint • Canada • USA • Mexico Note: As of March 8, 2022.
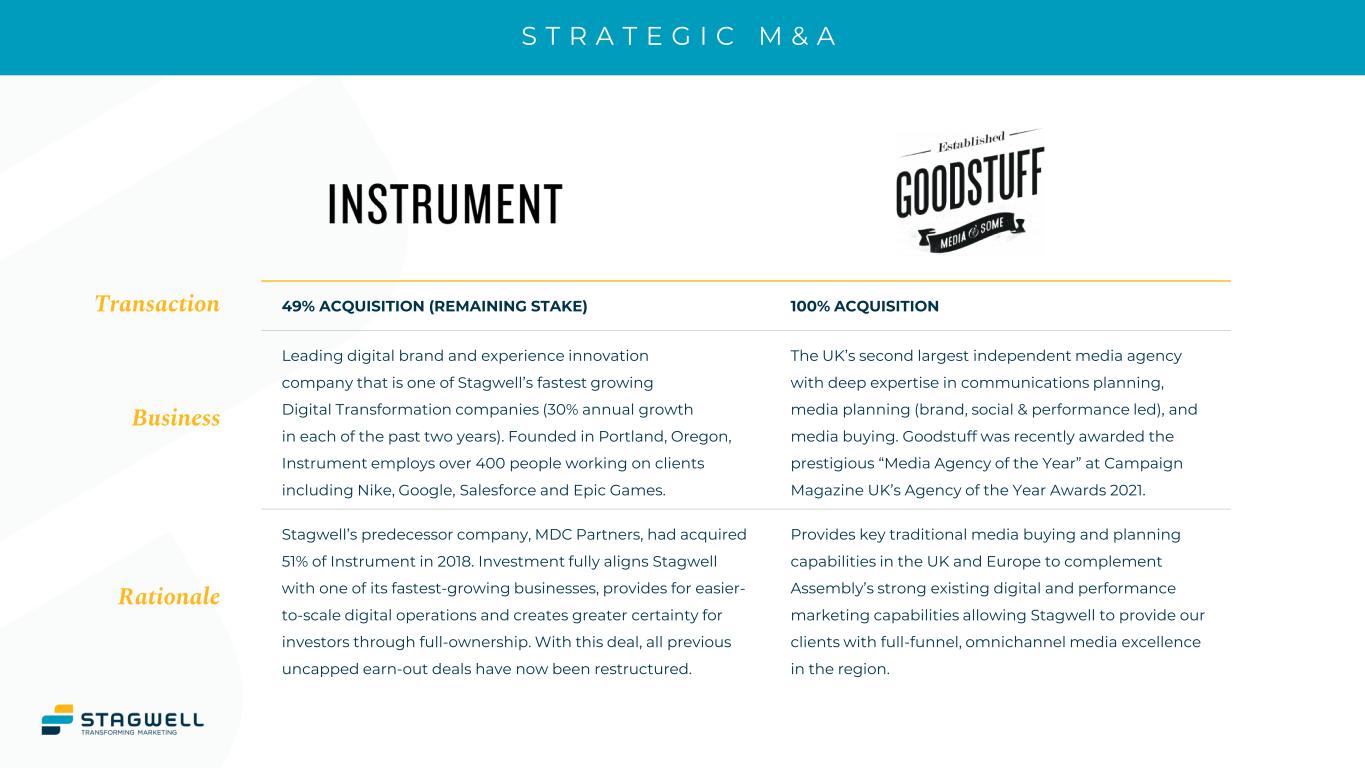
S T R A T E G I C M & A Transaction 49% ACQUISITION (REMAINING STAKE) 100% ACQUISITION Business Leading digital brand and experience innovation company that is one of Stagwell’s fastest growing Digital Transformation companies (30% annual growth in each of the past two years). Founded in Portland, Oregon, Instrument employs over 400 people working on clients including Nike, Google, Salesforce and Epic Games. The UK’s second largest independent media agency with deep expertise in communications planning, media planning (brand, social & performance led), and media buying. Goodstuff was recently awarded the prestigious “Media Agency of the Year” at Campaign Magazine UK’s Agency of the Year Awards 2021. Rationale Stagwell’s predecessor company, MDC Partners, had acquired 51% of Instrument in 2018. Investment fully aligns Stagwell with one of its fastest-growing businesses, provides for easier- to-scale digital operations and creates greater certainty for investors through full-ownership. With this deal, all previous uncapped earn-out deals have now been restructured. Provides key traditional media buying and planning capabilities in the UK and Europe to complement Assembly’s strong existing digital and performance marketing capabilities allowing Stagwell to provide our clients with full-funnel, omnichannel media excellence in the region.
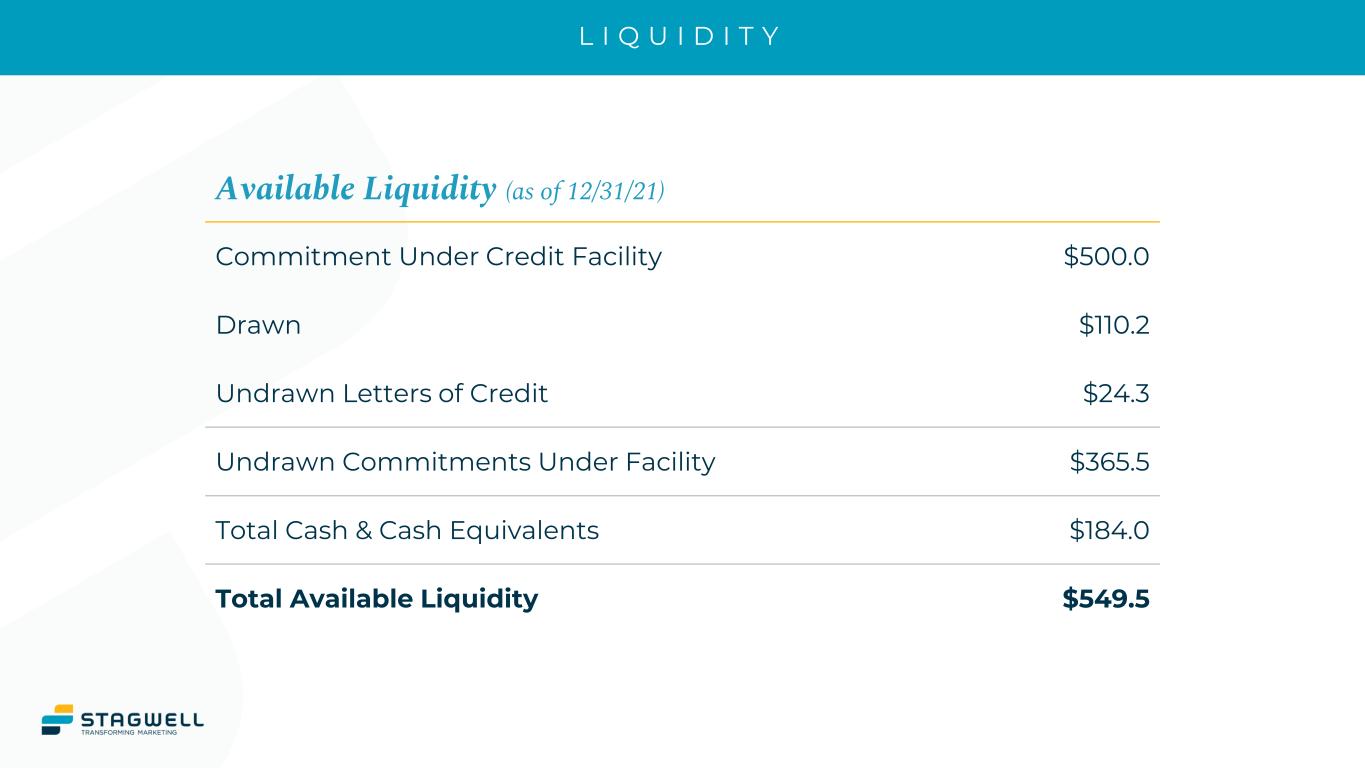
L I Q U I D I T Y Available Liquidity (as of 12/31/21) Commitment Under Credit Facility $500.0 Drawn $110.2 Undrawn Letters of Credit $24.3 Undrawn Commitments Under Facility $365.5 Total Cash & Cash Equivalents $184.0 Total Available Liquidity $549.5
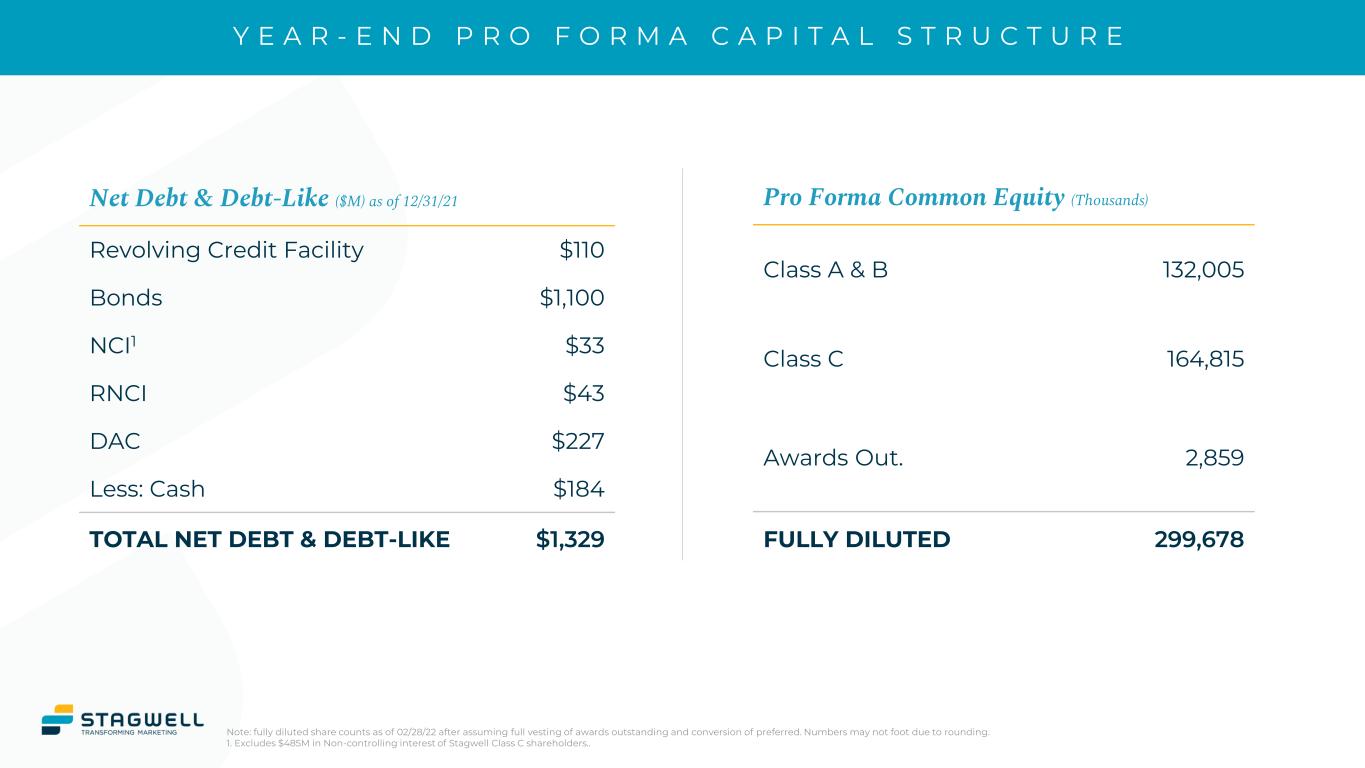
Y E A R - E N D P R O F O R M A C A P I T A L S T R U C T U R E Note: fully diluted share counts as of 02/28/22 after assuming full vesting of awards outstanding and conversion of preferred. Numbers may not foot due to rounding. 1. Excludes $485M in Non-controlling interest of Stagwell Class C shareholders.. Net Debt & Debt-Like ($M) as of 12/31/21 Revolving Credit Facility $110 Bonds $1,100 NCI1 $33 RNCI $43 DAC $227 Less: Cash $184 TOTAL NET DEBT & DEBT-LIKE $1,329 Pro Forma Common Equity (Thousands) Class A & B 132,005 Class C 164,815 Awards Out. 2,859 FULLY DILUTED 299,678

Appendix
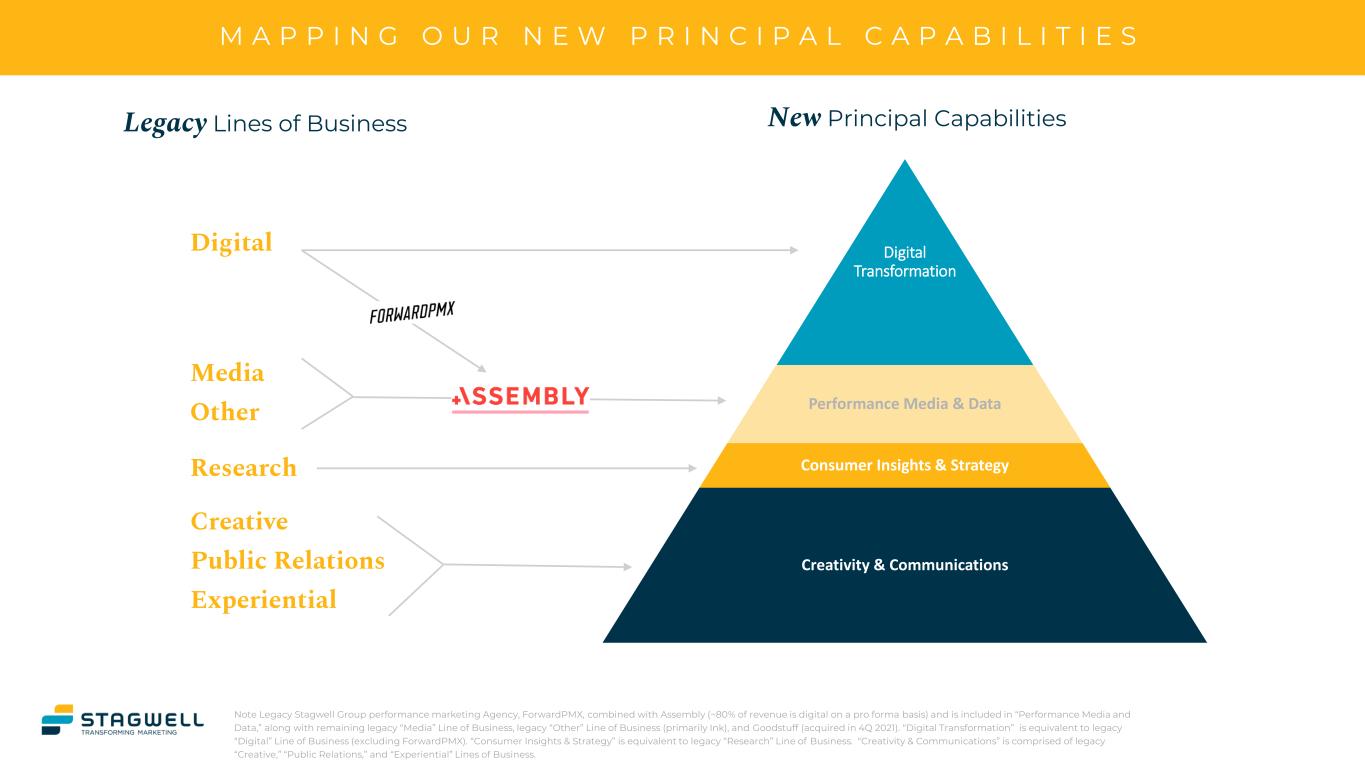
M A P P I N G O U R N E W P R I N C I P A L C A P A B I L I T I E S Digital Transformation Performance Media & Data Consumer Insights & Strategy Creativity & Communications Note Legacy Stagwell Group performance marketing Agency, ForwardPMX, combined with Assembly (~80% of revenue is digital on a pro forma basis) and is included in “Performance Media and Data,” along with remaining legacy “Media” Line of Business, legacy “Other” Line of Business (primarily Ink), and Goodstuff (acquired in 4Q 2021). “Digital Transformation” is equivalent to legacy “Digital” Line of Business (excluding ForwardPMX). “Consumer Insights & Strategy” is equivalent to legacy “Research” Line of Business. “Creativity & Communications” is comprised of legacy “Creative,” “Public Relations,” and “Experiential” Lines of Business. Creative Public Relations Experiential Research Media Other Digital New Principal CapabilitiesLegacy Lines of Business

Thank You Contact Us: IR@StagwellGlobal.com


