Exhibit 99.2

Link to searchable text of slide shown above

Link to searchable text of slide shown above
Link to searchable text of slide shown above

Link to searchable text of slide shown above

Link to searchable text of slide shown above

Link to searchable text of slide shown above
Link to searchable text of slide shown above

Link to searchable text of slide shown above

Link to searchable text of slide shown above

Link to searchable text of slide shown above
Link to searchable text of slide shown above
Link to searchable text of slide shown above
Link to searchable text of slide shown above

Link to searchable text of slide shown above

Link to searchable text of slide shown above
Link to searchable text of slide shown above
Link to searchable text of slide shown above

Link to searchable text of slide shown above
Link to searchable text of slide shown above
Link to searchable text of slide shown above

Link to searchable text of slide shown above
Link to searchable text of slide shown above

Link to searchable text of slide shown above

Link to searchable text of slide shown above

Link to searchable text of slide shown above
Searchable text section of graphics shown above
[LOGO]
Management Presentation
April 14, 2005
Fourth Quarter &
Full Year 2004 Results
[LOGO]
[LOGO]
Forward Looking Statements and Other Information
This presentation contains forward-looking statements. The Company’s representatives may also make forward-looking statements orally from time to time. Statements in this presentation that are not historical facts, including statements about the Company’s beliefs and expectations, particularly regarding the financial and strategic impact of acquiring the Zyman Group, recent business and economic trends, potential acquisitions, estimates of amounts for deferred acquisition consideration and “put” option rights, constitute forward-looking statements. These statements are based on current plans, estimates and projections, and are subject to change based on a number of factors, including those outlined in this section. Forward-looking statements speak only as of the date they are made, and the Company undertakes no obligation to update publicly any of them in light of new information or future events.
Forward-looking statements involve inherent risks and uncertainties. A number of important factors could cause actual results to differ materially from those contained in any forward-looking statements. Such risk factors include, but are not limited to, the following:
• risks associated with effects of national and regional economic conditions;
• the Company’s ability to attract new clients and retain existing clients;
• the financial success of the Company’s clients;
• the Company’s ability to remain in compliance with its credit facility;
• risks arising from potential material weaknesses in internal control over financial reporting;
• the Company’s ability to retain and attract key employees;
• the successful completion and integration of acquisitions which complement and expand the Company’s business capabilities;
• and, foreign currency fluctuations.
Investors should carefully consider these risk factors and the additional risk factors outlined in more detail in the Company’s SEC filings.
1
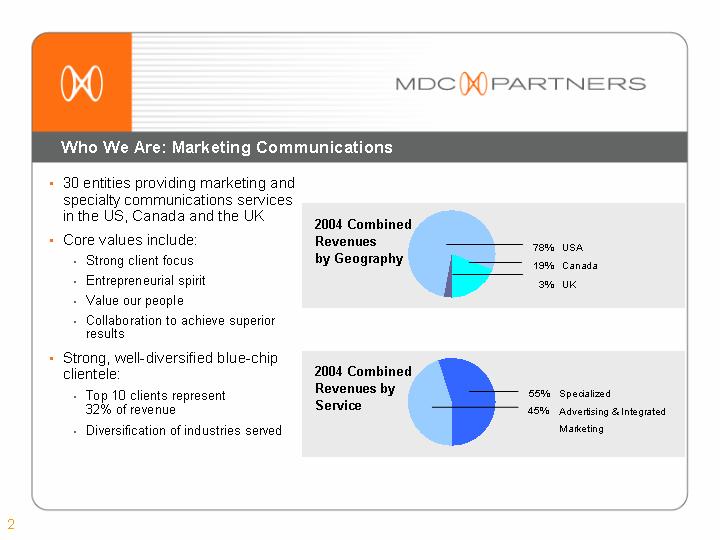
Who We Are: Marketing Communications
• | 30 entities providing marketing and specialty communications services in the US, Canada and the UK | |
| | |
• | Core values include: | 2004 Combined Revenues by Geography |
| | |
| | • | Strong client focus | [CHART] |
| | | | |
| | • | Entrepreneurial spirit | |
| | | | |
| | • | Value our people | |
| | | | |
| | • | Collaboration to achieve superior results | |
| | | |
• | Strong, well-diversified blue-chip clientele: | 2004 Combined Revenues by Service |
| | | |
| | • | Top 10 clients represent 32% of revenue | [CHART] |
| | | | |
| | • | Diversification of industries served | |
2
Combined Marketing Communications Revenue by Region
2004 | |
| |
[CHART] | |
| | | | | |
(US$ in millions) | | | | | |
| | | | | |
| | Revenue | |
| | $ | | % | |
US | | $ | 231.6 | | 78 | % |
| | | | | |
Canada | | 56.4 | | 19 | % |
| | | | | |
UK | | 8.9 | | 3 | % |
| | | | | | |
2003 | |
| |
[CHART] | |
| | | | | |
(US$ in millions) | | | | | |
| | | | | |
| | Revenue | |
| | $ | | % | |
US | | $ | 146.2 | | 73 | % |
| | | | | |
Canada | | 48.1 | | 24 | % |
| | | | | |
UK | | 6.0 | | 3 | % |
| | | | | | |
3
Combined Marketing Communications Revenue by Discipline
2004
[CHART]
2003
[CHART]
| | 2004 | | 2003 | |
Advertising / Integrated Communications | | 45 | % | 36 | % |
| | | | | |
CRM and Direct Marketing | | 26 | % | 30 | % |
| | | | | |
Sales Promotion | | 9 | % | 13 | % |
| | | | | |
Specialty Communications Services | | 20 | % | 20 | % |
4
Who We Are: Secure Products International
[LOGO] | | [LOGO] | | [LOGO] |
| | | | |
• | One of world’s largest private postage stamp printers | | • | Strong platform in high-end commercial printing | | • | Leader in smart card services in Canada and Australia (through Placard) with number one and number two share positions |
| | | | | | | |
• | Highly specialized with revenues supported by long-term contracts | | • | Major supplier of secure ticketing to NBA, Major League Baseball and many others | | • | Poised to benefit from investment in infrastructure |
| | | | | | | |
• | One of three companies sharing multi-million dollar, multi-year contract as part of privatization of U.S. stamp manufacturing | | | | | • | Recent success includes a large contract from Qantas for Placard |
5
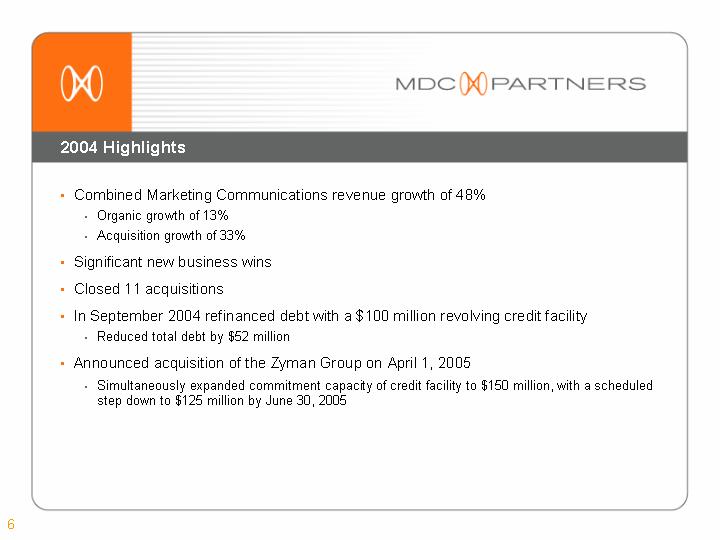
2004 Highlights
• Combined Marketing Communications revenue growth of 48%
• Organic growth of 13%
• Acquisition growth of 33%
• Significant new business wins
• Closed 11 acquisitions
• In September 2004 refinanced debt with a $100 million revolving credit facility
• Reduced total debt by $52 million
• Announced acquisition of the Zyman Group on April 1, 2005
• Simultaneously expanded commitment capacity of credit facility to $150 million, with a scheduled step down to $125 million by June 30, 2005
6
2004 Challenges
• Financial Reporting
• Secure Products
• Expense Management
• UK Discontinued Operation
• Lifemed start-up venture
7
2005 Action Plan
• Organic Growth
• Secure Products
• Management change at Metaca
• Rigorous new business plan
• Plan for asset disposition
• Expense Management / Operating Margin Improvement
• New Hires
• Chief Accounting Officer
• Director, Finance and Investor Relations
8
Summary of Full Year 2004 Results
(US$ in millions)
| | Full Year | |
| | 2004 | | 2003 | | % Change | |
Revenue | | | | | | | |
Marketing Communications | | $ | 247.1 | | $ | 164.9 | | 50 | % |
Secure Products International | | 69.7 | | 113.9 | | -39 | % |
| | $ | 316.8 | | $ | 278.8 | | | |
EBITDA | | | | | | | |
Marketing Communications | | $ | 28.7 | | $ | 18.3 | | 57 | % |
Margin | | 12 | % | 11 | % | | |
Secure Products International | | 4.0 | | 13.8 | | -71 | % |
Margin | | 6 | % | 12 | % | | |
Corporate and Other | | (16.4 | ) | (9.8 | ) | -67 | % |
| | $ | 16.3 | | $ | 22.3 | | | |
| | | | | | | |
Net Income from Continuing Operations before Amortization of Intangibles | | 6.9 | | 13.7 | | -49 | % |
Net Income from Continuing Operations | | 3.8 | | 13.7 | | 72 | % |
Loss from Discontinued Operations | | (5.9 | ) | (1.3 | ) | -367 | % |
Net Income | | $ | (2.2 | ) | $ | 12.4 | | 117 | % |
9
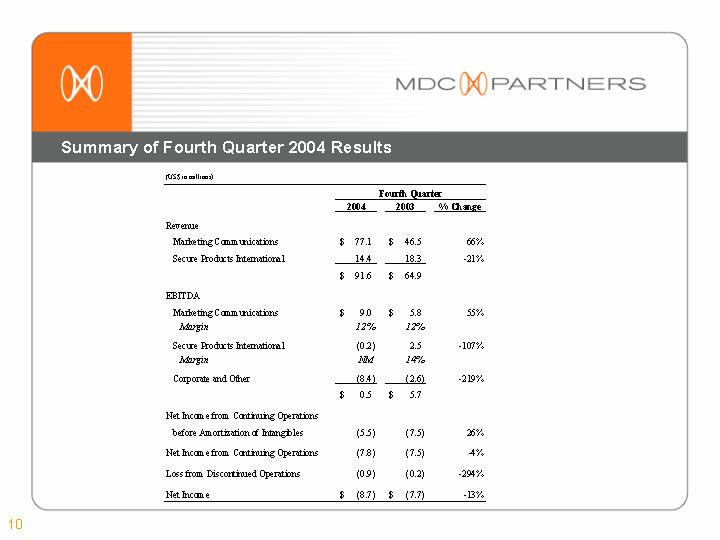
Summary of Fourth Quarter 2004 Results
(US$ in millions)
| | Fourth Quarter | |
| | 2004 | | 2003 | | % Change | |
| | | | | | | |
Revenue | | | | | | | |
Marketing Communications | | $ | 77.1 | | $ | 46.5 | | 66 | % |
Secure Products International | | 14.4 | | 18.3 | | -21 | % |
| | $ | 91.6 | | $ | 64.9 | | | |
EBITDA | | | | | | | |
Marketing Communications | | $ | 9.0 | | $ | 5.8 | | 55 | % |
Margin | | 12 | % | 12 | % | | |
Secure Products International | | (0.2 | ) | 2.5 | | -107 | % |
Margin | | NM | | 14 | % | | |
Corporate and Other | | (8.4 | ) | (2.6 | ) | -219 | % |
| | $ | 0.5 | | $ | 5.7 | | | |
| | | | | | | |
Net Income from Continuing Operations before Amortization of Intangibles | | (5.5 | ) | (7.5 | ) | 26 | % |
Net Income from Continuing Operations | | (7.8 | ) | (7.5 | ) | -4 | % |
Loss from Discontinued Operations | | (0.9 | ) | (0.2 | ) | -294 | % |
Net Income | | $ | (8.7 | ) | $ | (7.7 | ) | -13 | % |
10
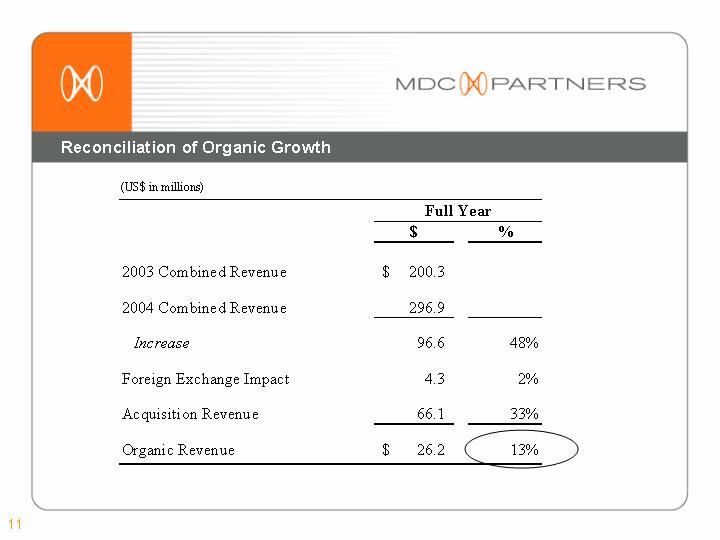
Reconciliation of Organic Growth
(US$ in millions)
| | Full Year | |
| | $ | | % | |
2003 Combined Revenue | | $ | 200.3 | | | |
2004 Combined Revenue | | 296.9 | | | |
Increase | | 96.6 | | 48 | % |
Foreign Exchange Impact | | 4.3 | | 2 | % |
Acquisition Revenue | | 66.1 | | 33 | % |
Organic Revenue | | $ | 26.2 | | 13 | % |
11
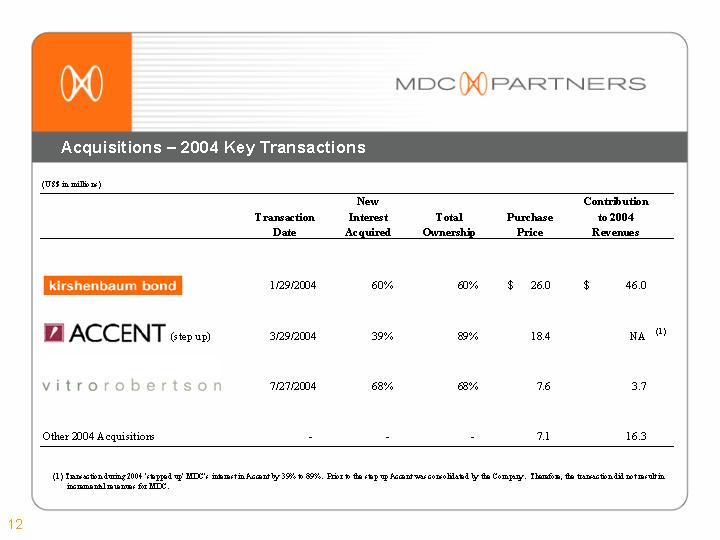
Acquisitions – 2004 Key Transactions
(US$ in millions)
| | | | New | | | | | | Contribution | |
| | Transaction | | Interest | | Total | | Purchase | | to 2004 | |
| | Date | | Acquired | | Ownership | | Price | | Revenues | |
[LOGO] | | 1/29/2004 | | 60 | % | 60 | % | $ | 26.0 | | $ | 46.0 | |
| | | | | | | | | | | |
[LOGO] | | 3/29/2004 | | 39 | % | 89 | % | 18.4 | | NA | (1) |
| | | | | | | | | | | |
[LOGO] | | 7/27/2004 | | 68 | % | 68 | % | 7.6 | | 3.7 | |
| | | | | | | | | | | |
Other 2004 Acquisitions | | — | | — | | — | | 7.1 | | 16.3 | |
| | | | | | | | | | | | | |
(1) Transaction during 2004 ‘stepped up’ MDC’s interest in Accent by 39% to 89%. Prior to the step up Accent was consolidated by the Company. Therefore, the transaction did not result in incremental revenues for MDC.
12
Key New Business Wins – 2004 & YTD 2005
2004
Agency | | Account |
Crispin Porter Bogusky | | Burger King, Gateway, Earthlink |
Cliff Freeman | | Snapple |
Colle + McVoy | | Minnesota Lottery |
Kirshenbaum Bond + Partners | | Edward Jones, Mohegan Sun, Equal |
Mono | | Hitachi, Airstream |
Margeotes / Fertitta + Partners | | Radisson Seven Seas Cruises, Godiva International |
VitroRobertson | | Little Einstein |
2005 YTD
Agency | | Account |
Accent | | State Farm Insurance |
Mono / Hello | | USA Networks |
Crispin Porter Bogusky | | Coke Zero |
Zig | | Molson Canadian |
13
Partner Companies Working Together to Benefit Clients
[GRAPHIC]
[GRAPHIC]
[GRAPHIC]
[LOGO]
14
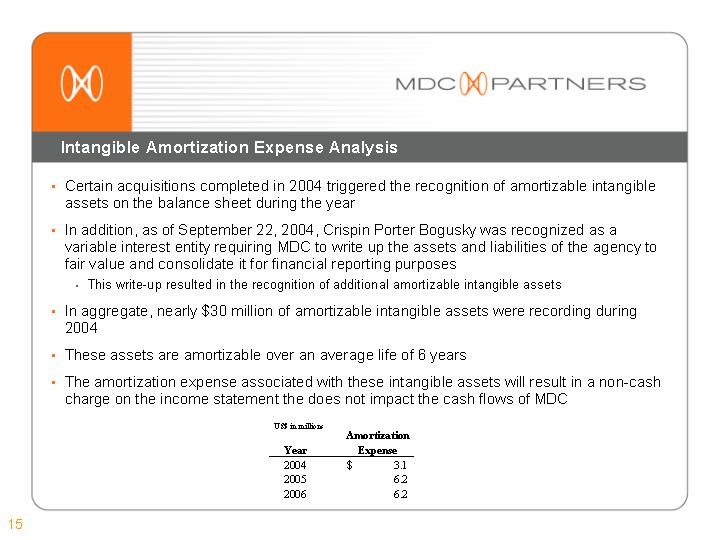
Intangible Amortization Expense Analysis
• Certain acquisitions completed in 2004 triggered the recognition of amortizable intangible assets on the balance sheet during the year
• In addition, as of September 22, 2004, Crispin Porter Bogusky was recognized as a variable interest entity requiring MDC to write up the assets and liabilities of the agency to fair value and consolidate it for financial reporting purposes
• This write-up resulted in the recognition of additional amortizable intangible assets
• In aggregate, nearly $30 million of amortizable intangible assets were recording during 2004
• These assets are amortizable over an average life of 6 years
• The amortization expense associated with these intangible assets will result in a non-cash charge on the income statement the does not impact the cash flows of MDC
US$ in millions
| | Amortization | |
Year | | Expense | |
2004 | | $ | 3.1 | |
2005 | | 6.2 | |
2006 | | 6.2 | |
| | | | |
15
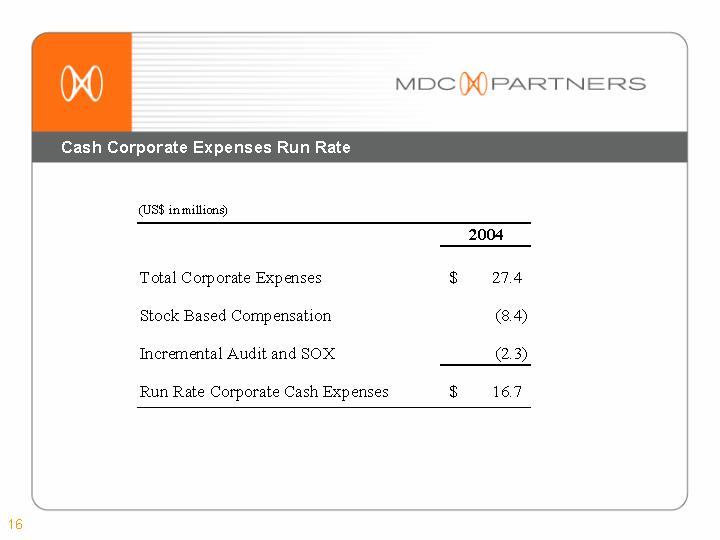
Cash Corporate Expenses Run Rate
(US$ in millions)
| | 2004 | |
Total Corporate Expenses | | $ | 27.4 | |
Stock Based Compensation | | (8.4 | ) |
Incremental Audit and SOX | | (2.3 | ) |
Run Rate Corporate Cash Expenses | | $ | 16.7 | |
16
Consolidated EBITDA before One Time Items
(US$ in millions)
| | EBITDA | |
2004 As Reported | | $ | 16.3 | |
One Time Items: | | | |
Recovery of Reserve | | (2.7 | ) |
Lifemed Startup Costs | | 1.8 | |
Incremental Audit and SOX | | 2.3 | |
Timing Differences | | $ | 3.0 | |
Run Rate(1) | | $ | 20.7 | |
(1) Run rate excludes the impact of the Zyman acquisition.
17
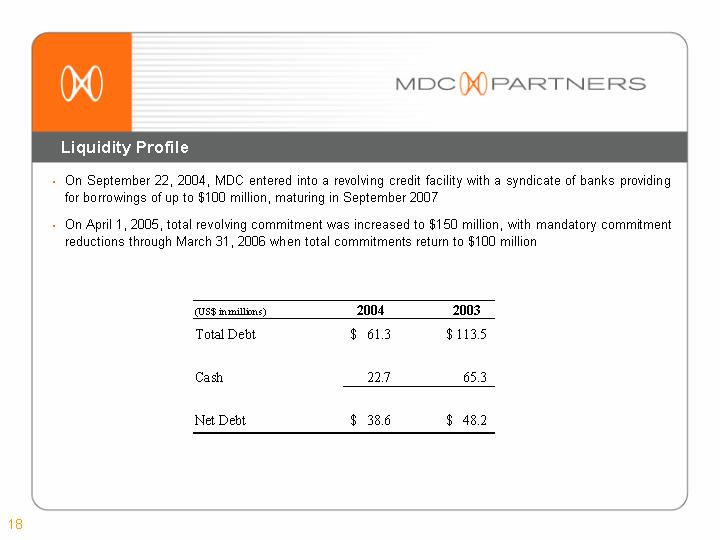
Liquidity Profile
• On September 22, 2004, MDC entered into a revolving credit facility with a syndicate of banks providing for borrowings of up to $100 million, maturing in September 2007
• On April 1, 2005, total revolving commitment was increased to $150 million, with mandatory commitment reductions through March 31, 2006 when total commitments return to $100 million
(US$ in millions) | | 2004 | | 2003 | |
Total Debt | | $ | 61.3 | | $ | 113.5 | |
| | | | | |
Cash | | 22.7 | | 65.3 | |
| | | | | |
Net Debt | | $ | 38.6 | | $ | 48.2 | |
18
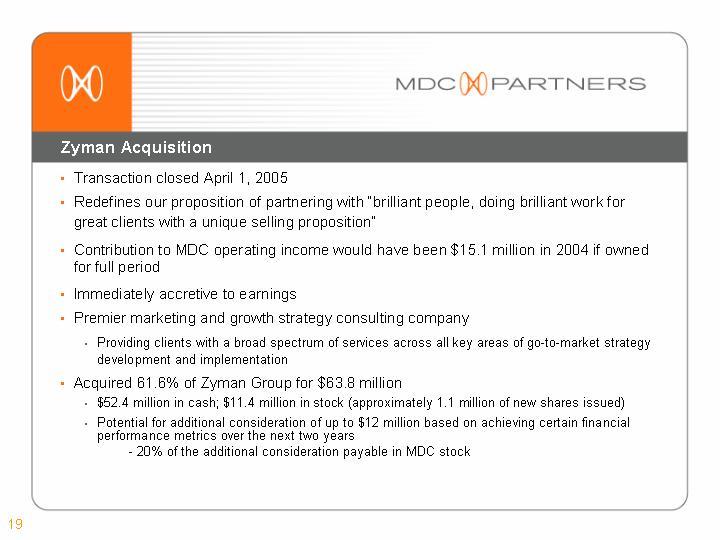
Zyman Acquisition
• Transaction closed April 1, 2005
• Redefines our proposition of partnering with “brilliant people, doing brilliant work for great clients with a unique selling proposition”
• Contribution to MDC operating income would have been $15.1 million in 2004 if owned for full period
• Immediately accretive to earnings
• Premier marketing and growth strategy consulting company
• Providing clients with a broad spectrum of services across all key areas of go-to-market strategy development and implementation
• Acquired 61.6% of Zyman Group for $63.8 million
• $52.4 million in cash; $11.4 million in stock (approximately 1.1 million of new shares issued)
• Potential for additional consideration of up to $12 million based on achieving certain financial performance metrics over the next two years
• 20% of the additional consideration payable in MDC stock
19
2005 Expectations
(US$ in millions)
| | Marketing
Communications | | Secure
Products | | Corporate | | Consolidated | |
| | 2005 | | Growth | | 2005 | | Growth | | 2005 | | Growth | | 2005 | | Growth | |
Revenue | | $ | 384.7 | | 56 | % | 82.9 | | 19 | % | $ | — | | NM | | $ | 467.6 | | 48 | % |
| | | | | | | | | | | | | | | | | |
MDC’s Share of EBITDA | | 57.7 | | 101 | % | 10.7 | | 168 | % | (18.6 | ) | 132 | % | 49.8 | | 102 | % |
| | | | | | | | | | | | | | | | | |
Cash EPS (1) | | | | | | | | | | | | | | | | | |
| | | | | | | | | | | | | | | | | |
Diluted | | | | | | | | | | | | | | $ | 1.41 | | 284 | % |
| | | | | | | | | | | | | | | | | |
Shares Outstanding | | | | | | | | | | | | | | | | | |
| | | | | | | | | | | | | | | | | |
Basic | | | | | | | | | | | | | | 23.3 | | | |
| | | | | | | | | | | | | | | | | |
Diluted | | | | | | | | | | | | | | 25.0 | | | |
| | | | | | | | | | | | | | | | | | | | |
(1) Cash EPS = Income from continuing operations + Depreciation and amortization + Stock based compensation.
20
Appendix
Summary of Wholly-Owned Subsidiaries
| | Year | |
Company | | Acquired | |
Marketing Communications | | | |
Ambrose Carr Linton Carroll Inc. | | 1992 | |
Bratskeir & Company, Inc. | | 2000 | |
Chinnici Direct, Inc. | | 2000 | |
Colle & McVoy, Inc. | | 1999 | |
Computer Composition of Canada Inc. | | 1988 | |
Mackenzie Marketing, Inc. | | 2000 | |
Pro-Image Corporation | | 1994 | |
Targetcom, LLC | | 2000 | |
| | | |
Secure Products International | | | |
Aston-Potter | | 1993 | |
Mercury Graphics | | 1995 | |
Metaca Corporation | | 1997 | |
Placard Pty. Ltd. | | 1996 | |
22
Less than Wholly-Owned and Incremental Ownership Summary
| | % Owned | | Ownership Potential Based on Outstanding Put / Call Options | |
Company | | at 12/31/04 | | 2005 | | 2006 | | 2007 | | 2008 | | 2009 | | 2010 | | 2011 | | 2012 | | 2013 | | 2014 | |
Accent Marketing Services | | 89.4 | % | 92.8 | % | 96.2 | % | 99.6 | % | — | | — | | — | | — | | — | | — | | — | |
Accumark Communications | | 55.0 | % | — | | — | | — | | — | | — | | — | | — | | — | | — | | — | |
Allard Johnson Communications | | 59.0 | % | 69.3 | % | — | | — | | — | | — | | — | | — | | — | | — | | — | |
Banjo | | 51.0 | % | — | | — | | — | | — | | — | | — | | — | | — | | — | | — | |
Bruce Mau Design | | 50.1 | % | — | | — | | — | | — | | — | | — | | — | | — | | — | | — | |
Bryan Mills Group | | 68.0 | % | 100.0 | % | — | | — | | — | | — | | — | | — | | — | | — | | — | |
Cliff Freeman and Partners | | 19.9 | % | — | | — | | — | | — | | — | | — | | — | | — | | — | | — | |
Crispin Porter & Bogusky | | 49.0 | % | — | | | | 66.0 | % | 83.0 | % | 100.0 | % | — | | — | | — | | — | | — | |
Fletcher Martin Ewing | | 85.0 | % | 100.0 | % | — | | — | | — | | — | | — | | — | | — | | — | | — | |
Hello Design | | 51.0 | % | — | | — | | — | | — | | — | | — | | — | | — | | — | | — | |
Henderson Bas | | 65.0 | % | — | | — | | — | | — | | — | | — | | — | | — | | — | | — | |
Integrated Healthcare Communications | | 70.0 | % | 90.0 | % | — | | — | | — | | — | | — | | — | | — | | — | | — | |
Kirshenbaum Bond & Partners | | 60.0 | % | — | | — | | — | | 100.0 | % | — | | — | | — | | — | | — | | — | |
Lifemed | | 45.0 | % | — | | — | | — | | — | | — | | — | | — | | — | | — | | — | |
Mageotes / Fertitta + Partners | | 80.0 | % | 100.0 | % | — | | — | | — | | — | | — | | — | | — | | — | | — | |
Mono Advertising | | 49.0 | % | — | | — | | — | | — | | — | | 54.0 | % | 59.0 | % | 64.0 | % | 69.0 | % | 74.0 | % |
Northstar Research Partners | | 50.1 | % | 100.0 | % | — | | — | | — | | — | | — | | — | | — | | — | | — | |
Onbrand Design (formerly Strategies) | | 85.0 | % | — | | — | | — | | — | | — | | — | | — | | — | | — | | — | |
Source Marketing | | 87.7 | % | 100.0 | % | — | | — | | — | | — | | — | | — | | — | | — | | — | |
Veritas Communications | | 58.8 | % | — | | — | | — | | — | | — | | — | | — | | — | | — | | — | |
Vitro Robertson | | 68.0 | % | — | | — | | — | | — | | — | | — | | 100.0 | % | — | | — | | — | |
Zig | | 49.9 | % | — | | — | | — | | — | | 79.9 | % | — | | — | | — | | — | | — | |
Note: All businesses are consolidated for accounting purposes except Accumark, Cliff Freeman, Mono and Zig which are accounted for for using the equity method.
23
Definition of Non-GAAP Metrics
• Combined: For purposes of this presentation, except as otherwise indicated, 100% of the results of operations of those material entities which are required to be equity accounted for under US GAAP have been combined on a line by line basis with the other consolidated businesses of the Marketing Communications operating segment, and this alternative presentation of operating results has been described as “Combined”. These “Combined” results do not constitute a financial measure prepared inaccordance with US GAAP and, therefore, may not be comparable to similarly titled measures presented by other publicly traded companies, nor should they be construed as an alternative to other titled measures determined in accordance with US GAAP. The Company believes that discussing “Combined” results provides a better understanding of our results of operation because it allows for a more meaningful analysis of the financial results of our underlying business operations. A reconciliation of “Combined” results of operations of the Marketing Communications operating segment to the US GAAP reported results of operations has been provided by the Company in the tables included in the earnings release issued on April 14, 2005.
• EBITDA: EBITDA is a non-GAAP measure, that represents operating profit plus depreciation and amortization plus stock-based compensation less minority interests. A reconciliation of “EBITDA” to the US GAAP reported results of operations has been provided by the Company in the tables included in the earnings release issued on April 14, 2005.
24