Exhibit 99.2
Link to searchable text of slide shown above
Link to searchable text of slide shown above

Link to searchable text of slide shown above
Link to searchable text of slide shown above
Link to searchable text of slide shown above
Link to searchable text of slide shown above
Link to searchable text of slide shown above
Link to searchable text of slide shown above

Link to searchable text of slide shown above
Link to searchable text of slide shown above
Link to searchable text of slide shown above
Link to searchable text of slide shown above
Link to searchable text of slide shown above
Link to searchable text of slide shown above
Link to searchable text of slide shown above
Link to searchable text of slide shown above

Link to searchable text of slide shown above
Link to searchable text of slide shown above
Searchable text section of graphics shown above
[GRAPHIC]
Management Presentation
August 5, 2005
Second Quarter 2005 Results
[LOGO]
Forward Looking Statements and Other Information
This presentation contains forward-looking statements. The Company’s representatives may also make forward-looking statements orally from time to time. Statements in this presentation that are not historical facts, including statements about the Company’s beliefs and expectations, particularly regarding the financial and strategic impact of acquiring the Zyman Group, recent business and economic trends, potential acquisitions, estimates of amounts for deferred acquisition consideration and “put” option rights, constitute forward-looking statements. These statements are based on current plans, estimates and projections, and are subject to change based on a number of factors, including those outlined in this section. Forward-looking statements speak only as of the date they are made, and the Company undertakes no obligation to update publicly any of them in light of new information or future events.
Forward-looking statements involve inherent risks and uncertainties. A number of important factors could cause actual results to differ materially from those contained in any forward-looking statements. Such risk factors include, but are not limited to, the following:
• risks associated with effects of national and regional economic conditions;
• the Company’s ability to attract new clients and retain existing clients;
• the financial success of the Company’s clients;
• the Company’s ability to remain in compliance with its credit facility;
• risks arising from potential material weaknesses in internal control over financial reporting;
• the Company’s ability to retain and attract key employees;
• the successful completion and integration of acquisitions which complement and expand the Company’s business capabilities;
• and, foreign currency fluctuations.
Investors should carefully consider these risk factors and the additional risk factors outlined in more detail in the Company’s SEC filings.
1
Summary of Segment Results
| | Three Months Ended | | Six Months Ended | |
(US$ in millions) | | 6/30/2005 | | 6/30/2004 | | % Change | | 6/30/2005 | | 6/30/2004 | | % Change | |
Marketing Communications | | | | | | | | | | | | | |
Revenue | | $ | 91.8 | | $ | 57.5 | | 59.7 | | $ | 167.0 | | $ | 107.8 | | 54.9 | |
Operating Income | | 10.1 | | 7.3 | | 38.6 | | 15.4 | | 11.5 | | 34.4 | |
margin | | 11.0 | % | 12.7 | % | | | 9.2 | % | 10.6 | % | | |
EBITDA | | 16.2 | | 9.3 | | 73.4 | | 24.9 | | 15.2 | | 64.1 | |
margin | | 17.6 | % | 16.2 | % | | | 14.9 | % | 14.1 | % | | |
MDC’s Share of EBITDA | | 10.7 | | 7.0 | | 52.9 | | 16.8 | | 11.5 | | 46.2 | |
margin | | 11.6 | % | 12.1 | % | | | 10.1 | % | 10.7 | % | | |
| | | | | | | | | | | | | |
Secured Products International | | | | | | | | | | | | | |
Revenue | | $ | 16.7 | | $ | 17.2 | | (3.2 | ) | $ | 33.9 | | $ | 35.3 | | (4.0 | ) |
Operating Income | | (1.3 | ) | 0.6 | | (333.5 | ) | (1.9 | ) | 0.9 | | (317.0 | ) |
margin | | NM | | 3.3 | % | | | NM | | 2.5 | % | | |
EBITDA | | (0.3 | ) | 1.4 | | (123.6 | ) | 0.2 | | 2.4 | | (93.3 | ) |
margin | | NM | | 8.0 | % | | | 0.5 | % | 6.7 | % | | |
| | | | | | | | | | | | | |
Corporate | | | | | | | | | | | | | |
Operating Income | | (5.2 | ) | (2.2 | ) | 133.6 | | (11.3 | ) | (11.0 | ) | 2.2 | |
EBITDA | | (4.1 | ) | (3.4 | ) | 20.0 | | (9.1 | ) | (6.2 | ) | 47.4 | |
2
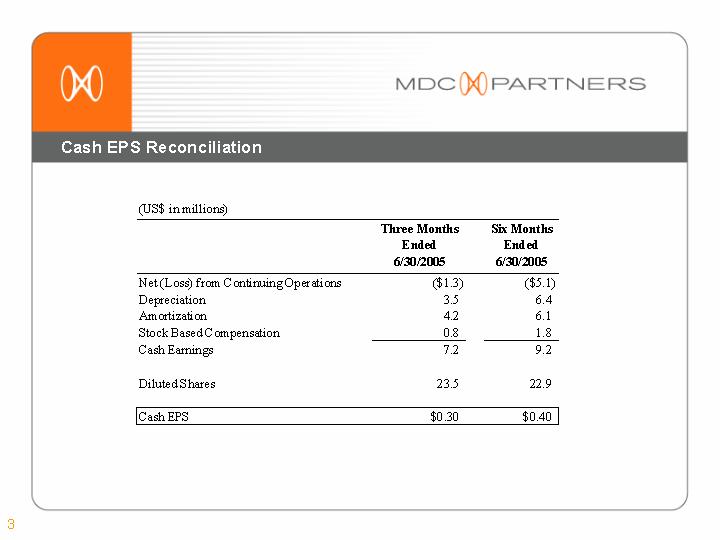
Cash EPS Reconciliation
(US$ in millions)
| | Three Months | | Six Months | |
| | Ended | | Ended | |
| | 6/30/2005 | | 6/30/2005 | |
Net (Loss) from Continuing Operations | | $ | (1.3 | ) | $ | (5.1 | ) |
Depreciation | | 3.5 | | 6.4 | |
Amortization | | 4.2 | | 6.1 | |
Stock Based Compensation | | 0.8 | | 1.8 | |
Cash Earnings | | 7.2 | | 9.2 | |
| | | | | |
Diluted Shares | | 23.5 | | 22.9 | |
| | | | | |
Cash EPS | | $ | 0.30 | | $ | 0.40 | |
| | | | | | | | | |
3
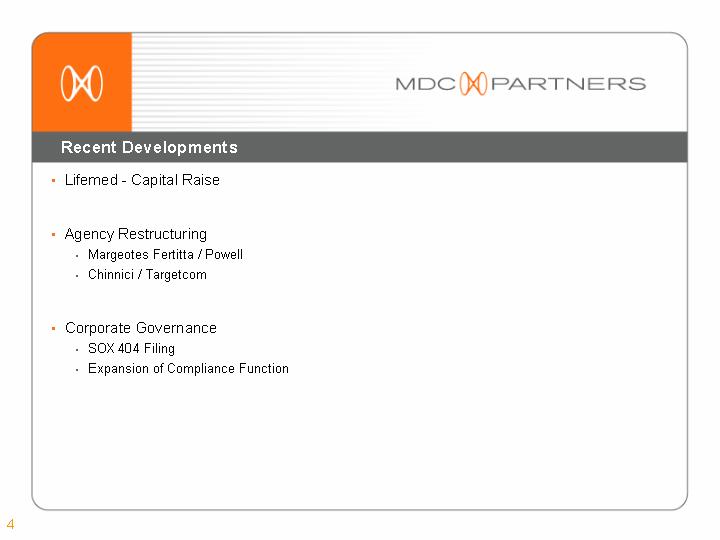
Recent Developments
• Lifemed - Capital Raise
• Agency Restructuring
• Margeotes Fertitta / Powell
• Chinnici / Targetcom
• Corporate Governance
• SOX 404 Filing
• Expansion of Compliance Function
4
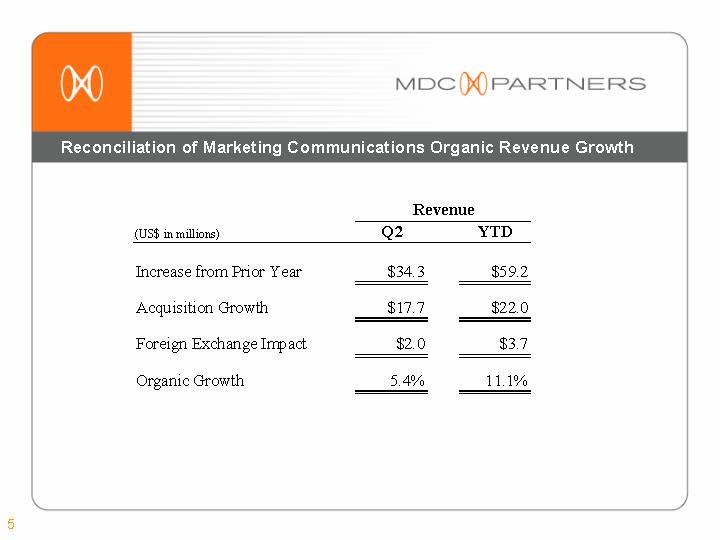
Reconciliation of Marketing Communications Organic Revenue Growth
| | Revenue | |
(US$ in millions) | | Q2 | | YTD | |
| | | | | |
Increase from Prior Year | | $ | 34.3 | | $ | 59.2 | |
Acquisition Growth | | $ | 17.7 | | $ | 22.0 | |
Foreign Exchange Impact | | $ | 2.0 | | $ | 3.7 | |
Organic Growth | | 5.4 | % | 11.1 | % |
5
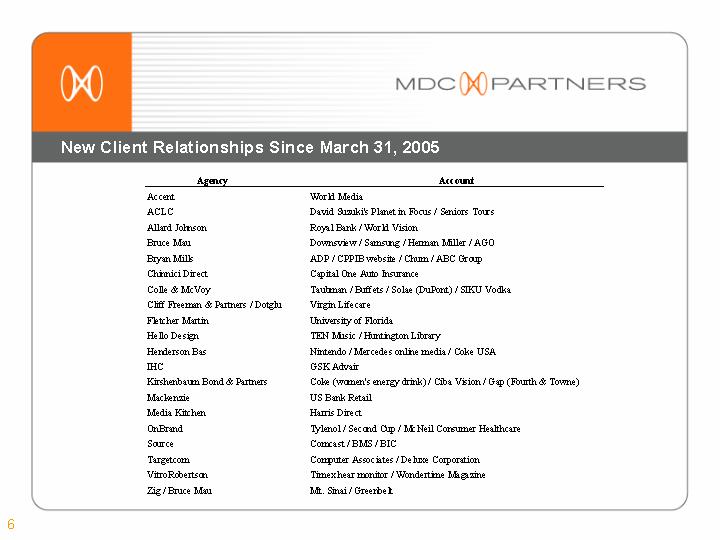
New Client Relationships Since March 31, 2005
Agency | | Account |
Accent | | World Media |
ACLC | | David Suzuki’s Planet in Focus / Seniors Tours |
Allard Johnson | | Royal Bank / World Vision |
Bruce Mau | | Downsview / Samsung / Herman Miller / AGO |
Bryan Mills | | ADP / CPPIB website / Chum / ABC Group |
Chinnici Direct | | Capital One Auto Insurance |
Colle & McVoy | | Taubman / Buffets / Solae (DuPont) / SIKU Vodka |
Cliff Freeman & Partners / Dotglu | | Virgin Lifecare |
Fletcher Martin | | University of Florida |
Hello Design | | TEN Music / Huntington Library |
Henderson Bas | | Nintendo / Mercedes online media / Coke USA |
IHC | | GSK Advair |
Kirshenbaum Bond & Partners | | Coke (women’s energy drink) / Ciba Vision / Gap (Fourth & Towne) |
Mackenzie | | US Bank Retail |
Media Kitchen | | Harris Direct |
OnBrand | | Tylenol / Second Cup / McNeil Consumer Healthcare |
Source | | Comcast / BMS / BIC |
Targetcom | | Computer Associates / Deluxe Corporation |
VitroRobertson | | Timex hear monitor / Wondertime Magazine |
Zig / Bruce Mau | | Mt. Sinai / Greenbelt |
6
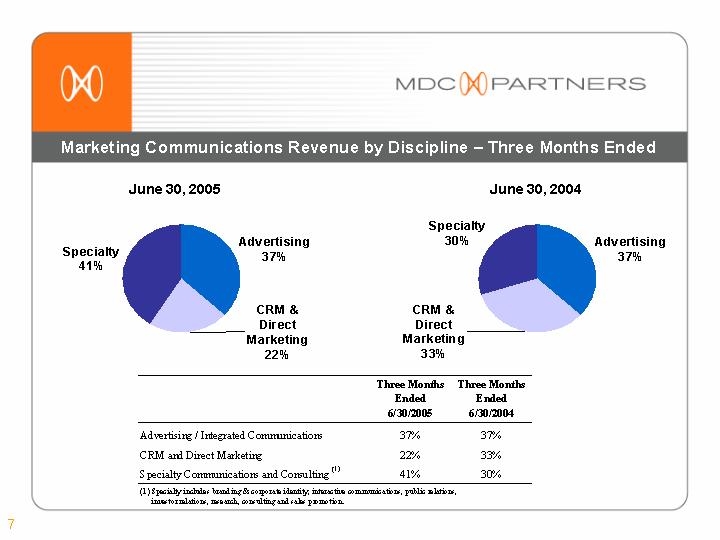
Marketing Communications Revenue by Discipline – Three Months Ended
June 30, 2005 | | June 30, 2004 |
| | |
[CHART] | | [CHART] |
| | Three Months | | Three Months | |
| | Ended | | Ended | |
| | 6/30/2005 | | 6/30/2004 | |
Advertising / Integrated Communications | | 37 | % | 37 | % |
CRM and Direct Marketing | | 22 | % | 33 | % |
Specialty Communications and Consulting (1) | | 41 | % | 30 | % |
(1) Specialty includes branding & corporate identity, interactive communications, public relations, investor relations, research, consulting and sales promotion.
7
Marketing Communications Revenue by Discipline – Six Months Ended
June 30, 2005 | | June 30, 2004 |
| | |
[CHART] | | [CHART] |
| | Six Months | | Six Months | |
| | Ended | | Ended | |
| | 6/30/2005 | | 6/30/2004 | |
Advertising / Integrated Communications | | 39 | % | 35 | % |
CRM and Direct Marketing | | 26 | % | 33 | % |
Specialty Communications and Consulting (1) | | 35 | % | 32 | % |
(1) Specialty includes branding & corporate identity, interactive communications, public relations, investor relations, research, consulting and sales promotion.
8
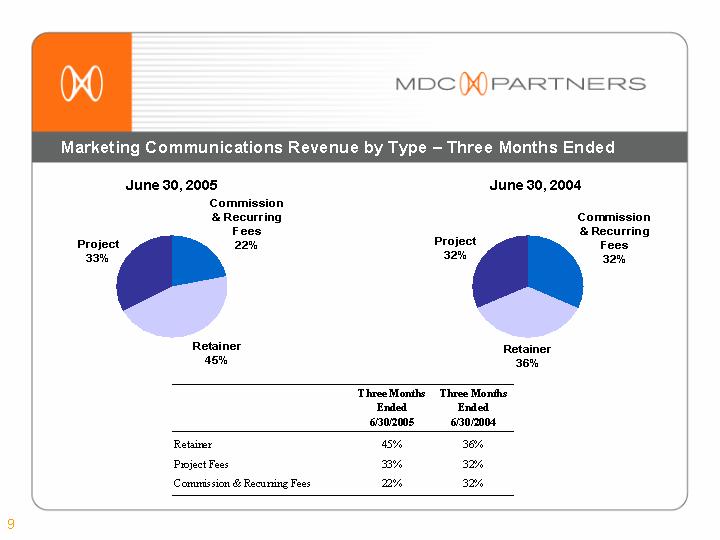
Marketing Communications Revenue by Type – Three Months Ended
June 30, 2005 | | June 30, 2004 |
| | |
[CHART] | | [CHART] |
| | Three Months | | Three Months | |
| | Ended | | Ended | |
| | 6/30/2005 | | 6/30/2004 | |
Retainer | | 45 | % | 36 | % |
Project Fees | | 33 | % | 32 | % |
Commission & Recurring Fees | | 22 | % | 32 | % |
9
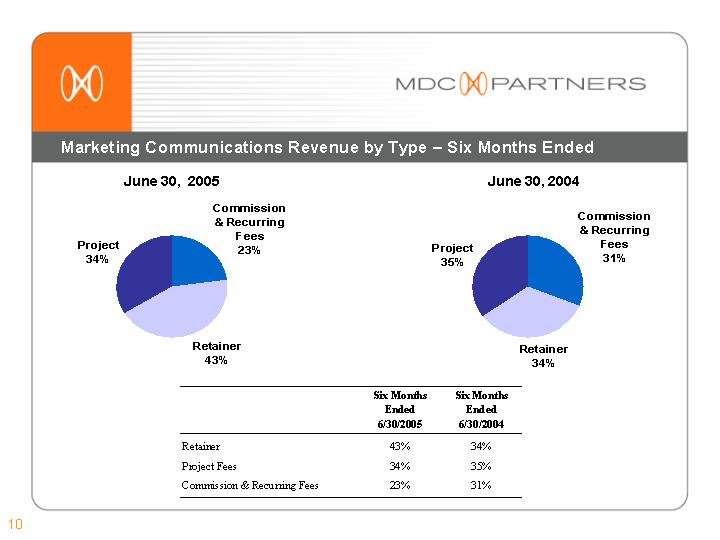
Marketing Communications Revenue by Type – Six Months Ended
June 30, 2005 | | June 30, 2004 |
| | |
[CHART] | | [CHART] |
| | Six Months | | Six Months | |
| | Ended | | Ended | |
| | 6/30/2005 | | 6/30/2004 | |
Retainer | | 43 | % | 34 | % |
Project Fees | | 34 | % | 35 | % |
Commission & Recurring Fees | | 23 | % | 31 | % |
10
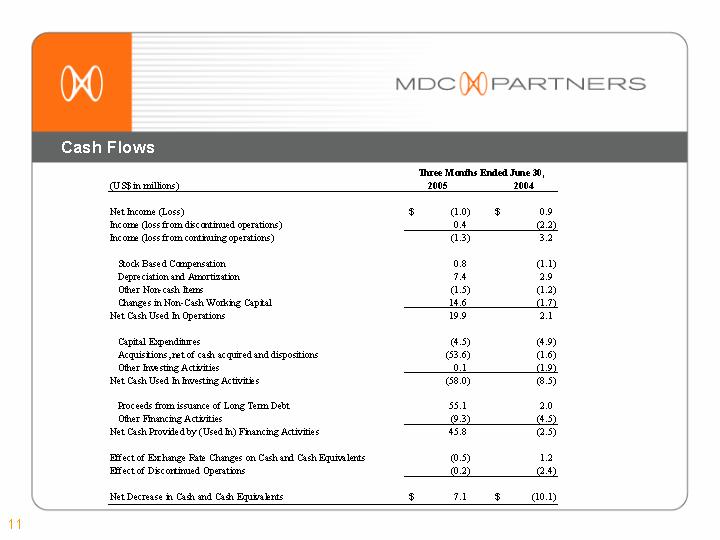
Cash Flows
| | Three Months Ended June 30, | |
(US$ in millions) | | 2005 | | 2004 | |
| | | | | |
Net Income (Loss) | | $ | (1.0 | ) | $ | 0.9 | |
Income (loss from discontinued operations) | | 0.4 | | (2.2 | ) |
Income (loss from continuing operations) | | (1.3 | ) | 3.2 | |
| | | | | |
Stock Based Compensation | | 0.8 | | (1.1 | ) |
Depreciation and Amortization | | 7.4 | | 2.9 | |
Other Non-cash Items | | (1.5 | ) | (1.2 | ) |
Changes in Non-Cash Working Capital | | 14.6 | | (1.7 | ) |
Net Cash Used In Operations | | 19.9 | | 2.1 | |
| | | | | |
Capital Expenditures | | (4.5 | ) | (4.9 | ) |
Acquisitions, net of cash acquired and dispositions | | (53.6 | ) | (1.6 | ) |
Other Investing Activities | | 0.1 | | (1.9 | ) |
Net Cash Used In Investing Activities | | (58.0 | ) | (8.5 | ) |
| | | | | |
Proceeds from issuance of Long Term Debt | | 55.1 | | 2.0 | |
Other Financing Activities | | (9.3 | ) | (4.5 | ) |
Net Cash Provided by (Used In) Financing Activities | | 45.8 | | (2.5 | ) |
| | | | | |
Effect of Exchange Rate Changes on Cash and Cash Equivalents | | (0.5 | ) | 1.2 | |
Effect of Discontinued Operations | | (0.2 | ) | (2.4 | ) |
| | | | | |
Net Decrease in Cash and Cash Equivalents | | $ | 7.1 | | $ | (10.1 | ) |
11
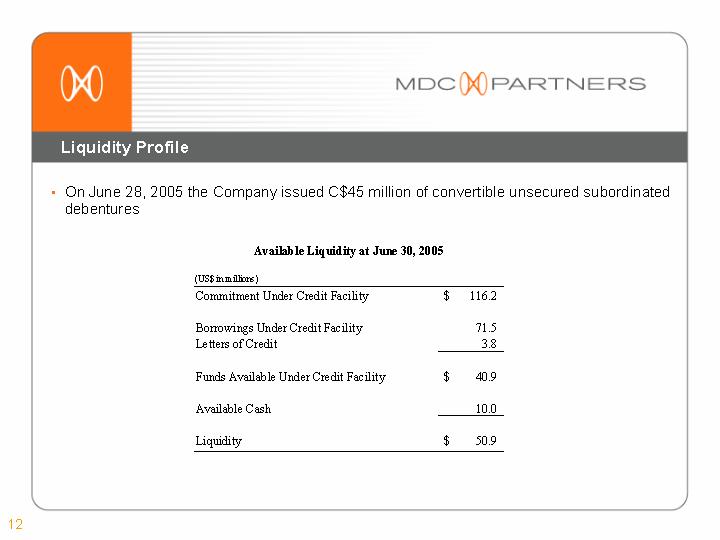
Liquidity Profile
• On June 28, 2005 the Company issued C$45 million of convertible unsecured subordinated debentures
Available Liquidity at June 30, 2005
(US$ in millions) | | | |
Commitment Under Credit Facility | | $ | 116.2 | |
| | | |
Borrowings Under Credit Facility | | 71.5 | |
Letters of Credit | | 3.8 | |
| | | |
Funds Available Under Credit Facility | | $ | 40.9 | |
| | | |
Available Cash | | 10.0 | |
| | | |
Liquidity | | $ | 50.9 | |
12
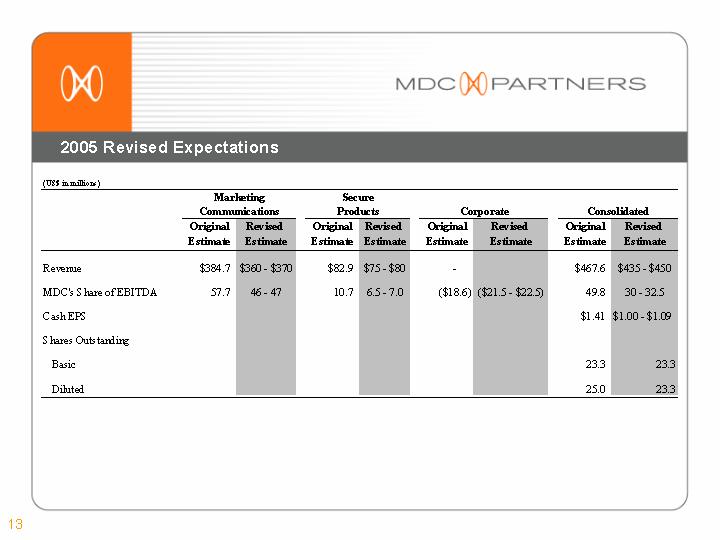
2005 Revised Expectations
(US$ in millions)
| | Marketing | | Secure | | | | | |
| | Communications | | Products | | Corporate | | Consolidated | |
| | Original | | Revised | | Original | | Revised | | Original | | Revised | | Original | | Revised | |
| | Estimate | | Estimate | | Estimate | | Estimate | | Estimate | | Estimate | | Estimate | | Estimate | |
| | | | | | | | | | | | | | | | | |
Revenue | | $ | 384.7 | | $360 - $370 | | $ | 82.9 | | $75 - $80 | | — | | | | $ | 467.6 | | $435 - $450 | |
| | | | | | | | | | | | | | | | | | | | |
MDC’s Share of EBITDA | | 57.7 | | 46 - 47 | | 10.7 | | 6.5 - 7.0 | | $ | (18.6 | ) | ($21.5 - $22.5) | | 49.8 | | 30 - 32.5 | |
| | | | | | | | | | | | | | | | | | |
Cash EPS | | | | | | | | | | | | | | $ | 1.41 | | $1.00 - $1.09 | |
| | | | | | | | | | | | | | | | | | |
Shares Outstanding | | | | | | | | | | | | | | | | | |
| | | | | | | | | | | | | | | | | |
Basic | | | | | | | | | | | | | | 23.3 | | 23.3 | |
| | | | | | | | | | | | | | | | | |
Diluted | | | | | | | | | | | | | | 25.0 | | 23.3 | |
13
Appendix
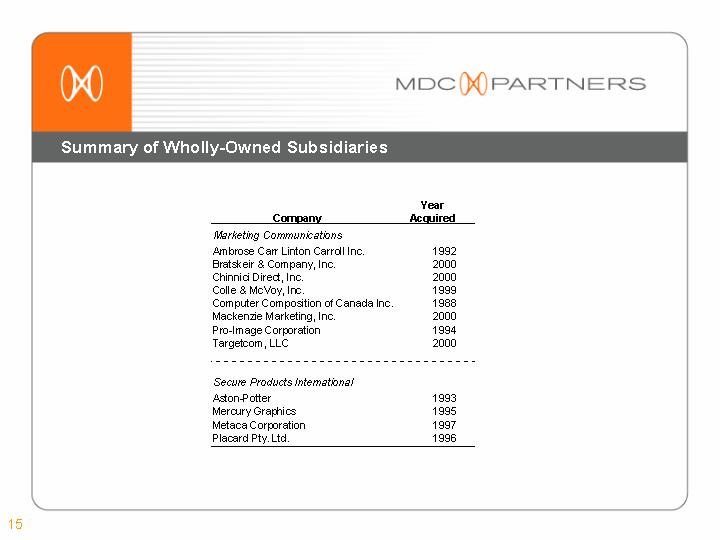
Summary of Wholly-Owned Subsidiaries
Company | | Year
Acquired | |
Marketing Communications | | | |
Ambrose Carr Linton Carroll Inc. | | 1992 | |
Bratskeir & Company, Inc. | | 2000 | |
Chinnici Direct, Inc. | | 2000 | |
Colle & McVoy, Inc. | | 1999 | |
Computer Composition of Canada Inc. | | 1988 | |
Mackenzie Marketing, Inc. | | 2000 | |
Pro-Image Corporation | | 1994 | |
Targetcom, LLC | | 2000 | |
| | | |
Secure Products International | | | |
Aston-Potter | | 1993 | |
Mercury Graphics | | 1995 | |
Metaca Corporation | | 1997 | |
Placard Pty. Ltd. | | 1996 | |
15
Less than Wholly-Owned and Incremental Ownership Summary
| | % Owned | | Ownership Potential Based on Outstanding Puts | |
Company | | at 6/30/05 | | 2005 | | 2006 | | 2007 | | 2008 | | 2009 | | 2010 | | 2011 | | 2012 | | 2013 | | 2014 | |
Accent Marketing Services | | 89.8 | % | 93.2 | % | 96.6 | % | 100.0 | % | — | | — | | — | | — | | — | | — | | — | |
Accumark Communications | | 55.0 | % | — | | — | | — | | — | | — | | — | | — | | — | | — | | — | |
Allard Johnson Communications | | 59.3 | % | 69.6 | % | — | | — | | — | | — | | — | | — | | — | | — | | — | |
Banjo | | 58.2 | % | — | | — | | — | | — | | — | | — | | — | | — | | — | | — | |
Bruce Mau Design | | 50.1 | % | — | | — | | — | | — | | — | | — | | — | | — | | — | | — | |
Bryan Mills Group | | 68.0 | % | 100.0 | % | — | | — | | — | | — | | — | | — | | — | | — | | — | |
Cliff Freeman and Partners | | 19.9 | % | — | | — | | — | | — | | — | | — | | — | | — | | — | | — | |
Crispin Porter & Bogusky | | 49.0 | % | — | | — | | 66.0 | % | 83.0 | % | 100.0 | % | — | | — | | — | | — | | — | |
Fletcher Martin Ewing | | 85.0 | % | 100.0 | % | — | | — | | — | | — | | — | | — | | — | | — | | — | |
Hello Design | | 51.0 | % | — | | — | | — | | — | | — | | — | | — | | — | | — | | — | |
Henderson Bas | | 65.0 | % | — | | — | | — | | — | | — | | — | | — | | — | | — | | — | |
Integrated Healthcare Communications | | 80.0 | % | 100.0 | % | — | | — | | — | | — | | — | | — | | — | | — | | — | |
Kirshenbaum Bond & Partners | | 60.0 | % | — | | — | | — | | 100.0 | % | — | | — | | — | | — | | — | | — | |
Lifemed | | 45.0 | % | — | | — | | — | | — | | — | | — | | — | | — | | — | | — | |
Mageotes / Fertitta + Partners | | 80.0 | % | 100.0 | % | — | | — | | — | | — | | — | | — | | — | | — | | — | |
Mono Advertising | | 49.0 | % | — | | — | | — | | — | | — | | 54.0 | % | 59.0 | % | 64.0 | % | 69.0 | % | 74.0 | % |
Northstar Research Partners | | 50.1 | % | 100.0 | % | — | | — | | — | | — | | — | | — | | — | | — | | — | |
Onbrand Design (formerly Strategies) | | 85.0 | % | — | | — | | — | | — | | — | | — | | — | | — | | — | | — | |
Source Marketing | | 87.7 | % | 100.0 | % | — | | — | | — | | — | | — | | — | | — | | — | | — | |
Veritas Communications | | 58.8 | % | — | | — | | — | | — | | — | | — | | — | | — | | — | | — | |
Vitro Robertson | | 68.0 | % | — | | — | | — | | — | | — | | — | | 100.0 | % | — | | — | | — | |
Zig | | 49.9 | % | — | | — | | — | | — | | 79.9 | % | — | | — | | — | | — | | — | |
Zyman | | 61.6 | % | — | | — | | — | | — | | — | | — | | 67.1 | % | — | | — | | — | |
Note: All businesses are consolidated for accounting purposes except Accumark, Cliff Freeman, Mono and Zig which are accounted for using the equity method.
16
Definition of Non-GAAP Metrics
• EBITDA: EBITDA is a non-GAAP measure, that represents operating profit plus depreciation and amortization plus stock-based compensation. A reconciliation of “EBITDA”to the US GAAP reported results of operations has been provided by the Company in the tables included in the earnings release issued on August 5, 2005.
17