Exhibit 99.2

November 5, 2019 Management Presentation Third Quarter 2019 Results
2 FORWARD LOOKING STATEMENTS & OTHER INFORMATION This presentation contains forward - looking statements . Statements in this presentation that are not historical facts, including without limitation statements about the Company’s beliefs and expectations, earnings guidance, recent business and economic trends, potential acquisitions, and estimates of amounts for redeemable noncontrolling interests and deferred acquisition consideration, constitute forward - looking statements . Words such as “estimates”, “expects”, “contemplates”, “will”, “anticipates”, “projects”, “plans”, “intends”, “believes”, “forecasts”, “may”, “should”, and variations of such words or similar expressions are intended to identify forward - looking statements . These statements are based on current plans, estimates and projections, and are subject to change based on a number of factors, including those outlined below . Forward - looking statements speak only as of the date they are made, and the Company undertakes no obligation to update publicly any of them in light of new information or future events, if any . Forward - looking statements involve inherent risks and uncertainties . A number of important factors could cause actual results to differ materially from those contained in any forward - looking statements . Such risk factors include, but are not limited to, the following : • risks associated with severe effects of international, national and regional economic conditions ; • the Company’s ability to attract new clients and retain existing clients ; • the spending patterns and financial success of the Company’s clients ; • the Company’s ability to retain and attract key employees ; • the Company’s ability to remain in compliance with its debt agreements and the Company’s ability to finance its contingent payment obligations when due and payable, including but not limited to those relating to redeemable noncontrolling interests and deferred acquisition consideration ; • the successful completion and integration of acquisitions which complement and expand the Company’s business capabilities, and the potential impact of one or more asset sales ; and • foreign currency fluctuations . Investors should carefully consider these risk factors and the additional risk factors outlined in more detail in the Company’s 2018 Annual Report on Form 10 - K filed with the Securities and Exchange Commission (the "SEC") under the caption “Risk Factors”, and in the Company’s other SEC filings .
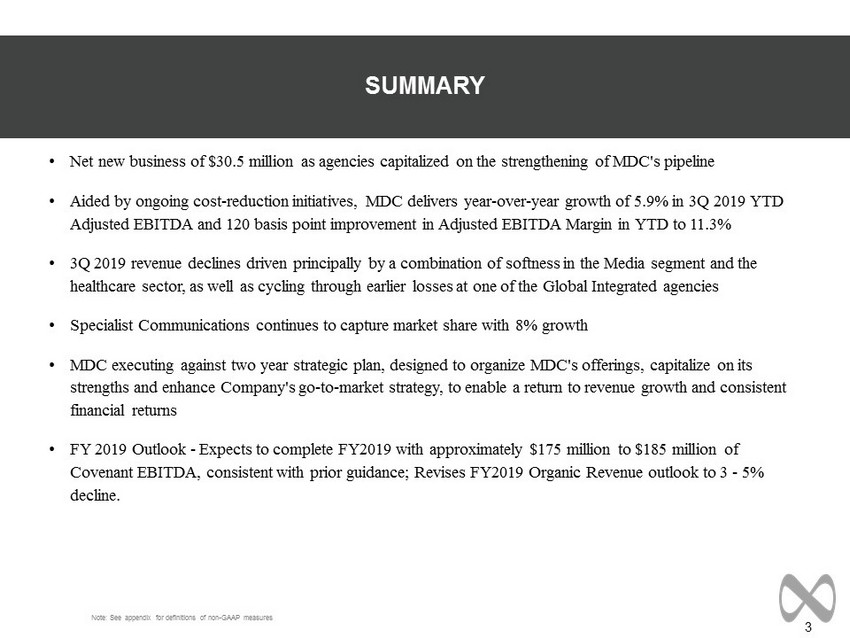
3 SUMMARY • Net new business of $30.5 million as agencies capitalized on the strengthening of MDC's pipeline • Aided by ongoing cost - reduction initiatives, MDC delivers year - over - year growth of 5.9% in 3Q 2019 YTD Adjusted EBITDA and 120 basis point improvement in Adjusted EBITDA Margin in YTD to 11.3% • 3Q 2019 revenue declines driven principally by a combination of softness in the Media segment and the healthcare sector, as well as cycling through earlier losses at one of the Global Integrated agencies • Specialist Communications continues to capture market share with 8% growth • MDC executing against two year strategic plan, designed to organize MDC's offerings, capitalize on its strengths and enhance Company's go - to - market strategy, to enable a return to revenue growth and consistent financial returns • FY 2019 Outlook - Expects to complete FY2019 with approximately $175 million to $185 million of Covenant EBITDA, consistent with prior guidance; Revises FY2019 Organic Revenue outlook to 3 - 5% decline. Note: See appendix for definitions of non - GAAP measures
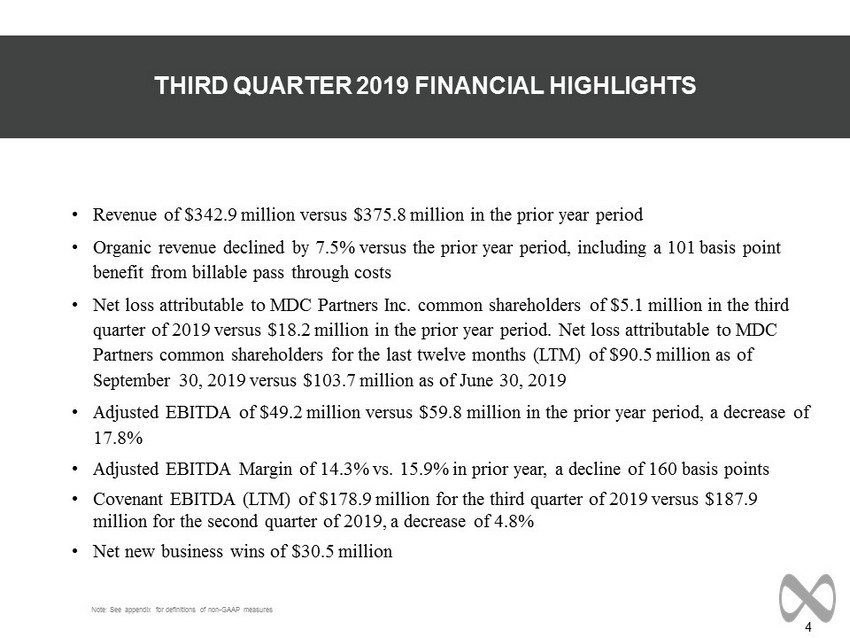
4 ----- DRAFT ----- • Revenue of $342.9 million versus $375.8 million in the prior year period • Organic revenue declined by 7.5% versus the prior year period, including a 101 basis point benefit from billable pass through costs • Net loss attributable to MDC Partners Inc. common shareholders of $5.1 million in the third quarter of 2019 versus $18.2 million in the prior year period. Net loss attributable to MDC Partners common shareholders for the last twelve months (LTM) of $90.5 million as of September 30, 2019 versus $103.7 million as of June 30, 2019 • Adjusted EBITDA of $49.2 million versus $59.8 million in the prior year period, a decrease of 17.8% • Adjusted EBITDA Margin of 14.3% vs. 15.9% in prior year, a decline of 160 basis points • Covenant EBITDA (LTM) of $178.9 million for the third quarter of 2019 versus $187.9 million for the second quarter of 2019, a decrease of 4.8% • Net new business wins of $30.5 million THIRD QUARTER 2019 FINANCIAL HIGHLIGHTS Note: See appendix for definitions of non - GAAP measures
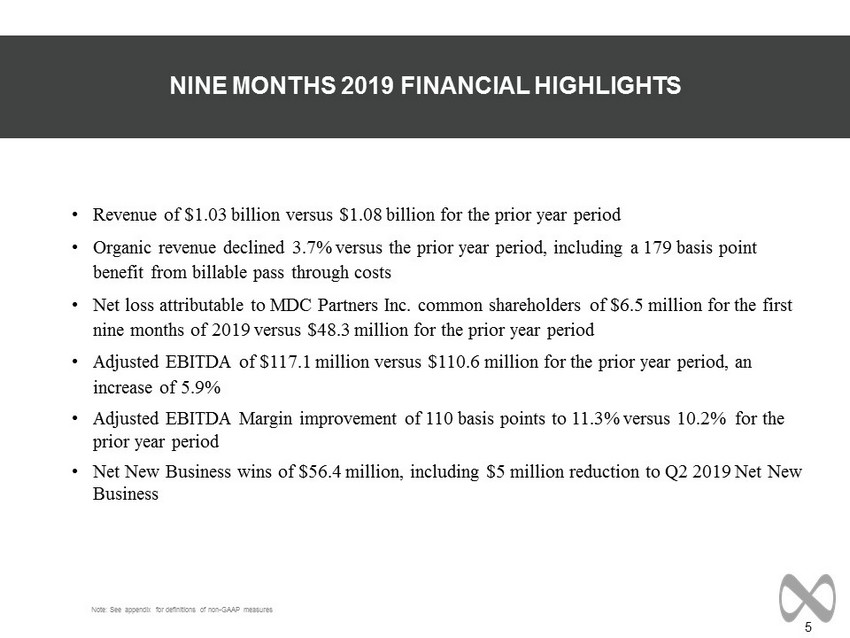
5 ----- DRAFT ----- • Revenue of $1.03 billion versus $1.08 billion for the prior year period • Organic revenue declined 3.7% versus the prior year period, including a 179 basis point benefit from billable pass through costs • Net loss attributable to MDC Partners Inc. common shareholders of $6.5 million for the first nine months of 2019 versus $48.3 million for the prior year period • Adjusted EBITDA of $117.1 million versus $110.6 million for the prior year period, an increase of 5.9% • Adjusted EBITDA Margin improvement of 110 basis points to 11.3% versus 10.2% for the prior year period • Net New Business wins of $56.4 million, including $5 million reduction to Q2 2019 Net New Business NINE MONTHS 2019 FINANCIAL HIGHLIGHTS Note: See appendix for definitions of non - GAAP measures
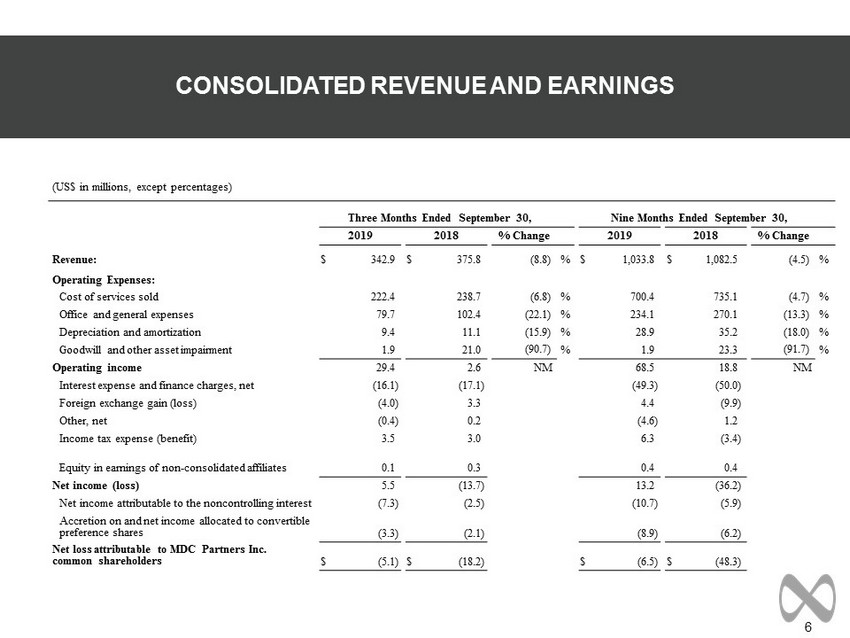
6 CONSOLIDATED REVENUE AND EARNINGS (US$ in millions, except percentages) Three Months Ended September 30, Nine Months Ended September 30, 2019 2018 % Change 2019 2018 % Change Revenue: $ 342.9 $ 375.8 (8.8 ) % $ 1,033.8 $ 1,082.5 (4.5 ) % Operating Expenses: Cost of services sold 222.4 238.7 (6.8 ) % 700.4 735.1 (4.7 ) % Office and general expenses 79.7 102.4 (22.1 ) % 234.1 270.1 (13.3 ) % Depreciation and amortization 9.4 11.1 (15.9 ) % 28.9 35.2 (18.0 ) % Goodwill and other asset impairment 1.9 21.0 (90.7 ) % 1.9 23.3 (91.7 ) % Operating income 29.4 2.6 NM 68.5 18.8 NM Interest expense and finance charges, net (16.1 ) (17.1 ) (49.3 ) (50.0 ) Foreign exchange gain (loss) (4.0 ) 3.3 4.4 (9.9 ) Other, net (0.4 ) 0.2 (4.6 ) 1.2 Income tax expense (benefit) 3.5 3.0 6.3 (3.4 ) Equity in earnings of non - consolidated affiliates 0.1 0.3 0.4 0.4 Net income (loss) 5.5 (13.7 ) 13.2 (36.2 ) Net income attributable to the noncontrolling interest (7.3 ) (2.5 ) (10.7 ) (5.9 ) Accretion on and net income allocated to convertible preference shares (3.3 ) (2.1 ) (8.9 ) (6.2 ) Net loss attributable to MDC Partners Inc. common shareholders $ (5.1 ) $ (18.2 ) $ (6.5 ) $ (48.3 )
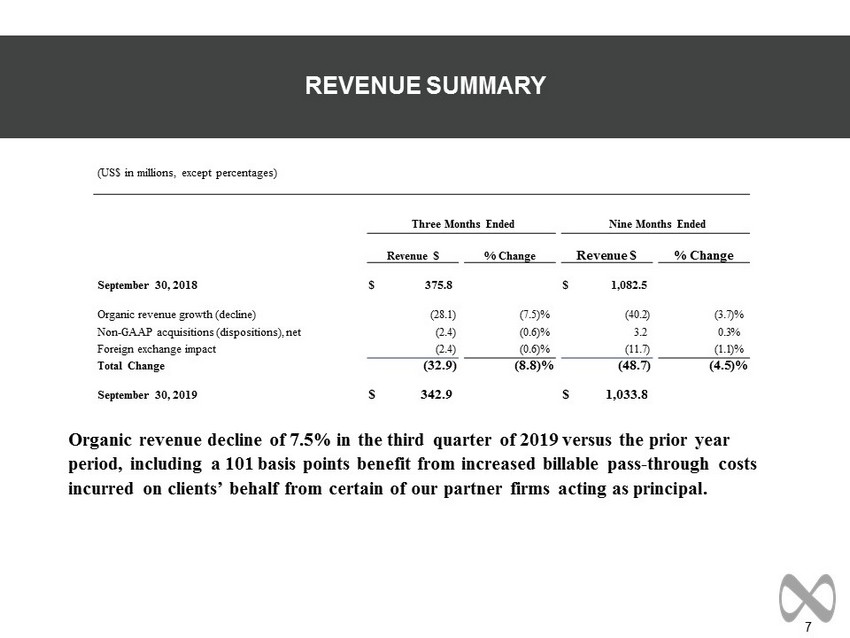
7 Organic revenue decline of 7.5% in the third quarter of 2019 versus the prior year period, including a 101 basis points benefit from increased billable pass - through costs incurred on clients’ behalf from certain of our partner firms acting as principal. REVENUE SUMMARY (US$ in millions, except percentages) Three Months Ended Nine Months Ended Revenue $ % Change Revenue $ % Change September 30, 2018 $ 375.8 $ 1,082.5 Organic revenue growth (decline) (28.1 ) (7.5 )% (40.2 ) (3.7 )% Non - GAAP acquisitions (dispositions), net (2.4 ) (0.6 )% 3.2 0.3 % Foreign exchange impact (2.4 ) (0.6 )% (11.7 ) (1.1 )% Total Change (32.9 ) (8.8 )% (48.7 ) (4.5 )% September 30, 2019 $ 342.9 $ 1,033.8
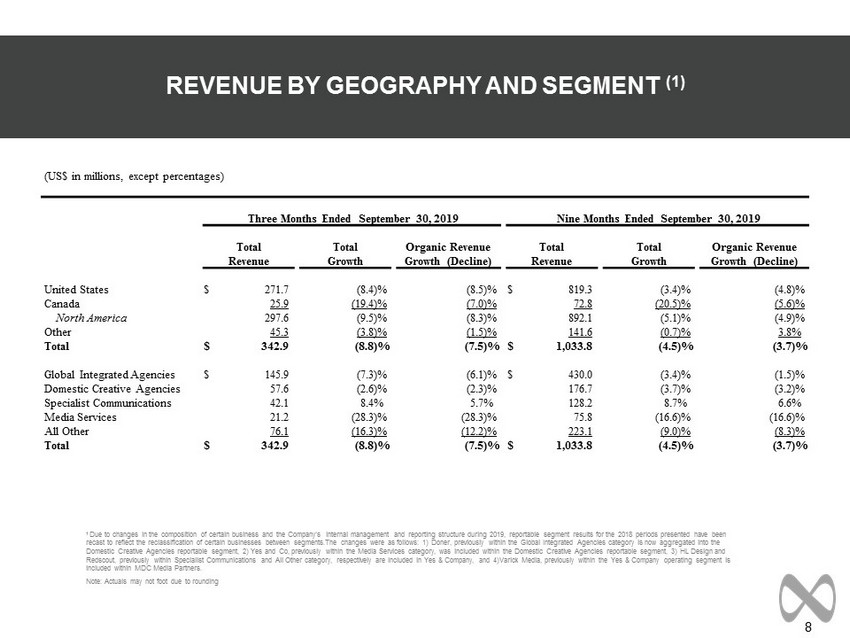
8 REVENUE BY GEOGRAPHY AND SEGMENT (1) 1 Due to changes in the composition of certain business and the Company’s internal management and reporting structure during 20 19, reportable segment results for the 2018 periods presented have been recast to reflect the reclassification of certain businesses between segments.The changes were as follows: 1) Doner, previous ly within the Global Integrated Agencies category is now aggregated into the Domestic Creative Agencies reportable segment, 2) Yes and Co, previously within the Media Services category, was included wit hin the Domestic Creative Agencies reportable segment, 3) HL Design and Redscout, previously within Specialist Communications and All Other category, respectively are included in Yes & Company, and 4) Varick Media, previously within the Yes & Company operating segment is included within MDC Media Partners. Note: Actuals may not foot due to rounding (US$ in millions, except percentages) Three Months Ended September 30, 2019 Nine Months Ended September 30, 2019 Total Total Organic Revenue Total Total Organic Revenue Revenue Growth Growth (Decline) Revenue Growth Growth (Decline) United States $ 271.7 (8.4 )% (8.5 )% $ 819.3 (3.4 )% (4.8 )% Canada 25.9 (19.4 )% (7.0 )% 72.8 (20.5 )% (5.6 )% North America 297.6 (9.5 )% (8.3 )% 892.1 (5.1 )% (4.9 )% Other 45.3 (3.8 )% (1.5 )% 141.6 (0.7 )% 3.8 % Total $ 342.9 (8.8 )% (7.5 )% $ 1,033.8 (4.5 )% (3.7 )% Global Integrated Agencies $ 145.9 (7.3 )% (6.1 )% $ 430.0 (3.4 )% (1.5 )% Domestic Creative Agencies 57.6 (2.6 )% (2.3 )% 176.7 (3.7 )% (3.2 )% Specialist Communications 42.1 8.4 % 5.7 % 128.2 8.7 % 6.6 % Media Services 21.2 (28.3 )% (28.3 )% 75.8 (16.6 )% (16.6 )% All Other 76.1 (16.3 )% (12.2 )% 223.1 (9.0 )% (8.3 )% Total $ 342.9 (8.8 )% (7.5 )% $ 1,033.8 (4.5 )% (3.7 )%
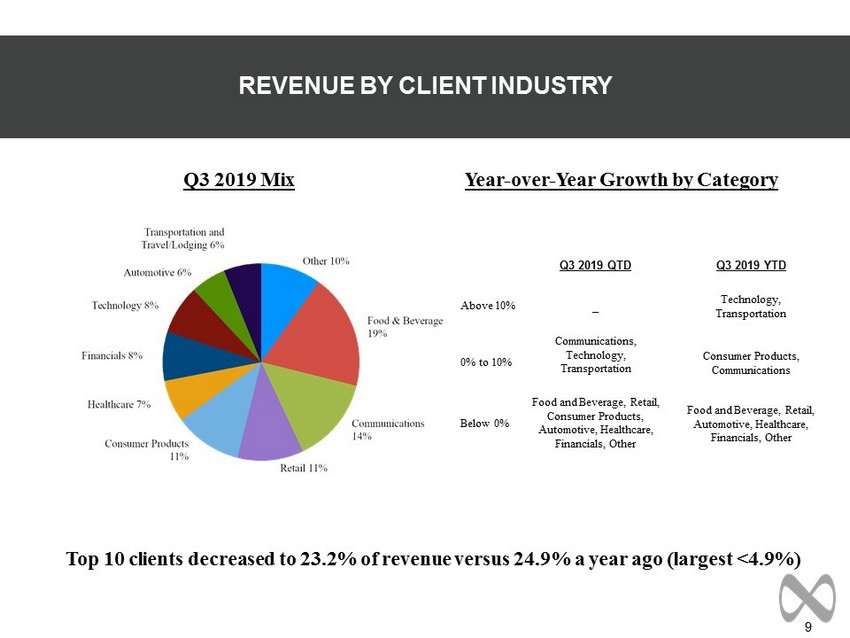
9 Top 10 clients decreased to 23.2% of revenue versus 24.9% a year ago (largest <4.9%) REVENUE BY CLIENT INDUSTRY Q3 2019 QTD Q3 2019 YTD Above 10% _ Technology, Transportation 0% to 10% Communications, Technology, Transportation Consumer Products, Communications Below 0% Food and Beverage, Retail, Consumer Products, Automotive, Healthcare, Financials, Other Food and Beverage, Retail, Automotive, Healthcare, Financials, Other Year - over - Year Growth by Category Q3 2019 Mix

10 ADJUSTED EBITDA (1) 1 Due to changes in the composition of certain business and the Company’s internal management and reporting structure during 20 19, reportable segment results for the 2018 periods presented have been recast to reflect the reclassification of certain businesses between segments.The changes were as follows: 1) Doner, previously with in the Global Integrated Agencies category is now aggregated into the Domestic Creative Agencies reportable segment, 2) Yes and Co, previously within the Media Services category, was included within the D ome stic Creative Agencies reportable segment, 3) HL Design and Redscout, previously within Specialist Communications and All Other category, respectively are included in Yes & Company, and 4)Varick Med ia, previously within the Yes & Company operating segment is included within MDC Media Partners. 2 Adjusted EBITDA is a non - GAAP measure. See appendix for the definition. Note: Actuals may not foot due to rounding. (US$ in millions, except percentages) Three Months Ended September 30, Nine Months Ended September 30, 2019 2018 % Change 2019 2018 % Change Advertising and Communications Group $ 56.5 $ 68.2 (17.2 ) % $ 137.6 $ 140.9 (2.3 ) % Global Integrated Agencies 31.2 38.4 (18.8 ) % 66.0 59.1 11.7 % Domestic Creative Agencies 9.2 4.7 95.7 % 27.2 17.3 57.2 % Specialist Communications 7.3 6.3 15.9 % 21.3 19.2 10.9 % Media Services (0.9 ) 1.6 (156.3 ) % (1.0 ) 2.3 (143.5 ) % All Other 9.8 17.2 (43.0 ) % 24.0 43.0 (44.2 ) % Corporate Group (7.3 ) (8.4 ) (13.1 ) % (20.5 ) (30.3 ) (32.3 ) % Adjusted EBITDA (2) $ 49.2 $ 59.8 (17.7 ) % $ 117.1 $ 110.6 5.9 % margin 14.3 % 15.9 % 11.3 % 10.2 %

11 COVENANT EBITDA 2018 2019 Covenant EBITDA (LTM) (1) (US$ in millions) Q3 Q4 Q1 Q2 Q3 Q2 - 2019 - LTM Q3 - 2019 - LTM Net income (loss) attributable to MDC Partners Inc. common shareholders $ (18.2 ) $ (83.7 ) $ (2.5 ) $ 0.8 $ (5.1 ) $ (103.7 ) $ (90.5 ) Adjustments to reconcile to operating profit (loss): Accretion on and net income allocated to convertible preference shares 2.1 2.2 2.4 3.5 3.3 10.2 11.4 Net income attributable to the noncontrolling interests 2.5 5.9 0.4 3.0 7.3 11.8 16.6 Equity in earnings (losses) of non - consolidated affiliates (0.3 ) 0.3 (0.1 ) (0.2 ) (0.1 ) (0.3 ) (0.1 ) Income tax expense 3.0 35.0 0.7 2.1 3.5 40.8 41.3 Interest expense and finance charges, net 17.1 17.1 16.8 16.4 16.1 67.3 66.4 Foreign exchange loss (gain) (3.3 ) 13.3 (5.4 ) (2.9 ) 4.0 1.7 8.9 Other income, net (0.2 ) 1.0 3.4 0.7 0.4 4.9 5.6 Operating income (loss) 2.6 (9.1 ) 15.7 23.4 29.4 32.7 59.5 Adjustments to reconcile to Adjusted EBITDA: Depreciation and amortization 11.1 11.0 8.8 10.7 9.4 41.6 39.9 Goodwill and other asset impairment 21.0 56.7 — — 1.9 77.7 58.7 Stock - based compensation 6.2 1.5 3.0 3.6 6.0 14.4 14.2 Deferred acquisition consideration adjustments 11.0 (9.0 ) (7.6 ) 2.1 1.9 (3.5 ) (12.6 ) Distributions from non - consolidated affiliates 0.5 0.3 — — (0.2 ) 0.8 0.1 Other items, net (2) 7.3 0.5 1.6 6.6 0.7 16.0 9.4 Adjusted EBITDA 59.8 52.0 21.5 46.4 49.2 179.7 169.1 Adjustments to reconcile to Covenant EBITDA: Proforma acquisitions/dispositions (1.2 ) (2.1 ) (2.0 ) — — (5.3 ) (4.1 ) Severance due to eliminated positions 1.2 3.6 1.5 2.3 2.0 8.7 9.5 Other adjustments, net (3) 0.6 1.9 1.4 1.0 0.2 4.9 4.5 $ 60.4 $ 55.3 $ 22.5 $ 49.8 $ 51.4 $ 187.9 $ 178.9 (1) Covenant EBITDA is a measure that includes pro forma adjustments for acquisitions, one - time charges, and other adjustments, as defined in the Credit Agreement. Covenant EBITDA is calculated as the aggregate of operating results for the rolling last twelve months (LTM). Each quarter is presente d t o provide the information utilized to calculate Covenant EBITDA. Historical Covenant EBITDA may be recasted in the current period for any proforma adjustments related to acq uis itions and/or dispositions in the current period. (2) Other items, net includes items such as severance expense and other restructuring expenses and costs associated with the com pany's strategic review process. (3) Other adjustments, net primarily includes one time professional fees and costs associated with real estate consolidation. Note: Actuals may not foot due to rounding.

12 SUMMARY OF CASH FLOW (US$ in millions) Nine Months Ended September 30, 2019 2018 Net cash used in operating activities $ (5.8 ) $ (31.7 ) Net cash provided by (used in) investing activities 3.3 (48.4 ) Net cash provided by (used in) financing activities (2.2 ) 59.1 Effect of exchange rate changes on cash, cash equivalents, and cash held in trusts — (0.2 ) Net decrease in cash, cash equivalents, and cash held in trusts including cash classified within assets held for sale (4.7 ) (21.1 ) Change in cash and cash equivalents held in trusts classified within held for sale (3.3 ) — Change in cash and cash equivalents classified within assets held for sale 4.4 — Net decrease in cash and cash equivalents $ (3.6 ) $ (21.1 )
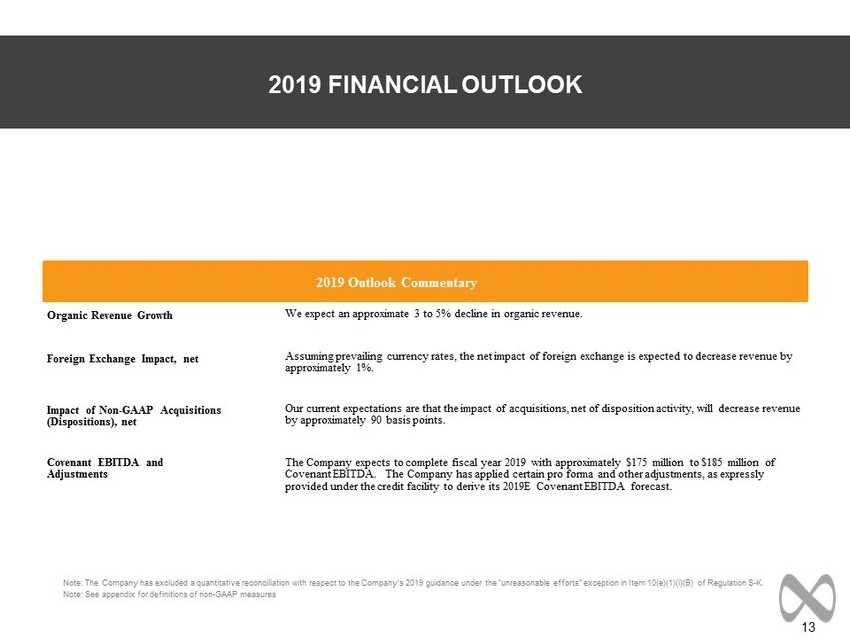
13 2019 FINANCIAL OUTLOOK Note: The Company has excluded a quantitative reconciliation with respect to the Company’s 2019 guidance under the “unreasona ble efforts” exception in Item 10(e)(1)(i)(B) of Regulation S - K. Note: See appendix for definitions of non - GAAP measures 2019 Outlook Commentary Organic Revenue Growth We expect an approximate 3 to 5% decline in organic revenue. Foreign Exchange Impact, net Assuming prevailing currency rates, the net impact of foreign exchange is expected to decrease revenue by approximately 1%. Impact of Non - GAAP Acquisitions (Dispositions), net Our current expectations are that the impact of acquisitions, net of disposition activity, will decrease revenue by approximately 90 basis points. Covenant EBITDA and Adjustments The Company expects to complete fiscal year 2019 with approximately $17 5 million to $18 5 million of Covenant EBITDA. The Company has applied certain pro forma and other adjustments, as expressly provided under the credit facility to derive its 2019E Covenant EBITDA forecast.

14 APPENDIX
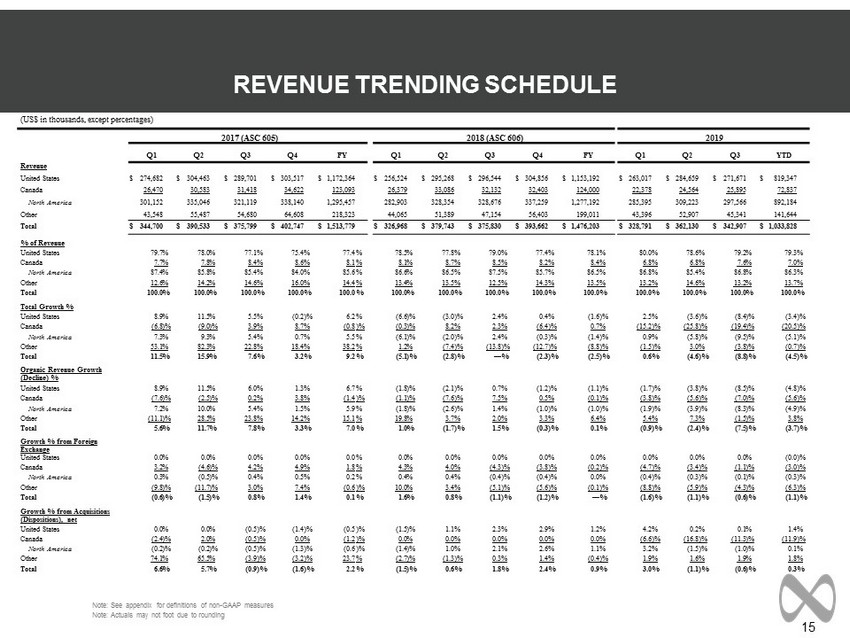
15 REVENUE TRENDING SCHEDULE Note: See appendix for definitions of non - GAAP measures Note: Actuals may not foot due to rounding (US$ in thousands, except percentages) 2017 (ASC 605) 2018 (ASC 606) 2019 Q1 Q2 Q3 Q4 FY Q1 Q2 Q3 Q4 FY Q1 Q2 Q3 YTD Revenue United States $ 274,682 $ 304,463 $ 289,701 $ 303,517 $ 1,172,364 $ 256,524 $ 295,268 $ 296,544 $ 304,856 $ 1,153,192 $ 263,017 $ 284,659 $ 271,671 $ 819,347 Canada 26,470 30,583 31,418 34,622 123,093 26,379 33,086 32,132 32,403 124,000 22,378 24,564 25,895 72,837 North America 301,152 335,046 321,119 338,140 1,295,457 282,903 328,354 328,676 337,259 1,277,192 285,395 309,223 297,566 892,184 Other 43,548 55,487 54,680 64,608 218,323 44,065 51,389 47,154 56,403 199,011 43,396 52,907 45,341 141,644 Total $ 344,700 $ 390,533 $ 375,799 $ 402,747 $ 1,513,779 $ 326,968 $ 379,743 $ 375,830 $ 393,662 $ 1,476,203 $ 328,791 $ 362,130 $ 342,907 $ 1,033,828 % of Revenue United States 79.7 % 78.0 % 77.1 % 75.4 % 77.4 % 78.5 % 77.8 % 79.0 % 77.4 % 78.1 % 80.0 % 78.6 % 79.2 % 79.3 % Canada 7.7 % 7.8 % 8.4 % 8.6 % 8.1 % 8.1 % 8.7 % 8.5 % 8.2 % 8.4 % 6.8 % 6.8 % 7.6 % 7.0 % North America 87.4 % 85.8 % 85.4 % 84.0 % 85.6 % 86.6 % 86.5 % 87.5 % 85.7 % 86.5 % 86.8 % 85.4 % 86.8 % 86.3 % Other 12.6 % 14.2 % 14.6 % 16.0 % 14.4 % 13.4 % 13.5 % 12.5 % 14.3 % 13.5 % 13.2 % 14.6 % 13.2 % 13.7 % Total 100.0 % 100.0 % 100.0 % 100.0 % 100.0 % 100.0 % 100.0 % 100.0 % 100.0 % 100.0 % 100.0 % 100.0 % 100.0 % 100.0 % Total Growth % United States 8.9 % 11.5 % 5.5 % (0.2 )% 6.2 % (6.6 )% (3.0 )% 2.4 % 0.4 % (1.6 )% 2.5 % (3.6 )% (8.4 )% (3.4 )% Canada (6.8 )% (9.0 )% 3.9 % 8.7 % (0.8 )% (0.3 )% 8.2 % 2.3 % (6.4 )% 0.7 % (15.2 )% (25.8 )% (19.4 )% (20.5 )% North America 7.3 % 9.3 % 5.4 % 0.7 % 5.5 % (6.1 )% (2.0 )% 2.4 % (0.3 )% (1.4 )% 0.9 % (5.8 )% (9.5 )% (5.1 )% Other 53.1 % 82.3 % 22.8 % 18.4 % 38.2 % 1.2 % (7.4 )% (13.8 )% (12.7 )% (8.8 )% (1.5 )% 3.0 % (3.8 )% (0.7 )% Total 11.5 % 15.9 % 7.6 % 3.2 % 9.2 % (5.1 )% (2.8 )% — % (2.3 )% (2.5 )% 0.6 % (4.6 )% (8.8 )% (4.5 )% Organic Revenue Growth (Decline) % United States 8.9 % 11.5 % 6.0 % 1.3 % 6.7 % (1.8 )% (2.1 )% 0.7 % (1.2 )% (1.1 )% (1.7 )% (3.8 )% (8.5 )% (4.8 )% Canada (7.6 )% (2.5 )% 0.2 % 3.8 % (1.4 )% (1.1 )% (7.6 )% 7.5 % 0.5 % (0.1 )% (3.8 )% (5.6 )% (7.0 )% (5.6 )% North America 7.2 % 10.0 % 5.4 % 1.5 % 5.9 % (1.8 )% (2.6 )% 1.4 % (1.0 )% (1.0 )% (1.9 )% (3.9 )% (8.3 )% (4.9 )% Other (11.1 )% 28.5 % 23.8 % 14.2 % 15.1 % 19.8 % 3.7 % 2.0 % 3.3 % 6.4 % 5.4 % 7.3 % (1.5 )% 3.8 % Total 5.6 % 11.7 % 7.8 % 3.3 % 7.0 % 1.0 % (1.7 )% 1.5 % (0.3 )% 0.1 % (0.9 )% (2.4 )% (7.5 )% (3.7 )% Growth % from Foreign Exchange United States 0.0 % 0.0 % 0.0 % 0.0 % 0.0 % 0.0 % 0.0 % 0.0 % 0.0 % 0.0 % 0.0 % 0.0 % 0.0 % (0.0 )% Canada 3.2 % (4.6 )% 4.2 % 4.9 % 1.8 % 4.3 % 4.0 % (4.3 )% (3.8 )% (0.2 )% (4.7 )% (3.4 )% (1.1 )% (3.0 )% North America 0.3 % (0.5 )% 0.4 % 0.5 % 0.2 % 0.4 % 0.4 % (0.4 )% (0.4 )% 0.0 % (0.4 )% (0.3 )% (0.1 )% (0.3 )% Other (9.8 )% (11.7 )% 3.0 % 7.4 % (0.6 )% 10.0 % 3.4 % (5.1 )% (5.6 )% (0.1 )% (8.8 )% (5.9 )% (4.3 )% (6.3 )% Total (0.6 )% (1.5 )% 0.8 % 1.4 % 0.1 % 1.6 % 0.8 % (1.1 )% (1.2 )% — % (1.6 )% (1.1 )% (0.6 )% (1.1 )% Growth % from Acquisitions (Dispositions), net United States 0.0 % 0.0 % (0.5 )% (1.4 )% (0.5 )% (1.5 )% 1.1 % 2.3 % 2.9 % 1.2 % 4.2 % 0.2 % 0.1 % 1.4 % Canada (2.4 )% 2.0 % (0.5 )% 0.0 % (1.2 )% 0.0 % 0.0 % 0.0 % 0.0 % 0.0 % (6.6 )% (16.8 )% (11.3 )% (11.9 )% North America (0.2 )% (0.2 )% (0.5 )% (1.3 )% (0.6 )% (1.4 )% 1.0 % 2.1 % 2.6 % 1.1 % 3.2 % (1.5 )% (1.0 )% 0.1 % Other 74.1 % 65.5 % (3.9 )% (3.2 )% 23.7 % (2.7 )% (1.3 )% 0.3 % 1.4 % (0.4 )% 1.9 % 1.6 % 1.9 % 1.8 % Total 6.6 % 5.7 % (0.9 )% (1.6 )% 2.2 % (1.5 )% 0.6 % 1.8 % 2.4 % 0.9 % 3.0 % (1.1 )% (0.6 )% 0.3 %

16 ADJUSTED EBITDA TRENDING SCHEDULE 1 Adjusted EBITDA is a non - GAAP measure. See appendix for the definition Note: Actuals may not foot due to rounding . (US$ in thousands, except percentages) 2017 (ASC 605) 2018 (ASC 606) 2019 Q1 Q2 Q3 Q4 FY Q1 Q2 Q3 Q4 FY Q1 Q2 Q3 YTD ADVERTISING AND COMMUNICATIONS GROUP Revenue $344,700 $390,532 $375,800 $402,747 $1,513,779 $326,968 $379,743 $375,830 $393,662 $1,476,203 $328,791 $362,130 $342,907 $1,033,828 Operating income (loss) 16,969 36,069 47,944 71,833 172,815 (561 ) 43,912 20,642 860 64,853 20,504 40,073 38,532 99,109 Depreciation and amortization 10,588 10,467 10,997 10,324 42,376 12,151 11,543 10,935 10,805 45,434 8,621 10,442 9,176 28,239 Goodwill and other asset impairment — — — 3,238 3,238 — — 21,008 56,732 77,740 — — 1,944 1,944 Stock - based compensation 4,345 5,023 5,903 6,945 22,216 3,789 4,382 4,622 964 13,757 4,545 2,442 5,193 12,180 Deferred acquisition consideration adjustments 11,431 4,306 (2,462 ) (18,173 ) (4,898 ) 2,586 (5,067 ) 11,003 (8,979 ) (457 ) (7,643 ) 2,073 1,943 (3,627 ) Distributions from non - consolidated affiliates — 105 — — 105 — — — — — — — (250 ) (250 ) Other items, net — — — — — — — — — — — — — — Adjusted EBITDA (1) $ 43,334 $ 55,969 $ 62,382 $ 74,167 $ 235,852 $ 17,965 $ 54,770 $ 68,210 $ 60,382 $ 201,327 $ 26,027 $ 55,030 $ 56,538 $ 137,595 CORPORATE GROUP Revenue $0 $0 $0 $0 $0 $0 $0 $0 $0 $0 $0 $0 $0 $0 Operating loss (8,570 ) (9,688 ) (10,724 ) (11,874 ) (40,856 ) (14,072 ) (13,140 ) (18,024 ) (9,921 ) (55,157 ) (4,822 ) (16,631 ) (9,111 ) (30,565 ) Depreciation and amortization 310 299 255 234 1,098 224 160 199 179 762 217 221 192 630 Goodwill and other asset impairment — — — 1,177 1,177 2,317 — — — 2,317 — — — — Stock - based compensation 605 517 477 535 2,134 1,248 1,221 1,620 570 4,659 (1,573 ) 1,192 833 452 Distributions from non - consolidated affiliates — — 1,118 2,716 3,834 20 11 478 270 779 — 31 48 79 Other items, net 135 (100 ) 330 (112 ) 253 122 (68 ) 7,346 479 7,879 1,626 6,594 705 8,925 Adjusted EBITDA (1) $ (7,521 ) $ (8,971 ) $ (8,544 ) $ (7,324 ) $ (32,360 ) $ (10,141 ) $ (11,816 ) $ (8,381 ) $ (8,423 ) $ (38,761 ) $ (4,552 ) $ (8,593 ) $ (7,333 ) $ (20,478 ) TOTAL Revenue $344,700 $390,532 $375,800 $402,747 $1,513,779 $326,968 $379,743 $375,830 $393,662 $1,476,203 $328,791 $362,130 $342,907 $1,033,828 Operating income (loss) 8,399 26,381 37,220 59,959 131,959 (14,633 ) 30,772 2,618 (9,061 ) 9,696 15,682 23,442 29,421 68,544 Depreciation and amortization 10,898 10,766 11,252 10,558 43,474 12,375 11,703 11,134 10,984 46,196 8,838 10,663 9,368 28,869 Goodwill and other asset impairment — — — 4,415 4,415 2,317 — 21,008 56,732 80,057 — — 1,944 1,944 Stock - based compensation 4,950 5,540 6,380 7,480 24,350 5,037 5,603 6,242 1,534 18,416 2,972 3,634 6,026 12,632 Deferred acquisition consideration adjustments 11,431 4,306 (2,462 ) (18,173 ) (4,898 ) 2,586 (5,067 ) 11,003 (8,979 ) (457 ) (7,643 ) 2,073 1,943 (3,627 ) Distributions from non - consolidated affiliates — 105 1,118 2,716 3,939 20 11 478 270 779 — 31 (202 ) (171 ) Other items, net 135 (100 ) 330 (112 ) 253 122 (68 ) 7,346 479 7,879 1,626 6,594 705 8,926 Adjusted EBITDA (1) $ 35,813 $ 46,998 $ 53,838 $ 66,843 $ 203,492 $ 7,824 $ 42,954 $ 59,829 $ 51,959 $ 162,566 $ 21,475 $ 46,437 $ 49,205 $ 117,117

17 RECONCILIATIONS (1) GAAP revenue from prior year acquisitions for 2019 and 2018 relates to acquisitions which occurred in 2018 and 2017, respecti ve ly. (2) Contributions to organic revenue growth (decline) represents the change in revenue, measured on a constant currency basis, re la tive to the comparable pre - acquisition period for acquired businesses that is included in the Company's organic revenue growth ( decline) calculation. (3) Prior year revenue from dispositions reflects the incremental impact on revenue for the comparable period after the Company's d isposition of such disposed business, plus revenue from each business disposed of by the Company in the previous year through th e twelve month anniversary of the disposition. Note: Actuals may not foot due to rounding. 2018 2019 Q1 Q2 Q3 Q4 FY Q1 Q2 Q3 YTD NON - GAAP ACQUISITIONS (DISPOSITIONS), NET GAAP revenue from current year acquisitions $ — $ 11,066 $ 12,734 $ 12,317 $ 36,117 $ — $ 698 $ 1,347 $ 2,045 GAAP revenue from prior year acquisitions (1) — — — — — 15,685 1,519 1,109 18,313 Impact of adoption of ASC 606 exclusion — 450 (1,122 ) 504 (168 ) — — — — Foreign exchange impact — — — — — — — 470 470 Contribution to organic revenue (growth) decline (2) — (3,417 ) (945 ) (3,243 ) (7,605 ) (4,008 ) (440 ) (2,185 ) (6,633 ) Prior year revenue from dispositions (3) (5,261 ) (5,592 ) (3,847 ) — (14,700 ) (1,825 ) (5,995 ) (3,178 ) (10,998 ) Non - GAAP acquisitions (dispositions), net $ (5,261 ) $ 2,507 $ 6,820 $ 9,578 $ 13,644 $ 9,852 $ (4,218 ) $ (2,437 ) $ 3,197 OTHER ITEMS, NET SEC investigation and class action litigation expenses $ 122 $ 235 $ (88 ) $ 131 $ 400 $ — $ — $ — $ — D&O insurance proceeds — (303 ) (231 ) (24 ) (558 ) — — — — Severance and other restructuring expenses — — 7,665 372 8,037 — 6,703 705 7,408 Strategic review process costs — — — — — 1,626 (109 ) — 1,517 Total other items, net $ 122 $ (68 ) $ 7,346 $ 479 $ 7,879 $ 1,626 $ 6,594 $ 705 $ 8,925 CASH INTEREST, NET & OTHER Cash interest paid $ (649 ) $ (30,765 ) $ (1,597 ) $ (31,001 ) $ (64,012 ) $ (1,629 ) $ (30,014 ) $ (882 ) $ (32,525 ) Bond interest accrual adjustment (14,625 ) 14,625 (14,625 ) 14,625 — (14,625 ) 14,625 (14,625 ) (14,625 ) Adjusted cash interest paid (15,274 ) (16,140 ) (16,222 ) (16,376 ) (64,012 ) (16,254 ) (15,389 ) (15,507 ) (47,150 ) Interest income 148 159 91 227 625 149 138 165 452 Total cash interest, net & other $ (15,126 ) $ (15,981 ) $ (16,131 ) $ (16,149 ) $ (63,387 ) $ (16,105 ) $ (15,251 ) $ (15,342 ) $ (46,698 ) CAPITAL EXPENDITURES, NET Capital expenditures $ (3,799 ) $ (5,890 ) $ (5,543 ) $ (5,032 ) $ (20,264 ) $ (3,606 ) $ (4,317 ) $ (5,863 ) $ (13,786 ) Landlord reimbursements 219 851 291 442 1,803 1 — — 1 Total capital expenditures, net $ (3,580 ) $ (5,039 ) $ (5,252 ) $ (4,590 ) $ (18,461 ) $ (3,605 ) $ (4,317 ) $ (5,863 ) $ (13,785 ) MISCELLANEOUS OTHER DISCLOSURES Net income attributable to the noncontrolling interests $ 897 $ 2,545 $ 2,458 $ 5,885 $ 11,785 $ 429 $ 3,043 $ 7,265 $ 10,737 Cash taxes $ 1,333 $ 1,293 $ 2,196 $ (986 ) $ 3,836 $ 1,677 $ 1,817 $ 137 $ 3,631
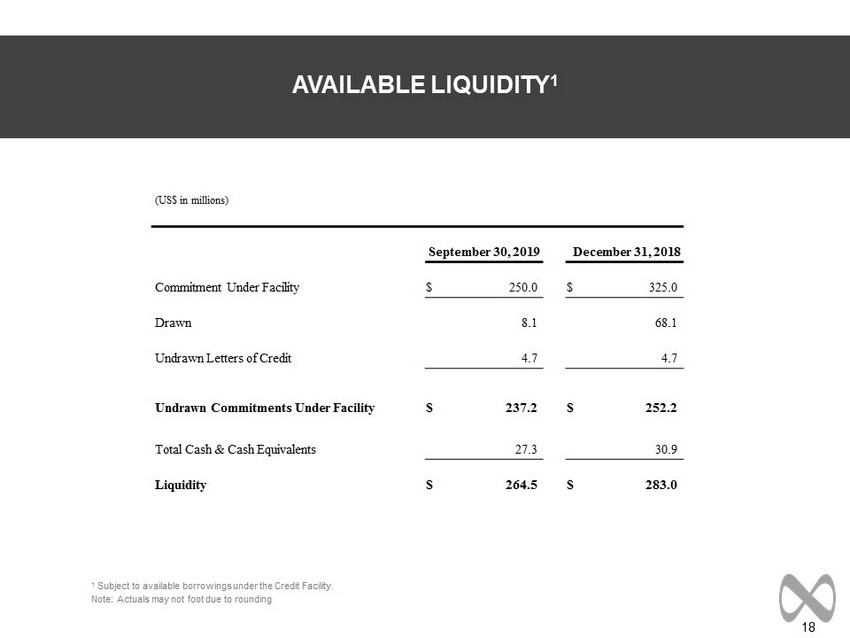
18 AVAILABLE LIQUIDITY 1 1 Subject to available borrowings under the Credit Facility. Note: Actuals may not foot due to rounding (US$ in millions) September 30, 2019 December 31, 2018 Commitment Under Facility $ 250.0 $ 325.0 Drawn 8.1 68.1 Undrawn Letters of Credit 4.7 4.7 Undrawn Commitments Under Facility $ 237.2 $ 252.2 Total Cash & Cash Equivalents 27.3 30.9 Liquidity $ 264.5 $ 283.0
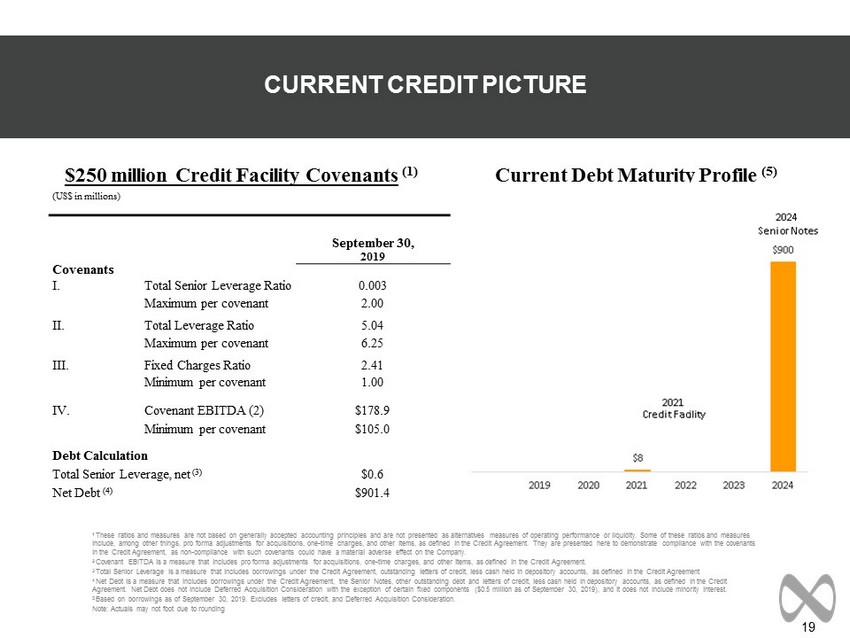
19 CURRENT CREDIT PICTURE 1 These ratios and measures are not based on generally accepted accounting principles and are not presented as alternatives mea sur es of operating performance or liquidity. Some of these ratios and measures include, among other things, pro forma adjustments for acquisitions, one - time charges, and other items, as defined in the Credit Agreement. They are presented here to demonstrate compliance with the covenants in the Credit Agreement, as non - compliance with such covenants could have a material adverse effect on the Company. 2 Covenant EBITDA is a measure that includes pro forma adjustments for acquisitions, one - time charges, and other items, as defined in the Credit Agreement. 3 Total Senior Leverage is a measure that includes borrowings under the Credit Agreement, outstanding letters of credit, less c ash held in depository accounts, as defined in the Credit Agreement 4 Net Debt is a measure that includes borrowings under the Credit Agreement, the Senior Notes, other outstanding debt and lette rs of credit, less cash held in depository accounts, as defined in the Credit Agreement. Net Debt does not include Deferred Acquisition Consideration with the exception of certain fixed components ($0.5 mil lion as of September 30, 2019), and it does not include minority interest. 5 Based on borrowings as of September 30, 2019. Excludes letters of credit, and Deferred Acquisition Consideration. Note: Actuals may not foot due to rounding Current Debt Maturity Profile (5) $250 million Credit Facility Covenants (1) (US$ in millions) September 30, 2019 Covenants I. Total Senior Leverage Ratio 0.003 Maximum per covenant 2.00 II. Total Leverage Ratio 5.04 Maximum per covenant 6.25 III. Fixed Charges Ratio 2.41 Minimum per covenant 1.00 IV. Covenant EBITDA (2) $178.9 Minimum per covenant $105.0 Debt Calculation Total Senior Leverage, net (3) $0.6 Net Debt (4) $901.4
20 DEFINITION OF NON - GAAP MEASURES In addition to its reported results, MDC Partners has included in its earnings release and supplemental management presentati on certain financial results that the Securities and Exchange Commission defines as "non - GAAP financial measures." Management believes that such non - GAAP financial measures, when r ead in conjunction with the Company's reported results, can provide useful supplemental information for investors analyzing period to period comparisons of the Com pan y's results. Such non - GAAP financial measures include the following: Organic Revenue: Organic Revenue: “Organic revenue growth” and “organic revenue decline” refer to the positive or negative results, respective l y, of subtracting both the foreign exchange and acquisition (disposition) components from total revenue growth. The acquisition (disposition) component is calcu lat ed by aggregating prior period revenue for any acquired businesses, less the prior period revenue of any businesses that were disposed of during the current period. The org ani c revenue growth (decline) component reflects the constant currency impact of (a) the change in revenue of the partner firms which the Company has held throughout each of the com parable periods presented, and (b) “non - GAAP acquisitions (dispositions), net”. Non - GAAP acquisitions (dispositions), net consists of (i) for acquisitions during the current year, the revenue effect from such acquisitions as if the acquisition had been owned during the equivalent period in the prior year and (ii) for acquisitions during the previous year, th e revenue effect from such acquisitions as if they had been owned during that entire year (or same period as the current reportable period), taking into account their respective pre - acquis ition revenues for the applicable periods, and (iii) for dispositions, the revenue effect from such dispositions as if they had been disposed of during the equivalent period in the p rio r year. Net New Business: Estimate of annualized revenue for new wins less annualized revenue for losses incurred in the period. Adjusted EBITDA: Adjusted EBITDA is a non - GAAP measure that represents operating profit (loss) plus depreciation and amortization, stock - based co mpensation, deferred acquisition consideration adjustments, distributions from non - consolidated affiliates, and other items. Covenant EBITDA: Covenant EBITDA is a measure that includes pro forma adjustments for acquisitions, one - time charges, and other items, as defined in the Credit Agreement. We believe that the presentation of Covenant EBITDA is appropriate as it eliminates the effect of certain non - cash and other items not necessarily indicative of a company’s underlying operating performance. In addition, the presentation of Covenant EBITDA provides additional information to investors about th e c alculation of, and compliance with, certain financial covenants in the Credit Agreement. Included in the Company’s earnings release and supplemental management presentation are tables reconciling MDC Partners’ repo rte d results to arrive at certain of these non - GAAP financial measures. We are unable to reconcile our projected 2019 organic revenue growth to the corresponding GAAP measure be cau se we are unable to predict the 2019 impact of foreign exchange due to the unpredictability of future changes in foreign exchange rates and because we are unable to predict th e occurrence or impact of any acquisitions, dispositions, or other potential changes. We are unable to reconcile our projected 2019 Covenant EBITDA to the corresponding GAA P measure because the amount and timing of many future charges that impact these measures (such as amortization of future acquired intangible assets, foreign exchange t ran saction gains or losses, impairment charges, provision or benefit for income taxes, and certain assumptions used in the calculation of deferred acquisition consideration) ar e variable, uncertain, or out of our control and therefore cannot be reasonably predicted without unreasonable effort, if at all. As a result, we are unable to provide reconciliations of these measures. In addition, we believe such reconciliations could imply a degree of precision that might be confusing or misleading to investors. For the same reasons, w e a re unable to address the probable significance of the unavailable information, which could have a potentially unpredictable, and potentially significant, impact on future GAAP fin anc ial results. Note: A reconciliation of non - GAAP to US GAAP reported results has been provided by the Company in the tables included herein.

MDC Partners Innovation Center 745 Fifth Avenue, Floor 19 New York, NY 10151 646 - 429 - 1800 www.mdc - partners.com