Exhibit 99.2

Management Presentation
February 27, 2012
Fourth Quarter and Year End
2011 Results
FORWARD LOOKING STATEMENTS & OTHER INFORMATION
This presentation, including our “2012 Financial Outlook”, contains forward-looking statements. The Company’s representatives may also make forward-looking
statements orally from time to time. Statements in this presentation that are not historical facts, including statements about the Company’s beliefs and
expectations, earnings guidance, recent business and economic trends, potential acquisitions, estimates of amounts for deferred acquisition consideration and
“put” option rights, constitute forward-looking statements. These statements are based on current plans, estimates and projections, and are subject to change
based on a number of factors, including those outlined in this section. Forward-looking statements speak only as of the date they are made, and the Company
undertakes no obligation to update publicly any of them in light of new information or future events, if any.
Forward-looking statements involve inherent risks and uncertainties. A number of important factors could cause actual results to differ materially from those
contained in any forward-looking statements. Such risk factors include, but are not limited to, the following:
• risks associated with severe effects of international, national and regional economic downturn;
• the Company’s ability to attract new clients and retain existing clients;
• the spending patterns and financial success of the Company’s clients;
• the Company’s ability to remain in compliance with its debt agreements and the Company’s ability to finance its contingent payment obligations when
due and payable, including but not limited to those relating to “put” option rights and deferred acquisition consideration;
• the successful completion and integration of acquisitions which compliment and expand the Company’s business capabilities; and
• foreign currency fluctuations.
The Company’s business strategy includes ongoing efforts to engage in material acquisitions of ownership interests in entities in the marketing communications
services industry. The Company intends to finance these acquisitions by using available cash from operations and through incurrence of bridge or other debt
financing, either of which may increase the Company’s leverage ratios, or by issuing equity, which may have a dilutive impact on existing shareholders
proportionate ownership. At any given time the Company may be engaged in a number of discussions that may result in one or more material acquisitions.
These opportunities require confidentiality and may involve negotiations that require quick responses by the Company. Although there is uncertainty that any of
these discussions will result in definitive agreements or the completion of any transactions, the announcement of any such transaction may lead to increased
volatility in the trading price of the Company’s securities.
Investors should carefully consider these risk factors and the additional risk factors outlined in more detail in the Annual Report on Form 10-K under the caption
“Risk Factors” and in the Company’s other SEC filings.
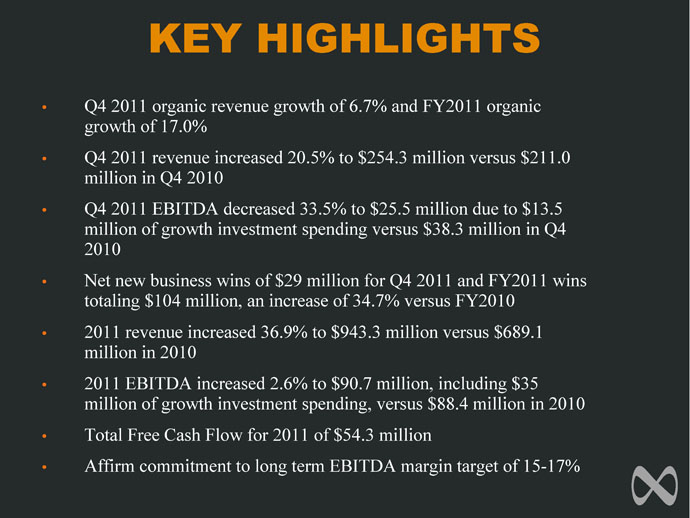
KEY HIGHLIGHTS
Q4 2011 organic revenue growth of 6.7% and FY2011 organic
growth of 17.0%
• Q4 2011 revenue increased 20.5% to $254.3 million versus $211.0
million in Q4 2010
• Q4 2011 EBITDA decreased 33.5% to $25.5 million due to $13.5
million of growth investment spending versus $38.3 million in Q4
2010
• Net new business wins of $29 million for Q4 2011 and FY2011 wins
totaling $104 million, an increase of 34.7% versus FY2010
• 2011 revenue increased 36.9% to $943.3 million versus $689.1
million in 2010
• 2011 EBITDA increased 2.6% to $90.7 million, including $35
million of growth investment spending, versus $88.4 million in 2010
• Total Free Cash Flow for 2011 of $54.3 million
• Affirm commitment to long term EBITDA margin target of 15-17%
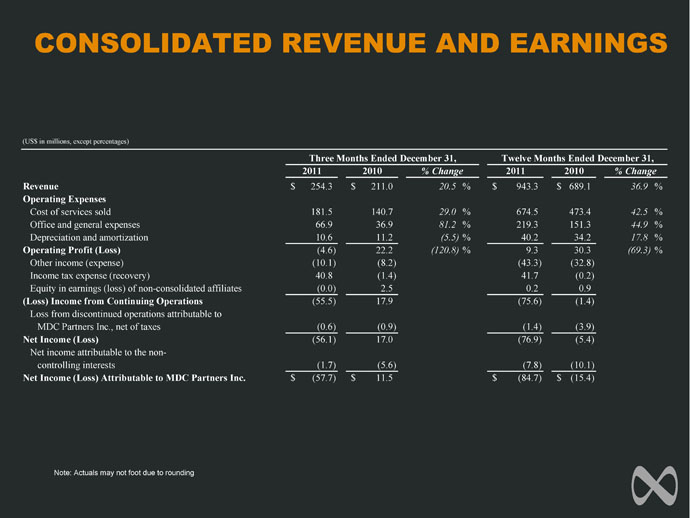
CONSOLIDATED REVENUE AND EARNINGS
Note: Actuals may not foot due to rounding
(US$ in millions, except percentages)
2011 2010 2011 2010
Revenue $ 254.3 $ 211.0 20.5 % $ 943.3 $ 689.1 36.9 %
Operating Expenses
Cost of services sold 181.5 140.7 29.0 % 674.5 473.4 42.5 %
Office and general expenses 66.9 36.9 81.2 % 219.3 151.3 44.9 %
Depreciation and amortization 10.6 11.2 (5.5) % 40.2 34.2 17.8 %
Operating Profit (Loss) (4.6) 22.2 (120.8) % 9.3 30.3 (69.3) %
Other income (expense) (10.1) ( 8.2) ( 43.3) ( 32.8)
Income tax expense (recovery) 40.8 ( 1.4) 41.7 ( 0.2)
Equity in earnings (loss) of non-consolidated affiliates ( 0.0) 2.5 0.2 0.9
(Loss) Income from Continuing Operations (55.5) 17.9 ( 75.6) ( 1.4)
Loss from discontinued operations attributable to
MDC Partners Inc., net of taxes (0.6) (0.9) ( 1.4) ( 3.9)
Net Income (Loss) (56.1) 17.0 ( 76.9) ( 5.4)
Net income attributable to the noncontrolling
interests (1.7) (5.6) ( 7.8) ( 10.1)
Net Income (Loss) Attributable to MDC Partners Inc. $ (57.7) $ 11.5 $ ( 84.7) $ ( 15.4)
% Change
Three Months Ended December 31, Twelve Months Ended December 31,
% Change
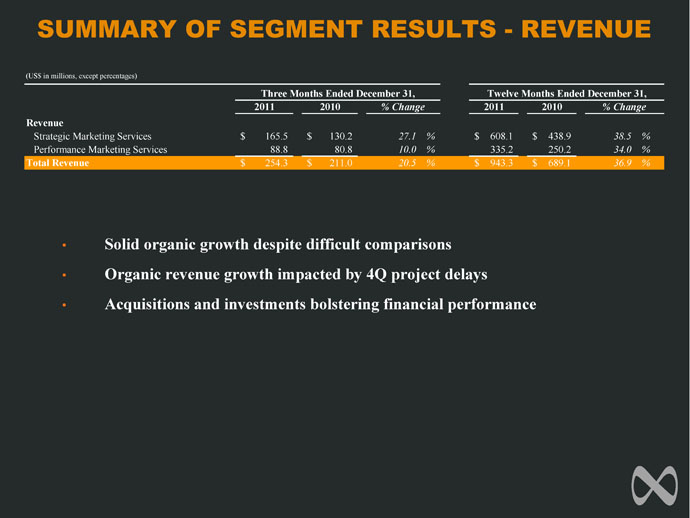
SUMMARY OF SEGMENT RESULTS - REVENUE
• Solid organic growth despite difficult comparisons
• Organic revenue growth impacted by 4Q project delays
• Acquisitions and investments bolstering financial performance
(US$ in millions, except percentages)
2011 2010 2011 2010
Revenue
Strategic Marketing Services $ 1 65.5 $ 1 30.2 27.1 % $ 608.1 $ 438.9 38.5 %
Performance Marketing Services 8 8.8 8 0.8 10.0 % 335.2 250.2 34.0 %
Total Revenue $ 2 54.3 $ 2 11.0 20.5 % $ 943.3 $ 689.1 36.9 %
% Change
Three Months Ended December 31, Twelve Months Ended December 31,
% Change
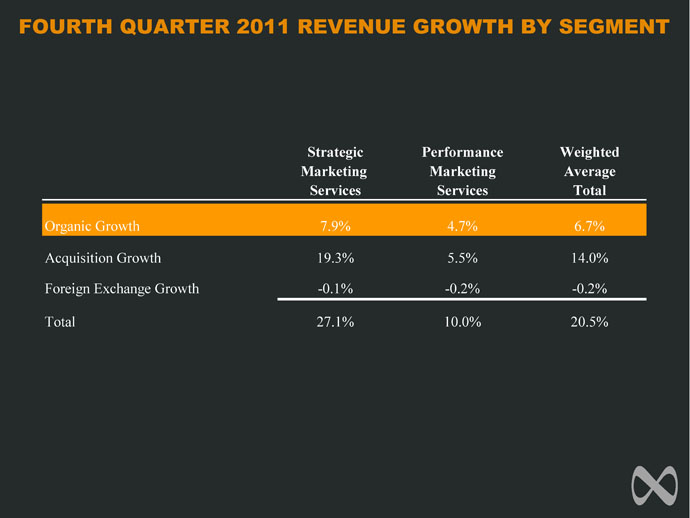
FOURTH QUARTER 2011 REVENUE GROWTH BY SEGMENT
Strategic Performance Weighted
Marketing Marketing Average
Services Services Total
Organic Growth 7.9% 4.7% 6.7%
Acquisition Growth 19.3% 5.5% 14.0%
Foreign Exchange Growth -0.1% -0.2% -0.2%
Total 27.1% 10.0% 20.5%
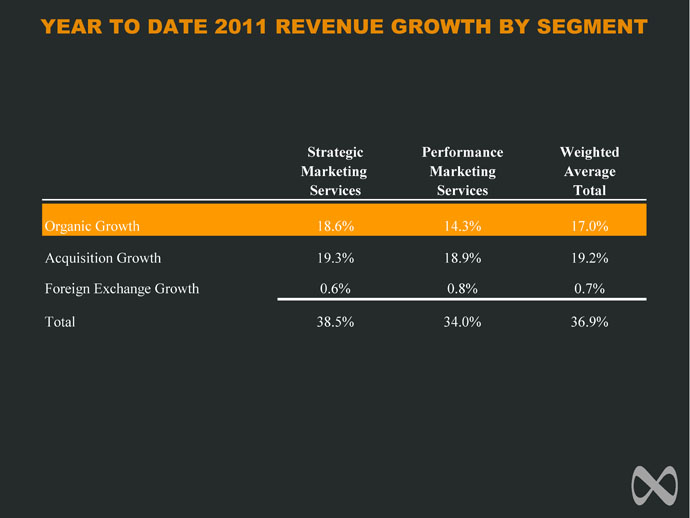
YEAR TO DATE 2011 REVENUE GROWTH BY SEGMENT
Strategic Performance Weighted
Marketing Marketing Average
Services Services Total
Organic Growth 18.6% 14.3% 17.0%
Acquisition Growth 19.3% 18.9% 19.2%
Foreign Exchange Growth 0.6% 0.8% 0.7%
Total 38.5% 34.0% 36.9%

FOURTH QUARTER REVENUE BY CLIENT SECTOR
Note: Actuals may not foot due to rounding
Q4 2011 Q4 2010
Communications, Retail, 12%
14%
Other, 13%
Financials, 10%
Consumer Products,
38%
Technology, 4%
Healthcare, 4% Auto, 4%
Communications, Retail, 16%
15%
Other, 12%
Financials, 9%
Healthcare, 5% Auto, 3%
Technology, 7%
Consumer Products,
34%
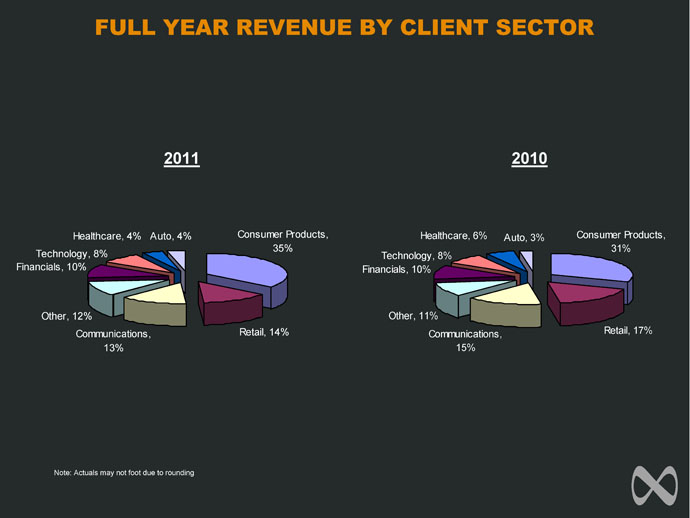
FULL YEAR REVENUE BY CLIENT SECTOR
Note: Actuals may not foot due to rounding
2011 2010
Communications, Retail, 14%
13%
Other, 12%
Financials, 10%
Consumer Products,
Technology, 8% 35%
Healthcare, 4% Auto, 4%
Communications, Retail, 17%
15%
Other, 11%
Financials, 10%
Healthcare, 6% Auto, 3%
Technology, 8%
Consumer Products,
31%

MDC Partners vs. Peers
Trailing 12 Month Organic Revenue
-10.0%
-5.0%
0.0%
5.0%
10.0%
15.0%
20.0%
25.0%
1Q08
2Q08
3Q08
4Q08
1Q09
2Q09
3Q09
4Q09
1Q10
2Q10
3Q10
4Q10
1Q11
2Q11
3Q11
4Q11
MDC Partners
Peers
Outperformance Despite More Difficult Comparisons
Note: Peers include Omnicom, Interpublic, WPP Group, Havas and Publicis for 1Q08-3Q11
*Due to timing of earnings, peers for 4Q11 include Omnicom, Publicis, and Interpublic
ORGANIC GROWTH
2011 +17.0%

SUMMARY OF SEGMENT RESULTS - EBITDA
Note: Actuals may not foot due to rounding
(US$ in millions, except percentages)
2011 2010 2011 2010
EBITDA
Strategic Marketing Services $ 1 9.1 $ 2 4.9 (23.2) % $ 73.4 $ 69.0 6.4 %
margin 11.5% 19.1% 12.1% 15.7%
Performance Marketing Services 1 0.7 1 3.4 (20.4) % 35.0 29.2 19.7 %
margin 12.0% 16.6% 10.4% 11.7%
Marketing Communications 2 9.8 3 8.3 (22.2) % 108.4 98.2 10.4 %
margin 11.7% 18.1% 11.5% 14.3%
Corporate Expenses (4.8) (3.9) 24.5 % ( 18.8) ( 14.0) 34.1 %
Profit Distributions from Affiliates 0 .5 3 .9 1.1 4.2
Total EBITDA $ 2 5.5 $ 3 8.3 (33.5) % $ 90.7 $ 88.4 2.6 %
margin 10.0% 18.2% 9.6% 12.8%
% Change
Three Months Ended December 31, Twelve Months Ended December 31,
% Change

FREE CASH FLOW
Note: Actuals may not foot due to rounding
(US$ in millions) 2011 2010 2011 2010
EBITDA $25.5 $38.3 $90.7 $88.4
Net Income Attibutable to Noncontrolling Interests (1.7) (5.6) (7.8) (10.1)
Capital Expenditures (5.0) (4.2) (21.1) (11.1)
Cash Taxes (0.1) (0.4) (0.2) (1.1)
Cash Interest, net and other (10.2) (7.4) (38.4) (29.3)
Free Cash Flow $8.6 $20.9 $23.2 $36.7
Three Months Ended December 31, Twelve Months Ended December 31,

LIQUIDITY
*Note: At December 31, 2011, after giving effect to the limitations under the 11% Senior Notes indenture, approximately $41.2 million was available under the bank
credit facility.
(US$ in millions)
Commitment Under Facility $ 150.0
Drawn 38.0
Letters of Credit 5.8
Funds Available Under Facility $ 106.2
Total Cash 8.1
Liquidity $ 114.3
Available Liquidity at December 31, 2011*
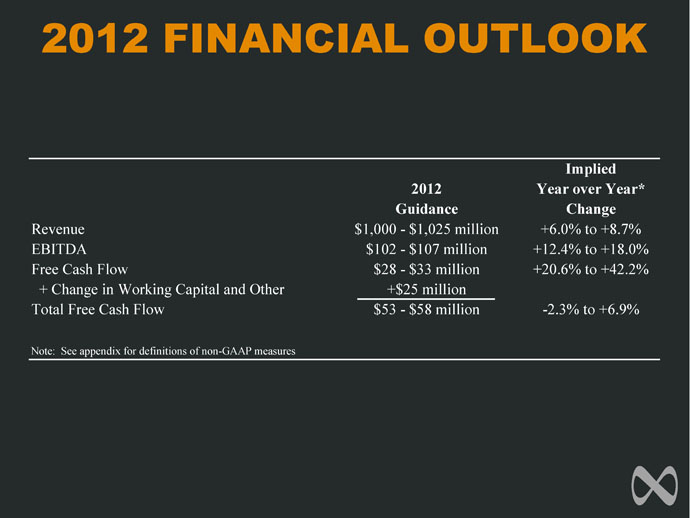
2012 FINANCIAL OUTLOOK
Implied
2012 Year over Year*
Guidance Change
Revenue $1,000 - $1,025 million +6.0% to +8.7%
EBITDA $102 - $107 million +12.4% to +18.0%
Free Cash Flow $28 - $33 million +20.6% to +42.2%
+ Change in Working Capital and Other +$25 million
Total Free Cash Flow $53 - $58 million -2.3% to +6.9%
Note: See appendix for definitions of non-GAAP measures

APPENDIX
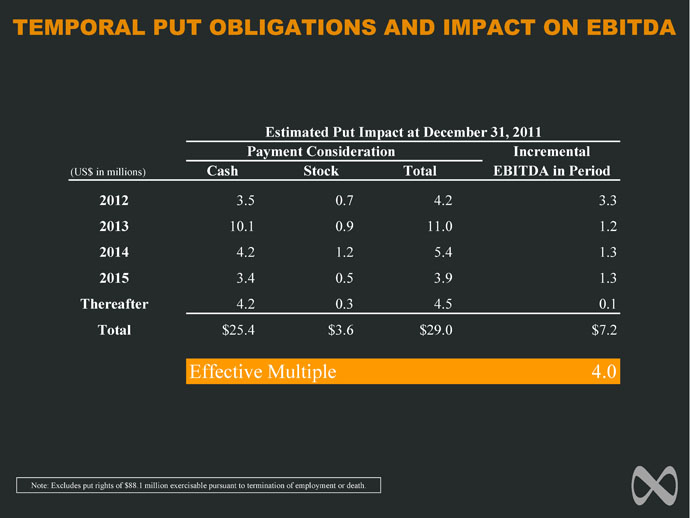
TEMPORAL PUT OBLIGATIONS AND IMPACT ON EBITDA
Note: Excludes put rights of $88.1 million exercisable pursuant to termination of employment or death.
Incremental
(US$ in millions) Cash Stock Total EBITDA in Period
2012 3.5 0.7 4.2 3.3
2013 10.1 0.9 11.0 1.2
2014 4.2 1.2 5.4 1.3
2015 3.4 0.5 3.9 1.3
Thereafter 4.2 0.3 4.5 0.1
Total $25.4 $3.6 $29.0 $7.2
Effective Multiple 4.0
Estimated Put Impact at December 31, 2011
Payment Consideration
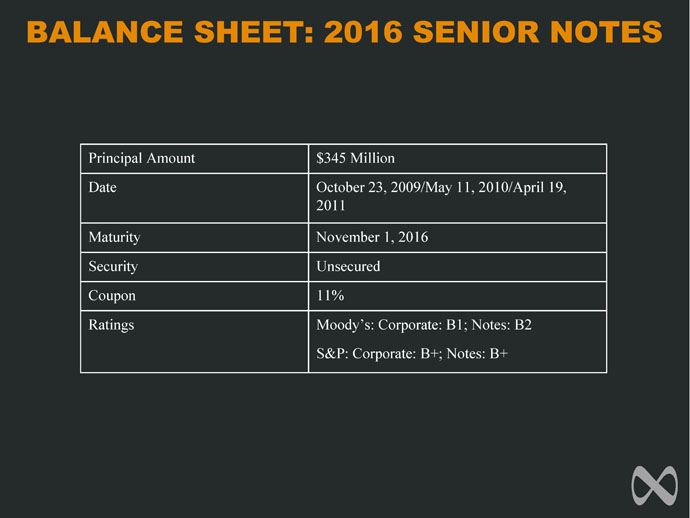
BALANCE SHEET: 2016 SENIOR NOTES
Principal Amount $345 Million
Date October 23, 2009/May 11, 2010/April 19,
2011
Maturity November 1, 2016
Security Unsecured
Coupon 11%
Ratings Moody’s: Corporate: B1; Notes: B2
S&P: Corporate: B+; Notes: B+

BALANCE SHEET: REVOLVING CREDIT FACILITY
Amount $150 Million
Type Senior Secured
Maturity October 23, 2015
Facility Fee 50bps per annum
Drawn Rate Prime + 225bps / LIBOR +250bps
Covenants • Minimum EBITDA: $90 million
• Fixed Charge Coverage Ratio: 1.25:1.0
• Senior Leverage Ratio: 2.0:1.0
• Total Leverage Ratio: 4.15:1.0
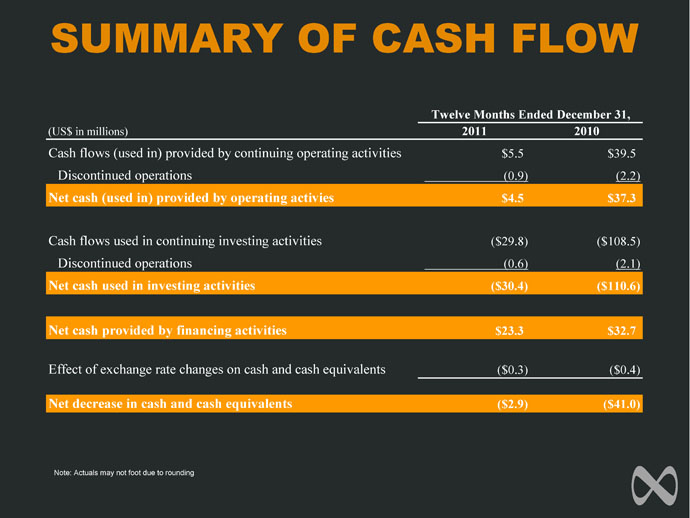
SUMMARY OF CASH FLOW
Note: Actuals may not foot due to rounding
(US$ in millions) 2011 2010
Cash flows (used in) provided by continuing operating activities $5.5 $39.5
Discontinued operations (0.9) (2.2)
Net cash (used in) provided by operating activies $4.5 $37.3
Cash flows used in continuing investing activities ($29.8) ($108.5)
Discontinued operations (0.6) (2.1)
Net cash used in investing activities ($30.4) ($110.6)
Net cash provided by financing activities $23.3 $32.7
Effect of exchange rate changes on cash and cash equivalents ($0.3) ($0.4)
Net decrease in cash and cash equivalents ($2.9) ($41.0)
Twelve Months Ended December 31,
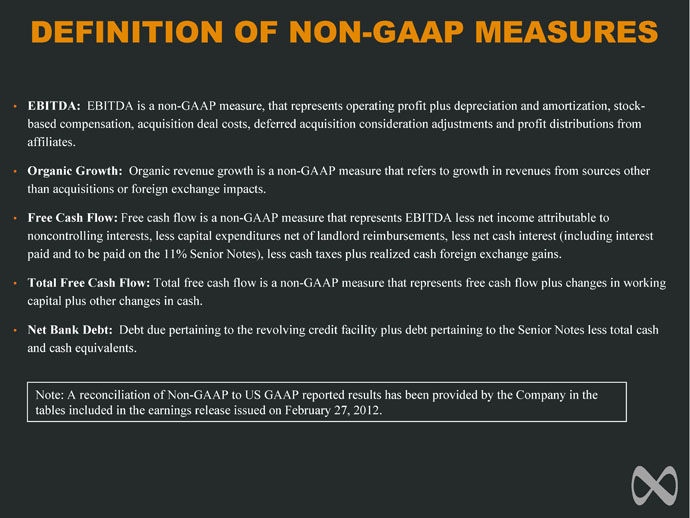
DEFINITION OF NON-GAAP MEASURES
• EBITDA: EBITDA is a non-GAAP measure, that represents operating profit plus depreciation and amortization, stockbased
compensation, acquisition deal costs, deferred acquisition consideration adjustments and profit distributions from
affiliates.
• Organic Growth: Organic revenue growth is a non-GAAP measure that refers to growth in revenues from sources other
than acquisitions or foreign exchange impacts.
• Free Cash Flow: Free cash flow is a non-GAAP measure that represents EBITDA less net income attributable to
noncontrolling interests, less capital expenditures net of landlord reimbursements, less net cash interest (including interest
paid and to be paid on the 11% Senior Notes), less cash taxes plus realized cash foreign exchange gains.
• Total Free Cash Flow: Total free cash flow is a non-GAAP measure that represents free cash flow plus changes in working
capital plus other changes in cash.
• Net Bank Debt: Debt due pertaining to the revolving credit facility plus debt pertaining to the Senior Notes less total cash
and cash equivalents.
Note: A reconciliation of Non-GAAP to US GAAP reported results has been provided by the Company in the
tables included in the earnings release issued on February 27, 2012.