
Management Presentation April 25, 2013 First Quarter Results DRAFT
This presentation, including our “ 2013 Financial Outlook”, contains forward - looking statements . The Company’s representatives may also make forward - looking statements orally from time to time . Statements in this presentation that are not historical facts, including statements about the Company’s beliefs and expectations, earnings guidance, recent business and economic trends, potential acquisitions, estimates of amounts for deferred acquisition consideration and “put” option rights, constitute forward - looking statements . These statements are based on current plans, estimates and projections, and are subject to change based on a number of factors, including those outlined in this section . Forward - looking statements speak only as of the date they are made, and the Company undertakes no obligation to update publicly any of them in light of new information or future events, if any . Forward - looking statements involve inherent risks and uncertainties . A number of important factors could cause actual results to differ materially from those contained in any forward - looking statements . Such risk factors include, but are not limited to, the following : • risks associated with severe effects of international, national and regional economic downturn ; • the Company’s ability to attract new clients and retain existing clients; • the spending patterns and financial success of the Company’s clients; • the Company’s ability to remain in compliance with its debt agreements and the Company’s ability to finance its contingent pa yme nt obligations when due and payable, including but not limited to those relating to “put” option rights and deferred acquisition consideration; • the successful completion and integration of acquisitions which compliment and expand the Company’s business capabilities; an d • foreign currency fluctuations. The Company’s business strategy includes ongoing efforts to engage in material acquisitions of ownership interests in entities in the marketing communications services industry . The Company intends to finance these acquisitions by using available cash from operations and through incurrence of bridge or other debt financing, either of which may increase the Company’s leverage ratios, or by issuing equity, which may have a dilutive impact on existing shareholders proportionate ownership . At any given time the Company may be engaged in a number of discussions that may result in one or more material acquisitions . These opportunities require confidentiality and may involve negotiations that require quick responses by the Company . Although there is uncertainty that any of these discussions will result in definitive agreements or the completion of any transactions, the announcement of any such transaction may lead to increased volatility in the trading price of the Company’s securities . Investors should carefully consider these risk factors and the additional risk factors outlined in more detail in the Annual Report on Form 10 - K under the caption “Risk Factors” and in the Company’s other SEC filings . FORWARD LOOKING STATEMENTS & OTHER INFORMATION
SUMMARY • 1Q 2013 was the strongest first quarter in company history • We continue to win incremental share of wallet and market share as our clients see the strong business results and trust more of their marketing and growth efforts to us • 1Q new business wins were a record high and our pipeline remains robust across the portfolio • We capitalized on our strong organic growth and the success of our past investments to refinance our balance sheet at a blended interest rate of 5.5% • We have strong visibility on financial performance in 2013 and are increasing our revenue, EBITDA, margin and free cash flow guidance
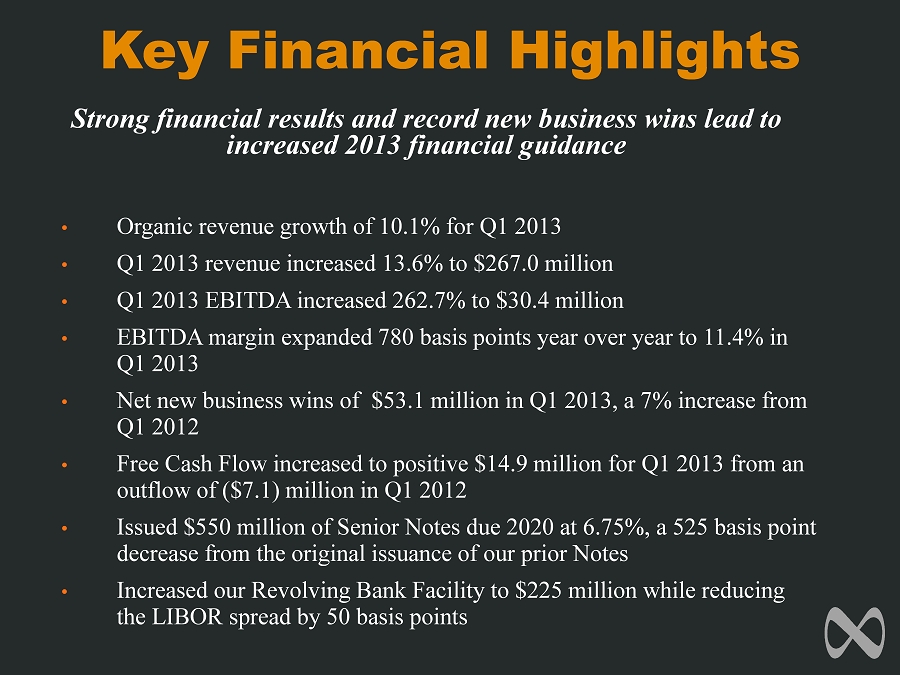
Key Financial Highlights Strong financial results and record new business wins lead to increased 2013 financial guidance • Organic revenue growth of 10.1% for Q1 2013 • Q1 2013 revenue increased 13.6% to $267.0 million • Q1 2013 EBITDA increased 262.7% to $30.4 million • EBITDA margin expanded 780 basis points year over year to 11.4% in Q1 2013 • Net new business wins of $53.1 million in Q1 2013, a 7% increase from Q1 2012 • Free Cash Flow increased to $14.9 million for Q1 2013 from an outflow of ($7.1) million in Q1 2012 • Issued $550 million of Senior Notes due 2020 at 6.75%, a 525 basis point decrease from the original issuance of our prior Notes • Increased our Revolving Bank Facility to $225 million while reducing the LIBOR spread by 50 basis points
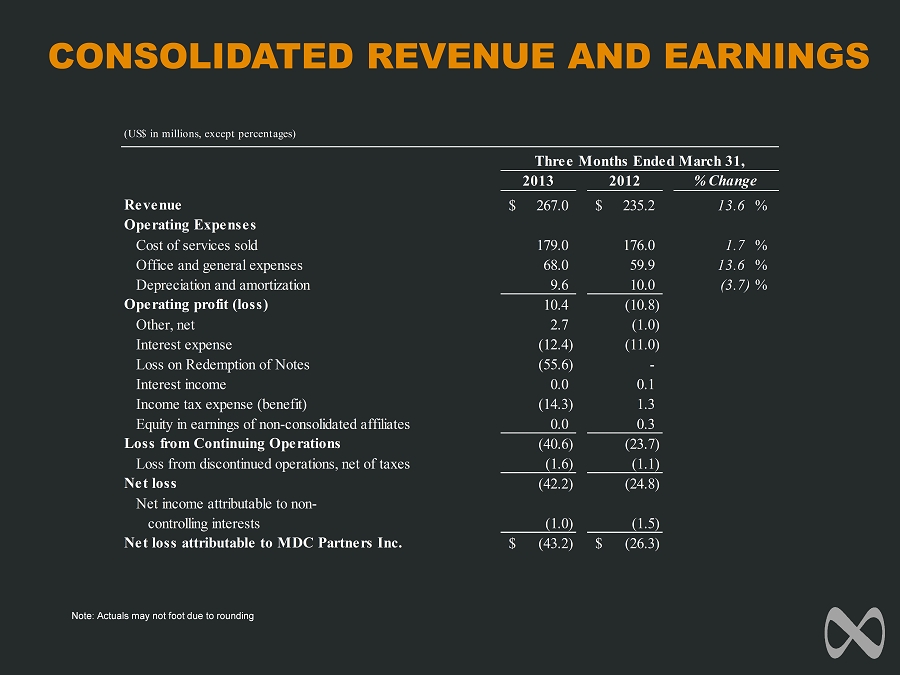
CONSOLIDATED REVENUE AND EARNINGS Note: Actuals may not foot due to rounding (US$ in millions, except percentages) 2013 2012 Revenue 267.0$ 235.2$ 13.6 % Operating Expenses Cost of services sold 179.0 176.0 1.7 % Office and general expenses 68.0 59.9 13.6 % Depreciation and amortization 9.6 10.0 (3.7) % Operating profit (loss) 10.4 (10.8) Other, net 2.7 (1.0) Interest expense (12.4) (11.0) Loss on Redemption of Notes (55.6) - Interest income 0.0 0.1 Income tax expense (benefit) (14.3) 1.3 Equity in earnings of non-consolidated affiliates 0.0 0.3 Loss from Continuing Operations (40.6) (23.7) Loss from discontinued operations, net of taxes (1.6) (1.1) Net loss (42.2) (24.8) Net income attributable to non- controlling interests (1.0) (1.5) Net loss attributable to MDC Partners Inc. (43.2)$ (26.3)$ % Change Three Months Ended March 31,
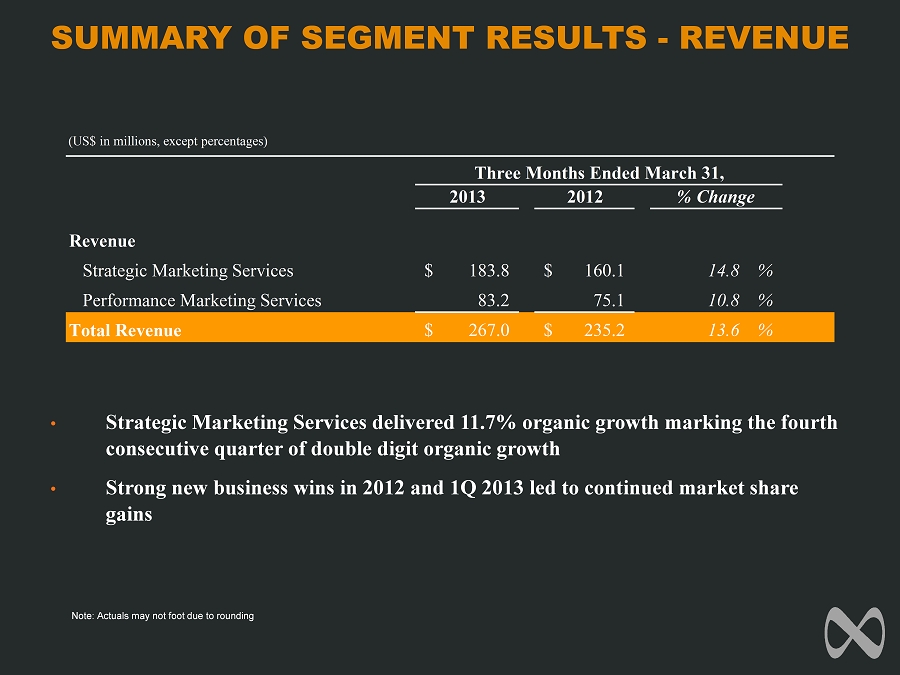
SUMMARY OF SEGMENT RESULTS - REVENUE • Strategic Marketing Services delivered 11.7% organic growth marking the fourth consecutive quarter of double digit organic growth • Strong new business wins in 2012 and 1Q 2013 led to continued market share gains Note: Actuals may not foot due to rounding (US$ in millions, except percentages) 2013 2012 Revenue Strategic Marketing Services 183.8$ 160.1$ 14.8 % Performance Marketing Services 83.2 75.1 10.8 % Total Revenue 267.0$ 235.2$ 13.6 % % Change Three Months Ended March 31,
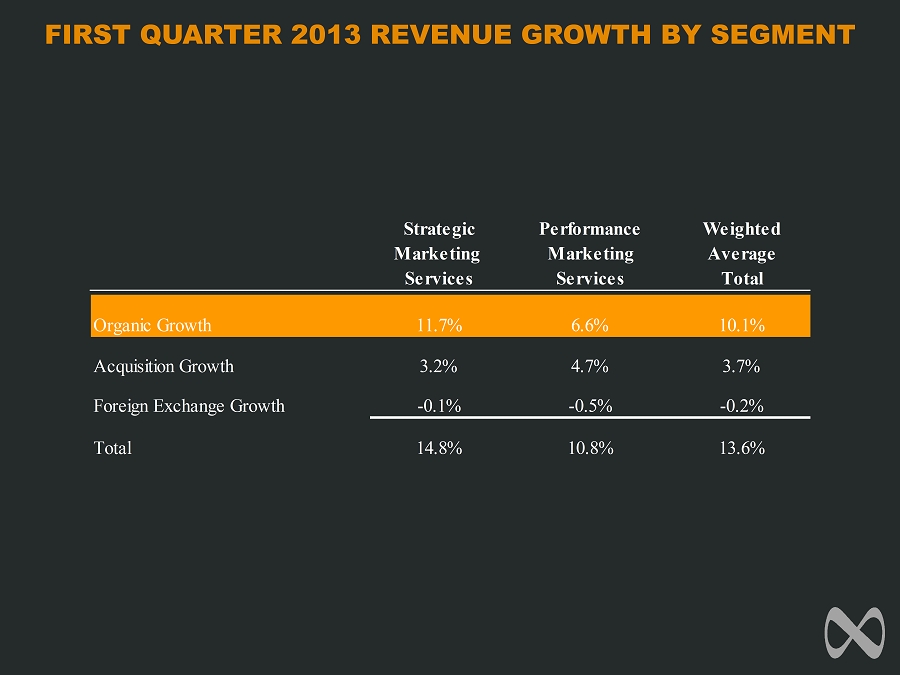
FIRST QUARTER 2013 REVENUE GROWTH BY SEGMENT Strategic Performance Weighted Marketing Marketing Average Services Services Total Organic Growth 11.7% 6.6% 10.1% Acquisition Growth 3.2% 4.7% 3.7% Foreign Exchange Growth -0.1% -0.5% -0.2% Total 14.8% 10.8% 13.6%
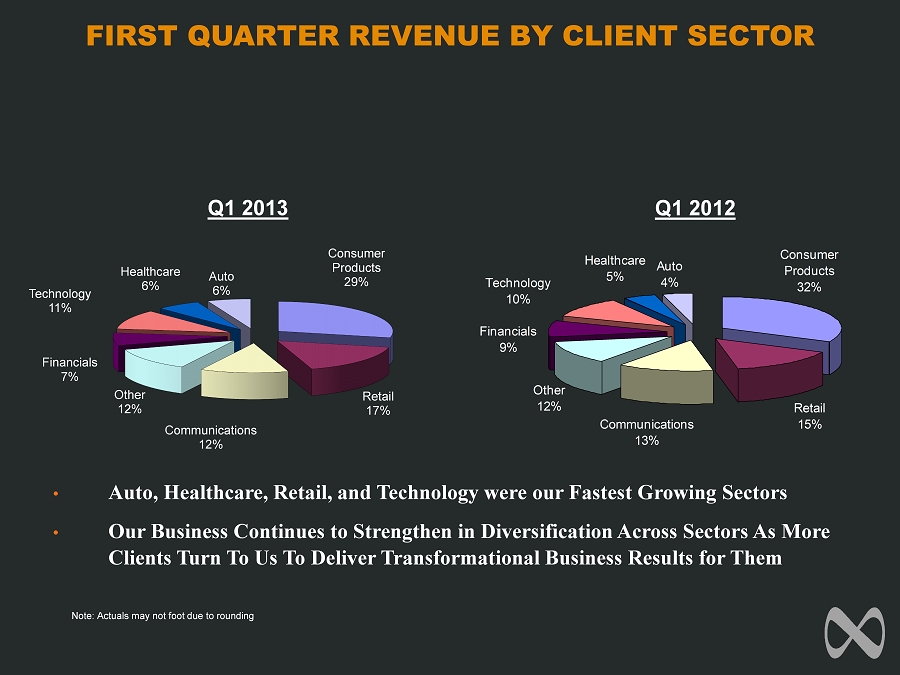
FIRST QUARTER REVENUE BY CLIENT SECTOR Note: Actuals may not foot due to rounding Q1 2013 Q1 2012 • Our Business Continues to Strengthen in Diversification Across Sectors As More Clients Turn To Us To Deliver Transformational Business Results for Them • We Continue To Expand Our Portfolio of Services and Our Industry Capabilities Retail 15% Other 12% Auto 4% Consumer Products 32% Communications 13% Financials 9% Technology 10% Healthcare 5% Consumer Products 29% Retail 17% Communications 12% Other 12% Financials 7% Technology 11% Healthcare 6% Auto 6%

4x Outperformance Relative to Peers Over Last 5 Years Note: *Peers include Omnicom, Interpublic, and Publicis *Due to timing of earnings WPP and Havas are not included in 1 Q13 ORGANIC GROWTH 1Q13 +10.1% MDC Partners vs. Peers Trailing 12 Month Organic Revenue -10.0% -5.0% 0.0% 5.0% 10.0% 15.0% 20.0% 25.0% 1Q082Q083Q084Q081Q092Q093Q094Q091Q102Q103Q104Q101Q112Q113Q114Q111Q122Q123Q124Q121Q13 MDC Peers

SUMMARY OF SEGMENT RESULTS - EBITDA Note: Actuals may not foot due to rounding • We remain focused on sustainable profitable growth by optimizing the conversion of incremental revenues to EBITDA and Free Cash Flow (US$ in millions, except percentages) 2013 2012 EBITDA Strategic Marketing Services 29.9$ 10.3$ 190.7 % margin 16.3% 6.4% Performance Marketing Services 4.8 3.1 51.2 % margin 5.7% 4.2% Marketing Communications 34.6 13.4 158.0 % margin 13.0% 5.7% Corporate Expenses (7.3) (5.0) 44.9 % Profit Distributions from Affiliates 3.1 - Total EBITDA 30.4$ 8.4$ 262.7 % margin 11.4% 3.6% % Change Three Months Ended March 31,

FREE CASH FLOW Note: Actuals may not foot due to rounding (US$ in millions) 2013 2012 Cash Flow Provided by (used in) Continuing Operating Activities ($32.0) $13.3 Distributions 3.1 0.0 Interest Expense, net 12.0 10.4 Changes in Working Capital 47.8 (17.3) Changes in Non-Current Assets & Liabilities (1.2) 1.1 Other 0.7 0.9 EBITDA $30.4 $8.4 Net Income Attibutable to Noncontrolling Interests (1.0) (1.5) Capital Expenditures, net (1) (2.7) (4.6) Cash Taxes (0.1) (0.0) Cash Interest, net & Other (2) (11.8) (9.4) Free Cash Flow (3) $14.9 ($7.1) (3) Free Cash Flow is a non-GAAP measure. As shown above, Free Cash Flow represents EBITDA less net income attributable to noncontrolling interests, less capital expenditures, less cash taxes, less net cash interest (including interest paid and other). Three Months Ended March 31, (1) Capital Expenditures, net represents capital expenditures net of landlord reimbursements. (2) Cash Interest, net & Other represents the quarterly accrual of cash interest under our Senior Notes.

LIQUIDITY (US$ in millions) Commitment Under Facility 225.0$ Drawn - Undrawn Letters of Credit 5.0 Funds Available Under Facility 220.0$ Total Cash 71.4 Liquidity 291.4$ Available Liquidity at March 31, 2013
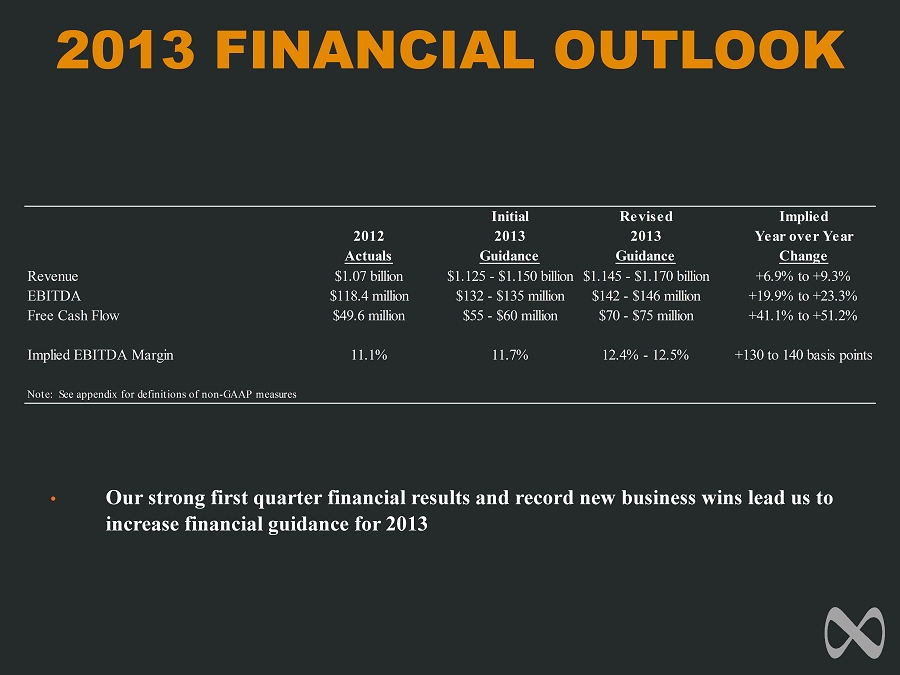
2013 FINANCIAL OUTLOOK • Our strong first quarter financial results and record new business wins lead us to increase financial guidance for 2013 Revised Initial Implied 2013 2013 Year over Year Guidance Guidance Change Revenue $1.145 - $1.170 billion $1.125 - $1.150 billion +6.9% to +9.3% EBITDA $142 - $146 million $132 - $135 million +19.9% to +23.3% Free Cash Flow $70 - $75 million $55 - $60 million +41.1% to +51.2% Implied EBITDA Margin 12.4% - 12.5% 11.7% +130 to 140 basis points Note: See appendix for definitions of non-GAAP measures

APPENDIX

TEMPORAL PUT OBLIGATIONS AND IMPACT ON EBITDA Note: Excludes put rights of $102.2 million exercisable pursuant to termination of employment or death. Incremental (US$ in millions) Cash Stock Total EBITDA in Period 2013 1.5 0.4 1.9 1.5 2014 1.5 0.5 2.0 0.2 2015 3.8 0.6 4.4 1.7 2016 2.7 0.2 2.9 0.0 Thereafter 5.8 0.0 5.8 0.6 Total $15.3 $1.7 $17.0 $4.0 Effective Multiple 4.3 Estimated Put Impact at March 31, 2013 Payment Consideration
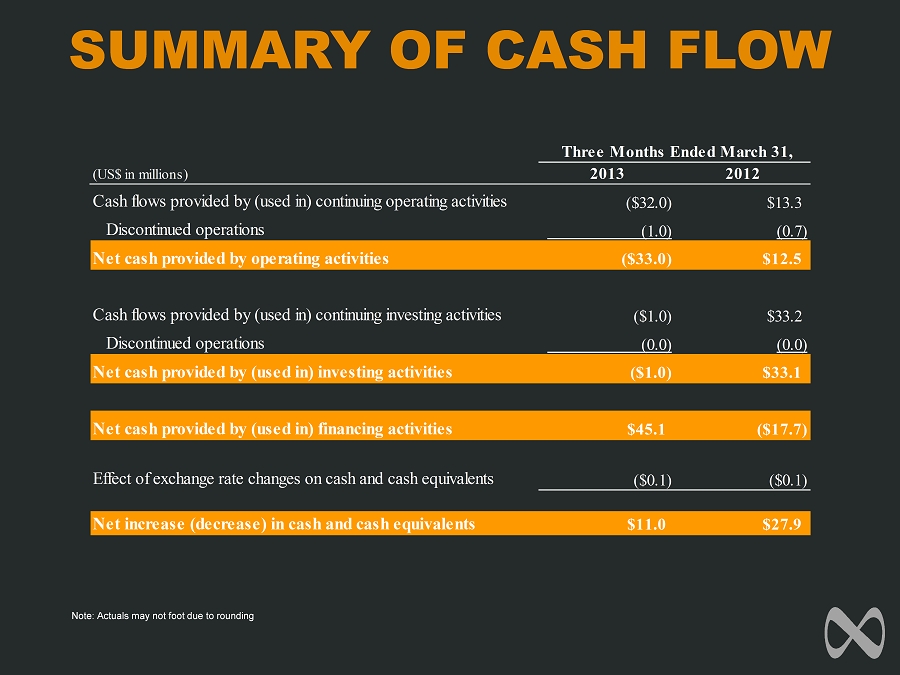
SUMMARY OF CASH FLOW Note: Actuals may not foot due to rounding (US$ in millions) 2013 2012 Cash flows provided by (used in) continuing operating activities ($32.0) $13.3 Discontinued operations (1.0) (0.7) Net cash provided by operating activities ($33.0) $12.5 Cash flows provided by (used in) continuing investing activities ($1.0) $33.2 Discontinued operations (0.0) (0.0) Net cash provided by (used in) investing activities ($1.0) $33.1 Net cash provided by (used in) financing activities $45.1 ($17.7) Effect of exchange rate changes on cash and cash equivalents ($0.1) ($0.1) Net increase (decrease) in cash and cash equivalents $11.0 $27.9 Three Months Ended March 31,
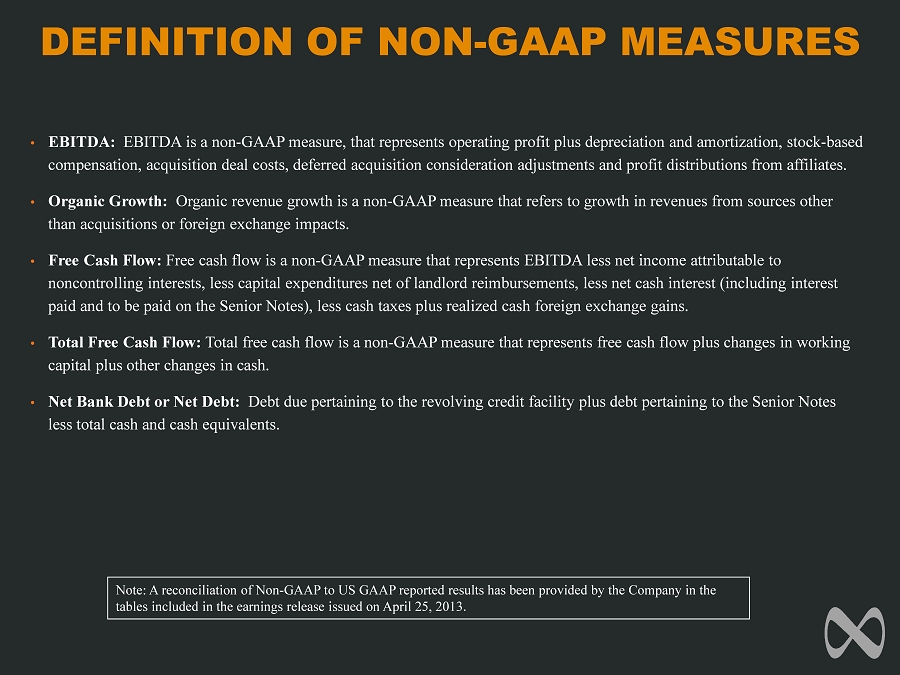
DEFINITION OF NON - GAAP MEASURES Note: A reconciliation of Non - GAAP to US GAAP reported results has been provided by the Company in the tables included in the earnings release issued on April 25, 2013. • EBITDA: EBITDA is a non - GAAP measure, that represents operating profit plus depreciation and amortization, stock - based compensation, acquisition deal costs, deferred acquisition consideration adjustments and profit distributions from affiliates . • Organic Growth: Organic revenue growth is a non - GAAP measure that refers to growth in revenues from sources other than acquisitions or foreign exchange impacts. • Free Cash Flow: Free cash flow is a non - GAAP measure that represents EBITDA less net income attributable to noncontrolling interests, less capital expenditures net of landlord reimbursements, less net cash interest (including interest paid and to be paid on the Senior Notes), less cash taxes plus realized cash foreign exchange gains. • Total Free Cash Flow: Total free cash flow is a non - GAAP measure that represents free cash flow plus changes in working capital plus other changes in cash. • Net Bank Debt or Net Debt: Debt due pertaining to the revolving credit facility plus debt pertaining to the Senior Notes less total cash and cash equivalents.