February 20, 2014 Management Presentation Fourth Quarter 2013 Results
2 FORWARD LOOKING STATEMENTS & OTHER INFORMATION This presentation, including our “ 2014 Financial Outlook”, contains forward - looking statements . The Company’s representatives may also make forward - looking statements orally from time to time . Statements in this presentation that are not historical facts, including statements about the Company’s beliefs and expectations, earnings guidance, recent business and economic trends, potential acquisitions, estimates of amounts for deferred acquisition consideration and “put” option rights, constitute forward - looking statements . These statements are based on current plans, estimates and projections, and are subject to change based on a number of factors, including those outlined in this section . Forward - looking statements speak only as of the date they are made, and the Company undertakes no obligation to update publicly any of them in light of new information or future events, if any . Forward - looking statements involve inherent risks and uncertainties . A number of important factors could cause actual results to differ materially from those contained in any forward - looking statements . Such risk factors include, but are not limited to, the following : • risks associated with severe effects of international, national and regional economic downturn ; • the Company’s ability to attract new clients and retain existing clients; • the spending patterns and financial success of the Company’s clients; • the Company’s ability to remain in compliance with its debt agreements and the Company’s ability to finance its contingent pa yme nt obligations when due and payable, including but not limited to those relating to “put” option rights and deferred acquisition co nsideration; • the successful completion and integration of acquisitions which compliment and expand the Company’s business capabilities; an d • foreign currency fluctuations. The Company’s business strategy includes ongoing efforts to engage in material acquisitions of ownership interests in entities in the marketing communications services industry . The Company intends to finance these acquisitions by using available cash from operations and through incurrence of bridge or other debt financing, either of which may increase the Company’s leverage ratios, or by issuing equity, which may have a dilutive impact on existing shareholders proportionate ownership . At any given time the Company may be engaged in a number of discussions that may result in one or more material acquisitions . These opportunities require confidentiality and may involve negotiations that require quick responses by the Company . Although there is uncertainty that any of these discussions will result in definitive agreements or the completion of any transactions, the announcement of any such transaction may lead to increased volatility in the trading price of the Company’s securities . Investors should carefully consider these risk factors and the additional risk factors outlined in more detail in the Annual Report on Form 10 - K under the caption “Risk Factors” and in the Company’s other SEC filings .
3 • Another year of exceptionally strong operational and financial performance for our business • Exceptional financial performance across all key metrics – industry - leading organic revenue growth, strong EBITDA growth and operating leverage, and solid free cash flow growth • New business wins and pipeline robust as incremental share of wallet and increasing market share provide visibility for future momentum • Superior industry recognition…72andSunny named “Agency of the Year” again; Anomaly and 72andSunny made the A - List, Vitro and kbs + celebrated as 2 of only 10 “Standout Agencies” • Significant free cash flow generation; increasing quarterly dividend • Strengthened balance sheet, reduced borrowing costs, and improved flexibility to use capital to the benefit of shareholders SUMMARY
4 SUPERIOR FINANCIAL PERFORMANCE ACROSS ALL KEY METRICS – INDUSTRY LEADING ORGANIC REVENUE GROWTH, STRONG EBITDA GROWTH AND OPERATING LEVERAGE, AND SOLID FREE CASH FLOW GROWTH • O rganic revenue growth of 8.3 %, outpacing the industry by 3 times • Revenue increased from $1.06 billion to $1.15 billion , up 8.1% • EBITDA increased from $119.7 million to $159.4 million, up 33.1% • EBITDA margin expanded from 11.3% to 13.9%, up 260 basis points • Net new business wins of $132.5 million, consistent with 2012 • Free Cash Flow increased from $50.3 million to $91.6 million, up 82.0% • Quarterly dividend increased by 93% over the course of the year to $0.18 • Effectively repurchased 7% of shares outstanding during the year 2013 FINANCIAL HIGHLIGHTS
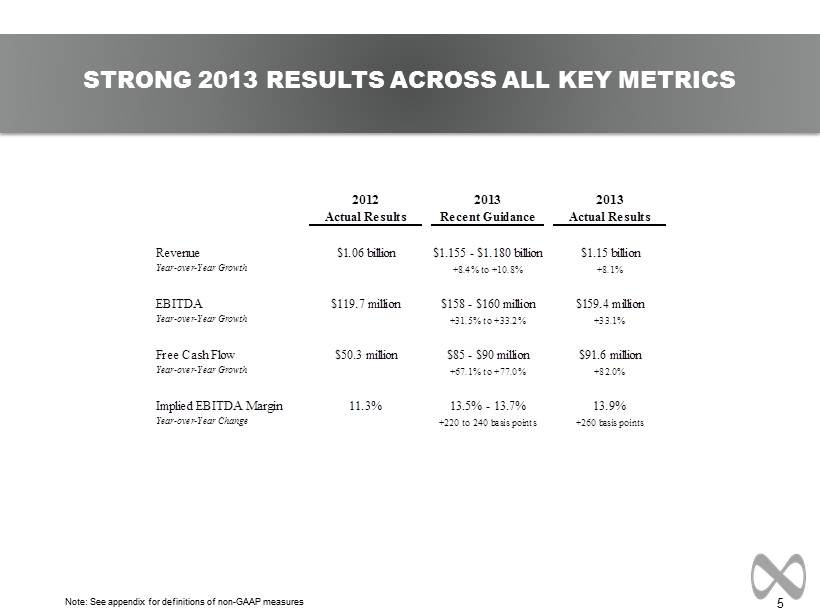
5 STRONG 2013 RESULTS ACROSS ALL KEY METRICS Note: See appendix for definitions of non - GAAP measures 2012 2013 2013 Actual Results Recent Guidance Actual Results Revenue $1.06 billion $1.155 - $1.180 billion $1.15 billion Year-over-Year Growth +8.4% to +10.8% +8.1% EBITDA $119.7 million $158 - $160 million $159.4 million Year-over-Year Growth +31.5% to +33.2% +33.1% Free Cash Flow $50.3 million $85 - $90 million $91.6 million Year-over-Year Growth +67.1% to +77.0% +82.0% Implied EBITDA Margin 11.3% 13.5% - 13.7% 13.9% Year-over-Year Change +220 to 240 basis points +260 basis points
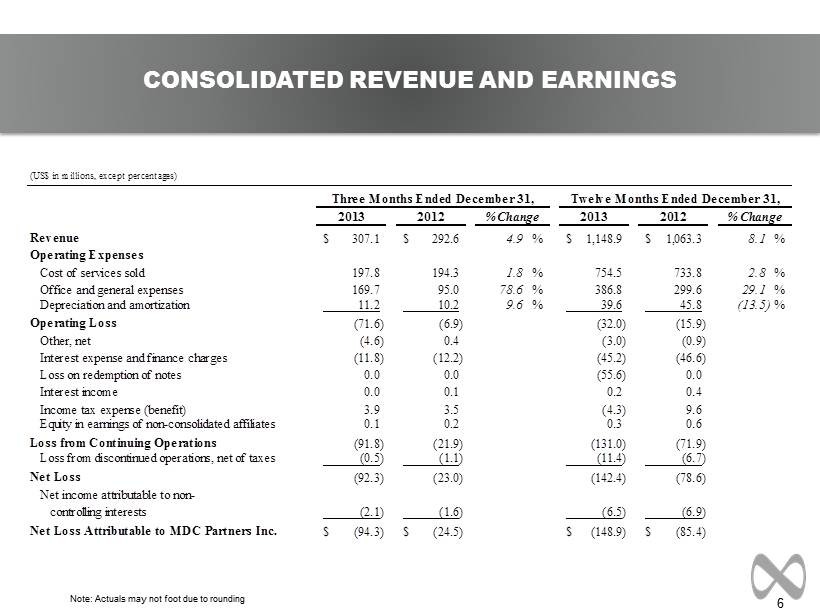
6 Note: Actuals may not foot due to rounding CONSOLIDATED REVENUE AND EARNINGS (US$ in millions, except percentages) 2013 2012 2013 2012 Revenue 307.1$ 292.6$ 4.9 % 1,148.9$ 1,063.3$ 8.1 % Operating Expenses Cost of services sold 197.8 194.3 1.8 % 754.5 733.8 2.8 % Office and general expenses 169.7 95.0 78.6 % 386.8 299.6 29.1 % Depreciation and amortization 11.2 10.2 9.6 % 39.6 45.8 (13.5) % Operating Loss (71.6) (6.9) (32.0) (15.9) Other, net (4.6) 0.4 (3.0) (0.9) Interest expense and finance charges (11.8) (12.2) (45.2) (46.6) Loss on redemption of notes 0.0 0.0 (55.6) 0.0 Interest income 0.0 0.1 0.2 0.4 Income tax expense (benefit) 3.9 3.5 (4.3) 9.6 Equity in earnings of non-consolidated affiliates 0.1 0.2 0.3 0.6 Loss from Continuing Operations (91.8) (21.9) (131.0) (71.9) Loss from discontinued operations, net of taxes (0.5) (1.1) (11.4) (6.7) Net Loss (92.3) (23.0) (142.4) (78.6) Net income attributable to non- controlling interests (2.1) (1.6) (6.5) (6.9) Net Loss Attributable to MDC Partners Inc. (94.3)$ (24.5)$ (148.9)$ (85.4)$ % Change Three Months Ended December 31, Twelve Months Ended December 31, % Change
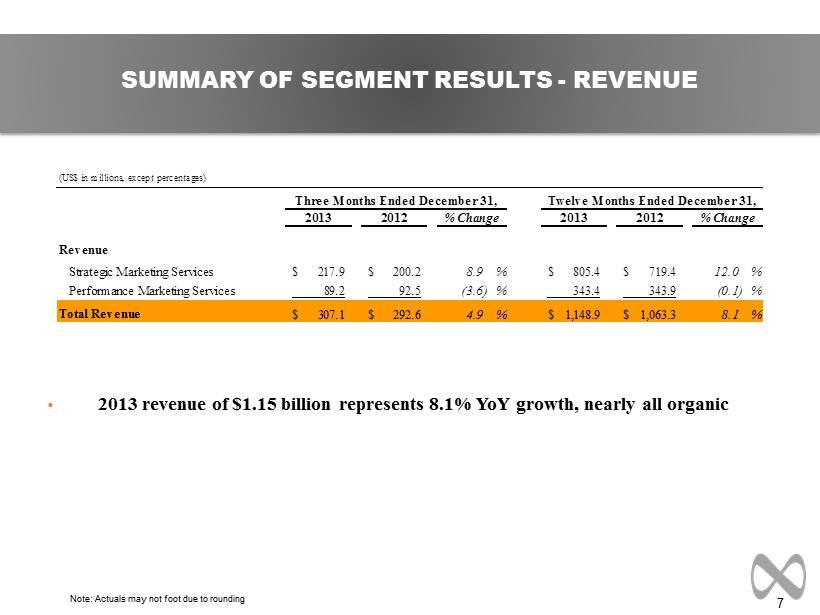
7 • 2013 revenue of $1.15 billion represents 8.1% YoY growth, nearly all organic SUMMARY OF SEGMENT RESULTS - REVENUE Note: Actuals may not foot due to rounding (US$ in millions, except percentages) 2013 2012 2013 2012 Revenue Strategic Marketing Services 217.9$ 200.2$ 8.9 % 805.4$ 719.4$ 12.0 % Performance Marketing Services 89.2 92.5 (3.6) % 343.4 343.9 (0.1) % Total Revenue 307.1$ 292.6$ 4.9 % 1,148.9$ 1,063.3$ 8.1 % % Change Three Months Ended December 31, Twelve Months Ended December 31, % Change
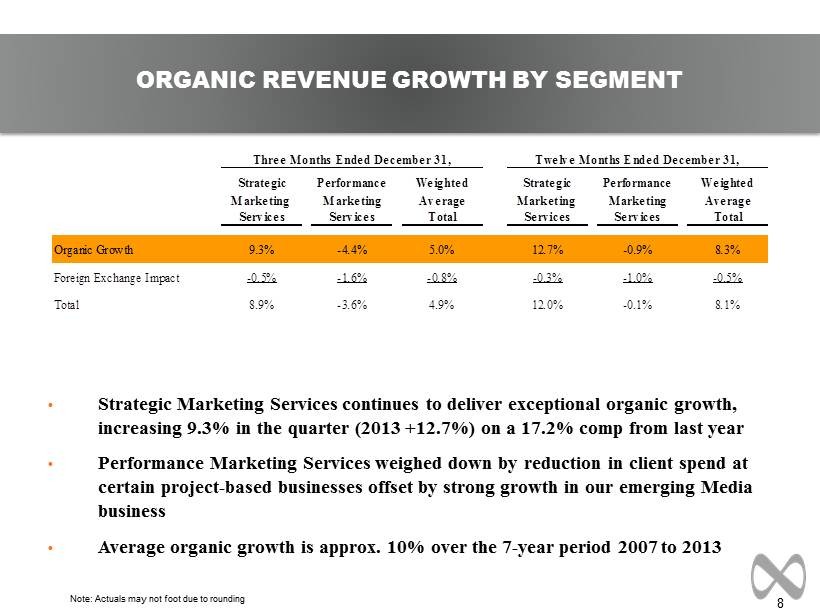
8 Note: Actuals may not foot due to rounding ORGANIC REVENUE GROWTH BY SEGMENT Note: Actuals may not foot due to rounding • Strategic Marketing Services continues to deliver exceptional organic growth, increasing 9.3% in the quarter (2013 +12.7%) on a 17.2% comp from last year • Performance Marketing Services weighed down by reduction in client spend at certain project - based businesses offset by strong growth in our emerging Media business • Average organic growth is approx. 10% over the 7 - year period 2007 to 2013 Strategic Performance Weighted Strategic Performance Weighted Marketing Marketing Average Marketing Marketing Average Services Services Total Services Services Total Organic Growth 9.3% -4.4% 5.0% 12.7% -0.9% 8.3% Foreign Exchange Impact -0.5% -1.6% -0.8% -0.3% -1.0% -0.5% Total 8.9% -3.6% 4.9% 12.0% -0.1% 8.1% Three Months Ended December 31, Twelve Months Ended December 31,

9 Q4 2013 Mix Year - over - Year Growth by Category • Technology, Healthcare and Auto are our fastest growing industry sectors, more than offsetting declines in certain other categories • Our business continues to strengthen in diversification across sectors as more clients turn to us to deliver transformational business results for them FOURTH QUARTER REVENUE BY CLIENT INDUSTRY Note: Actuals may not foot due to rounding Q4 2013 FY 2013 Above 10% Technology Auto Healthcare Other Technology Healthcare Other 0% to 10% Consumer Products Financials Auto Retail Communications Below 0% Retail Communications Financials Consumer Products
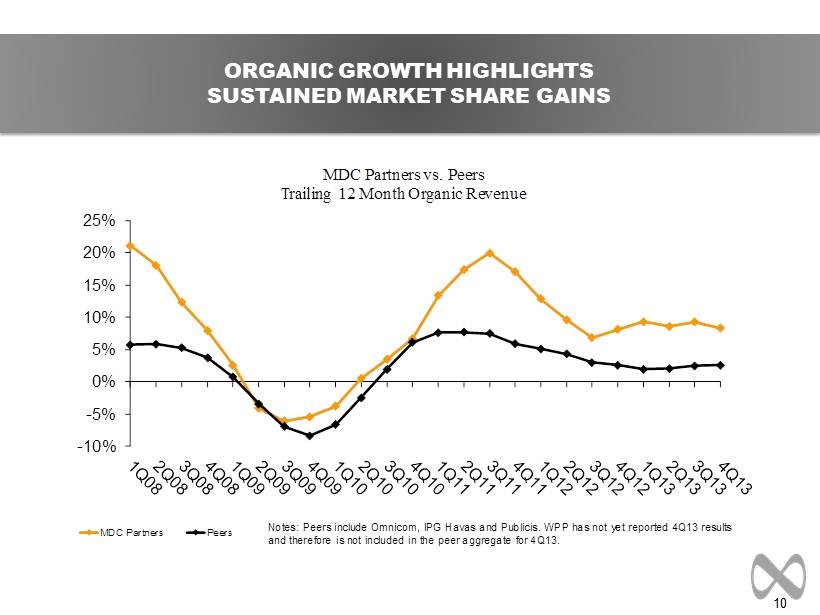
10 ORGANIC GROWTH HIGHLIGHTS SUSTAINED MARKET SHARE GAINS -10% -5% 0% 5% 10% 15% 20% 25% MDC Partners vs. Peers Trailing 12 Month Organic Revenue MDC Partners Peers Notes: Peers include Omnicom, IPG Havas and Publicis . WPP has not yet reported 4Q13 results and therefore is not included in the peer aggregate for 4Q13.
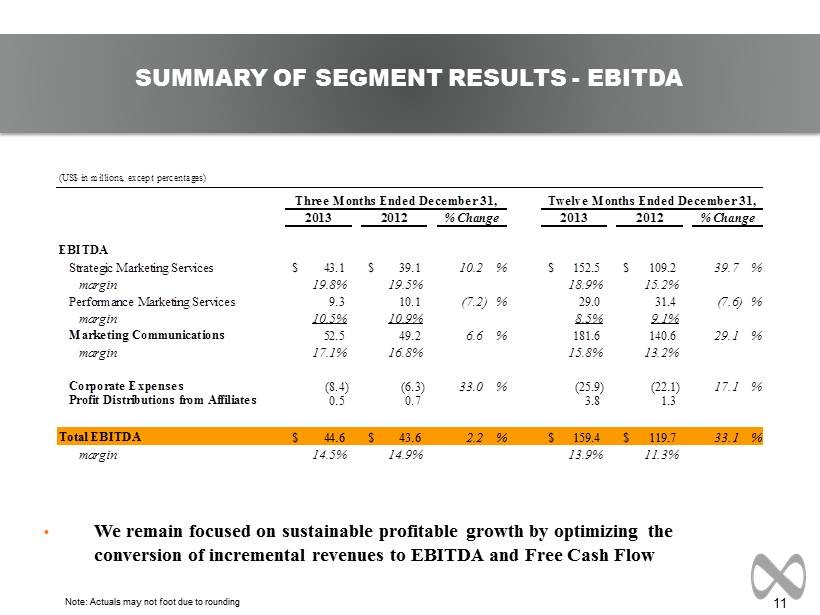
11 Note: Actuals may not foot due to rounding • We remain focused on sustainable profitable growth by optimizing the conversion of incremental revenues to EBITDA and Free Cash Flow SUMMARY OF SEGMENT RESULTS - EBITDA (US$ in millions, except percentages) 2013 2012 2013 2012 EBITDA Strategic Marketing Services 43.1$ 39.1$ 10.2 % 152.5$ 109.2$ 39.7 % margin 19.8% 19.5% 18.9% 15.2% Performance Marketing Services 9.3 10.1 (7.2) % 29.0 31.4 (7.6) % margin 10.5% 10.9% 8.5% 9.1% Marketing Communications 52.5 49.2 6.6 % 181.6 140.6 29.1 % margin 17.1% 16.8% 15.8% 13.2% Corporate Expenses (8.4) (6.3) 33.0 % (25.9) (22.1) 17.1 % Profit Distributions from Affiliates 0.5 0.7 3.8 1.3 Total EBITDA 44.6$ 43.6$ 2.2 % 159.4$ 119.7$ 33.1 % margin 14.5% 14.9% 13.9% 11.3% % Change Three Months Ended December 31, Twelve Months Ended December 31, % Change
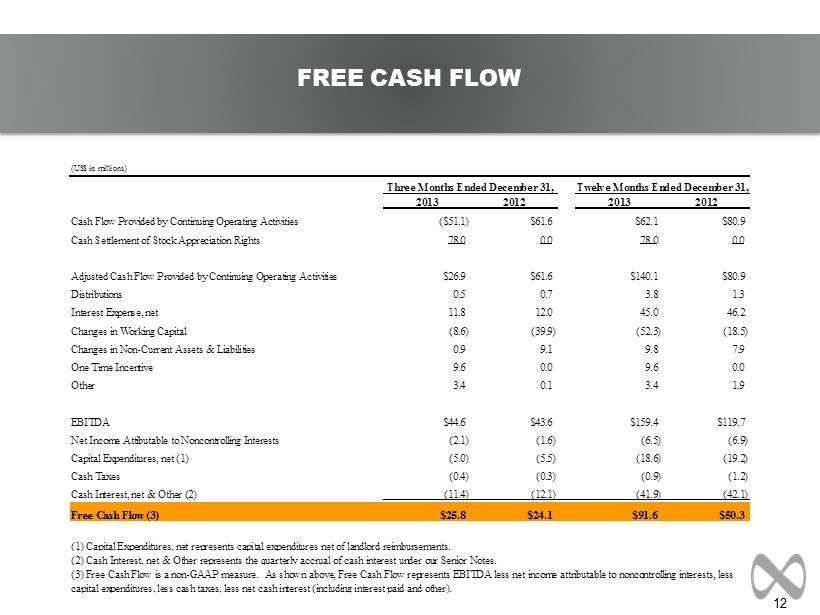
12 Note: Actuals may not foot due to rounding FREE CASH FLOW (US$ in millions) 2013 2012 2013 2012 Cash Flow Provided by Continuing Operating Activities ($51.1) $61.6 $62.1 $80.9 Cash Settlement of Stock Appreciation Rights 78.0 0.0 78.0 0.0 Adjusted Cash Flow Provided by Continuing Operating Activities $26.9 $61.6 $140.1 $80.9 Distributions 0.5 0.7 3.8 1.3 Interest Expense, net 11.8 12.0 45.0 46.2 Changes in Working Capital (8.6) (39.9) (52.3) (18.5) Changes in Non-Current Assets & Liabilities 0.9 9.1 9.8 7.9 One Time Incentive 9.6 0.0 9.6 0.0 Other 3.4 0.1 3.4 1.9 EBITDA $44.6 $43.6 $159.4 $119.7 Net Income Attibutable to Noncontrolling Interests (2.1) (1.6) (6.5) (6.9) Capital Expenditures, net (1) (5.0) (5.5) (18.6) (19.2) Cash Taxes (0.4) (0.3) (0.9) (1.2) Cash Interest, net & Other (2) (11.4) (12.1) (41.9) (42.1) Free Cash Flow (3) $25.8 $24.1 $91.6 $50.3 Three Months Ended December 31, Twelve Months Ended December 31, (1) Capital Expenditures, net represents capital expenditures net of landlord reimbursements. (2) Cash Interest, net & Other represents the quarterly accrual of cash interest under our Senior Notes. (3) Free Cash Flow is a non-GAAP measure. As shown above, Free Cash Flow represents EBITDA less net income attributable to noncontrolling interests, less capital expenditures, less cash taxes, less net cash interest (including interest paid and other).

13 AVAILABLE LIQUIDITY (US$ in millions) December 31, 2013 December 31, 2012 Commitment Under Facility $225.0 $150.0 Drawn - - Undrawn Letters of Credit 4.9 4.8 Funds Available Under Facility $220.1 $145.2 Total Cash & Cash Equivalents 102.0 60.3 Liquidity $322.1 $205.5
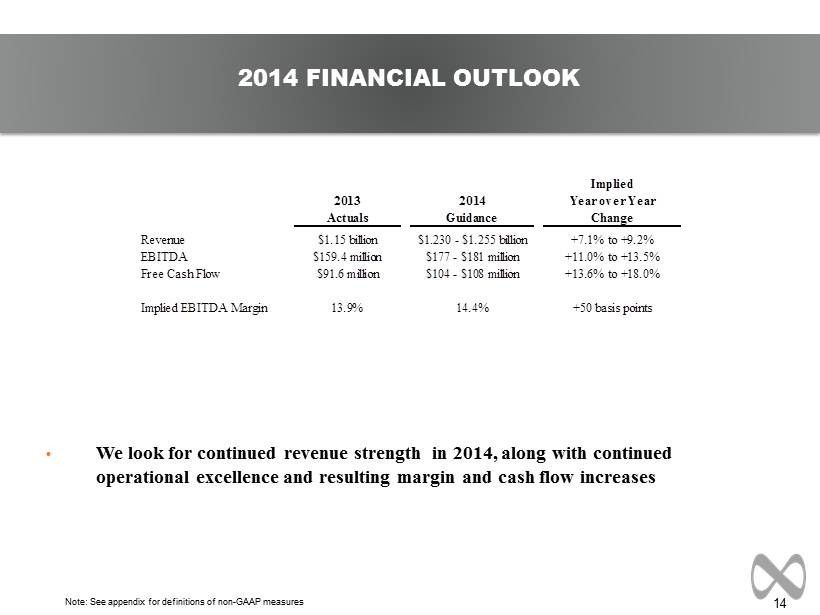
14 • We look for continued revenue strength in 2014, along with continued operational excellence and resulting margin and cash flow increases 2014 FINANCIAL OUTLOOK Implied 2013 2014 Year over Year Actuals Guidance Change Revenue $1.15 billion $1.230 - $1.255 billion +7.1% to +9.2% EBITDA $159.4 million $177 - $181 million +11.0% to +13.5% Free Cash Flow $91.6 million $104 - $108 million +13.6% to +18.0% Implied EBITDA Margin 13.9% 14.4% +50 basis points Note: See appendix for definitions of non - GAAP measures
15 APPENDIX
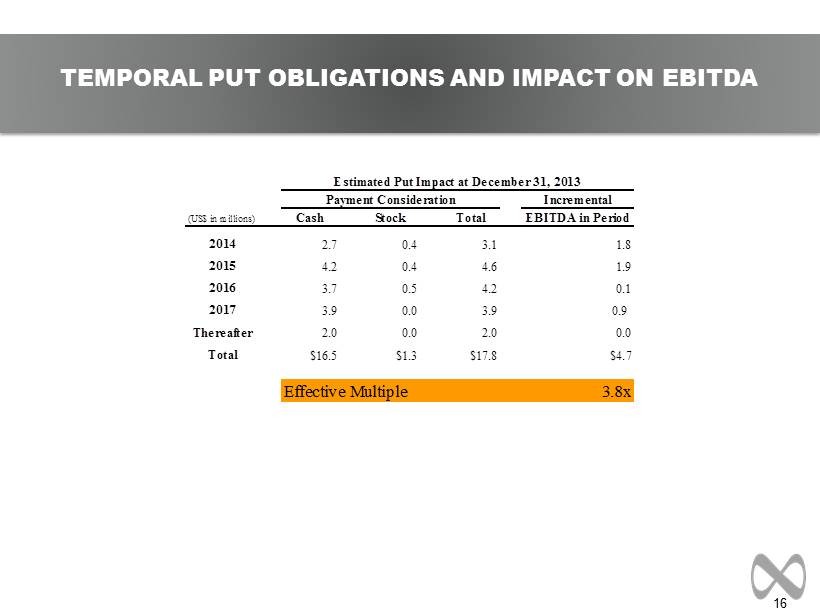
16 TEMPORAL PUT OBLIGATIONS AND IMPACT ON EBITDA Incremental (US$ in millions) Cash Stock Total EBITDA in Period 2014 2.7 0.4 3.1 1.8 2015 4.2 0.4 4.6 1.9 2016 3.7 0.5 4.2 0.1 2017 3.9 0.0 3.9 0.9 Thereafter 2.0 0.0 2.0 0.0 Total $16.5 $1.3 $17.8 $4.7 Effective Multiple 3.8x Estimated Put Impact at December 31, 2013 Payment Consideration
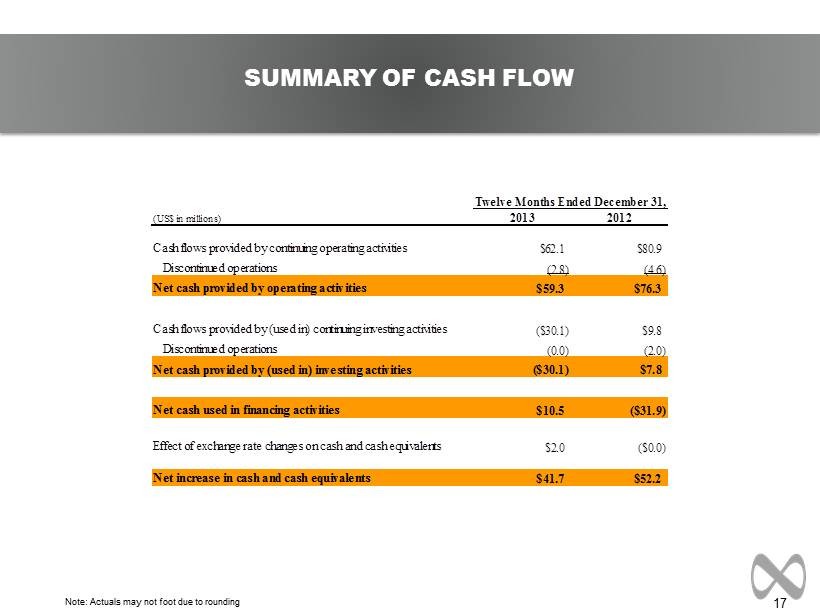
17 Note: Actuals may not foot due to rounding SUMMARY OF CASH FLOW Note: Actuals may not foot due to rounding (US$ in millions) 2013 2012 Cash flows provided by continuing operating activities $62.1 $80.9 Discontinued operations (2.8) (4.6) Net cash provided by operating activities $59.3 $76.3 Cash flows provided by (used in) continuing investing activities ($30.1) $9.8 Discontinued operations (0.0) (2.0) Net cash provided by (used in) investing activities ($30.1) $7.8 Net cash used in financing activities $10.5 ($31.9) Effect of exchange rate changes on cash and cash equivalents $2.0 ($0.0) Net increase in cash and cash equivalents $41.7 $52.2 Twelve Months Ended December 31,
18 Note: Actuals may not foot due to rounding DEFINITION OF NON - GAAP MEASURES EBITDA: EBITDA is a non - GAAP measure, that represents operating profit plus depreciation and amortization, stock - based compensation, acquisition deal costs, deferred acquisition consideration adjustments, one time incentive compensation, and profit distributions from affiliates. Organic Growth: Organic revenue growth is a non - GAAP measure that refers to growth in revenues from sources other than acquisitions or foreign exchange impacts. Free Cash Flow: Free cash flow is a non - GAAP measure that represents EBITDA less net income attributable to non - controlling interests, less capital expenditures net of landlord reimbursements, less net cash interest (including interest paid and to be paid on the Senior Notes), less cash taxes plus realized cash foreign exchange gains. Net Bank Debt or Net Debt: Debt due pertaining to the revolving credit facility plus debt pertaining to the Senior Notes less total cash and cash equivalents. Note: A reconciliation of Non - GAAP to US GAAP reported results has been provided by the Company in the tables included in the earnings release issued on February 20, 2014.
MDC Partners Innovation Centre 745 Fifth Avenue, Floor 19 New York, NY 10151 646 - 429 - 1800 www.mdc - partners.com