Exhibit 99.2

August 7, 2019 Management Presentation Second Quarter 2019 Results

2 FORWARD LOOKING STATEMENTS & OTHER INFORMATION This presentation contains forward - looking statements . Statements in this presentation that are not historical facts, including without limitation statements about the Company’s beliefs and expectations, earnings guidance, recent business and economic trends, potential acquisitions, and estimates of amounts for redeemable noncontrolling interests and deferred acquisition consideration, constitute forward - looking statements . Words such as “estimates”, “expects”, “contemplates”, “will”, “anticipates”, “projects”, “plans”, “intends”, “believes”, “forecasts”, “may”, “should”, and variations of such words or similar expressions are intended to identify forward - looking statements . These statements are based on current plans, estimates and projections, and are subject to change based on a number of factors, including those outlined below . Forward - looking statements speak only as of the date they are made, and the Company undertakes no obligation to update publicly any of them in light of new information or future events, if any . Forward - looking statements involve inherent risks and uncertainties . A number of important factors could cause actual results to differ materially from those contained in any forward - looking statements . Such risk factors include, but are not limited to, the following : • risks associated with severe effects of international, national and regional economic conditions ; • the Company’s ability to attract new clients and retain existing clients ; • the spending patterns and financial success of the Company’s clients ; • the Company’s ability to retain and attract key employees ; • the Company’s ability to remain in compliance with its debt agreements and the Company’s ability to finance its contingent payment obligations when due and payable, including but not limited to those relating to redeemable noncontrolling interests and deferred acquisition consideration ; • the successful completion and integration of acquisitions which complement and expand the Company’s business capabilities, and the potential impact of one or more asset sales ; and • foreign currency fluctuations . Investors should carefully consider these risk factors and the additional risk factors outlined in more detail in the Company’s 2018 Annual Report on Form 10 - K under the caption “Risk Factors”, and in the Company’s other SEC filings .
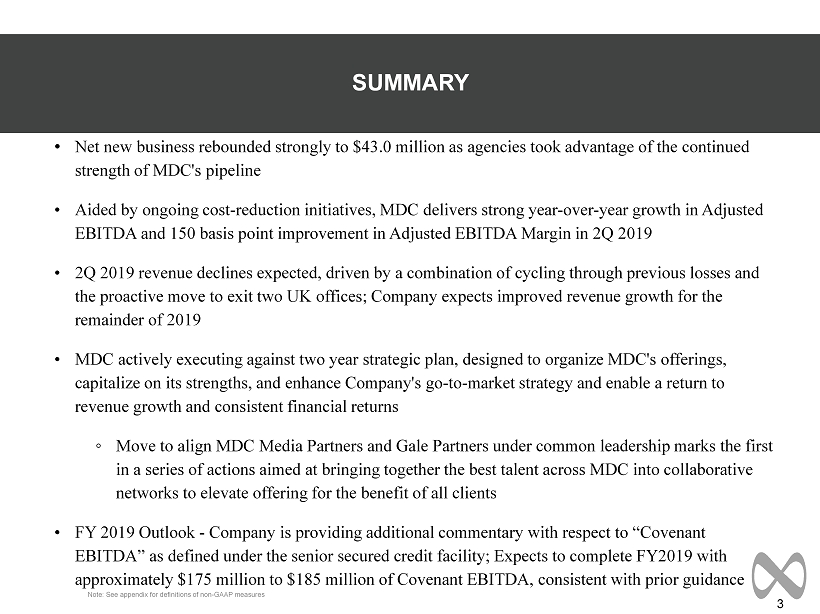
3 SUMMARY • Net new business rebounded strongly to $43.0 million as agencies took advantage of the continued strength of MDC's pipeline • Aided by ongoing cost - reduction initiatives, MDC delivers strong year - over - year growth in Adjusted EBITDA and 150 basis point improvement in Adjusted EBITDA Margin in 2Q 2019 • 2Q 2019 revenue declines expected, driven by a combination of cycling through previous losses and the proactive move to exit two UK offices; Company expects improved revenue growth for the remainder of 2019 • MDC actively executing against two year strategic plan, designed to organize MDC's offerings, capitalize on its strengths, and enhance Company's go - to - market strategy and enable a return to revenue growth and consistent financial returns ◦ Move to align MDC Media Partners and Gale Partners under common leadership marks the first in a series of actions aimed at bringing together the best talent across MDC into collaborative networks to elevate offering for the benefit of all clients • FY 2019 Outlook - Company is providing additional commentary with respect to “Covenant EBITDA” as defined under the senior secured credit facility; Expects to complete FY2019 with approximately $175 million to $185 million of Covenant EBITDA, consistent with prior guidance Note: See appendix for definitions of non - GAAP measures
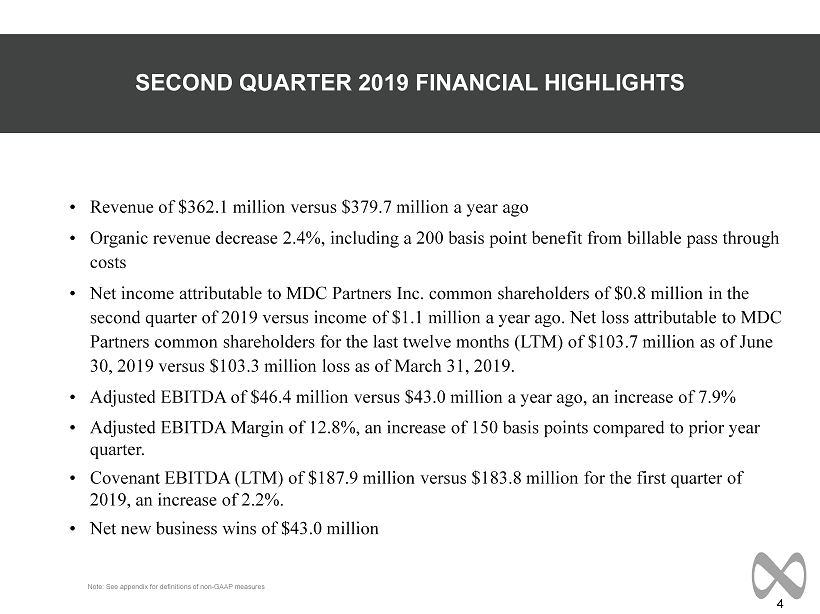
4 ----- DRAFT ----- • Revenue of $362.1 million versus $379.7 million a year ago • Organic revenue decrease 2.4%, including a 200 basis point benefit from billable pass through costs • Net income attributable to MDC Partners Inc. common shareholders of $0.8 million in the second quarter of 2019 versus income of $1.1 million a year ago. Net loss attributable to MDC Partners common shareholders for the last twelve months (LTM) of $103.7 million as of June 30, 2019 versus $103.3 million loss as of March 31, 2019. • Adjusted EBITDA of $46.4 million versus $43.0 million a year ago, an increase of 7.9% • Adjusted EBITDA Margin of 12.8%, an increase of 150 basis points compared to prior year quarter. • Covenant EBITDA (LTM) of $187.9 million versus $183.8 million for the first quarter of 2019, an increase of 2.2%. • Net new business wins of $43.0 million SECOND QUARTER 2019 FINANCIAL HIGHLIGHTS Note: See appendix for definitions of non - GAAP measures
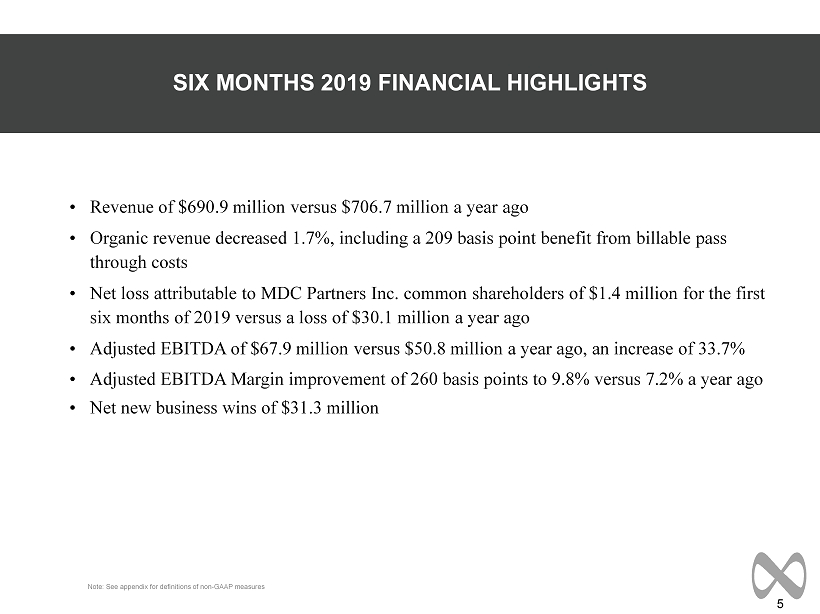
5 ----- DRAFT ----- • Revenue of $690.9 million versus $706.7 million a year ago • Organic revenue decreased 1.7%, including a 209 basis point benefit from billable pass through costs • Net loss attributable to MDC Partners Inc. common shareholders of $1.4 million for the first six months of 2019 versus a loss of $30.1 million a year ago • Adjusted EBITDA of $67.9 million versus $50.8 million a year ago, an increase of 33.7% • Adjusted EBITDA Margin improvement of 260 basis points to 9.8% versus 7.2% a year ago • Net new business wins of $31.3 million SIX MONTHS 2019 FINANCIAL HIGHLIGHTS Note: See appendix for definitions of non - GAAP measures
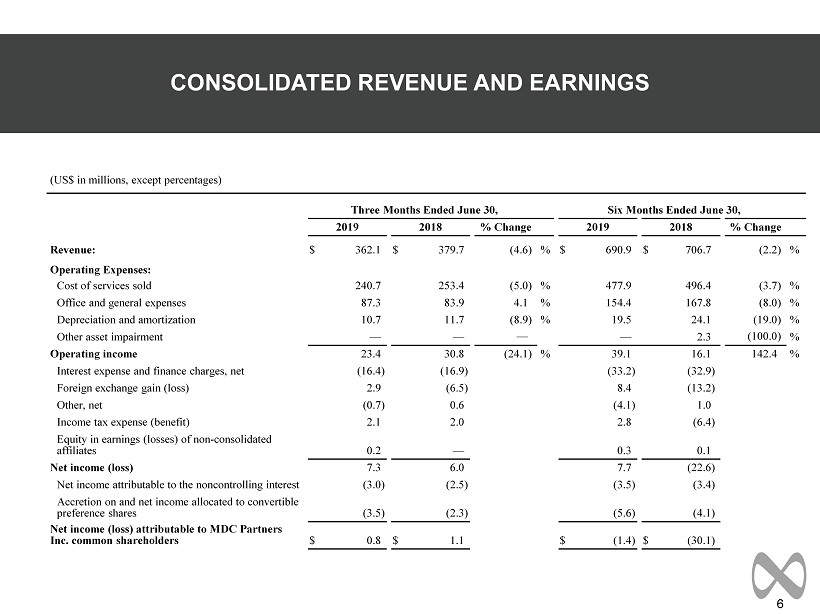
6 CONSOLIDATED REVENUE AND EARNINGS (US$ in millions, except percentages) Three Months Ended June 30, Six Months Ended June 30, 2019 2018 % Change 2019 2018 % Change Revenue: $ 362.1 $ 379.7 (4.6 ) % $ 690.9 $ 706.7 (2.2 ) % Operating Expenses: Cost of services sold 240.7 253.4 (5.0 ) % 477.9 496.4 (3.7 ) % Office and general expenses 87.3 83.9 4.1 % 154.4 167.8 (8.0 ) % Depreciation and amortization 10.7 11.7 (8.9 ) % 19.5 24.1 (19.0 ) % Other asset impairment — — — — 2.3 (100.0 ) % Operating income 23.4 30.8 (24.1 ) % 39.1 16.1 142.4 % Interest expense and finance charges, net (16.4 ) (16.9 ) (33.2 ) (32.9 ) Foreign exchange gain (loss) 2.9 (6.5 ) 8.4 (13.2 ) Other, net (0.7 ) 0.6 (4.1 ) 1.0 Income tax expense (benefit) 2.1 2.0 2.8 (6.4 ) Equity in earnings (losses) of non - consolidated affiliates 0.2 — 0.3 0.1 Net income (loss) 7.3 6.0 7.7 (22.6 ) Net income attributable to the noncontrolling interest (3.0 ) (2.5 ) (3.5 ) (3.4 ) Accretion on and net income allocated to convertible preference shares (3.5 ) (2.3 ) (5.6 ) (4.1 ) Net income (loss) attributable to MDC Partners Inc. common shareholders $ 0.8 $ 1.1 $ (1.4 ) $ (30.1 )
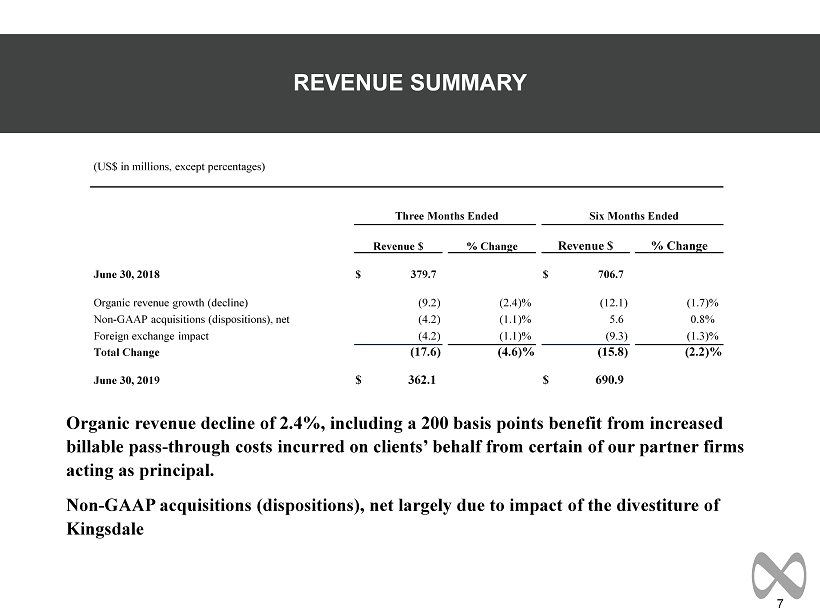
7 Organic revenue decline of 2.4%, including a 200 basis points benefit from increased billable pass - through costs incurred on clients’ behalf from certain of our partner firms acting as principal. Non - GAAP acquisitions (dispositions), net largely due to impact of the divestiture of Kingsdale REVENUE SUMMARY (US$ in millions, except percentages) Three Months Ended Six Months Ended Revenue $ % Change Revenue $ % Change June 30, 2018 $ 379.7 $ 706.7 Organic revenue growth (decline) (9.2 ) (2.4 )% (12.1 ) (1.7 )% Non - GAAP acquisitions (dispositions), net (4.2 ) (1.1 )% 5.6 0.8 % Foreign exchange impact (4.2 ) (1.1 )% (9.3 ) (1.3 )% Total Change (17.6 ) (4.6 )% (15.8 ) (2.2 )% June 30, 2019 $ 362.1 $ 690.9
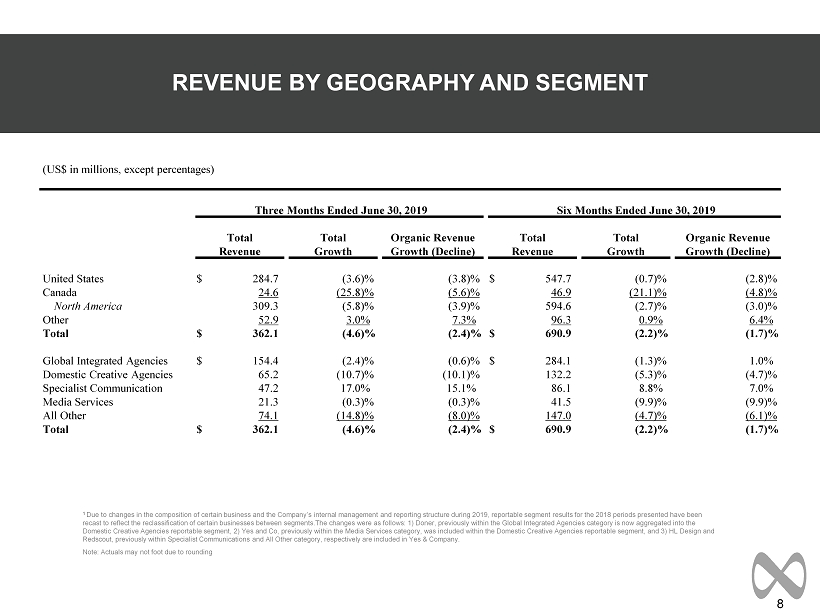
8 REVENUE BY GEOGRAPHY AND SEGMENT 1 Due to changes in the composition of certain business and the Company’s internal management and reporting structure during 20 19, reportable segment results for the 2018 periods presented have been recast to reflect the reclassification of certain businesses between segments.The changes were as follows: 1) Doner, previous ly within the Global Integrated Agencies category is now aggregated into the Domestic Creative Agencies reportable segment, 2) Yes and Co, previously within the Media Services category, was included wit hin the Domestic Creative Agencies reportable segment, and 3) HL Design and Redscout, previously within Specialist Communications and All Other category, respectively are included in Yes & Company. Note: Actuals may not foot due to rounding (US$ in millions, except percentages) Three Months Ended June 30, 2019 Six Months Ended June 30, 2019 Total Total Organic Revenue Total Total Organic Revenue Revenue Growth Growth (Decline) Revenue Growth Growth (Decline) United States $ 284.7 (3.6 )% (3.8 )% $ 547.7 (0.7 )% (2.8 )% Canada 24.6 (25.8 )% (5.6 )% 46.9 (21.1 )% (4.8 )% North America 309.3 (5.8 )% (3.9 )% 594.6 (2.7 )% (3.0 )% Other 52.9 3.0 % 7.3 % 96.3 0.9 % 6.4 % Total $ 362.1 (4.6 )% (2.4 )% $ 690.9 (2.2 )% (1.7 )% Global Integrated Agencies $ 154.4 (2.4 )% (0.6 )% $ 284.1 (1.3 )% 1.0 % Domestic Creative Agencies 65.2 (10.7 )% (10.1 )% 132.2 (5.3 )% (4.7 )% Specialist Communication 47.2 17.0 % 15.1 % 86.1 8.8 % 7.0 % Media Services 21.3 (0.3 )% (0.3 )% 41.5 (9.9 )% (9.9 )% All Other 74.1 (14.8 )% (8.0 )% 147.0 (4.7 )% (6.1 )% Total $ 362.1 (4.6 )% (2.4 )% $ 690.9 (2.2 )% (1.7 )%
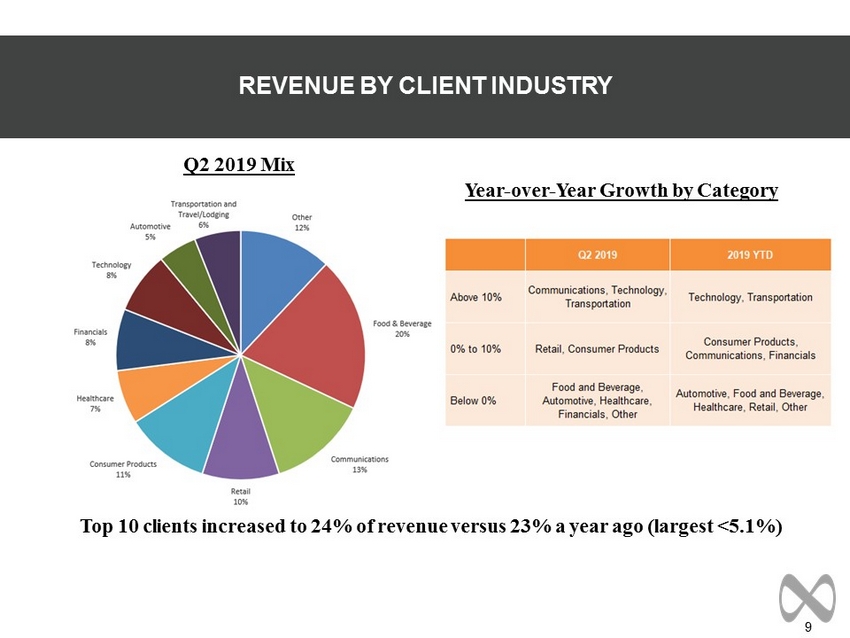
9 Top 10 clients increased to 24% of revenue versus 23% a year ago (largest <5.1%) REVENUE BY CLIENT INDUSTRY Year - over - Year Growth by Category Q2 2019 Mix
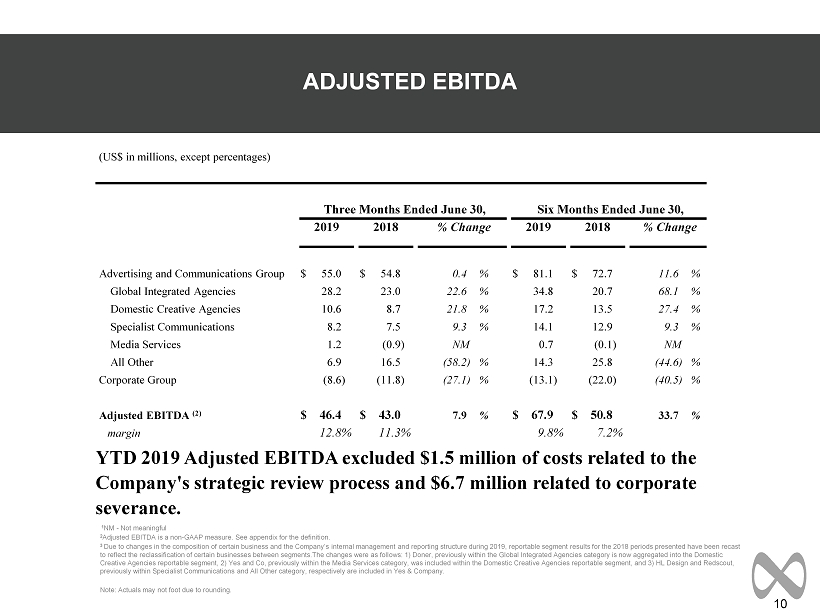
10 ADJUSTED EBITDA 1 NM - Not meaningful 2 Adjusted EBITDA is a non - GAAP measure. See appendix for the definition. 3 Due to changes in the composition of certain business and the Company’s internal management and reporting structure during 20 19, reportable segment results for the 2018 periods presented have been recast to reflect the reclassification of certain businesses between segments.The changes were as follows: 1) Doner , previously within the Global Integrated Agencies category is now aggregated into the Domestic Creative Agencies reportable segment, 2) Yes and Co, previously within the Media Services category, was included within the D ome stic Creative Agencies reportable segment, and 3) HL Design and Redscout , previously within Specialist Communications and All Other category, respectively are included in Yes & Company. Note: Actuals may not foot due to rounding. YTD 2019 Adjusted EBITDA excluded $1.5 million of costs related to the Company's strategic review process and $6.7 million related to corporate severance. (US$ in millions, except percentages) Three Months Ended June 30, Six Months Ended June 30, 2019 2018 % Change 2019 2018 % Change Advertising and Communications Group $ 55.0 $ 54.8 0.4 % $ 81.1 $ 72.7 11.6 % Global Integrated Agencies 28.2 23.0 22.6 % 34.8 20.7 68.1 % Domestic Creative Agencies 10.6 8.7 21.8 % 17.2 13.5 27.4 % Specialist Communications 8.2 7.5 9.3 % 14.1 12.9 9.3 % Media Services 1.2 (0.9 ) NM 0.7 (0.1 ) NM All Other 6.9 16.5 (58.2 ) % 14.3 25.8 (44.6 ) % Corporate Group (8.6 ) (11.8 ) (27.1 ) % (13.1 ) (22.0 ) (40.5 ) % Adjusted EBITDA (2) $ 46.4 $ 43.0 7.9 % $ 67.9 $ 50.8 33.7 % margin 12.8 % 11.3 % 9.8 % 7.2 %
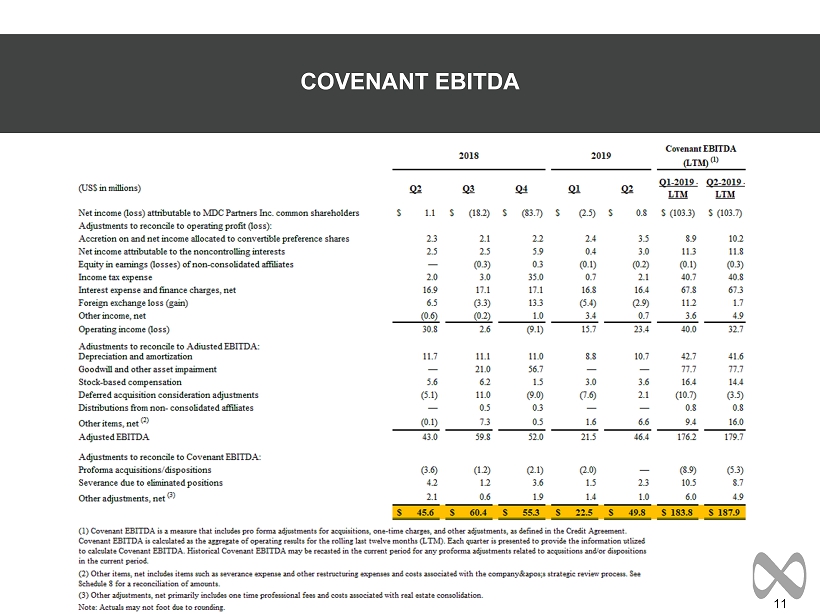
11 COVENANT EBITDA
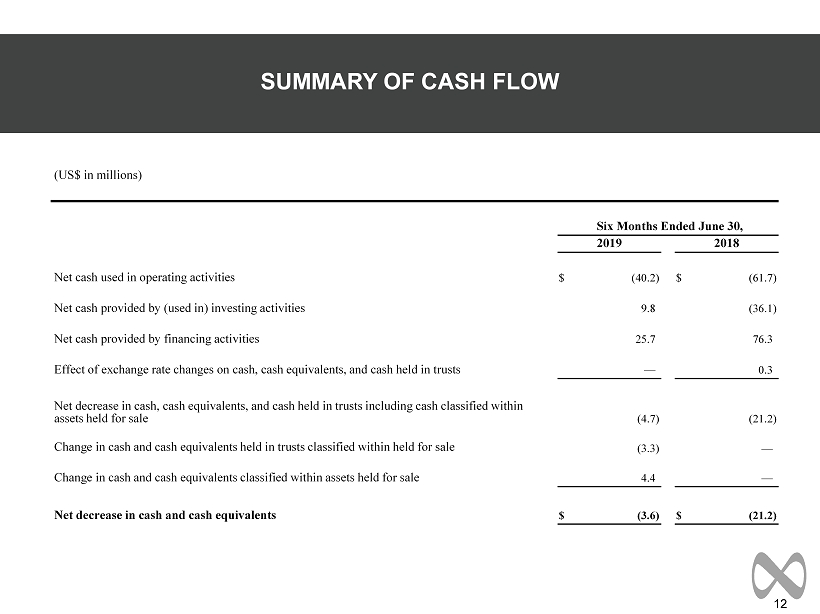
12 SUMMARY OF CASH FLOW (US$ in millions) Six Months Ended June 30, 2019 2018 Net cash used in operating activities $ (40.2 ) $ (61.7 ) Net cash provided by (used in) investing activities 9.8 (36.1 ) Net cash provided by financing activities 25.7 76.3 Effect of exchange rate changes on cash, cash equivalents, and cash held in trusts — 0.3 Net decrease in cash, cash equivalents, and cash held in trusts including cash classified within assets held for sale (4.7 ) (21.2 ) Change in cash and cash equivalents held in trusts classified within held for sale (3.3 ) — Change in cash and cash equivalents classified within assets held for sale 4.4 — Net decrease in cash and cash equivalents $ (3.6 ) $ (21.2 )
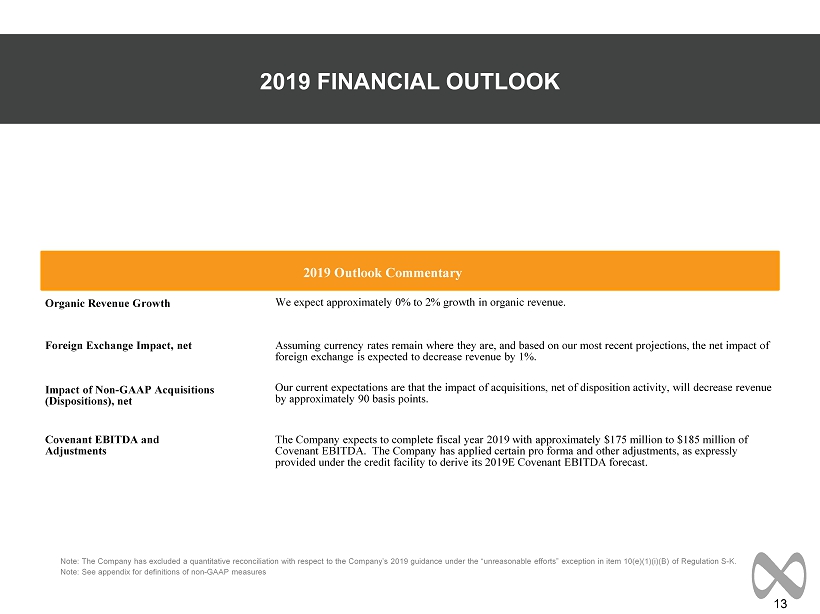
13 2019 FINANCIAL OUTLOOK Note: The Company has excluded a quantitative reconciliation with respect to the Company’s 2019 guidance under the “unreasona ble efforts” exception in item 10(e)(1)(i)(B) of Regulation S - K. Note: See appendix for definitions of non - GAAP measures 2019 Outlook Commentary Organic Revenue Growth We expect approximately 0% to 2% growth in organic revenue. Foreign Exchange Impact, net Assuming currency rates remain where they are, and based on our most recent projections, the net impact of foreign exchange is expected to decrease revenue by 1%. Impact of Non - GAAP Acquisitions (Dispositions), net Our current expectations are that the impact of acquisitions, net of disposition activity, will decrease revenue by approximately 90 basis points. Covenant EBITDA and Adjustments The Company expects to complete fiscal year 2019 with approximately $175 million to $185 million of Covenant EBITDA. The Company has applied certain pro forma and other adjustments, as expressly provided under the credit facility to derive its 2019E Covenant EBITDA forecast.

14 APPENDIX
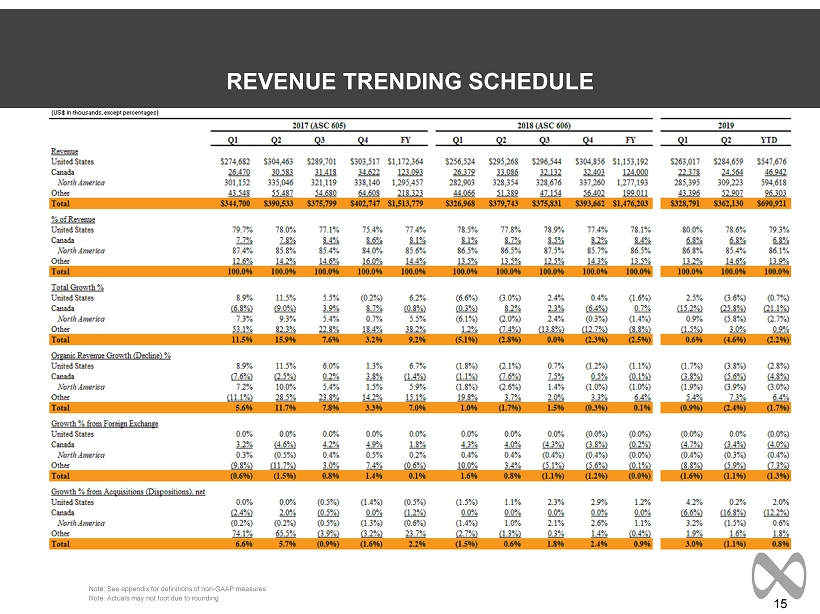
15 REVENUE TRENDING SCHEDULE Note: See appendix for definitions of non - GAAP measures Note: Actuals may not foot due to rounding
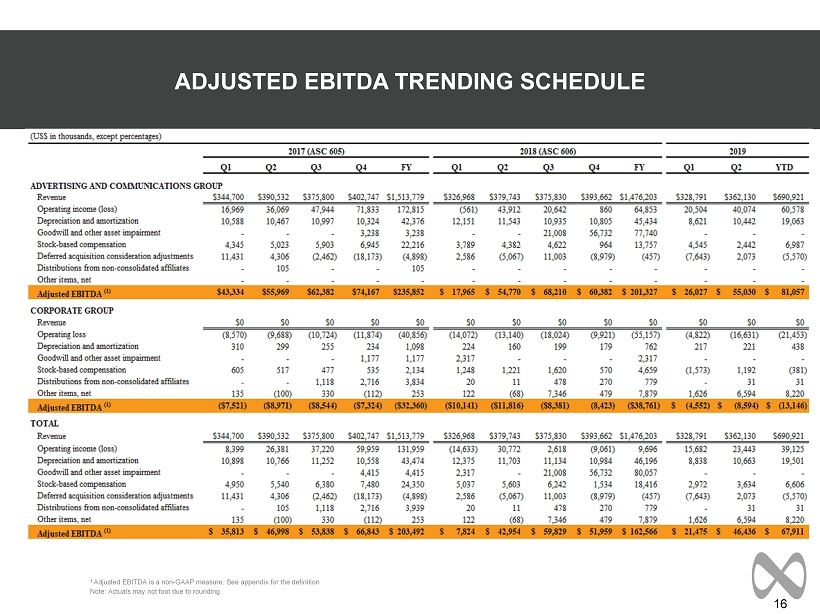
16 ADJUSTED EBITDA TRENDING SCHEDULE 1 Adjusted EBITDA is a non - GAAP measure. See appendix for the definition Note: Actuals may not foot due to rounding
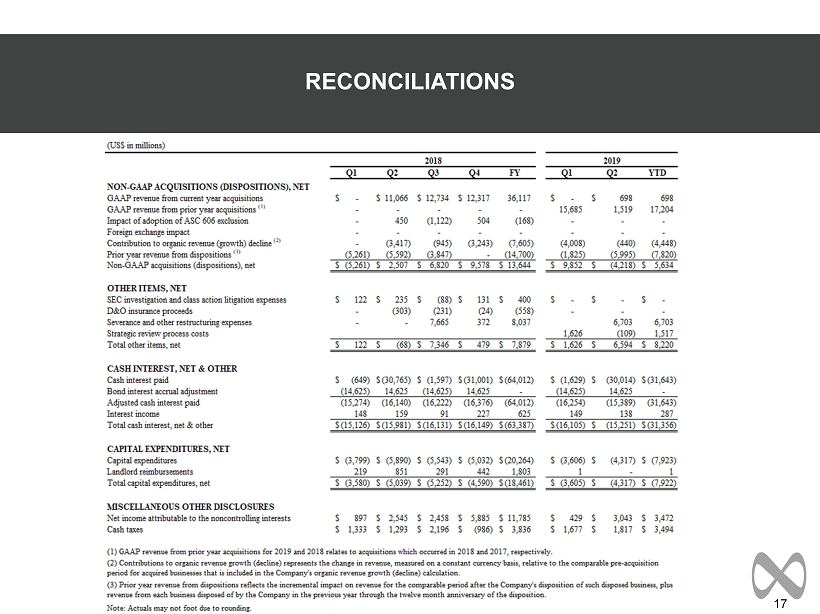
17 RECONCILIATIONS
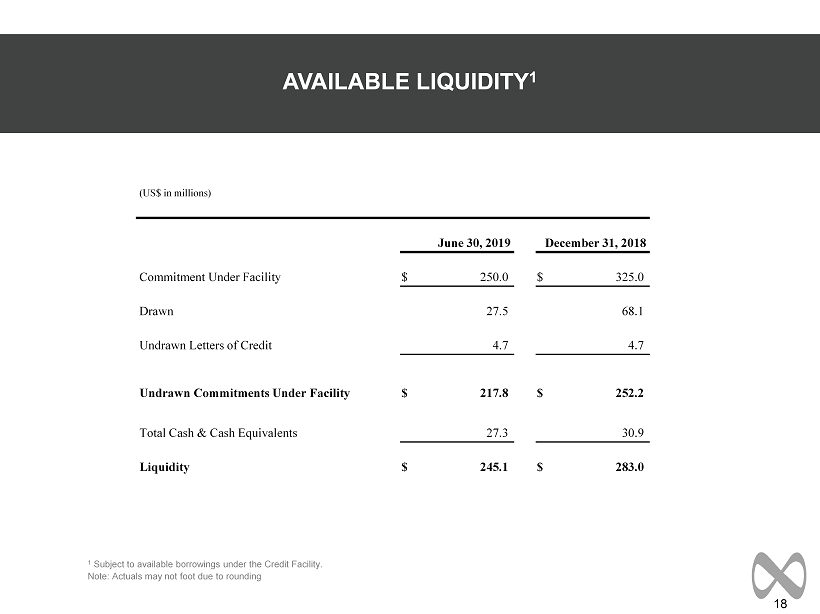
18 AVAILABLE LIQUIDITY 1 1 Subject to available borrowings under the Credit Facility. Note: Actuals may not foot due to rounding (US$ in millions) June 30, 2019 December 31, 2018 Commitment Under Facility $ 250.0 $ 325.0 Drawn 27.5 68.1 Undrawn Letters of Credit 4.7 4.7 Undrawn Commitments Under Facility $ 217.8 $ 252.2 Total Cash & Cash Equivalents 27.3 30.9 Liquidity $ 245.1 $ 283.0
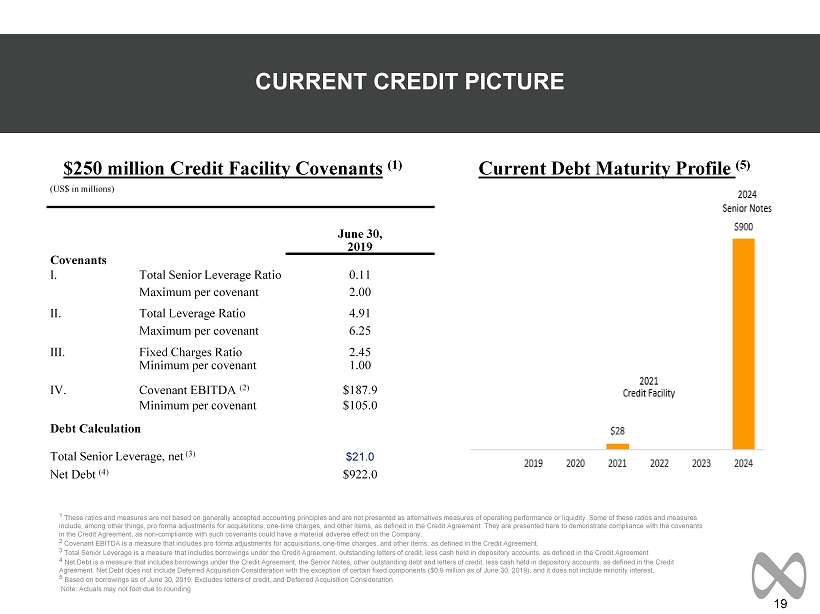
19 CURRENT CREDIT PICTURE 1 These ratios and measures are not based on generally accepted accounting principles and are not presented as alternatives mea sur es of operating performance or liquidity. Some of these ratios and measures include, among other things, pro forma adjustments for acquisitions, one - time charges, and other items, as defined in the Credit Agreement. They are presented here to demonstrate compliance with the covenants in the Credit Agreement, as non - compliance with such covenants could have a material adverse effect on the Company. 2 Covenant EBITDA is a measure that includes pro forma adjustments for acquisitions, one - time charges, and other items, as defined in the Credit Agreement. 3 Total Senior Leverage is a measure that includes borrowings under the Credit Agreement, outstanding letters of credit, less c ash held in depository accounts, as defined in the Credit Agreement 4 Net Debt is a measure that includes borrowings under the Credit Agreement, the Senior Notes, other outstanding debt and lette rs of credit, less cash held in depository accounts, as defined in the Credit Agreement. Net Debt does not include Deferred Acquisition Consideration with the exception of certain fixed components ($0.9 mil lion as of June 30, 2019), and it does not include minority interest. 5 Based on borrowings as of June 30, 2019. Excludes letters of credit, and Deferred Acquisition Consideration .Note: Actuals may not foot due to rounding Current Debt Maturity Profile (5) $250 million Credit Facility Covenants (1) (US$ in millions) June 30, 2019 Covenants I. Total Senior Leverage Ratio 0.11 Maximum per covenant 2.00 II. Total Leverage Ratio 4.91 Maximum per covenant 6.25 III. Fixed Charges Ratio 2.45 Minimum per covenant 1.00 IV. Covenant EBITDA (2) $187.9 Minimum per covenant $105.0 Debt Calculation Total Senior Leverage, net (3) $21.0 Net Debt (4) $922.0
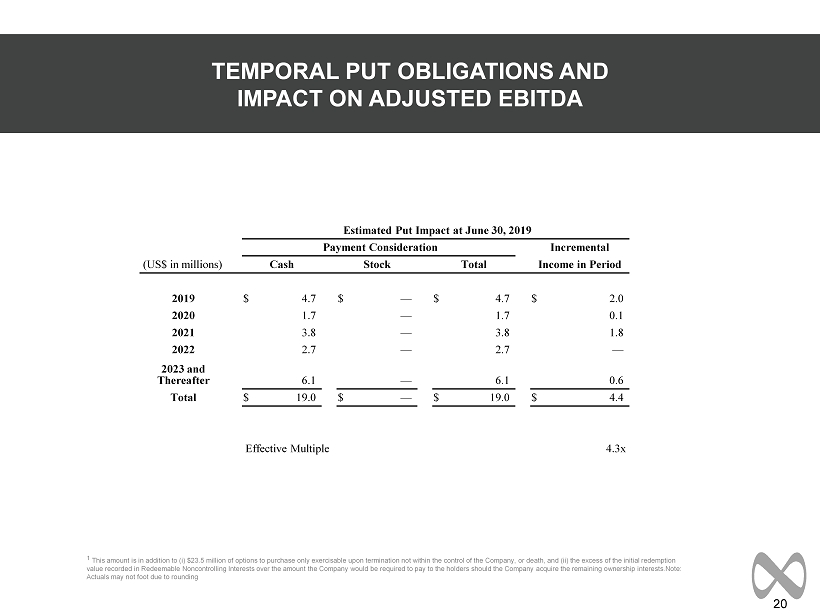
20 TEMPORAL PUT OBLIGATIONS AND IMPACT ON ADJUSTED EBITDA 1 This amount is in addition to ( i ) $23.5 million of options to purchase only exercisable upon termination not within the control of the Company, or death, and (i i) the excess of the initial redemption value recorded in Redeemable Noncontrolling Interests over the amount the Company would be required to pay to the holders sho uld the Company acquire the remaining ownership interests.Note : Actuals may not foot due to rounding Estimated Put Impact at June 30, 2019 Payment Consideration Incremental (US$ in millions) Cash Stock Total Income in Period 2019 $ 4.7 $ — $ 4.7 $ 2.0 2020 1.7 — 1.7 0.1 2021 3.8 — 3.8 1.8 2022 2.7 — 2.7 — 2023 and Thereafter 6.1 — 6.1 0.6 Total $ 19.0 $ — $ 19.0 $ 4.4 Effective Multiple 4.3x
21 DEFINITION OF NON - GAAP MEASURES In addition to its reported results, MDC Partners has included in its earnings release and supplemental management presentati on certain financial results that the Securities and Exchange Commission defines as "non - GAAP financial measures." Management believes that such non - GAAP financial measures, when r ead in conjunction with the Company's reported results, can provide useful supplemental information for investors analyzing period to period comparisons of the Com pan y's results. Such non - GAAP financial measures include the following: Organic Revenue: Organic Revenue: “Organic revenue growth” and “organic revenue decline” refer to the positive or negative results, respective l y, of subtracting both the foreign exchange and acquisition (disposition) components from total revenue growth. The acquisition (disposition) component is calcu lat ed by aggregating prior period revenue for any acquired businesses, less the prior period revenue of any businesses that were disposed of during the current period. The org ani c revenue growth (decline) component reflects the constant currency impact of (a) the change in revenue of the partner firms which the Company has held throughout each of the com parable periods presented, and (b) “non - GAAP acquisitions (dispositions), net”. Non - GAAP acquisitions (dispositions), net consists of (i) for acquisitions during the current year, the revenue effect from such acquisition as if the acquisition had been owned during the equivalent period in the prior year and (ii) for acquisitions during the previous year, th e revenue effect from such acquisitions as if they had been owned during that entire year (or same period as the current reportable period), taking into account their respective pre - acquis ition revenues for the applicable periods, and (iii) for dispositions, the revenue effect from such disposition as if they had been disposed of during the equivalent period in the pr ior year. Net New Business: Estimate of annualized revenue for new wins less annualized revenue for losses incurred in the period. Adjusted EBITDA: Adjusted EBITDA is a non - GAAP measure that represents operating profit (loss) plus depreciation and amortization, stock - based co mpensation, deferred acquisition consideration adjustments, distributions from non - consolidated affiliates, and other items. Covenant EBITDA: Covenant EBITDA is a measure that includes pro forma adjustments for acquisitions, one - time charges, and other items, as defined in the Credit Agreement. We believe that the presentation of Covenant EBITDA is appropriate as it eliminates the effect of certain non - cash and other items not necessarily indicative of a company’s underlying operating performance. In addition, the presentation of Covenant EBITDA provides additional information to investors about th e c alculation of, and compliance with, certain financial covenants in the Credit Agreement. Included in the Company’s earnings release and supplemental management presentation are tables reconciling MDC Partners’ repo rte d results to arrive at certain of these non - GAAP financial measures. We are unable to reconcile our projected 2019 organic revenue growth to the corresponding GAAP measure be cau se we are unable to predict the 2019 impact of foreign exchange due to the unpredictability of future changes in foreign exchange rates and because we are unable to predict th e occurrence or impact of any acquisitions, dispositions, or other potential changes. We are unable to reconcile our projected 2019 Covenant EBITDA to the corresponding GAA P measure because the amount and timing of many future charges that impact these measures (such as amortization of future acquired intangible assets, foreign exchange t ran saction gains or losses, impairment charges, provision or benefit for income taxes, and certain assumptions used in the calculation of deferred acquisition consideration) ar e variable, uncertain, or out of our control and therefore cannot be reasonably predicted without unreasonable effort, if at all. As a result, we are unable to provide reconciliations of these measures. In addition, we believe such reconciliations could imply a degree of precision that might be confusing or misleading to investors. For the same reasons, w e a re unable to address the probable significance of the unavailable information, which could have a potentially unpredictable, and potentially significant, impact on future GAAP fin anc ial results. Note: A reconciliation of non - GAAP to US GAAP reported results has been provided by the Company in the tables included in the earnings release issued on August 7, 2019.

MDC Partners Innovation Center 745 Fifth Avenue, Floor 19 New York, NY 10151 646 - 429 - 1800 www.mdc - partners.com