UNITED STATES
SECURITIES AND EXCHANGE COMMISSION
Washington, D.C. 20549
FORM N-CSR
CERTIFIED SHAREHOLDER REPORT OF REGISTERED MANAGEMENT
INVESTMENT COMPANIES
Investment Company Act file number 811-06367
Gabelli Equity Series Funds, Inc.
(Exact name of registrant as specified in charter)
One Corporate Center
Rye, New York 10580-1422
(Address of principal executive offices) (Zip code)
Bruce N. Alpert
Gabelli Funds, LLC
One Corporate Center
Rye, New York 10580-1422
(Name and address of agent for service)
Registrant’s telephone number, including area code: 1-800-422-3554
Date of fiscal year end: September 30
Date of reporting period: September 30, 2021
Form N-CSR is to be used by management investment companies to file reports with the Commission not later than 10 days after the transmission to stockholders of any report that is required to be transmitted to stockholders under Rule 30e-1 under the Investment Company Act of 1940 (17 CFR 270.30e-1). The Commission may use the information provided on Form N-CSR in its regulatory, disclosure review, inspection, and policymaking roles.
A registrant is required to disclose the information specified by Form N-CSR, and the Commission will make this information public. A registrant is not required to respond to the collection of information contained in Form N-CSR unless the Form displays a currently valid Office of Management and Budget (“OMB”) control number. Please direct comments concerning the accuracy of the information collection burden estimate and any suggestions for reducing the burden to Secretary, Securities and Exchange Commission, 450 Fifth Street, NW, Washington, DC 20549-0609. The OMB has reviewed this collection of information under the clearance requirements of 44 U.S.C. § 3507.
Item 1. Reports to Stockholders.
| (a) | The Report to Shareholders is attached herewith. |
The Gabelli Equity Income Fund
Annual Report — September 30, 2021
To Our Shareholders,
For the fiscal year ended September 30, 2021, the net asset value (NAV) total return per Class AAA Share of The Gabelli Equity Income Fund was 31.3% compared with a total return of 30.0% for the Standard & Poor’s (S&P) 500 Index. Other classes of shares are available. See page 3 for performance information for all classes.
Enclosed are the financial statements, including the schedule of investments, as of September 30, 2021.
Investment Objective and Strategy (Unaudited)
Our stock selection process is based on the investment principles of Graham and Dodd, the first investors to articulate the fundamentals of value investing. Their work provided the framework for value investing, and we contributed to this framework with the discipline of Private Market Value with a Catalyst™. This proprietary research and valuation method identifies companies whose shares are selling at a discount to intrinsic value, with an identifiable path to realizing, or surfacing, that private market value. We define private market value as the price an informed acquirer would pay for an entire enterprise. The catalyst comprises identifiable events or circumstances that might reasonably result in the narrowing of the difference between the public market price of the stock and our estimate of the private market value. This realization of value can take place gradually or suddenly, with company specific changes such as management changes or restructurings, sale of assets or of the business as a whole, or industry changes such as changes in regulation or changes in competition.
The Fund will seek to achieve its investment objective through a combination of capital appreciation and current income by investing, under normal market conditions, at least 80% of its net assets in income producing equity securities. Income producing equity securities include, for example, common stock, preferred stock, and convertible securities.
Performance Discussion (Unaudited)
During the fourth quarter of 2020 and continuing through the first quarter of 2021, investors began to look beyond COVID-19 and to anticipate more fiscal stimulus from the government. The anticipation of an infrastructure bill in the first quarter of 2021 proposed by the Biden administration provided a major catalyst for the building and construction, and the machinery sectors. Financial stocks in general also performed well in the quarter, as long term interest rates slowly moved up and the economy continued to strengthen. The first quarter was a period during which investors shifted their attention towards stocks that would benefit from an economy with strong growth, and many non-cyclical companies.
| As permitted by regulations adopted by the Securities and Exchange Commission, paper copies of the Fund’s annual and semiannual shareholder reports will no longer be sent by mail, unless you specifically request paper copies of the reports. Instead, the reports will be made available on the Fund’s website (www.gabelli.com), and you will be notified by mail each time a report is posted and provided with a website link to access the report. If you already elected to receive shareholder reports electronically, you will not be affected by this change and you need not take any action. To elect to receive all future reports on paper free of charge, please contact your financial intermediary, or, if you invest directly with the Fund, you may call 800-422-3554 or send an email request to info@gabelli.com. |
During the second quarter of 2021, the stock market continued to post healthy gains, as did (y)our portfolio. Generally speaking, growth stocks outperformed value stocks in the quarter, as the economy opened up from the various COVID-19 restrictions. Huge sums of both fiscal and monetary stimulus have been delivered to help the economy recover. Workers continued to rejoin the workforce as children returned to school, supplemental unemployment benefits expired, and vaccination rates continued to climb.
Through the third quarter of 2021, the 10 year government bond yield did not move much, growth stocks generally outperformed value stocks, and the overall markets, as measured by the S&P 500 total return, was up by less than 1%. The Federal Reserve indicated they will soon start the process of tapering their bond buying program as the economy heals and inflation becomes more of an issue. Unemployment should continue to fall over the next few months as vaccination rates climb and workers feel more comfortable returning to the workforce. We continue to focus on companies that we believe will be able to raise prices and adjust to an inflationary environment.
Among our better performing stocks for the fiscal year were PNC Financial Services Group (2.4% of net assets as of September 30, 2021), Deere & Co. (2.8%), and Bank of New York Mellon Corp. (2.7%). PNC Financial Services Group Inc. is one of the nation’s largest diversified financial services organizations. Deere & Co. is a leading global manufacturer of machinery for agricultural, construction, and forestry usage. Bank of New York Mellon Corp is a global leader in providing financial services to institutions and individuals. The company operates in more than 100 markets worldwide and strives to be the global provider of choice for investment management and investment services.
A few of our weaker performers were Newmont Corp (1.3%), Brown-Forman Corp. (2.4%), and Nissin Foods Holdings Co. LTD (0.8%). Newmont Corporation is the largest gold mining company in the world. It was founded in 1921 and has been publicly traded since 1925. Brown-Forman Corporation is a global alcohol spirits company that makes Jack Daniels whiskey and other leading spirits brands. Nissin Foods Holdings together with its subsidiaries, engages in the manufacture and sale of instant foods in Japan and internationally. Its products include the Cup Noodle and Chicken Ramen brands, as well as others.
We appreciate your confidence and trust.
2
Comparative Results
Average Annual Returns through September 30, 2021 (a)(b) (Unaudited)
Average annual returns reflect changes in share price, reinvestment of distributions, and are net of expenses.
| Since | |||||||||||||||
| Inception | |||||||||||||||
| 1 Year | 5 Year | 10 Year | 15 Year | (1/2/92) | |||||||||||
| Class AAA (GABEX) | 31.32 | % | 9.78 | % | 11.01 | % | 7.56 | % | 9.83 | % | |||||
| S&P 500 Index (c) | 30.00 | 16.90 | 16.63 | 10.37 | 10.36 | ||||||||||
| Lipper Equity Income Fund Average (c) | 28.68 | 11.49 | 12.71 | 7.71 | 8.78 | ||||||||||
| Class A (GCAEX) (d) | 31.31 | 9.78 | 11.01 | 7.56 | 9.82 | ||||||||||
| With sales charge (e) | 23.76 | 8.49 | 10.35 | 7.14 | 9.61 | ||||||||||
| Class C (GCCEX) (d) | 30.29 | 8.97 | 10.19 | 6.76 | 9.34 | ||||||||||
| With contingent deferred sales charge (f) | 29.29 | 8.97 | 10.19 | 6.76 | 9.34 | ||||||||||
| Class I (GCIEX) (d) | 31.71 | 10.06 | 11.29 | 7.81 | 9.96 | ||||||||||
| (a) | The Fund’s fiscal year ends September 30. |
| (b) | The Fund imposes a 2% redemption fee on shares sold or exchanged within seven days of purchase. |
| (c) | The S&P 500 Index is a market capitalization weighted index of 500 large capitalization stocks commonly used to represent the U.S. equity market. Inception performance is as of December 31, 1991. The Lipper Equity Income Fund Average includes the 30 largest equity funds in this category tracked by Lipper, Inc. Dividends are considered reinvested. You cannot invest directly in an index. |
| (d) | The Class AAA Share NAVs are used to calculate performance for the periods prior to the issuance of Class A Shares and Class C Shares on December 31, 2003, and Class I Shares on January 11, 2008. The actual performance of the Class A Shares, and Class C Shares would have been lower due to the additional fees and expenses associated with these classes of shares. The actual performance of the Class I Shares would have been higher due to lower expenses related to this class of shares. |
| (e) | Performance results include the effect of the maximum 5.75% sales charge at the beginning of the period. |
| (f) | Assuming payment of the 1% maximum contingent deferred sales charge imposed on redemptions made within one year of purchase. |
In the current prospectuses dated January 28, 2021, the expense ratios for Class AAA, A, C, and I Shares are 1.48%, 1.48%, 2.23%, and 1.23%, respectively. See page 13 for the expense ratios for the year ended September 30, 2021. Class AAA and Class I Shares do not have a sales charge. The maximum sales charge for Class A Shares, and Class C Shares is 5.75%, and 1.00%, respectively.
Investors should carefully consider the investment objectives, risks, charges, and expenses of the Fund before investing. The prospectuses contain information about these and other matters and should be read carefully before investing. To obtain a prospectus, please visit our website at www.gabelli.com.
Returns represent past performance and do not guarantee future results. Investment returns and the principal value of an investment will fluctuate. When shares are redeemed, they may be worth more or less than their original cost. Current performance may be lower or higher than the performance data presented. Visit www.gabelli.com for performance information as of the most recent month end.
3
COMPARISON OF CHANGE IN VALUE OF A $10,000 INVESTMENT IN
THE GABELLI EQUITY INCOME FUND (CLASS AAA SHARES) AND S&P 500 INDEX (Unaudited)
| Average Annual Total Returns* | |||
| 1 Year | 5 Year | 10 Year | |
| Class AAA | 31.32% | 9.78% | 11.01% |
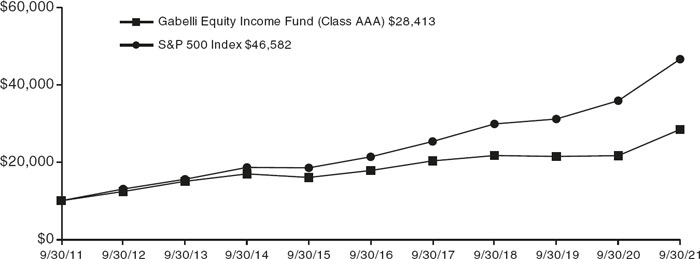
* Past performance is not predictive of future results. The performance tables and graph do not reflect the deduction of taxes that a shareholder would pay on Fund distributions or the redemption of Fund shares.
4
| The Gabelli Equity Income Fund | |
| Disclosure of Fund Expenses (Unaudited) | |
| For the Six Month Period from April 1, 2021 through September 30, 2021 | Expense Table |
We believe it is important for you to understand the impact of fees and expenses regarding your investment. All mutual funds have operating expenses. As a shareholder of a fund, you incur ongoing costs, which include costs for portfolio management, administrative services, and shareholder reports (like this one), among others. Operating expenses, which are deducted from a fund’s gross income, directly reduce the investment return of a fund. When a fund’s expenses are expressed as a percentage of its average net assets, this figure is known as the expense ratio. The following examples are intended to help you understand the ongoing costs (in dollars) of investing in your Fund and to compare these costs with those of other mutual funds. The examples are based on an investment of $1,000 made at the beginning of the period shown and held for the entire period.
The Expense Table below illustrates your Fund’s costs in two ways:
Actual Fund Return: This section provides information about actual account values and actual expenses. You may use this section to help you to estimate the actual expenses that you paid over the period after any fee waivers and expense reimbursements. The “Ending Account Value” shown is derived from the Fund’s actual return during the past six months, and the “Expenses Paid During Period” shows the dollar amount that would have been paid by an investor who started with $1,000 in the Fund. You may use this information, together with the amount you invested, to estimate the expenses that you paid over the period.
To do so, simply divide your account value by $1,000 (for example, an $8,600 account value divided by $1,000 = 8.6), then multiply the result by the number given for your Fund under the heading “Expenses Paid During Period” to estimate the expenses you paid during this period.
Hypothetical 5% Return: This section provides information about hypothetical account values and hypothetical expenses based on the Fund’s actual expense ratio. It assumes a hypothetical annualized return of 5% before expenses during the period shown. In this case – because the hypothetical return used is not the Fund’s actual return – the results do not apply to your investment and you cannot use the hypothetical account value and expense to estimate the actual ending account balance or expenses you
paid for the period. This example is useful in making comparisons of the ongoing costs of investing in the Fund and other funds. To do so, compare this 5% hypothetical example with the 5% hypothetical examples that appear in shareholder reports of other funds.
Please note that the expenses shown in the table are meant to highlight your ongoing costs only and do not reflect any transactional costs such as sales charges (loads), redemption fees, or exchange fees, if any, which are described in the Prospectus. If these costs were applied to your account, your costs would be higher. Therefore, the 5% hypothetical return is useful in comparing ongoing costs only, and will not help you determine the relative total costs of owning different funds. The “Annualized Expense Ratio” represents the actual expenses for the last six months and may be different from the expense ratio in the Financial Highlights which is for the fiscal year ended September 30, 2021.
| Beginning Account Value 04/01/21 | Ending Account Value 09/30/21 | Annualized Expense Ratio | Expenses Paid During Period* | |||||||||||
| The Gabelli Equity Income Fund | ||||||||||||||
| Actual Fund Return | ||||||||||||||
| Class AAA | $1,000.00 | $1,053.00 | 1.40 | % | $ | 7.21 | ||||||||
| Class A | $1,000.00 | $1,052.90 | 1.40 | % | $ | 7.20 | ||||||||
| Class C | $1,000.00 | $1,050.00 | 2.15 | % | $ | 11.05 | ||||||||
| Class I | $1,000.00 | $1,054.10 | 1.15 | % | $ | 5.92 | ||||||||
| Hypothetical 5% Return | ||||||||||||||
| Class AAA | $1,000.00 | $1,018.05 | 1.40 | % | $ | 7.08 | ||||||||
| Class A | $1,000.00 | $1,018.05 | 1.40 | % | $ | 7.08 | ||||||||
| Class C | $1,000.00 | $1,014.29 | 2.15 | % | $ | 10.86 | ||||||||
| Class I | $1,000.00 | $1,019.30 | 1.15 | % | $ | 5.82 | ||||||||
| * | Expenses are equal to the Fund’s annualized expense ratio for the last six months multiplied by the average account value over the period, multiplied by the number of days in the most recent fiscal half year (183 days), then divided by 365. |
5
Summary of Portfolio Holdings (Unaudited)
The following table presents portfolio holdings as a percent of net assets as of September 30, 2021:
The Gabelli Equity Income Fund
| Food and Beverage | 17.1 | % | ||
| Financial Services | 16.4 | % | ||
| Consumer Products | 7.5 | % | ||
| Diversified Industrial | 5.3 | % | ||
| Retail | 5.2 | % | ||
| Health Care | 4.8 | % | ||
| Equipment and Supplies | 4.4 | % | ||
| Telecommunications | 4.3 | % | ||
| Automotive: Parts and Accessories | 4.3 | % | ||
| Business Services | 4.2 | % | ||
| Machinery | 3.4 | % | ||
| Building and Construction | 2.3 | % | ||
| Entertainment | 2.3 | % | ||
| Electronics | 2.3 | % | ||
| Energy and Utilities: Oil | 2.2 | % | ||
| Computer Software and Services | 2.2 | % | ||
| Metals and Mining | 1.8 | % | ||
| Energy and Utilities: Natural Gas | 1.8 | % | ||
| Computer Hardware | 1.8 | % | ||
| Transportation | 1.5 | % | ||
| Specialty Chemicals | 1.1 | % |
| Cable and Satellite | 1.0 | % | ||
| Agriculture | 0.6 | % | ||
| Aerospace | 0.6 | % | ||
| Real Estate Investment Trusts | 0.6 | % | ||
| Energy and Utilities: Integrated | 0.5 | % | ||
| Energy and Utilities: Electric | 0.4 | % | ||
| Energy and Utilities: Services | 0.3 | % | ||
| Broadcasting | 0.3 | % | ||
| Communications Equipment | 0.3 | % | ||
| Environmental Services | 0.3 | % | ||
| Hotels and Gaming | 0.2 | % | ||
| Energy and Utilities: Water | 0.2 | % | ||
| Automotive | 0.1 | % | ||
| Consumer Services | 0.1 | % | ||
| Paper and Forest Products | 0.1 | % | ||
| Wireless Communications | 0.0 | %* | ||
| Publishing | 0.0 | %* | ||
| Other Assets and Liabilities (Net) | (1.8 | )% | ||
| 100.0 | % | |||
| * | Amount represents less than 0.05%. |
The Fund files a complete schedule of portfolio holdings with the Securities and Exchange Commission (the SEC) for the first and third quarters of each fiscal year on Form N-PORT. Shareholders may obtain this information www.gabelli.com or by calling the Fund at 800-GABELLI (800-422-3554). The Fund’s Form N-PORT is available on the SEC’s website at www.sec.gov and may also be reviewed and copied at the SEC’s Public Reference Room in Washington, DC. Information on the operation of the Public Reference Room may be obtained by calling 800-SEC-0330.
Proxy Voting
The Fund files Form N-PX with its complete proxy voting record for the twelve months ended June 30, no later than August 31 of each year. A description of the Fund’s proxy voting policies, procedures, and how the Fund voted proxies relating to portfolio securities is available without charge, upon request, by (i) calling 800-GABELLI (800-422-3554); (ii) writing to The Gabelli Funds at One Corporate Center, Rye, NY 10580-1422; or (iii) visiting the SEC’s website at www.sec.gov.
6
The Gabelli Equity Income Fund
Schedule of Investments — September 30, 2021
| Shares | Cost | Market Value | ||||||||||
| COMMON STOCKS — 101.8% | ||||||||||||
| Aerospace — 0.6% | ||||||||||||
| 2,000 | Lockheed Martin Corp. | $ | 47,350 | $ | 690,200 | |||||||
| 9,500 | Rockwell Automation Inc. | 285,402 | 2,793,380 | |||||||||
| 332,752 | 3,483,580 | |||||||||||
| Agriculture — 0.6% | ||||||||||||
| 53,000 | Archer-Daniels-Midland Co. | 1,360,884 | 3,180,530 | |||||||||
| 12,000 | The Mosaic Co. | 186,246 | 428,640 | |||||||||
| 1,547,130 | 3,609,170 | |||||||||||
| Automotive — 0.1% | ||||||||||||
| 10,000 | PACCAR Inc. | 386,268 | 789,200 | |||||||||
| Automotive: Parts and Accessories — 4.3% | ||||||||||||
| 76,000 | Dana Inc. | 1,193,901 | 1,690,240 | |||||||||
| 190,000 | Genuine Parts Co.(a) | 8,436,489 | 23,033,700 | |||||||||
| 9,630,390 | 24,723,940 | |||||||||||
| Broadcasting — 0.3% | ||||||||||||
| 45,000 | Liberty Global plc, Cl. A† | 1,033,770 | 1,341,000 | |||||||||
| 10,000 | Liberty Global plc, Cl. C† | 216,949 | 294,600 | |||||||||
| 1,250,719 | 1,635,600 | |||||||||||
| Building and Construction — 2.3% | ||||||||||||
| 30,000 | Carrier Global Corp. | 254,819 | 1,552,800 | |||||||||
| 44,000 | Fortune Brands Home & | |||||||||||
| Security Inc. | 437,065 | 3,934,480 | ||||||||||
| 29,000 | Herc Holdings Inc.† | 898,435 | 4,740,340 | |||||||||
| 48,000 | Johnson Controls | |||||||||||
| International plc | 856,545 | 3,267,840 | ||||||||||
| 2,446,864 | 13,495,460 | |||||||||||
| Business Services — 4.2% | ||||||||||||
| 12,500 | Automatic Data Processing Inc. | 579,141 | 2,499,000 | |||||||||
| 31,300 | Mastercard Inc., Cl. A | 548,831 | 10,882,384 | |||||||||
| 2,400 | MSC Industrial Direct Co. Inc., Cl. A | 165,490 | 192,456 | |||||||||
| 32,000 | Pentair plc | 622,795 | 2,324,160 | |||||||||
| 20,000 | S&P Global Inc. | 862,027 | 8,497,800 | |||||||||
| 2,778,284 | 24,395,800 | |||||||||||
| Cable and Satellite — 1.0% | ||||||||||||
| 129,000 | DISH Network Corp., Cl. A† | 2,343,606 | 5,606,340 | |||||||||
| 16,000 | EchoStar Corp., Cl. A† | 389,202 | 408,160 | |||||||||
| 2,732,808 | 6,014,500 | |||||||||||
| Communications Equipment — 0.3% | ||||||||||||
| 42,000 | Corning Inc. | 481,575 | 1,532,580 | |||||||||
| Computer Hardware — 1.8% | ||||||||||||
| 47,500 | Apple Inc. | 869,729 | 6,721,250 | |||||||||
| 25,000 | International Business Machines Corp. | 2,042,464 | 3,473,250 | |||||||||
| 2,912,193 | 10,194,500 | |||||||||||
| Shares | Cost | Market Value | ||||||||||
| Computer Software and Services — 2.2% | ||||||||||||
| 95,000 | Hewlett Packard Enterprise Co. | $ | 543,304 | $ | 1,353,750 | |||||||
| 41,000 | Microsoft Corp. | 1,145,540 | 11,558,720 | |||||||||
| 1,688,844 | 12,912,470 | |||||||||||
| Consumer Products — 7.5% | ||||||||||||
| 11,000 | Altria Group Inc. | 92,672 | 500,720 | |||||||||
| 6,000 | Edgewell Personal Care Co. | 182,805 | 217,800 | |||||||||
| 48,000 | Energizer Holdings Inc. | 1,205,437 | 1,874,400 | |||||||||
| 30,000 | Essity AB, Cl. A | 529,907 | 928,676 | |||||||||
| 1,000 | National Presto Industries Inc. | 30,628 | 82,080 | |||||||||
| 34,500 | Reckitt Benckiser Group plc | 1,023,563 | 2,710,093 | |||||||||
| 3,975,000 | Swedish Match AB | 4,981,348 | 34,808,039 | |||||||||
| 42,000 | Unilever plc, ADR | 838,099 | 2,277,240 | |||||||||
| 8,884,459 | 43,399,048 | |||||||||||
| Consumer Services — 0.1% | ||||||||||||
| 1,600 | Allegion plc | 19,252 | 211,488 | |||||||||
| 15,000 | Rollins Inc. | 14,913 | 529,950 | |||||||||
| 34,165 | 741,438 | |||||||||||
| Diversified Industrial — 5.3% | ||||||||||||
| 78,000 | Crane Co | 2,384,873 | 7,395,180 | |||||||||
| 36,000 | Eaton Corp. plc | 1,330,537 | 5,375,160 | |||||||||
| 1,500 | Honeywell International Inc. | 32,160 | 318,420 | |||||||||
| 8,824 | Ingersoll Rand Inc.† | 46,675 | 444,818 | |||||||||
| 48,000 | ITT Inc. | 961,318 | 4,120,320 | |||||||||
| 31,000 | Jardine Matheson Holdings Ltd. | 1,528,820 | 1,644,240 | |||||||||
| 22,000 | nVent Electric plc | 230,823 | 711,260 | |||||||||
| 108,000 | Textron Inc. | 841,688 | 7,539,480 | |||||||||
| 154,000 | Toray Industries Inc. | 1,030,504 | 991,013 | |||||||||
| 9,500 | Trane Technologies plc | 155,306 | 1,640,175 | |||||||||
| 23,000 | Trinity Industries Inc. | 302,107 | 624,910 | |||||||||
| 8,844,811 | 30,804,976 | |||||||||||
| Electronics — 2.3% | ||||||||||||
| 10,000 | Sony Group Corp. | 269,547 | 1,119,098 | |||||||||
| 32,000 | Sony Group Corp., ADR | 724,495 | 3,538,560 | |||||||||
| 49,000 | TE Connectivity Ltd | 1,618,565 | 6,723,780 | |||||||||
| 10,000 | Texas Instruments Inc. | 147,000 | 1,922,100 | |||||||||
| 2,759,607 | 13,303,538 | |||||||||||
| Energy and Utilities: Electric — 0.4% | ||||||||||||
| 7,500 | Avangrid Inc. | 210,171 | 364,500 | |||||||||
| 20,000 | Korea Electric Power Corp., ADR | 236,921 | 197,400 | |||||||||
| 8,000 | Portland General Electric Co. | 334,816 | 375,920 | |||||||||
| 63,000 | The AES Corp. | 291,918 | 1,438,290 | |||||||||
| 1,073,826 | 2,376,110 | |||||||||||
See accompanying notes to financial statements.
7
The Gabelli Equity Income Fund
Schedule of Investments (Continued) — September 30, 2021
| Shares | Cost | Market Value | ||||||||||
| COMMON STOCKS (Continued) | ||||||||||||
| Energy and Utilities: Integrated — 0.5% | ||||||||||||
| 50,000 | Energy Transfer LP | $ | 51,674 | $ | 479,000 | |||||||
| 21,000 | Eni SpA | 220,487 | 280,860 | |||||||||
| 6,500 | Iberdrola SA, ADR | 98,020 | 261,560 | |||||||||
| 57,000 | OGE Energy Corp. | 760,843 | 1,878,720 | |||||||||
| 1,131,024 | 2,900,140 | |||||||||||
| Energy and Utilities: Natural Gas — 1.8% | ||||||||||||
| 108,000 | National Fuel Gas Co. | 4,793,408 | 5,672,160 | |||||||||
| 11,500 | ONE Gas Inc. | 48,202 | 728,755 | |||||||||
| 60,000 | ONEOK Inc. | 30,168 | 3,479,400 | |||||||||
| 7,500 | Southwest Gas Holdings Inc. | 153,948 | 501,600 | |||||||||
| 5,025,726 | 10,381,915 | |||||||||||
| Energy and Utilities: Oil — 2.2% | ||||||||||||
| 50,000 | Chevron Corp. | 1,865,111 | 5,072,500 | |||||||||
| 5,000 | ConocoPhillips | 91,664 | 338,850 | |||||||||
| 7,747 | Devon Energy Corp. | 78,701 | 275,096 | |||||||||
| 12,000 | Exxon Mobil Corp. | 312,521 | 705,840 | |||||||||
| 60,000 | Hess Corp. | 2,882,174 | 4,686,600 | |||||||||
| 18,000 | Marathon Petroleum Corp. | 234,717 | 1,112,580 | |||||||||
| 15,000 | TotalEnergies SE, ADR | 252,772 | 718,950 | |||||||||
| 5,717,660 | 12,910,416 | |||||||||||
| Energy and Utilities: Services — 0.3% | ||||||||||||
| 80,000 | Halliburton Co. | 1,424,821 | 1,729,600 | |||||||||
| 8,000 | Schlumberger NV | 161,590 | 237,120 | |||||||||
| 1,586,411 | 1,966,720 | |||||||||||
| Energy and Utilities: Water — 0.2% | ||||||||||||
| 5,000 | Essential Utilities Inc. | 36,851 | 230,400 | |||||||||
| 20,000 | Severn Trent plc | 504,721 | 701,726 | |||||||||
| 541,572 | 932,126 | |||||||||||
| Entertainment — 2.3% | ||||||||||||
| 30,200 | Grupo Televisa SAB, ADR | 281,406 | 331,596 | |||||||||
| 6,934 | Madison Square Garden | |||||||||||
| Entertainment Corp.† | 145,283 | 503,894 | ||||||||||
| 2,500 | Madison Square Garden | |||||||||||
| Sports Corp.† | 301,304 | 464,875 | ||||||||||
| 287,800 | ViacomCBS Inc., Cl. A | 6,885,351 | 12,107,746 | |||||||||
| 7,613,344 | 13,408,111 | |||||||||||
| Environmental Services — 0.3% | ||||||||||||
| 9,500 | Republic Services Inc. | 352,210 | 1,140,570 | |||||||||
| 2,500 | Waste Management Inc. | 72,277 | 373,400 | |||||||||
| 424,487 | 1,513,970 | |||||||||||
| Equipment and Supplies — 4.4% | ||||||||||||
| 8,500 | A.O. Smith Corp. | 22,649 | 519,095 | |||||||||
| 14,000 | Danaher Corp. | 406,841 | 4,262,160 | |||||||||
| 158,000 | Flowserve Corp. | 1,981,245 | 5,477,860 | |||||||||
| 51,000 | Graco Inc. | 869,009 | 3,568,470 | |||||||||
| Shares | Cost | Market Value | ||||||||||
| 18,500 | Minerals Technologies Inc. | $ | 703,572 | $ | 1,292,040 | |||||||
| 153,500 | Mueller Industries Inc. | 2,896,761 | 6,308,850 | |||||||||
| 15,200 | Parker-Hannifin Corp. | 814,541 | 4,250,224 | |||||||||
| 7,694,618 | 25,678,699 | |||||||||||
| Financial Services — 16.4% | ||||||||||||
| 2,600 | Alleghany Corp.† | 384,777 | 1,623,466 | |||||||||
| 20,000 | AllianceBernstein Holding LP | 64,014 | 991,600 | |||||||||
| 26,000 | American Express Co.(a) | 391,403 | 4,355,780 | |||||||||
| 20,000 | Ameris Bancorp | 211,974 | 1,037,600 | |||||||||
| 6,000 | Argo Group International Holdings Ltd. | 110,474 | 313,320 | |||||||||
| 5,195 | Banco Santander Chile, ADR | 29,250 | 102,705 | |||||||||
| 130,000 | Bank of America Corp. | 851,958 | 5,518,500 | |||||||||
| 12,500 | BNP Paribas SA | 534,851 | 802,736 | |||||||||
| 42,000 | Interactive Brokers Group Inc., Cl. A | 625,837 | 2,618,280 | |||||||||
| 15,000 | Jefferies Financial Group Inc. | 263,160 | 556,950 | |||||||||
| 11,000 | JPMorgan Chase & Co. | 213,462 | 1,800,590 | |||||||||
| 53,500 | Julius Baer Group Ltd. | 1,730,852 | 3,577,574 | |||||||||
| 22,500 | Kinnevik AB, Cl. A† | 539,836 | 884,127 | |||||||||
| 70,000 | Loews Corp. | 2,616,598 | 3,775,100 | |||||||||
| 13,000 | M&T Bank Corp. | 1,111,523 | 1,941,420 | |||||||||
| 21,500 | Marsh & McLennan Companies Inc. | 601,590 | 3,255,745 | |||||||||
| 12,000 | Morgan Stanley | 549,368 | 1,167,720 | |||||||||
| 8,500 | Popular Inc. | 148,460 | 660,195 | |||||||||
| 64,000 | SLM Corp. | 311,552 | 1,126,400 | |||||||||
| 123,000 | State Street Corp. | 5,611,126 | 10,420,560 | |||||||||
| 265,000 | Sterling Bancorp | 2,828,809 | 6,614,400 | |||||||||
| 6,000 | T. Rowe Price Group Inc. | 122,374 | 1,180,200 | |||||||||
| 300,000 | The Bank of New York Mellon Corp.(a) | 7,545,388 | 15,552,000 | |||||||||
| 15,400 | The Goldman Sachs Group Inc. | 1,927,790 | 5,821,662 | |||||||||
| 70,000 | The PNC Financial Services Group Inc.(a) | 3,776,241 | 13,694,800 | |||||||||
| 53,000 | Valley National Bancorp | 331,250 | 705,430 | |||||||||
| 118,000 | Wells Fargo & Co. | 3,333,128 | 5,476,380 | |||||||||
| 36,767,045 | 95,575,240 | |||||||||||
| Food and Beverage — 17.1% | ||||||||||||
| 1,000 | Anheuser-Busch InBev SA/ NV | 15,876 | 56,927 | |||||||||
| 218,500 | Brown-Forman Corp., Cl. A | 3,676,201 | 13,693,395 | |||||||||
| 34,000 | Campbell Soup Co. | 1,061,533 | 1,421,540 | |||||||||
| 19,000 | Coca-Cola Europacific Partners plc | 427,500 | 1,050,510 | |||||||||
| 10,000 | Coca-Cola Femsa SAB de CV, ADR | 340,563 | 562,700 | |||||||||
See accompanying notes to financial statements.
8
The Gabelli Equity Income Fund
Schedule of Investments (Continued) — September 30, 2021
| Shares | Cost | Market Value | ||||||||||
| COMMON STOCKS (Continued) | ||||||||||||
| Food and Beverage (Continued) | ||||||||||||
| 6,000 | Constellation Brands Inc., Cl. A | $ | 74,420 | $ | 1,264,140 | |||||||
| 38,000 | Danone SA | 1,509,959 | 2,599,221 | |||||||||
| 55,000 | Davide Campari-Milano NV | 184,844 | 775,979 | |||||||||
| 49,500 | Diageo plc, ADR | 3,063,927 | 9,553,500 | |||||||||
| 85,000 | Fomento Economico Mexicano SAB de CV, ADR | 2,040,249 | 7,371,200 | |||||||||
| 1,000 | General Mills Inc. | 26,640 | 59,820 | |||||||||
| 1,750,000 | Grupo Bimbo SAB de CV, Cl. A | 1,402,299 | 4,918,126 | |||||||||
| 93,000 | Heineken NV | 4,417,436 | 9,716,935 | |||||||||
| 134,000 | ITO EN Ltd. | 2,393,108 | 8,933,735 | |||||||||
| 21,000 | Kellogg Co. | 1,088,475 | 1,342,320 | |||||||||
| 4,000 | McCormick & Co. Inc. | 137,120 | 329,520 | |||||||||
| 31,500 | McCormick & Co. Inc., Non-Voting | 680,896 | 2,552,445 | |||||||||
| 37,000 | Mondelez International Inc., Cl. A | 666,521 | 2,152,660 | |||||||||
| 34,000 | Nestlé SA | 696,743 | 4,111,594 | |||||||||
| 55,000 | Nissin Foods Holdings Co. Ltd. | 1,691,974 | 4,427,872 | |||||||||
| 34,000 | PepsiCo Inc. | 2,284,715 | 5,113,940 | |||||||||
| 25,000 | Pernod Ricard SA | 2,451,708 | 5,522,434 | |||||||||
| 36,500 | Remy Cointreau SA | 1,964,105 | 7,081,862 | |||||||||
| 30,000 | Sapporo Holdings Ltd. | 664,276 | 694,101 | |||||||||
| 10,000 | The Coca-Cola Co. | 208,400 | 524,700 | |||||||||
| 1,000 | The Hershey Co. | 36,300 | 169,250 | |||||||||
| 50,000 | The Kraft Heinz Co. | 1,403,471 | 1,841,000 | |||||||||
| 32,000 | Yakult Honsha Co. Ltd. | 799,840 | 1,627,387 | |||||||||
| 35,409,099 | 99,468,813 | |||||||||||
| Health Care — 4.8% | ||||||||||||
| 5,500 | Abbott Laboratories | 126,068 | 649,715 | |||||||||
| 3,000 | AbbVie Inc. | 74,560 | 323,610 | |||||||||
| 4,000 | Alcon Inc. | 133,378 | 321,880 | |||||||||
| 75,000 | Baxter International Inc. | 1,657,103 | 6,032,250 | |||||||||
| 4,400 | Bio-Rad Laboratories Inc., Cl. A† | 432,651 | 3,282,180 | |||||||||
| 92,500 | Bristol-Myers Squibb Co. | 2,228,107 | 5,473,225 | |||||||||
| 70,000 | Demant A/S† | 677,525 | 3,528,349 | |||||||||
| 8,000 | GlaxoSmithKline plc, ADR | 327,365 | 305,680 | |||||||||
| 31,000 | Henry Schein Inc.† | 316,934 | 2,360,960 | |||||||||
| 16,000 | Merck & Co. Inc. | 283,402 | 1,201,760 | |||||||||
| 13,000 | Novartis AG, ADR | 634,024 | 1,063,140 | |||||||||
| 1,600 | Organon & Co. | 12,724 | 52,464 | |||||||||
| 20,000 | Pfizer Inc. | 320,152 | 860,200 | |||||||||
| 45,000 | Roche Holding AG, ADR | 826,666 | 2,046,150 | |||||||||
| Shares | Cost | Market Value | ||||||||||
| 2,000 | Zimmer Biomet Holdings Inc. | $ | 141,420 | $ | 292,720 | |||||||
| 8,192,079 | 27,794,283 | |||||||||||
| Hotels and Gaming — 0.2% | ||||||||||||
| 21,000 | MGM Resorts International | 253,359 | 906,150 | |||||||||
| 1,500 | Wynn Resorts Ltd.† | 71,983 | 127,125 | |||||||||
| 325,342 | 1,033,275 | |||||||||||
| Machinery — 3.4% | ||||||||||||
| 6,000 | Caterpillar Inc. | 35,181 | 1,151,820 | |||||||||
| 49,400 | Deere & Co. | 1,627,017 | 16,552,458 | |||||||||
| 10,000 | Otis Worldwide Corp. | 369,541 | 822,800 | |||||||||
| 10,500 | Xylem Inc. | 322,904 | 1,298,640 | |||||||||
| 2,354,643 | 19,825,718 | |||||||||||
| Metals and Mining — 1.8% | ||||||||||||
| 95,000 | Freeport-McMoRan Inc. | 1,096,298 | 3,090,350 | |||||||||
| 140,000 | Newmont Corp | 3,329,662 | 7,602,000 | |||||||||
| 4,425,960 | 10,692,350 | |||||||||||
| Paper and Forest Products — 0.1% | ||||||||||||
| 23,000 | Svenska Cellulosa AB SCA, Cl. A | 94,735 | 358,357 | |||||||||
| Publishing — 0.0% | ||||||||||||
| 3,000 | Value Line Inc. | 41,976 | 102,780 | |||||||||
| Real Estate Investment Trusts — 0.6% | ||||||||||||
| 9,285 | Indus Realty Trust Inc., REIT | 237,685 | 650,879 | |||||||||
| 74,000 | Weyerhaeuser Co., REIT | 1,162,915 | 2,632,180 | |||||||||
| 1,400,600 | 3,283,059 | |||||||||||
| Retail — 5.2% | ||||||||||||
| 14,000 | Cie Financiere Richemont SA, Cl. A | 470,500 | 1,463,469 | |||||||||
| 30,000 | Copart Inc.† | 264,751 | 4,161,600 | |||||||||
| 10,000 | Costco Wholesale Corp | 465,517 | 4,493,500 | |||||||||
| 92,000 | CVS Health Corp. | 3,063,886 | 7,807,120 | |||||||||
| 63,000 | Ingles Markets Inc., Cl. A | 990,190 | 4,159,890 | |||||||||
| 74,000 | Seven & i Holdings Co. Ltd. | 2,211,852 | 3,381,014 | |||||||||
| 5,000 | The Home Depot Inc. | 138,392 | 1,641,300 | |||||||||
| 60,000 | Walgreens Boots Alliance Inc. | 1,832,858 | 2,823,000 | |||||||||
| 1,000 | Walmart Inc. | 43,340 | 139,380 | |||||||||
| 4,000 | Weis Markets Inc | 120,192 | 210,200 | |||||||||
| 9,601,478 | 30,280,473 | |||||||||||
| Specialty Chemicals — 1.1% | ||||||||||||
| 3,500 | Albemarle Corp. | 34,885 | 766,395 | |||||||||
| 2,500 | Ashland Global Holdings Inc. | 58,812 | 222,800 | |||||||||
| 32,000 | Ferro Corp.† | 60,762 | 650,880 | |||||||||
| 8,000 | FMC Corp. | 161,197 | 732,480 | |||||||||
| 46,000 | H.B. Fuller Co. | 950,216 | 2,969,760 | |||||||||
See accompanying notes to financial statements.
9
The Gabelli Equity Income Fund
Schedule of Investments (Continued) — September 30, 2021
| Shares | Cost | Market Value | ||||||||||
| COMMON STOCKS (Continued) | ||||||||||||
| Specialty Chemicals (Continued) | ||||||||||||
| 2,000 | NewMarket Corp. | $ | 7,719 | $ | 677,540 | |||||||
| 600 | Quaker Chemical Corp. | 6,478 | 142,632 | |||||||||
| 1,280,069 | 6,162,487 | |||||||||||
| Telecommunications — 4.3% | ||||||||||||
| 111,000 | BCE Inc. | 2,120,135 | 5,556,660 | |||||||||
| 190,000 | Deutsche Telekom AG, ADR | 2,540,249 | 3,828,500 | |||||||||
| 17,000 | Loral Space & Communications Inc. | 482,487 | 731,170 | |||||||||
| 12,000 | Orange SA, ADR | 138,547 | 129,960 | |||||||||
| 65,000 | Telefonica SA, ADR | 274,093 | 306,150 | |||||||||
| 125,000 | Telephone and Data Systems Inc. | 3,327,060 | 2,437,500 | |||||||||
| 94,000 | TELUS Corp. | 713,431 | 2,064,240 | |||||||||
| 180,000 | Verizon Communications Inc.(a) | 6,241,326 | 9,721,800 | |||||||||
| 15,837,328 | 24,775,980 | |||||||||||
| Transportation — 1.5% | ||||||||||||
| 100,000 | GATX Corp. | 3,162,200 | 8,956,000 | |||||||||
| Wireless Communications — 0.0% | ||||||||||||
| 80,000 | BT Group plc, Cl. A† | 222,654 | 172,252 | |||||||||
| Shares | Cost | Market Value | ||||||||||
| 20,000 | Turkcell Iletisim Hizmetleri A/S, ADR | $ | 91,562 | $ | 87,000 | |||||||
| 314,216 | 259,252 | |||||||||||
| TOTAL COMMON STOCKS | 196,726,307 | 591,672,074 | ||||||||||
| WARRANTS — 0.0% | ||||||||||||
| Energy and Utilities: Oil — 0.0% | ||||||||||||
| 1,250 | Occidental Petroleum Corp., expire 08/03/27† | 6,187 | 14,812 | |||||||||
| Retail — 0.0% | ||||||||||||
| 28,000 | Cie Financiere Richemont | |||||||||||
| SA, expire 11/22/23† | 0 | 13,220 | ||||||||||
| TOTAL WARRANTS | 6,187 | 28,032 | ||||||||||
| TOTAL INVESTMENTS — 101.8% | $ | 196,732,494 | 591,700,106 | |||||||||
| Other Assets and Liabilities (Net) — (1.8)% | (10,486,690 | ) | ||||||||||
| NET ASSETS — 100.0% | $ | 581,213,416 | ||||||||||
| (a) | Securities, or a portion thereof, with a value of $34,776,100 were deposited with Pershing LLC. |
| † | Non-income producing security. |
| ADR | American Depositary Receipt |
| REIT | Real Estate Investment Trust |
See accompanying notes to financial statements.
10
The Gabelli Equity Income Fund
Statement of Assets and Liabilities
September 30, 2021
| Assets: | ||||
| Investments, at value (cost $196,732,494) | $ | 591,700,106 | ||
| Foreign currency, at value (cost $16,541) | 16,496 | |||
| Receivable for Fund shares sold | 1,186,031 | |||
| Receivable for investments sold | 141,689 | |||
| Dividends receivable | 1,522,997 | |||
| Prepaid expenses | 29,460 | |||
| Total Assets | 594,596,779 | |||
| Liabilities: | ||||
| Payable to bank | 42,978 | |||
| Line of credit payable | 11,231,000 | |||
| Payable for Fund shares redeemed | 1,152,892 | |||
| Payable for investment advisory fees | 498,945 | |||
| Payable for distribution fees | 129,145 | |||
| Payable for accounting fees | 7,500 | |||
| Other accrued expenses | 320,903 | |||
| Total Liabilities | 13,383,363 | |||
| Net Assets | ||||
| (applicable to 57,238,699 shares outstanding) | $ | 581,213,416 | ||
| Net Assets Consist of: | ||||
| Paid-in capital | $ | 190,053,532 | ||
| Total distributable earnings | 391,159,884 | |||
| Net Assets | $ | 581,213,416 | ||
| Shares of Capital Stock, each at $0.001 par value: | ||||
| Class AAA: | ||||
| Net Asset Value, offering, and redemption price per share ($297,368,990 ÷ 27,398,414 shares outstanding; 150,000,000 shares authorized) | $ | 10.85 | ||
| Class A: | ||||
| Net Asset Value and redemption price per share ($98,631,374 ÷ 9,224,750 shares outstanding; 50,000,000 shares authorized) | $ | 10.69 | ||
| Maximum offering price per share (NAV ÷ 0.9425, based on maximum sales charge of 5.75% of the offering price) | $ | 11.34 | ||
| Class C: | ||||
| Net Asset Value and offering price per share ($51,139,988 ÷ 9,759,766 shares outstanding; 50,000,000 shares authorized) | $ | 5.24 | (a) | |
| Class I: | ||||
| Net Asset Value, offering, and redemption price per share ($134,073,064 ÷ 10,855,769 shares outstanding; 50,000,000 shares authorized) | $ | 12.35 | ||
Statement of Operations
For the Year Ended September 30, 2021
| Investment Income: | ||||
| Dividends (net of foreign withholding taxes of $374,608) | $ | 12,118,304 | ||
| Interest | 684 | |||
| Total Investment Income | 12,118,988 | |||
| Expenses: | ||||
| Investment advisory fees. | 5,901,368 | |||
| Distribution fees - Class AAA | 756,581 | |||
| Distribution fees - Class A | 226,112 | |||
| Distribution fees - Class C | 559,024 | |||
| Shareholder services fees | 456,564 | |||
| Shareholder communications expenses | 118,558 | |||
| Custodian fees | 104,373 | |||
| Legal and audit fees | 74,384 | |||
| Registration expenses. | 64,547 | |||
| Accounting fees | 45,000 | |||
| Directors’ fees. | 44,215 | |||
| Interest expense | 29,337 | |||
| Miscellaneous expenses | 48,944 | |||
| Total Expenses | 8,429,007 | |||
| Less: | ||||
| Expenses paid indirectly by broker (See Note 6) | (6,091 | ) | ||
| Net Expenses | 8,422,916 | |||
| Net Investment Income | 3,696,072 | |||
| Net Realized and Unrealized Gain/(Loss) on Investments, Securities Sold Short, and Foreign | ||||
| Currency: | ||||
| Net realized gain on investments | 68,631,401 | |||
| Net realized gain on securities sold short | 291,686 | |||
| Net realized gain on foreign currency transactions | 4,039 | |||
| Net realized gain on investments, securities sold | ||||
| short, and foreign currency transactions | 68,927,126 | |||
| Net change in unrealized appreciation/depreciation: | ||||
| on investments | 82,924,736 | |||
| on foreign currency translations | (3,715 | ) | ||
| Net change in unrealized appreciation/depreciation | ||||
| on investments and foreign currency translations | 82,921,021 | |||
| Net Realized and Unrealized Gain/(Loss) on Investments, Securities Sold Short, and Foreign Currency | 151,848,147 | |||
| Net Increase in Net Assets Resulting from Operations | $ | 155,544,219 | ||
| (a) | Redemption price varies based on the length of time held. |
See accompanying notes to financial statements.
11
The Gabelli Equity Income Fund
Statement of Changes in Net Assets
| Year Ended September 30, 2021 | Year Ended September 30, 2020 | ||||||||||
| Operations: | |||||||||||
| Net investment income | $ | 3,696,072 | $ | 4,517,675 | |||||||
| Net realized gain on investments, securities sold short, and foreign currency Transactions | 68,927,126 | 137,694,507 | |||||||||
| Net change in unrealized appreciation/depreciation on investments and foreign currency translations | 82,921,021 | (141,908,799 | ) | ||||||||
| Net Increase in Net Assets Resulting from Operations | 155,544,219 | 303,383 | |||||||||
| Distributions to Shareholders: | |||||||||||
| Accumulated earnings | |||||||||||
| Class AAA | (33,908,511 | ) | (60,530,136 | ) | |||||||
| Class A | (10,265,934 | ) | (14,287,953 | ) | |||||||
| Class C | (11,014,210 | ) | (19,964,287 | ) | |||||||
| Class I | (14,518,170 | ) | (29,113,541 | ) | |||||||
| (69,706,825 | ) | (123,895,917 | ) | ||||||||
| Return of capital | |||||||||||
| Class AAA | (23,401,915 | ) | (22,602,669 | ) | |||||||
| Class A | (8,046,305 | ) | (6,706,415 | ) | |||||||
| Class C | (7,915,693 | ) | (6,207,826 | ) | |||||||
| Class I | (8,957,061 | ) | (8,566,767 | ) | |||||||
| (48,320,974 | ) | (44,083,677 | ) | ||||||||
| Total Distributions to Shareholders | (118,027,799 | ) | (167,979,594 | ) | |||||||
| Capital Share Transactions: | |||||||||||
| Class AAA | 1,047,718 | (21,606,608 | ) | ||||||||
| Class A | 25,393,934 | 16,928,786 | |||||||||
| Class C | 1,702,442 | (20,000,786 | ) | ||||||||
| Class I | (11,136,577 | ) | (40,684,434 | ) | |||||||
| Net Increase/(Decrease) in Net Assets from Capital Share Transactions | 17,007,517 | (65,363,042 | ) | ||||||||
| Redemption Fees | 215 | 1,452 | |||||||||
| Net Increase/(Decrease) in Net Assets | 54,524,152 | (233,037,801 | ) | ||||||||
| Net Assets: | |||||||||||
| Beginning of year | 526,689,264 | 759,727,065 | |||||||||
| End of year | $ | 581,213,416 | $ | 526,689,264 | |||||||
See accompanying notes to financial statements.
12
The Gabelli Equity Income Fund
Financial Highlights
Selected data for a share of Capital Stock outstanding throughout each year:
| Income (Loss) from Investment Operations | Distributions | Ratios to Average Net Assets/Supplemental Data | |||||||||||||||||||||||||||||||||||||||||||||||||||||||||||
| Year Ended September 30 | Net Asset Value, Beginning of Year | Net Investment Income (Loss)(a) | Net Realized and Unrealized Gain (Loss) on Investments | Total from Investment Operations | Net Investment Income | Net Realized Gain on Investments | Return of Capital | Total Distributions | Redemption Fees(a)(b) | Net Asset Value, End of Year | Total Return† | Net Assets, End of Year (in 000’s) | Net Investment Income (Loss) | Operating Expenses(c)(d) | Portfolio Turnover Rate | ||||||||||||||||||||||||||||||||||||||||||||||
| Class AAA | |||||||||||||||||||||||||||||||||||||||||||||||||||||||||||||
| 2021 | $ | 10.04 | $ | 0.07 | $ | 3.00 | $ | 3.07 | $ | (0.08 | ) | $ | (1.24 | ) | $ | (0.94 | ) | $ | (2.26 | ) | $ | 0.00 | $ | 10.85 | 31.32 | % | $ | 297,369 | 0.64 | % | 1.42 | % | 1 | % | |||||||||||||||||||||||||||
| 2020 | 13.61 | 0.10 | (e) | (0.02 | ) | 0.08 | (0.11 | ) | (2.39 | ) | (1.15 | ) | (3.65 | ) | 0.00 | 10.04 | 0.93 | 272,980 | 0.75 | (e) | 1.45 | 0 | (f) | ||||||||||||||||||||||||||||||||||||||
| 2019 | 19.09 | 0.13 | (0.38 | ) | (0.25 | ) | (0.15 | ) | (3.72 | ) | (1.36 | ) | (5.23 | ) | 0.00 | 13.61 | (1.09 | ) | 377,589 | 0.76 | 1.45 | 1 | |||||||||||||||||||||||||||||||||||||||
| 2018 | 22.84 | 0.19 | 1.34 | 1.53 | (0.20 | ) | (3.68 | ) | (1.40 | ) | (5.28 | ) | 0.00 | 19.09 | 6.77 | 521,485 | 0.82 | 1.40 | 0 | (f) | |||||||||||||||||||||||||||||||||||||||||
| 2017 | 24.06 | 0.24 | 2.97 | 3.21 | (0.25 | ) | (3.33 | ) | (0.85 | ) | (4.43 | ) | 0.00 | 22.84 | 13.91 | 662,696 | 0.97 | 1.39 | 1 | ||||||||||||||||||||||||||||||||||||||||||
| Class A | |||||||||||||||||||||||||||||||||||||||||||||||||||||||||||||
| 2021 | $ | 9.92 | $ | 0.08 | $ | 2.95 | $ | 3.03 | $ | (0.08 | ) | $ | (1.24 | ) | $ | (0.94 | ) | $ | (2.26 | ) | $ | 0.00 | $ | 10.69 | 31.31 | % | $ | 98,631 | 0.65 | % | 1.42 | % | 1 | % | |||||||||||||||||||||||||||
| 2020 | 13.49 | 0.10 | (e) | (0.02 | ) | 0.08 | (0.11 | ) | (2.39 | ) | (1.15 | ) | (3.65 | ) | 0.00 | 9.92 | 0.95 | 69,201 | 0.75 | (e) | 1.45 | 0 | (f) | ||||||||||||||||||||||||||||||||||||||
| 2019 | 18.97 | 0.13 | (0.38 | ) | (0.25 | ) | (0.15 | ) | (3.72 | ) | (1.36 | ) | (5.23 | ) | 0.00 | 13.49 | (1.08 | ) | 72,778 | 0.76 | 1.45 | 1 | |||||||||||||||||||||||||||||||||||||||
| 2018 | 22.73 | 0.19 | 1.33 | 1.52 | (0.20 | ) | (3.68 | ) | (1.40 | ) | (5.28 | ) | 0.00 | 18.97 | 6.76 | 86,332 | 0.82 | 1.40 | 0 | (f) | |||||||||||||||||||||||||||||||||||||||||
| 2017 | 23.96 | 0.24 | 2.96 | 3.20 | (0.25 | ) | (3.33 | ) | (0.85 | ) | (4.43 | ) | 0.00 | 22.73 | 13.92 | 115,702 | 0.96 | 1.39 | 1 | ||||||||||||||||||||||||||||||||||||||||||
| Class C | |||||||||||||||||||||||||||||||||||||||||||||||||||||||||||||
| 2021 | $ | 5.81 | $ | (0.01 | ) | $ | 1.70 | $ | 1.69 | $ | (0.05 | ) | $ | (1.24 | ) | $ | (0.97 | ) | $ | (2.26 | ) | $ | 0.00 | $ | 5.24 | 30.29 | % | $ | 51,140 | (0.12 | )% | 2.17 | % | 1 | % | ||||||||||||||||||||||||||
| 2020 | 9.48 | 0.00 | (b)(e) | (0.02 | ) | (0.02 | ) | (0.06 | ) | (2.39 | ) | (1.20 | ) | (3.65 | ) | 0.00 | 5.81 | 0.27 | 53,605 | 0.00 | (e)(g) | 2.20 | 0 | (f) | |||||||||||||||||||||||||||||||||||||
| 2019 | 15.03 | (0.00 | )(b) | (0.32 | ) | (0.32 | ) | (0.05 | ) | (3.72 | ) | (1.46 | ) | (5.23 | ) | 0.00 | 9.48 | (1.87 | ) | 100,467 | (0.00 | )(g) | 2.20 | 1 | |||||||||||||||||||||||||||||||||||||
| 2018 | 19.17 | 0.01 | 1.13 | 1.14 | (0.07 | ) | (3.68 | ) | (1.53 | ) | (5.28 | ) | 0.00 | 15.03 | 6.02 | 176,167 | 0.07 | 2.15 | 0 | (f) | |||||||||||||||||||||||||||||||||||||||||
| 2017 | 20.99 | 0.05 | 2.56 | 2.61 | (0.10 | ) | (3.33 | ) | (1.00 | ) | (4.43 | ) | 0.00 | 19.17 | 13.04 | 246,690 | 0.22 | 2.14 | 1 | ||||||||||||||||||||||||||||||||||||||||||
| Class I | |||||||||||||||||||||||||||||||||||||||||||||||||||||||||||||
| 2021 | $ | 11.15 | $ | 0.12 | $ | 3.34 | $ | 3.46 | $ | (0.11 | ) | $ | (1.24 | ) | $ | (0.91 | ) | $ | (2.26 | ) | $ | 0.00 | $ | 12.35 | 31.71 | % | $ | 134,073 | 0.89 | % | 1.17 | % | 1 | % | |||||||||||||||||||||||||||
| 2020 | 14.68 | 0.14 | (e) | (0.02 | ) | 0.12 | (0.14 | ) | (2.39 | ) | (1.12 | ) | (3.65 | ) | 0.00 | 11.15 | 1.14 | 130,903 | 1.00 | (e) | 1.20 | 0 | (f) | ||||||||||||||||||||||||||||||||||||||
| 2019 | 20.13 | 0.19 | (0.41 | ) | (0.22 | ) | (0.19 | ) | (3.72 | ) | (1.32 | ) | (5.23 | ) | 0.00 | 14.68 | (0.86 | ) | 208,893 | 1.00 | 1.20 | 1 | |||||||||||||||||||||||||||||||||||||||
| 2018 | 23.75 | 0.26 | 1.40 | 1.66 | (0.26 | ) | (3.68 | ) | (1.34 | ) | (5.28 | ) | 0.00 | 20.13 | 7.07 | 357,812 | 1.08 | 1.15 | 0 | (f) | |||||||||||||||||||||||||||||||||||||||||
| 2017 | 24.80 | 0.31 | 3.07 | 3.38 | (0.31 | ) | (3.33 | ) | (0.79 | ) | (4.43 | ) | 0.00 | 23.75 | 14.19 | 443,912 | 1.21 | 1.14 | 1 | ||||||||||||||||||||||||||||||||||||||||||
| † | Total return represents aggregate total return of a hypothetical investment at the beginning of the year and sold at the end of the year including reinvestment of distributions and does not reflect the applicable sales charges. |
| (a) | Per share amounts have been calculated using the average shares outstanding method. |
| (b) | Amount represents less than $0.005 per share. |
| (c) | The Fund received credits from a designated broker who agreed to pay certain Fund operating expenses. For the fiscal years ended September 30, 2021, 2020, 2019, 2018, and 2017, there was no impact on the expense ratios. |
| (d) | The Fund incurred interest expense during the fiscal years ended September 30, 2021, 2020, 2019, 2018, and 2017. If interest expense had not been incurred, the ratio of operating expenses to average net assets would have been 1.41%, 1.42%, 1.40%, 1.39%, and 1.38% (Class AAA and Class A), 2.16%, 2.17%, 2.15%, 2.14%, and 2.13% (Class C), and 1.16%, 1.17%, 1.15%, 1.14%, and 1.13% (Class I), respectively. |
| (e) | Includes income resulting from special dividends. Without these dividends, the per share income (loss) amounts would have been $0.09 (Class AAA and Class A), $(0.01) (Class C), and $0.13 (Class I), respectively, and the net investment income (loss) ratio would have been 0.68% (Class AAA and Class A), (0.07)% (Class C), and 0.93% (Class I), respectively. |
| (f) | Amount represents less than 0.5%. |
| (g) | Amount represents less than 0.005%. |
See accompanying notes to financial statements.
13
The Gabelli Equity Income Fund
Notes to Financial Statements
1. Organization. The Gabelli Equity Income Fund is a series of the Gabelli Equity Series Funds, Inc. (the Corporation). The Corporation was incorporated on July 25, 1991 in Maryland. The Fund is a diversified open-end management investment company registered under the Investment Company Act of 1940, as amended (the 1940 Act), and one of four separately managed portfolios of the Corporation. The Fund seeks to provide a high level of total return on its assets with an emphasis on income. The Fund commenced investment operations on January 2, 1992.
2. Significant Accounting Policies. As an investment company, the Fund follows the investment company accounting and reporting guidance, which is part of U.S. generally accepted accounting principles (GAAP) that may require the use of management estimates and assumptions in the preparation of its financial statements. Actual results could differ from those estimates. The following is a summary of significant accounting policies followed by the Fund in the preparation of its financial statements.
The global outbreak of the novel coronavirus disease, known as COVID-19, has caused adverse effects on many companies, sectors, nations, regions, and the markets in general, and may continue for an unpredictable duration. The effects of this pandemic may materially impact the value and performance of the Fund, its ability to buy and sell fund investments at appropriate valuations, and its ability to achieve its investment objectives.
New Accounting Pronouncements. In March 2020, the Financial Accounting Standards Board (FASB) issued Accounting Standards Update (ASU) No. 2020-04, Reference Rate Reform (Topic 848) – Facilitation of the Effects of Reference Rate Reform on Financial Reporting. The amendments in the ASU provides optional temporary financial reporting relief from the effect of certain types of contract modifications due to the planned discontinuation of the London Interbank Offered Rate (LIBOR) and other interbank-offered based reference rates as of the end of 2021. The ASU is effective for certain reference rate-related contract modifications that occur through December 31, 2022. Management has reviewed the requirements and believes the adoption of this ASU will not have a material impact on the financial statements.
Security Valuation. Portfolio securities listed or traded on a nationally recognized securities exchange or traded in the U.S. over-the-counter market for which market quotations are readily available are valued at the last quoted sale price or a market’s official closing price as of the close of business on the day the securities are being valued. If there were no sales that day, the security is valued at the average of the closing bid and asked prices or, if there were no asked prices quoted on that day, then the security is valued at the closing bid price on that day. If no bid or asked prices are quoted on such day, the security is valued at the most recently available price or, if the Board of Directors (the Board) so determines, by such other method as the Board shall determine in good faith to reflect its fair market value. Portfolio securities traded on more than one national securities exchange or market are valued according to the broadest and most representative market, as determined by Gabelli Funds, LLC (the Adviser).
Portfolio securities primarily traded on a foreign market are generally valued at the preceding closing values of such securities on the relevant market, but may be fair valued pursuant to procedures established by the Board if market conditions change significantly after the close of the foreign market, but prior to the close of business on the day the securities are being valued. Debt obligations for which market quotations are readily available are valued at the average of the latest bid and asked prices. If there were no asked prices quoted on such day, the security is valued using the closing bid price, unless the Board determines such amount does not reflect
14
The Gabelli Equity Income Fund
Notes to Financial Statements (Continued)
the securities’ fair value, in which case these securities will be fair valued as determined by the Board. Certain securities are valued principally using dealer quotations. Futures contracts are valued at the closing settlement price of the exchange or board of trade on which the applicable contract is traded. OTC futures and options on futures for which market quotations are readily available will be valued by quotations received from a pricing service or, if no quotations are available from a pricing service, by quotations obtained from one of more dealers in the instrument in question by the Adviser.
Securities and assets for which market quotations are not readily available are fair valued as determined by the Board. Fair valuation methodologies and procedures may include, but are not limited to: analysis and review of available financial and non-financial information about the company; comparisons with the valuation and changes in valuation of similar securities, including a comparison of foreign securities with the equivalent U.S. dollar value American Depositary Receipt securities at the close of the U.S. exchange; and evaluation of any other information that could be indicative of the value of the security.
The inputs and valuation techniques used to measure fair value of the Fund’s investments are summarized into three levels as described in the hierarchy below:
| ● | Level 1 — quoted prices in active markets for identical securities; |
| ● | Level 2 — other significant observable inputs (including quoted prices for similar securities, interest rates, prepayment speeds, credit risk, etc.); and |
| ● | Level 3 — significant unobservable inputs (including the Board’s determinations as to the fair value of investments). |
A financial instrument’s level within the fair value hierarchy is based on the lowest level of any input both individually and in the aggregate that is significant to the fair value measurement. The inputs or methodology used for valuing securities are not necessarily an indication of the risk associated with investing in those securities. The summary of the Fund’s investments in securities by inputs used to value the Fund’s investments as of September 30, 2021 is as follows:
| Valuation Inputs | ||||||||
| Level 1 Quoted Prices | Total Market Value at 09/30/21 | |||||||
| INVESTMENTS IN SECURITIES: | ||||||||
| ASSETS (Market Value): | ||||||||
| Common Stocks (a) | $ | 591,672,074 | $ | 591,672,074 | ||||
| Warrants (a) | 28,032 | 28,032 | ||||||
| TOTAL INVESTMENTS IN SECURITIES ASSETS | $ | 591,700,106 | $ | 591,700,106 | ||||
| (a) | Please refer to the Schedule of Investments for the industry classifications of these portfolio holdings. |
The Fund held no Level 3 investments at September 30, 2021 or September 30, 2020.
Additional Information to Evaluate Qualitative Information.
General. The Fund uses recognized industry pricing services – approved by the Board and unaffiliated with the Adviser – to value most of its securities, and uses broker quotes provided by market makers of securities not valued by these and other recognized pricing sources. Several different pricing feeds are received to
15
The Gabelli Equity Income Fund
Notes to Financial Statements (Continued)
value domestic equity securities, international equity securities, preferred equity securities, and fixed income securities. The data within these feeds are ultimately sourced from major stock exchanges and trading systems where these securities trade. The prices supplied by external sources are checked by obtaining quotations or actual transaction prices from market participants. If a price obtained from the pricing source is deemed unreliable, prices will be sought from another pricing service or from a broker/dealer that trades that security or similar securities.
Fair Valuation. Fair valued securities may be common or preferred equities, warrants, options, rights, or fixed income obligations. Where appropriate, Level 3 securities are those for which market quotations are not available, such as securities not traded for several days, or for which current bids are not available, or which are restricted as to transfer. When fair valuing a security, factors to consider include recent prices of comparable securities that are publicly traded, reliable prices of securities not publicly traded, the use of valuation models, current analyst reports, valuing the income or cash flow of the issuer, or cost if the preceding factors do not apply. A significant change in the unobservable inputs could result in a lower or higher value in Level 3 securities. The circumstances of Level 3 securities are frequently monitored to determine if fair valuation measures continue to apply.
The Adviser reports quarterly to the Board the results of the application of fair valuation policies and procedures. These may include backtesting the prices realized in subsequent trades of these fair valued securities to fair values previously recognized.
Securities Sold Short. The Fund enters into short sale transactions. Short selling involves selling securities that may or may not be owned and, at times, borrowing the same securities for delivery to the purchaser, with an obligation to replace such borrowed securities at a later date. The proceeds received from short sales are recorded as liabilities and the Fund records an unrealized gain or loss to the extent of the difference between the proceeds received and the value of an open short position on the day of determination. The Fund records a realized gain or loss when the short position is closed out. By entering into a short sale, the Fund bears the market risk of an unfavorable change in the price of the security sold short. Dividends on short sales are recorded as an expense by the Fund on the ex-dividend date and interest expense is recorded on the accrual basis. The broker retains collateral for the value of the open positions, which is adjusted periodically as the value of the position fluctuates. At September 30, 2021, there were no short sales outstanding.
Foreign Currency Translations. The books and records of the Fund are maintained in U.S. dollars. Foreign currencies, investments, and other assets and liabilities are translated into U.S. dollars at current exchange rates. Purchases and sales of investment securities, income, and expenses are translated at the exchange rate prevailing on the respective dates of such transactions. Unrealized gains and losses that result from changes in foreign exchange rates and/or changes in market prices of securities have been included in unrealized appreciation/depreciation on investments and foreign currency translations. Net realized foreign currency gains and losses resulting from changes in exchange rates include foreign currency gains and losses between trade date and settlement date on investment securities transactions, foreign currency transactions, and the difference between the amounts of interest and dividends recorded on the books of the Fund and the amounts actually received. The portion of foreign currency gains and losses related to fluctuation in exchange rates between the initial purchase trade date and subsequent sale trade date is included in realized gain/(loss) on investments.
16
The Gabelli Equity Income Fund
Notes to Financial Statements (Continued)
Foreign Securities. The Fund may directly purchase securities of foreign issuers. Investing in securities of foreign issuers involves special risks not typically associated with investing in securities of U.S. issuers. The risks include possible revaluation of currencies, the inability to repatriate funds, less complete financial information about companies, and possible future adverse political and economic developments. Moreover, securities of many foreign issuers and their markets may be less liquid and their prices more volatile than securities of comparable U.S. issuers.
Foreign Taxes. The Fund may be subject to foreign taxes on income, gains on investments, or currency repatriation, a portion of which may be recoverable. The Fund will accrue such taxes and recoveries as applicable, based upon its current interpretation of tax rules and regulations that exist in the markets in which it invests.
Restricted Securities. The Fund may invest up to 15% of its net assets in securities for which the markets are restricted. Restricted securities include securities whose disposition is subject to substantial legal or contractual restrictions. The sale of restricted securities often requires more time and results in higher brokerage charges or dealer discounts and other selling expenses than the sale of securities eligible for trading on national securities exchanges or in the over-the-counter markets. Restricted securities may sell at a price lower than similar securities that are not subject to restrictions on resale. Securities freely saleable among qualified institutional investors under special rules adopted by the SEC may be treated as liquid if they satisfy liquidity standards established by the Board. The continued liquidity of such securities is not as well assured as that of publicly traded securities, and accordingly the Board will monitor their liquidity. At September 30, 2021, the Fund did not hold any restricted securities.
Securities Transactions and Investment Income. Securities transactions are accounted for on the trade date with realized gain/(loss) on investments determined by using the identified cost method. Interest income (including amortization of premium and accretion of discount) is recorded on an accrual basis. Premiums and discounts on debt securities are amortized using the effective yield to maturity method or amortized to earliest call date, if applicable. Dividend income is recorded on the ex-dividend date, except for certain dividends from foreign securities that are recorded as soon after the ex-dividend date as the Fund becomes aware of such dividends.
Determination of Net Asset Value and Calculation of Expenses. Certain administrative expenses are common to, and allocated among, various affiliated funds. Such allocations are made on the basis of each fund’s average net assets or other criteria directly affecting the expenses as determined by the Adviser pursuant to procedures established by the Board.
In calculating the NAV per share of each class, investment income, realized and unrealized gains and losses, redemption fees, and expenses other than class specific expenses are allocated daily to each class of shares based upon the proportion of net assets of each class at the beginning of each day. Distribution expenses are borne solely by the class incurring the expense.
Distributions to Shareholders. Distributions to shareholders are recorded on the ex-dividend date. Distributions to shareholders are based on income and capital gains as determined in accordance with federal income tax regulations, which may differ from income and capital gains as determined under GAAP. These differences are primarily due to differing treatments of income and gains on various investment securities and foreign currency transactions held by the Fund, timing differences, and differing characterizations of distributions made by the
17
The Gabelli Equity Income Fund
Notes to Financial Statements (Continued)
Fund. Distributions from net investment income for federal income tax purposes include net realized gains on foreign currency transactions. These book/tax differences are either temporary or permanent in nature. To the extent these differences are permanent, adjustments are made to the appropriate capital accounts in the period when the differences arise. Permanent differences were primarily due to prior year post financial statement adjustments, tax treatment of partnership expenses, and tax equalization utilized during the year. These reclassifications have no impact on the NAV of the Fund. For the fiscal year ended September 30, 2021, reclassifications were made to increase paid-in capital by $2,671,840, with an offsetting adjustment to total distributable earnings.
The tax character of distributions paid during the fiscal years ended September 30, 2021 and 2020 was as follows:
| Year Ended September 30, 2021* | Year Ended September 30, 2020* | |||||||||
| Distributions paid from: | ||||||||||
| Ordinary income | $ | 4,817,998 | $ | 5,482,409 | ||||||
| Net long term capital gains | 67,752,576 | 136,799,128 | ||||||||
| Return of capital | 48,320,974 | 44,083,677 | ||||||||
| Total distributions paid. | $ | 120,891,548 | $ | 186,365,214 | ||||||
| * | Total distributions paid differs from the Statement of Changes in Net Assets due to the utilization of equalization. |
The Fund has a fixed distribution policy. Under the policy, the Fund declares and pays monthly distributions from net investment income, capital gains, and paid-in capital. The actual source of the distribution is determined after the end of the calendar year. Pursuant to this policy, distributions during the calendar year are made in excess of required distributions. To the extent such distributions are made from current earnings and profits, they are considered ordinary income or long term capital gains. Distributions sourced from paid-in capital should not be considered as dividend yield or the total return from an investment in the Fund. The Board continues to evaluate its distribution policy in light of ongoing economic and market conditions and may change the amount of the monthly distributions in the future.
Provision for Income Taxes. The Fund intends to continue to qualify as a regulated investment company under Subchapter M of the Internal Revenue Code of 1986, as amended (the Code). It is the policy of the Fund to comply with the requirements of the Code applicable to regulated investment companies and to distribute substantially all of its net investment company taxable income and net capital gains. Therefore, no provision for federal income taxes is required.
At September 30, 2021, the components of accumulated earnings/losses on a tax basis were as follows:
| Net unrealized appreciation on investments and foreign currency translations | $ | 391,159,884 | ||
| Total | $ | 391,159,884 |
At September 30, 2021, the temporary difference between book basis and tax basis net unrealized appreciation on investments was due to deferral of losses from wash sales for tax purposes and tax basis adjustments on investments in partnerships.
18
The Gabelli Equity Income Fund
Notes to Financial Statements (Continued)
The following summarizes the tax cost of investments and the related net unrealized appreciation at September 30, 2021:
| Cost | Gross Unrealized Appreciation | Gross Unrealized Depreciation | Net Unrealized Appreciation | |||||
| Investments | $200,545,071 | $400,631,171 | $(9,476,136) | $391,155,035 |
The Fund is required to evaluate tax positions taken or expected to be taken in the course of preparing the Fund’s tax returns to determine whether the tax positions are “more-likely-than-not” of being sustained by the applicable tax authority. Income tax and related interest and penalties would be recognized by the Fund as tax expense in the Statement of Operations if the tax positions were deemed not to meet the more-likely-than-not threshold. For the fiscal year ended September 30, 2021, the Fund did not incur any income tax, interest, or penalties. As of September 30, 2021, the Adviser has reviewed all open tax years and concluded that there was no impact to the Fund’s net assets or results of operations. The Fund’s federal and state tax returns for the prior three fiscal years remain open, subject to examination. On an ongoing basis, the Adviser will monitor the Fund’s tax positions to determine if adjustments to this conclusion are necessary.
3. Investment Advisory Agreement and Other Transactions. The Fund has entered into an investment advisory agreement (the Advisory Agreement) with the Adviser which provides that the Fund will pay the Adviser a fee, computed daily and paid monthly, at the annual rate of 1.00% of the value of its average daily net assets. In accordance with the Advisory Agreement, the Adviser provides a continuous investment program for the Fund’s portfolio, oversees the administration of all aspects of the Fund’s business and affairs, and pays the compensation of all Officers and Directors of the Fund who are affiliated persons of the Adviser.
4. Distribution Plan. The Fund’s Board has adopted a distribution plan (the Plan) for each class of shares, except for Class I Shares, pursuant to Rule 12b-1 under the 1940 Act. Under the Class AAA, Class A, and Class C Share Plans, payments are authorized to G.distributors, LLC (the Distributor), an affiliate of the Adviser, at annual rates of 0.25%, 0.25%, and 1.00%, respectively, of the average daily net assets of those classes, the annual limitations under each Plan. Such payments are accrued daily and paid monthly.
5. Portfolio Securities. Purchases and sales of securities during the fiscal year ended September 30, 2021, other than short term securities and U.S. Government obligations, aggregated $7,316,627 and $110,117,872, respectively.
6. Transactions with Affiliates and Other Arrangements. During the fiscal year ended September 30, 2021, the Fund paid $8,193 in brokerage commissions on security trades to G.research, LLC, an affiliate of the Adviser. Additionally, the Distributor retained a total of $64,774 from investors representing commissions (sales charges and underwriting fees) on sales and redemptions of Fund shares.
During the fiscal year ended September 30, 2021, the Fund received credits from a designated broker who agreed to pay certain Fund operating expenses. The amount of such expenses paid through this directed brokerage arrangement during this period was $6,091.
19
The Gabelli Equity Income Fund
Notes to Financial Statements (Continued)
The cost of calculating the Fund’s NAV per share is a Fund expense pursuant to the Advisory Agreement. During the fiscal year ended September 30, 2021, the Fund accrued $45,000 in connection with the cost of computing the Fund’s NAV.
The Corporation pays retainer and per meeting fees to Directors not affiliated with the Adviser, plus specified amounts to the Lead Director and Audit Committee Chairman. Directors are also reimbursed for out of pocket expenses incurred in attending meetings. Directors who are directors or employees of the Adviser or an affiliated company receive no compensation or expense reimbursement from the Corporation.
7. Line of Credit. The Fund participates in an unsecured line of credit, which expires on March 2, 2022 and may be renewed annually, of up to $75,000,000 under which it may borrow up to 10% of its net assets from the custodian for temporary borrowing purposes. Borrowings under this arrangement bear interest at a floating rate equal to the higher of the Overnight Federal Funds Rate plus 135 basis points or the Overnight Bank Funding Rate plus 135 basis points in effect on that day. This amount, if any, would be included in “Interest expense” in the Statement of Operations. At September 30, 2021, there was $11,231,000 outstanding under the line of credit.
The average daily amount of borrowings outstanding under the line of credit during the fiscal year ended September 30, 2021 was $1,321,373 with a weighted average interest rate of 1.25%. The maximum amount borrowed at any time during the fiscal year ended September 30, 2021 was $18,892,000.
8. Capital Stock. The Fund offers four classes of shares – Class AAA Shares, Class A Shares, Class C Shares, and Class I Shares. Class AAA and Class I Shares are offered without a sales charge. Class A Shares are subject to a maximum front-end sales charge of 5.75%. Class C Shares are subject to a 1.00% contingent deferred sales charge for one year after purchase.
The Fund imposes a redemption fee of 2.00% on all classes of shares that are redeemed or exchanged on or before the seventh day after the date of a purchase. The redemption fee is deducted from the proceeds otherwise payable to the redeeming shareholders and is retained by the Fund as an increase in paid-in capital. The redemption fees retained by the Fund during the fiscal years ended September 30, 2021 and 2020, if any, can be found in the Statement of Changes in Net Assets under Redemption Fees.
20
The Gabelli Equity Income Fund
Notes to Financial Statements (Continued)
Transactions in shares of capital stock were as follows:
| Year Ended September 30, 2021 | Year Ended September 30, 2020 | |||||||||||||
| Shares | Amount | Shares | Amount | |||||||||||
| Class AAA | ||||||||||||||
| Shares sold | 719,191 | $ | 8,391,443 | 517,283 | $ | 6,576,297 | ||||||||
| Shares issued upon reinvestment of distributions | 4,944,370 | 55,696,708 | 7,517,054 | 80,737,011 | ||||||||||
| Shares redeemed | (5,455,710 | ) | (63,040,433 | ) | (8,582,075 | ) | (108,919,916 | ) | ||||||
| Net increase/(decrease). | 207,851 | $ | 1,047,718 | (547,738 | ) | $ | (21,606,608 | ) | ||||||
| Class A | ||||||||||||||
| Shares sold | 3,025,728 | $ | 34,701,143 | 2,531,411 | $ | 32,538,086 | ||||||||
| Shares issued upon reinvestment of distributions | 1,538,993 | 17,114,296 | 1,830,657 | 19,372,951 | ||||||||||
| Shares redeemed | (2,318,146 | ) | (26,421,505 | ) | (2,778,776 | ) | (34,982,251 | ) | ||||||
| Net increase | 2,246,575 | $ | 25,393,934 | 1,583,292 | $ | 16,928,786 | ||||||||
| Class C | ||||||||||||||
| Shares sold | 1,812,023 | $ | 11,756,248 | 1,439,486 | $ | 12,895,728 | ||||||||
| Shares issued upon reinvestment of distributions | 3,201,433 | 18,582,717 | 3,855,885 | 25,043,742 | ||||||||||
| Shares redeemed | (4,487,597 | ) | (28,636,523 | ) | (6,657,072 | ) | (57,940,256 | ) | ||||||
| Net increase/(decrease) | 525,859 | $ | 1,702,442 | (1,361,701 | ) | $ | (20,000,786 | ) | ||||||
| Class I | ||||||||||||||
| Shares sold | 1,707,653 | $ | 22,716,891 | 1,325,390 | $ | 18,231,196 | ||||||||
| Shares issued upon reinvestment of distributions | 1,824,386 | 23,208,214 | 3,055,726 | 36,304,618 | ||||||||||
| Shares redeemed | (4,414,403 | ) | (57,061,682 | ) | (6,873,418 | ) | (95,220,248 | ) | ||||||
| Net decrease | (882,364 | ) | $ | (11,136,577 | ) | (2,492,302 | ) | $ | (40,684,434 | ) | ||||
9. Indemnifications. The Fund enters into contracts that contain a variety of indemnifications. The Fund’s maximum exposure under these arrangements is unknown. However, the Fund has not had prior claims or losses pursuant to these contracts. Management has reviewed the Fund’s existing contracts and expects the risk of loss to be remote.
10. Subsequent Events. Management has evaluated the impact on the Fund of all subsequent events occurring through the date the financial statements were issued and has determined that there were no subsequent events requiring recognition or disclosure in the financial statements.
21
The Gabelli Equity Income Fund
Report of Independent Registered Public Accounting Firm
To the Shareholders of The Gabelli Equity Income Fund
and the Board of Directors of Gabelli Equity Series Funds, Inc.
Opinion on the Financial Statements
We have audited the accompanying statement of assets and liabilities of The Gabelli Equity Income Fund (the “Fund”) (one of the funds constituting Gabelli Equity Series Funds, Inc. (the “Corporation”)), including the schedule of investments, as of September 30, 2021, and the related statement of operations for the year then ended, the statements of changes in net assets for each of the two years in the period then ended, the financial highlights for each of the five years in the period then ended and the related notes (collectively referred to as the “financial statements”). In our opinion, the financial statements present fairly, in all material respects, the financial position of the Fund (one of the funds constituting Gabelli Equity Series Funds, Inc.) at September 30, 2021, the results of its operations for the year then ended, the changes in its net assets for each of the two years in the period then ended and its financial highlights for each of the five years in the period then ended, in conformity with U.S. generally accepted accounting principles.
Basis for Opinion
These financial statements are the responsibility of the Corporation’s management. Our responsibility is to express an opinion on the Fund’s financial statements based on our audits. We are a public accounting firm registered with the Public Company Accounting Oversight Board (United States) (“PCAOB”) and are required to be independent with respect to the Corporation in accordance with the U.S. federal securities laws and the applicable rules and regulations of the Securities and Exchange Commission and the PCAOB.
We conducted our audits in accordance with the standards of the PCAOB. Those standards require that we plan and perform the audit to obtain reasonable assurance about whether the financial statements are free of material misstatement, whether due to error or fraud. The Corporation is not required to have, nor were we engaged to perform, an audit of the Corporation’s internal control over financial reporting. As part of our audits we are required to obtain an understanding of internal control over financial reporting but not for the purpose of expressing an opinion on the effectiveness of the Corporation’s internal control over financial reporting. Accordingly, we express no such opinion.
Our audits included performing procedures to assess the risks of material misstatement of the financial statements, whether due to error or fraud, and performing procedures that respond to those risks. Such procedures included examining, on a test basis, evidence regarding the amounts and disclosures in the financial statements. Our procedures included confirmation of securities owned as of September 30, 2021, by correspondence with the custodian or by other appropriate auditing procedures where replies from brokers were not received. Our audits also included evaluating the accounting principles used and significant estimates made by management, as well as evaluating the overall presentation of the financial statements. We believe that our audits provide a reasonable basis for our opinion.

We have served as the auditor of one or more Gabelli/GAMCO Funds investment companies since 1992.
Philadelphia, Pennsylvania
November 24, 2021
22
The Gabelli Equity Income Fund
Liquidity Risk Management (Unaudited)
In accordance with Rule 22e-4 under the 1940 Act, the Fund has established a liquidity risk management program (the LRM Program) to govern its approach to managing liquidity risk. The LRM Program is administered by the Liquidity Committee (the Committee), which is comprised of members of Gabelli Funds, LLC management. The Board has designated the Committee to administer the LRM Program.
The LRM Program’s principal objectives include supporting the Fund’s compliance with limits on investments in illiquid assets and mitigating the risk that the Fund will be unable to meet its redemption obligations in a timely manner. The LRM Program also includes elements that support the management and assessment of liquidity risk, including an annual assessment of factors that influence the Fund’s liquidity and the monthly classification and re-classification of certain investments that reflect the Committee’s assessment of their relative liquidity under current market conditions.
At a meeting of the Board held on May 12, 2021, the Board received a written report from the Committee regarding the design and operational effectiveness of the LRM Program. The Committee determined, and reported to the Board, that the LRM Program is reasonably designed to assess and manage the Fund’s liquidity risk and has operated adequately and effectively since its implementation. The Committee reported that there were no liquidity events that impacted the Fund or its ability to timely meet redemptions without dilution to existing shareholders. The Committee noted that the Fund is primarily invested in highly liquid securities and, accordingly, continues to be exempt from the requirement to determine a “highly liquid investment minimum” as defined in the Rule 22e-4. Because of that continued qualification for the exemption, the Fund has not adopted a “highly liquid investment minimum” amount. The Committee further noted that while changes to the LRM Program were made during the Review Period and reported to the Board, no material changes were made to the LRM Program as a result of the Committee’s annual review.
There can be no assurance that the LRM Program will achieve its objectives in the future. Please refer to the Fund’s Prospectus for more information regarding its exposure to liquidity risk and other principal risks to which an investment in the Fund may be subject.
23
The Gabelli Equity Income Fund
Additional Fund Information (Unaudited)
The business and affairs of the Corporation are managed under the direction of the Corporation’s Board of Directors. Information pertaining to the Directors and officers of the Corporation is set forth below. The Corporation’s Statement of Additional Information includes additional information about the Corporation’s Directors and is available without charge, upon request, by calling 800-GABELLI (800-422-3554) or by writing to The Gabelli Equity Income Fund at One Corporate Center, Rye, NY 10580-1422.
| Name, Position(s) Address1 and Age | Term of Office and Length of Time Served2 | Number of Funds in Fund Complex Overseen by Director | Principal Occupation(s) During Past Five Years | Other Directorships Held by Director3 | ||||
| INTERESTED DIRECTORS4: | ||||||||
Mario J. Gabelli, CFA Director and Chief Investment Officer Age: 79 | Since 1991 | 32 | Chairman, Chief Executive Officer, and Chief Investment Officer– Value Portfolios of GAMCO Investors, Inc. and Chief Investment Officer– Value Portfolios of Gabelli Funds, LLC and GAMCO Asset Management Inc.; Director/ Trustee or Chief Investment Officer of other registered investment companies within the Fund Complex; Chief Executive Officer of GGCP, Inc.; Executive Chairman of Associated Capital Group, Inc. | Director of Morgan Group Holdings, Inc. (holding company); Chairman of the Board and Chief Executive Officer of LICT Corp. (multimedia and communication services company); Director of CIBL, Inc. (broadcasting and wireless communications); Director of ICTC Group Inc.(communications) (2013-2018) | ||||
John D. Gabelli Director Age: 77 | Since 1991 | 12 | Senior Vice President of G.research, LLC | Senior Vice President of G.research, LLC | ||||
| INDEPENDENT DIRECTORS5: | ||||||||
Elizabeth C. Bogan Director Age: 77 | Since 2019 | 12 | Senior Vice President of G.research, LLC | Trustee | ||||
Anthony J. Colavita6 Director Age: 85 | Since 1991 | 18 | President of the law firm of Anthony J. Colavita, P.C. | — | ||||
Vincent D. Enright Director Age: 77 | Since 1991 | 17 | Former Senior Vice President and Chief Financial Officer of KeySpan Corp. (public utility) (1994-1998) | Director of Echo Therapeutics, Inc. (therapeutics and diagnostics) (2008-2014); Director of The LGL Group, Inc. (diversified manufacturing) (2011-2014) | ||||
Robert J. Morrissey Director Age: 82 | Since 1991 | 7 | Partner in the law firm of Morrissey, Hawkins & Lynch | Chairman of the Board of Directors, Belmont Savings Bank | ||||
Kuni Nakamura Director Age: 53 | Since 2009 | 35 | President of Advanced Polymer, Inc. (chemical manufacturing company);President of KEN Enterprises, Inc. (real estate); Trustee on Long Island University Board of Trustees | — | ||||
24
The Gabelli Equity Income Fund
Additional Fund Information (Continued) (Unaudited)
| Name, Position(s) Address1 and Age | Term of Office and Length of Time Served2 | Number of Funds in Fund Complex Overseen by Director | Principal Occupation(s) During Past Five Years | Other Directorships Held by Director3 | ||||
Anthonie C. van Ekris6 Director Age: 87 | Since 1991 | 23 | Chairman and Chief Executive Officer of BALMAC International, Inc.(global import/ export company) | — | ||||
Salvatore J. Zizza7 Director Age: 75 | Since 2001 | 32 | President of Zizza & Associates Corp. (private holding company); Chairman of Bergen Cove Realty Inc. (residential real estate) | Director and Chairman of Trans-Lux Corporation (business services); Director and Chairman of Harbor Diversified Inc. (pharmaceuticals) (2009-2018); Retired Chairman of BAM (semiconductor and aerospace manufacturing) |
25
The Gabelli Equity Income Fund
Additional Fund Information (Continued) (Unaudited)
| Name, Position(s) Address1 and Age | Term of Office and Length of Time Served2 | Principal Occupation(s) During Past Five Years | ||
| OFFICERS: | ||||
Bruce N. Alpert President Age: 69 | Since 1991 | Executive Vice President and Chief Operating Officer of Gabelli Funds, LLC since 1988; Officer of registered investment companies within the Fund Complex; Senior Vice President of GAMCO Investors, Inc. since 2008; Vice President – Mutual Funds, G.research, LLC | ||
John C. Ball Treasurer Age: 45 | Since 2017 | Treasurer of registered investment companies within the Fund Complex since 2017; Vice President and Assistant Treasurer of AMG Funds, 2014-2017; Chief Executive Officer, G.distributors, LLC since December 2020 | ||
Peter Goldstein Secretary and Vice President Age: 68 | Since 2020 | General Counsel, Gabelli Funds, LLC since July 2020; General Counsel and Chief Compliance Officer, Buckingham Capital Management, Inc. (2012-2020); Chief Legal Officer and Chief Compliance Officer, The Buckingham Research Group, Inc. (2012-2020) | ||
Richard J. Walz Chief Compliance Officer Age: 62 | Since 2013 | Chief Compliance Officer of registered investment companies within the Fund Complex since 2013; Chief Compliance Officer for Gabelli Funds, LLC since 2015 | ||
Daniel Plourde Vice President Age: 41 | Since 2021 | Vice President of registered investment companies within the Fund Complex since 2021; Assistant Treasurer of the North American SPDR ETFs and State Street Global Advisors Mutual Funds (2017-2021); Fund Administration at State Street Bank (2009-2017) |
| 1 | Address: One Corporate Center, Rye, NY 10580-1422, unless otherwise noted. |
| 2 | Each Director will hold office for an indefinite term until the earliest of (i) the next meeting of shareholders, if any, called for the purpose of considering the election or re-election of such Director and until the election and qualification of his or her successor, if any, elected at such meeting, or (ii) the date a Director resigns or retires, or a Director is removed by the Board of Directors or shareholders, in accordance with the Fund’s By-Laws and Articles of Incorporation. For officers, includes time served in prior officer positions with the Fund. Each officer will hold office for an indefinite term until the date he or she resigns or retires or until his or her successor is elected and qualified. |
| 3 | This column includes only directorships of companies required to report to the SEC under the Securities Exchange Act of 1934, as amended, i.e., public companies, or other investment companies registered under the 1940 Act. |
| 4 | “Interested person” of the Fund as defined in the 1940 Act. Messrs. Gabelli are each considered an “interested person” because of their affiliation with Gabelli Funds, LLC which acts as the Fund’s investment adviser. Mario J. Gabelli and John D. Gabelli are brothers. |
| 5 | Directors who are not interested persons are considered “Independent” Directors. |
| 6 | Mr. Colavita’s son, Anthony S. Colavita, serves as a director of other funds in the Gabelli/GAMCO Fund Complex. Mr. van Ekris is an independent director of Gabelli International Ltd., Gabelli Fund, LDC, GAMA Capital Opportunities Master, Ltd., and GAMCO International SICAV, which may be deemed to be controlled by Mario J. Gabelli and/or affiliates and in that event would be deemed to be under common control with the Fund’s Adviser. |
| 7 | Mr. Zizza is an independent director of Gabelli International Ltd., which may be deemed to be controlled by Mario J. Gabelli and/or affiliates and in that event would be deemed to be under common control with the Fund’s Adviser. On September 9, 2015, Mr. Zizza entered into a settlement with the SEC to resolve an inquiry relating to an alleged violation regarding the making of false statements or omissions to the accountants of a company concerning a related party transaction. The company in question is not an affiliate of, nor has any connection to, the Fund. Under the terms of the settlement, Mr. Zizza, without admitting or denying the SEC’s findings and allegation, paid $150,000 and agreed to cease and desist committing or causing any future violations of Rule 13b2-2 of the Securities Exchange Act of 1934, as amended. The Board has discussed this matter and has determined that it does not disqualify Mr. Zizza from serving as an Independent Director. |
26
Gabelli Funds and Your Personal Privacy
Who are we?
The Gabelli Funds are investment companies registered with the Securities and Exchange Commission under the Investment Company Act of 1940. We are managed by Gabelli Funds, LLC, which is affiliated with GAMCO Investors, Inc., a publicly held company with subsidiaries and affiliates that provide investment advisory services for a variety of clients.
What kind of non-public information do we collect about you if you become a fund shareholder?
If you apply to open an account directly with us, you will be giving us some non-public information about yourself. The non-public information we collect about you is:
| ● | Information you give us on your application form. This could include your name, address, telephone number, social security number, bank account number, and other information. |
| ● | Information about your transactions with us, any transactions with our affiliates, and transactions with the entities we hire to provide services to you. This would include information about the shares that you buy or redeem. If we hire someone else to provide services — like a transfer agent — we will also have information about the transactions that you conduct through them. |
What information do we disclose and to whom do we disclose it?
We do not disclose any non-public personal information about our customers or former customers to anyone other than our affiliates, our service providers who need to know such information, and as otherwise permitted by law. If you want to find out what the law permits, you can read the privacy rules adopted by the Securities and Exchange Commission. They are in volume 17 of the Code of Federal Regulations, Part 248. The Commission often posts information about its regulations on its website, www.sec.gov.
What do we do to protect your personal information?
We restrict access to non-public personal information about you to the people who need to know that information in order to provide services to you or the fund and to ensure that we are complying with the laws governing the securities business. We maintain physical, electronic, and procedural safeguards to keep your personal information.
This page was intentionally left blank.
This page was intentionally left blank.
THE GABELLI EQUITY INCOME FUND
2021 TAX NOTICE TO SHAREHOLDERS (Unaudited)
During the fiscal year ended September 30, 2021, the Fund paid to shareholders ordinary income distributions (comprised of net investment income and short term capital gains) totaling $0.0822, $0.0825, $0.0463, and $0.1117 for each of Class AAA, Class A, Class C, and Class I, respectively, and long term capital gains totaling $67,752,576, or the maximum allowable. The distribution of long term capital gains has been designated as a capital gain dividend by the Fund’s Board of Directors. For the fiscal year ended September 30, 2021, 100% of the ordinary income distribution qualifies for the dividends received deduction available to corporations. The Fund designates 100% of the ordinary income distribution as qualified dividend income pursuant to the Jobs and Growth Tax Relief Reconciliation Act of 2003. The Fund designates 0.00% of the ordinary income distribution as qualified interest income pursuant to the Tax Relief, Unemployment Reauthorization, and Job Creation Act of 2010.
All designations are based on financial information available as of the date of this annual report and, accordingly, are subject to change. For each item, it is the intention of the Fund to designate the maximum amount permitted under the Internal Revenue Code and the regulations thereunder.
|
GABELLI EQUITY INCOME FUND
One Corporate Center
Rye, NY 10580-1422
Portfolio Manager’s Biography
Mario J. Gabelli, CFA, is Chairman, Chief Executive Officer, and Chief Investment Officer - Value Portfolios of GAMCO Investors, Inc. that he founded in 1977, and Chief Investment Officer - Value Portfolios of Gabelli Funds, LLC and GAMCO Asset Management Inc. He is also Executive Chairman of Associated Capital Group, Inc. Mr. Gabelli is a summa cum laude graduate of Fordham University and holds an MBA degree from Columbia Business School and Honorary Doctorates from Fordham University and Roger Williams University.
| We have separated the portfolio manager’s commentary from the financial statements and investment portfolio due to corporate governance regulations stipulated by the Sarbanes-Oxley Act of 2002. We have done this to ensure that the contents of the portfolio manager’s commentary are unrestricted. Both the commentary and the financial statements, including the portfolios of investments, will be available on our website at www.gabelli.com. |
Gabelli Equity Series Funds, Inc.
THE GABELLI EQUITY INCOME FUND
One Corporate Center
Rye, New York 10580-1422
| t | 800-GABELLI (800-422-3554) |
| f | 914-921-5118 |
| e | info@gabelli.com |
| GABELLI.COM |
Net Asset Values per share available daily
by calling 800-GABELLI after 7:00 P.M.
BOARD OF DIRECTORS Mario J. Gabelli, CFA Chairman and Chief Executive Officer, GAMCO Investors, Inc. Executive Chairman, Associated Capital Group Inc.
Elizabeth C. Bogan Senior Lecturer, Princeton University
Anthony J. Colavita President, Anthony J. Colavita, P.C.
Vincent D. Enright Former Senior Vice President and Chief Financial Officer, KeySpan Corp.
John D. Gabelli Former Senior Vice President, G.research, LLC
Robert J. Morrissey Partner, Morrissey, Hawkins & Lynch
Kuni Nakamura President, Advanced Polymer, Inc.
Anthonie C. van Ekris Chairman, BALMAC International, Inc. | Salvatore J. Zizza Chairman, Zizza & Associates Corp.
OFFICERS Bruce N. Alpert President
John C. Ball Treasurer
Peter Goldstein Secretary and Vice President
Richard J. Walz Chief Compliance Officer
Daniel Plourde Vice President
DISTRIBUTOR G.distributors, LLC
CUSTODIAN State Street Bank and Trust Company
TRANSFER AGENT AND DIVIDEND DISBURSING AGENT DST Asset Manager Solutions, Inc.
LEGAL COUNSEL Skadden, Arps, Slate, Meagher & Flom LLP |
This report is submitted for the general information of the shareholders of The Gabelli Equity Income Fund. It is not authorized for distribution to prospective investors unless preceded or accompanied by an effective prospectus.
GAB444Q321AR

The Gabelli Small Cap Growth Fund
Annual Report — September 30, 2021
 |  |
| Mario J. Gabelli, CFA, | Gordon Grender |
| Chief Investment Officer | Portfolio Manager |
To Our Shareholders,
For the fiscal year ended September 30, 2021, the net asset value (NAV) total return per Class AAA Share of The Gabelli Small Cap Growth Fund was 42.2% compared with a total return of 57.6% for the Standard & Poor’s (S&P) SmallCap 600 Index. Other classes of shares are available. See page 3 for performance information for all classes.
Enclosed are the financial statements, including the summary schedule of investments, as of September 30, 2021.
Investment Objective and Strategy
The Fund invests primarily in small cap companies, that through bottom-up fundamental research, the portfolio manager believes are attractively priced relative to their earnings growth potential or private market value. The Fund characterizes small capitalization companies as those companies with a market capitalization of $3 billion or less at the time of the Fund’s initial investment.
| As permitted by regulations adopted by the Securities and Exchange Commission, paper copies of the Fund’s annual and semiannual shareholder reports will no longer be sent by mail, unless you specifically request paper copies of the reports. Instead, the reports will be made available on the Fund’s website (www.gabelli.com), and you will be notified by mail each time a report is posted and provided with a website link to access the report. If you already elected to receive shareholder reports electronically, you will not be affected by this change and you need not take any action. To elect to receive all future reports on paper free of charge, please contact your financial intermediary, or, if you invest directly with the Fund, you may call 800-422-3554 or send an email request to info@gabelli.com. |
Performance Discussion
During the fourth quarter of 2020, the stock market rebounded dramatically from the March pandemic driven lows. Favorable news on Pfizer’s COVID-19 vaccine in mid-November (followed by Moderna, Johnson & Johnson and AstraZeneca) ignited a global stock market rally on hopes the world would normalize in 2021. It also spurred a rotation into value oriented stocks from growth stocks. What’s more, the large cap S&P 500 Index, long buoyed by a handful of mega cap tech stocks, lost ground to a dynamic revival in small caps. In the month of November, for example, small cap indices rallied by 18%, a historical breakout.
Following more than a decade of growth stock leadership, the first quarter of 2021 saw the trend of rotation to value stocks continue. Following a steep, rather short, recession, the U.S. economy rebounded in tandem with massive government fiscal stimulus along with unprecedented Federal Reserve monetary accommodation.
During the second quarter of 2021, the equity bull market remained intact as U.S. and global economies rebounded from pandemic driven shutdowns with a surge of consumer spending on retail, travel, leisure, and hospitality. Widespread vaccination in the U.S. to protect against the spread of COVID-19 has allowed bars, restaurants, and entertainment venues to reopen. Air travel reached pre-pandemic levels, hotel occupancies rose rapidly, and major cities, like New York, are once again vibrant and bustling with commuter traffic. Underpinning the broad based reopening of America is trillions of dollars of government fiscal stimulus funneled to businesses along with funding to unemployed workers hit hardest by the pandemic. Against this backdrop has been the U.S. Federal Reserve with its unprecedented quantitative easing, fostering negative real interest rates, adjusted for inflation.
In the third quarter of 2021, the U.S. economy continued its robust growth trajectory. The economy has rebounded from its pandemic lows, and so have corporate earnings which now stand above their pre-pandemic highs. Supply chain constraints have become a discussion topic in virtually every corporate earnings call, with higher input cots being reflected in both producer and consumer prices. Many companies have passed these additional costs onto consumers through higher prices in recent months, further stoking consumer inflation. In September the U.S. Federal Reserve signaled that it is on track to start scaling back asset purchases before year end.
Among the better performing stocks for the fiscal year were: Herc Holdings Inc. (2.68% of net assets as of September 30, 2021) which operates through its subsidiaries as a full service equipment rental firm, renting earth moving equipment and aerial lifts, among many other items. In addition to the rental business Herc also provides industry specific solution based services. KKR & Co. Inc. (2.26%) is a private equity and real estate investment firm specializing in direct and fund of fund investments. Crane Co. (1.79%) manufactures and sells engineered industrial products in the United States, Canada, the United Kingdom, Continental Europe, and internationally.
The weaker performing stocks during the year were: CHR Hansen Holding A/S (0.84%), a bioscience company, develops natural ingredient solutions for food, nutritional, pharmaceutical, and agricultural industries worldwide. Quidel Corp (0.58%) develops, manufactures, and markets diagnostic testing solutions for applications in infectious diseases, cardiology, thyroid, women’s and general health, eye health, gastrointestinal diseases, and toxicology worldwide. Teladoc Health Inc. (0.18%), the leader in telemedicine, expands access to care while also reducing costs, addressing two persistent issues in the U.S. healthcare system.
We appreciate your confidence and trust.
2
Comparative Results
Average Annual Returns through September 30, 2021 (a)(b) (Unaudited)
Average annual returns reflect changes in share price, reinvestment of distributions, and are net of expenses.
| 1 Year | 5 Year | 10 Year | 15 Year | Since Inception (10/22/91) | |||||||||||
| Class AAA (GABSX) | 42.16 | % | 11.33 | % | 12.95 | % | 9.57 | % | 12.26 | % | |||||
| S&P SmallCap 600 Index (c) | 57.64 | 13.57 | 15.69 | 10.30 | N/A | ||||||||||
| Lipper Small-Cap Core Funds Average (c) | 53.83 | 12.74 | 13.79 | 9.09 | N/A | ||||||||||
| Class A (GCASX) (d) | 42.17 | 11.33 | 12.95 | 9.57 | 12.26 | ||||||||||
| With sales charge (e) | 34.00 | 10.02 | 12.29 | 9.13 | 12.03 | ||||||||||
| Class C (GCCSX) (d) | 41.10 | 10.50 | 12.11 | 8.75 | 11.76 | ||||||||||
| With contingent deferred sales charge (f) | 40.10 | 10.50 | 12.11 | 8.75 | 11.76 | ||||||||||
| Class I (GACIX) (d) | 42.51 | 11.61 | 13.24 | 9.82 | 12.39 | ||||||||||
| (a) | The Fund's fiscal year ends September 30. |
| (b) | Returns would have been lower had the Adviser not reimbursed certain expenses of the Fund. The Fund imposes a 2% redemption fee on shares sold or exchanged within seven days of purchase. |
| (c) | The S&P SmallCap 600 Index is an unmanaged indicator which measures the performance of the small-cap segment of the U.S. equity market. The inception date of the index is December 31, 1994. The Lipper Small-Cap Core Funds Average reflects the average performance of mutual funds classified in this particular category. The inception date of the index is December 31, 1991. Dividends are considered reinvested. You cannot invest directly in an index. |
| (d) | The Class AAA Share NAVs are used to calculate performance for the periods prior to the issuance of Class A Shares and Class C Shares on December 31, 2003, and Class I Shares on January 11, 2008. The actual performance of the Class A Shares and Class C Shares would have been lower due to the additional fees and expenses associated with these classes of shares. The actual performance of the Class I Shares would have been higher due to lower expenses related to this class of shares. |
| (e) | Performance results include the effect of the maximum 5.75% sales charge at the beginning of the period. |
| (f) | Assuming payment of the 1% maximum contingent deferred sales charge imposed on redemptions made within one year of purchase. |
In the current prospectuses dated January 28, 2021, the expense ratios for Class AAA, A, C, and I Shares are 1.44%, 1.44%, 2.19%, and 1.19%, respectively. See page 12 for the expense ratios for the year ended September 30, 2021. Class AAA and Class I Shares have no sales charge. The maximum sales charge for Class A Shares, and Class C Shares is 5.75% and 1.00% respectively.
Investing in small capitalization securities involves special risks because these securities may trade less frequently and experience more abrupt price movements than large capitalization securities. Investors should carefully consider the investment objectives, risks, charges, and expenses of the Fund before investing. The prospectuses contain information about these and other matters and should be read carefully before investing. To obtain a prospectus, please visit our website at www.gabelli.com.
Returns represent past performance and do not guarantee future results. Investment returns and the principal value of an investment will fluctuate. When shares are redeemed, they may be worth more or less than their original cost. Current performance may be lower or higher than the performance data presented. Visit www.gabelli.com for performance information as of the most recent month end.
3
COMPARISON OF CHANGE IN VALUE OF A $10,000 INVESTMENT IN
THE GABELLI SMALL CAP GROWTH FUND CLASS AAA AND S&P SMALL CAP 600 INDEX (Unaudited)
| Average Annual Total Returns* | |||
| 1 Year | 5 Year | 10 Year | |
| Class AAA | 42.16% | 11.33% | 12.95% |
* Past performance is not predictive of future results. The performance tables and graph do not reflect the deduction of taxes that a shareholder would pay on Fund distributions or the redemption of Fund shares.
4
The Gabelli Small Cap Growth Fund
Disclosure of Fund Expenses (Unaudited)
| For the Six Month Period from April 1, 2021 through September 30, 2021 | Expense Table |
We believe it is important for you to understand the impact of fees and expenses regarding your investment. All mutual funds have operating expenses. As a shareholder of a fund, you incur ongoing costs, which include costs for portfolio management, administrative services, and shareholder reports (like this one), among others. Operating expenses, which are deducted from a fund’s gross income, directly reduce the investment return of a fund. When a fund’s expenses are expressed as a percentage of its average net assets, this figure is known as the expense ratio. The following examples are intended to help you understand the ongoing costs (in dollars) of investing in your Fund and to compare these costs with those of other mutual funds. The examples are based on an investment of $1,000 made at the beginning of the period shown and held for the entire period.
The Expense Table below illustrates your Fund’s costs in two ways:
Actual Fund Return: This section provides information about actual account values and actual expenses. You may use this section to help you to estimate the actual expenses that you paid over the period after any fee waivers and expense reimbursements. The “Ending Account Value” shown is derived from the Fund’s actual return during the past six months, and the “Expenses Paid During Period” shows the dollar amount that would have been paid by an investor who started with $1,000 in the Fund. You may use this information, together with the amount you invested, to estimate the expenses that you paid over the period.
To do so, simply divide your account value by $1,000 (for example, an $8,600 account value divided by $1,000 = 8.6), then multiply the result by the number given for your Fund under the heading “Expenses Paid During Period” to estimate the expenses you paid during this period.
Hypothetical 5% Return: This section provides information about hypothetical account values and hypothetical expenses based on the Fund’s actual expense ratio. It assumes a hypothetical annualized return of 5% before expenses during the period shown. In this case – because the hypothetical return used is not the Fund’s actual return – the results do not apply to your investment and you cannot use the hypothetical account value and expense to estimate the actual ending account balance or expenses you
paid for the period. This example is useful in making comparisons of the ongoing costs of investing in the Fund and other funds. To do so, compare this 5% hypothetical example with the 5% hypothetical examples that appear in shareholder reports of other funds.
Please note that the expenses shown in the table are meant to highlight your ongoing costs only and do not reflect any transactional costs such as sales charges (loads), redemption fees, or exchange fees, if any, which are described in the Prospectus. If these costs were applied to your account, your costs would be higher. Therefore, the 5% hypothetical return is useful in comparing ongoing costs only, and will not help you determine the relative total costs of owning different funds. The "Annualized Expense Ratio" represents the actual expenses for the last six months and may be different from the expense ratio in the Financial Highlights which is for the fiscal year ended September 30, 2021.
| Beginning | Ending | Annualized | Expenses | ||
| Account Value | Account Value | Expense | Paid During | ||
| 04/01/21 | 09/30/21 | Ratio | Period* | ||
| The Gabelli Small Cap Growth Fund | |||||
| Actual Fund Return | |||||
| Class AAA | $1,000.00 | $1,032.30 | 1.37% | $ | 6.98 |
| Class A | $1,000.00 | $1,032.30 | 1.37% | $ | 6.98 |
| Class C | $1,000.00 | $1,028.30 | 2.12% | $ | 10.78 |
| Class I | $1,000.00 | $1,033.40 | 1.12% | $ | 5.71 |
| Hypothetical 5% Return | |||||
| Class AAA | $1,000.00 | $1,018.20 | 1.37% | $ | 6.93 |
| Class A | $1,000.00 | $1,018.20 | 1.37% | $ | 6.93 |
| Class C | $1,000.00 | $1,014.44 | 2.12% | $ | 10.71 |
| Class I | $1,000.00 | $1,019.45 | 1.12% | $ | 5.67 |
| * | Expenses are equal to the Fund’s annualized expense ratio for the last six months multiplied by the average account value over the period, multiplied by the number of days in the most recent fiscal half year (183 days), then divided by 365. |
5
Summary of Portfolio Holdings (Unaudited)
The following table presents portfolio holdings as a percent of net assets as of September 30, 2021:
The Gabelli Small Cap Growth Fund
| Equipment and Supplies | 15.2 | % | |
| Diversified Industrial | 10.9 | % | |
| Building and Construction | 7.1 | % | |
| Food and Beverage | 6.5 | % | |
| Health Care | 6.0 | % | |
| Retail | 5.7 | % | |
| Financial Services | 4.9 | % | |
| Hotels and Gaming | 4.8 | % | |
| Automotive: Parts and Accessories | 4.3 | % | |
| Specialty Chemicals | 3.5 | % | |
| Business Services | 3.3 | % | |
| Machinery | 2.8 | % | |
| Real Estate | 2.7 | % | |
| Energy and Utilities | 2.2 | % | |
| Consumer Products | 2.2 | % | |
| Broadcasting | 2.1 | % | |
| Aviation: Parts and Services | 2.0 | % | |
| Electronics | 2.0 | % | |
| Computer Software and Services | 1.9 | % | |
| Transportation | 1.8 | % |
| Manufactured Housing and Recreational Vehicles | 1.5 | % | |
| Entertainment | 1.3 | % | |
| Consumer Services | 0.9 | % | |
| Publishing | 0.9 | % | |
| Telecommunications | 0.9 | % | |
| Cable | 0.8 | % | |
| Aerospace | 0.7 | % | |
| Environmental Services | 0.5 | % | |
| Home Furnishings | 0.3 | % | |
| Closed-End Funds | 0.2 | % | |
| Automotive | 0.2 | % | |
| Miscellaneous Investments | 0.1 | % | |
| Communications Equipment | 0.1 | % | |
| Metals and Mining | 0.0 | %* | |
| Agriculture | 0.0 | %* | |
| Wireless Communications | 0.0 | %* | |
| Other Assets and Liabilities (Net) | (0.3) | % | |
| 100.0 | % |
| * | Amount represents less than 0.05%. |
The Fund files a complete schedule of portfolio holdings with the Securities and Exchange Commission (the SEC) for the first and third quarters of each fiscal year on Form N-PORT. Shareholders may obtain this information at www.gabelli.com or by calling the Fund at 800-GABELLI (800-422-3554). The Fund’s Form N-PORT is available on the SEC’s website at www.sec.gov and may also be reviewed and copied at the SEC’s Public Reference Room in Washington, DC. Information on the operation of the Public Reference Room may be obtained by calling 800-SEC-0330.
Proxy Voting
The Fund files Form N-PX with its complete proxy voting record for the twelve months ended June 30, no later than August 31 of each year. A description of the Fund’s proxy voting policies, procedures, and how the Fund voted proxies relating to portfolio securities is available without charge, upon request, by (i) calling 800-GABELLI (800-422-3554); (ii) writing to The Gabelli Funds at One Corporate Center, Rye, NY 10580-1422; or (iii) visiting the SEC’s website at www.sec.gov.
6
The Gabelli Small Cap Growth Fund
Summary Schedule of Investments — September 30, 2021
| Shares | Cost | Market Value | ||||||||||
| COMMON STOCKS* — 99.7% | ||||||||||||
| Aerospace — 0.7% | ||||||||||||
| 260,000 | Aerojet Rocketdyne Holdings Inc. | $ | 683,183 | $ | 11,323,000 | |||||||
| 73,500 | Various Securities | 862,834 | 1,302,485 | |||||||||
| 1,546,017 | 12,625,485 | |||||||||||
| Agriculture — 0.0% | ||||||||||||
| 52,000 | Various Securities | 808,732 | 731,280 | |||||||||
| Automotive — 0.2% | ||||||||||||
| 80,200 | Various Securities | 426,012 | 3,097,494 | |||||||||
| Automotive: Parts and Accessories — 4.0% | ||||||||||||
| 848,055 | Brembo SpA | 1,568,825 | 10,717,379 | |||||||||
| 1,110,000 | Dana Inc. | 9,031,849 | 24,686,400 | |||||||||
| 244,000 | Strattec Security Corp.†(a) | 4,677,938 | 9,491,600 | |||||||||
| 1,274,272 | Various Securities | 8,273,797 | 30,330,675 | |||||||||
| 23,552,409 | 75,226,054 | |||||||||||
| Aviation: Parts and Services — 2.0% | ||||||||||||
| 670,000 | Kaman Corp. | 9,964,092 | 23,898,900 | |||||||||
| 228,700 | Various Securities | 2,928,031 | 14,201,960 | |||||||||
| 12,892,123 | 38,100,860 | |||||||||||
| Broadcasting — 2.1% | ||||||||||||
| 1,854,342 | Various Securities | 13,589,434 | 40,485,747 | |||||||||
| Building and Construction — 7.1% | ||||||||||||
| 311,500 | Herc Holdings Inc.† | 10,297,382 | 50,917,790 | |||||||||
| 380,000 | Lennar Corp., Cl. B | 9,178,089 | 29,484,200 | |||||||||
| 2,700 | NVR Inc.† | 1,908,454 | 12,944,016 | |||||||||
| 809,500 | Various Securities | 10,664,379 | 41,941,265 | |||||||||
| 32,048,304 | 135,287,271 | |||||||||||
| Business Services — 3.3% | ||||||||||||
| 196,000 | IAA Inc.† | 1,593,186 | 10,695,720 | |||||||||
| 338,000 | The Interpublic Group of Companies Inc. | 1,425,712 | 12,394,460 | |||||||||
| 1,612,500 | Trans-Lux Corp.†(a) | 1,587,544 | 677,331 | |||||||||
| 35,000 | United Rentals Inc.† | 216,471 | 12,282,550 | |||||||||
| 1,538,000 | Various Securities | 9,535,060 | 27,293,444 | |||||||||
| 14,357,973 | 63,343,505 | |||||||||||
| Cable — 0.8% | ||||||||||||
| 464,500 | Various Securities | 7,160,946 | 14,228,095 | |||||||||
| Communications Equipment — 0.1% | ||||||||||||
| 242,000 | Various Securities | 1,610,888 | 2,093,300 | |||||||||
| Computer Software and Services — 1.9% | ||||||||||||
| 34,500 | Rockwell Automation Inc. | 804,852 | 10,144,380 | |||||||||
| 36,000 | Tyler Technologies Inc.† | 71,925 | 16,511,400 | |||||||||
| 601,000 | Various Securities | 3,576,553 | 9,565,580 | |||||||||
| 4,453,330 | 36,221,360 | |||||||||||
| Consumer Products — 2.2% | ||||||||||||
| 2,002,500 | Various Securities | 9,790,937 | 41,526,191 | |||||||||
| Market | ||||||||||||
| Shares | Cost | Value | ||||||||||
| Consumer Services — 0.9% | ||||||||||||
| 358,000 | Rollins Inc. | $ | 340,833 | $ | 12,648,140 | |||||||
| 321,000 | Various Securities | 1,463,221 | 5,292,845 | |||||||||
| 1,804,054 | 17,940,985 | |||||||||||
| Diversified Industrial — 10.9% | ||||||||||||
| 359,000 | Crane Co. | 7,725,236 | 34,036,790 | |||||||||
| 1,315,000 | Griffon Corp. | 14,366,530 | 32,349,000 | |||||||||
| 920,000 | Myers Industries Inc. | 12,634,530 | 18,004,400 | |||||||||
| 341,500 | Textron Inc. | 2,071,915 | 23,840,115 | |||||||||
| 2,507,411 | Various Securities | 42,134,579 | 98,531,562 | |||||||||
| 78,932,790 | 206,761,867 | |||||||||||
| Electronics — 2.0% | ||||||||||||
| 138,500 | Badger Meter Inc. | 1,768,846 | 14,007,890 | |||||||||
| 213,800 | Bel Fuse Inc., Cl. A(a) | 4,047,987 | 3,072,306 | |||||||||
| 465,000 | CTS Corp. | 3,976,813 | 14,373,150 | |||||||||
| 258,000 | Various Securities | 2,077,954 | 5,996,067 | |||||||||
| 11,871,600 | 37,449,413 | |||||||||||
| Energy and Utilities — 2.2% | ||||||||||||
| 2,528,800 | Various Securities | 11,848,138 | 41,583,486 | |||||||||
| Entertainment — 1.3% | ||||||||||||
| 690,213 | Various Securities | 8,904,095 | 25,392,276 | |||||||||
| Environmental Services — 0.5% | ||||||||||||
| 92,500 | Various Securities | 785,217 | 9,018,750 | |||||||||
| Equipment and Supplies — 15.2% | ||||||||||||
| 406,500 | AMETEK Inc. | 691,697 | 50,410,065 | |||||||||
| 129,000 | Crown Holdings Inc. | 520,753 | 13,000,620 | |||||||||
| 163,000 | Franklin Electric Co. Inc. | 636,072 | 13,015,550 | |||||||||
| 453,500 | Graco Inc. | 2,597,302 | 31,731,395 | |||||||||
| 154,000 | Interpump Group SpA | 691,669 | 9,989,610 | |||||||||
| 683,500 | Mueller Industries Inc. | 17,993,876 | 28,091,850 | |||||||||
| 170,700 | Tennant Co. | 2,876,864 | 12,623,265 | |||||||||
| 761,000 | The Gorman-Rupp Co. | 11,825,810 | 27,251,410 | |||||||||
| 59,000 | The Middleby Corp.† | 669,921 | 10,060,090 | |||||||||
| 2,108,403 | Various Securities | 19,202,702 | 91,780,623 | |||||||||
| 57,706,666 | 287,954,478 | |||||||||||
| Financial Services — 4.9% | ||||||||||||
| 705,000 | KKR & Co. Inc. | 2,933,468 | 42,920,400 | |||||||||
| 10,000 | Waterloo Investment Holdings Ltd.†(b) | 1,373 | 3,000 | |||||||||
| 2,738,420 | Various Securities | 26,977,749 | 50,085,673 | |||||||||
| 29,912,590 | 93,009,073 | |||||||||||
| Food and Beverage — 6.5% | ||||||||||||
| 195,000 | Chr. Hansen Holding A/S | 8,106,517 | 15,928,038 | |||||||||
| 254,000 | Kikkoman Corp. | 1,749,120 | 20,745,406 | |||||||||
| 690,000 | Maple Leaf Foods Inc. | 12,027,755 | 14,022,264 | |||||||||
| 5,611,051 | Various Securities | 25,296,369 | 72,602,072 | |||||||||
| 47,179,761 | 123,297,780 | |||||||||||
See accompanying notes to financial statements.
7
The Gabelli Small Cap Growth Fund
Summary Schedule of Investments (Continued) — September 30, 2021
| Market | ||||||||||||
| Shares | Cost | Value | ||||||||||
| COMMON STOCKS* (Continued) | ||||||||||||
| Health Care — 6.0% | ||||||||||||
| 411,000 | Cutera Inc.† | $ | 5,198,266 | $ | 19,152,600 | |||||||
| 163,000 | Globus Medical Inc., Cl. A† | 3,684,152 | 12,489,060 | |||||||||
| 78,000 | Quidel Corp.† | 346,178 | 11,009,700 | |||||||||
| 1,033,600 | Various Securities | 15,909,129 | 71,447,923 | |||||||||
| 25,137,725 | 114,099,283 | |||||||||||
| Home Furnishings — 0.3% | ||||||||||||
| 246,500 | Various Securities | 2,939,320 | 5,480,465 | |||||||||
| Hotels and Gaming — 4.8% | ||||||||||||
| 118,000 | Churchill Downs Inc. | 1,089,792 | 28,329,440 | |||||||||
| 285,000 | Ryman Hospitality Properties Inc., REIT† | 4,929,759 | 23,854,500 | |||||||||
| 7,170,548 | Various Securities | 14,692,696 | 38,926,868 | |||||||||
| 20,712,247 | 91,110,808 | |||||||||||
| Machinery — 2.8% | ||||||||||||
| 341,500 | Astec Industries Inc. | 11,945,517 | 18,376,115 | |||||||||
| 1,427,000 | CNH Industrial NV | 4,242,733 | 23,702,470 | |||||||||
| 455,300 | Various Securities | 6,529,199 | 11,758,495 | |||||||||
| 22,717,449 | 53,837,080 | |||||||||||
| Manufactured Housing and Recreational Vehicles — 1.5% | ||||||||||||
| 71,000 | Cavco Industries Inc.† | 1,418,150 | 16,808,540 | |||||||||
| 204,000 | Various Securities | 1,838,995 | 11,177,320 | |||||||||
| 3,257,145 | 27,985,860 | |||||||||||
| Metals and Mining — 0.0% | ||||||||||||
| 140,000 | Various Securities | 529,906 | 796,978 | |||||||||
| Publishing — 0.9% | ||||||||||||
| 775,000 | The E.W. Scripps Co., Cl. A | 4,022,887 | 13,996,500 | |||||||||
| 60,000 | Various Securities | 1,492,061 | 3,565,020 | |||||||||
| 5,514,948 | 17,561,520 | |||||||||||
| Real Estate — 2.7% | ||||||||||||
| 262,000 | Indus Realty Trust Inc., REIT | 5,058,467 | 18,366,200 | |||||||||
| 405,000 | The St. Joe Co. | 6,267,431 | 17,050,500 | |||||||||
| 447,467 | Various Securities | 6,019,255 | 15,416,070 | |||||||||
| 17,345,153 | 50,832,770 | |||||||||||
| Retail — 5.7% | ||||||||||||
| 129,000 | AutoNation Inc.† | 2,094,018 | 15,707,040 | |||||||||
| 92,000 | Copart Inc.† | 777,200 | 12,762,240 | |||||||||
| 474,000 | Ingles Markets Inc., Cl. A | 6,938,285 | 31,298,220 | |||||||||
| 348,000 | Rush Enterprises Inc., Cl. B | 2,493,065 | 15,927,960 | |||||||||
| 562,723 | Various Securities | 5,916,505 | 31,639,769 | |||||||||
| 18,219,073 | 107,335,229 | |||||||||||
| Specialty Chemicals — 3.5% | ||||||||||||
| 1,354,525 | Ferro Corp.† | 6,342,463 | 27,551,039 | |||||||||
| 252,000 | H.B. Fuller Co. | 2,873,618 | 16,269,120 | |||||||||
| 91,200 | The General Chemical Group Inc.†(b) | 1,186 | 456 | |||||||||
| Market | ||||||||||||
| Shares | Cost | Value | ||||||||||
| 492,046 | Various Securities | $ | 7,690,121 | $ | 22,705,649 | |||||||
| 16,907,388 | 66,526,264 | |||||||||||
| Telecommunications — 0.9% | ||||||||||||
| 1,298,500 | Various Securities | 5,703,957 | 16,750,225 | |||||||||
| Transportation — 1.8% | ||||||||||||
| 380,000 | GATX Corp. | 10,862,049 | 34,032,800 | |||||||||
| 118,653 | Various Securities | 975,418 | 983,440 | |||||||||
| 11,837,467 | 35,016,240 | |||||||||||
| Wireless Communications — 0.0% | ||||||||||||
| 22,000 | Various Securities | 789,590 | 701,580 | |||||||||
| TOTAL COMMON STOCKS | 522,793,384 | 1,893,409,052 | ||||||||||
| CLOSED-END FUNDS* — 0.2% | ||||||||||||
| 207,266 | Various Securities | 3,198,981 | 4,313,634 | |||||||||
| PREFERRED STOCKS* — 0.3% | ||||||||||||
| Automotive: Parts and Accessories — 0.3% | ||||||||||||
| 95,000 | Various Securities | 649,637 | 4,432,542 | |||||||||
| RIGHTS* — 0.0% | ||||||||||||
| Entertainment — 0.0% | ||||||||||||
| 1,680,000 | Media General Inc., CVR, expire 12/31/21†(b) | 2 | 2 | |||||||||
| WARRANTS* — 0.0% | ||||||||||||
| Business Services — 0.0% | ||||||||||||
| 1 | Internap Corp., expire 05/08/24†(b) | 0 | 652 | |||||||||
| Diversified Industrial — 0.0% | ||||||||||||
| 140,000 | Various Securities | 95,648 | 121,037 | |||||||||
| TOTAL WARRANTS | 95,648 | 121,689 | ||||||||||
| TOTAL MISCELLANEOUS INVESTMENTS — 0.1%(c) | 1,843,659 | 2,204,711 | ||||||||||
| TOTAL INVESTMENTS — 100.3% | $ | 528,581,311 | 1,904,481,630 | |||||||||
| Other Assets and Liabilities (Net) — (0.3)% | (5,050,117 | ) | ||||||||||
| NET ASSETS — 100.0% | $ | 1,899,431,513 | ||||||||||
See accompanying notes to financial statements.
8
The Gabelli Small Cap Growth Fund
Summary Schedule of Investments (Continued) — September 30, 2021
This Summary Schedule of Investments does not reflect the complete portfolio holdings of the Fund. It includes the Fund’s 50 largest holdings, each investment of any issuer that exceeds 1% of the Fund’s net assets, and affiliated or Level 3 securities, if any.
| * | “Various Securities” consist of issuers not identified as a top 50 holding, issues or issuers not exceeding 1% of net assets individually or in the aggregate, any issuers that are not affiliated or level 3 securities, if any, as of September 30, 2021. The complete Schedule of Investments is available (i) without charge, upon request, by calling 800-GABELLI (800-422-3554); and (ii) on the SEC’S website at http://www.sec.gov. |
| (a) | Security considered an affiliated holding because the Fund owns at least 5% of its outstanding shares. |
| (b) | Security is valued using significant unobservable inputs and is classified as Level 3 in the fair value hierarchy. |
| (c) | Represents previously undisclosed, unrestricted securities which the Fund has held for less than one year. |
| † | Non-income producing security. |
| CVR | Contingent Value Right |
| REIT | Real Estate Investment Trust |
See accompanying notes to financial statements.
9
The Gabelli Small Cap Growth Fund
Statement of Assets and Liabilities
September 30, 2021
| Assets: | ||||
| Investments, at value (cost $518,267,842) | $ | 1,891,240,393 | ||
| Investments in affiliates, at value (cost $10,313,469) | 13,241,237 | |||
| Foreign currency, at value (cost $91,743) | 91,985 | |||
| Cash | 771 | |||
| Receivable for Fund shares sold | 491,503 | |||
| Receivable for investments sold | 419,199 | |||
| Dividends receivable | 1,334,130 | |||
| Prepaid expenses | 38,516 | |||
| Total Assets | 1,906,857,734 | |||
| Liabilities: | ||||
| Line of credit payable | 3,705,000 | |||
| Payable for Fund shares redeemed | 1,000,493 | |||
| Payable for investment advisory fees | 1,580,183 | |||
| Payable for distribution fees | 304,810 | |||
| Payable for accounting fees | 7,500 | |||
| Other accrued expenses | 828,235 | |||
| Total Liabilities | 7,426,221 | |||
| Net Assets | ||||
| (applicable to 38,155,871 shares outstanding) | $ | 1,899,431,513 | ||
| Net Assets Consist of: | ||||
| Paid-in capital | $ | 330,393,125 | ||
| Total distributable earnings | 1,569,038,388 | |||
| Net Assets | $ | 1,899,431,513 | ||
| Shares of Capital Stock, each at $0.001 par value: | ||||
| Class AAA: | ||||
| Net Asset Value, offering, and redemption price per share ($1,054,894,286 ÷ 21,263,904 shares outstanding; 150,000,000 shares authorized) | $ | 49.61 | ||
| Class A: | ||||
| Net Asset Value and redemption price per share ($134,004,869 ÷ 2,703,939 shares outstanding; 50,000,000 shares authorized) | $ | 49.56 | ||
| Maximum offering price per share (NAV ÷ 0.9425, based on maximum sales charge of 5.75% of the offering price) | $ | 52.58 | ||
| Class C: | ||||
| Net Asset Value and offering price per share ($66,466,302 ÷ 1,710,382 shares outstanding; 50,000,000 shares authorized) | $ | 38.86 | (a) | |
| Class I: | ||||
| Net Asset Value, offering, and redemption price per share ($644,066,056 ÷ 12,477,646 shares outstanding; 50,000,000 shares authorized) | $ | 51.62 | ||
Statement of Operations
For the Year Ended September 30, 2021
| Investment Income: | ||||
| Dividends - unaffiliated (net of foreign withholding taxes of $332,657) | $ | 27,830,005 | ||
| Dividends - affiliated | 51,468 | |||
| Interest | 634 | |||
| Total Investment Income | 27,882,107 | |||
| Expenses: | ||||
| Investment advisory fees | 19,018,307 | |||
| Distribution fees - Class AAA | 2,629,917 | |||
| Distribution fees - Class A | 326,132 | |||
| Distribution fees - Class C | 760,158 | |||
| Shareholder services fees | 1,525,224 | |||
| Shareholder communications expenses | 264,729 | |||
| Custodian fees | 201,410 | |||
| Directors’ fees. | 142,538 | |||
| Registration expenses | 90,032 | |||
| Legal and audit fees | 73,717 | |||
| Interest expense | 72,457 | |||
| Accounting fees | 45,000 | |||
| Miscellaneous expenses | 121,278 | |||
| Total Expenses | 25,270,899 | |||
| Less: | ||||
| Advisory fee reduction on unsupervised assets (See Note 3) | (126,227 | ) | ||
| Expenses paid indirectly by broker (See Note 6) | (17,672 | ) | ||
| Total Reductions | (143,899 | ) | ||
| Net Expenses | 25,127,000 | |||
| Net Investment Income | 2,755,107 | |||
| Net Realized and Unrealized Gain/(Loss) on Investments and Foreign Currency: | ||||
| Net realized gain on investments - unaffiliated | 259,802,817 | |||
| Net realized loss on investments - affiliated | (93,397 | ) | ||
| Net realized loss on foreign currency transactions | (12,318 | ) | ||
| Net realized gain on investments and foreign currency transactions | 259,697,102 | |||
| Net change in unrealized appreciation/depreciation: | ||||
| on investments - unaffiliated | 372,749,696 | |||
| on investments - affiliated | 5,864,443 | |||
| on foreign currency translations | (7,733 | ) | ||
| Net change in unrealized appreciation/depreciation | ||||
| on investments and foreign currency translations | 378,606,406 | |||
| Net Realized and Unrealized Gain/(Loss) on Investments and Foreign Currency | 638,303,508 | |||
| Net Increase in Net Assets Resulting from Operations | $ | 641,058,615 | ||
(a) Redemption price varies based on the length of time held.
See accompanying notes to financial statements.
10
The Gabelli Small Cap Growth Fund
Statement of Changes in Net Assets
| Year Ended September 30, 2021 | Year Ended September 30, 2020 | |||||||||
| Operations: | ||||||||||
| Net investment income | $ | 2,755,107 | $ | 2,602,287 | ||||||
| Net realized gain on investments and foreign currency transactions | 259,697,102 | 421,208,660 | ||||||||
| Net change in unrealized appreciation/depreciation on investments and foreign currency translations | 378,606,406 | (501,380,754 | ) | |||||||
| Net Increase/(Decrease) in Net Assets Resulting from Operations | 641,058,615 | (77,569,807 | ) | |||||||
| Distributions to Shareholders: | ||||||||||
| Accumulated earnings | ||||||||||
| Class AAA | (191,595,179 | ) | (225,788,690 | ) | ||||||
| Class A | (22,004,092 | ) | (32,301,744 | ) | ||||||
| Class C | (18,595,632 | ) | (27,339,966 | ) | ||||||
| Class I | (114,398,478 | ) | (154,155,709 | ) | ||||||
| Total Distributions to Shareholders | (346,593,381 | ) | (439,586,109 | ) | ||||||
| Capital Share Transactions: | ||||||||||
| Class AAA | 9,809,347 | (95,842,744 | ) | |||||||
| Class A | 2,604,293 | (23,192,192 | ) | |||||||
| Class C | (17,810,664 | ) | (33,587,375 | ) | ||||||
| Class I | (28,524,077 | ) | (137,549,435 | ) | ||||||
| Net Decrease in Net Assets from Capital Share Transactions | (33,921,101 | ) | (290,171,746 | ) | ||||||
| Redemption Fees | 1,871 | 5,069 | ||||||||
| Net Increase/(Decrease) in Net Assets | 260,546,004 | (807,322,593 | ) | |||||||
| Net Assets: | ||||||||||
| Beginning of year | 1,638,885,509 | 2,446,208,102 | ||||||||
| End of year | $ | 1,899,431,513 | $ | 1,638,885,509 | ||||||
See accompanying notes to financial statements.
11
The Gabelli Small Cap Growth Fund
Financial Highlights
Selected data for a share of capital stock outstanding throughout each year:
| Income (Loss) from Investment Operations | Distributions | Ratios to Average Net Assets/Supplemental Data | |||||||||||||||||||||||||||||||||||||||||||
| Year Ended September 30 | Net Asset Value, Beginning of Year | Net Investment Income (Loss) (a)(b) | Net Realized and Unrealized Gain (Loss) on Investments | Total from Investment Operations | Net Investment Income | Net Realized Gain on Investments | Total Distributions | Redemption Fees(a)(c) | Net Asset Value, End of Year | Total Return† | Net Assets, End of Year (in 000’s) | Net Investment Income (Loss)(b) | Operating Expenses(d)(e) | Portfolio Turnover Rate | |||||||||||||||||||||||||||||||
| Class AAA | |||||||||||||||||||||||||||||||||||||||||||||
| 2021 | $ | 43.30 | $ | 0.04 | $ | 15.83 | $ | 15.87 | $ | — | $ | (9.56 | ) | $ | (9.56 | ) | $ | 0.00 | $ | 49.61 | 42.16 | % | $ | 1,054,894 | 0.09 | % | 1.38 | %(f) | 1 | % | |||||||||||||||
| 2020 | 53.92 | 0.04 | (0.63 | ) | (0.59 | ) | (0.07 | ) | (9.96 | ) | (10.03 | ) | 0.00 | 43.30 | (2.08 | ) | 884,341 | 0.08 | 1.41 | (f) | 0 | (g) | |||||||||||||||||||||||
| 2019 | 59.61 | 0.03 | (3.50 | ) | (3.47 | ) | (0.09 | ) | (2.13 | ) | (2.22 | ) | 0.00 | 53.92 | (5.72 | ) | 1,243,608 | 0.06 | 1.39 | (f) | 1 | ||||||||||||||||||||||||
| 2018 | 58.63 | 0.09 | 4.01 | 4.10 | — | (3.12 | ) | (3.12 | ) | 0.00 | 59.61 | 7.21 | 1,711,850 | 0.16 | 1.36 | 3 | |||||||||||||||||||||||||||||
| 2017 | 50.13 | 0.02 | 10.47 | 10.49 | — | (1.99 | ) | (1.99 | ) | 0.00 | 58.63 | 21.56 | 1,882,823 | 0.04 | 1.38 | 4 | |||||||||||||||||||||||||||||
| Class A | |||||||||||||||||||||||||||||||||||||||||||||
| 2021 | $ | 43.26 | $ | 0.04 | $ | 15.82 | $ | 15.86 | $ | — | $ | (9.56 | ) | $ | (9.56 | ) | $ | 0.00 | $ | 49.56 | 42.17 | % | $ | 134,005 | 0.08 | % | 1.38 | %(f) | 1 | % | |||||||||||||||
| 2020 | 53.89 | 0.05 | (0.64 | ) | (0.59 | ) | (0.08 | ) | (9.96 | ) | (10.04 | ) | 0.00 | 43.26 | (2.08 | ) | 110,975 | 0.11 | 1.41 | (f) | 0 | (g) | |||||||||||||||||||||||
| 2019 | 59.58 | 0.03 | (3.50 | ) | (3.47 | ) | (0.09 | ) | (2.13 | ) | (2.22 | ) | 0.00 | 53.89 | (5.73 | ) | 170,189 | 0.06 | 1.39 | (f) | 1 | ||||||||||||||||||||||||
| 2018 | 58.60 | 0.09 | 4.01 | 4.10 | — | (3.12 | ) | (3.12 | ) | 0.00 | 59.58 | 7.21 | 208,947 | 0.16 | 1.36 | 3 | |||||||||||||||||||||||||||||
| 2017 | 50.11 | 0.01 | 10.47 | 10.48 | — | (1.99 | ) | (1.99 | ) | 0.00 | 58.60 | 21.55 | 229,282 | 0.02 | 1.38 | 4 | |||||||||||||||||||||||||||||
| Class C | |||||||||||||||||||||||||||||||||||||||||||||
| 2021 | $ | 35.95 | $ | (0.24 | ) | $ | 12.71 | $ | 12.47 | $ | — | $ | (9.56 | ) | $ | (9.56 | ) | $ | 0.00 | $ | 38.86 | 41.10 | % | $ | 66,467 | (0.64 | )% | 2.13 | %(f) | 1 | % | ||||||||||||||
| 2020 | 46.63 | (0.24 | ) | (0.48 | ) | (0.72 | ) | — | (9.96 | ) | (9.96 | ) | 0.00 | 35.95 | (2.80 | ) | 75,505 | (0.65 | ) | 2.16 | (f) | 0 | (g) | ||||||||||||||||||||||
| 2019 | 52.16 | (0.32 | ) | (3.08 | ) | (3.40 | ) | — | (2.13 | ) | (2.13 | ) | 0.00 | 46.63 | (6.44 | ) | 141,522 | (0.69 | ) | 2.14 | (f) | 1 | |||||||||||||||||||||||
| 2018 | 52.05 | (0.30 | ) | 3.53 | 3.23 | — | (3.12 | ) | (3.12 | ) | 0.00 | 52.16 | 6.41 | 215,939 | (0.59 | ) | 2.11 | 3 | |||||||||||||||||||||||||||
| 2017 | 45.04 | (0.34 | ) | 9.34 | 9.00 | — | (1.99 | ) | (1.99 | ) | 0.00 | 52.05 | 20.65 | 233,786 | (0.71 | ) | 2.13 | 4 | |||||||||||||||||||||||||||
| Class I | |||||||||||||||||||||||||||||||||||||||||||||
| 2021 | $ | 44.62 | $ | 0.17 | $ | 16.39 | $ | 16.56 | $ | — | $ | (9.56 | ) | $ | (9.56 | ) | $ | 0.00 | $ | 51.62 | 42.51 | % | $ | 644,066 | 0.34 | % | 1.13 | %(f) | 1 | % | |||||||||||||||
| 2020 | 55.29 | 0.15 | (0.64 | ) | (0.49 | ) | (0.22 | ) | (9.96 | ) | (10.18 | ) | 0.00 | 44.62 | (1.83 | ) | 568,065 | 0.34 | 1.16 | (f) | 0 | (g) | |||||||||||||||||||||||
| 2019 | 61.09 | 0.17 | (3.59 | ) | (3.42 | ) | (0.25 | ) | (2.13 | ) | (2.38 | ) | 0.00 | 55.29 | (5.50 | ) | 890,889 | 0.32 | 1.14 | (f) | 1 | ||||||||||||||||||||||||
| 2018 | 59.86 | 0.25 | 4.10 | 4.35 | — | (3.12 | ) | (3.12 | ) | 0.00 | 61.09 | 7.49 | 1,624,806 | 0.43 | 1.11 | 3 | |||||||||||||||||||||||||||||
| 2017 | 51.09 | 0.16 | 10.67 | 10.83 | (0.07 | ) | (1.99 | ) | (2.06 | ) | 0.00 | 59.86 | 21.84 | 1,404,639 | 0.30 | 1.13 | 4 | ||||||||||||||||||||||||||||
| † | Total return represents aggregate total return of a hypothetical investment at the beginning of the year and sold at the end of the year including reinvestment of distributions and does not reflect the applicable sales charges. |
| (a) | Per share amounts have been calculated using the average shares outstanding method. |
| (b) | Due to capital share activity throughout the period, net investment income/(loss) per share and the ratio to average net assets are not necessarily correlated among the different classes of shares. |
| (c) | Amount represents less than $0.005 per share. |
| (d) | The Fund received credits from a designated broker who agreed to pay certain Fund operating expenses. For all years presented, there was no impact on the expense ratios. |
| (e) | Ratio of operating expenses includes advisory fee reduction on unsupervised assets totaling 0.01% of net assets for the fiscal year ended September 30, 2020. For the years ended September 30, 2021, 2019, 2018, and 2017, there was no impact on the expense ratios. |
| (f) | The Fund incurred interest expense during the fiscal years ended September 30, 2021, 2020 and 2019. If interest expense had not been incurred, the ratios of operating expenses to average net assets would have been 1.37%, 1.39%, and 1.38% (Class AAA and Class A), 2.12%, 2.14%, and 2.13% (Class C), and 1.12%, 1.14%, and 1.13% (Class I). For the years ended September 30, 2018 and 2017, the effect of interest expense was minimal. |
| (g) | Amount represents less than 0.5%. |
See accompanying notes to financial statements.
12
The Gabelli Small Cap Growth Fund
Notes to Financial Statements
1. Organization. The Gabelli Small Cap Growth Fund is a series of the Gabelli Equity Series Funds, Inc. (the Corporation). The Corporation was incorporated on July 25, 1991 in Maryland. The Fund is a diversified open-end management investment company registered under the Investment Company Act of 1940, as amended (the 1940 Act), and one of four separately managed portfolios of the Corporation. The Fund seeks to provide a high level of capital appreciation. Gabelli Funds, LLC (the Adviser) currently characterizes small capitalization companies for the Fund as those with total common stock market values of $3 billion or less at the time of investment. The Fund commenced investment operations on October 22, 1991.
2. Significant Accounting Policies. As an investment company, the Fund follows the investment company accounting and reporting guidance, which is part of U.S. generally accepted accounting principles (GAAP) that may require the use of management estimates and assumptions in the preparation of its financial statements. Actual results could differ from those estimates. The following is a summary of significant accounting policies followed by the Fund in the preparation of its financial statements.
The global outbreak of the novel coronavirus disease, known as COVID-19, has caused adverse effects on many companies, sectors, nations, regions, and the markets in general, and may continue for an unpredictable duration. The effects of this pandemic may materially impact the value and performance of the Fund, its ability to buy and sell fund investments at appropriate valuations, and its ability to achieve its investment objectives.
Security Valuation. Portfolio securities listed or traded on a nationally recognized securities exchange or traded in the U.S. over-the-counter market for which market quotations are readily available are valued at the last quoted sale price or a market’s official closing price as of the close of business on the day the securities are being valued. If there were no sales that day, the security is valued at the average of the closing bid and asked prices or, if there were no asked prices quoted on that day, then the security is valued at the closing bid price on that day. If no bid or asked prices are quoted on such day, the security is valued at the most recently available price or, if the Board of Directors (the Board) so determines, by such other method as the Board shall determine in good faith to reflect its fair market value. Portfolio securities traded on more than one national securities exchange or market are valued according to the broadest and most representative market, as determined by the Adviser.
Portfolio securities primarily traded on a foreign market are generally valued at the preceding closing values of such securities on the relevant market, but may be fair valued pursuant to procedures established by the Board if market conditions change significantly after the close of the foreign market, but prior to the close of business on the day the securities are being valued. Debt obligations for which market quotations are readily available are valued at the average of the latest bid and asked prices. If there were no asked prices quoted on such day, the security is valued using the closing bid price, unless the Board determines such amount does not reflect the securities’ fair value, in which case these securities will be fair valued as determined by the Board. Certain securities are valued principally using dealer quotations. Futures contracts are valued at the closing settlement price of the exchange or board of trade on which the applicable contract is traded. OTC futures and options on futures for which market quotations are readily available will be valued by quotations received from a pricing service or, if no quotations are available from a pricing service, by quotations obtained from one of more dealers in the instrument in question by the Adviser.
13
The Gabelli Small Cap Growth Fund
Notes to Financial Statements (Continued)
Securities and assets for which market quotations are not readily available are fair valued as determined by the Board. Fair valuation methodologies and procedures may include, but are not limited to: analysis and review of available financial and non-financial information about the company; comparisons with the valuation and changes in valuation of similar securities, including a comparison of foreign securities with the equivalent U.S. dollar value American Depositary Receipt securities at the close of the U.S. exchange; and evaluation of any other information that could be indicative of the value of the security.
The inputs and valuation techniques used to measure fair value of the Fund’s investments are summarized into three levels as described in the hierarchy below:
| ● | Level 1 — quoted prices in active markets for identical securities; |
| ● | Level 2 — other significant observable inputs (including quoted prices for similar securities, interest rates, prepayment speeds, credit risk, etc.); and |
| ● | Level 3 — significant unobservable inputs (including the Board’s determinations as to the fair value of investments). |
A financial instrument’s level within the fair value hierarchy is based on the lowest level of any input both individually and in the aggregate that is significant to the fair value measurement. The inputs or methodology used for valuing securities are not necessarily an indication of the risk associated with investing in those securities.
14
The Gabelli Small Cap Growth Fund
Notes to Financial Statements (Continued)
The summary of the Fund’s investments in securities by inputs used to value the Fund’s investments as of September 30, 2021 is as follows:
| Valuation Inputs | ||||||||||||||||
| Level 1 Quoted Prices | Level 2 Other Significant Observable Inputs | Level 3 Significant Unobservable Inputs | Total Market Value at 09/30/21 | |||||||||||||
| INVESTMENTS IN SECURITIES: | ||||||||||||||||
| ASSETS (Market Value): | ||||||||||||||||
| Common Stocks: | ||||||||||||||||
| Automotive: Parts and Accessories | $ | 75,226,041 | $ | 13 | — | $ | 75,226,054 | |||||||||
| Aviation: Parts and Services | 36,933,980 | 1,166,880 | — | 38,100,860 | ||||||||||||
| Consumer Services | 17,665,120 | 275,865 | — | 17,940,985 | ||||||||||||
| Diversified Industrial | 206,608,300 | 888,487 | — | 207,496,787 | ||||||||||||
| Financial Services | 91,543,053 | 1,463,020 | $ | 3,000 | 93,009,073 | |||||||||||
| Manufactured Housing and Recreational Vehicles | 25,500,860 | 2,485,000 | — | 27,985,860 | ||||||||||||
| Publishing | 17,299,870 | 261,650 | — | 17,561,520 | ||||||||||||
| Real Estate | 49,888,807 | 943,963 | — | 50,832,770 | ||||||||||||
| Retail | 107,325,884 | 10,225 | — | 107,336,109 | ||||||||||||
| Specialty Chemicals | 66,525,808 | — | 456 | 66,526,264 | ||||||||||||
| Other Industries (a) | 1,193,597,481 | — | — | 1,193,597,481 | ||||||||||||
| Total Common Stocks | 1,888,115,204 | 7,495,103 | 3,456 | 1,895,613,763 | ||||||||||||
| Closed-End Funds | 4,313,634 | — | — | 4,313,634 | ||||||||||||
| Preferred Stocks (a) | 4,432,542 | — | — | 4,432,542 | ||||||||||||
| Rights (a) | — | — | 2 | 2 | ||||||||||||
| Warrants (a) | 121,037 | — | 652 | 121,689 | ||||||||||||
| TOTAL INVESTMENTS IN SECURITIES – ASSETS | $ | 1,896,982,417 | $ | 7,495,103 | $ | 4,110 | $ | 1,904,481,630 | ||||||||
| (a) | Please refer to the Schedule of Investments for the industry classifications of these portfolio holdings. |
During the fiscal year ended September 30, 2021, the Fund did not have material transfers into or out of Level 3.
Additional Information to Evaluate Qualitative Information.
General. The Fund uses recognized industry pricing services – approved by the Board and unaffiliated with the Adviser – to value most of its securities, and uses broker quotes provided by market makers of securities not valued by these and other recognized pricing sources. Several different pricing feeds are received to value domestic equity securities, international equity securities, preferred equity securities, and fixed income securities. The data within these feeds are ultimately sourced from major stock exchanges and trading systems where these securities trade. The prices supplied by external sources are checked by obtaining quotations or actual transaction prices from market participants. If a price obtained from the pricing source is deemed unreliable, prices will be sought from another pricing service or from a broker/dealer that trades that security or similar securities.
15
The Gabelli Small Cap Growth Fund
Notes to Financial Statements (Continued)
Fair Valuation. Fair valued securities may be common or preferred equities, warrants, options, rights, or fixed income obligations. Where appropriate, Level 3 securities are those for which market quotations are not available, such as securities not traded for several days, or for which current bids are not available, or which are restricted as to transfer. When fair valuing a security, factors to consider include recent prices of comparable securities that are publicly traded, reliable prices of securities not publicly traded, the use of valuation models, current analyst reports, valuing the income or cash flow of the issuer, or cost if the preceding factors do not apply. A significant change in the unobservable inputs could result in a lower or higher value in Level 3 securities. The circumstances of Level 3 securities are frequently monitored to determine if fair valuation measures continue to apply.
The Adviser reports quarterly to the Board the results of the application of fair valuation policies and procedures. These may include backtesting the prices realized in subsequent trades of these fair valued securities to fair values previously recognized.
Foreign Currency Translations. The books and records of the Fund are maintained in U.S. dollars. Foreign currencies, investments, and other assets and liabilities are translated into U.S. dollars at current exchange rates. Purchases and sales of investment securities, income, and expenses are translated at the exchange rate prevailing on the respective dates of such transactions. Unrealized gains and losses that result from changes in foreign exchange rates and/or changes in market prices of securities have been included in unrealized appreciation/depreciation on investments and foreign currency translations. Net realized foreign currency gains and losses resulting from changes in exchange rates include foreign currency gains and losses between trade date and settlement date on investment securities transactions, foreign currency transactions, and the difference between the amounts of interest and dividends recorded on the books of the Fund and the amounts actually received. The portion of foreign currency gains and losses related to fluctuation in exchange rates between the initial purchase trade date and subsequent sale trade date is included in realized gain/(loss) on investments.
Foreign Securities. The Fund may directly purchase securities of foreign issuers. Investing in securities of foreign issuers involves special risks not typically associated with investing in securities of U.S. issuers. The risks include possible revaluation of currencies, the inability to repatriate funds, less complete financial information about companies, and possible future adverse political and economic developments. Moreover, securities of many foreign issuers and their markets may be less liquid and their prices more volatile than securities of comparable U.S. issuers.
Foreign Taxes. The Fund may be subject to foreign taxes on income, gains on investments, or currency repatriation, a portion of which may be recoverable. The Fund will accrue such taxes and recoveries as applicable, based upon its current interpretation of tax rules and regulations that exist in the markets in which it invests.
Restricted Securities. The Fund may invest up to 15% of its net assets in securities for which the markets are restricted. Restricted securities include securities whose disposition is subject to substantial legal or contractual restrictions. The sale of restricted securities often requires more time and results in higher brokerage charges or dealer discounts and other selling expenses than the sale of securities eligible for trading on national securities exchanges or in the over-the-counter markets. Restricted securities may sell at a price lower than similar securities that are not subject to restrictions on resale. Securities freely saleable among qualified institutional investors under special rules adopted by the SEC may be treated as liquid if they satisfy liquidity standards
16
The Gabelli Small Cap Growth Fund
Notes to Financial Statements (Continued)
established by the Board. The continued liquidity of such securities is not as well assured as that of publicly traded securities, and accordingly the Board will monitor their liquidity. At September 30, 2021, the Fund did not hold any restricted securities.
Investments in Other Investment Companies. The Fund may invest, from time to time, in shares of other investment companies (or entities that would be considered investment companies but are excluded from the definition pursuant to certain exceptions under the 1940 Act) (the Acquired Funds) in accordance with the 1940 Act and related rules. Shareholders in the Fund would bear the pro rata portion of the periodic expenses of the Acquired Funds in addition to the Fund’s expenses. For the fiscal year ended September 30, 2021, the Fund’s pro rata portion of the periodic expenses charged by the Acquired Funds was less than one basis point.
Securities Transactions and Investment Income. Securities transactions are accounted for on the trade date with realized gain/(loss) on investments determined by using the identified cost method. Interest income (including amortization of premium and accretion of discount) is recorded on an accrual basis. Premiums and discounts on debt securities are amortized using the effective yield to maturity method or amortized to earliest call date, if applicable. Dividend income is recorded on the ex-dividend date, except for certain dividends from foreign securities that are recorded as soon after the ex-dividend date as the Fund becomes aware of such dividends.
Determination of Net Asset Value and Calculation of Expenses. Certain administrative expenses are common to, and allocated among, various affiliated funds. Such allocations are made on the basis of each fund’s average net assets or other criteria directly affecting the expenses as determined by the Adviser pursuant to procedures established by the Board.
In calculating the NAV per share of each class, investment income, realized and unrealized gains and losses, redemption fees, and expenses other than class specific expenses are allocated daily to each class of shares based upon the proportion of net assets of each class at the beginning of each day. Distribution expenses are borne solely by the class incurring the expense.
Distributions to Shareholders. Distributions to shareholders are recorded on the ex-dividend date. Distributions to shareholders are based on income and capital gains as determined in accordance with federal income tax regulations, which may differ from income and capital gains as determined under GAAP. These differences are primarily due to differing treatments of income and gains as determined under the GAAP. Distributions from net investment income for federal income tax purposes include net realized gains on foreign currency transactions. These book/tax differences are either temporary or permanent in nature. To the extent these differences are permanent, adjustments are made to the appropriate capital accounts in the period when the differences arise. Permanent differences were primarily due the tax treatment of currency gains and losses, the adjustments for sales on investments in passive foreign investment companies, utilization of tax equalization, redesignation of dividends paid, and basis and capital gain adjustments on sale of Partnerships. These reclassifications have no impact on the NAV of the Fund. For the fiscal year ended September 30, 2021, reclassifications were made to increase paid-in capital by $21,654,530, with an offsetting adjustment to total distributable earnings.
17
The Gabelli Small Cap Growth Fund
Notes to Financial Statements (Continued)
The tax character of distributions paid during the fiscal years ended September 30, 2021 and 2020 was as follows:
| Year Ended September 30, 2021* | Year Ended September 30, 2020* | |||||||
| Distributions paid from: | ||||||||
| Ordinary income | $ | 373,251 | $ | 5,852,594 | ||||
| Net long term capital gains | 368,128,057 | 503,827,323 | ||||||
| Total distributions paid | $ | 368,501,308 | $ | 509,679,917 | ||||
| * | Total distributions paid differs from the Statement of Changes in Net Assets due to the utilization of equalization. |
Provision for Income Taxes. The Fund intends to continue to qualify as a regulated investment company under Subchapter M of the Internal Revenue Code of 1986, as amended (the Code). It is the policy of the Fund to comply with the requirements of the Code applicable to regulated investment companies and to distribute substantially all of its net investment company taxable income and net capital gains. Therefore, no provision for federal income taxes is required.
At September 30, 2021, the components of accumulated earnings/losses on a tax basis were as follows:
| Undistributed ordinary income | $ | 3,394,293 | ||
| Undistributed long term capital gains | 210,830,577 | |||
| Net unrealized appreciation on investments and foreign currency translations | 1,354,813,518 | |||
| Total | $ | 1,569,038,388 |
At September 30, 2021, the temporary difference between book basis and tax basis net unrealized appreciation on investments was due to deferral of losses from wash sales for tax purposes, mark-to-market adjustments on investments considered passive foreign investment companies, tax basis adjustments on investments in partnerships, and tax basis adjustments on investments in real estate investment trusts.
The following summarizes the tax cost of investments and the related net unrealized appreciation at September 30, 2021:
| Gross | Gross | ||||||
| Unrealized | Unrealized | Net Unrealized | |||||
| Cost | Appreciation | Depreciation | Appreciation | ||||
| Investments | $549,673,218 | $1,389,818,482 | $(35,010,070) | $1,354,808,412 |
The Fund is required to evaluate tax positions taken or expected to be taken in the course of preparing the Fund’s tax returns to determine whether the tax positions are “more-likely-than-not” of being sustained by the applicable tax authority. Income tax and related interest and penalties would be recognized by the Fund as tax expense in the Statement of Operations if the tax positions were deemed not to meet the more-likely-than-not threshold. For the fiscal year ended September 30, 2021, the Fund did not incur any income tax, interest, or penalties. As of September 30, 2021, the Adviser has reviewed all open tax years and concluded that there was
18
The Gabelli Small Cap Growth Fund
Notes to Financial Statements (Continued)
no impact to the Fund’s net assets or results of operations. The Fund’s federal and state tax returns for the prior three fiscal years remain open, subject to examination. On an ongoing basis, the Adviser will monitor the Fund’s tax positions to determine if adjustments to this conclusion are necessary.
3. Investment Advisory Agreement and Other Transactions. The Fund has entered into an investment advisory agreement (the Advisory Agreement) with the Adviser which provides that the Fund will pay the Adviser a fee, computed daily and paid monthly, at the annual rate of 1.00% of the value of its average daily net assets. In accordance with the Advisory Agreement, the Adviser provides a continuous investment program for the Fund’s portfolio, oversees the administration of all aspects of the Fund’s business and affairs, and pays the compensation of all Officers and Directors of the Fund who are affiliated persons of the Adviser.
There was a reduction in the advisory fee paid to the Adviser relating to certain portfolio holdings, i.e., unsupervised assets, of the Fund with respect to which the Adviser transferred dispositive and voting control to the Fund’s Proxy Voting Committee. During the fiscal year ended September 30, 2021, the Fund’s Proxy Voting Committee exercised control and discretion over all rights to vote or consent with respect to such securities, and the Adviser reduced its fee with respect to such securities by $126,227.
4. Distribution Plan. The Fund’s Board has adopted a distribution plan (the Plan) for each class of shares, except for Class I Shares, pursuant to Rule 12b-1 under the 1940 Act. Under the Class AAA, Class A, and Class C Share Plans, payments are authorized to G.distributors, LLC (the Distributor), an affiliate of the Adviser, at annual rates of 0.25%, 0.25%, and 1.00%, respectively, of the average daily net assets of those classes, the annual limitations under each Plan. Such payments are accrued daily and paid monthly.
5. Portfolio Securities. Purchases and sales of securities during the fiscal year ended September 30, 2021, other than short term securities and U.S. Government obligations, aggregated $16,008,602 and $403,216,789, respectively.
6. Transactions with Affiliates and Other Arrangements. During the fiscal year ended September 30, 2021, the Fund paid $44,034 in brokerage commissions on security trades to G.research, LLC, an affiliate of the Adviser. Additionally, the Distributor retained a total of $11,061 from investors representing commissions (sales charges and underwriting fees) on sales and redemptions of Fund shares.
During the fiscal year ended September 30, 2021, the Fund received credits from a designated broker who agreed to pay certain Fund operating expenses. The amount of such expenses paid through this directed brokerage arrangement during this period was $17,672.
The cost of calculating the Fund’s NAV per share is a Fund expense pursuant to the Advisory Agreement. During the fiscal year ended September 30, 2021, the Fund accrued $45,000 in connection with the cost of computing the Fund’s NAV.
The Corporation pays retainer and per meeting fees to Directors not affiliated with the Adviser, plus specified amounts to the Lead Director and Audit Committee Chairman. Directors are also reimbursed for out of pocket expenses incurred in attending meetings. Directors who are directors or employees of the Adviser or an affiliated company receive no compensation or expense reimbursement from the Corporation.
19
The Gabelli Small Cap Growth Fund
Notes to Financial Statements (Continued)
7. Line of Credit. The Fund participates in an unsecured line of credit, which expires on March 2, 2022 and may be renewed annually, of up to $75,000,000 under which it may borrow up to 10% of its net assets from the custodian for temporary borrowing purposes. Borrowings under this arrangement bear interest at a floating rate equal to the higher of the Overnight Federal Funds Rate plus 135 basis points or the Overnight Bank Funding Rate plus 135 basis points in effect on that day. This amount, if any, would be included in “Interest expense” in the Statement of Operations. At September 30, 2021, there was $3,705,000 outstanding under the line of credit.
The average daily amount of borrowings outstanding under the line of credit during the fiscal year ended September 30, 2021 was $4,399,655 with a weighted average interest rate of 1.28%. The maximum amount borrowed at any time during the fiscal year ended September 30, 2021 was $41,179,000.
8. Capital Stock. The Fund offers four classes of shares – Class AAA Shares, Class A Shares, Class C Shares, and Class I Shares. Class AAA and Class I Shares are offered without a sales charge. Class A Shares are subject to a maximum front-end sales charge of 5.75%. Class C Shares are subject to a 1.00% contingent deferred sales charge for one year after purchase.
The Fund imposes a redemption fee of 2.00% on all classes of shares that are redeemed or exchanged on or before the seventh day after the date of a purchase. The redemption fee is deducted from the proceeds otherwise payable to the redeeming shareholders and is retained by the Fund as an increase in paid-in capital. The redemption fees retained by the Fund during the fiscal years ended September 30, 2021 and 2020, if any, can be found in the Statement of Changes in Net Assets under Redemption Fees.
20
The Gabelli Small Cap Growth Fund
Notes to Financial Statements (Continued)
Transactions in shares of capital stock were as follows:
| Year Ended | Year Ended | |||||||||||||||
| September 30, 2021 | September 30, 2020 | |||||||||||||||
| Shares | Amount | Shares | Amount | |||||||||||||
| Class AAA | ||||||||||||||||
| Shares sold | 580,407 | $ | 27,170,660 | 598,564 | $ | 24,465,838 | ||||||||||
| Shares issued upon reinvestment of distributions | 4,663,083 | 185,171,154 | 4,774,548 | 218,340,063 | ||||||||||||
| Shares redeemed | (4,404,600 | ) | (202,532,467 | ) | (8,012,510 | ) | (338,648,645 | ) | ||||||||
| Net increase/(decrease) | 838,890 | $ | 9,809,347 | (2,639,398 | ) | $ | (95,842,744 | ) | ||||||||
| Class A | ||||||||||||||||
| Shares sold | 596,881 | $ | 27,627,213 | 645,315 | $ | 29,221,937 | ||||||||||
| Shares issued upon reinvestment of distributions | 509,988 | 20,231,248 | 665,223 | 30,394,069 | ||||||||||||
| Shares redeemed | (968,174 | ) | (45,254,168 | ) | (1,903,125 | ) | (82,808,198 | ) | ||||||||
| Net increase/(decrease) | 138,695 | $ | 2,604,293 | (592,587 | ) | $ | (23,192,192 | ) | ||||||||
| Class C | ||||||||||||||||
| Shares sold | 113,421 | $ | 4,140,636 | 151,481 | $ | 5,540,011 | ||||||||||
| Shares issued upon reinvestment of distributions | 588,946 | 18,439,890 | 670,396 | 25,615,826 | ||||||||||||
| Shares redeemed | (1,092,311 | ) | (40,391,190 | ) | (1,756,395 | ) | (64,743,212 | ) | ||||||||
| Net decrease | (389,944 | ) | $ | (17,810,664 | ) | (934,518 | ) | $ | (33,587,375 | ) | ||||||
| Class I | ||||||||||||||||
| Shares sold | 1,947,762 | $ | 95,525,742 | 2,748,459 | $ | 121,429,673 | ||||||||||
| Shares issued upon reinvestment of distributions | 2,640,278 | 108,858,645 | 2,942,208 | 138,342,624 | ||||||||||||
| Shares redeemed | (4,842,756 | ) | (232,908,464 | ) | (9,070,988 | ) | (397,321,732 | ) | ||||||||
| Net decrease | (254,716 | ) | $ | (28,524,077 | ) | (3,380,321 | ) | $ | (137,549,435 | ) | ||||||
21
The Gabelli Small Cap Growth Fund
Notes to Financial Statements (Continued)
9. Transactions in Securities of Affiliated Issuers. The 1940 Act defines affiliated issuers as those in which a Fund’s holdings of an issuer represent 5% or more of the outstanding voting securities of the issuer. A summary of the Fund’s transactions in the securities of these issuers during the fiscal year ended September 30, 2021 is set forth below:
Market Value at September 30, 2020 | Purchases | Sales Proceeds | Realized Gain/ (Loss) | Change In Unrealized Appreciation | Market Value at September 30, 2021 | Dividend Income | Percent Owned of Shares | |||||||||||||||||||||||||
| Bel Fuse Inc., Cl. A | $ | 2,408,400 | — | $ | 31,450 | $ | (35,958 | ) | $ | 731,314 | $ | 3,072,306 | $ | 51,468 | 9.83 | % | ||||||||||||||||
| Indus Realty Trust Inc., REIT* | 13,843,550 | $ | 507,965 | 330,981 | — | — | — | — | — | |||||||||||||||||||||||
| Strattec Security Corp.† | 4,923,260 | 48,493 | 203,941 | 46,690 | 4,677,098 | 9,491,600 | — | 6.19 | % | |||||||||||||||||||||||
| Trans-Lux Corp.† | 347,800 | — | 22,371 | (104,129 | ) | 456,031 | 677,331 | — | 11.99 | % | ||||||||||||||||||||||
| Total | $ | (93,397 | ) | $ | 5,864,443 | $ | 13,241,237 | $ | 51,468 | |||||||||||||||||||||||
| * | Name change from Griffin Industrial Realty Inc. Security is no longer considered affiliated at September 30, 2021. |
| † | Non-income producing security. |
10. Indemnifications. The Fund enters into contracts that contain a variety of indemnifications. The Fund’s maximum exposure under these arrangements is unknown. However, the Fund has not had prior claims or losses pursuant to these contracts. Management has reviewed the Fund’s existing contracts and expects the risk of loss to be remote.
11. Subsequent Events. Management has evaluated the impact on the Fund of all subsequent events occurring through the date the financial statements were issued and has determined that there were no subsequent events requiring recognition or disclosure in the financial statements.
22
The Gabelli Small Cap Growth Fund
Report of Independent Registered Public Accounting Firm
To the Shareholders of The Gabelli Small Cap Growth Fund
and the Board of Directors of Gabelli Equity Series Funds, Inc.
Opinion on the Financial Statements
We have audited the accompanying statement of assets and liabilities of The Gabelli Small Cap Growth Fund (the “Fund”) (one of the funds constituting Gabelli Equity Series Funds, Inc. (the “Corporation”)), including the summary schedule of investments, as of September 30, 2021, and the related statement of operations for the year then ended, the statements of changes in net assets for each of the two years in the period then ended, the financial highlights for each of the five years in the period then ended and the related notes (collectively referred to as the “financial statements”). In our opinion, the financial statements present fairly, in all material respects, the financial position of the Fund (one of the funds constituting Gabelli Equity Series Funds, Inc.) at September 30, 2021, the results of its operations for the year then ended, the changes in its net assets for each of the two years in the period then ended and its financial highlights for each of the five years in the period then ended, in conformity with U.S. generally accepted accounting principles.
Basis for Opinion
These financial statements are the responsibility of the Corporation’s management. Our responsibility is to express an opinion on the Fund’s financial statements based on our audits. We are a public accounting firm registered with the Public Company Accounting Oversight Board (United States) (“PCAOB”) and are required to be independent with respect to the Corporation in accordance with the U.S. federal securities laws and the applicable rules and regulations of the Securities and Exchange Commission and the PCAOB.
We conducted our audits in accordance with the standards of the PCAOB. Those standards require that we plan and perform the audit to obtain reasonable assurance about whether the financial statements are free of material misstatement, whether due to error or fraud. The Corporation is not required to have, nor were we engaged to perform, an audit of the Corporation’s internal control over financial reporting. As part of our audits we are required to obtain an understanding of internal control over financial reporting but not for the purpose of expressing an opinion on the effectiveness of the Corporation’s internal control over financial reporting. Accordingly, we express no such opinion.
Our audits included performing procedures to assess the risks of material misstatement of the financial statements, whether due to error or fraud, and performing procedures that respond to those risks. Such procedures included examining, on a test basis, evidence regarding the amounts and disclosures in the financial statements. Our procedures included confirmation of securities owned as of September 30, 2021, by correspondence with the custodian or by other appropriate auditing procedures where replies from brokers were not received. Our audits also included evaluating the accounting principles used and significant estimates made by management, as well as evaluating the overall presentation of the financial statements. We believe that our audits provide a reasonable basis for our opinion.

We have served as the auditor of one or more Gabelli/GAMCO Funds investment companies since 1992.
Philadelphia, Pennsylvania
November 24, 2021
23
The Gabelli Small Cap Growth Fund
Liquidity Risk Management Program (Unaudited)
In accordance with Rule 22e-4 under the 1940 Act, the Fund has established a liquidity risk management program (the LRM Program) to govern its approach to managing liquidity risk. The LRM Program is administered by the Liquidity Committee (the Committee), which is comprised of members of Gabelli Funds, LLC management. The Board has designated the Committee to administer the LRM Program.
The LRM Program’s principal objectives include supporting the Fund’s compliance with limits on investments in illiquid assets and mitigating the risk that the Fund will be unable to meet its redemption obligations in a timely manner. The LRM Program also includes elements that support the management and assessment of liquidity risk, including an annual assessment of factors that influence the Fund’s liquidity and the monthly classification and re-classification of certain investments that reflect the Committee’s assessment of their relative liquidity under current market conditions.
At a meeting of the Board held on May 12, 2021, the Board received a written report from the Committee regarding the design and operational effectiveness of the LRM Program. The Committee determined, and reported to the Board, that the LRM Program is reasonably designed to assess and manage the Fund’s liquidity risk and has operated adequately and effectively since its implementation. The Committee reported that there were no liquidity events that impacted the Fund or its ability to timely meet redemptions without dilution to existing shareholders. The Committee noted that the Fund is primarily invested in highly liquid securities and, accordingly, continues to be exempt from the requirement to determine a “highly liquid investment minimum” as defined in the Rule 22e-4. Because of that continued qualification for the exemption, the Fund has not adopted a “highly liquid investment minimum” amount. The Committee further noted that while changes to the LRM Program were made during the Review Period and reported to the Board, no material changes were made to the LRM Program as a result of the Committee’s annual review.
There can be no assurance that the LRM Program will achieve its objectives in the future. Please refer to the Fund’s Prospectus for more information regarding its exposure to liquidity risk and other principal risks to which an investment in the Fund may be subject.
24
The Gabelli Small Cap Growth Fund
Additional Fund Information (Unaudited)
The business and affairs of the Corporation are managed under the direction of the Corporation’s Board of Directors. Information pertaining to the Directors and officers of the Corporation is set forth below. The Corporation’s Statement of Additional Information includes additional information about the Corporation’s Directors and is available without charge, upon request, by calling 800-GABELLI (800-422-3554) or by writing to The Gabelli Small Cap Growth Fund at One Corporate Center, Rye, NY 10580-1422.
| Number of | ||||
| Funds | ||||
| in Fund | ||||
| Name, Position(s) | Term of Office | Complex | ||
| Address1 | and Length of | Overseen by | Principal Occupation(s) | Other Directorships |
| and Age | Time Served2 | Director | During Past Five Years | Held by Director3 |
| INTERESTED DIRECTORS4: | ||||
| Mario J. Gabelli, CFA Director and Chief Investment Officer Age: 79 | Since 1991 | 32 | Chairman, Chief Executive Officer, and Chief Investment Officer– Value Portfolios of GAMCO Investors, Inc. and Chief Investment Officer– Value Portfolios of Gabelli Funds, LLC and GAMCO Asset Management Inc.; Director/ Trustee or Chief Investment Officer of other registered investment companies within the Fund Complex; Chief Executive Officer of GGCP, Inc.; Executive Chairman of Associated Capital Group, Inc. | Director of Morgan Group Holdings, Inc. (holding company); Chairman of the Board and Chief Executive Officer of LICT Corp. (multimedia and communication services company); Director of CIBL, Inc. (broadcasting and wireless communications); Director of ICTC Group Inc.(communications) (2013- 2018) |
| John D. Gabelli Director Age: 77 | Since 1991 | 12 | Former Senior Vice President of G.research, LLC | — |
| INDEPENDENT DIRECTORS5: | ||||
| Elizabeth C. Bogan Director Age: 77 | Since 2019 | 12 | Senior Lecturer in Economics at Princeton University | — |
| Anthony J. Colavita6 Director Age: 85 | Since 1991 | 18 | President of the law firm of Anthony J. Colavita, P.C. | — |
| Vincent D. Enright Director Age: 77 | Since 1991 | 17 | Former Senior Vice President and Chief Financial Officer of KeySpan Corp. (public utility) (1994-1998) | Director of Echo Therapeutics, Inc. (therapeutics and diagnostics) (2008-2014); Director of The LGL Group, Inc. (diversified manufacturing) (2011-2014) |
| Robert J. Morrissey Director Age: 82 | Since 1991 | 7 | Partner in the law firm of Morrissey, Hawkins & Lynch | Chairman of the Board of Directors, Belmont Savings Bank |
| Kuni Nakamura Director Age: 53 | Since 2009 | 35 | President of Advanced Polymer, Inc. (chemical manufacturing company);President of KEN Enterprises, Inc. (real estate); Trustee on Long Island University Board of Trustees | — |
25
The Gabelli Small Cap Growth Fund
Additional Fund Information (Continued) (Unaudited)
| Number of | ||||
| Funds | ||||
| in Fund | ||||
| Name, Position(s) | Term of Office | Complex | ||
| Address1 | and Length of | Overseen by | Principal Occupation(s) | Other Directorships |
| and Age | Time Served2 | Director | During Past Five Years | Held by Director3 |
| Anthonie C. van Ekris6 Director Age: 87 | Since 1991 | 23 | Chairman and Chief Executive Officer of BALMAC International, Inc.(global import/export company) | — |
| Salvatore J. Zizza7 Director Age: 75 | Since 2001 | 32 | President of Zizza & Associates Corp. (private holding company); Chairman of Bergen Cove Realty Inc. (residential real estate) | Director and Chairman of Trans-Lux Corporation (business services); Director and Chairman of Harbor Diversified Inc. (pharmaceuticals) (2009-2018); Retired Chairman of BAM (semiconductor and aerospace manufacturing) |
26
The Gabelli Small Cap Growth Fund
Additional Fund Information (Continued) (Unaudited)
| Name, Position(s) | Term of Office | |
| Address1 | and Length of | Principal Occupation(s) |
| and Age | Time Served2 | During Past Five Years |
| OFFICERS: | ||
| Bruce N. Alpert President Age: 69 | Since 1991 | Executive Vice President and Chief Operating Officer of Gabelli Funds, LLC since 1988; Officer of registered investment companies within the Fund Complex; Senior Vice President of GAMCO Investors, Inc. since 2008; Vice President – Mutual Funds, G.research, LLC |
| John C. Ball Treasurer Age: 45 | Since 2017 | Treasurer of registered investment companies within the Fund Complex since 2017; Vice President and Assistant Treasurer of AMG Funds, 2014-2017; Chief Executive Officer, G.distributors, LLC since December 2020 |
| Peter Goldstein Secretary and Vice President Age: 68 | Since 2020 | General Counsel, Gabelli Funds, LLC since July 2020; General Counsel and Chief Compliance Officer, Buckingham Capital Management, Inc. (2012-2020); Chief Legal Officer and Chief Compliance Officer, The Buckingham Research Group, Inc. (2012-2020) |
| Richard J. Walz Chief Compliance Officer Age: 62 | Since 2013 | Chief Compliance Officer of registered investment companies within the Fund Complex since 2013; Chief Compliance Officer for Gabelli Funds, LLC since 2015 |
| Daniel Plourde Vice President Age: 41 | Since 2021 | Vice President of registered investment companies within the Fund Complex since 2021; Assistant Treasurer of the North American SPDR ETFs and State Street Global Advisors Mutual Funds (2017-2021); Fund Administration at State Street Bank (2009-2017) |
| 1 | Address: One Corporate Center, Rye, NY 10580-1422, unless otherwise noted. |
| 2 | Each Director will hold office for an indefinite term until the earliest of (i) the next meeting of shareholders, if any, called for the purpose of considering the election or re-election of such Director and until the election and qualification of his or her successor, if any, elected at such meeting, or (ii) the date a Director resigns or retires, or a Director is removed by the Board of Directors or shareholders, in accordance with the Fund’s By-Laws and Articles of Incorporation. For officers, includes time served in prior officer positions with the Fund. Each officer will hold office for an indefinite term until the date he or she resigns or retires or until his or her successor is elected and qualified. |
| 3 | This column includes only directorships of companies required to report to the SEC under the Securities Exchange Act of 1934, as amended, i.e., public companies, or other investment companies registered under the 1940 Act. |
| 4 | “Interested person” of the Fund as defined in the 1940 Act. Messrs. Gabelli are each considered an “interested person” because of their affiliation with Gabelli Funds, LLC which acts as the Fund’s investment adviser. Mario J. Gabelli and John D. Gabelli are brothers. |
| 5 | Directors who are not interested persons are considered “Independent” Directors. |
| 6 | Mr. Colavita’s son, Anthony S. Colavita, serves as a director of other funds in the Gabelli/GAMCO Fund Complex. Mr. van Ekris is an independent director of Gabelli International Ltd., Gabelli Fund, LDC, GAMA Capital Opportunities Master, Ltd., and GAMCO International SICAV, which may be deemed to be controlled by Mario J. Gabelli and/or affiliates and in that event would be deemed to be under common control with the Fund’s Adviser. |
| 7 | Mr. Zizza is an independent director of Gabelli International Ltd., which may be deemed to be controlled by Mario J. Gabelli and/or affiliates and in that event would be deemed to be under common control with the Fund’s Adviser. On September 9, 2015, Mr. Zizza entered into a settlement with the SEC to resolve an inquiry relating to an alleged violation regarding the making of false statements or omissions to the accountants of a company concerning a related party transaction. The company in question is not an affiliate of, nor has any connection to, the Fund. Under the terms of the settlement, Mr. Zizza, without admitting or denying the SEC’s findings and allegation, paid $150,000 and agreed to cease and desist committing or causing any future violations of Rule 13b2-2 of the Securities Exchange Act of 1934, as amended. The Board has discussed this matter and has determined that it does not disqualify Mr. Zizza from serving as an Independent Director. |
27
THE GABELLI SMALL CAP GROWTH FUND
2021 TAX NOTICE TO SHAREHOLDERS (Unaudited)
For the fiscal year ended September 30, 2020, the Fund paid to shareholders long term capital gains totaling $368,128,057 or the maximum allowable. The distribution of long term capital gains has been designated as a capital gain dividend by the Fund’s Board of Directors.
All designations are based on financial information available as of the date of this annual report and, accordingly, are subject to change. For each item, it is the intention of the Fund to designate the maximum amount permitted under the Internal Revenue Code and the regulations thereunder.
|
Gabelli Funds and Your Personal Privacy
Who are we?
The Gabelli Funds are investment companies registered with the Securities and Exchange Commission under the Investment Company Act of 1940. We are managed by Gabelli Funds, LLC, which is affiliated with GAMCO Investors, Inc., a publicly held company with subsidiaries and affiliates that provide investment advisory services for a variety of clients.
What kind of non-public information do we collect about you if you become a fund shareholder?
If you apply to open an account directly with us, you will be giving us some non-public information about yourself. The non-public information we collect about you is:
| ● | Information you give us on your application form. This could include your name, address, telephone number, social security number, bank account number, and other information. |
| ● | Information about your transactions with us, any transactions with our affiliates, and transactions with the entities we hire to provide services to you. This would include information about the shares that you buy or redeem. If we hire someone else to provide services — like a transfer agent — we will also have information about the transactions that you conduct through them. |
What information do we disclose and to whom do we disclose it?
We do not disclose any non-public personal information about our customers or former customers to anyone other than our affiliates, our service providers who need to know such information, and as otherwise permitted by law. If you want to find out what the law permits, you can read the privacy rules adopted by the Securities and Exchange Commission. They are in volume 17 of the Code of Federal Regulations, Part 248. The Commission often posts information about its regulations on its website, www.sec.gov.
What do we do to protect your personal information?
We restrict access to non-public personal information about you to the people who need to know that information in order to provide services to you or the fund and to ensure that we are complying with the laws governing the securities business. We maintain physical, electronic, and procedural safeguards to keep your personal information confidential.
This page was intentionally left blank.
THE GABELLI SMALL CAP GROWTH FUND
One Corporate Center
Rye, NY 10580-1422
Portfolio Management Team
Mario J. Gabelli, CFA, is Chairman, Chief Executive Officer, and Chief Investment Officer - Value Portfolios of GAMCO Investors, Inc. that he founded in 1977, and Chief Investment Officer - Value Portfolios of Gabelli Funds, LLC and GAMCO Asset Management Inc. He is also Executive Chairman of Associated Capital Group, Inc. Mr. Gabelli is a summa cum laude graduate of Fordham University and holds an MBA degree from Columbia Business School and Honorary Doctorates from Fordham University and Roger Williams University.
Gordon Grender joined GAMCO UK in 2020 as a portfolio manager. Prior to joining the Firm, Mr. Grender served as the portfolio manager for a U.S. equity fund at GAM International Ltd.
| We have separated the portfolio managers’ commentary from the financial statements and investment portfolio due to corporate governance regulations stipulated by the Sarbanes-Oxley Act of 2002. We have done this to ensure that the contents of the portfolio manager’s commentary are unrestricted. Both the commentary and the financial statements, including the portfolios of investments, will be available on our website at www.gabelli.com. |
Gabelli Equity Series Funds, Inc.
THE GABELLI SMALL CAP GROWTH FUND
One Corporate Center
Rye, New York 10580-1422
t 800-GABELLI (800-422-3554)
f 914-921-5118
e info@gabelli.com
GABELLI.COM
Net Asset Values per share available daily
by calling 800-GABELLI after 7:00 P.M.
| BOARD OF DIRECTORS | Salvatore J. Zizza |
| Mario J. Gabelli, CFA | Chairman, |
| Chairman and | Zizza & Associates Corp. |
| Chief Executive Officer, | |
| GAMCO Investors, Inc. | OFFICERS |
| Executive Chairman, | Bruce N. Alpert |
| Associated Capital Group Inc. | President |
| Elizabeth C. Bogan | John C. Ball |
| Senior Lecturer, | Treasurer |
| Princeton University | |
| Peter Goldstein | |
| Anthony J. Colavita | Secretary and Vice President |
| President, | |
| Anthony J. Colavita, P.C. | Richard J. Walz |
| Chief Compliance Officer | |
| Vincent D. Enright | |
| Former Senior Vice President | Daniel Plourde |
| and Chief Financial Officer, | Vice President |
| Keyspan Corp. | |
| DISTRIBUTOR | |
| John D. Gabelli | G.distributors, LLC |
| Former Senior Vice President, | |
| G.research, LLC | CUSTODIAN |
| State Street Bank and Trust | |
| Robert J. Morrissey | Company |
| Partner, | |
| Morrissey, Hawkins & Lynch | TRANSFER AGENT AND |
| DIVIDEND DISBURSING | |
| Kuni Nakamura | AGENT |
| President, | DST Asset Manager |
| Advanced Polymer, Inc. | Solutions, Inc. |
| Anthonie C. van Ekris | LEGAL COUNSEL |
| Chairman, | Skadden, Arps, Slate, Meagher & |
| BALMAC International, Inc. | Flom LLP |
| This report is submitted for the general information of the shareholders of The Gabelli Small Cap Growth Fund. It is not authorized for distribution to prospective investors unless preceded or accompanied by an effective prospectus. |
GAB443Q321AR

The Gabelli Focused Growth and
Annual Report — September 30, 2021 |  Daniel M. Miller Portfolio Manager GAMCO Investors BS, University of Miami |
To Our Shareholders,
For the fiscal year ended September 30, 2021, the net asset value (NAV) total return per Class I Share of The Gabelli Focused Growth and Income Fund (formerly The Gabelli Focus Five Fund) was 46.2% compared with a total return of 28.7% for the Lipper Equity Income Fund Average. Other classes of shares are available. See page 3 for performance information for all classes.
Enclosed are the financial statements, including the schedule of investments, as of September 30, 2021.
Investment Objective and Strategy (Unaudited)
The Gabelli Focused Growth and Income Fund is a concentrated, actively managed strategy. The Fund invests in a global portfolio of common and preferred equities, REITs, bonds, and other securities that have the potential for capital appreciation while emphasizing a high level of current net investment income. The Fund has a managed, monthly distribution, currently set at $0.06 per share.
Performance Discussion (Unaudited)
As a Fund with a concentrated portfolio of holdings, stock selection is an important element of performance as the Fund is driven more by the results of the companies selected rather than the movement of the overall market.
| As permitted by regulations adopted by the Securities and Exchange Commission, paper copies of the Fund’s annual and semiannual shareholder reports will no longer be sent by mail, unless you specifically request paper copies of the reports. Instead, the reports will be made available on the Fund’s website (www.gabelli.com), and you will be notified by mail each time a report is posted and provided with a website link to access the report. If you already elected to receive shareholder reports electronically, you will not be affected by this change and you need not take any action. To elect to receive all future reports on paper free of charge, please contact your financial intermediary, or, if you invest directly with the Fund, you may call 800-422-3554 or send an email request to info@gabelli.com. |
Some of the better performing investments during the fiscal year were: Herc Holdings Inc. (3.66% of net assets as of September 30, 2021), MGM Growth Properties LLC (8.38%), and Option Care Health Inc. (2.83%). Bonita Springs, Florida based Herc operates through its subsidiaries, as a full service equipment rental firm, which rents earth moving equipment and aerial lifts, among many other items. In addition to the rental business Herc also provides industry specific solution based services. MGM Growth Properties is one of the leading publicly traded real estate investment trusts (REIT). The company’s high quality assets, competent management team, and strong balance sheet set them apart from other REITs. Option Care Health is a leading provider of healthcare management solutions with a commitment to bring infusion therapy services into the home or alternate-site settings.
A few of our weaker performers were Ontrak Inc. (1.14%), EchoStar Corp (no longer held) and Liberty Broadband (no longer held). Ontrak is a leading AI and technology-enabled behavioral health company, offering virtualized outpatient healthcare. EchoStar together with its subsidiaries, provides broadband satellite technologies and broadband internet services. Liberty Broadband, a cable operator, provides internet, video and voice services to residential and business customers in the U.S., they are the owner of cable operator Charter Communications.
We appreciate your confidence and trust.
2
Comparative Results
Average Annual Returns through September 30, 2021 (a)(b) (Unaudited)
Average annual returns reflect changes in share price, reinvestment of distributions, and are net of expenses.
| Since | |||||||||||||||
| Inception | |||||||||||||||
| 1 Year | 3 Year | 5 Year | 10 Year | (12/31/02) | |||||||||||
| Class I (GWSIX) (c) | 46.21 | % | 9.89 | % | 6.50 | % | 10.30 | % | 7.82 | % | |||||
| Class AAA (GWSVX) | 44.76 | 9.32 | 6.06 | 9.93 | 7.57 | ||||||||||
| S&P MidCap 400 Index (d) | 43.68 | 11.08 | 12.97 | 14.72 | 11.78 | ||||||||||
| Lipper Equity Income Fund Average (d) | 28.68 | 10.41 | 11.49 | 12.71 | 9.04 | ||||||||||
| Class A (GWSAX) | 44.82 | 9.37 | 6.09 | 9.95 | 7.60 | ||||||||||
| With sales charge (e) | 36.50 | 7.24 | 4.84 | 9.30 | 7.25 | ||||||||||
| Class C (GWSCX) | 43.75 | 8.55 | 5.29 | 9.13 | 6.81 | ||||||||||
| With contingent deferred sales charge (f) | 42.75 | 8.55 | 5.29 | 9.13 | 6.81 | ||||||||||
| (a) | The Fund’s fiscal year ends September 30. |
| (b) | Returns would have been lower had the Adviser not reimbursed certain expenses of the Fund. The Fund imposes a 2% redemption fee on shares sold or exchanged within seven days of purchase. |
| (c) | The Class AAA Share NAVs are used to calculate performance for the periods prior to the issuance of Class I Shares on January 11, 2008. The actual performance of Class I Shares would have been higher due to lower expenses associated with this class of shares. |
| (d) | The S&P Midcap 400 Index is an index comprised of U.S. stocks in the middle capitalization range, which is generally considered to be between $200 million and $5 billion in market value. The Lipper Equity Income Fund Average includes the 30 largest equity funds in this category tracked by Lipper, Inc. Dividends are considered reinvested. You cannot invest directly in an index. |
| (e) | Performance results include the effect of the maximum 5.75% sales charge at the beginning of the period. |
| (f) | Assuming payment of the 1% maximum contingent deferred sales charge imposed on redemptions made within one year of purchase. |
In the current prospectuses dated January 28, 2021, the expense ratios for Class AAA, A, C, and I Shares are 1.71%, 1.71%, 2.46%, and 1.46%, respectively, and the net expense ratios for these share classes after contractual reimbursements by Gabelli Funds, LLC, (the Adviser) are 1.71%, 1.71%, 2.46%, and 0.80%, respectively. See page 11 for the expense ratios for the year ended September 30, 2021. Class AAA and Class I Shares have no sales charge. The maximum sales charge for Class A Shares and Class C Shares is 5.75% and 1.00%, respectively.
Investors should carefully consider the investment objectives, risks, charges, and expenses of the Fund before investing. The prospectuses contain information about these and other matters and should be read carefully before investing. To obtain a prospectus, please visit our website at www.gabelli.com.
Returns represent past performance and do not guarantee future results. Investment returns and the principal value of an investment will fluctuate. When shares are redeemed, they may be worth more or less than their original cost. Current performance may be lower or higher than the performance data presented. Visit www.gabelli.com for performance information as of the most recent month end.
3
COMPARISON OF CHANGE IN VALUE OF A $10,000 INVESTMENT IN
THE GABELLI FOCUSED GROWTH AND INCOME FUND (CLASS AAA SHARES)
AND S&P MIDCAP 400 INDEX (Unaudited)
| Average Annual Total Returns* | |||
| 1 Year | 5 Year | 10 Year | |
| Class AAA | 44.76% | 6.06% | 9.93% |
* Past performance is not predictive of future results. The performance tables and graph do not reflect the deduction of taxes that a shareholder would pay on Fund distributions or the redemption of Fund shares.
4
The Gabelli Focused Growth and Income Fund Disclosure of Fund Expenses (Unaudited) For the Six Month Period from April 1, 2021 through September 30, 2021 | Expense Table |
We believe it is important for you to understand the impact of fees and expenses regarding your investment. All mutual funds have operating expenses. As a shareholder of a fund, you incur ongoing costs, which include costs for portfolio management, administrative services, and shareholder reports (like this one), among others. Operating expenses, which are deducted from a fund’s gross income, directly reduce the investment return of a fund. When a fund’s expenses are expressed as a percentage of its average net assets, this figure is known as the expense ratio. The following examples are intended to help you understand the ongoing costs (in dollars) of investing in your Fund and to compare these costs with those of other mutual funds. The examples are based on an investment of $1,000 made at the beginning of the period shown and held for the entire period.
The Expense Table below illustrates your Fund’s costs in two ways:
Actual Fund Return: This section provides information about actual account values and actual expenses. You may use this section to help you to estimate the actual expenses that you paid over the period after any fee waivers and expense reimbursements. The “Ending Account Value” shown is derived from the Fund’s actual return during the past six months, and the “Expenses Paid During Period” shows the dollar amount that would have been paid by an investor who started with $1,000 in the Fund. You may use this information, together with the amount you invested, to estimate the expenses that you paid over the period.
To do so, simply divide your account value by $1,000 (for example, an $8,600 account value divided by $1,000 = 8.6), then multiply the result by the number given for your Fund under the heading “Expenses Paid During Period” to estimate the expenses you paid during this period.
Hypothetical 5% Return: This section provides information about hypothetical account values and hypothetical expenses based on the Fund’s actual expense ratio. It assumes a hypothetical annualized return of 5% before expenses during the period shown. In this case – because the hypothetical return used is not the Fund’s actual return – the results do not apply to your investment and you cannot use the hypothetical account value and expense to estimate the actual ending account balance or expenses you
paid for the period. This example is useful in making comparisons of the ongoing costs of investing in the Fund and other funds. To do so, compare this 5% hypothetical example with the 5% hypothetical examples that appear in shareholder reports of other funds.
Please note that the expenses shown in the table are meant to highlight your ongoing costs only and do not reflect any transactional costs such as sales charges (loads), redemption fees, or exchange fees, if any, which are described in the Prospectus. If these costs were applied to your account, your costs would be higher. Therefore, the 5% hypothetical return is useful in comparing ongoing costs only, and will not help you determine the relative total costs of owning different funds. The “Annualized Expense Ratio” represents the actual expenses for the last six months and may be different from the expense ratio in the Financial Highlights which is for the fiscal year ended September 30, 2021.
| Beginning Account Value 04/01/21 | Ending Account Value 09/30/21 | Annualized Expense Ratio | Expenses Paid During Period* | |||||
| The Gabelli Focused Growth and Income Fund | ||||||||
| Actual Fund Return | ||||||||
| Class AAA | $1,000.00 | $1,096.50 | 2.25% | $ 11.83 | ||||
| Class A | $1,000.00 | $1,097.30 | 2.15% | $ 11.30 | ||||
| Class C | $1,000.00 | $1,092.80 | 2.91% | $ 15.27 | ||||
| Class I | $1,000.00 | $1,104.70 | 0.80% | $ 4.22 | ||||
| Hypothetical 5% Return | ||||||||
| Class AAA | $1,000.00 | $1,013.79 | 2.25% | $ 11.36 | ||||
| Class A | $1,000.00 | $1,014.29 | 2.15% | $ 10.86 | ||||
| Class C | $1,000.00 | $1,010.48 | 2.91% | $ 14.67 | ||||
| Class I | $1,000.00 | $1,021.06 | 0.80% | $ 4.05 | ||||
| * | Expenses are equal to the Fund’s annualized expense ratio for the last six months multiplied by the average account value over the period, multiplied by the number of days in the most recent fiscal half year (183 days), then divided by 365. |
5
Summary of Portfolio Holdings (Unaudited)
The following table presents portfolio holdings as a percent of net assets as of September 30, 2021:
The Gabelli Focused Growth and Income Fund
| Energy and Utilities | 23.6 | % | ||
| Real Estate Investment Trusts | 15.2 | % | ||
| Financial Services | 13.8 | % | ||
| Food and Beverage | 9.2 | % | ||
| Health Care | 7.4 | % | ||
| Diversified Industrial | 4.5 | % | ||
| Retail | 4.3 | % | ||
| Building and Construction | 3.7 | % | ||
| Telecommunications | 3.3 | % | ||
| Computer Software and Services | 3.0 | % |
| Automotive: Parts and Accessories | 2.9 | % | ||
| Entertainment | 2.6 | % | ||
| Cable and Satellite | 1.9 | % | ||
| U.S. Government Obligations | 1.8 | % | ||
| Consumer Products | 1.0 | % | ||
| Automotive | 0.9 | % | ||
| Aerospace and Defense | 0.8 | % | ||
| Other Assets and Liabilities (Net) | 0.1 | % | ||
| 100.0 | % |
The Fund files a complete schedule of portfolio holdings with the Securities and Exchange Commission (the SEC) for the first and third quarters of each fiscal year on Form N-PORT. Shareholders may obtain this information at www.gabelli.com or by calling the Fund at 800-GABELLI (800-422-3554). The Fund’s Form N-PORT is available on the SEC’s website at www.sec.gov and may also be reviewed and copied at the SEC’s Public Reference Room in Washington, DC. Information on the operation of the Public Reference Room may be obtained by calling 800-SEC-0330.
Proxy Voting
The Fund files Form N-PX with its complete proxy voting record for the twelve months ended June 30, no later than August 31 of each year. A description of the Fund’s proxy voting policies, procedures, and how the Fund voted proxies relating to portfolio securities is available without charge, upon request, by (i) calling 800-GABELLI (800-422-3554); (ii) writing to The Gabelli Funds at One Corporate Center, Rye, NY 10580-1422; or (iii) visiting the SEC’s website at www.sec.gov.
6
The Gabelli Focused Growth and Income Fund
Schedule of Investments — September 30, 2021
| Shares | Cost | Market Value | ||||||||||
| COMMON STOCKS — 84.7% | ||||||||||||
| Aerospace and Defense — 0.8% | ||||||||||||
| 7,500 | Aerojet Rocketdyne Holdings Inc. | $ | 267,231 | $ | 326,625 | |||||||
| Automotive — 0.9% | ||||||||||||
| 20,000 | Stellantis NV | 238,106 | 382,000 | |||||||||
| Automotive: Parts and Accessories — 2.9% | ||||||||||||
| 7,750 | Aptiv plc† | 405,874 | 1,154,517 | |||||||||
| Building and Construction — 3.7% | ||||||||||||
| 9,000 | Herc Holdings Inc.† | 173,772 | 1,471,140 | |||||||||
| Cable and Satellite — 1.9% | ||||||||||||
| 16,000 | Liberty Media Corp. -Liberty Formula One, Cl. A† | 453,144 | 752,800 | |||||||||
| Computer Software and Services — 3.0% | ||||||||||||
| 450 | Alphabet Inc., Cl. C† | 266,938 | 1,199,390 | |||||||||
| Consumer Products — 1.0% | ||||||||||||
| 10,000 | Terminix Global Holdings Inc.† | 267,352 | 416,700 | |||||||||
| Diversified Industrial — 0.9% | ||||||||||||
| 775 | Roper Technologies Inc. | 222,013 | 345,751 | |||||||||
| Energy and Utilities — 19.2% | ||||||||||||
| 15,000 | Atlantica Sustainable Infrastructure plc | 523,279 | 517,650 | |||||||||
| 97,500 | Energy Transfer LP | 657,321 | 934,050 | |||||||||
| 87,500 | Enterprise Products Partners LP | 1,642,080 | 1,893,500 | |||||||||
| 105,000 | Kinder Morgan Inc. | 1,304,954 | 1,756,650 | |||||||||
| 35,000 | NextEra Energy Partners LP. | 1,597,111 | 2,637,600 | |||||||||
| 5,724,745 | 7,739,450 | |||||||||||
| Entertainment — 2.6% | ||||||||||||
| 175,000 | Sirius XM Holdings Inc. | 517,281 | 1,067,500 | |||||||||
| Financial Services — 13.8% | ||||||||||||
| 42,500 | Apollo Global Management Inc. | 1,525,058 | 2,617,575 | |||||||||
| 12,500 | Morgan Stanley | 525,580 | 1,216,375 | |||||||||
| 100,000 | New York Community Bancorp Inc. | 877,712 | 1,287,000 | |||||||||
| 1,650 | PayPal Holdings Inc.† | 149,927 | 429,346 | |||||||||
| 3,078,277 | 5,550,296 | |||||||||||
| Food and Beverage — 9.2% | ||||||||||||
| 75,000 | Maple Leaf Foods Inc. | 1,225,395 | 1,524,159 | |||||||||
| 16,500 | Mondelēz International Inc., Cl. A | 675,416 | 959,970 | |||||||||
| Shares | Cost | Market Value | ||||||||||
| 11,000 | Post Holdings Inc.† | $ | 366,228 | $ | 1,211,760 | |||||||
| 2,267,039 | 3,695,889 | |||||||||||
| Health Care — 6.3% | ||||||||||||
| 13,000 | AbbVie Inc. | 1,342,477 | 1,402,310 | |||||||||
| 47,000 | Option Care Health Inc.† | 257,598 | 1,140,220 | |||||||||
| 1,600,075 | 2,542,530 | |||||||||||
| Real Estate Investment Trusts — 15.2% | ||||||||||||
| 43,000 | Blackstone Mortgage Trust Inc., Cl. A | 1,067,666 | 1,303,760 | |||||||||
| 8,000 | Hannon Armstrong Sustainable Infrastructure Capital Inc. | 249,961 | 427,840 | |||||||||
| 30,000 | Healthpeak Properties Inc. | 881,663 | 1,004,400 | |||||||||
| 88,000 | MGM Growth Properties LLC, Cl. A | 1,970,940 | 3,370,400 | |||||||||
| 4,170,230 | 6,106,400 | |||||||||||
| Telecommunications — 3.3% | ||||||||||||
| 55,000 | Lumen Technologies Inc. | 514,544 | 681,450 | |||||||||
| 5,000 | T-Mobile US Inc.† | 366,791 | 638,800 | |||||||||
| 881,335 | 1,320,250 | |||||||||||
| TOTAL COMMON STOCKS | 20,533,412 | 34,071,238 | ||||||||||
| PREFERRED STOCKS — 13.4% | ||||||||||||
| Diversified Industrial — 3.6% | ||||||||||||
| 17,704 | Babcock & Wilcox Enterprises Inc., 8.125%, 02/28/26 | 445,279 | 463,137 | |||||||||
| 42,500 | Steel Partners Holdings LP, Ser. A, 6.000%, 02/07/26 | 870,682 | 997,475 | |||||||||
| 1,315,961 | 1,460,612 | |||||||||||
| Energy and Utilities — 4.4% | ||||||||||||
| 70,000 | Energy Transfer LP, Ser. D, 7.625% | 1,397,654 | 1,753,500 | |||||||||
| Health Care — 1.1% | ||||||||||||
| 27,700 | Ontrak Inc., 9.500% | 578,075 | 457,050 | |||||||||
| Retail — 4.3% | ||||||||||||
| 16,000 | Qurate Retail Inc., 8.000%, 03/15/31 | 1,569,395 | 1,730,400 | |||||||||
| TOTAL PREFERRED STOCKS | 4,861,085 | 5,401,562 | ||||||||||
See accompanying notes to financial statements.
7
The Gabelli Focused Growth and Income Fund
Schedule of Investments (Continued) — September 30, 2021
| Principal Amount | Cost | Market Value | ||||||||||
| U.S. GOVERNMENT OBLIGATIONS — 1.8% | ||||||||||||
| $ | 721,000 | U.S. Treasury Bills, 0.017% to 0.055%††, 11/12/21 to 12/23/21 | $ | 720,961 | $ | 720,963 | ||||||
| TOTAL INVESTMENTS — 99.9% | $ | 26,115,458 | 40,193,763 | |||||||||
| Other Assets and Liabilities (Net) — 0.1% | 49,608 | |||||||||||
| NET ASSETS — 100.0% | $ | 40,243,371 | ||||||||||
| † | Non-income producing security. |
| †† | Represents annualized yields at dates of purchase. |
See accompanying notes to financial statements.
8
The Gabelli Focused Growth and Income Fund
Statement of Assets and Liabilities
September 30, 2021
| Assets: | ||||
| Investments, at value (cost $26,115,458) | $ | 40,193,763 | ||
| Foreign currency, at value (cost $9,034) | 9,060 | |||
| Cash | 60,639 | |||
| Receivable for Fund shares sold | 4,103 | |||
| Receivable from Adviser | 17,287 | |||
| Dividends receivable | 80,995 | |||
| Prepaid expenses | 21,630 | |||
| Total Assets | 40,387,477 | |||
| Liabilities: | ||||
| Payable for Fund shares redeemed | 38,426 | |||
| Payable for investment advisory fees | 33,523 | |||
| Payable for distribution fees | 10,123 | |||
| Payable for shareholder communications | 27,684 | |||
| Payable for legal and audit fees | 21,950 | |||
| Other accrued expenses | 12,400 | |||
| Total Liabilities | 144,106 | |||
| Net Assets | ||||
| (applicable to 2,338,000 shares outstanding) | $ | 40,243,371 | ||
| Net Assets Consist of: | ||||
| Paid-in capital | $ | 27,674,307 | ||
| Total distributable earnings | 12,569,064 | |||
| Net Assets | $ | 40,243,371 | ||
| Shares of Capital Stock, each at $0.001 par value: | ||||
| Class AAA: | ||||
| Net Asset Value, offering, and redemption price per share ($6,928,219 ÷ 395,875 shares outstanding; 100,000,000 shares authorized) | $ | 17.50 | ||
| Class A: | ||||
| Net Asset Value and redemption price per share ($8,957,912 ÷ 505,865 shares outstanding; 50,000,000 shares authorized) | $ | 17.71 | ||
| Maximum offering price per share (NAV ÷ 0.9425, based on maximum sales charge of 5.75% of the offering price) | $ | 18.79 | ||
| Class C: | ||||
| Net Asset Value and offering price per share ($8,142,599 ÷ 552,637 shares outstanding; 50,000,000 shares authorized) | $ | 14.73 | (a) | |
| Class I: | ||||
| Net Asset Value, offering, and redemption price per share ($16,214,641 ÷ 883,623 shares outstanding; 50,000,000 shares authorized) | $ | 18.35 | ||
| (a) | Redemption price varies based on the length of time held. |
Statement of Operations
For the Year Ended September 30, 2021
| Investment Income: | ||||
| Dividends (net of foreign withholding taxes of $6,279) | $ | 1,421,854 | ||
| Interest | 691 | |||
| Total Investment Income | 1,422,545 | |||
| Expenses: | ||||
| Investment advisory fees | 371,866 | |||
| Distribution fees - Class AAA | 20,529 | |||
| Distribution fees - Class A | 20,767 | |||
| Distribution fees - Class C | 78,247 | |||
| Legal and audit fees | 116,201 | |||
| Registration expenses | 62,086 | |||
| Shareholder communications expenses | 33,189 | |||
| Shareholder services fees | 28,718 | |||
| Custodian fees | 8,389 | |||
| Directors’ fees | 2,753 | |||
| Interest expense | 153 | |||
| Miscellaneous expenses | 13,969 | |||
| Total Expenses | 756,867 | |||
| Less: | ||||
| Expense reimbursements (See Note 3) | (97,862 | ) | ||
| Net Expenses | 659,005 | |||
| Net Investment Income | 763,540 | |||
| Net Realized and Unrealized Gain/(Loss) on Investments and Foreign Currency: | ||||
| Net realized gain on investments | 6,177,346 | |||
| Net realized loss on foreign currency transactions | (320 | ) | ||
| Net realized gain on investments and foreign currency transactions | 6,177,026 | |||
| Net change in unrealized appreciation/depreciation: | ||||
| on investments | 6,127,574 | |||
| on foreign currency translations | (22 | ) | ||
| Net change in unrealized appreciation/depreciation on investments and foreign currency translations | 6,127,552 | |||
| Net Realized and Unrealized Gain/(Loss) on Investments and Foreign Currency | 12,304,578 | |||
| Net Increase in Net Assets Resulting from Operations | $ | 13,068,118 | ||
See accompanying notes to financial statements.
9
The Gabelli Focused Growth and Income Fund
Statement of Changes in Net Assets
Year Ended September 30, 2021 | Year Ended September 30, 2020 | |||||||||
| Operations: | ||||||||||
| Net investment income/(loss) | $ | 763,540 | $ | (135,502 | ) | |||||
| Net realized gain/(loss) on investments, written options, and foreign currency transactions | 6,177,026 | (1,877,976 | ) | |||||||
| Net change in unrealized appreciation/depreciation on investments and foreign currency translations | 6,127,552 | (78,140 | ) | |||||||
| Net Increase/(Decrease)in Net Assets Resulting from Operations | 13,068,118 | (2,091,618 | ) | |||||||
| Distributions to Shareholders: | ||||||||||
| Class AAA | (246,442 | ) | — | |||||||
| Class A | (274,575 | ) | — | |||||||
| Class C | (301,224 | ) | — | |||||||
| Class I | (435,658 | ) | — | |||||||
| Total Distributions to Shareholders | (1,257,899 | ) | — | |||||||
| Capital Share Transactions: | ||||||||||
| Class AAA | (4,833,791 | ) | (2,854,458 | ) | ||||||
| Class A | (298,998 | ) | (2,048,935 | ) | ||||||
| Class C | (1,224,967 | ) | (6,433,896 | ) | ||||||
| Class I | 4,175,125 | (6,519,450 | ) | |||||||
| Net Decrease in Net Assets from Capital Share Transactions | (2,182,631 | ) | (17,856,739 | ) | ||||||
| Redemption Fees | — | 137 | ||||||||
| Net Increase/(Decrease) in Net Assets | 9,627,588 | (19,948,220 | ) | |||||||
| Net Assets: | ||||||||||
| Beginning of year | 30,615,783 | 50,564,003 | ||||||||
| End of year | $ | 40,243,371 | $ | 30,615,783 | ||||||
See accompanying notes to financial statements.
10
The Gabelli Focused Growth and Income Fund
Financial Highlights
Selected data for a share of capital stock outstanding throughout each period:
| Income (Loss) from Investment Operations | Distributions | Ratios to Average Net Assets/Supplemental Data | |||||||||||||||||||||||||||||||||||||||||||||||||||
| Year Ended September 30 | Net Asset Value, Beginning of Year | Net Investment Income (Loss) (a)(b) | Net Realized and Unrealized Gain (Loss) on Investments | Total from Investment Operations | Net Investment Income | Net Realized Gain on Investments | Total Distributions | Redemption Fees(a) | Net Asset Value, End of Year | Total Return† | Net Assets, End of Year (in 000’s) | Net Investment Income (Loss)(b) | Operating Expenses(c) | Portfolio Turnover Rate | |||||||||||||||||||||||||||||||||||||||
| Class AAA | |||||||||||||||||||||||||||||||||||||||||||||||||||||
| 2021 | $ | 12.48 | $ | 0.34 | $ | 5.22 | $ | 5.56 | $ | (0.54 | ) | $ | — | $ | (0.54 | ) | $ | — | $ | 17.50 | 44.76 | % | $ | 6,927 | 2.15 | % | 1.96 | % | 54 | % | |||||||||||||||||||||||
| 2020 | 12.93 | (0.03 | ) | (0.42 | ) | (0.45 | ) | — | — | — | 0.00 | (d) | 12.48 | (3.48 | ) | 8,713 | (0.24 | ) | 1.71 | 59 | |||||||||||||||||||||||||||||||||
| 2019 | 13.84 | (0.07 | ) | (0.83 | ) | (0.90 | ) | — | (0.01 | ) | (0.01 | ) | — | 12.93 | (6.50 | ) | 12,189 | (0.56 | ) | 1.64 | (e) | 67 | |||||||||||||||||||||||||||||||
| 2018 | 14.61 | (0.09 | ) | (0.61 | ) | (0.70 | ) | — | (0.07 | ) | (0.07 | ) | 0.00 | (d) | 13.84 | (4.78 | ) | 16,630 | (0.63 | ) | 1.53 | 105 | |||||||||||||||||||||||||||||||
| 2017 | 13.70 | (0.15 | ) | 1.21 | 1.06 | — | (0.15 | ) | (0.15 | ) | 0.00 | (d) | 14.61 | 7.88 | 22,542 | (1.08 | ) | 1.43 | (e) | 77 | |||||||||||||||||||||||||||||||||
| Class A | |||||||||||||||||||||||||||||||||||||||||||||||||||||
| 2021 | $ | 12.62 | $ | 0.30 | $ | 5.33 | $ | 5.63 | $ | (0.54 | ) | $ | — | $ | (0.54 | ) | $ | — | $ | 17.71 | 44.82 | % | $ | 8,958 | 1.83 | % | 1.96 | % | 54 | % | |||||||||||||||||||||||
| 2020 | 13.06 | (0.03 | ) | (0.41 | ) | (0.44 | ) | — | — | — | 0.00 | (d) | 12.62 | (3.37 | ) | 6,644 | (0.24 | ) | 1.71 | 59 | |||||||||||||||||||||||||||||||||
| 2019 | 13.98 | (0.07 | ) | (0.84 | ) | (0.91 | ) | — | (0.01 | ) | (0.01 | ) | — | 13.06 | (6.51 | ) | 9,013 | (0.57 | ) | 1.64 | (e) | 67 | |||||||||||||||||||||||||||||||
| 2018 | 14.76 | (0.09 | ) | (0.62 | ) | (0.71 | ) | — | (0.07 | ) | (0.07 | ) | 0.00 | (d) | 13.98 | (4.80 | ) | 15,137 | (0.65 | ) | 1.53 | 105 | |||||||||||||||||||||||||||||||
| 2017 | 13.84 | (0.15 | ) | 1.22 | 1.07 | — | (0.15 | ) | (0.15 | ) | 0.00 | (d) | 14.76 | 7.87 | 29,391 | (1.08 | ) | 1.43 | (e) | 77 | |||||||||||||||||||||||||||||||||
| Class C | |||||||||||||||||||||||||||||||||||||||||||||||||||||
| 2021 | $ | 10.64 | $ | 0.15 | $ | 4.48 | $ | 4.63 | $ | (0.54 | ) | $ | — | $ | (0.54 | ) | $ | — | $ | 14.73 | 43.75 | % | $ | 8,143 | 1.13 | % | 2.71 | % | 54 | % | |||||||||||||||||||||||
| 2020 | 11.10 | (0.11 | ) | (0.35 | ) | (0.46 | ) | — | — | — | 0.00 | (d) | 10.64 | (4.14 | ) | 6,926 | (1.00 | ) | 2.46 | 59 | |||||||||||||||||||||||||||||||||
| 2019 | 11.97 | (0.14 | ) | (0.72 | ) | (0.86 | ) | — | (0.01 | ) | (0.01 | ) | — | 11.10 | (7.18 | ) | 13,807 | (1.33 | ) | 2.39 | (e) | 67 | |||||||||||||||||||||||||||||||
| 2018 | 12.74 | (0.17 | ) | (0.53 | ) | (0.70 | ) | — | (0.07 | ) | (0.07 | ) | 0.00 | (d) | 11.97 | (5.48 | ) | 24,992 | (1.38 | ) | 2.28 | 105 | |||||||||||||||||||||||||||||||
| 2017 | 12.06 | (0.22 | ) | 1.05 | 0.83 | — | (0.15 | ) | (0.15 | ) | 0.00 | (d) | 12.74 | 7.04 | 37,147 | (1.83 | ) | 2.18 | (e) | 77 | |||||||||||||||||||||||||||||||||
| Class I | |||||||||||||||||||||||||||||||||||||||||||||||||||||
| 2021 | $ | 12.94 | $ | 0.46 | $ | 5.49 | $ | 5.95 | $ | (0.54 | ) | $ | — | $ | (0.54 | ) | $ | — | $ | 18.35 | 46.21 | % | $ | 16,215 | 2.70 | % | 1.71 | %(f) | 54 | % | |||||||||||||||||||||||
| 2020 | 13.36 | 0.00 | (d) | (0.42 | ) | (0.42 | ) | — | — | — | 0.00 | (d) | 12.94 | (3.14 | ) | 8,333 | 0.01 | 1.46 | 59 | ||||||||||||||||||||||||||||||||||
| 2019 | 14.27 | (0.05 | ) | (0.85 | ) | (0.90 | ) | — | (0.01 | ) | (0.01 | ) | — | 13.36 | (6.30 | ) | 15,555 | (0.36 | ) | 1.39 | (e) | 67 | |||||||||||||||||||||||||||||||
| 2018 | 15.02 | (0.06 | ) | (0.62 | ) | (0.68 | ) | — | (0.07 | ) | (0.07 | ) | 0.00 | (d) | 14.27 | (4.50 | ) | 34,947 | (0.39 | ) | 1.28 | 105 | |||||||||||||||||||||||||||||||
| 2017 | 14.05 | (0.11 | ) | 1.23 | 1.12 | — | (0.15 | ) | (0.15 | ) | 0.00 | (d) | 15.02 | 8.11 | 71,138 | (0.83 | ) | 1.18 | (e) | 77 | |||||||||||||||||||||||||||||||||
| † | Total return represents aggregate total return of a hypothetical investment at the beginning of the year and sold at the end of the year including reinvestment of distributions and does not reflect the applicable sales charges. |
| (a) | Per share amounts have been calculated using the average shares outstanding method. |
| (b) | Due to capital share activity, net investment income/(loss) per share and the ratio to average net assets are not necessarily correlated among the different classes of shares. |
| (c) | The Fund incurred interest expense. For the fiscal year ended September 30, 2020, if interest expense had not been incurred, the ratios of operating expenses to average net assets would have been 1.70% (Class AAA and Class A), 2.45% (Class C), and 1.45% (Class I). For the fiscal years ended September 30, 2021, 2019, 2018, and 2017, the effect of interest expense was minimal. |
| (d) | Amount represents less than $0.005 per share. |
| (e) | The Fund received credits from a designated broker who agreed to pay certain Fund operating expenses. If such credits had not been received the ratios of operating expenses to average net assets would have been 1.64% (Class AAA and Class A), 2.39% (Class C), and 1.40% (Class I) for the fiscal year ended September 30, 2019. For the fiscal years ended September 30, 2017, there was no impact to the expense ratios. |
| (f) | Under an expense reimbursement agreement with the Adviser, the Adviser reimbursed expenses of $97,862 with the operating expenses net of reimbursement ratio of 0.95% for the fiscal year ended September 30, 2021. |
See accompanying notes to financial statements.
11
The Gabelli Focused Growth and Income Fund
Notes to Financial Statements
1. Organization. Effective January 14, 2021. The Gabelli Focus Five Fund changed its name to Gabelli Focused Growth and Income Fund with a corresponding change in the name of each of its Classes of Shares. The Fund is a series of the Gabelli Equity Series Funds, Inc. (the Corporation), which was incorporated on July 25, 1991 in Maryland. The Fund is a diversified open-end management investment company registered under the Investment Company Act of 1940, as amended (the 1940 Act), and one of four separately managed portfolios of the Corporation. The Fund seeks to provide a high level of capital appreciation. The Fund commenced investment operations on December 31, 2002.
2. Significant Accounting Policies. As an investment company, the Fund follows the investment company accounting and reporting guidance, which is part of U.S. generally accepted accounting principles (GAAP) that may require the use of management estimates and assumptions in the preparation of its financial statements. Actual results could differ from those estimates. The following is a summary of significant accounting policies followed by the Fund in the preparation of its financial statements.
The global outbreak of the novel coronavirus disease, known as COVID-19, has caused adverse effects on many companies, sectors, nations, regions, and the markets in general, and may continue for an unpredictable duration. The effects of this pandemic may materially impact the value and performance of the Fund, its ability to buy and sell fund investments at appropriate valuations, and its ability to achieve its investment objectives.
New Accounting Pronouncements. In March 2020, the Financial Accounting Standards Board (FASB) issued Accounting Standards Update (ASU) No. 2020-04, Reference Rate Reform (Topic 848) – Facilitation of the Effects of Reference Rate Reform on Financial Reporting. The amendments in the ASU provides optional temporary financial reporting relief from the effect of certain types of contract modifications due to the planned discontinuation of the London Interbank Offered Rate (LIBOR) and other interbank-offered based reference rates as of the end of 2021. The ASU is effective for certain reference rate-related contract modifications that occur through December 31, 2022. Management has reviewed the requirements and believes the adoption of this ASU will not have a material impact on the financial statements.
Security Valuation. Portfolio securities listed or traded on a nationally recognized securities exchange or traded in the U.S. over-the-counter market for which market quotations are readily available are valued at the last quoted sale price or a market’s official closing price as of the close of business on the day the securities are being valued. If there were no sales that day, the security is valued at the average of the closing bid and asked prices or, if there were no asked prices quoted on that day, then the security is valued at the closing bid price on that day. If no bid or asked prices are quoted on such day, the security is valued at the most recently available price or, if the Board of Directors (the Board) so determines, by such other method as the Board shall determine in good faith to reflect its fair market value. Portfolio securities traded on more than one national securities exchange or market are valued according to the broadest and most representative market, as determined by Gabelli Funds, LLC (the Adviser).
Portfolio securities primarily traded on a foreign market are generally valued at the preceding closing values of such securities on the relevant market, but may be fair valued pursuant to procedures established by the Board if market conditions change significantly after the close of the foreign market, but prior to the close of business on the day the securities are being valued. Debt obligations for which market quotations are readily available are valued at the average of the latest bid and asked prices. If there were no asked prices quoted on such day,
12
The Gabelli Focused Growth and Income Fund
Notes to Financial Statements (Continued)
the security is valued using the closing bid price, unless the Board determines such amount does not reflect the securities’ fair value, in which case these securities will be fair valued as determined by the Board. Certain securities are valued principally using dealer quotations. Futures contracts are valued at the closing settlement price of the exchange or board of trade on which the applicable contract is traded. OTC futures and options on futures for which market quotations are readily available will be valued by quotations received from a pricing service or, if no quotations are available from a pricing service, by quotations obtained from one of more dealers in the instrument in question by the Adviser.
Securities and assets for which market quotations are not readily available are fair valued as determined by the Board. Fair valuation methodologies and procedures may include, but are not limited to: analysis and review of available financial and non-financial information about the company; comparisons with the valuation and changes in valuation of similar securities, including a comparison of foreign securities with the equivalent U.S. dollar value American Depositary Receipt securities at the close of the U.S. exchange; and evaluation of any other information that could be indicative of the value of the security.
The inputs and valuation techniques used to measure fair value of the Fund’s investments are summarized into three levels as described in the hierarchy below:
| ● | Level 1 — quoted prices in active markets for identical securities; |
| ● | Level 2 — other significant observable inputs (including quoted prices for similar securities, interest rates, prepayment speeds, credit risk, etc.); and |
| ● | Level 3 — significant unobservable inputs (including the Board’s determinations as to the fair value of investments). |
A financial instrument’s level within the fair value hierarchy is based on the lowest level of any input both individually and in the aggregate that is significant to the fair value measurement. The inputs or methodology used for valuing securities are not necessarily an indication of the risk associated with investing in those securities. The summary of the Fund’s investments in securities by inputs used to value the Fund’s investments as of September 30, 2021 is as follows:
| Valuation Inputs | |||||||||||||||
| Level 1 Quoted Prices | Level 2 Other Significant Observable Inputs | Total Market Value at 09/30/21 | |||||||||||||
| INVESTMENTS IN SECURITIES: | |||||||||||||||
| ASSETS (Market Value): | |||||||||||||||
| Common Stocks (a) | $ | 34,071,238 | — | $ | 34,071,238 | ||||||||||
| Preferred Stocks (a) | 5,401,562 | — | 5,401,562 | ||||||||||||
| U.S. Government Obligations | — | $ | 720,963 | 720,963 | |||||||||||
| TOTAL INVESTMENTS IN SECURITIES – ASSETS | $ | 39,472,800 | $ | 720,963 | $ | 40,193,763 | |||||||||
| (a) | Please refer to the Schedule of Investments for the industry classifications of these portfolio holdings. |
The Fund held no Level 3 investments at September 30, 2021 or September 30, 2020.
13
The Gabelli Focused Growth and Income Fund
Notes to Financial Statements (Continued)
Additional Information to Evaluate Qualitative Information.
General. The Fund uses recognized industry pricing services – approved by the Board and unaffiliated with the Adviser – to value most of its securities, and uses broker quotes provided by market makers of securities not valued by these and other recognized pricing sources. Several different pricing feeds are received to value domestic equity securities, international equity securities, preferred equity securities, and fixed income securities. The data within these feeds are ultimately sourced from major stock exchanges and trading systems where these securities trade. The prices supplied by external sources are checked by obtaining quotations or actual transaction prices from market participants. If a price obtained from the pricing source is deemed unreliable, prices will be sought from another pricing service or from a broker/dealer that trades that security or similar securities.
Fair Valuation. Fair valued securities may be common or preferred equities, warrants, options, rights, or fixed income obligations. Where appropriate, Level 3 securities are those for which market quotations are not available, such as securities not traded for several days, or for which current bids are not available, or which are restricted as to transfer. When fair valuing a security, factors to consider include recent prices of comparable securities that are publicly traded, reliable prices of securities not publicly traded, the use of valuation models, current analyst reports, valuing the income or cash flow of the issuer, or cost if the preceding factors do not apply. A significant change in the unobservable inputs could result in a lower or higher value in Level 3 securities. The circumstances of Level 3 securities are frequently monitored to determine if fair valuation measures continue to apply.
The Adviser reports quarterly to the Board the results of the application of fair valuation policies and procedures. These may include backtesting the prices realized in subsequent trades of these fair valued securities to fair values previously recognized.
Foreign Currency Translations. The books and records of the Fund are maintained in U.S. dollars. Foreign currencies, investments, and other assets and liabilities are translated into U.S. dollars at current exchange rates. Purchases and sales of investment securities, income, and expenses are translated at the exchange rate prevailing on the respective dates of such transactions. Unrealized gains and losses that result from changes in foreign exchange rates and/or changes in market prices of securities have been included in unrealized appreciation/depreciation on investments and foreign currency translations. Net realized foreign currency gains and losses resulting from changes in exchange rates include foreign currency gains and losses between trade date and settlement date on investment securities transactions, foreign currency transactions, and the difference between the amounts of interest and dividends recorded on the books of the Fund and the amounts actually received. The portion of foreign currency gains and losses related to fluctuation in exchange rates between the initial purchase trade date and subsequent sale trade date is included in realized gain/(loss) on investments.
Foreign Securities. The Fund may directly purchase securities of foreign issuers. Investing in securities of foreign issuers involves special risks not typically associated with investing in securities of U.S. issuers. The risks include possible revaluation of currencies, the inability to repatriate funds, less complete financial information about companies, and possible future adverse political and economic developments. Moreover, securities of many foreign issuers and their markets may be less liquid and their prices more volatile than securities of comparable U.S. issuers.
14
The Gabelli Focused Growth and Income Fund
Notes to Financial Statements (Continued)
Foreign Taxes. The Fund may be subject to foreign taxes on income, gains on investments, or currency repatriation, a portion of which may be recoverable. The Fund will accrue such taxes and recoveries as applicable, based upon its current interpretation of tax rules and regulations that exist in the markets in which it invests.
Securities Transactions and Investment Income. Securities transactions are accounted for on the trade date with realized gain/(loss) on investments determined by using the identified cost method. Interest income (including amortization of premium and accretion of discount) is recorded on an accrual basis. Premiums and discounts on debt securities are amortized using the effective yield to maturity method or amortized to earliest call date, if applicable. Dividend income is recorded on the ex-dividend date, except for certain dividends from foreign securities that are recorded as soon after the ex-dividend date as the Fund becomes aware of such dividends.
Determination of Net Asset Value and Calculation of Expenses. Certain administrative expenses are common to, and allocated among, various affiliated funds. Such allocations are made on the basis of each fund’s average net assets or other criteria directly affecting the expenses as determined by the Adviser pursuant to procedures established by the Board.
In calculating the NAV per share of each class, investment income, realized and unrealized gains and losses, redemption fees, and expenses other than class specific expenses are allocated daily to each class of shares based upon the proportion of net assets of each class at the beginning of each day. Distribution expenses are borne solely by the class incurring the expense.
Distributions to Shareholders. Distributions to shareholders are recorded on the ex-dividend date. Distributions to shareholders are based on income and capital gains as determined in accordance with federal income tax regulations, which may differ from income and capital gains as determined under GAAP. These differences are primarily due to differing treatments of income and gains on various investment securities and foreign currency transactions held by the Fund, timing differences, and differing characterizations of distributions made by the Fund. These book/tax differences are either temporary or permanent in nature. To the extent these differences are permanent, adjustments are made to the appropriate capital accounts in the period when the differences arise. Permanent differences were primarily due to distribution in excess of income. These reclassifications have no impact on the NAV of the Fund. For the fiscal year ended September 30, 2021, reclassifications were made to decrease paid-in capital by $589,514, with an offsetting adjustment to total distributable earnings.
The Fund has a fixed distribution policy. Under the policy, the Fund declares and pays monthly distributions from net investment income, capital gains, and paid-in capital. The actual source of the distribution is determined after the end of the calendar year. Pursuant to this policy, distributions during the calendar year are made in excess of required distributions. To the extent such distributions are made from current earnings and profits, they are considered ordinary income or long term capital gains. Distributions sourced from paid-in capital should not be considered as dividend yield or the total return from an investment in the Fund. The Board continues to evaluate its distribution policy in light of ongoing economic and market conditions and may change the amount of the monthly distributions in the future.
15
The Gabelli Focused Growth and Income Fund
Notes to Financial Statements (Continued)
The tax character of distributions paid during the fiscal year ended September 20, 2021 was as follows. There was no distribution during the fiscal year ended September 30, 2020.
| Year Ended September 30, 2021 | |||||
| Distributions paid from: | |||||
| Ordinary income | $ | 1,257,899 | |||
| Total distributions paid | $ | 1,257,899 | |||
Provision for Income Taxes. The Fund intends to continue to qualify as a regulated investment company under Subchapter M of the Internal Revenue Code of 1986, as amended (the Code). It is the policy of the Fund to comply with the requirements of the Code applicable to regulated investment companies and to distribute substantially all of its net investment company taxable income and net capital gains. Therefore, no provision for federal income taxes is required.
At September 30, 2021, the components of accumulated earnings/losses on a tax basis were as follows:
| Accumulated capital loss carryforwards | $ | (1,518,552 | ) | |
| Net unrealized appreciation on investments and foreign currency translations | 14,087,928 | |||
| Qualified late year loss deferrals | (312 | ) | ||
| Total | $ | 12,569,064 |
The Fund is permitted to carry capital losses forward for an unlimited period. Capital losses that are carried forward will retain their character as either short term or long term capital losses. The Fund has a short term capital loss carryforward with no expiration of $1,518,552. The Fund utilized $3,800,312 of the capital loss carryovers for the fiscal year ended September 30, 2021.
At September 30, 2021, the temporary difference between book basis and tax basis net unrealized appreciation on investments was due to tax basis adjustments on investments in partnerships, tax basis adjustments on investments in real estate investment trusts, and deferral of losses from wash sales for tax purposes.
The following summarizes the tax cost of investments and the related net unrealized appreciation at September 30, 2021:
| Cost | Gross Unrealized Appreciation | Gross Unrealized Depreciation | Net Unrealized Appreciation | |||||
| Investments | $26,105,861 | $14,292,576 | $(204,674) | $14,087,902 |
The Fund is required to evaluate tax positions taken or expected to be taken in the course of preparing the Fund’s tax returns to determine whether the tax positions are “more-likely-than-not” of being sustained by the applicable tax authority. Income tax and related interest and penalties would be recognized by the Fund as tax expense in the Statement of Operations if the tax positions were deemed not to meet the more-likely-than-not threshold. For the fiscal year ended September 30, 2021, the Fund did not incur any income tax, interest, or penalties. As of September 30, 2021, the Adviser has reviewed all open tax years and concluded that there was no impact to the Fund’s net assets or results of operations. The Fund’s federal and state tax returns for the prior
16
The Gabelli Focused Growth and Income Fund
Notes to Financial Statements (Continued)
three fiscal years remain open, subject to examination. On an ongoing basis, the Adviser will monitor the Fund’s tax positions to determine if adjustments to this conclusion are necessary.
3. Investment Advisory Agreement and Other Transactions. The Fund has entered into an investment advisory agreement (the Advisory Agreement) with the Adviser which provides that the Fund will pay the Adviser a fee, computed daily and paid monthly, at the annual rate of 1.00% of the value of its average daily net assets. In accordance with the Advisory Agreement, the Adviser provides a continuous investment program for the Fund’s portfolio, oversees the administration of all aspects of the Fund’s business and affairs, and pays the compensation of all Officers and Directors of the Fund who are affiliated persons of the Adviser.
Effective January 21, 2021, the Adviser has contractually agreed to waive its investment advisory fees and/or to reimburse expenses of the Fund to the extent necessary to maintain the annualized total operating expenses of Class I (excluding brokerage costs, acquired fund fees and expenses, interest, taxes, and extraordinary expenses) at no more than an annual rate of 0.80% of the value of that class’s average daily net assets. This agreement is in effect through January 31, 2022 and may be terminated only by the Board before such time. During the fiscal year ended September 30, 2021, the Adviser reimbursed expenses in the amount of $97,862 for Class I. In addition, the Fund has agreed, during the two year period following any waiver or reimbursement by the Adviser, to repay such amount to the extent, that after giving effect to the repayment, such adjusted annualized total operating expenses of the Class I Shares would not exceed 0.80% of the value of the Class I average daily net assets. At September 30, 2021, the cumulative amount which the Fund may repay the Adviser, expiring September 30, 2023, subject to the terms above, is $97,862.
4. Distribution Plan. The Fund’s Board has adopted a distribution plan (the Plan) for each class of shares, except for Class I Shares, pursuant to Rule 12b-1 under the 1940 Act. Under the Class AAA, Class A, and Class C Share Plans, payments are authorized to G.distributors, LLC (the Distributor), an affiliate of the Adviser, at annual rates of 0.25%, 0.25%, and 1.00%, respectively, of the average daily net assets of those classes, the annual limitations under each Plan. Such payments are accrued daily and paid monthly.
5. Portfolio Securities. Purchases and sales of securities during the fiscal year ended September 30, 2021, other than short term securities and U.S. Government obligations, aggregated $19,374,018 and $20,398,751, respectively.
6. Transactions with Affiliates and Other Arrangements. During the fiscal year ended September 30, 2021, the Distributor retained a total of $4,954 from investors representing commissions (sales charges and underwriting fees) on sales and redemptions of Fund shares.
The Corporation pays retainer and per meeting fees to Directors not affiliated with the Adviser, plus specified amounts to the Lead Director and Audit Committee Chairman. Directors are also reimbursed for out of pocket expenses incurred in attending meetings. Directors who are directors or employees of the Adviser or an affiliated company receive no compensation or expense reimbursement from the Corporation.
7. Line of Credit. The Fund participates in an unsecured line of credit, which expires on March 2, 2022 and may be renewed annually, of up to $75,000,000 under which it may borrow up to 10% of its net assets from the custodian for temporary borrowing purposes. Borrowings under this arrangement bear interest at a floating rate equal to the higher of the Overnight Federal Funds Rate plus 135 basis points or the Overnight Bank Funding
17
The Gabelli Focused Growth and Income Fund
Notes to Financial Statements (Continued)
Rate plus 135 basis points in effect on that day. This amount, if any, would be included in “Interest expense” in the Statement of Operations. During the fiscal year ended September 30, 2021, there were no borrowings under the line of credit.
8. Capital Stock. The Fund offers four classes of shares – Class AAA Shares, Class A Shares, Class C Shares, and Class I Shares. Class AAA and Class I Shares are offered without a sales charge. Class A Shares are subject to a maximum front-end sales charge of 5.75%. Class C Shares are subject to a 1.00% contingent deferred sales charge for one year after purchase.
The Fund imposes a redemption fee of 2.00% on all classes of shares that are redeemed or exchanged on or before the seventh day after the date of a purchase. The redemption fee is deducted from the proceeds otherwise payable to the redeeming shareholders and is retained by the Fund as an increase in paid-in capital. The redemption fees retained by the Fund during the fiscal years ended September 30, 2021 and 2020, if any, can be found in the Statement of Changes in Net Assets under Redemption Fees.
Transactions in shares of capital stock were as follows:
| Year Ended September 30, 2021 | Year Ended September 30, 2020 | |||||||||||||||
| Shares | Amount | Shares | Amount | |||||||||||||
| Class AAA | ||||||||||||||||
| Shares sold | 12,780 | $ | 207,769 | 31,364 | $ | 432,781 | ||||||||||
| Shares issued upon reinvestment of distributions | 14,570 | 244,259 | — | — | ||||||||||||
| Shares redeemed | (329,648 | ) | (5,285,819 | ) | (276,063 | ) | (3,287,239 | ) | ||||||||
| Net decrease | (302,298 | ) | $ | (4,833,791 | ) | (244,699 | ) | $ | (2,854,458 | ) | ||||||
| Class A | ||||||||||||||||
| Shares sold | 97,320 | $ | 1,561,225 | 135,152 | $ | 1,638,263 | ||||||||||
| Shares issued upon reinvestment of distributions | 14,276 | 244,498 | — | — | ||||||||||||
| Shares redeemed | (132,380 | ) | (2,104,721 | ) | (298,561 | ) | (3,687,198 | ) | ||||||||
| Net decrease | (20,784 | ) | $ | (298,998 | ) | (163,409 | ) | $ | (2,048,935 | ) | ||||||
| Class C | ||||||||||||||||
| Shares sold | 63,456 | $ | 902,093 | 36,416 | $ | 397,493 | ||||||||||
| Shares issued upon reinvestment of distributions | 20,969 | 300,090 | — | — | ||||||||||||
| Shares redeemed | (182,584 | ) | (2,427,150 | ) | (629,588 | ) | (6,831,389 | ) | ||||||||
| Net decrease | (98,159 | ) | $ | (1,224,967 | ) | (593,172 | ) | $ | (6,433,896 | ) | ||||||
| Class I | ||||||||||||||||
| Shares sold | 345,547 | $ | 5,842,285 | 75,874 | $ | 1,024,738 | ||||||||||
| Shares issued upon reinvestment of distributions | 23,078 | 409,395 | — | — | ||||||||||||
| Shares redeemed | (129,025 | ) | (2,076,555 | ) | (595,926 | ) | (7,544,188 | ) | ||||||||
| Net increase/(decrease) | 239,600 | $ | 4,175,125 | (520,052 | ) | $ | (6,519,450 | ) | ||||||||
9. Indemnifications. The Fund enters into contracts that contain a variety of indemnifications. The Fund’s maximum exposure under these arrangements is unknown. However, the Fund has not had prior claims or
18
The Gabelli Focused Growth and Income Fund
Notes to Financial Statements (Continued)
losses pursuant to these contracts. Management has reviewed the Fund’s existing contracts and expects the risk of loss to be remote.
10. Subsequent Events. Management has evaluated the impact on the Fund of all subsequent events occurring through the date the financial statements were issued and has determined that there were no subsequent events requiring recognition or disclosure in the financial statements.
19
The Gabelli Focused Growth and Income Fund
Report of Independent Registered Public Accounting Firm
To the Shareholders of The Gabelli Focused Growth and Income Fund
and the Board of Directors of Gabelli Equity Series Funds, Inc.
Opinion on the Financial Statements
We have audited the accompanying statement of assets and liabilities of The Gabelli Focused Growth and Income Fund (the “Fund”) (one of the funds constituting Gabelli Equity Series Funds, Inc. (the “Corporation”)), including the schedule of investments, as of September 30, 2021, and the related statement of operations for the year then ended, the statements of changes in net assets for each of the two years in the period then ended, the financial highlights for each of the five years in the period then ended and the related notes (collectively referred to as the “financial statements”). In our opinion, the financial statements present fairly, in all material respects, the financial position of the Fund (one of the funds constituting Gabelli Equity Series Funds, Inc.) at September 30, 2021, the results of its operations for the year then ended, the changes in its net assets for each of the two years in the period then ended and its financial highlights for each of the five years in the period then ended, in conformity with U.S. generally accepted accounting principles.
Basis for Opinion
These financial statements are the responsibility of the Corporation’s management. Our responsibility is to express an opinion on the Fund’s financial statements based on our audits. We are a public accounting firm registered with the Public Company Accounting Oversight Board (United States) (“PCAOB”) and are required to be independent with respect to the Corporation in accordance with the U.S. federal securities laws and the applicable rules and regulations of the Securities and Exchange Commission and the PCAOB.
We conducted our audits in accordance with the standards of the PCAOB. Those standards require that we plan and perform the audit to obtain reasonable assurance about whether the financial statements are free of material misstatement, whether due to error or fraud. The Corporation is not required to have, nor were we engaged to perform, an audit of the Corporation’s internal control over financial reporting. As part of our audits we are required to obtain an understanding of internal control over financial reporting but not for the purpose of expressing an opinion on the effectiveness of the Corporation’s internal control over financial reporting. Accordingly, we express no such opinion.
Our audits included performing procedures to assess the risks of material misstatement of the financial statements, whether due to error or fraud, and performing procedures that respond to those risks. Such procedures included examining, on a test basis, evidence regarding the amounts and disclosures in the financial statements. Our procedures included confirmation of securities owned as of September 30, 2021, by correspondence with the custodian or by other appropriate auditing procedures where replies from brokers were not received. Our audits also included evaluating the accounting principles used and significant estimates made by management, as well as evaluating the overall presentation of the financial statements. We believe that our audits provide a reasonable basis for our opinion.

We have served as the auditor of one or more Gabelli/GAMCO Funds investment companies since 1992.
Philadelphia, Pennsylvania
November 24, 2021
20
The Gabelli Focused Growth and Income Fund
Liquidity Risk Management (Unaudited)
In accordance with Rule 22e-4 under the 1940 Act, the Fund has established a liquidity risk management program (the LRM Program) to govern its approach to managing liquidity risk. The LRM Program is administered by the Liquidity Committee (the Committee), which is comprised of members of Gabelli Funds, LLC management. The Board has designated the Committee to administer the LRM Program.
The LRM Program’s principal objectives include supporting the Fund’s compliance with limits on investments in illiquid assets and mitigating the risk that the Fund will be unable to meet its redemption obligations in a timely manner. The LRM Program also includes elements that support the management and assessment of liquidity risk, including an annual assessment of factors that influence the Fund’s liquidity and the monthly classification and re-classification of certain investments that reflect the Committee’s assessment of their relative liquidity under current market conditions.
At a meeting of the Board held on May 12, 2021, the Board received a written report from the Committee regarding the design and operational effectiveness of the LRM Program. The Committee determined, and reported to the Board, that the LRM Program is reasonably designed to assess and manage the Fund’s liquidity risk and has operated adequately and effectively since its implementation. The Committee reported that there were no liquidity events that impacted the Fund or its ability to timely meet redemptions without dilution to existing shareholders. The Committee noted that the Fund is primarily invested in highly liquid securities and, accordingly, continues to be exempt from the requirement to determine a “highly liquid investment minimum” as defined in the Rule 22e-4. Because of that continued qualification for the exemption, the Fund has not adopted a “highly liquid investment minimum” amount. The Committee further noted that while changes to the LRM Program were made during the Review Period and reported to the Board, no material changes were made to the LRM Program as a result of the Committee’s annual review.
There can be no assurance that the LRM Program will achieve its objectives in the future. Please refer to the Fund’s Prospectus for more information regarding its exposure to liquidity risk and other principal risks to which an investment in the Fund may be subject.
21
The Gabelli Focused Growth and Income Fund
Additional Fund Information (Unaudited)
The business and affairs of the Corporation are managed under the direction of the Corporation’s Board of Directors. Information pertaining to the Directors and officers of the Corporation is set forth below. The Corporation’s Statement of Additional Information includes additional information about the Corporation’s Directors and is available without charge, upon request, by calling 800-GABELLI (800-422-3554) or by writing to The Gabelli Focused Growth and Income Fund at One Corporate Center, Rye, NY 10580-1422.
| Name, Position(s) Address1 and Age | Term of Office and Length of Time Served2 | Number of Funds in Fund Complex Overseen by Director | Principal Occupation(s) During Past Five Years | Other Directorships Held by Director3 | ||||
| INTERESTED DIRECTORS4: | ||||||||
| Mario J. Gabelli, CFA Director and Chief Investment Officer Age: 79 | Since 1991 | 32 | Chairman, Chief Executive Officer, and Chief Investment Officer– Value Portfolios of GAMCO Investors, Inc. and Chief Investment Officer– Value Portfolios of Gabelli Funds, LLC and GAMCO Asset Management Inc.; Director/ Trustee or Chief Investment Officer of other registered investment companies within the Fund Complex; Chief Executive Officer of GGCP, Inc.; Executive Chairman of Associated Capital Group, Inc. | Director of Morgan Group Holdings, Inc. (holding company); Chairman of the Board and Chief Executive Officer of LICT Corp. (multimedia and communication services company); Director of CIBL, Inc. (broadcasting and wireless communications); Director of ICTC Group Inc.(communications) (2013-2018) | ||||
| John D. Gabelli Director Age: 77 | Since 1991 | 12 | Senior Vice President of G.research, LLC | — | ||||
| INDEPENDENT DIRECTORS5: | ||||||||
| Elizabeth C. Bogan Director Age: 77 | Since 2019 | 12 | Senior Lecturer in Economics at Princeton University | — | ||||
| Anthony J. Colavita6 Director Age: 85 | Since 1991 | 18 | President of the law firm of Anthony J. Colavita, P.C. | — | ||||
| Vincent D. Enright Director Age: 77 | Since 1991 | 17 | Former Senior Vice President and Chief Financial Officer of KeySpan Corp. (public utility) (1994-1998) | Director of Echo Therapeutics, Inc. (therapeutics and diagnostics) (2008-2014); Director of The LGL Group, Inc. (diversified manufacturing) (2011-2014) | ||||
| Robert J. Morrissey Director Age: 82 | Since 1991 | 7 | Partner in the law firm of Morrissey, Hawkins & Lynch | Chairman of the Board of Directors, Belmont Savings Bank | ||||
| Kuni Nakamura Director Age: 53 | Since 2009 | 35 | President of Advanced Polymer, Inc. (chemical manufacturing company);President of KEN Enterprises, Inc. (real estate); Trustee on Long Island University Board of Trustees
| — | ||||
22
The Gabelli Focused Growth and Income Fund
Additional Fund Information (Continued) (Unaudited)
| Name, Position(s) Address1 and Age | Term of Office and Length of Time Served2 | Number of Funds in Fund Complex Overseen by Director | Principal Occupation(s) During Past Five Years | Other Directorships Held by Director3 | ||||
Anthonie C. van Ekris6 Director Age: 87
| Since 1991 | 23 | Chairman and Chief Executive Officer of BALMAC International, Inc.(global import/ export company) | — | ||||
Salvatore J. Zizza7 Director Age: 75
| Since 2001 | 32 | President of Zizza & Associates Corp. (private holding company); Chairman of Bergen Cove Realty Inc. (residential real estate) | Director and Chairman of Trans-Lux Corporation (business services); Director and Chairman of Harbor Diversified Inc. (pharmaceuticals) (2009-2018); Retired Chairman of BAM (semiconductor and aerospace manufacturing) |
23
The Gabelli Focused Growth and Income Fund
Additional Fund Information (Continued) (Unaudited)
| Name, Position(s) Address1 and Age | Term of Office and Length of Time Served2 | Principal Occupation(s) During Past Five Years | ||
| OFFICERS: | ||||
Bruce N. Alpert President Age: 69 | Since 1991 | Executive Vice President and Chief Operating Officer of Gabelli Funds, LLC since 1988; Officer of registered investment companies within the Fund Complex; Senior Vice President of GAMCO Investors, Inc. since 2008; Vice President – Mutual Funds, G.research, LLC | ||
John C. Ball Treasurer Age: 45 | Since 2017 | Treasurer of registered investment companies within the Fund Complex since 2017; Vice President and Assistant Treasurer of AMG Funds, 2014-2017; Chief Executive Officer, G.distributors, LLC since December 2020 | ||
Peter Goldstein Secretary and Vice President Age: 68 | Since 2020 | General Counsel, Gabelli Funds, LLC since July 2020; General Counsel and Chief Compliance Officer, Buckingham Capital Management, Inc. (2012-2020); Chief Legal Officer and Chief Compliance Officer, The Buckingham Research Group, Inc. (2012-2020) | ||
Richard J. Walz Chief Compliance Officer Age: 62 | Since 2013 | Chief Compliance Officer of registered investment companies within the Fund Complex since 2013; Chief Compliance Officer for Gabelli Funds, LLC since 2015 | ||
Daniel Plourde Vice President Age: 41 | Since 2021 | Vice President of registered investment companies within the Fund Complex since 2021; Assistant Treasurer of the North American SPDR ETFs and State Street Global Advisors Mutual Funds (2017-2021); Fund Administration at State Street Bank (2009-2017) |
| 1 | Address: One Corporate Center, Rye, NY 10580-1422, unless otherwise noted. |
| 2 | Each Director will hold office for an indefinite term until the earliest of (i) the next meeting of shareholders, if any, called for the purpose of considering the election or re-election of such Director and until the election and qualification of his or her successor, if any, elected at such meeting, or (ii) the date a Director resigns or retires, or a Director is removed by the Board of Directors or shareholders, in accordance with the Fund’s By-Laws and Articles of Incorporation. For officers, includes time served in prior officer positions with the Fund. Each officer will hold office for an indefinite term until the date he or she resigns or retires or until his or her successor is elected and qualified. |
| 3 | This column includes only directorships of companies required to report to the SEC under the Securities Exchange Act of 1934, as amended, i.e., public companies, or other investment companies registered under the 1940 Act. |
| 4 | “Interested person” of the Fund as defined in the 1940 Act. Messrs. Gabelli are each considered an “interested person” because of their affiliation with Gabelli Funds, LLC which acts as the Fund’s investment adviser. Mario J. Gabelli and John D. Gabelli are brothers. |
| 5 | Directors who are not interested persons are considered “Independent” Directors. |
| 6 | Mr. Colavita’s son, Anthony S. Colavita, serves as a director of other funds in the Gabelli/GAMCO Fund Complex. Mr. van Ekris is an independent director of Gabelli International Ltd., Gabelli Fund, LDC, GAMA Capital Opportunities Master, Ltd., and GAMCO International SICAV, which may be deemed to be controlled by Mario J. Gabelli and/or affiliates and in that event would be deemed to be under common control with the Fund’s Adviser. |
| 7 | Mr. Zizza is an independent director of Gabelli International Ltd., which may be deemed to be controlled by Mario J. Gabelli and/or affiliates and in that event would be deemed to be under common control with the Fund’s Adviser. On September 9, 2015, Mr. Zizza entered into a settlement with the SEC to resolve an inquiry relating to an alleged violation regarding the making of false statements or omissions to the accountants of a company concerning a related party transaction. The company in question is not an affiliate of, nor has any connection to, the Fund. Under the terms of the settlement, Mr. Zizza, without admitting or denying the SEC’s findings and allegation, paid $150,000 and agreed to cease and desist committing or causing any future violations of Rule 13b2-2 of the Securities Exchange Act of 1934, as amended. The Board has discussed this matter and has determined that it does not disqualify Mr. Zizza from serving as an Independent Director. |
24
Gabelli Funds and Your Personal Privacy
Who are we?
The Gabelli Funds are investment companies registered with the Securities and Exchange Commission under the Investment Company Act of 1940. We are managed by Gabelli Funds, LLC, which is affiliated with GAMCO Investors, Inc., a publicly held company with subsidiaries and affiliates that provide investment advisory services for a variety of clients.
What kind of non-public information do we collect about you if you become a fund shareholder?
If you apply to open an account directly with us, you will be giving us some non-public information about yourself. The non-public information we collect about you is:
| ● | Information you give us on your application form. This could include your name, address, telephone number, social security number, bank account number, and other information. |
| ● | Information about your transactions with us, any transactions with our affiliates, and transactions with the entities we hire to provide services to you. This would include information about the shares that you buy or redeem. If we hire someone else to provide services — like a transfer agent — we will also have information about the transactions that you conduct through them. |
What information do we disclose and to whom do we disclose it?
We do not disclose any non-public personal information about our customers or former customers to anyone other than our affiliates, our service providers who need to know such information, and as otherwise permitted by law. If you want to find out what the law permits, you can read the privacy rules adopted by the Securities and Exchange Commission. They are in volume 17 of the Code of Federal Regulations, Part 248. The Commission often posts information about its regulations on its website, www. sec.gov.
What do we do to protect your personal information?
We restrict access to non-public personal information about you to the people who need to know that information in order to provide services to you or the fund and to ensure that we are complying with the laws governing the securities business. We maintain physical, electronic, and procedural safeguards to keep your personal information confidential.
THE GABELLI FOCUSED GROWTH AND INCOME FUND
2021 TAX NOTICE TO SHAREHOLDERS (Unaudited)
During the fiscal year ended September 30, 2021, the Fund paid to shareholders ordinary income totaling $1,257,899, or the maximum allowable. For the fiscal year ended September 30, 2021, 100% of the ordinary income distribution qualifies for the dividends received deduction available to corporations. The Fund designates 100% of the ordinary income distribution as qualified dividend income pursuant to the Jobs and Growth Tax Relied Reconciliation Act of 2003. The Fund designates 0.05% of the ordinary income distribution as qualified interest income pursuant to the Tax Relief, Unemployment Reauthorization, and Job Creation Act of 2010.
U.S. Government Income:
The percentage of the ordinary income distribution paid by the Fund during the fiscal year ended September 30, 2021 which was derived from U.S. Treasury securities was 0.05%. Such income is exempt from state and local tax in all states. However, many states, including New York and California, allow a tax exemption for a portion of the income earned only if a mutual fund has invested at least 50% of its assets at the end of each quarter of the Fund’s fiscal year in U.S. Government securities. The Gabelli Focused Growth and Income Fund did not meet this strict requirement in 2021. The percentage of U.S. Government securities held as of September 30, 2021 was 1.79%. Due to the diversity in state and local tax law, it is recommended that you consult your personal tax adviser as to the applicability of the information provided to your specific situation.
All designations are based on financial information available as of the date of this annual report and, accordingly, are subject to change. For each item, it is the intention of the Fund to designate the maximum amount permitted under the Internal Revenue Code and the regulations thereunder.
THE GABELLI FOCUSED GROWTH AND INCOME FUND
One Corporate Center
Rye, NY 10580-1422
Portfolio Manager’s Biography
Daniel M. Miller currently serves as a portfolio manager of Gabelli Funds, LLC and is also a Managing Director of GAMCO Investors, Inc. Mr. Miller joined the Firm in 2002 and graduated magna cum laude with a degree in Finance from the University of Miami in Coral Gables, Florida.
| We have separated the portfolio manager’s commentary from the financial statements and investment portfolio due to corporate governance regulations stipulated by the Sarbanes-Oxley Act of 2002. We have done this to ensure that the contents of the portfolio manager’s commentary are unrestricted. Both the commentary and the financial statements, including the portfolios of investments, will be available on our website at www.gabelli.com. |
Gabelli Equity Series Funds, Inc.
THE GABELLI FOCUSED GROWTH AND INCOME FUND
One Corporate Center
Rye, New York 10580-1422
| t | 800-GABELLI (800-422-3554) |
| f | 914-921-5118 |
| e | info@gabelli.com |
GABELLI.COM
Net Asset Values per share available daily
by calling 800-GABELLI after 7:00 P.M.
BOARD OF DIRECTORS
Elizabeth C. Bogan
Anthony J. Colavita Anthony J. Colavita, P.C. Vincent D. Enright Former Senior Vice President and Chief Financial Officer, KeySpan Corp.
John D. Gabelli Former Senior Vice President, G.research, LLC
Robert J. Morrissey Partner, Morrissey, Hawkins & Lynch
Kuni Nakamura President, Advanced Polymer, Inc.
Anthonie C. van Ekris Chairman, BALMAC International, Inc. | Salvatore J. Zizza Chairman, Zizza & Associates Corp.
OFFICERS Bruce N. Alpert President
John C. Ball Treasurer
Peter Goldstein Secretary and Vice President
Richard J. Walz Chief Compliance Officer
Daniel Plourde Vice President
DISTRIBUTOR G.distributors, LLC
CUSTODIAN State Street Bank and Trust Company
TRANSFER AGENT AND DST Asset Manager Solutions, Inc.
LEGAL COUNSEL Skadden, Arps, Slate, Meagher & Flom LLP
|
This report is submitted for the general information of the shareholders of The Gabelli Focused Growth and Income Fund. It is not authorized for distribution to prospective investors unless preceded or accompanied by an effective prospectus.
GAB840Q321AR

The Gabelli Global Financial Services Fund
Annual Report — September 30, 2021 |
Ian Lapey Portfolio Manager BA, Williams College MS, Northeastern University MBA, New York University |

To Our Shareholders,
For the fiscal year ended September 30, 2021, the net asset value (NAV) total return per Class AAA Share of The Gabelli Global Financial Services Fund was 69.0% compared with a total return of 53.7% for the Morgan Stanley Capital International (MSCI) World Financials Index. Other classes of shares are available. See page 4 for performance information for all classes.
Enclosed are the financial statements, including the schedule of investments, as of September 30, 2021.
Investment Objective and Strategy (Unaudited)
The goal of the Fund is to generate long term capital appreciation, and under normal market conditions, the Fund will invest at least 80% of the value of its net assets in the securities of companies principally engaged in the group of industries comprising the financial services sector. The Fund considers a company to be engaged in financial services if it devotes a significant portion of its assets to or derives a significant portion of its revenues from providing financial services. The Adviser’s investment philosophy with respect to buying and selling equity securities is to identify assets that are selling in the public market at a discount to their private market value (PMV). The Adviser defines PMV as the value informed purchasers are willing to pay to acquire assets with similar characteristics.
| As permitted by regulations adopted by the Securities and Exchange Commission, paper copies of the Fund’s annual and semiannual shareholder reports will no longer be sent by mail, unless you specifically request paper copies of the reports. Instead, the reports will be made available on the Fund’s website (www.gabelli.com), and you will be notified by mail each time a report is posted and provided with a website link to access the report. If you already elected to receive shareholder reports electronically, you will not be affected by this change and you need not take any action. To elect to receive all future reports on paper free of charge, please contact your financial intermediary, or, if you invest directly with the Fund, you may call 800-422-3554 or send an email request to info@gabelli.com. |
Performance Discussion (Unaudited)
During the year ended September 30, 2021, the common stocks of most global financial services companies rebounded from declines in the previous year as their businesses proved to be resilient during the Covid-19 pandemic, and demand for financial services remained strong. The resilience of global banks was particularly noteworthy as their robust financial positions and prudent underwriting enabled them to book large reserves for credit losses at the outset of the pandemic without raising dilutive equity capital. As the table below shows, several of the Fund’s holdings were actually able to increase both credit reserves and capital positions during the pandemic. This has positioned them very well for future growth, particularly since underlying credit performance has been remarkably strong.
| CET1 ratio (1) | ACL (2) / Loans | |||||||||||||
| Company | 12/31/19 | 6/30/21 | 12/31/19 | 6/30/21 | ||||||||||
| Ally Financial | 9.5 | % | 11.3 | % | 1.0% | 2.8% | ||||||||
| Barclays | 13.8 | % | 15.1 | % | 1.8% | 1.8% | ||||||||
| Capital One Financial | 12.2 | % | 14.5 | % | 2.7% | 4.9% | ||||||||
| Citigroup | 11.8 | % | 11.8 | % | 1.8% | 2.8% | ||||||||
| Credit Agricole | 12.1 | % | 12.6 | % | 2.3% | 2.4% | ||||||||
| ING Group | 13.7 | % | 15.7 | % | 0.7% | 0.9% | ||||||||
| NatWest Group | 16.2 | % | 18.2 | % | 1.1% | 1.3% | ||||||||
| Societe Generale | 12.7 | % | 13.4 | % | 2.1% | 2.2% | ||||||||
| Standard Chartered | 13.8 | % | 14.1 | % | 2.1% | 2.0% | ||||||||
(1) Tier 1 Common Equity Ratio (common equity capital / risk weighted assets).
(2) Allowance for Credit Losses.
Sources: Company reports, GAMCO Investors.
The common stock of CIT Group was the largest positive contributor for the fiscal year. CIT is expected to be acquired by First Citizens BancShares in an all-stock transaction in which CIT shareholders would own 31% of the combined company. While the initial purchase price was very disappointing (only an 11% premium and a 60% discount to tangible book value), the stocks of both companies appreciated sharply after the announcement as First Citizens projected the transaction to be 50% accretive to earnings and 30% accretive to tangible book value. Additionally, CIT’s earnings have rebounded in recent quarters as the credit quality of its loan portfolio has improved markedly. First Citizens appears to be an extremely well-run company with an impressive long term track of growth of tangible book value and shareholder value.
Another takeover was also a significant contributor: Waddell & Reed, a Kansas based asset management firm, agreed to an all-cash purchase by Macquarie Group, an Australian diversified financial services company. The price was a 47% premium to the previous day’s close and about a 70% premium to the Fund’s cost. Finally, the common stock price of Jefferies Financial Group more than doubled owing primarily to robust financial results. For the first nine months of fiscal 2021, diluted earnings per share increased by 214% driven by a 119% increase in investment banking revenues. Jefferies has taken significant market share in the global investment banking industry and recently noted that its backlog was at a record level.
2
The largest negative contributor during the quarter was Hong Kong based Dah Sing Bank, whose common stock appeared to decline due macroeconomic concerns about China following increased government regulation of several high profile industries and the financial troubles of Evergrande, a large Chinese property developer. Dah Sing reported healthy first half 2021 financial results and has a strong financial position that should enable the company to weather continued economic uncertainty in China. The only other negative contributor was Axis Capital Holdings Ltd, a Bermuda based insurer and reinsurer, whose common stock appeared to decline along with many of its peers because of expected losses associated with Hurricane Ida.
The Fund’s aggregate valuation metrics are very attractive at about 0.9 times book value, 1.6 times tangible book value and 10 times expected 2021 earnings. As the table below shows, the management teams of many of the Fund’s holdings have been taking advantage of the depressed valuations of their common stocks to repurchase shares. I believe that share repurchases are prudent if the company has a strong financial position with excess capital and the common stock is trading below private market or intrinsic value. I believe that both conditions are met for the companies in the table below and that the share repurchases increase the value of shares for shareholders who don’t sell, like the Fund.
| Position | Share count % change (1) | |||||||
| Company | Size | YTD | 3yr. | 6yr. | ||||
| Ally Financial Inc. | 3.7% | -3.2% | -14.9% | -24.7% | ||||
| Bank of New York Mellon | 4.4% | -2.7% | -13.7% | -22.0% | ||||
| Barclays PLC | 2.5% | -2.1% | -0.7% | 1.3% | ||||
| Capital One Financial | 3.1% | -2.8% | -6.8% | -17.8% | ||||
| Citigroup | 3.9% | -2.7% | -19.5% | -32.7% | ||||
| Daiwa Securities Group | 2.6% | 0.1% | -5.4% | -10.8% | ||||
| Franklin Resources | 3.7% | -0.5% | -5.0% | -18.2% | ||||
| Janus Henderson | 4.5% | -4.5% | -14.0% | NM | ||||
| Jeffries Financial Group | 4.8% | -1.1% | -25.9% | -32.6% | ||||
| NatWest Group PLC | 2.7% | -4.6% | -3.8% | 0.0% | ||||
| Shinsei Bank | 2.6% | -0.8% | -14.9% | -18.9% | ||||
| Standard Chartered | 2.8% | -1.0% | -5.6% | 22.5% | ||||
| State Street Corporation | 2.9% | -2.7% | -6.1% | -15.8% | ||||
| Toyota Motor | 2.8% | -0.1% | -3.4% | -10.3% | ||||
| Westwood Holdings Group | 4.0% | -0.1% | -7.8% | -3.3% | ||||
(1) As of 6/30/21
NM: Janus and Henderson merged in 2017
Sources: Company reports, GAMCO Investors.
We appreciate your confidence and trust.
3
Comparative Results
Average Annual Returns through September 30, 2021 (a)(b) (Unaudited)
Average annual returns reflect changes in share price, reinvestment of distributions, and are net of expenses.
| 1 Year | 2 Year | Since Inception (10/1/18) | ||||||||||
| Class AAA (GAFSX) | 69.04 | % | 16.05 | % | 7.11 | % | ||||||
| MSCI World Financials Index (c) | 53.71 | 14.85 | 9.71 | |||||||||
| Class A (GGFSX) | 69.07 | 16.12 | 7.18 | |||||||||
| With sales charge (d) | 59.35 | 12.73 | 5.08 | |||||||||
| Class C (GCFSX) | 67.59 | 15.09 | 6.28 | |||||||||
| With contingent deferred sales charge (e) | 66.59 | 15.09 | 6.28 | |||||||||
| Class I (GFSIX) | 69.45 | 16.31 | 7.37 | |||||||||
| (a) | The Fund’s fiscal year ends September 30. |
| (b) | Returns would have been lower had the Adviser not reimbursed certain expenses of the Fund. The Fund imposes a 2% redemption fee on shares sold or exchanged within seven days of purchase. |
| (c) | The MSCI World Financials Index captures large and mid cap securities in the Financials sector across Developed Markets countries. Dividends are considered reinvested. You cannot invest directly in an index. |
| (d) | Performance results include the effect of the maximum 5.75% sales charge at the beginning of the period. |
| (e) | Assuming payment of the 1% maximum contingent deferred sales charge imposed on redemptions made within one year of purchase. |
In the current prospectuses dated January 28, 2021, the gross expense ratios for Class AAA, A, C, and I Shares are 2.51%, 2.51%, 3.26%, and 2.26%, respectively, and the net expense ratios for these share classes after contractual reimbursements by Gabelli Funds, LLC, (the Adviser) are 1.25%, 1.25%, 2.00%, and 1.00%, respectively. See page 11 for the expense ratios for the year ended September 30, 2021. The contractual reimbursements are in effect through January 31, 2022. Class AAA and Class I Shares do not have a sales charge. The maximum sales charge for Class A Shares and Class C Shares is 5.75% and 1.00%, respectively.
Investing in foreign securities involves risks not ordinarily associated with investments in domestic issues, including currency fluctuation, economic, and political risks. Investors should carefully consider the investment objectives, risks, charges, and expenses of the Fund before investing. The prospectuses contain information about these and other matters and should be read carefully before investing. To obtain a prospectus, please visit our website at www.gabelli.com.
Returns represent past performance and do not guarantee future results. Investment returns and the principal value of an investment will fluctuate. When shares are redeemed, they may be worth more or less than their original cost. Current performance may be lower or higher than the performance data presented. Visit www.gabelli.com for performance information as of the most recent month end.
4
COMPARISON OF CHANGE IN VALUE OF A $10,000 INVESTMENT IN
THE GABELLI GLOBAL FINANCIAL SERVICES FUND (CLASS AAA SHARES) AND MSCI WORLD FINANCIALS INDEX (Unaudited)
| Average Annual Total Returns* | |||
| 1 Year | 2 Year | Since Inception | |
| Class AAA | 69.04% | 16.05% | 7.11% |
* Past performance is not predictive of future results. The performance tables and graph do not reflect the deduction of taxes that a shareholder would pay on Fund distributions or the redemption of Fund shares.
5
| The Gabelli Global Financial Services Fund | |
| Disclosure of Fund Expenses (Unaudited) | |
| For the Six Month Period from April 1, 2021 through September 30, 2021 | Expense Table |
We believe it is important for you to understand the impact of fees and expenses regarding your investment. All mutual funds have operating expenses. As a shareholder of a fund, you incur ongoing costs, which include costs for portfolio management, administrative services, and shareholder reports (like this one), among others. Operating expenses, which are deducted from a fund’s gross income, directly reduce the investment return of a fund. When a fund’s expenses are expressed as a percentage of its average net assets, this figure is known as the expense ratio. The following examples are intended to help you understand the ongoing costs (in dollars) of investing in your Fund and to compare these costs with those of other mutual funds. The examples are based on an investment of $1,000 made at the beginning of the period shown and held for the entire period.
The Expense Table below illustrates your Fund’s costs in two ways:
Actual Fund Return: This section provides information about actual account values and actual expenses. You may use this section to help you to estimate the actual expenses that you paid over the period after any fee waivers and expense reimbursements. The “Ending Account Value” shown is derived from the Fund’s actual return during the past six months, and the “Expenses Paid During Period” shows the dollar amount that would have been paid by an investor who started with $1,000 in the Fund. You may use this information, together with the amount you invested, to estimate the expenses that you paid over the period.
To do so, simply divide your account value by $1,000 (for example, an $8,600 account value divided by $1,000 = 8.6), then multiply the result by the number given for your Fund under the heading “Expenses Paid During Period” to estimate the expenses you paid during this period.
Hypothetical 5% Return: This section provides information about hypothetical account values and hypothetical expenses based on the Fund’s actual expense ratio. It assumes a hypothetical annualized return of 5% before expenses during the period shown. In this case – because the hypothetical return used is not the Fund’s actual return – the results do not apply to your investment and you cannot use the hypothetical account value and expense to estimate the actual ending account balance or expenses you
paid for the period. This example is useful in making comparisons of the ongoing costs of investing in the Fund and other funds. To do so, compare this 5% hypothetical example with the 5% hypothetical examples that appear in shareholder reports of other funds.
Please note that the expenses shown in the table are meant to highlight your ongoing costs only and do not reflect any transactional costs such as sales charges (loads), redemption fees, or exchange fees, if any, which are described in the Prospectus. If these costs were applied to your account, your costs would be higher. Therefore, the 5% hypothetical return is useful in comparing ongoing costs only, and will not help you determine the relative total costs of owning different funds. The “Annualized Expense Ratio” represents the actual expenses for the last six months and may be different from the expense ratio in the Financial Highlights which is for the fiscal year ended September 30, 2021.
Beginning Account Value 04/01/21 | Ending Account Value 09/30/21 | Annualized Expense Ratio | Expenses Paid During Period* | |||||||||||||
| The Gabelli Global Financial Services Fund | ||||||||||||||||
| Actual Fund Return | ||||||||||||||||
| Class AAA | $ | 1,000.00 | $ | 1,088.60 | 1.25 | % | $ | 6.54 | ||||||||
| Class A | $ | 1,000.00 | $ | 1,088.10 | 1.25 | % | $ | 6.54 | ||||||||
| Class C | $ | 1,000.00 | $ | 1,083.50 | 2.00 | % | $ | 10.45 | ||||||||
| Class I | $ | 1,000.00 | $ | 1,089.60 | 1.00 | % | $ | 5.24 | ||||||||
| Hypothetical 5% Return | ||||||||||||||||
| Class AAA | $ | 1,000.00 | $ | 1,018.80 | 1.25 | % | $ | 6.33 | ||||||||
| Class A | $ | 1,000.00 | $ | 1,018.80 | 1.25 | % | $ | 6.33 | ||||||||
| Class C | $ | 1,000.00 | $ | 1,015.04 | 2.00 | % | $ | 10.10 | ||||||||
| Class I | $ | 1,000.00 | $ | 1,020.05 | 1.00 | % | $ | 5.06 | ||||||||
| * | Expenses are equal to the Fund’s annualized expense ratio for the last six months multiplied by the average account value over the period, multiplied by the number of days in the most recent fiscal half year (183 days), then divided by 365. |
6
Summary of Portfolio Holdings (Unaudited)
The following table presents portfolio holdings as a percent of net assets as of September 30, 2021:
The Gabelli Global Financial Services Fund
| Banks | 22.6 | % | ||
| Diversified Banks | 15.8 | % | ||
| Investment Management | 12.2 | % | ||
| Insurance | 9.7 | % | ||
| Institutional Brokerage | 8.5 | % | ||
| Institutional Trust, Fiduciary, and Custody | 7.3 | % | ||
| Consumer Finance | 6.7 | % |
| Automobiles | 5.6 | % | ||
| U.S. Government Obligations | 5.1 | % | ||
| Homebuilders | 4.9 | % | ||
| Reinsurance | 1.5 | % | ||
| Other Assets and Liabilities (Net) | 0.1 | % | ||
| 100.0 | % |
The Fund files a complete schedule of portfolio holdings with the Securities and Exchange Commission (the SEC) for the first and third quarters of each fiscal year on Form N-PORT. Shareholders may obtain this information at www.gabelli.com or by calling the Fund at 800-GABELLI (800-422-3554). The Fund’s Form N-PORT is available on the SEC’s website at www.sec.gov and may also be reviewed and copied at the SEC’s Public Reference Room in Washington, DC. Information on the operation of the Public Reference Room may be obtained by calling 800-SEC-0330.
Proxy Voting
The Fund files Form N-PX with its complete proxy voting record for the twelve months ended June 30, no later than August 31 of each year. A description of the Fund’s proxy voting policies, procedures, and how the Fund voted proxies relating to portfolio securities is available without charge, upon request, by (i) calling 800-GABELLI (800-422-3554); (ii) writing to The Gabelli Funds at One Corporate Center, Rye, NY 10580-1422; or (iii) visiting the SEC’s website at www.sec.gov.
7
| The Gabelli Global Financial Services Fund |
| Schedule of Investments — September 30, 2021 |
| Market | ||||||||||||
| Shares | Cost | Value | ||||||||||
| COMMON STOCKS 94.8% | ||||||||||||
| Automobiles 5.6% | ||||||||||||
| 7,900 | Daimler AG | $ | 454,697 | $ | 702,062 | |||||||
| 3,910 | Toyota Motor Corp., ADR | 501,290 | 695,003 | |||||||||
| 955,987 | 1,397,065 | |||||||||||
| Banks — 22.6% | ||||||||||||
| 68,000 | Banco Bilbao Vizcaya Argentaria SA | 364,384 | 450,316 | |||||||||
| 19,950 | CIT Group Inc | 377,937 | 1,036,403 | |||||||||
| 96,500 | Commerzbank AG† | 597,486 | 643,298 | |||||||||
| 350,800 | Dah Sing Banking Group Ltd. | 363,239 | 321,299 | |||||||||
| 206,000 | Dah Sing Financial Holdings Ltd. | 859,422 | 615,249 | |||||||||
| 28,200 | ING Groep NV | 229,850 | 410,540 | |||||||||
| 40,300 | Japan Post Bank Co. Ltd. | 411,118 | 347,617 | |||||||||
| 21,500 | Shinhan Financial Group Co. Ltd., ADR | 735,279 | 723,905 | |||||||||
| 38,300 | Shinsei Bank Ltd. | 547,720 | 644,900 | |||||||||
| 7,700 | Webster Financial Corp. | 235,622 | 419,342 | |||||||||
| 4,722,057 | 5,612,869 | |||||||||||
| Consumer Finance — 6.7% | ||||||||||||
| 17,900 | Ally Financial Inc. | 436,425 | 913,795 | |||||||||
| 4,700 | Capital One Financial Corp. | 376,974 | 761,259 | |||||||||
| 813,399 | 1,675,054 | |||||||||||
| Diversified Banks — 15.8% | ||||||||||||
| 237,500 | Barclays plc | 489,692 | 606,734 | |||||||||
| 13,650 | Citigroup Inc. | 825,250 | 957,957 | |||||||||
| 44,820 | Credit Agricole SA | 529,047 | 620,203 | |||||||||
| 223,000 | NatWest Group plc | 559,553 | 675,758 | |||||||||
| 11,910 | Societe Generale SA | 291,611 | 375,181 | |||||||||
| 116,100 | Standard Chartered plc | 793,646 | 682,049 | |||||||||
| 3,488,799 | 3,917,882 | |||||||||||
| Homebuilders — 4.9% | ||||||||||||
| 3,010 | Cavco Industries Inc.† | 414,062 | 712,587 | |||||||||
| 27,409 | Legacy Housing Corp.† | 338,783 | 492,540 | |||||||||
| 752,845 | 1,205,127 | |||||||||||
| Institutional Brokerage — 8.5% | ||||||||||||
| 26,800 | Credit Suisse Group AG, ADR | 257,444 | 264,248 | |||||||||
| 109,900 | Daiwa Securities Group Inc. | 588,301 | 645,704 | |||||||||
| 32,310 | Jefferies Financial Group Inc. | 643,568 | 1,199,670 | |||||||||
| 1,489,313 | 2,109,622 | |||||||||||
| Institutional Trust, Fiduciary, and Custody — 7.3% | ||||||||||||
| 8,450 | State Street Corp. | 444,650 | 715,884 | |||||||||
| Shares | Cost | Market Value | ||||||||||
| 21,050 | The Bank of New York Mellon Corp. | $ | 974,205 | $ | 1,091,232 | |||||||
| 1,418,855 | 1,807,116 | |||||||||||
| Insurance — 9.7% | ||||||||||||
| 144,118 | Aegon NV | 562,271 | 745,717 | |||||||||
| 847 | E-L Financial Corp. Ltd. | 662,570 | 625,246 | |||||||||
| 6,479 | HG Holdings Inc.† | 60,708 | 59,769 | |||||||||
| 18,829 | NN Group NV | 761,019 | 987,364 | |||||||||
| 2,046,568 | 2,418,096 | |||||||||||
| Investment Management — 12.2% | ||||||||||||
| 30,950 | Franklin Resources Inc. | 835,878 | 919,834 | |||||||||
| 26,900 | Janus Henderson Group plc | 570,948 | 1,111,777 | |||||||||
| 52,029 | Westwood Holdings Group Inc. | 735,133 | 988,551 | |||||||||
| 2,141,959 | 3,020,162 | |||||||||||
| Reinsurance — 1.5% | ||||||||||||
| 8,000 | Axis Capital Holdings Ltd. | 388,503 | 368,320 | |||||||||
| TOTAL COMMON STOCKS | 18,218,285 | 23,531,313 | ||||||||||
| Principal Amount | ||||||||||||
| CONVERTIBLE CORPORATE BONDS — 0.0% | ||||||||||||
| Institutional Brokerage — 0.0% | ||||||||||||
| $ | 13,000 | Credit Suisse Group Guernsey VII Ltd., 3.000%, 11/12/21 | 14,304 | 15,030 | ||||||||
| U.S. GOVERNMENT OBLIGATIONS — 5.1% | ||||||||||||
| 1,260,000 | U.S. Treasury Bills, 0.017% to 0.047%††, 10/28/21 to 12/23/21 | 1,259,936 | 1,259,940 | |||||||||
| TOTAL INVESTMENTS — 99.9% | $ | 19,492,525 | 24,806,283 | |||||||||
| Other Assets and Liabilities (Net) — 0.1% | 13,068 | |||||||||||
| NET ASSETS — 100.0% | $ | 24,819,351 | ||||||||||
| † | Non-income producing security. |
| †† | Represents annualized yields at dates of purchase. |
| ADR | American Depositary Receipt |
See accompanying notes to financial statements.
8
The Gabelli Global Financial Services Fund
| Statement of Assets and Liabilities |
| September 30, 2021 |
| Assets: | ||||
| Investments, at value (cost $19,492,525) | $ | 24,806,283 | ||
| Receivable for investments sold | 63,009 | |||
| Receivable for Fund shares sold | 2,687 | |||
| Receivable from Adviser | 15,006 | |||
| Dividends and interest receivable | 49,177 | |||
| Prepaid expenses | 36,079 | |||
| Total Assets | 24,972,241 | |||
| Liabilities: | ||||
| Payable to bank | 36,907 | |||
| Foreign currency overdraft, at value (cost $142) | 136 | |||
| Payable for investments purchased | 36,164 | |||
| Payable for investment advisory fees | 20,334 | |||
| Payable for distribution fees | 119 | |||
| Payable for shareholder communications | 25,445 | |||
| Payable for legal and audit fees | 21,950 | |||
| Payable for custodian fees | 8,822 | |||
| Other accrued expenses | 3,013 | |||
| Total Liabilities | 152,890 | |||
| Net Assets | ||||
| (applicable to 2,103,657 shares outstanding) | $ | 24,819,351 | ||
| Net Assets Consist of: | ||||
| Paid-in capital | $ | 20,053,949 | ||
| Total distributable earnings | 4,765,402 | |||
| Net Assets | $ | 24,819,351 | ||
| Shares of Capital Stock, each at $0.001 par value: | ||||
| Class AAA: | ||||
| Net Asset Value, offering, and redemption price per share ($564,007 ÷ 47,807 shares outstanding; 120,000,000 shares authorized) | $ | 11.80 | ||
| Class A: | ||||
| Net Asset Value and redemption price per share ($33,264 ÷ 2,805 shares outstanding; 60,000,000 shares authorized) | $ | 11.86 | ||
| Maximum offering price per share (NAV ÷ 0.9425, based on maximum sales charge of 5.75% of the offering price) | $ | 12.58 | ||
| Class C: | ||||
| Net Asset Value and offering price per share ($1,200 ÷ 102.76 shares outstanding; 20,000,000 shares authorized) | $ | 11.68 | (a) | |
| Class I: | ||||
| Net Asset Value, offering, and redemption price per share ($24,220,880 ÷ 2,052,942 shares outstanding; 150,000,000 shares authorized) | $ | 11.80 | ||
| Statement of Operations |
| For the Year Ended September 30, 2021 |
| Investment Income: | ||||
| Dividends (net of foreign withholding taxes of $49,065) | $ | 800,321 | ||
| Interest | 415 | |||
| Total Investment Income | 800,736 | |||
| Expenses: | ||||
| Investment advisory fees | 211,129 | |||
| Distribution fees - Class AAA | 646 | |||
| Distribution fees - Class A | 54 | |||
| Distribution fees - Class C | 11 | |||
| Registration expenses | 57,726 | |||
| Legal and audit fees | 46,493 | |||
| Shareholder communications expenses | 23,924 | |||
| Shareholder services fees | 12,496 | |||
| Custodian fees | 10,337 | |||
| Directors’ fees | 1,494 | |||
| Miscellaneous expenses | 14,183 | |||
| Total Expenses | 378,493 | |||
| Less: | ||||
| Expense reimbursements (See Note 3) | (165,217 | ) | ||
| Expenses paid indirectly by broker (See Note 6) | (1,437 | ) | ||
| Total Credits and Reimbursements | (166,654 | ) | ||
| Net Expenses | 211,839 | |||
| Net Investment Income | 588,897 | |||
| Net Realized and Unrealized Gain/(Loss) on Investments, Forward Foreign Exchange Contracts, and Foreign Currency: | ||||
| Net realized gain on investments | 143,087 | |||
| Net realized loss on forward foreign exchange contracts | (187 | ) | ||
| Net realized loss on foreign currency transactions | (1,369 | ) | ||
| Net realized gain on investments, forward foreign exchange contracts, and foreign currency transactions | 141,531 | |||
| Net change in unrealized appreciation/depreciation: on investments | 8,857,059 | |||
| on foreign currency translations | (171 | ) | ||
| Net change in unrealized appreciation/depreciation on investments and foreign currency translations | ||||
| 8,856,888 | ||||
| Net Realized and Unrealized Gain/(Loss) on Investments, Forward Foreign Exchange Contracts, and Foreign Currency | 8,998,419 | |||
| Net Increase in Net Assets Resulting from Operations | $ | 9,587,316 | ||
| (a) | Redemption price varies based on the length of time held. |
See accompanying notes to financial statements.
9
| The Gabelli Global Financial Services Fund |
| Statement of Changes in Net Assets |
Year Ended September 30, 2021 | Year Ended September 30, 2020 | |||||||
| Operations: | ||||||||
| Net investment income | $ | 588,897 | $ | 255,051 | ||||
| Net realized gain/(loss) on investments, forward foreign exchange contracts, and foreign currency transactions | 141,531 | (1,019,053 | ) | |||||
| Net change in unrealized appreciation/depreciation on investments and foreign currency translations | 8,856,888 | (2,603,272 | ) | |||||
| Net Increase/(Decrease) in Net Assets Resulting from Operations | 9,587,316 | (3,367,274 | ) | |||||
| Distributions to Shareholders: | ||||||||
| Accumulated earnings | ||||||||
| Class AAA | (858 | ) | (1,646 | ) | ||||
| Class A | (92 | ) | (264 | ) | ||||
| Class C | (8 | ) | (17 | ) | ||||
| Class I | (285,578 | ) | (377,283 | ) | ||||
| Total Distributions to Shareholders | (286,536 | ) | (379,210 | ) | ||||
| Capital Share Transactions: | ||||||||
| Class AAA | 453,786 | (63,425 | ) | |||||
| Class A | 18,752 | (8,303 | ) | |||||
| Class C | 8 | 17 | ||||||
| Class I | 1,544,852 | 4,081,055 | ||||||
| Net Increase in Net Assets from Capital Share Transactions | 2,017,398 | 4,009,344 | ||||||
| Redemption Fees | — | 503 | ||||||
| Net Increase in Net Assets | 11,318,178 | 263,363 | ||||||
| Net Assets: | ||||||||
| Beginning of year | 13,501,173 | 13,237,810 | ||||||
| End of year | $ | 24,819,351 | $ | 13,501,173 | ||||
See accompanying notes to financial statements.
10
| The Gabelli Global Financial Services Fund |
| Financial Highlights |
Selected data for a share of capital stock outstanding throughout each year:
| Income (Loss) from Investment Operations | Distributions | Ratios to Average Net Assets/Supplemental Data | |||||||||||||||||||||||||||||||||||||||||||||||||||||||
Year Ended September 30 | Net Asset Value, Beginning of Period | Net Investment Income(a) | Net Realized and Unrealized Gain (Loss) on Investments | Total from Investment Operations | Net Investment Income | Total Distributions | Redemption Fees(a) | Net Asset Value, End of Period | Total Return† | Net Assets, End of Period (in 000’s) | Net Investment Income | Operating Expenses Before Reimbursement | Operating Expenses Net of Reimbursement(b) | Portfolio Turnover Rate | |||||||||||||||||||||||||||||||||||||||||||
| Class AAA | |||||||||||||||||||||||||||||||||||||||||||||||||||||||||
| 2021 | $ | 7.08 | $ | 0.33 | $ | 4.52 | $ | 4.85 | $ | (0.13 | ) | $ | (0.13 | ) | $ | — | $ | 11.80 | 69.04 | % | $ | 564 | 2.99 | % | 2.04 | % | 1.25 | %(c) | 19 | % | |||||||||||||||||||||||||||
| 2020 | 9.09 | 0.11 | (1.90 | ) | (1.79 | ) | (0.22 | ) | (0.22 | ) | 0.00 | (d) | 7.08 | (20.33 | ) | 47 | 1.34 | 2.51 | 1.25 | (c) | 18 | ||||||||||||||||||||||||||||||||||||
| 2019(e) | 10.00 | 0.27 | (1.15 | ) | (0.88 | ) | (0.03 | ) | (0.03 | ) | — | 9.09 | (8.76 | ) | 134 | 3.01 | 2.32 | 1.25 | 14 | ||||||||||||||||||||||||||||||||||||||
| Class A | |||||||||||||||||||||||||||||||||||||||||||||||||||||||||
| 2021 | $ | 7.08 | $ | 0.32 | $ | 4.54 | $ | 4.86 | $ | (0.08 | ) | $ | (0.08 | ) | $ | — | $ | 11.86 | 69.07 | % | $ | 33 | 2.94 | % | 2.04 | % | 1.25 | %(c) | 19 | % | |||||||||||||||||||||||||||
| 2020 | 9.10 | 0.16 | (1.94 | ) | (1.78 | ) | (0.24 | ) | (0.24 | ) | 0.00 | (d) | 7.08 | (20.24 | ) | 8 | 2.12 | 2.51 | 1.25 | (c) | 18 | ||||||||||||||||||||||||||||||||||||
| 2019(e) | 10.00 | 0.35 | (1.22 | ) | (0.87 | ) | (0.03 | ) | (0.03 | ) | — | 9.10 | (8.71 | ) | 10 | 3.77 | 2.32 | 1.25 | 14 | ||||||||||||||||||||||||||||||||||||||
| Class C | |||||||||||||||||||||||||||||||||||||||||||||||||||||||||
| 2021 | $ | 7.03 | $ | 0.18 | $ | 4.55 | $ | 4.73 | $ | (0.08 | ) | $ | (0.08 | ) | $ | — | $ | 11.68 | 67.59 | % | $ | 1 | 1.77 | % | 2.79 | % | 2.00 | %(c) | 19 | % | |||||||||||||||||||||||||||
| 2020 | 9.05 | 0.06 | (1.91 | ) | (1.85 | ) | (0.17 | ) | (0.17 | ) | 0.00 | (d) | 7.03 | (20.97 | ) | 1 | 0.76 | 3.26 | 2.00 | (c) | 18 | ||||||||||||||||||||||||||||||||||||
| 2019(e) | 10.00 | 0.17 | (1.11 | ) | (0.94 | ) | (0.01 | ) | (0.01 | ) | — | 9.05 | (9.39 | ) | 1 | 1.85 | 3.08 | 2.00 | 14 | ||||||||||||||||||||||||||||||||||||||
| Class I | |||||||||||||||||||||||||||||||||||||||||||||||||||||||||
| 2021 | $ | 7.08 | $ | 0.29 | $ | 4.58 | $ | 4.87 | $ | (0.15 | ) | $ | (0.15 | ) | $ | — | $ | 11.80 | 69.45 | % | $ | 24,221 | 2.79 | % | 1.79 | % | 1.00 | %(c) | 19 | % | |||||||||||||||||||||||||||
| 2020 | 9.11 | 0.14 | (1.91 | ) | (1.77 | ) | (0.26 | ) | (0.26 | ) | 0.00 | (d) | 7.08 | (20.17 | ) | 13,445 | 1.84 | 2.26 | 1.00 | (c) | 18 | ||||||||||||||||||||||||||||||||||||
| 2019(e) | 10.00 | 0.28 | (1.13 | ) | (0.85 | ) | (0.04 | ) | (0.04 | ) | — | 9.11 | (8.51 | ) | 13,093 | 3.05 | 2.07 | 1.00 | 14 | ||||||||||||||||||||||||||||||||||||||
| † | Total return represents aggregate total return of a hypothetical investment at the beginning of the period and sold at the end of the period. Total return for a period of less than one year is not annualized. |
| (a) | Per share amounts have been calculated using the average shares outstanding method. |
| (b) | Under an expense reimbursement agreement with the Adviser, the Adviser reimbursed expenses of $165,217, $174,126 and $124,154 for the fiscal years ended September 30, 2021, 2020 and 2019, respectively. |
| (c) | The Fund received credits from a designated broker who agreed to pay certain Fund expenses. For the fiscal years ended September 30, 2021 and 2020, if credits had not been received, the expense ratios would have been 1.26% and 1.26% (Class AAA and Class A), 2.01 and 2.01% (Class C), and 1.01% and 1.01% (Class I), respectively. |
| (d) | Amount represents less than $0.005 per share. |
| (e) | The Fund commenced investment operations on October 1, 2018. |
See accompanying notes to financial statements.
11
| The Gabelli Global Financial Services Fund |
| Notes to Financial Statements |
1. Organization. The Gabelli Global Financial Services Fund is a series of the Gabelli Equity Series Funds, Inc. (the Corporation). The Corporation was incorporated on July 25, 1991 in Maryland. The Fund is a non-diversified open-end management investment company registered under the Investment Company Act of 1940, as amended (the 1940 Act), and one of four separately managed portfolios of the Corporation. The Fund seeks to provide capital appreciation. The Fund commenced investment operations on October 1, 2018.
2. Significant Accounting Policies. As an investment company, the Fund follows the investment company accounting and reporting guidance, which is part of U.S. generally accepted accounting principles (GAAP) that may require the use of management estimates and assumptions in the preparation of its financial statements. Actual results could differ from those estimates. The following is a summary of significant accounting policies followed by the Fund in the preparation of its financial statements.
The global outbreak of the novel coronavirus disease, known as COVID-19, has caused adverse effects on many companies, sectors, nations, regions, and the markets in general, and may continue for an unpredictable duration. The effects of this pandemic may materially impact the value and performance of the Fund, its ability to buy and sell fund investments at appropriate valuations, and its ability to achieve its investment objectives.
New Accounting Pronouncements. In March 2020, the Financial Accounting Standards Board (FASB) issued Accounting Standards Update (ASU) No. 2020-04, Reference Rate Reform (Topic 848) – Facilitation of the Effects of Reference Rate Reform on Financial Reporting. The amendments in the ASU provides optional temporary financial reporting relief from the effect of certain types of contract modifications due to the planned discontinuation of the London Interbank Offered Rate (LIBOR) and other interbank-offered based reference rates as of the end of 2021. The ASU is effective for certain reference rate-related contract modifications that occur through December 31, 2022. Management has reviewed the requirements and believes the adoption of this ASU will not have a material impact on the financial statements.
Security Valuation. Portfolio securities listed or traded on a nationally recognized securities exchange or traded in the U.S. over-the-counter market for which market quotations are readily available are valued at the last quoted sale price or a market’s official closing price as of the close of business on the day the securities are being valued. If there were no sales that day, the security is valued at the average of the closing bid and asked prices or, if there were no asked prices quoted on that day, then the security is valued at the closing bid price on that day. If no bid or asked prices are quoted on such day, the security is valued at the most recently available price or, if the Board of Directors (the Board) so determines, by such other method as the Board shall determine in good faith to reflect its fair market value. Portfolio securities traded on more than one national securities exchange or market are valued according to the broadest and most representative market, as determined by Gabelli Funds, LLC (the Adviser).
Portfolio securities primarily traded on a foreign market are generally valued at the preceding closing values of such securities on the relevant market, but may be fair valued pursuant to procedures established by the Board if market conditions change significantly after the close of the foreign market, but prior to the close of business on the day the securities are being valued. Debt obligations for which market quotations are readily available are valued at the average of the latest bid and asked prices. If there were no asked prices quoted on such day, the security is valued using the closing bid price, unless the Board determines such amount does not reflect the securities’ fair value, in which case these securities will be fair valued as determined by the Board. Certain
12
| The Gabelli Global Financial Services Fund |
| Notes to Financial Statements (Continued) |
securities are valued principally using dealer quotations. Futures contracts are valued at the closing settlement price of the exchange or board of trade on which the applicable contract is traded. OTC futures and options on futures for which market quotations are readily available will be valued by quotations received from a pricing service or, if no quotations are available from a pricing service, by quotations obtained from one of more dealers in the instrument in question by the Adviser.
Securities and assets for which market quotations are not readily available are fair valued as determined by the Board. Fair valuation methodologies and procedures may include, but are not limited to: analysis and review of available financial and non-financial information about the company; comparisons with the valuation and changes in valuation of similar securities, including a comparison of foreign securities with the equivalent U.S. dollar value American Depositary Receipt securities at the close of the U.S. exchange; and evaluation of any other information that could be indicative of the value of the security.
The inputs and valuation techniques used to measure fair value of the Fund’s investments are summarized into three levels as described in the hierarchy below:
| ● | Level 1 — quoted prices in active markets for identical securities; |
| ● | Level 2 — other significant observable inputs (including quoted prices for similar securities, interest rates, prepayment speeds, credit risk, etc.); and |
| ● | Level 3 — significant unobservable inputs (including the Board’s determinations as to the fair value of investments). |
A financial instrument’s level within the fair value hierarchy is based on the lowest level of any input both individually and in the aggregate that is significant to the fair value measurement. The inputs or methodology used for valuing securities are not necessarily an indication of the risk associated with investing in those securities. The summary of the Fund’s investments in securities by inputs used to value the Fund’s investments as of September 30, 2021 is as follows:
| Valuation Inputs | ||||||||||||
| Level 1 Quoted Prices | Level 2 Other Significant Observable Inputs | Total Market Value at 09/30/21 | ||||||||||
| INVESTMENTS IN SECURITIES: | ||||||||||||
| ASSETS (Market Value): | ||||||||||||
| Common Stocks | ||||||||||||
| Insurance | $ | 2,358,327 | $ | 59,769 | $ | 2,418,096 | ||||||
| Other Industries (a) | 21,113,217 | — | 21,113,217 | |||||||||
| Total Common Stocks | 23,471,544 | 59,769 | 23,531,313 | |||||||||
| Convertible Corporate Bonds (a) | — | 15,030 | 15,030 | |||||||||
| U.S. Government Obligations | — | 1,259,940 | 1,259,940 | |||||||||
| TOTAL INVESTMENTS IN SECURITIES – ASSETS | $ | 23,471,544 | $ | 1,334,739 | $ | 24,806,283 | ||||||
(a) Please refer to the Schedule of Investments for the industry classifications of these portfolio holdings.
The Fund held no Level 3 investments at September 30, 2021 or September 30, 2020.
13
| The Gabelli Global Financial Services Fund |
| Notes to Financial Statements (Continued) |
Additional Information to Evaluate Qualitative Information.
General. The Fund uses recognized industry pricing services – approved by the Board and unaffiliated with the Adviser – to value most of its securities, and uses broker quotes provided by market makers of securities not valued by these and other recognized pricing sources. Several different pricing feeds are received to value domestic equity securities, international equity securities, preferred equity securities, and fixed income securities. The data within these feeds are ultimately sourced from major stock exchanges and trading systems where these securities trade. The prices supplied by external sources are checked by obtaining quotations or actual transaction prices from market participants. If a price obtained from the pricing source is deemed unreliable, prices will be sought from another pricing service or from a broker/dealer that trades that security or similar securities.
Fair Valuation. Fair valued securities may be common or preferred equities, warrants, options, rights, or fixed income obligations. Where appropriate, Level 3 securities are those for which market quotations are not available, such as securities not traded for several days, or for which current bids are not available, or which are restricted as to transfer. When fair valuing a security, factors to consider include recent prices of comparable securities that are publicly traded, reliable prices of securities not publicly traded, the use of valuation models, current analyst reports, valuing the income or cash flow of the issuer, or cost if the preceding factors do not apply. A significant change in the unobservable inputs could result in a lower or higher value in Level 3 securities. The circumstances of Level 3 securities are frequently monitored to determine if fair valuation measures continue to apply.
The Adviser reports quarterly to the Board the results of the application of fair valuation policies and procedures. These may include backtesting the prices realized in subsequent trades of these fair valued securities to fair values previously recognized.
Foreign Currency Translations. The books and records of the Fund are maintained in U.S. dollars. Foreign currencies, investments, and other assets and liabilities are translated into U.S. dollars at current exchange rates. Purchases and sales of investment securities, income, and expenses are translated at the exchange rate prevailing on the respective dates of such transactions. Unrealized gains and losses that result from changes in foreign exchange rates and/or changes in market prices of securities have been included in unrealized appreciation/depreciation on investments and foreign currency translations. Net realized foreign currency gains and losses resulting from changes in exchange rates include foreign currency gains and losses between trade date and settlement date on investment securities transactions, foreign currency transactions, and the difference between the amounts of interest and dividends recorded on the books of the Fund and the amounts actually received. The portion of foreign currency gains and losses related to fluctuation in exchange rates between the initial purchase trade date and subsequent sale trade date is included in realized gain/(loss) on investments.
Foreign Securities. The Fund may directly purchase securities of foreign issuers. Investing in securities of foreign issuers involves special risks not typically associated with investing in securities of U.S. issuers. The risks include possible revaluation of currencies, the inability to repatriate funds, less complete financial information about companies, and possible future adverse political and economic developments. Moreover, securities of many foreign issuers and their markets may be less liquid and their prices more volatile than securities of comparable U.S. issuers.
14
| The Gabelli Global Financial Services Fund |
| Notes to Financial Statements (Continued) |
Foreign Taxes. The Fund may be subject to foreign taxes on income, gains on investments, or currency repatriation, a portion of which may be recoverable. The Fund will accrue such taxes and recoveries as applicable, based upon its current interpretation of tax rules and regulations that exist in the markets in which it invests.
Restricted Securities. The Fund may invest up to 15% of its net assets in securities for which the markets are restricted. Restricted securities include securities whose disposition is subject to substantial legal or contractual restrictions. The sale of restricted securities often requires more time and results in higher brokerage charges or dealer discounts and other selling expenses than the sale of securities eligible for trading on national securities exchanges or in the over-the-counter markets. Restricted securities may sell at a price lower than similar securities that are not subject to restrictions on resale. Securities freely saleable among qualified institutional investors under special rules adopted by the SEC may be treated as liquid if they satisfy liquidity standards established by the Board. The continued liquidity of such securities is not as well assured as that of publicly traded securities, and accordingly the Board will monitor their liquidity. At September 30, 2021, the Fund did not hold any restricted securities.
Securities Transactions and Investment Income. Securities transactions are accounted for on the trade date with realized gain/(loss) on investments determined by using the identified cost method. Interest income (including amortization of premium and accretion of discount) is recorded on an accrual basis. Premiums and discounts on debt securities are amortized using the effective yield to maturity method or amortized to earliest call date, if applicable. Dividend income is recorded on the ex-dividend date, except for certain dividends from foreign securities that are recorded as soon after the ex-dividend date as the Fund becomes aware of such dividends.
Determination of Net Asset Value and Calculation of Expenses. Certain administrative expenses are common to, and allocated among, various affiliated funds. Such allocations are made on the basis of each fund’s average net assets or other criteria directly affecting the expenses as determined by the Adviser pursuant to procedures established by the Board.
In calculating the NAV per share of each class, investment income, realized and unrealized gains and losses, redemption fees, and expenses other than class specific expenses are allocated daily to each class of shares based upon the proportion of net assets of each class at the beginning of each day. Distribution expenses are borne solely by the class incurring the expense.
Distributions to Shareholders. Distributions to shareholders are recorded on the ex-dividend date. The characterization of distributions to shareholders is based on income and capital gains as determined in accordance with federal income tax regulations, which may differ from income and capital gains as determined under GAAP. These differences are primarily due to the tax treatment of currency gains and losses. Distributions from net investment income for federal income tax purposes include net realized gains on foreign currency transactions. These book/tax differences are either temporary or permanent in nature. To the extent these differences are permanent, adjustments are made to the appropriate capital accounts in the period when the differences arise. Permanent differences were primarily due to the tax treatment of currency gains and losses. These reclassifications have no impact on the NAV of the Fund.
15
| The Gabelli Global Financial Services Fund |
| Notes to Financial Statements (Continued) |
The tax character of distributions paid during the fiscal years ended September 30, 2021 and 2020 was as follows:
| Year Ended | Year Ended | |||||||
| September 30, 2021 | September 30, 2020 | |||||||
| Distributions paid from: | ||||||||
| Ordinary income | $ | 286,536 | $ | 379,210 | ||||
| Total distributions paid | $ | 286,536 | $ | 379,210 | ||||
Provision for Income Taxes. The Fund intends to continue to qualify as a regulated investment company under Subchapter M of the Internal Revenue Code of 1986, as amended (the Code). It is the policy of the Fund to comply with the requirements of the Code applicable to regulated investment companies and to distribute substantially all of its net investment company taxable income and net capital gains. Therefore, no provision for federal income taxes is required.
At September 30, 2021, the components of accumulated earnings/losses on a tax basis were as follows:
| Undistributed ordinary income | $ | 491,048 | ||
| Accumulated capital loss carryforwards | (1,013,391 | ) | ||
| Net unrealized appreciation on investments and foreign currency translations | 5,287,745 | |||
| Total | $ | 4,765,402 |
The Fund is permitted to carry capital losses forward for an unlimited period. Capital losses that are carried forward will retain their character as either short term or long term capital losses. The Fund has a short term capital loss carryforward with no expiration of $414,615 and a long term capital loss carryforward with no expiration of $598,776.
At September 30, 2021, the temporary difference between book basis and tax basis net unrealized appreciation on investments was due to the deferral of losses from wash sales for tax purposes and mark-to-market adjustments on investments considered passive foreign investment companies.
The following summarizes the tax cost of investments and the related net unrealized appreciation at September 30, 2021:
| Cost | Gross Unrealized Appreciation | Gross Unrealized Depreciation | Net Unrealized Appreciation | ||||||||||||||
| Investments | $ | 19,518,919 | $ | 5,885,493 | $ | (598,129 | ) | $ | 5,287,364 | ||||||||
The Fund is required to evaluate tax positions taken or expected to be taken in the course of preparing the Fund’s tax returns to determine whether the tax positions are “more-likely-than-not” of being sustained by the applicable tax authority. Income tax and related interest and penalties would be recognized by the Fund as tax expense in the Statement of Operations if the tax positions were deemed not to meet the more-likely-than-not threshold. For the fiscal year ended September 30, 2021, the Fund did not incur any income tax, interest, or penalties. As of September 30, 2021, the Adviser has reviewed all open tax years and concluded that there was
16
| The Gabelli Global Financial Services Fund |
| Notes to Financial Statements (Continued) |
no impact to the Fund’s net assets or results of operations. The Fund’s federal and state tax returns for the prior three fiscal years remain open, subject to examination. On an ongoing basis, the Adviser will monitor the Fund’s tax positions to determine if adjustments to this conclusion are necessary.
3. Investment Advisory Agreement and Other Transactions. The Fund has entered into an investment advisory agreement (the Advisory Agreement) with the Adviser which provides that the Fund will pay the Adviser a fee, computed daily and paid monthly, at the annual rate of 1.00% of the value of its average daily net assets. In accordance with the Advisory Agreement, the Adviser provides a continuous investment program for the Fund’s portfolio, oversees the administration of all aspects of the Fund’s business and affairs, and pays the compensation of all Officers and Directors of the Fund who are affiliated persons of the Adviser.
The Adviser has contractually agreed to waive its investment advisory fees and/or to reimburse expenses of the Fund to the extent necessary to maintain the annualized total operating expenses of the Fund (excluding brokerage costs, acquired fund fees and expenses, interest, taxes, and extraordinary expenses) at no more than an annual rate of 1.25%, 1.25%, 2.00%, and 1.00% for Class AAA, Class A, Class C, and Class I shares, respectively. This arrangement is in effect through January 31, 2022. For the fiscal year ended September 30, 2021, the Adviser reimbursed the Fund in the amount of $165,217. In addition, the Fund has also agreed, during the two year period following any waiver or reimbursement by the Adviser, to repay such amount to the extent, that after giving effect to the repayments, such adjusted annualized total operating expenses of the Fund would not exceed the foregoing expense limitations of the value of the Fund’s average daily net assets for Class AAA, Class A, Class C, and Class I Shares. At September 30, 2021, the cumulative amount which the Fund may repay the Adviser, subject to the terms above, is $339,343:
| For the fiscal year ended September 30, 2020, expiring September 30, 2022 | $ | 174,126 | |||
| For the fiscal year ended September 30, 2021, expiring September 30, 2023 | 165,217 | ||||
| $ | 339,343 |
4. Distribution Plan. The Fund’s Board has adopted a distribution plan (the Plan) for each class of shares, except for Class I Shares, pursuant to Rule 12b-1 under the 1940 Act. Under the Class AAA, Class A, and Class C Share Plans, payments are authorized to G.distributors, LLC (the Distributor), an affiliate of the Adviser, at annual rates of 0.25%, 0.25%, and 1.00%, respectively, of the average daily net assets of those classes, the annual limitations under each Plan. Such payments are accrued daily and paid monthly.
5. Portfolio Securities. Purchases and sales of securities during the fiscal year ended September 30, 2021, other than short term securities and U.S. Government obligations, aggregated $4,961,843 and $3,837,712, respectively.
6. Transactions with Affiliates and Other Arrangements. During the fiscal year ended September 30, 2021, the Fund paid $2,172 in brokerage commissions on security trades to G.research, LLC, an affiliate of the Adviser. Additionally, the Distributor retained a total of $38 from investors representing commissions (sales charges and underwriting fees) on sales and redemptions of Fund shares.
During the fiscal year ended September 30, 2021, the Fund received credits from a designated broker who agreed to pay certain Fund operating expenses. The amount of such expenses paid through this directed brokerage arrangement during this period was $1,437.
17
| The Gabelli Global Financial Services Fund |
| Notes to Financial Statements (Continued) |
The cost of calculating the Fund’s NAV per share is a Fund expense pursuant to the Advisory Agreement. The Fund reimburses the Adviser for this service. The Adviser did not seek a reimbursement during the fiscal year ended September 30, 2021.
The Corporation pays retainer and per meeting fees to Directors not affiliated with the Adviser, plus specified amounts to the Lead Director and Audit Committee Chairman. Directors are also reimbursed for out of pocket expenses incurred in attending meetings. Directors who are directors or employees of the Adviser or an affiliated company receive no compensation or expense reimbursement from the Corporation.
7. Line of Credit. The Fund participates in an unsecured line of credit, which expires on March 2, 2022 and may be renewed annually, of up to $75,000,000 under which it may borrow up to 10% of its net assets from the custodian for temporary borrowing purposes. Borrowings under this arrangement bear interest at a floating rate equal to the higher of the Overnight Federal Funds Rate plus 135 basis points or the Overnight Bank Funding Rate plus 135 basis points in effect on that day. This amount, if any, would be included in “Interest expense” in the Statement of Operations. During the fiscal year ended September 30, 2021, there were no borrowings under the line of credit.
8. Capital Stock. The Fund offers four classes of shares – Class AAA Shares, Class A Shares, Class C Shares, and Class I Shares. Class AAA and Class I Shares are offered without a sales charge. Class A Shares are subject to a maximum front-end sales charge of 5.75%. Class C Shares are subject to a 1.00% contingent deferred sales charge for one year after purchase.
The Fund imposes a redemption fee of 2.00% on all classes of shares that are redeemed or exchanged on or before the seventh day after the date of a purchase. The redemption fee is deducted from the proceeds otherwise payable to the redeeming shareholders and is retained by the Fund as an increase in paid-in capital. The redemption fees retained by the Fund during the fiscal years ended September 30, 2021 and 2020, if any, can be found in the Statement of Changes in Net Assets under Redemption Fees.
18
| The Gabelli Global Financial Services Fund |
| Notes to Financial Statements (Continued) |
Transactions in shares of capital stock were as follows:
| Year Ended | Year Ended | |||||||||||||||
| September 30, 2021 | September 30, 2020 | |||||||||||||||
| Shares | Amount | Shares | Amount | |||||||||||||
| Class AAA | ||||||||||||||||
| Shares sold | 43,802 | $ | 484,049 | 9,216 | $ | 71,042 | ||||||||||
| Shares issued upon reinvestment of distributions | 96 | 858 | 171 | 1,647 | ||||||||||||
| Shares redeemed | (2,821 | ) | (31,121 | ) | (17,429 | ) | (136,114 | ) | ||||||||
| Net increase/(decrease) | 41,077 | $ | 453,786 | (8,042 | ) | $ | (63,425 | ) | ||||||||
| Class A | ||||||||||||||||
| Shares sold | 1,707 | $ | 18,743 | 9,324 | $ | 59,425 | ||||||||||
| Shares issued upon reinvestment of distributions | 10 | 92 | 28 | 264 | ||||||||||||
| Shares redeemed | (10 | ) | (83 | ) | (9,349 | ) | (67,992 | ) | ||||||||
| Net increase/(decrease) | 1,707 | $ | 18,752 | 3 | $ | (8,303 | ) | |||||||||
| Class C | ||||||||||||||||
| Shares issued upon reinvestment of distributions | 1 | $ | 8 | 2 | $ | 17 | ||||||||||
| Net increase | 1 | $ | 8 | 2 | $ | 17 | ||||||||||
| Class I | ||||||||||||||||
| Shares sold | 130,600 | $ | 1,318,396 | 454,386 | $ | 3,950,997 | ||||||||||
| Shares issued upon reinvestment of distributions | 31,795 | 305,172 | 39,081 | 374,401 | ||||||||||||
| Shares redeemed | (7,406 | ) | (78,716 | ) | (32,357 | ) | (244,343 | ) | ||||||||
| Net increase | 154,989 | $ | 1,544,852 | 461,110 | $ | 4,081,055 | ||||||||||
9. Significant Shareholder. As of September 30, 2021, approximately 97.76% of the Fund was beneficially owned by the Adviser and its affiliates.
10. Indemnifications. The Fund enters into contracts that contain a variety of indemnifications. The Fund’s maximum exposure under these arrangements is unknown. However, the Fund has not had prior claims or losses pursuant to these contracts. Management has reviewed the Fund’s existing contracts and expects the risk of loss to be remote.
11. Subsequent Events. Management has evaluated the impact on the Fund of all subsequent events occurring through the date the financial statements were issued and has determined that there were no subsequent events requiring recognition or disclosure in the financial statements.
19
| The Gabelli Global Financial Services Fund |
| Report of Independent Registered Public Accounting Firm |
To the Shareholders of The Gabelli Global Financial Services Fund
and the Board of Directors of Gabelli Equity Series Funds, Inc.
Opinion on the Financial Statements
We have audited the accompanying statement of assets and liabilities of The Global Financial Services Fund (the “Fund”) (one of the funds constituting Gabelli Equity Series Funds, Inc. (the “Corporation”)), including the schedule of investments, as of September 30, 2021, and the related statement of operations for the year then ended, the statements of changes in net assets for each of the two years in the period then ended, the financial highlights for each of the two years in the period then ended and the period from October 1, 2018 (commencement of operations) through September 30, 2019 and the related notes (collectively referred to as the “financial statements”). In our opinion, the financial statements present fairly, in all material respects, the financial position of the Fund (one of the funds constituting Gabelli Equity Series Funds, Inc.) at September 30, 2021, the results of its operations for the year then ended, the changes in its net assets for each of the two years in the period then ended and its financial highlights for each of the two years in the period then ended and the period from October 1, 2018 (commencement of operations) through September 30, 2019, in conformity with U.S. generally accepted accounting principles.
Basis for Opinion
These financial statements are the responsibility of the Corporation’s management. Our responsibility is to express an opinion on the Fund’s financial statements based on our audits. We are a public accounting firm registered with the Public Company Accounting Oversight Board (United States) (“PCAOB”) and are required to be independent with respect to the Corporation in accordance with the U.S. federal securities laws and the applicable rules and regulations of the Securities and Exchange Commission and the PCAOB.
We conducted our audits in accordance with the standards of the PCAOB. Those standards require that we plan and perform the audit to obtain reasonable assurance about whether the financial statements are free of material misstatement, whether due to error or fraud. The Corporation is not required to have, nor were we engaged to perform, an audit of the Corporation’s internal control over financial reporting. As part of our audits we are required to obtain an understanding of internal control over financial reporting but not for the purpose of expressing an opinion on the effectiveness of the Corporation’s internal control over financial reporting. Accordingly, we express no such opinion.
Our audits included performing procedures to assess the risks of material misstatement of the financial statements, whether due to error or fraud, and performing procedures that respond to those risks. Such procedures included examining, on a test basis, evidence regarding the amounts and disclosures in the financial statements. Our procedures included confirmation of securities owned as of September 30, 2021, by correspondence with the custodian and brokers or by other appropriate auditing procedures where replies from brokers were not received. Our audits also included evaluating the accounting principles used and significant estimates made by management, as well as evaluating the overall presentation of the financial statements. We believe that our audits provide a reasonable basis for our opinion.

We have served as the auditor of one or more Gabelli/GAMCO Funds investment companies since 1992.
Philadelphia, Pennsylvania
November 24, 2021
20
| The Gabelli Global Financial Services Fund |
| Liquidity Risk Managment (Unaudited) |
In accordance with Rule 22e-4 under the 1940 Act, the Fund has established a liquidity risk management program (the LRM Program) to govern its approach to managing liquidity risk. The LRM Program is administered by the Liquidity Committee (the Committee), which is comprised of members of Gabelli Funds, LLC management. The Board has designated the Committee to administer the LRM Program.
The LRM Program’s principal objectives include supporting the Fund’s compliance with limits on investments in illiquid assets and mitigating the risk that the Fund will be unable to meet its redemption obligations in a timely manner. The LRM Program also includes elements that support the management and assessment of liquidity risk, including an annual assessment of factors that influence the Fund’s liquidity and the monthly classification and re-classification of certain investments that reflect the Committee’s assessment of their relative liquidity under current market conditions.
At a meeting of the Board held on May 12, 2021, the Board received a written report from the Committee regarding the design and operational effectiveness of the LRM Program. The Committee determined, and reported to the Board, that the LRM Program is reasonably designed to assess and manage the Fund’s liquidity risk and has operated adequately and effectively since its implementation. The Committee reported that there were no liquidity events that impacted the Fund or its ability to timely meet redemptions without dilution to existing shareholders. The Committee noted that the Fund is primarily invested in highly liquid securities and, accordingly, continues to be exempt from the requirement to determine a “highly liquid investment minimum” as defined in the Rule 22e-4. Because of that continued qualification for the exemption, the Fund has not adopted a “highly liquid investment minimum” amount. The Committee further noted that while changes to the LRM Program were made during the Review Period and reported to the Board, no material changes were made to the LRM Program as a result of the Committee’s annual review.
There can be no assurance that the LRM Program will achieve its objectives in the future. Please refer to the Fund’s Prospectus for more information regarding its exposure to liquidity risk and other principal risks to which an investment in the Fund may be subject.
21
The Gabelli Global Financial Services Fund
Additional Fund Information (Unaudited)
The business and affairs of the Corporation are managed under the direction of the Corporation’s Board of Directors. Information pertaining to the Directors and officers of the Corporation is set forth below. The Corporation’s Statement of Additional Information includes additional information about the Corporation’s Directors and is available without charge, upon request, by calling 800-GABELLI (800-422-3554) or by writing to The Gabelli Global Financial Services Fund at One Corporate Center, Rye, NY 10580-1422.
| Name, Position(s) Address1 and Age | Term of Office and Length of Time Served2 | Number of Funds in Fund Complex Overseen by Director | Principal Occupation(s) During Past Five Years | Other Directorships Held by Director3 | ||||
| INTERESTED DIRECTORS4: | ||||||||
Mario J. Gabelli, CFA Director and Chief Investment Officer Age: 79 | Since 1991 | 32 | Chairman, Chief Executive Officer, and Chief Investment Officer– Value Portfolios of GAMCO Investors, Inc. and Chief Investment Officer– Value Portfolios of Gabelli Funds, LLC and GAMCO Asset Management Inc.; Director/ Trustee or Chief Investment Officer of other registered investment companies within the Fund Complex; Chief Executive Officer of GGCP, Inc.; Executive Chairman of Associated Capital Group, Inc. | Director of Morgan Group Holdings, Inc. (holding company); Chairman of the Board and Chief Executive Officer of LICT Corp. (multimedia and communication services company); Director of CIBL, Inc. (broadcasting and wireless communications); Director of ICTC Group Inc.(communications) (2013- 2018) | ||||
John D. Gabelli Director Age: 77 | Since 1991 | 12 | Senior Vice President of G.research, LLC | — | ||||
| INDEPENDENT DIRECTORS5: | ||||||||
Elizabeth C. Bogan Director Age: 77 | Since 2019 | 12 | Senior Lecturer in Economics at Princeton University | — | ||||
Anthony J. Colavita6 Director Age: 85 | Since 1991 | 18 | President of the law firm of Anthony J. Colavita, P.C. | — | ||||
Vincent D. Enright Director Age: 77 | Since 1991 | 17 | Former Senior Vice President and Chief Financial Officer of KeySpan Corp. (public utility) (1994-1998) | Director of Echo Therapeutics, Inc. (therapeutics and diagnostics) (2008-2014); Director of The LGL Group, Inc. (diversified manufacturing) (2011-2014) | ||||
Robert J. Morrissey Director Age: 82 | Since 1991 | 7 | Partner in the law firm of Morrissey, Hawkins & Lynch | Chairman of the Board of Directors, Belmont Savings Bank | ||||
Kuni Nakamura Director Age: 53 | Since 2009 | 35 | President of Advanced Polymer, Inc. (chemical manufacturing company);President of KEN Enterprises, Inc. (real estate); Trustee on Long Island University Board of Trustees | — | ||||
22
| The Gabelli Global Financial Services Fund |
| Additional Fund Information (Continued) (Unaudited) |
| Name, Position(s) Address1 and Age | Term of Office and Length of Time Served2 | Number of Funds in Fund Complex Overseen by Director | Principal Occupation(s) During Past Five Years | Other Directorships Held by Director3 | ||||
Anthonie C. van Ekris6 Director Age: 87 | Since 1991 | 23 | Chairman and Chief Executive Officer of BALMAC International, Inc.(global import/ export company) | — | ||||
Salvatore J. Zizza7 Director Age: 75 | Since 2001 | 32 | President of Zizza & Associates Corp. (private holding company); Chairman of Bergen Cove Realty Inc. (residential real estate) | Director and Chairman of Trans-Lux Corporation (business services); Director and Chairman of Harbor Diversified Inc. (pharmaceuticals) (2009-2018); Retired Chairman of BAM (semiconductor and aerospace manufacturing) |
23
| The Gabelli Global Financial Services Fund |
| Additional Fund Information (Continued) (Unaudited) |
Name, Position(s) Address1 and Age | Term of Office and Length of Time Served2 | Principal Occupation(s) During Past Five Years | ||
| OFFICERS: | ||||
Bruce N. Alpert President Age: 69 | Since 1991 | Executive Vice President and Chief Operating Officer of Gabelli Funds, LLC since 1988; Officer of registered investment companies within the Fund Complex; Senior Vice President of GAMCO Investors, Inc. since 2008; Vice President – Mutual Funds, G.research, LLC | ||
John C. Ball Treasurer Age: 45 | Since 2017 | Treasurer of registered investment companies within the Fund Complex since 2017; Vice President and Assistant Treasurer of AMG Funds, 2014-2017; Chief Executive Officer, G.distributors, LLC since December 2020 | ||
Peter Goldstein Secretary and Vice President Age: 68 | Since 2020 | General Counsel, Gabelli Funds, LLC since July 2020; General Counsel and Chief Compliance Officer, Buckingham Capital Management, Inc. (2012-2020); Chief Legal Officer and Chief Compliance Officer, The Buckingham Research Group, Inc. (2012-2020) | ||
Richard J. Walz Chief Compliance Officer Age: 62 | Since 2013 | Chief Compliance Officer of registered investment companies within the Fund Complex since 2013; Chief Compliance Officer for Gabelli Funds, LLC since 2015 | ||
Daniel Plourde Vice President Age: 41 | Since 2021 | Vice President of registered investment companies within the Fund Complex since 2021; Assistant Treasurer of the North American SPDR ETFs and State Street Global Advisors Mutual Funds (2017-2021); Fund Administration at State Street Bank (2009-2017) |
| 1 | Address: One Corporate Center, Rye, NY 10580-1422, unless otherwise noted. |
| 2 | Each Director will hold office for an indefinite term until the earliest of (i) the next meeting of shareholders, if any, called for the purpose of considering the election or re-election of such Director and until the election and qualification of his or her successor, if any, elected at such meeting, or (ii) the date a Director resigns or retires, or a Director is removed by the Board of Directors or shareholders, in accordance with the Fund’s By-Laws and Articles of Incorporation. For officers, includes time served in prior officer positions with the Fund. Each officer will hold office for an indefinite term until the date he or she resigns or retires or until his or her successor is elected and qualified. |
| 3 | This column includes only directorships of companies required to report to the SEC under the Securities Exchange Act of 1934, as amended, i.e., public companies, or other investment companies registered under the 1940 Act. |
| 4 | “Interested person” of the Fund as defined in the 1940 Act. Messrs. Gabelli are each considered an “interested person” because of their affiliation with Gabelli Funds, LLC which acts as the Fund’s investment adviser. Mario J. Gabelli and John D. Gabelli are brothers. |
| 5 | Directors who are not interested persons are considered “Independent” Directors. |
| 6 | Mr. Colavita’s son, Anthony S. Colavita, serves as a director of other funds in the Gabelli/GAMCO Fund Complex. Mr. van Ekris is an independent director of Gabelli International Ltd., Gabelli Fund, LDC, GAMA Capital Opportunities Master, Ltd., and GAMCO International SICAV, which may be deemed to be controlled by Mario J. Gabelli and/or affiliates and in that event would be deemed to be under common control with the Fund’s Adviser. |
| 7 | Mr. Zizza is an independent director of Gabelli International Ltd., which may be deemed to be controlled by Mario J. Gabelli and/or affiliates and in that event would be deemed to be under common control with the Fund’s Adviser. On September 9, 2015, Mr. Zizza entered into a settlement with the SEC to resolve an inquiry relating to an alleged violation regarding the making of false statements or omissions to the accountants of a company concerning a related party transaction. The company in question is not an affiliate of, nor has any connection to, the Fund. Under the terms of the settlement, Mr. Zizza, without admitting or denying the SEC’s findings and allegation, paid $150,000 and agreed to cease and desist committing or causing any future violations of Rule 13b2-2 of the Securities Exchange Act of 1934, as amended. The Board has discussed this matter and has determined that it does not disqualify Mr. Zizza from serving as an Independent Director. |
24
Gabelli Funds and Your Personal Privacy
Who are we?
The Gabelli Funds are investment companies registered with the Securities and Exchange Commission under the Investment Company Act of 1940. We are managed by Gabelli Funds, LLC, which is affiliated with GAMCO Investors, Inc., a publicly held company with subsidiaries and affiliates that provide investment advisory services for a variety of clients.
What kind of non-public information do we collect about you if you become a fund shareholder?
If you apply to open an account directly with us, you will be giving us some non-public information about yourself. The non-public information we collect about you is:
| ● | Information you give us on your application form. This could include your name, address, telephone number, social security number, bank account number, and other information. |
| ● | Information about your transactions with us, any transactions with our affiliates, and transactions with the entities we hire to provide services to you. This would include information about the shares that you buy or redeem. If we hire someone else to provide services — like a transfer agent — we will also have information about the transactions that you conduct through them. |
What information do we disclose and to whom do we disclose it?
We do not disclose any non-public personal information about our customers or former customers to anyone other than our affiliates, our service providers who need to know such information, and as otherwise permitted by law. If you want to find out what the law permits, you can read the privacy rules adopted by the Securities and Exchange Commission. They are in volume 17 of the Code of Federal Regulations, Part 248. The Commission often posts information about its regulations on its website, www. sec.gov.
What do we do to protect your personal information?
We restrict access to non-public personal information about you to the people who need to know that information in order to provide services to you or the fund and to ensure that we are complying with the laws governing the securities business. We maintain physical, electronic, and procedural safeguards to keep your personal information.
The Gabelli Global Financial Services Fund
2021 TAX NOTICE TO SHAREHOLDERS (Unaudited)
During the fiscal year ended September 30, 2021, the Fund paid to shareholders ordinary income distributions (inclusive of short term capital gains) totaling $0.1273, $0.0834, $0.0775, and $0.1490 per share for each of Class AAA, Class A, Class C, and Class I, respectively. For the fiscal year ended September 30, 2021, 73.75% of the ordinary income distribution qualifies for the dividends received deduction available to corporations. The Fund designates 100% of the ordinary income distribution as qualified dividend income pursuant to the Jobs and Growth Tax Relief Reconciliation Act of 2003. The Fund designates 0.58% of the ordinary income distribution as qualified interest income pursuant to the Tax Relief, Unemployment Reauthorization, and Job Creation Act of 2010.
U.S. Government Income:
The percentage of the ordinary income distribution paid by the Fund during the fiscal year ended September 30, 2021 which was derived from U.S. Treasury securities was 0.57%. Such income is exempt from state and local tax in all states. However, many states, including New York and California, allow a tax exemption for a portion of the income earned only if a mutual fund has invested at least 50% of its assets at the end of each quarter of the Fund’s fiscal year in U.S. Government securities. The Gabelli Global Financial Services Fund did not meet this strict requirement in 2021. The percentage of U.S. Government securities held as of September 30, 2021 was 5.08%. Due to the diversity in state and local tax law, it is recommended that you consult your personal tax adviser as to the applicability of the information provided to your specific situation.
All designations are based on financial information available as of the date of this annual report and, accordingly, are subject to change. For each item, it is the intention of the Fund to designate the maximum amount permitted under the Internal Revenue Code and the regulations thereunder.
THE GABELLI GLOBAL FINANCIAL SERVICES FUND
One Corporate Center
Rye, NY 10580-1422
Portfolio Manager’s Biography
Ian Lapey joined Gabelli in October 2018 as a portfolio manager. Prior to joining Gabelli, Mr. Lapey was a research analyst and partner at Moerus Capital Management LLC. Prior to joining Moerus, he was a partner, research analyst, and a portfolio manager at Third Avenue Management. Mr. Lapey holds an MBA in Finance and Statistics from the Stern School of Business at New York University. He also holds a Master’s degree in Accounting from Northeastern University and a BA in Economics from Williams College.
| We have separated the portfolio manager’s commentary from the financial statements and investment portfolio due to corporate governance regulations stipulated by the Sarbanes-Oxley Act of 2002. We have done this to ensure that the contents of the portfolio manager’s commentary are unrestricted. Both the commentary and the financial statements, including the portfolios of investments, will be available on our website at www.gabelli.com. |
Gabelli Equity Series Funds, Inc.
THE GABELLI GLOBAL FINANCIAL SERVICES FUND
One Corporate Center
Rye, New York 10580-1422
t 800-GABELLI (800-422-3554)
f 914-921-5118
e info@gabelli.com
GABELLI.COM
Net Asset Values per share available daily
by calling 800-GABELLI after 7:00 P.M.
BOARD OF DIRECTORS Mario J. Gabelli, CFA Chairman and Chief Executive Officer, GAMCO Investors, Inc. Executive Chairman, Associated Capital Group, Inc.
Elizabeth C. Bogan Senior Lecturer, Princeton University
Anthony J. Colavita President, Anthony J. Colavita, P.C.
Vincent D. Enright Former Senior Vice President and Chief Financial Officer, KeySpan Corp.
John D. Gabelli Former Senior Vice President, G.research, LLC
Robert J. Morrissey Partner, Morrissey, Hawkins & Lynch
Kuni Nakamura President, Advanced Polymer, Inc.
Anthonie C. van Ekris Chairman, BALMAC International, Inc. | Salvatore J. Zizza Chairman, Zizza & Associates Corp.
OFFICERS Bruce N. Alpert President
John C. Ball Treasurer
Peter Goldstein Secretary and Vice President
Richard J. Walz Chief Compliance Officer
Daniel Plourde Vice President
DISTRIBUTOR G.distributors, LLC
CUSTODIAN State Street Bank and Trust Company
TRANSFER AGENT AND DIVIDEND DISBURSING AGENT DST Asset Manager Solutions, Inc.
LEGAL COUNSEL Skadden, Arps, Slate, Meagher & Flom LLP |
This report is submitted for the general information of the shareholders of The Gabelli Global Financial Services Fund. It is not authorized for distribution to prospective investors unless preceded or accompanied by an effective prospectus.
GAB3630Q321AR

| (b) | Not applicable. |
Item 2. Code of Ethics.
| (a) | The registrant, as of the end of the period covered by this report, has adopted a code of ethics that applies to the registrant’s principal executive officer, principal financial officer, principal accounting officer or controller, or persons performing similar functions, regardless of whether these individuals are employed by the registrant or a third party. |
| (c) | There have been no amendments, during the period covered by this report, to a provision of the code of ethics that applies to the registrant’s principal executive officer, principal financial officer, principal accounting officer or controller, or persons performing similar functions, regardless of whether these individuals are employed by the registrant or a third party, and that relates to any element of the code of ethics description. |
| (d) | The registrant has not granted any waivers, including an implicit waiver, from a provision of the code of ethics that applies to the registrant’s principal executive officer, principal financial officer, principal accounting officer or controller, or persons performing similar functions, regardless of whether these individuals are employed by the registrant or a third party, that relates to one or more of the items set forth in paragraph (b) of this item’s instructions. |
Item 3. Audit Committee Financial Expert.
As of the end of the period covered by the report, the registrant’s board of directors has determined that Vincent D. Enright is qualified to serve as an audit committee financial expert serving on its audit committee and that he is “independent.”
Item 4. Principal Accountant Fees and Services.
Audit Fees
| (a) | The aggregate fees billed for each of the last two fiscal years for professional services rendered by the principal accountant for the audit of the registrant’s annual financial statements or services that are normally provided by the accountant in connection with statutory and regulatory filings or engagements for those fiscal years are $109,000 in 2020 and $109,000 in 2021. |
Audit-Related Fees
(b)
| The aggregate fees billed in each of the last two fiscal years for assurance and related services by the principal accountant that are reasonably related to the performance of the audit of the registrant’s financial statements and are not reported under paragraph (a) of this Item are $0 in 2020 and $0 in 2021. |
Tax Fees
| (c) | The aggregate fees billed in each of the last two fiscal years for professional services rendered by the principal accountant for tax compliance, tax advice, and tax planning are $15,200 in 2020 and $15,200 in 2021. Tax fees represent tax compliance services provided in connection with the review of the Registrant’s tax returns. |
All Other Fees
| (c) | The aggregate fees billed in each of the last two fiscal years for products and services provided by the principal accountant, other than the services reported in paragraphs (a) through (c) of this Item are $2,861 in 2020 and $3,186 in 2021. The fees relate to Passive Foreign Investment Company identification database subscription fees billed on an annual basis. |
| (e)(1) | Disclose the audit committee's pre-approval policies and procedures described in paragraph (c)(7) of Rule 2-01 of Regulation S-X. | |
| Pre-Approval Policies and Procedures. The Audit Committee (“Committee”) of the registrant is responsible for pre-approving (i) all audit and permissible non-audit services to be provided by the independent registered public accounting firm to the registrant and (ii) all permissible non-audit services to be provided by the independent registered public accounting firm to the Adviser, Gabelli Funds, LLC, and any affiliate of Gabelli Funds, LLC (“Gabelli”) that provides services to the registrant (a “Covered Services Provider”) if the independent registered public accounting firm’s engagement related directly to the operations and financial reporting of the registrant. The Committee may delegate its responsibility to pre-approve any such audit and permissible non-audit services to the Chairperson of the Committee, and the Chairperson must report to the Committee, at its next regularly scheduled meeting after the Chairperson’s pre-approval of such services, his or her decision(s). The Committee may also establish detailed pre-approval policies and procedures for pre-approval of such services in accordance with applicable laws, including the delegation of some or all of the Committee’s pre-approval responsibilities to the other persons (other than Gabelli or the registrant’s officers). Pre-approval by the Committee of any permissible non-audit services is not required so long as: (i) the permissible non-audit services were not recognized by the registrant at the time of the engagement to be non-audit services; and (ii) such services are promptly brought to the attention of the Committee and approved by the Committee or Chairperson prior to the completion of the audit. | ||
| (e)(2) | The percentage of services described in each of paragraphs (b) through (d) of this Item that were approved by the audit committee pursuant to paragraph (c)(7)(i)(C) of Rule 2-01 of Regulation S-X are as follows: |
(b) N/A
(c) 0%
(d) 0%
| (f) | The percentage of hours expended on the principal accountant's engagement to audit the registrant's financial statements for the most recent fiscal year that were attributed to work performed by persons other than the principal accountant's full-time, permanent employees was less than fifty percent. |
| (g) | The aggregate non-audit fees billed by the registrant’s accountant for services rendered to the registrant, and rendered to the registrant’s investment adviser (not including any sub-adviser whose role is primarily portfolio management and is subcontracted with or overseen by another investment adviser), and any entity controlling, controlled by, or under common control with the adviser that provides ongoing services to the registrant for each of the last two fiscal years of the registrant was $55,950 in 2020 and $56,350 in 2021. |
| (h) | The registrant's audit committee of the board of directors has considered whether the provision of non-audit services that were rendered to the registrant's investment adviser (not including any sub-adviser whose role is primarily portfolio management and is subcontracted with or overseen by another investment adviser), and any entity controlling, controlled by, or under common control with the investment adviser that provides ongoing services to the registrant that were not pre-approved pursuant to paragraph (c)(7)(ii) of Rule 2-01 of Regulation S-X is compatible with maintaining the principal accountant's independence. |
Item 5. Audit Committee of Listed Registrants.
Not applicable.
Item 6. Investments.
(a)
The Gabelli Small Cap Growth Fund
Schedule of Investments — September 30, 2021
| Market | ||||||||||||
| Shares | Cost | Value | ||||||||||
| COMMON STOCKS — 99.7% | ||||||||||||
| Aerospace — 0.7% | ||||||||||||
| 260,000 | Aerojet Rocketdyne Holdings Inc. | $ | 683,183 | $ | 11,323,000 | |||||||
| 30,000 | Allied Motion Technologies Inc. | 664,462 | 938,400 | |||||||||
| 40,000 | Innovative Solutions and Support Inc. | 130,088 | 286,000 | |||||||||
| 3,500 | Kratos Defense & Security Solutions Inc.† | 68,284 | 78,085 | |||||||||
| 1,546,017 | 12,625,485 | |||||||||||
| Agriculture — 0.0% | ||||||||||||
| 12,000 | Cadiz Inc.† | 93,950 | 84,480 | |||||||||
| 40,000 | Limoneira Co | 714,782 | 646,800 | |||||||||
| 808,732 | 731,280 | |||||||||||
| Automotive — 0.2% | ||||||||||||
| 1,200 | PACCAR Inc. | 44,521 | 94,704 | |||||||||
| 79,000 | The Shyft Group Inc. | 381,491 | 3,002,790 | |||||||||
| 426,012 | 3,097,494 | |||||||||||
| Automotive: Parts and Accessories — 4.0% | ||||||||||||
| 148,000 | BorgWarner Inc. | 693,961 | 6,395,080 | |||||||||
| 848,055 | Brembo SpA | 1,568,825 | 10,717,379 | |||||||||
| 90,022 | China Automotive Systems Inc.† | 428,854 | 294,372 | |||||||||
| 75,000 | Commercial Vehicle Group Inc.† | 665,983 | 709,500 | |||||||||
| 1,110,000 | Dana Inc. | 9,031,849 | 24,686,400 | |||||||||
| 385,000 | Modine Manufacturing Co.† | 3,507,189 | 4,362,050 | |||||||||
| 18,000 | Monro Inc. | 80,738 | 1,035,180 | |||||||||
| 4,300 | O'Reilly Automotive Inc.† | 92,532 | 2,627,558 | |||||||||
| 45,000 | Puradyn Filter Technologies Inc.† | 11,732 | 13 | |||||||||
| 190,000 | Standard Motor Products Inc. | 1,449,364 | 8,304,900 | |||||||||
| 244,000 | Strattec Security Corp.†(a) | 4,677,938 | 9,491,600 | |||||||||
| 280,000 | Tenneco Inc., Cl. A† | 1,006,626 | 3,995,600 | |||||||||
| 18,950 | Thor Industries Inc. | 175,501 | 2,326,302 | |||||||||
| 20,000 | Uni-Select Inc.† | 161,317 | 280,120 | |||||||||
| 23,552,409 | 75,226,054 | |||||||||||
| Aviation: Parts and Services — 2.0% | ||||||||||||
| 20,000 | AAR Corp.† | 230,415 | 648,600 | |||||||||
| 9,500 | Astronics Corp.† | 13,628 | 133,570 | |||||||||
| 22,700 | Astronics Corp., Cl. B† | 31,898 | 322,340 | |||||||||
| 46,000 | Ducommun Inc.† | 918,285 | 2,316,100 | |||||||||
| 670,000 | Kaman Corp. | 9,964,092 | 23,898,900 | |||||||||
| 89,000 | Moog Inc., Cl. A | 1,052,574 | 6,784,470 | |||||||||
| 16,500 | Moog Inc., Cl. B | 496,050 | 1,166,880 | |||||||||
| 25,000 | Woodward Inc. | 185,181 | 2,830,000 | |||||||||
| 12,892,123 | 38,100,860 | |||||||||||
| Market | ||||||||||||
| Shares | Cost | Value | ||||||||||
| Broadcasting — 2.1% | ||||||||||||
| 119,000 | Beasley Broadcast Group Inc., Cl. A† | $ | 449,276 | $ | 316,540 | |||||||
| 10,000 | Cogeco Communications Inc. | 340,851 | 888,678 | |||||||||
| 23,300 | Cogeco Inc. | 592,837 | 1,659,293 | |||||||||
| 185,000 | Corus Entertainment Inc., Cl. B | 679,390 | 829,623 | |||||||||
| 40,000 | Fox Corp., Cl. A | 1,662,000 | 1,604,400 | |||||||||
| 25,000 | Gray Television Inc. | 73,674 | 570,500 | |||||||||
| 72,350 | Gray Television Inc., Cl. A | 386,480 | 1,604,000 | |||||||||
| 260,000 | ITV plc† | 529,070 | 373,445 | |||||||||
| 13,000 | Liberty Broadband Corp., Cl. A† | 78,211 | 2,188,550 | |||||||||
| 11,000 | Liberty Broadband Corp., Cl. C† | 57,595 | 1,899,700 | |||||||||
| 20,000 | Liberty Media Corp.- Liberty Formula One, Cl. A† | 66,962 | 941,000 | |||||||||
| 27,000 | Liberty Media Corp.- Liberty Formula One, Cl. C† | 91,359 | 1,388,070 | |||||||||
| 64,000 | Liberty Media Corp.- Liberty SiriusXM, Cl. A† | 214,254 | 3,018,880 | |||||||||
| 34,452 | Liberty Media Corp.- Liberty SiriusXM, Cl. C† | 294,602 | 1,635,436 | |||||||||
| 92,340 | Madison Square Garden Entertainment Corp.† | 2,147,239 | 6,710,348 | |||||||||
| 22,900 | Nexstar Media Group Inc., Cl. A | 1,439,565 | 3,479,884 | |||||||||
| 100,000 | Salem Media Group Inc.† | 0 | 371,000 | |||||||||
| 255,000 | Sinclair Broadcast Group Inc., Cl. A | 4,169,298 | 8,078,400 | |||||||||
| 480,000 | Sirius XM Holdings Inc. | 316,771 | 2,928,000 | |||||||||
| 13,589,434 | 40,485,747 | |||||||||||
| Building and Construction — 7.1% | ||||||||||||
| 79,000 | Arcosa Inc. | 942,643 | 3,963,430 | |||||||||
| 94,000 | D.R. Horton Inc. | 1,028,426 | 7,893,180 | |||||||||
| 28,000 | Gibraltar Industries Inc.† | 524,580 | 1,950,200 | |||||||||
| 311,500 | Herc Holdings Inc.† | 10,297,382 | 50,917,790 | |||||||||
| 128,000 | KB Home | 1,271,387 | 4,981,760 | |||||||||
| 2,500 | Legacy Housing Corp.† | 29,404 | 44,925 | |||||||||
| 380,000 | Lennar Corp., Cl. B | 9,178,089 | 29,484,200 | |||||||||
| 107,000 | MDC Holdings Inc. | 1,971,373 | 4,999,040 | |||||||||
| 18,000 | Meritage Homes Corp.† | 305,692 | 1,746,000 | |||||||||
| 2,700 | NVR Inc.† | 1,908,454 | 12,944,016 | |||||||||
| 136,000 | PulteGroup Inc. | 808,694 | 6,245,120 | |||||||||
| 64,000 | Titan Machinery Inc.† | 1,057,708 | 1,658,240 | |||||||||
| 153,000 | Toll Brothers Inc. | 2,724,472 | 8,459,370 | |||||||||
| 32,048,304 | 135,287,271 | |||||||||||
| Business Services — 3.3% | ||||||||||||
| 13,000 | ACCO Brands Corp. | 60,332 | 111,670 | |||||||||
See accompanying notes to financial statements.
The Gabelli Small Cap Growth Fund
Schedule of Investments (Continued) — September 30, 2021
| Market | ||||||||||||
| Shares | Cost | Value | ||||||||||
| COMMON STOCKS (Continued) | ||||||||||||
| Business Services (Continued) | ||||||||||||
| 570,000 | Clear Channel Outdoor Holdings Inc.† | $ | 1,214,257 | $ | 1,544,700 | |||||||
| 390,000 | Diebold Nixdorf Inc.† | 3,869,432 | 3,942,900 | |||||||||
| 60,000 | Element Solutions Inc. | 537,606 | 1,300,800 | |||||||||
| 70,000 | GP Strategies Corp.† | 579,429 | 1,449,000 | |||||||||
| 13,000 | GSE Systems Inc.† | 18,200 | 19,240 | |||||||||
| 196,000 | IAA Inc.† | 1,593,186 | 10,695,720 | |||||||||
| 45,000 | Live Nation Entertainment Inc.† | 380,370 | 4,100,850 | |||||||||
| 40,000 | Loomis AB | 402,123 | 1,085,626 | |||||||||
| 162,000 | Macquarie Infrastructure Holdings LLC | 7,832 | 6,570,720 | |||||||||
| 16,000 | McGrath RentCorp. | 411,253 | 1,151,200 | |||||||||
| 20,000 | Sealed Air Corp. | 587,044 | 1,095,800 | |||||||||
| 69,000 | Sohgo Security Services Co. Ltd. | 799,632 | 3,130,868 | |||||||||
| 4,000 | Stamps.com Inc.† | 33,237 | 1,319,160 | |||||||||
| 41,000 | Team Inc.† | 519,115 | 123,410 | |||||||||
| 338,000 | The Interpublic Group of Companies Inc. | 1,425,712 | 12,394,460 | |||||||||
| 25,000 | TransAct Technologies Inc.† | 115,198 | 347,500 | |||||||||
| 1,612,500 | Trans-Lux Corp.†(a) | 1,587,544 | 677,331 | |||||||||
| 35,000 | United Rentals Inc.† | 216,471 | 12,282,550 | |||||||||
| 14,357,973 | 63,343,505 | |||||||||||
| Cable — 0.8% | ||||||||||||
| 52,500 | AMC Networks Inc., Cl. A† | 0 | 2,445,975 | |||||||||
| 39,000 | DISH Network Corp., Cl. A† | 726,991 | 1,694,940 | |||||||||
| 30,000 | EchoStar Corp., Cl. A† | 479,334 | 765,300 | |||||||||
| 121,000 | Liberty Global plc, Cl. A† | 2,700,564 | 3,605,800 | |||||||||
| 138,000 | Liberty Global plc, Cl. C† | 2,601,189 | 4,065,480 | |||||||||
| 84,000 | WideOpenWest Inc.† | 652,868 | 1,650,600 | |||||||||
| 7,160,946 | 14,228,095 | |||||||||||
| Communications Equipment — 0.1% | ||||||||||||
| 242,000 | Communications Systems Inc.† | 1,610,888 | 2,093,300 | |||||||||
| Computer Software and Services — 1.9% | ||||||||||||
| 74,000 | Activision Blizzard Inc. | 953,347 | 5,726,860 | |||||||||
| 375,000 | Alithya Group Inc., Cl. A† | 1,134,059 | 975,000 | |||||||||
| 140,000 | GTY Technology Holdings Inc.† | 1,280,772 | 1,052,800 | |||||||||
| 12,000 | MKS Instruments Inc. | 208,375 | 1,810,920 | |||||||||
| 34,500 | Rockwell Automation Inc. | 804,852 | 10,144,380 | |||||||||
| 36,000 | Tyler Technologies Inc.† | 71,925 | 16,511,400 | |||||||||
| 4,453,330 | 36,221,360 | |||||||||||
| Consumer Products — 2.2% | ||||||||||||
| 35,000 | 1-800-Flowers.com Inc., Cl. A† | 336,212 | 1,067,850 | |||||||||
| 68,000 | Brunswick Corp. | 1,372,115 | 6,478,360 | |||||||||
| Market | ||||||||||||
| Shares | Cost | Value | ||||||||||
| 32,000 | Chofu Seisakusho Co. Ltd. | $ | 461,495 | $ | 606,101 | |||||||
| 40,500 | Church & Dwight Co. Inc. | 68,934 | 3,344,085 | |||||||||
| 17,000 | Energizer Holdings Inc. | 709,960 | 663,850 | |||||||||
| 5,000 | Ginko International Co. Ltd. | 35,851 | 33,201 | |||||||||
| 2,000 | Harley-Davidson Inc. | 4,713 | 73,220 | |||||||||
| 48,000 | Hunter Douglas NV† | 1,935,651 | 5,448,878 | |||||||||
| 2,500 | Kobayashi Pharmaceutical Co. Ltd. | 103,323 | 198,571 | |||||||||
| 3,800 | LCI Industries | 62,898 | 511,594 | |||||||||
| 220,000 | Marine Products Corp. | 136,308 | 2,752,200 | |||||||||
| 3,000 | National Presto Industries Inc. | 83,060 | 246,240 | |||||||||
| 190,000 | Sally Beauty Holdings Inc.† | 1,007,050 | 3,201,500 | |||||||||
| 215,000 | Samick Musical Instruments Co. Ltd. | 289,566 | 338,661 | |||||||||
| 3,700 | Shimano Inc. | 414,540 | 1,093,760 | |||||||||
| 13,500 | Steven Madden Ltd. | 32,850 | 542,160 | |||||||||
| 1,000,000 | Swedish Match AB | 1,904,234 | 8,756,740 | |||||||||
| 10,000 | The Scotts Miracle-Gro Co. | 174,942 | 1,463,600 | |||||||||
| 9,500 | WD-40 Co. | 248,399 | 2,199,060 | |||||||||
| 84,000 | Wolverine World Wide Inc. | 408,836 | 2,506,560 | |||||||||
| 9,790,937 | 41,526,191 | |||||||||||
| Consumer Services — 0.9% | ||||||||||||
| 53,000 | Bowlin Travel Centers Inc.† | 53,948 | 275,865 | |||||||||
| 3,000 | H&E Equipment Services Inc. | 67,163 | 104,130 | |||||||||
| 5,000 | IAC/InterActiveCorp.† | 11,719 | 651,450 | |||||||||
| 260,000 | KAR Auction Services Inc.† | 1,330,391 | 4,261,400 | |||||||||
| 358,000 | Rollins Inc. | 340,833 | 12,648,140 | |||||||||
| 1,804,054 | 17,940,985 | |||||||||||
| Diversified Industrial — 10.9% | ||||||||||||
| 10,300 | Acuity Brands Inc. | 97,210 | 1,785,711 | |||||||||
| 55,000 | Albany International Corp., Cl. A | 1,080,818 | 4,227,850 | |||||||||
| 240,000 | Ampco-Pittsburgh Corp.† | 1,390,885 | 1,128,000 | |||||||||
| 64,500 | Burnham Holdings Inc., Cl. A | 1,103,458 | 888,487 | |||||||||
| 359,000 | Crane Co | 7,725,236 | 34,036,790 | |||||||||
| 108,000 | EnPro Industries Inc. | 5,761,157 | 9,408,960 | |||||||||
| 110,000 | Greif Inc., Cl. A | 2,079,606 | 7,106,000 | |||||||||
| 96,362 | Greif Inc., Cl. B | 4,378,812 | 6,244,258 | |||||||||
| 1,315,000 | Griffon Corp. | 14,366,530 | 32,349,000 | |||||||||
| 13,100 | Hyster-Yale Materials Handling Inc. | 863,154 | 658,406 | |||||||||
| 4,000 | JSP Corp. | 89,499 | 58,295 | |||||||||
| 79,000 | Kimball International Inc., Cl. B | 744,560 | 884,800 | |||||||||
| 76,620 | L.B. Foster Co., Cl. A† | 1,056,909 | 1,186,844 | |||||||||
| 50,000 | Lawson Products Inc.† | 654,828 | 2,500,500 | |||||||||
| 45,500 | Lincoln Electric Holdings Inc. | 1,165,737 | 5,859,945 | |||||||||
See accompanying notes to financial statements.
The Gabelli Small Cap Growth Fund
Schedule of Investments (Continued) — September 30, 2021
| Market | ||||||||||||
| Shares | Cost | Value | ||||||||||
| COMMON STOCKS (Continued) | ||||||||||||
| Diversified Industrial (Continued) | ||||||||||||
| 38,400 | Lindsay Corp. | $ | 808,625 | $ | 5,828,736 | |||||||
| 19,000 | Lydall Inc.† | 184,361 | 1,179,710 | |||||||||
| 38,000 | Matthews International Corp., Cl. A | 976,341 | 1,318,220 | |||||||||
| 920,000 | Myers Industries Inc. | 12,634,530 | 18,004,400 | |||||||||
| 72,000 | Oil-Dri Corp. of America | 501,026 | 2,520,000 | |||||||||
| 13,000 | Olin Corp. | 203,184 | 627,250 | |||||||||
| 300,000 | Park-Ohio Holdings Corp. | 2,642,414 | 7,656,000 | |||||||||
| 12,500 | Pentair plc | 296,897 | 907,875 | |||||||||
| 90,000 | Raven Industries Inc.† | 2,212,968 | 5,184,900 | |||||||||
| 15,600 | Roper Technologies Inc. | 293,574 | 6,959,628 | |||||||||
| 59,000 | Sonoco Products Co. | 1,711,094 | 3,515,220 | |||||||||
| 52,500 | Standex International Corp. | 1,374,056 | 5,192,775 | |||||||||
| 110,000 | Steel Connect Inc.† | 124,473 | 223,300 | |||||||||
| 82,029 | Steel Partners Holdings LP† | 1,031,404 | 2,331,674 | |||||||||
| 13,000 | T. Hasegawa Co. Ltd. | 236,725 | 311,874 | |||||||||
| 7,000 | Terex Corp. | 166,670 | 294,700 | |||||||||
| 341,500 | Textron Inc. | 2,071,915 | 23,840,115 | |||||||||
| 360,000 | Tredegar Corp. | 5,410,627 | 4,384,800 | |||||||||
| 228,000 | Trinity Industries Inc. | 2,595,295 | 6,194,760 | |||||||||
| 45,000 | Ultra Electronics Holdings plc | 898,212 | 1,962,084 | |||||||||
| 78,932,790 | 206,761,867 | |||||||||||
| Electronics — 2.0% | ||||||||||||
| 138,500 | Badger Meter Inc. | 1,768,846 | 14,007,890 | |||||||||
| 213,800 | Bel Fuse Inc., Cl. A(a) | 4,047,987 | 3,072,306 | |||||||||
| 465,000 | CTS Corp. | 3,976,813 | 14,373,150 | |||||||||
| 30,000 | Daktronics Inc.† | 250,418 | 162,900 | |||||||||
| 115,000 | Gentex Corp. | 1,162,259 | 3,792,700 | |||||||||
| 20,000 | IMAX Corp.† | 158,565 | 379,600 | |||||||||
| 30,000 | Renesas Electronics Corp.† | 194,117 | 376,297 | |||||||||
| 63,000 | Stoneridge Inc.† | 312,595 | 1,284,570 | |||||||||
| 11,871,600 | 37,449,413 | |||||||||||
| Energy and Utilities — 2.2% | ||||||||||||
| 19,000 | Avangrid Inc. | 736,250 | 923,400 | |||||||||
| 17,000 | Callon Petroleum Co.† | 90,593 | 834,360 | |||||||||
| 11,000 | Chesapeake Utilities Corp. | 143,045 | 1,320,550 | |||||||||
| 35,500 | CMS Energy Corp. | 167,523 | 2,120,415 | |||||||||
| 11,000 | Consolidated Water Co. Ltd. | 141,093 | 125,400 | |||||||||
| 95,000 | Covanta Holding Corp. | 1,467 | 1,911,400 | |||||||||
| 45,500 | Diamondback Energy Inc. | 2,263,600 | 4,307,485 | |||||||||
| 29,800 | Dril-Quip Inc.† | 922,889 | 750,364 | |||||||||
| 74,000 | Energy Recovery Inc.† | 316,427 | 1,408,220 | |||||||||
| 24,000 | Landis+Gyr Group AG | 1,466,993 | 1,555,448 | |||||||||
| 25,000 | Marathon Petroleum Corp. | 123,446 | 1,545,250 | |||||||||
| 3,500 | Middlesex Water Co. | 54,166 | 359,730 | |||||||||
| 11,000 | Northwest Natural Holding Co. | 518,541 | 505,890 | |||||||||
| 21,500 | NorthWestern Corp. | 582,609 | 1,231,950 | |||||||||
| Market | ||||||||||||
| Shares | Cost | Value | ||||||||||
| 11,000 | Otter Tail Corp. | $ | 216,252 | $ | 615,670 | |||||||
| 5,500 | PNM Resources Inc. | 43,446 | 272,140 | |||||||||
| 1,850,000 | RPC Inc.† | 864,702 | 8,991,000 | |||||||||
| 20,000 | Siemens Gamesa Renewable Energy SA† | 117,491 | 510,137 | |||||||||
| 89,000 | SJW Group | 1,619,026 | 5,879,340 | |||||||||
| 32,500 | Southwest Gas Holdings Inc. | 533,592 | 2,173,600 | |||||||||
| 9,000 | Spire Inc. | 354,680 | 550,620 | |||||||||
| 34,000 | The York Water Co. | 475,596 | 1,485,120 | |||||||||
| 55,000 | Vestas Wind Systems A/S | 94,711 | 2,205,997 | |||||||||
| 11,848,138 | 41,583,486 | |||||||||||
| Entertainment — 1.3% | ||||||||||||
| 43,000 | Discovery Inc., Cl. A† | 624,892 | 1,091,340 | |||||||||
| 70,000 | Discovery Inc., Cl. C† | 461,173 | 1,698,900 | |||||||||
| 76,500 | Inspired Entertainment Inc.† | 479,260 | 895,050 | |||||||||
| 113,213 | Liberty Media Corp.- Liberty Braves, Cl. A† | 2,615,420 | 3,046,562 | |||||||||
| 197,000 | Liberty Media Corp.- Liberty Braves, Cl. C† | 2,839,833 | 5,204,740 | |||||||||
| 34,000 | Madison Square Garden Sports Corp.† | 186,907 | 6,322,300 | |||||||||
| 50,000 | Manchester United plc, Cl. A | 784,105 | 968,500 | |||||||||
| 9,500 | Take-Two Interactive Software Inc.† | 71,611 | 1,463,665 | |||||||||
| 4,000 | The Walt Disney Co.† | 22,938 | 676,680 | |||||||||
| 36,000 | Universal Entertainment Corp.† | 217,230 | 817,719 | |||||||||
| 57,000 | World Wrestling Entertainment Inc., Cl. A | 600,726 | 3,206,820 | |||||||||
| 8,904,095 | 25,392,276 | |||||||||||
| Environmental Services — 0.5% | ||||||||||||
| 20,000 | Primo Water Corp. | 130,300 | 314,400 | |||||||||
| 72,500 | Republic Services Inc. | 654,917 | 8,704,350 | |||||||||
| 785,217 | 9,018,750 | |||||||||||
| Equipment and Supplies — 15.2% | ||||||||||||
| 25,500 | A.O. Smith Corp. | 57,150 | 1,557,285 | |||||||||
| 406,500 | AMETEK Inc. | 691,697 | 50,410,065 | |||||||||
| 52,000 | AZZ Inc. | 1,771,545 | 2,766,400 | |||||||||
| 13,000 | Chart Industries Inc.† | 427,173 | 2,484,430 | |||||||||
| 144,000 | CIRCOR International Inc.† | 2,183,088 | 4,753,440 | |||||||||
| 317,000 | Core Molding Technologies Inc.† | 637,421 | 3,648,670 | |||||||||
| 129,000 | Crown Holdings Inc. | 520,753 | 13,000,620 | |||||||||
| 2,025 | Danaher Corp. | 13,122 | 616,491 | |||||||||
| 100,000 | Donaldson Co. Inc. | 575,112 | 5,741,000 | |||||||||
| 55,000 | Entegris Inc. | 235,130 | 6,924,500 | |||||||||
| 225,000 | Federal Signal Corp. | 1,195,159 | 8,689,500 | |||||||||
| 241,000 | Flowserve Corp. | 1,445,694 | 8,355,470 | |||||||||
| 163,000 | Franklin Electric Co. Inc. | 636,072 | 13,015,550 | |||||||||
See accompanying notes to financial statements.
The Gabelli Small Cap Growth Fund
Schedule of Investments (Continued) — September 30, 2021
| Market | ||||||||||||
| Shares | Cost | Value | ||||||||||
| COMMON STOCKS (Continued) | ||||||||||||
| Equipment and Supplies (Continued) | ||||||||||||
| 453,500 | Graco Inc. | $ | 2,597,302 | $ | 31,731,395 | |||||||
| 35,000 | IDEX Corp. | 128,247 | 7,243,250 | |||||||||
| 154,000 | Interpump Group SpA | 691,669 | 9,989,610 | |||||||||
| 8,000 | Littelfuse Inc. | 69,715 | 2,186,160 | |||||||||
| 110,000 | Maezawa Kyuso Industries Co. Ltd. | 359,609 | 1,002,201 | |||||||||
| 60,000 | Minerals Technologies Inc. | 2,530,695 | 4,190,400 | |||||||||
| 6,000 | MSA Safety Inc. | 179,592 | 874,200 | |||||||||
| 683,500 | Mueller Industries Inc. | 17,993,876 | 28,091,850 | |||||||||
| 339,000 | Mueller Water Products Inc., Cl. A | 2,278,449 | 5,159,580 | |||||||||
| 3,600 | Teleflex Inc. | 54,840 | 1,355,580 | |||||||||
| 170,700 | Tennant Co. | 2,876,864 | 12,623,265 | |||||||||
| 761,000 | The Gorman-Rupp Co. | 11,825,810 | 27,251,410 | |||||||||
| 98,000 | The Greenbrier Companies Inc. | 1,137,850 | 4,213,020 | |||||||||
| 110,003 | The L.S. Starrett Co., Cl. A† | 803,564 | 1,373,938 | |||||||||
| 30,000 | The Manitowoc Co. Inc.† | 283,157 | 642,600 | |||||||||
| 59,000 | The Middleby Corp.† | 669,921 | 10,060,090 | |||||||||
| 35,000 | The Timken Co. | 1,159,088 | 2,289,700 | |||||||||
| 30,000 | The Toro Co. | 524,020 | 2,922,300 | |||||||||
| 7,000 | Valmont Industries Inc. | 145,925 | 1,645,840 | |||||||||
| 3,400 | Vicor Corp.† | 15,622 | 456,144 | |||||||||
| 7,875 | Watsco Inc., Cl. B | 23,627 | 2,115,934 | |||||||||
| 51,000 | Watts Water Technologies Inc., Cl. A | 968,108 | 8,572,590 | |||||||||
| 57,706,666 | 287,954,478 | |||||||||||
| Financial Services — 4.9% | ||||||||||||
| 5,000 | Alleghany Corp.† | 762,027 | 3,122,050 | |||||||||
| 8,240 | Ameris Bancorp | 71,897 | 427,491 | |||||||||
| 25,000 | Argo Group International Holdings Ltd. | 493,734 | 1,305,500 | |||||||||
| 12,000 | Capitol Federal Financial Inc. | 120,000 | 137,880 | |||||||||
| 21,800 | Crazy Woman Creek Bancorp Inc. | 339,160 | 480,145 | |||||||||
| 325,000 | Energy Transfer LP | 0 | 3,113,500 | |||||||||
| 130 | Farmers & Merchants Bank of Long Beach | 846,022 | 1,056,250 | |||||||||
| 329,950 | Flushing Financial Corp. | 5,378,313 | 7,456,870 | |||||||||
| 66,000 | FNB Corp. | 659,922 | 766,920 | |||||||||
| 195,000 | GAM Holding AG† | 601,170 | 355,706 | |||||||||
| 278,000 | Hope Bancorp Inc. | 3,087,049 | 4,014,320 | |||||||||
| 410,000 | Huntington Bancshares Inc. | 3,921,829 | 6,338,600 | |||||||||
| 705,000 | KKR & Co. Inc. | 2,933,468 | 42,920,400 | |||||||||
| 80,000 | Medallion Financial Corp.† | 362,763 | 627,200 | |||||||||
| 13,500 | PROG Holdings Inc. | 8,634 | 567,135 | |||||||||
| 55,000 | Pzena Investment Management Inc., Cl. A | 426,256 | 541,200 | |||||||||
| 44,000 | Sandy Spring Bancorp Inc. | 1,491,612 | 2,016,080 | |||||||||
| Market | ||||||||||||
| Shares | Cost | Value | ||||||||||
| 13,500 | Sculptor Capital Management Inc. | $ | 301,309 | $ | 376,515 | |||||||
| 800 | SouthState Corp. | 58,904 | 59,736 | |||||||||
| 9,000 | State Auto Financial Corp. | 208,279 | 458,550 | |||||||||
| 372,000 | Sterling Bancorp | 3,909,506 | 9,285,120 | |||||||||
| 45,000 | Synovus Financial Corp. | 1,152,365 | 1,975,050 | |||||||||
| 16,000 | TFS Financial Corp. | 234,831 | 304,960 | |||||||||
| 15,000 | Thomasville Bancshares Inc. | 570,703 | 982,875 | |||||||||
| 230,000 | Valley National Bancorp | 1,437,500 | 3,061,300 | |||||||||
| 35,500 | Value Line Inc. | 443,012 | 1,216,230 | |||||||||
| 10,000 | Waterloo Investment Holdings Ltd.†(b) | 1,373 | 3,000 | |||||||||
| 133,000 | Wright Investors' Service Holdings Inc.† | 90,952 | 38,490 | |||||||||
| 29,912,590 | 93,009,073 | |||||||||||
| Food and Beverage — 6.5% | ||||||||||||
| 425,000 | Arca Continental SAB de CV | 763,179 | 2,587,700 | |||||||||
| 80,000 | Brown-Forman Corp., Cl. A | 460,939 | 5,013,600 | |||||||||
| 40,000 | Bull-Dog Sauce Co. Ltd. | 95,622 | 846,399 | |||||||||
| 900,000 | China Tontine Wines Group Ltd.† | 94,571 | 12,139 | |||||||||
| 195,000 | Chr. Hansen Holding A/S | 8,106,517 | 15,928,038 | |||||||||
| 283,000 | Crimson Wine Group Ltd.† | 2,484,231 | 2,430,970 | |||||||||
| 220,000 | Denny's Corp.† | 736,620 | 3,594,800 | |||||||||
| 500,000 | Dynasty Fine Wines Group Ltd.† | 74,726 | 26,013 | |||||||||
| 70,000 | Farmer Brothers Co.† | 770,486 | 588,700 | |||||||||
| 415,000 | Flowers Foods Inc. | 986,370 | 9,806,450 | |||||||||
| 115,000 | ITO EN Ltd. | 2,159,849 | 7,667,011 | |||||||||
| 46,000 | Iwatsuka Confectionery Co. Ltd. | 1,592,452 | 1,651,197 | |||||||||
| 23,000 | J & J Snack Foods Corp. | 509,737 | 3,514,860 | |||||||||
| 110,000 | Kameda Seika Co. Ltd. | 4,422,956 | 4,393,279 | |||||||||
| 254,000 | Kikkoman Corp. | 1,749,120 | 20,745,406 | |||||||||
| 690,000 | Maple Leaf Foods Inc. | 12,027,755 | 14,022,264 | |||||||||
| 6,000 | MEIJI Holdings Co. Ltd. | 117,526 | 388,697 | |||||||||
| 17,000 | MGP Ingredients Inc. | 23,756 | 1,106,700 | |||||||||
| 66,000 | Morinaga Milk Industry Co. Ltd. | 1,268,212 | 4,151,130 | |||||||||
| 45,000 | Nissin Foods Holdings Co. Ltd. | 1,497,492 | 3,622,804 | |||||||||
| 15,000 | Post Holdings Inc.† | 62,689 | 1,652,400 | |||||||||
| 75,000 | Rock Field Co. Ltd. | 505,724 | 1,160,430 | |||||||||
| 1,800 | The Boston Beer Co. Inc., Cl. A† | 34,506 | 917,550 | |||||||||
| 57,200 | The J.M. Smucker Co. | 1,323,825 | 6,865,716 | |||||||||
| 625,000 | Tingyi (Cayman Islands) Holding Corp. | 1,326,207 | 1,162,544 | |||||||||
| 36,051 | Tootsie Roll Industries Inc. | 313,204 | 1,097,032 | |||||||||
| 370,000 | Vina Conchay Toro SA | 676,676 | 587,674 | |||||||||
See accompanying notes to financial statements.
The Gabelli Small Cap Growth Fund
Schedule of Investments (Continued) — September 30, 2021
| Market | ||||||||||||
| Shares | Cost | Value | ||||||||||
| COMMON STOCKS (Continued) | ||||||||||||
| Food and Beverage (Continued) | ||||||||||||
| 950,000 | Vitasoy International Holdings Ltd. | $ | 542,729 | $ | 2,416,294 | |||||||
| 20,000 | Willamette Valley Vineyards Inc.† | 73,225 | 254,400 | |||||||||
| 100,000 | Yakult Honsha Co. Ltd. | 2,378,860 | 5,085,583 | |||||||||
| 47,179,761 | 123,297,780 | |||||||||||
| Health Care — 6.0% | ||||||||||||
| 1,400 | Align Technology Inc.† | 9,766 | 931,602 | |||||||||
| 6,700 | Bio-Rad Laboratories Inc., Cl. A† | 283,604 | 4,997,865 | |||||||||
| 13,500 | Bruker Corp. | 107,977 | 1,054,350 | |||||||||
| 1,000 | Chemed Corp. | 13,731 | 465,120 | |||||||||
| 21,500 | CONMED Corp. | 441,065 | 2,812,845 | |||||||||
| 32,000 | Covetrus Inc.† | 153,127 | 580,480 | |||||||||
| 411,000 | Cutera Inc.† | 5,198,266 | 19,152,600 | |||||||||
| 12,500 | Dexcom Inc.† | 68,464 | 6,835,750 | |||||||||
| 10,000 | Evolent Health Inc., Cl. A† | 103,500 | 310,000 | |||||||||
| 8,000 | Global Blood Therapeutics Inc.† | 273,937 | 203,840 | |||||||||
| 163,000 | Globus Medical Inc., Cl. A† | 3,684,152 | 12,489,060 | |||||||||
| 72,000 | Henry Schein Inc.† | 494,318 | 5,483,520 | |||||||||
| 28,500 | ICU Medical Inc.† | 926,671 | 6,651,330 | |||||||||
| 35,000 | Masimo Corp.† | 839,798 | 9,474,850 | |||||||||
| 80,000 | Meridian Bioscience Inc.† | 1,243,246 | 1,539,200 | |||||||||
| 47,000 | Neogen Corp.† | 467,615 | 2,041,210 | |||||||||
| 96,000 | NuVasive Inc.† | 2,463,987 | 5,745,600 | |||||||||
| 216,000 | OPKO Health Inc.† | 569,980 | 788,400 | |||||||||
| 129,000 | Orthofix Medical Inc.† | 2,865,834 | 4,917,480 | |||||||||
| 19,000 | Patterson Cos. Inc. | 414,269 | 572,660 | |||||||||
| 78,000 | Quidel Corp.† | 346,178 | 11,009,700 | |||||||||
| 24,000 | Seikagaku Corp. | 280,995 | 229,013 | |||||||||
| 29,000 | STERIS plc | 1,520,020 | 5,924,120 | |||||||||
| 1,900 | Straumann Holding AG | 170,618 | 3,432,212 | |||||||||
| 3,000 | Stryker Corp. | 142,188 | 791,160 | |||||||||
| 52,000 | Surgalign Holdings Inc.† | 225,170 | 56,680 | |||||||||
| 30,000 | SurModics Inc.† | 608,729 | 1,668,000 | |||||||||
| 26,500 | Teladoc Health Inc.† | 884,474 | 3,360,465 | |||||||||
| 100 | The Cooper Companies Inc. | 3,627 | 41,331 | |||||||||
| 38,000 | United-Guardian Inc. | 332,419 | 538,840 | |||||||||
| 25,137,725 | 114,099,283 | |||||||||||
| Home Furnishings — 0.3% | ||||||||||||
| 171,500 | Bassett Furniture Industries Inc. | 1,682,604 | 3,105,865 | |||||||||
| 5,000 | Ethan Allen Interiors Inc. | 116,387 | 118,500 | |||||||||
| 70,000 | La-Z-Boy Inc. | 1,140,329 | 2,256,100 | |||||||||
| 2,939,320 | 5,480,465 | |||||||||||
| Hotels and Gaming — 4.8% | ||||||||||||
| 140,000 | Boyd Gaming Corp.† | 677,092 | 8,856,400 | |||||||||
| Market | ||||||||||||
| Shares | Cost | Value | ||||||||||
| 191,040 | Canterbury Park Holding Corp.† | $ | 1,967,490 | $ | 3,169,354 | |||||||
| 118,000 | Churchill Downs Inc. | 1,089,792 | 28,329,440 | |||||||||
| 120,000 | Formosa International Hotels Corp. | 775,629 | 631,001 | |||||||||
| 535,000 | Full House Resorts Inc.† | 1,556,937 | 5,676,350 | |||||||||
| 48,508 | Gaming and Leisure Properties Inc., REIT | 389,693 | 2,246,890 | |||||||||
| 12,000 | GAN Ltd.† | 238,973 | 178,440 | |||||||||
| 750,000 | Genting Singapore Ltd | 688,148 | 397,702 | |||||||||
| 130,000 | Golden Entertainment Inc.† | 1,054,750 | 6,381,700 | |||||||||
| 2,600,000 | Mandarin Oriental International Ltd.† | 3,509,608 | 5,434,000 | |||||||||
| 3,500 | Penn National Gaming Inc.† | 15,199 | 253,610 | |||||||||
| 285,000 | Ryman Hospitality Properties Inc., REIT† | 4,929,759 | 23,854,500 | |||||||||
| 2,500,000 | The Hongkong & Shanghai Hotels Ltd.† | 2,476,225 | 2,341,146 | |||||||||
| 127,000 | The Marcus Corp.† | 1,342,952 | 2,216,150 | |||||||||
| 13,500 | Wynn Resorts Ltd.† | 0 | 1,144,125 | |||||||||
| 20,712,247 | 91,110,808 | |||||||||||
| Machinery — 2.8% | ||||||||||||
| 341,500 | Astec Industries Inc. | 11,945,517 | 18,376,115 | |||||||||
| 1,427,000 | CNH Industrial NV | 4,242,733 | 23,702,470 | |||||||||
| 90,000 | Kennametal Inc. | 1,650,215 | 3,080,700 | |||||||||
| 5,300 | Nordson Corp. | 90,324 | 1,262,195 | |||||||||
| 160,000 | The Eastern Co. | 3,114,959 | 4,025,600 | |||||||||
| 100,000 | Twin Disc Inc.† | 1,080,068 | 1,066,000 | |||||||||
| 100,000 | Welbilt Inc.† | 593,633 | 2,324,000 | |||||||||
| 22,717,449 | 53,837,080 | |||||||||||
| Manufactured Housing and Recreational Vehicles — 1.5% | ||||||||||||
| 71,000 | Cavco Industries Inc.† | 1,418,150 | 16,808,540 | |||||||||
| 70,000 | Nobility Homes Inc. | 771,717 | 2,485,000 | |||||||||
| 82,000 | Skyline Champion Corp.† | 475,234 | 4,924,920 | |||||||||
| 52,000 | Winnebago Industries Inc. | 592,044 | 3,767,400 | |||||||||
| 3,257,145 | 27,985,860 | |||||||||||
| Metals and Mining — 0.0% | ||||||||||||
| 45,000 | Ivanhoe Mines Ltd., Cl. A† | 117,783 | 287,778 | |||||||||
| 95,000 | Kinross Gold Corp. | 412,123 | 509,200 | |||||||||
| 529,906 | 796,978 | |||||||||||
| Publishing — 0.9% | ||||||||||||
| 2,500 | Graham Holdings Co., Cl. B | 1,163,667 | 1,472,900 | |||||||||
| 5,000 | John Wiley & Sons Inc., Cl. B | 19,375 | 261,650 | |||||||||
| 18,500 | Meredith Corp.† | 260,981 | 1,030,450 | |||||||||
| 34,000 | News Corp., Cl. A | 48,038 | 800,020 | |||||||||
| 775,000 | The E.W. Scripps Co., Cl. A | 4,022,887 | 13,996,500 | |||||||||
| 5,514,948 | 17,561,520 | |||||||||||
See accompanying notes to financial statements.
The Gabelli Small Cap Growth Fund
Schedule of Investments (Continued) — September 30, 2021
| Market | ||||||||||||
| Shares | Cost | Value | ||||||||||
| COMMON STOCKS (Continued) | ||||||||||||
| Real Estate — 2.7% | ||||||||||||
| 78,500 | Capital Properties Inc., Cl. A | $ | 935,416 | $ | 943,963 | |||||||
| 6,967 | Gyrodyne LLC† | 201,352 | 90,501 | |||||||||
| — | Indus Realty Trust Inc. | 0 | 0 | |||||||||
| 262,000 | Indus Realty Trust Inc., REIT | 5,058,467 | 18,366,200 | |||||||||
| 18,300 | Lamar Advertising Co., Cl. A, REIT | 105,310 | 2,076,135 | |||||||||
| 90,000 | Morguard Corp. | 1,140,881 | 9,464,709 | |||||||||
| 10,000 | Reading International Inc., Cl. A† | 68,355 | 50,600 | |||||||||
| 3,500 | Reading International Inc., Cl. B† | 66,647 | 79,415 | |||||||||
| 18,500 | Seritage Growth Properties, Cl. A, REIT† | 269,861 | 274,355 | |||||||||
| 126,700 | Tejon Ranch Co.† | 2,896,958 | 2,250,192 | |||||||||
| 405,000 | The St. Joe Co. | 6,267,431 | 17,050,500 | |||||||||
| 95,000 | Trinity Place Holdings Inc.† | 334,475 | 186,200 | |||||||||
| 17,345,153 | 50,832,770 | |||||||||||
| Retail — 5.7% | ||||||||||||
| 129,000 | AutoNation Inc.† | 2,094,018 | 15,707,040 | |||||||||
| 9,000 | Big 5 Sporting Goods Corp. | 53,145 | 207,360 | |||||||||
| 900 | Biglari Holdings Inc., Cl. A† | 548,428 | 738,000 | |||||||||
| 92,000 | Copart Inc.† | 777,200 | 12,762,240 | |||||||||
| 523 | Hertz Global Holdings Inc.†(c) | 5,957 | 10,225 | |||||||||
| 474,000 | Ingles Markets Inc., Cl. A | 6,938,285 | 31,298,220 | |||||||||
| 30,000 | Lands' End Inc.† | 395,280 | 706,200 | |||||||||
| 75,000 | Movado Group Inc. | 1,154,573 | 2,361,750 | |||||||||
| 155,500 | Nathan's Famous Inc. | 187,982 | 9,511,935 | |||||||||
| 71,000 | Penske Automotive Group Inc. | 1,036,332 | 7,142,600 | |||||||||
| 93,000 | Pets at Home Group plc | 159,631 | 602,231 | |||||||||
| 348,000 | Rush Enterprises Inc., Cl. B | 2,493,065 | 15,927,960 | |||||||||
| 10,000 | Salvatore Ferragamo SpA† | 198,277 | 205,028 | |||||||||
| 10,000 | The Cheesecake Factory Inc.† | 93,274 | 470,000 | |||||||||
| 38,500 | Tractor Supply Co. | 330,273 | 7,800,485 | |||||||||
| 60,000 | Village Super Market Inc., Cl. A | 1,471,077 | 1,300,800 | |||||||||
| 100 | Vroom Inc.† | 2,200 | 2,207 | |||||||||
| 8,600 | Weis Markets Inc. | 238,885 | 451,930 | |||||||||
| 600 | Winmark Corp. | 41,191 | 129,018 | |||||||||
| 18,219,073 | 107,335,229 | |||||||||||
| Specialty Chemicals — 3.5% | ||||||||||||
| 3,500 | Albemarle Corp. | 52,132 | 766,395 | |||||||||
| 28,000 | Ashland Global Holdings Inc. | 210,127 | 2,495,360 | |||||||||
| 1,354,525 | Ferro Corp.† | 6,342,463 | 27,551,039 | |||||||||
| Market | ||||||||||||
| Shares | Cost | Value | ||||||||||
| 180,546 | GCP Applied Technologies Inc.† | $ | 4,482,831 | $ | 3,957,568 | |||||||
| 252,000 | H.B. Fuller Co. | 2,873,618 | 16,269,120 | |||||||||
| 37,500 | Hawkins Inc. | 640,205 | 1,308,000 | |||||||||
| 45,000 | Huntsman Corp | 141,192 | 1,331,550 | |||||||||
| 6,000 | NewMarket Corp. | 602,057 | 2,032,620 | |||||||||
| 9,000 | Quaker Chemical Corp. | 139,495 | 2,139,480 | |||||||||
| 50,000 | Sensient Technologies Corp. | 972,081 | 4,554,000 | |||||||||
| 2,500 | Takasago International Corp. | 66,073 | 67,276 | |||||||||
| 91,200 | The General Chemical Group Inc.†(b) | 1,186 | 456 | |||||||||
| 130,000 | Valvoline Inc. | 383,928 | 4,053,400 | |||||||||
| 16,907,388 | 66,526,264 | |||||||||||
| Telecommunications — 0.9% | ||||||||||||
| 60,000 | Consolidated Communications Holdings Inc.† | 369,591 | 551,400 | |||||||||
| 70,000 | Gogo Inc.† | 369,181 | 1,211,000 | |||||||||
| 4,500 | IDT Corp., Cl. B† | 16,983 | 188,775 | |||||||||
| 65,000 | Iridium Communications Inc.† | 581,750 | 2,590,250 | |||||||||
| 50,000 | Loral Space & Communications Inc. | 1,661,975 | 2,150,500 | |||||||||
| 86,000 | Nuvera Communications Inc. | 634,234 | 1,892,000 | |||||||||
| 84,000 | Rogers Communications Inc., Cl. B | 302,780 | 3,917,760 | |||||||||
| 75,000 | Shenandoah Telecommunications Co. | 183,915 | 2,368,500 | |||||||||
| 800,000 | VEON Ltd., ADR† | 1,565,983 | 1,664,000 | |||||||||
| 4,000 | Verizon Communications Inc. | 17,565 | 216,040 | |||||||||
| 5,703,957 | 16,750,225 | |||||||||||
| Transportation — 1.8% | ||||||||||||
| 380,000 | GATX Corp. | 10,862,049 | 34,032,800 | |||||||||
| 18,600 | Irish Continental Group plc† | 13,660 | 92,968 | |||||||||
| 100,053 | Navigator Holdings Ltd.† | 961,758 | 890,472 | |||||||||
| 11,837,467 | 35,016,240 | |||||||||||
| Wireless Communications — 0.0% | ||||||||||||
| 22,000 | United States Cellular Corp.† | 789,590 | 701,580 | |||||||||
| TOTAL COMMON STOCKS | 522,793,384 | 1,893,409,052 | ||||||||||
| CLOSED-END FUNDS — 0.2% | ||||||||||||
| 55,000 | The Central Europe, Russia, and Turkey Fund Inc. | 1,214,513 | 1,587,850 | |||||||||
| 32,729 | The European Equity Fund Inc. | 325,355 | 364,928 | |||||||||
See accompanying notes to financial statements.
The Gabelli Small Cap Growth Fund
Schedule of Investments (Continued) — September 30, 2021
| Market | ||||||||||||
| Shares | Cost | Value | ||||||||||
| CLOSED-END FUNDS (Continued) | ||||||||||||
| 119,537 | The New Germany Fund Inc. | $ | 1,659,113 | $ | 2,360,856 | |||||||
| 3,198,981 | 4,313,634 | |||||||||||
| TOTAL CLOSED-END FUNDS | 3,198,981 | 4,313,634 | ||||||||||
| PREFERRED STOCKS — 0.3% | ||||||||||||
| Automotive: Parts and Accessories — 0.3% | ||||||||||||
| 95,000 | Jungheinrich AG | 649,637 | 4,432,542 | |||||||||
| RIGHTS — 0.0% | ||||||||||||
| Entertainment — 0.0% | ||||||||||||
| 1,680,000 | Media General Inc., CVR, expire 12/31/21†(b) | 2 | 2 | |||||||||
| WARRANTS — 0.0% | ||||||||||||
| Business Services — 0.0% | ||||||||||||
| 1 | Internap Corp., expire 05/08/24†(b) | 0 | 652 | |||||||||
| Diversified Industrial — 0.0% | ||||||||||||
| 140,000 | Ampco-Pittsburgh Corp., expire 08/01/25† | 95,648 | 121,037 | |||||||||
| TOTAL WARRANTS | 95,648 | 121,689 | ||||||||||
| TOTAL MISCELLANEOUS INVESTMENTS — 0.1%(d) | 1,843,659 | 2,204,711 | ||||||||||
| TOTAL INVESTMENTS — 100.3% | $ | 528,581,311 | 1,904,481,630 | |||||||||
| Other Assets and Liabilities (Net) — (0.3)% | (5,050,117 | ) | ||||||||||
| NET ASSETS — 100.0% | $ | 1,899,431,513 | ||||||||||
| (a) | Security considered an affiliated holding because the Fund owns at least 5% of its outstanding shares. |
| (b) | Security is valued using significant unobservable inputs and is classified as Level 3 in the fair value hierarchy. |
| (c) | Security exempt from registration under Rule 144A of the Securities Act of 1933, as amended. This security may be resold in transactions exempt from registration, normally to qualified institutional buyers. |
| (d) | Represents previously undisclosed, unrestricted securities which the Fund has held for less than one year. |
| † | Non-income producing security. |
ADR American Depositary Receipt
CVR Contingent Value Right
REIT Real Estate Investment Trust
See accompanying notes to financial statements.
Report of Independent Registered Public Accounting Firm
To the Shareholders of The Gabelli Small Cap Growth Fund
and the Board of Directors of Gabelli Equity Series Funds, Inc.
Opinion on the Financial Statements and Schedule of Investments in Securities
We have audited the accompanying statement of assets and liabilities of The Gabelli Small Cap Growth Fund (the “Fund”) (one of the funds constituting Gabelli Equity Series Funds, Inc. (the “Corporation”)), including the summary schedule of investments, as of September 30, 2021, and the related statement of operations for the year then ended, the statements of changes in net assets for each of the two years in the period then ended, the financial highlights for each of the five years in the period then ended and the related notes (collectively referred to as the “financial statements”) (the financial statements are included in Item 1 of this Form N-CSR), and the schedule of investments in securities as of September 30, 2021 (included in Item 6 of this Form N-CSR). In our opinion, the financial statements and schedule of investments in securities present fairly, in all material respects, the financial position of the Fund (one of the funds constituting Gabelli Equity Series Funds, Inc.) at September 30, 2021, the results of its operations for the year then ended, the changes in its net assets for each of the two years in the period then ended and its financial highlights for each of the five years in the period then ended, in conformity with U.S. generally accepted accounting principles.
Basis for Opinion
These financial statements and schedule of investments in securities are the responsibility of the Corporation’s management. Our responsibility is to express an opinion on the Fund’s financial statements and schedule of investments in securities based on our audits. We are a public accounting firm registered with the Public Company Accounting Oversight Board (United States) ("PCAOB") and are required to be independent with respect to the Corporation in accordance with the U.S. federal securities laws and the applicable rules and regulations of the Securities and Exchange Commission and the PCAOB.
We conducted our audits in accordance with the standards of the PCAOB. Those standards require that we plan and perform the audit to obtain reasonable assurance about whether the financial statements and schedule of investments in securities are free of material misstatement, whether due to error or fraud. The Corporation is not required to have, nor were we engaged to perform, an audit of the Corporation’s internal control over financial reporting. As part of our audits we are required to obtain an understanding of internal control over financial reporting but not for the purpose of expressing an opinion on the effectiveness of the Corporation’s internal control over financial reporting. Accordingly, we express no such opinion.
Our audits included performing procedures to assess the risks of material misstatement of the financial statements and schedule of investments in securities, whether due to error or fraud, and performing procedures that respond to those risks. Such procedures included examining, on a test basis, evidence regarding the amounts and disclosures in the financial statements and schedule of investments in securities. Our procedures included confirmation of securities owned as of September 30, 2021, by correspondence with the custodian. Our audits also included evaluating the accounting principles used and significant estimates made by management, as well as evaluating the overall presentation of the financial statements and schedule of investments in securities. We believe that our audits provide a reasonable basis for our opinion.

We have served as the auditor of one or more Gabelli/GAMCO Funds investment companies since 1992.
Philadelphia, Pennsylvania
November 24, 2021
| (b) | Not applicable due to no such divestments during the semi-annual period covered since the previous Form N-CSR filing. |
Item 7. Disclosure of Proxy Voting Policies and Procedures for Closed-End Management Investment Companies.
Not applicable.
Item 8. Portfolio Managers of Closed-End Management Investment Companies.
Not applicable.
Item 9. Purchases of Equity Securities by Closed-End Management Investment Company and Affiliated Purchasers.
Not applicable.
Item 10. Submission of Matters to a Vote of Security Holders.
There have been no material changes to the procedures by which the shareholders may recommend nominees to the registrant’s board of directors, where those changes were implemented after the registrant last provided disclosure in response to the requirements of Item 407(c)(2)(iv) of Regulation S-K (17 CFR 229.407) (as required by Item 22(b)(15) of Schedule 14A (17 CFR 240.14a-101)), or this Item.
Item 11. Controls and Procedures.
| (a) | The registrant’s principal executive and principal financial officers, or persons performing similar functions, have concluded that the registrant’s disclosure controls and procedures (as defined in Rule 30a-3(c) under the Investment Company Act of 1940, as amended (the “1940 Act”) (17 CFR 270.30a-3(c))) are effective, as of a date within 90 days of the filing date of the report that includes the disclosure required by this paragraph, based on their evaluation of these controls and procedures required by Rule 30a-3(b) under the 1940 Act (17 CFR 270.30a-3(b)) and Rules 13a-15(b) or 15d-15(b) under the Securities Exchange Act of 1934, as amended (17 CFR 240.13a-15(b) or 240.15d-15(b)). | |
| (b) | There were no changes in the registrant’s internal control over financial reporting (as defined in Rule 30a-3(d) under the 1940 Act (17 CFR 270.30a-3(d))) that occurred during the period covered by this report that has materially affected, or is reasonably likely to materially affect, the registrant’s internal control over financial reporting. |
Item 12. Disclosure of Securities Lending Activities for Closed-End Management Investment Companies.
Not applicable.
Item 13. Exhibits.
| (a)(1) | Code of ethics, or any amendment thereto, that is the subject of disclosure required by Item 2 is attached hereto. |
| (a)(2) | Certifications pursuant to Rule 30a-2(a) under the 1940 Act and Section 302 of the Sarbanes-Oxley Act of 2002 are attached hereto. | |
| (a)(2)(1) | Not applicable. | |
| (a)(2)(2) | Not applicable. |
| (b) | Certifications pursuant to Rule 30a-2(b) under the 1940 Act and Section 906 of the Sarbanes-Oxley Act of 2002 are attached hereto. |
SIGNATURES
Pursuant to the requirements of the Securities Exchange Act of 1934 and the Investment Company Act of 1940, the registrant has duly caused this report to be signed on its behalf by the undersigned, thereunto duly authorized.
| (Registrant) | Gabelli Equity Series Funds, Inc. |
| By (Signature and Title)* | /s/ Bruce N. Alpert | |
| Bruce N. Alpert, Principal Executive Officer |
| Date | December 3, 2021 |
Pursuant to the requirements of the Securities Exchange Act of 1934 and the Investment Company Act of 1940, this report has been signed below by the following persons on behalf of the registrant and in the capacities and on the dates indicated.
| By (Signature and Title)* | /s/ Bruce N. Alpert | |
| Bruce N. Alpert, Principal Executive Officer |
| Date | December 3, 2021 |
| By (Signature and Title)* | /s/ John C. Ball | |
John C. Ball, Principal Financial Officer and Treasurer
|
| Date | December 3, 2021 |
* Print the name and title of each signing officer under his or her signature.