UNITED STATES
SECURITIES AND EXCHANGE COMMISSION
Washington, D.C. 20549
FORM N-CSR
CERTIFIED SHAREHOLDER REPORT OF REGISTERED
MANAGEMENT INVESTMENT COMPANIES
Investment Company Act file number 811-06367
Gabelli Equity Series Funds, Inc.
(Exact name of registrant as specified in charter)
One Corporate Center
Rye, New York 10580-1422
(Address of principal executive offices) (Zip code)
John C. Ball
Gabelli Funds, LLC
One Corporate Center
Rye, New York 10580-1422
(Name and address of agent for service)
Registrant’s telephone number, including area code: 1-800-422-3554
Date of fiscal year end: September 30
Date of reporting period: September 30, 2024
Form N-CSR is to be used by management investment companies to file reports with the Commission not later than 10 days after the transmission to stockholders of any report that is required to be transmitted to stockholders under Rule 30e-1 under the Investment Company Act of 1940 (17 CFR 270.30e-1). The Commission may use the information provided on Form N-CSR in its regulatory, disclosure review, inspection, and policymaking roles.
A registrant is required to disclose the information specified by Form N-CSR, and the Commission will make this information public. A registrant is not required to respond to the collection of information contained in Form N-CSR unless the Form displays a currently valid Office of Management and Budget (“OMB”) control number. Please direct comments concerning the accuracy of the information collection burden estimate and any suggestions for reducing the burden to Secretary, Securities and Exchange Commission, 100 F Street, NE Washington, DC 20549-1090. The OMB has reviewed this collection of information under the clearance requirements of 44 U.S.C. § 3507.
| Item 1. | Reports to Stockholders. |
| (a) | The Report to Shareholders is attached herewith. |
The Gabelli Equity Income Fund
Annual Shareholder Report - September 30, 2024

This annual shareholder report contains important information about The Gabelli Equity Income Fund (the "Fund") for the period of October 1, 2023 to September 30, 2024. The Gabelli Equity Income Fund seeks to provide a high level of total return on its assets with an emphasis on income. The Fund will seek to achieve its investment objective through a combination of capital appreciation and current income by investing, under normal market conditions, at least 80% of its net assets in income producing equity securities. Income producing equity securities include, for example, common stock, preferred stock, and convertible securities. In making stock selections, Gabelli Funds, LLC, the Adviser, looks for securities that have a better yield than the average of the S&P 500 Index, as well as capital gains potential. You can find additional information about the Fund at www.gabelli.com/funds/open_ends. You can also request this information by contacting us at 800-GABELLI (800-422-3554).
What were the Fund costs for the last year?
(based on a hypothetical $10,000 investment)
| Class Name | Costs of a $10k Investment | Costs Paid as a % of a $10k Investment |
|---|
| The Gabelli Equity Income Fund - Class AAA | $157 | 1.43% |
How did the Fund perform?
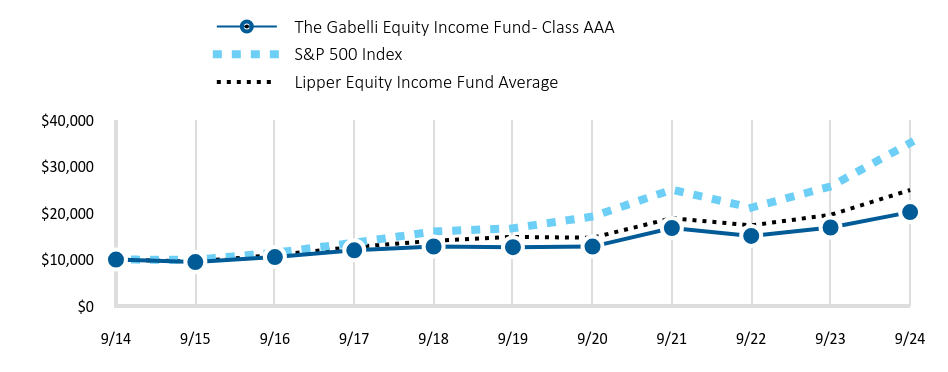
During the fiscal year ended September 30, 2024, the Gabelli Equity Income Fund underperformed its broad-based benchmark, the S&P 500 Index, as well as its comparative benchmark, the Lipper Equity Income Fund Average. Top contributors to the Fund over the year were focused in the Financials, Industrials and Information Technology sectors. Detractors to returns over the fiscal year primarily came from the Consumer Staples, Energy, and Health Care sectors.
How has the Fund performed over the past 10 years?
The performance chart of the fund class presented reflects a hypothetical $10,000 investment, assuming the maximum sales charge, compared to a broad-based securities market index and more narrowly based indices reflecting market sectors in which the Fund invests over a 10-year period. The chart uses total return NAV performance and assumes reinvestment of dividends and capital gains distribution. Fund expenses were deducted.
Total Return Based on a $10,000 Investment
| The Gabelli Equity Income Fund - Class AAA | S&P 500 Index | Lipper Equity Income Fund Average |
|---|
| 9/14 | 10,000 | 10,000 | 10,000 |
| 9/15 | 9,460 | 9,939 | 9,576 |
| 9/16 | 10,530 | 11,473 | 10,975 |
| 9/17 | 11,995 | 13,608 | 12,720 |
| 9/18 | 12,807 | 16,045 | 14,048 |
| 9/19 | 12,667 | 16,727 | 14,873 |
| 9/20 | 12,785 | 19,261 | 14,693 |
| 9/21 | 16,789 | 25,039 | 18,907 |
| 9/22 | 15,097 | 21,165 | 17,360 |
| 9/23 | 16,896 | 25,741 | 19,634 |
| 9/24 | 20,215 | 35,098 | 24,967 |
Average Annual Total Returns
| 1 Year | 5 Year | 10 Year |
|---|
| The Gabelli Equity Income Fund - Class AAA | 19.64% | 9.80% | 7.29% |
| S&P 500 Index | 36.35% | 15.98% | 13.38% |
| Lipper Equity Income Fund Average | 27.16% | 10.92% | 9.58% |
- Total Net Assets$483,695,327
- Number of Portfolio Holdings213
- Portfolio Turnover Rate1%
- Management Fees$4,963,427
Past performance does not guarantee future results. Call 800-GABELLI (800-422-3554) or visit www.gabelli.com/funds/open_ends for current month-end performance. The table and graph presented above do not reflect the deduction of taxes a shareholder would pay on fund distributions or the redemption of fund shares.
What did the Fund invest in?
Top 10 Holdings (% of net assets)
| Genuine Parts Co. | 4.4% |
| The Bank of New York Mellon Corp. | 4.2% |
| Deere & Co. | 2.7% |
| Microsoft Corp. | 2.4% |
| GATX Corp. | 2.4% |
| State Street Corp. | 2.2% |
| Crane Co. | 2.0% |
| Mueller Industries Inc. | 2.0% |
| Textron Inc. | 1.8% |
| Brown-Forman Corp. | 1.8% |
Portfolio Weighting (% of net assets)
| Common Stocks | 99.9% |
| Other Assets and Liabilities (Net) | 0.1% |
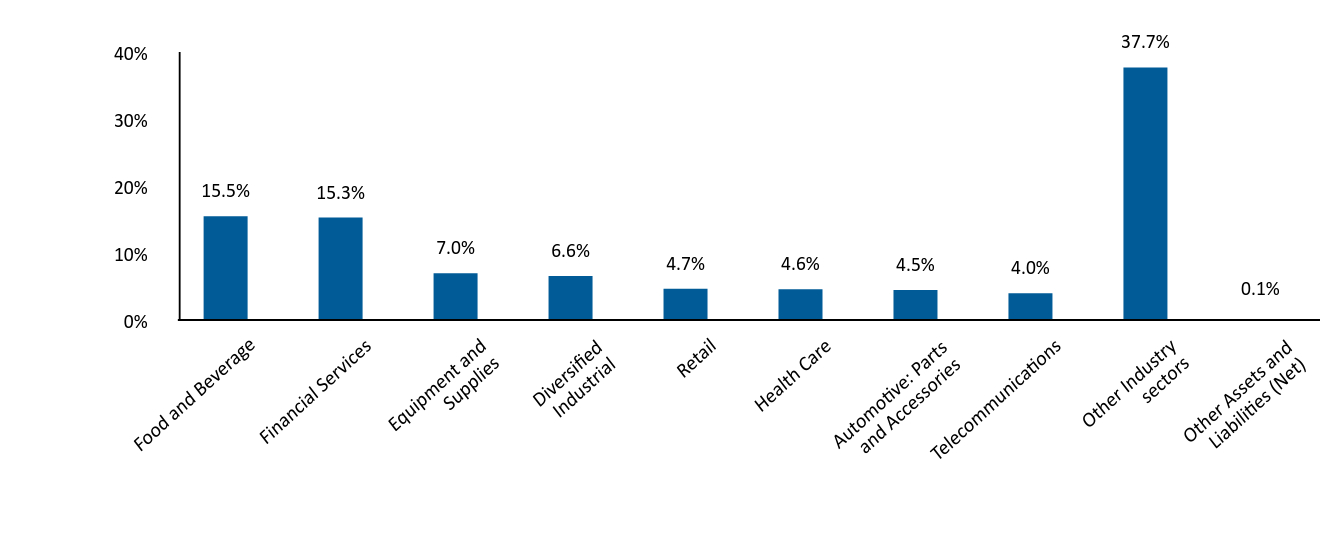
Industry Allocation (% of net assets)
| Industry Weighting | . |
|---|
| Food and Beverage | 15.5% |
| Financial Services | 15.3% |
| Equipment and Supplies | 7.0% |
| Diversified Industrial | 6.6% |
| Retail | 4.7% |
| Health Care | 4.6% |
| Automotive: Parts and Accessories | 4.5% |
| Telecommunications | 4.0% |
| Other Industry sectors | 37.7% |
| Other Assets and Liabilities (Net) | 0.1% |
The Gabelli Equity Income Fund
Annual Shareholder Report - September 30, 2024
Where can I find additional information about the Fund?
If you wish to view additional information about the Fund; including but not limited to financial statements or holdings, please visit www.gabelli.com/funds/open_ends.
Contact Us
Phone: 800-GABELLI (800-422-3554)
Email: info@gabelli.com
If you wish to receive a copy of this document at a new address, contact 800-GABELLI (800-422-3554)
The Gabelli Equity Income Fund
Annual Shareholder Report - September 30, 2024

This annual shareholder report contains important information about The Gabelli Equity Income Fund (the "Fund") for the period of October 1, 2023 to September 30, 2024. The Gabelli Equity Income Fund seeks to provide a high level of total return on its assets with an emphasis on income. The Fund will seek to achieve its investment objective through a combination of capital appreciation and current income by investing, under normal market conditions, at least 80% of its net assets in income producing equity securities. Income producing equity securities include, for example, common stock, preferred stock, and convertible securities. In making stock selections, Gabelli Funds, LLC, the Adviser, looks for securities that have a better yield than the average of the S&P 500 Index, as well as capital gains potential. You can find additional information about the Fund at www.gabelli.com/funds/open_ends. You can also request this information by contacting us at 800-GABELLI (800-422-3554).
This report describes changes to the Fund that occurred during the reporting period.
What were the Fund costs for the last year?
(based on a hypothetical $10,000 investment)
| Class Name | Costs of a $10k Investment | Costs Paid as a % of a $10k Investment |
|---|
| The Gabelli Equity Income Fund - Class C | $239 | 2.18% |
How did the Fund perform?
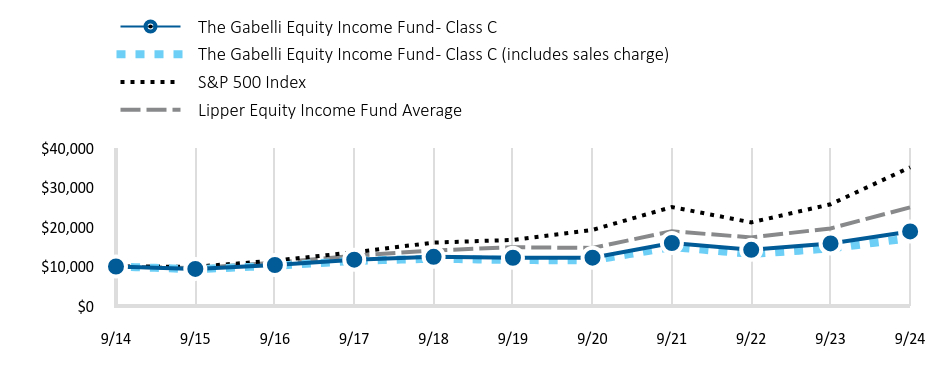
During the fiscal year ended September 30, 2024, the Gabelli Equity Income Fund underperformed its broad-based benchmark, the S&P 500 Index, as well as its comparative benchmark, the Lipper Equity Income Fund Average. Top contributors to the Fund over the year were focused in the Financials, Industrials and Information Technology sectors. Detractors to returns over the fiscal year primarily came from the Consumer Staples, Energy, and Health Care sectors.
How has the Fund performed over the past 10 years?
The performance chart of the fund class presented reflects a hypothetical $10,000 investment, assuming the maximum sales charge, compared to a broad-based securities market index and more narrowly based indices reflecting market sectors in which the Fund invests over a 10-year period. The chart uses total return NAV performance and assumes reinvestment of dividends and capital gains distribution. Fund expenses were deducted.
Total Return Based on a $10,000 Investment
| The Gabelli Equity Income Fund - Class C | The Gabelli Equity Income Fund - Class C (includes sales charge) | S&P 500 Index | Lipper Equity Income Fund Average |
|---|
| 9/14 | 10,000 | 10,000 | 10,000 | 10,000 |
| 9/15 | 9,390 | 9,296 | 9,939 | 9,576 |
| 9/16 | 10,377 | 10,180 | 11,473 | 10,975 |
| 9/17 | 11,730 | 11,406 | 13,608 | 12,720 |
| 9/18 | 12,436 | 11,978 | 16,045 | 14,048 |
| 9/19 | 12,204 | 11,637 | 16,727 | 14,873 |
| 9/20 | 12,237 | 11,552 | 19,261 | 14,693 |
| 9/21 | 15,943 | 14,936 | 25,039 | 18,907 |
| 9/22 | 14,215 | 13,184 | 21,165 | 17,360 |
| 9/23 | 15,827 | 14,547 | 25,741 | 19,634 |
| 9/24 | 18,862 | 17,191 | 35,098 | 24,967 |
Average Annual Total Returns
| 1 Year | 5 Year | 10 Year |
|---|
| The Gabelli Equity Income Fund - Class C | 19.18% | 8.97% | 6.49% |
| The Gabelli Equity Income Fund - Class C (includes sales charge) | 18.18% | 8.97% | 6.49% |
| S&P 500 Index | 36.35% | 15.98% | 13.38% |
| Lipper Equity Income Fund Average | 27.16% | 10.92% | 9.58% |
- Total Net Assets$483,695,327
- Number of Portfolio Holdings213
- Portfolio Turnover Rate1%
- Management Fees$4,963,427
Past performance does not guarantee future results. Call 800-GABELLI (800-422-3554) or visit www.gabelli.com/funds/open_ends for current month-end performance. The table and graph presented above do not reflect the deduction of taxes a shareholder would pay on fund distributions or the redemption of fund shares.
What did the Fund invest in?
Top 10 Holdings (% of net assets)
| Genuine Parts Co. | 4.4% |
| The Bank of New York Mellon Corp. | 4.2% |
| Deere & Co. | 2.7% |
| Microsoft Corp. | 2.4% |
| GATX Corp. | 2.4% |
| State Street Corp. | 2.2% |
| Crane Co. | 2.0% |
| Mueller Industries Inc. | 2.0% |
| Textron Inc. | 1.8% |
| Brown-Forman Corp. | 1.8% |
Portfolio Weighting (% of net assets)
| Common Stocks | 99.9% |
| Other Assets and Liabilities (Net) | 0.1% |
Industry Allocation (% of net assets)
| Industry Weighting | . |
|---|
| Food and Beverage | 15.5% |
| Financial Services | 15.3% |
| Equipment and Supplies | 7.0% |
| Diversified Industrial | 6.6% |
| Retail | 4.7% |
| Health Care | 4.6% |
| Automotive: Parts and Accessories | 4.5% |
| Telecommunications | 4.0% |
| Other Industry sectors | 37.7% |
| Other Assets and Liabilities (Net) | 0.1% |
The Gabelli Equity Income Fund
Annual Shareholder Report - September 30, 2024
Due to the Fund changing fiscal year ends from October to September, returns for both 11 months and 1 year are presented in the Average Annual Total Returns table.
Where can I find additional information about the Fund?
If you wish to view additional information about the Fund; including but not limited to financial statements or holdings, please visit www.gabelli.com/funds/open_ends.
Contact Us
Phone: 800-GABELLI (800-422-3554)
Email: info@gabelli.com
If you wish to receive a copy of this document at a new address, contact 800-GABELLI (800-422-3554)
The Gabelli Equity Income Fund
Annual Shareholder Report - September 30, 2024

This annual shareholder report contains important information about The Gabelli Equity Income Fund (the "Fund") for the period of October 1, 2023 to September 30, 2024. The Gabelli Equity Income Fund seeks to provide a high level of total return on its assets with an emphasis on income. The Fund will seek to achieve its investment objective through a combination of capital appreciation and current income by investing, under normal market conditions, at least 80% of its net assets in income producing equity securities. Income producing equity securities include, for example, common stock, preferred stock, and convertible securities. In making stock selections, Gabelli Funds, LLC, the Adviser, looks for securities that have a better yield than the average of the S&P 500 Index, as well as capital gains potential. You can find additional information about the Fund at www.gabelli.com/funds/open_ends. You can also request this information by contacting us at 800-GABELLI (800-422-3554).
What were the Fund costs for the last year?
(based on a hypothetical $10,000 investment)
| Class Name | Costs of a $10k Investment | Costs Paid as a % of a $10k Investment |
|---|
| The Gabelli Equity Income Fund - Class I | $130 | 1.18% |
How did the Fund perform?
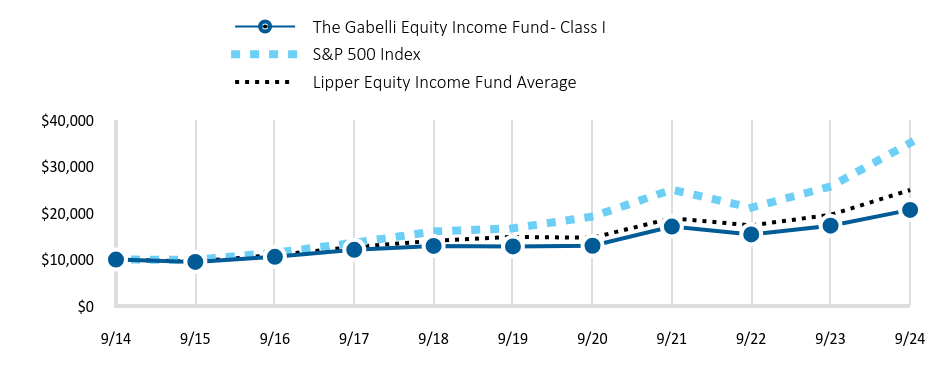
During the fiscal year ended September 30, 2024, the Gabelli Equity Income Fund underperformed its broad-based benchmark, the S&P 500 Index, as well as its comparative benchmark, the Lipper Equity Income Fund Average. Top contributors to the Fund over the year were focused in the Financials, Industrials and Information Technology sectors. Detractors to returns over the fiscal year primarily came from the Consumer Staples, Energy, and Health Care sectors.
How has the Fund performed over the past 10 years?
The performance chart of the fund class presented reflects a hypothetical $10,000 investment, assuming the maximum sales charge, compared to a broad-based securities market index and more narrowly based indices reflecting market sectors in which the Fund invests over a 10-year period. The chart uses total return NAV performance and assumes reinvestment of dividends and capital gains distribution. Fund expenses were deducted.
Total Return Based on a $10,000 Investment
| The Gabelli Equity Income Fund - Class I | S&P 500 Index | Lipper Equity Income Fund Average |
|---|
| 9/14 | 10,000 | 10,000 | 10,000 |
| 9/15 | 9,485 | 9,939 | 9,576 |
| 9/16 | 10,584 | 11,473 | 10,975 |
| 9/17 | 12,086 | 13,608 | 12,720 |
| 9/18 | 12,941 | 16,045 | 14,048 |
| 9/19 | 12,829 | 16,727 | 14,873 |
| 9/20 | 12,976 | 19,261 | 14,693 |
| 9/21 | 17,090 | 25,039 | 18,907 |
| 9/22 | 15,414 | 21,165 | 17,360 |
| 9/23 | 17,293 | 25,741 | 19,634 |
| 9/24 | 20,691 | 35,098 | 24,967 |
Average Annual Total Returns
| 1 Year | 5 Year | 10 Year |
|---|
| The Gabelli Equity Income Fund - Class I | 19.85% | 10.07% | 7.56% |
| S&P 500 Index | 36.35% | 15.98% | 13.38% |
| Lipper Equity Income Fund Average | 27.16% | 10.92% | 9.58% |
- Total Net Assets$483,695,327
- Number of Portfolio Holdings213
- Portfolio Turnover Rate1%
- Management Fees$4,963,427
Past performance does not guarantee future results. Call 800-GABELLI (800-422-3554) or visit www.gabelli.com/funds/open_ends for current month-end performance. The table and graph presented above do not reflect the deduction of taxes a shareholder would pay on fund distributions or the redemption of fund shares.
What did the Fund invest in?
Top 10 Holdings (% of net assets)
| Genuine Parts Co. | 4.4% |
| The Bank of New York Mellon Corp. | 4.2% |
| Deere & Co. | 2.7% |
| Microsoft Corp. | 2.4% |
| GATX Corp. | 2.4% |
| State Street Corp. | 2.2% |
| Crane Co. | 2.0% |
| Mueller Industries Inc. | 2.0% |
| Textron Inc. | 1.8% |
| Brown-Forman Corp. | 1.8% |
Portfolio Weighting (% of net assets)
| Common Stocks | 99.9% |
| Other Assets and Liabilities (Net) | 0.1% |
Industry Allocation (% of net assets)
| Industry Weighting | . |
|---|
| Food and Beverage | 15.5% |
| Financial Services | 15.3% |
| Equipment and Supplies | 7.0% |
| Diversified Industrial | 6.6% |
| Retail | 4.7% |
| Health Care | 4.6% |
| Automotive: Parts and Accessories | 4.5% |
| Telecommunications | 4.0% |
| Other Industry sectors | 37.7% |
| Other Assets and Liabilities (Net) | 0.1% |
The Gabelli Equity Income Fund
Annual Shareholder Report - September 30, 2024
Where can I find additional information about the Fund?
If you wish to view additional information about the Fund; including but not limited to financial statements or holdings, please visit www.gabelli.com/funds/open_ends.
Contact Us
Phone: 800-GABELLI (800-422-3554)
Email: info@gabelli.com
If you wish to receive a copy of this document at a new address, contact 800-GABELLI (800-422-3554)
The Gabelli Equity Income Fund
Annual Shareholder Report - September 30, 2024

This annual shareholder report contains important information about The Gabelli Equity Income Fund (the "Fund") for the period of October 1, 2023 to September 30, 2024. The Gabelli Equity Income Fund seeks to provide a high level of total return on its assets with an emphasis on income. The Fund will seek to achieve its investment objective through a combination of capital appreciation and current income by investing, under normal market conditions, at least 80% of its net assets in income producing equity securities. Income producing equity securities include, for example, common stock, preferred stock, and convertible securities. In making stock selections, Gabelli Funds, LLC, the Adviser, looks for securities that have a better yield than the average of the S&P 500 Index, as well as capital gains potential. You can find additional information about the Fund at www.gabelli.com/funds/open_ends. You can also request this information by contacting us at 800-GABELLI (800-422-3554).
What were the Fund costs for the last year?
(based on a hypothetical $10,000 investment)
| Class Name | Costs of a $10k Investment | Costs Paid as a % of a $10k Investment |
|---|
| The Gabelli Equity Income Fund - Class A | $157 | 1.43% |
How did the Fund perform?
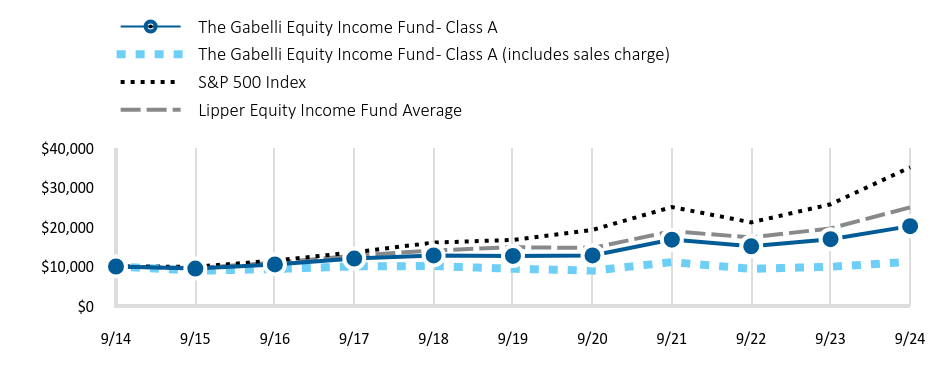
During the fiscal year ended September 30, 2024, the Gabelli Equity Income Fund underperformed its broad-based benchmark, the S&P 500 Index, as well as its comparative benchmark, the Lipper Equity Income Fund Average. Top contributors to the Fund over the year were focused in the Financials, Industrials and Information Technology sectors. Detractors to returns over the fiscal year primarily came from the Consumer Staples, Energy, and Health Care sectors.
How has the Fund performed over the past 10 years?
The performance chart of the fund class presented reflects a hypothetical $10,000 investment, assuming the maximum sales charge, compared to a broad-based securities market index and more narrowly based indices reflecting market sectors in which the Fund invests over a 10-year period. The chart uses total return NAV performance and assumes reinvestment of dividends and capital gains distribution. Fund expenses were deducted.
Total Return Based on a $10,000 Investment
| The Gabelli Equity Income Fund - Class A | The Gabelli Equity Income Fund - Class A (includes sales charge) | S&P 500 Index | Lipper Equity Income Fund Average |
|---|
| 9/14 | 10,000 | 10,000 | 10,000 | 10,000 |
| 9/15 | 9,462 | 8,918 | 9,939 | 9,576 |
| 9/16 | 10,532 | 9,356 | 11,473 | 10,975 |
| 9/17 | 11,998 | 10,045 | 13,608 | 12,720 |
| 9/18 | 12,809 | 10,108 | 16,045 | 14,048 |
| 9/19 | 12,671 | 9,423 | 16,727 | 14,873 |
| 9/20 | 12,791 | 8,965 | 19,261 | 14,693 |
| 9/21 | 16,796 | 11,096 | 25,039 | 18,907 |
| 9/22 | 15,108 | 9,407 | 21,165 | 17,360 |
| 9/23 | 16,912 | 9,925 | 25,741 | 19,634 |
| 9/24 | 20,213 | 11,181 | 35,098 | 24,967 |
Average Annual Total Returns
| 1 Year | 5 Year | 10 Year |
|---|
| The Gabelli Equity Income Fund - Class A | 19.52% | 9.80% | 7.29% |
| The Gabelli Equity Income Fund - Class A (includes sales charge) | 12.65% | 8.51% | 6.66% |
| S&P 500 Index | 36.35% | 15.98% | 13.38% |
| Lipper Equity Income Fund Average | 27.16% | 10.92% | 9.58% |
- Total Net Assets$483,695,327
- Number of Portfolio Holdings213
- Portfolio Turnover Rate1%
- Management Fees$4,963,427
Past performance does not guarantee future results. Call 800-GABELLI (800-422-3554) or visit www.gabelli.com/funds/open_ends for current month-end performance. The table and graph presented above do not reflect the deduction of taxes a shareholder would pay on fund distributions or the redemption of fund shares.
What did the Fund invest in?
Top 10 Holdings (% of net assets)
| Genuine Parts Co. | 4.4% |
| The Bank of New York Mellon Corp. | 4.2% |
| Deere & Co. | 2.7% |
| Microsoft Corp. | 2.4% |
| GATX Corp. | 2.4% |
| State Street Corp. | 2.2% |
| Crane Co. | 2.0% |
| Mueller Industries Inc. | 2.0% |
| Textron Inc. | 1.8% |
| Brown-Forman Corp. | 1.8% |
Portfolio Weighting (% of net assets)
| Common Stocks | 99.9% |
| Other Assets and Liabilities (Net) | 0.1% |
Industry Allocation (% of net assets)
| Industry Weighting | . |
|---|
| Food and Beverage | 15.5% |
| Financial Services | 15.3% |
| Equipment and Supplies | 7.0% |
| Diversified Industrial | 6.6% |
| Retail | 4.7% |
| Health Care | 4.6% |
| Automotive: Parts and Accessories | 4.5% |
| Telecommunications | 4.0% |
| Other Industry sectors | 37.7% |
| Other Assets and Liabilities (Net) | 0.1% |
The Gabelli Equity Income Fund
Annual Shareholder Report - September 30, 2024
Where can I find additional information about the Fund?
If you wish to view additional information about the Fund; including but not limited to financial statements or holdings, please visit www.gabelli.com/funds/open_ends.
Contact Us
Phone: 800-GABELLI (800-422-3554)
Email: info@gabelli.com
If you wish to receive a copy of this document at a new address, contact 800-GABELLI (800-422-3554)
The Gabelli Global Financial Services Fund
Annual Shareholder Report - September 30, 2024
This annual shareholder report contains important information about The Gabelli Global Financial Services Fund (the "Fund") for the period of October 1, 2023 to September 30, 2024. The Fund seeks to provide capital appreciation. The Fund invests primarily in the common stocks of companies engaged in financial services. The Fund seeks to purchase common stocks that are selling in the public market at a discount to their private market value (“PMV”). Gabelli Funds, LLC (the "Adviser") prefers issuers that are well managed and strongly financed. The Fund can also invest in debt securities but will usually only do so when they offer equity like returns. You can find additional information about the Fund at www.gabelli.com/funds/open_ends. You can also request this information by contacting us at 800-GABELLI (800-422-3554).
What were the Fund costs for the last year?
(based on a hypothetical $10,000 investment)
| Class Name | Costs of a $10k Investment | Costs Paid as a % of a $10k Investment |
|---|
| The Gabelli Global Financial Services Fund - Class A | $149 | 1.25% |
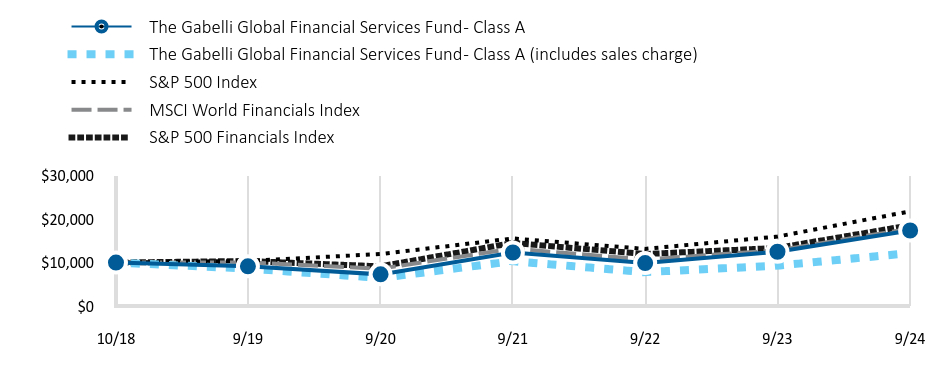
How did the Fund perform?
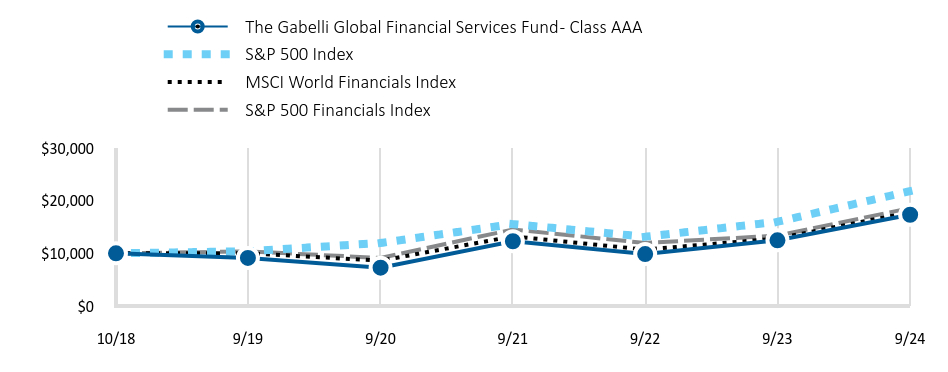
During the fiscal year ended September 30, 2024, The Gabelli Global Financial Services Fund outperformed its broad-based benchmark, the S&P 500 Index, as well as its comparative benchmarks, the MSCI World Financials and the S&P 500 Financials Indices. Most global financial services companies reported healthy financial results over the last twelve months and their outlooks improved as inflation moderated and central banks shifted from tightening to easing mode. The Fund’s European banks performed particularly well on a relative basis as their strong earnings and capital positions supported significant capital returns to shareholders.
How has the Fund performed since inception?
The performance chart of the fund class presented reflects a hypothetical $10,000 investment, assuming the maximum sales charge, compared to a broad-based securities market index and more narrowly based indices reflecting market sectors in which the Fund invests since inception. The chart uses total return NAV performance and assumes reinvestment of dividends and capital gains distribution. Fund expenses were deducted.
Total Return Based on a $10,000 Investment
| The Gabelli Global Financial Services Fund - Class A | The Gabelli Global Financial Services Fund - Class A (includes sales charge) | S&P 500 Index | MSCI World Financials Index | S&P 500 Financials Index |
|---|
| 10/18 | 10,000 | 10,000 | 10,000 | 10,000 | 10,000 |
| 9/19 | 9,129 | 8,604 | 10,387 | 10,020 | 10,356 |
| 9/20 | 7,281 | 6,468 | 11,961 | 8,598 | 9,127 |
| 9/21 | 12,310 | 10,306 | 15,549 | 13,216 | 14,523 |
| 9/22 | 9,879 | 7,796 | 13,143 | 10,706 | 11,960 |
| 9/23 | 12,491 | 9,290 | 15,985 | 12,821 | 13,363 |
| 9/24 | 17,374 | 12,178 | 21,796 | 17,794 | 18,576 |
Average Annual Total Returns
| 1 Year | 5 Year | Since Inception (10/01/2018) |
|---|
| The Gabelli Global Financial Services Fund - Class A | 39.09% | 13.74% | 9.65% |
| The Gabelli Global Financial Services Fund - Class A (includes sales charge) | 31.09% | 12.40% | 8.57% |
| S&P 500 Index | 36.35% | 15.98% | 18.38% |
| MSCI World Financials Index | 38.79% | 12.17% | 18.36% |
| S&P 500 Financials Index | 39.01% | 12.40% | 15.63% |
- Total Net Assets$44,193,120
- Number of Portfolio Holdings51
- Portfolio Turnover Rate9%
- Management Fees$196,149
Past performance does not guarantee future results. Call 800-GABELLI (800-422-3554) or visit www.gabelli.com/funds/open_ends for current month-end performance. The table and graph presented above do not reflect the deduction of taxes a shareholder would pay on fund distributions or the redemption of fund shares.
What did the Fund invest in?
Top 10 Holdings (% of net assets)
| First American Financial Corp. | 4.1% |
| First Citizens BancShares Inc. | 4.1% |
| The Bank of New York Mellon Corp. | 3.8% |
| Capital One Financial Corp. | 3.5% |
| Commerzbank AG | 3.4% |
| Axis Capital Holdings Ltd. | 3.4% |
| Cavco Industries Inc. | 3.3% |
| Jefferies Financial Group Inc. | 3.3% |
| E-L Financial Corp. Ltd. | 3.2% |
| TrustCo Bank Corp. NY | 3.1% |
Portfolio Weighting (% of net assets)
| Common Stocks | 95.9% |
| U.S. Government Obligations | 3.9% |
| Other Assets and Liabilities (Net) | 0.2% |
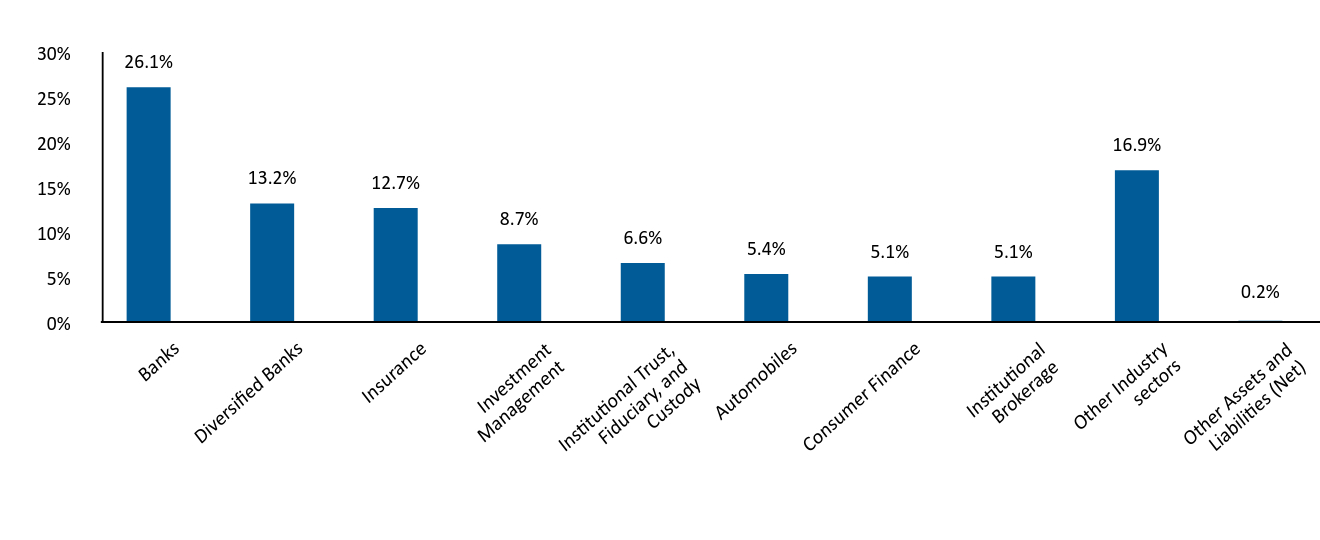
Industry Allocation (% of net assets)
| Industry Weighting | . |
|---|
| Banks | 26.1% |
| Diversified Banks | 13.2% |
| Insurance | 12.7% |
| Investment Management | 8.7% |
| Institutional Trust, Fiduciary, and Custody | 6.6% |
| Automobiles | 5.4% |
| Consumer Finance | 5.1% |
| Institutional Brokerage | 5.1% |
| Other Industry sectors | 16.9% |
| Other Assets and Liabilities (Net) | 0.2% |
The Gabelli Global Financial Services Fund
Annual Shareholder Report - September 30, 2024
Where can I find additional information about the Fund?
If you wish to view additional information about the Fund; including but not limited to financial statements or holdings, please visit www.gabelli.com/funds/open_ends.
Contact Us
Phone: 800-GABELLI (800-422-3554)
Email: info@gabelli.com
If you wish to receive a copy of this document at a new address, contact 800-GABELLI (800-422-3554)
The Gabelli Global Financial Services Fund
Annual Shareholder Report - September 30, 2024
This annual shareholder report contains important information about The Gabelli Global Financial Services Fund (the "Fund") for the period of October 1, 2023 to September 30, 2024. The Fund seeks to provide capital appreciation. The Fund invests primarily in the common stocks of companies engaged in financial services. The Fund seeks to purchase common stocks that are selling in the public market at a discount to their private market value (“PMV”). Gabelli Funds, LLC (the "Adviser") prefers issuers that are well managed and strongly financed. The Fund can also invest in debt securities but will usually only do so when they offer equity like returns. You can find additional information about the Fund at www.gabelli.com/funds/open_ends. You can also request this information by contacting us at 800-GABELLI (800-422-3554).
What were the Fund costs for the last year?
(based on a hypothetical $10,000 investment)
| Class Name | Costs of a $10k Investment | Costs Paid as a % of a $10k Investment |
|---|
| The Gabelli Global Financial Services Fund - Class C | $238 | 2.00% |
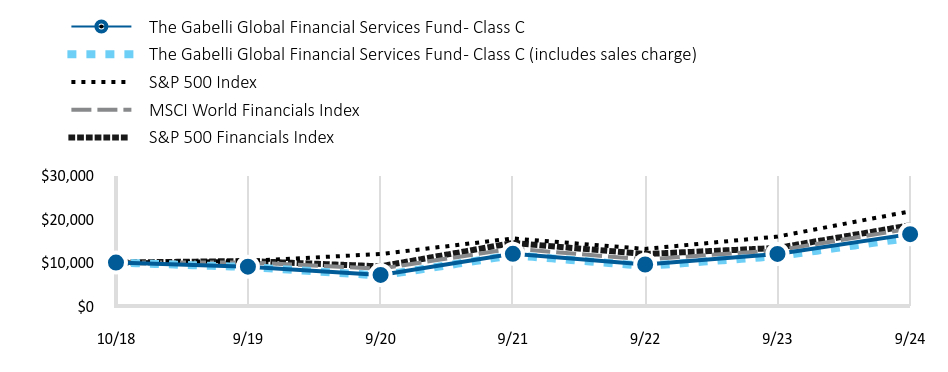
How did the Fund perform?
During the fiscal year ended September 30, 2024, The Gabelli Global Financial Services Fund outperformed its broad-based benchmark, the S&P 500 Index, as well as its comparative benchmarks, the MSCI World Financials and the S&P 500 Financials Indices. Most global financial services companies reported healthy financial results over the last twelve months and their outlooks improved as inflation moderated and central banks shifted from tightening to easing mode. The Fund’s European banks performed particularly well on a relative basis as their strong earnings and capital positions supported significant capital returns to shareholders.
How has the Fund performed since inception?
The performance chart of the fund class presented reflects a hypothetical $10,000 investment, assuming the maximum sales charge, compared to a broad-based securities market index and more narrowly based indices reflecting market sectors in which the Fund invests since inception. The chart uses total return NAV performance and assumes reinvestment of dividends and capital gains distribution. Fund expenses were deducted.
Total Return Based on a $10,000 Investment
| The Gabelli Global Financial Services Fund - Class C | The Gabelli Global Financial Services Fund - Class C (includes sales charge) | S&P 500 Index | MSCI World Financials Index | S&P 500 Financials Index |
|---|
| 10/18 | 10,000 | 10,000 | 10,000 | 10,000 | 10,000 |
| 9/19 | 9,061 | 8,971 | 10,387 | 10,020 | 10,356 |
| 9/20 | 7,161 | 7,019 | 11,961 | 8,598 | 9,127 |
| 9/21 | 12,001 | 11,693 | 15,549 | 13,216 | 14,523 |
| 9/22 | 9,559 | 9,220 | 13,143 | 10,706 | 11,960 |
| 9/23 | 11,994 | 11,477 | 15,985 | 12,821 | 13,363 |
| 9/24 | 16,544 | 15,715 | 21,796 | 17,794 | 18,576 |
Average Annual Total Returns
| 1 Year | 5 Year | Since Inception (10/01/2018) |
|---|
| The Gabelli Global Financial Services Fund - Class C | 37.93% | 12.80% | 8.76% |
| The Gabelli Global Financial Services Fund - Class C (includes sales charge) | 36.93% | 12.80% | 8.76% |
| S&P 500 Index | 36.35% | 15.98% | 18.38% |
| MSCI World Financials Index | 38.79% | 12.17% | 18.36% |
| S&P 500 Financials Index | 39.01% | 12.40% | 15.63% |
- Total Net Assets$44,193,120
- Number of Portfolio Holdings51
- Portfolio Turnover Rate9%
- Management Fees$196,149
Past performance does not guarantee future results. Call 800-GABELLI (800-422-3554) or visit www.gabelli.com/funds/open_ends for current month-end performance. The table and graph presented above do not reflect the deduction of taxes a shareholder would pay on fund distributions or the redemption of fund shares.
What did the Fund invest in?
Top 10 Holdings (% of net assets)
| First American Financial Corp. | 4.1% |
| First Citizens BancShares Inc. | 4.1% |
| The Bank of New York Mellon Corp. | 3.8% |
| Capital One Financial Corp. | 3.5% |
| Commerzbank AG | 3.4% |
| Axis Capital Holdings Ltd. | 3.4% |
| Cavco Industries Inc. | 3.3% |
| Jefferies Financial Group Inc. | 3.3% |
| E-L Financial Corp. Ltd. | 3.2% |
| TrustCo Bank Corp. NY | 3.1% |
Portfolio Weighting (% of net assets)
| Common Stocks | 95.9% |
| U.S. Government Obligations | 3.9% |
| Other Assets and Liabilities (Net) | 0.2% |
Industry Allocation (% of net assets)
| Industry Weighting | . |
|---|
| Banks | 26.1% |
| Diversified Banks | 13.2% |
| Insurance | 12.7% |
| Investment Management | 8.7% |
| Institutional Trust, Fiduciary, and Custody | 6.6% |
| Automobiles | 5.4% |
| Consumer Finance | 5.1% |
| Institutional Brokerage | 5.1% |
| Other Industry sectors | 16.9% |
| Other Assets and Liabilities (Net) | 0.2% |
The Gabelli Global Financial Services Fund
Annual Shareholder Report - September 30, 2024
Where can I find additional information about the Fund?
If you wish to view additional information about the Fund; including but not limited to financial statements or holdings, please visit www.gabelli.com/funds/open_ends.
Contact Us
Phone: 800-GABELLI (800-422-3554)
Email: info@gabelli.com
If you wish to receive a copy of this document at a new address, contact 800-GABELLI (800-422-3554)
The Gabelli Global Financial Services Fund
Annual Shareholder Report - September 30, 2024
This annual shareholder report contains important information about The Gabelli Global Financial Services Fund (the "Fund") for the period of October 1, 2023 to September 30, 2024. The Fund seeks to provide capital appreciation. The Fund invests primarily in the common stocks of companies engaged in financial services. The Fund seeks to purchase common stocks that are selling in the public market at a discount to their private market value (“PMV”). Gabelli Funds, LLC (the "Adviser") prefers issuers that are well managed and strongly financed. The Fund can also invest in debt securities but will usually only do so when they offer equity like returns. You can find additional information about the Fund at www.gabelli.com/funds/open_ends. You can also request this information by contacting us at 800-GABELLI (800-422-3554).
What were the Fund costs for the last year?
(based on a hypothetical $10,000 investment)
| Class Name | Costs of a $10k Investment | Costs Paid as a % of a $10k Investment |
|---|
| The Gabelli Global Financial Services Fund - Class I | $120 | 1.00% |
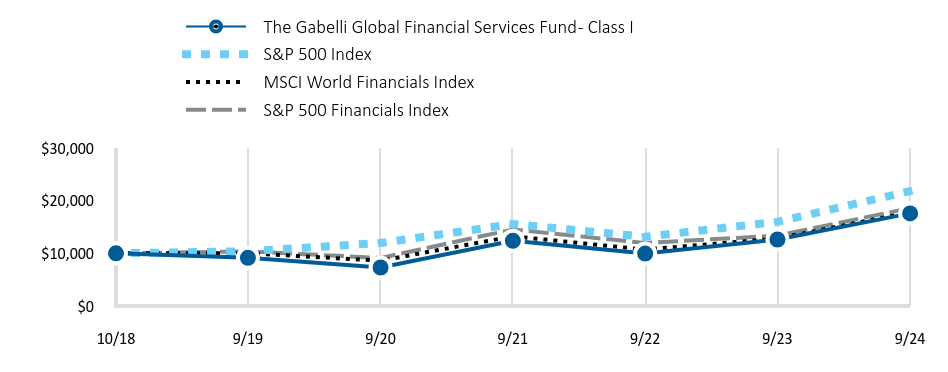
How did the Fund perform?
During the fiscal year ended September 30, 2024, The Gabelli Global Financial Services Fund outperformed its broad-based benchmark, the S&P 500 Index, as well as its comparative benchmarks, the MSCI World Financials and the S&P 500 Financials Indices. Most global financial services companies reported healthy financial results over the last twelve months and their outlooks improved as inflation moderated and central banks shifted from tightening to easing mode. The Fund’s European banks performed particularly well on a relative basis as their strong earnings and capital positions supported significant capital returns to shareholders.
How has the Fund performed since inception?
The performance chart of the fund class presented reflects a hypothetical $10,000 investment, assuming the maximum sales charge, compared to a broad-based securities market index and more narrowly based indices reflecting market sectors in which the Fund invests since inception. The chart uses total return NAV performance and assumes reinvestment of dividends and capital gains distribution. Fund expenses were deducted.
Total Return Based on a $10,000 Investment
| The Gabelli Global Financial Services Fund - Class I | S&P 500 Index | MSCI World Financials Index | S&P 500 Financials Index |
|---|
| 10/18 | 10,000 | 10,000 | 10,000 | 10,000 |
| 9/19 | 9,149 | 10,387 | 10,020 | 10,356 |
| 9/20 | 7,304 | 11,961 | 8,598 | 9,127 |
| 9/21 | 12,376 | 15,549 | 13,216 | 14,523 |
| 9/22 | 9,954 | 13,143 | 10,706 | 11,960 |
| 9/23 | 12,624 | 15,985 | 12,821 | 13,363 |
| 9/24 | 17,579 | 21,796 | 17,794 | 18,576 |
Average Annual Total Returns
| 1 Year | 5 Year | Since Inception (10/01/2018) |
|---|
| The Gabelli Global Financial Services Fund - Class I | 39.25% | 13.95% | 9.86% |
| S&P 500 Index | 36.35% | 15.98% | 18.38% |
| MSCI World Financials Index | 38.79% | 12.17% | 18.36% |
| S&P 500 Financials Index | 39.01% | 12.40% | 15.63% |
- Total Net Assets$44,193,120
- Number of Portfolio Holdings51
- Portfolio Turnover Rate9%
- Management Fees$196,149
Past performance does not guarantee future results. Call 800-GABELLI (800-422-3554) or visit www.gabelli.com/funds/open_ends for current month-end performance. The table and graph presented above do not reflect the deduction of taxes a shareholder would pay on fund distributions or the redemption of fund shares.
What did the Fund invest in?
Top 10 Holdings (% of net assets)
| First American Financial Corp. | 4.1% |
| First Citizens BancShares Inc. | 4.1% |
| The Bank of New York Mellon Corp. | 3.8% |
| Capital One Financial Corp. | 3.5% |
| Commerzbank AG | 3.4% |
| Axis Capital Holdings Ltd. | 3.4% |
| Cavco Industries Inc. | 3.3% |
| Jefferies Financial Group Inc. | 3.3% |
| E-L Financial Corp. Ltd. | 3.2% |
| TrustCo Bank Corp. NY | 3.1% |
Portfolio Weighting (% of net assets)
| Common Stocks | 95.9% |
| U.S. Government Obligations | 3.9% |
| Other Assets and Liabilities (Net) | 0.2% |
Industry Allocation (% of net assets)
| Industry Weighting | . |
|---|
| Banks | 26.1% |
| Diversified Banks | 13.2% |
| Insurance | 12.7% |
| Investment Management | 8.7% |
| Institutional Trust, Fiduciary, and Custody | 6.6% |
| Automobiles | 5.4% |
| Consumer Finance | 5.1% |
| Institutional Brokerage | 5.1% |
| Other Industry sectors | 16.9% |
| Other Assets and Liabilities (Net) | 0.2% |
The Gabelli Global Financial Services Fund
Annual Shareholder Report - September 30, 2024
Where can I find additional information about the Fund?
If you wish to view additional information about the Fund; including but not limited to financial statements or holdings, please visit www.gabelli.com/funds/open_ends.
Contact Us
Phone: 800-GABELLI (800-422-3554)
Email: info@gabelli.com
If you wish to receive a copy of this document at a new address, contact 800-GABELLI (800-422-3554)
The Gabelli Global Financial Services Fund
Annual Shareholder Report - September 30, 2024
This annual shareholder report contains important information about The Gabelli Global Financial Services Fund (the "Fund") for the period of October 1, 2023 to September 30, 2024. The Fund seeks to provide capital appreciation. The Fund invests primarily in the common stocks of companies engaged in financial services. The Fund seeks to purchase common stocks that are selling in the public market at a discount to their private market value (“PMV”). Gabelli Funds, LLC (the "Adviser") prefers issuers that are well managed and strongly financed. The Fund can also invest in debt securities but will usually only do so when they offer equity like returns. You can find additional information about the Fund at www.gabelli.com/funds/open_ends. You can also request this information by contacting us at 800-GABELLI (800-422-3554).
What were the Fund costs for the last year?
(based on a hypothetical $10,000 investment)
| Class Name | Costs of a $10k Investment | Costs Paid as a % of a $10k Investment |
|---|
| The Gabelli Global Financial Services Fund - Class AAA | $149 | 1.25% |
How did the Fund perform?
During the fiscal year ended September 30, 2024, The Gabelli Global Financial Services Fund outperformed its broad-based benchmark, the S&P 500 Index, as well as its comparative benchmarks, the MSCI World Financials and the S&P 500 Financials Indices. Most global financial services companies reported healthy financial results over the last twelve months and their outlooks improved as inflation moderated and central banks shifted from tightening to easing mode. The Fund’s European banks performed particularly well on a relative basis as their strong earnings and capital positions supported significant capital returns to shareholders.
How has the Fund performed since inception?
The performance chart of the fund class presented reflects a hypothetical $10,000 investment, assuming the maximum sales charge, compared to a broad-based securities market index and more narrowly based indices reflecting market sectors in which the Fund invests since inception. The chart uses total return NAV performance and assumes reinvestment of dividends and capital gains distribution. Fund expenses were deducted.
Total Return Based on a $10,000 Investment
| The Gabelli Global Financial Services Fund - Class AAA | S&P 500 Index | MSCI World Financials Index | S&P 500 Financials Index |
|---|
| 10/18 | 10,000 | 10,000 | 10,000 | 10,000 |
| 9/19 | 9,124 | 10,387 | 10,020 | 10,356 |
| 9/20 | 7,269 | 11,961 | 8,598 | 9,127 |
| 9/21 | 12,288 | 15,549 | 13,216 | 14,523 |
| 9/22 | 9,856 | 13,143 | 10,706 | 11,960 |
| 9/23 | 12,465 | 15,985 | 12,821 | 13,363 |
| 9/24 | 17,320 | 21,796 | 17,794 | 18,576 |
Average Annual Total Returns
| 1 Year | 5 Year | Since Inception (10/01/2018) |
|---|
| The Gabelli Global Financial Services Fund - Class AAA | 38.95% | 13.68% | 9.59% |
| S&P 500 Index | 36.35% | 15.98% | 18.38% |
| MSCI World Financials Index | 38.79% | 12.17% | 18.36% |
| S&P 500 Financials Index | 39.01% | 12.40% | 15.63% |
- Total Net Assets$44,193,120
- Number of Portfolio Holdings51
- Portfolio Turnover Rate9%
- Management Fees$196,149
Past performance does not guarantee future results. Call 800-GABELLI (800-422-3554) or visit www.gabelli.com/funds/open_ends for current month-end performance. The table and graph presented above do not reflect the deduction of taxes a shareholder would pay on fund distributions or the redemption of fund shares.
What did the Fund invest in?
Top 10 Holdings (% of net assets)
| First American Financial Corp. | 4.1% |
| First Citizens BancShares Inc. | 4.1% |
| The Bank of New York Mellon Corp. | 3.8% |
| Capital One Financial Corp. | 3.5% |
| Commerzbank AG | 3.4% |
| Axis Capital Holdings Ltd. | 3.4% |
| Cavco Industries Inc. | 3.3% |
| Jefferies Financial Group Inc. | 3.3% |
| E-L Financial Corp. Ltd. | 3.2% |
| TrustCo Bank Corp. NY | 3.1% |
Portfolio Weighting (% of net assets)
| Common Stocks | 95.9% |
| U.S. Government Obligations | 3.9% |
| Other Assets and Liabilities (Net) | 0.2% |
Industry Allocation (% of net assets)
| Industry Weighting | . |
|---|
| Banks | 26.1% |
| Diversified Banks | 13.2% |
| Insurance | 12.7% |
| Investment Management | 8.7% |
| Institutional Trust, Fiduciary, and Custody | 6.6% |
| Automobiles | 5.4% |
| Consumer Finance | 5.1% |
| Institutional Brokerage | 5.1% |
| Other Industry sectors | 16.9% |
| Other Assets and Liabilities (Net) | 0.2% |
The Gabelli Global Financial Services Fund
Annual Shareholder Report - September 30, 2024
Where can I find additional information about the Fund?
If you wish to view additional information about the Fund; including but not limited to financial statements or holdings, please visit www.gabelli.com/funds/open_ends.
Contact Us
Phone: 800-GABELLI (800-422-3554)
Email: info@gabelli.com
If you wish to receive a copy of this document at a new address, contact 800-GABELLI (800-422-3554)
The Gabelli Focused Growth and Income Fund
Annual Shareholder Report - September 30, 2024
This annual shareholder report contains important information about The Gabelli Focused Growth and Income Fund (the "Fund") for the period of October 1, 2023 to September 30, 2024. The Gabelli Focused Growth and Income Fund is a concentrated, actively managed strategy. The Fund invests in a global portfolio of common and preferred equities, REITs, bonds, and other securities that have the potential for capital appreciation while emphasizing a high level of current net investment income. You can find additional information about the Fund at www.gabelli.com/funds/open_ends. You can also request this information by contacting us at 800-GABELLI (800-422-3554).
What were the Fund costs for the last year?
(based on a hypothetical $10,000 investment)
| Class Name | Costs of a $10k Investment | Costs Paid as a % of a $10k Investment |
|---|
| The Gabelli Focused Growth and Income Fund - Class AAA | $182 | 1.64% |
How did the Fund perform?
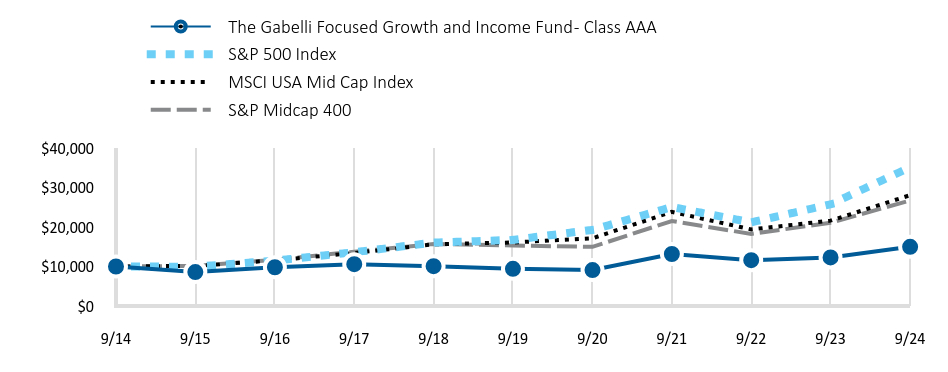
The Gabelli Focused Growth and Income Fund is a concentrated strategy emphasizing capital appreciation and current income. During the fiscal year ended September 30, 2024, the Fund underperformed its broad based index, the S&P 500 Index, and its comparative indices. 40% of the S&P’s gain can be attributed to the Magnificent 7, while income producing securities only recently began to benefit from a lower interest rate environment. The Fund is supported by a portfolio yield of approximately 7.4%. Contributors over the year included AT&T and Apollo Global Management. Detractors included New Fortress Energy and New York Community Bancorp.
How has the Fund performed over the past 10 years?
The performance chart of the fund class presented reflects a hypothetical $10,000 investment, assuming the maximum sales charge, compared to a broad-based securities market index and more narrowly based indices reflecting market sectors in which the Fund invests over a 10-year period. The chart uses total return NAV performance and assumes reinvestment of dividends and capital gains distribution. Fund expenses were deducted.
Total Return Based on a $10,000 Investment
| The Gabelli Focused Growth and Income Fund - Class AAA | S&P 500 Index | MSCI USA Mid Cap Index | S&P Midcap 400 |
|---|
| 9/14 | 10,000 | 10,000 | 10,000 | 10,000 |
| 9/15 | 8,589 | 9,939 | 10,149 | 10,140 |
| 9/16 | 9,806 | 11,473 | 11,565 | 11,694 |
| 9/17 | 10,579 | 13,608 | 13,405 | 13,743 |
| 9/18 | 10,073 | 16,045 | 15,623 | 15,696 |
| 9/19 | 9,418 | 16,727 | 16,073 | 15,305 |
| 9/20 | 9,091 | 19,261 | 17,142 | 14,975 |
| 9/21 | 13,160 | 25,039 | 23,824 | 21,516 |
| 9/22 | 11,600 | 21,165 | 19,381 | 18,235 |
| 9/23 | 12,286 | 25,741 | 21,600 | 21,063 |
| 9/24 | 14,974 | 35,098 | 28,050 | 26,706 |
Average Annual Total Returns
| 1 Year | 5 Year | 10 Year |
|---|
| The Gabelli Focused Growth and Income Fund - Class AAA | 21.88% | 9.72% | 4.12% |
| S&P 500 Index | 36.35% | 15.98% | 13.38% |
| MSCI USA Mid Cap Index | 29.86% | 11.78% | 10.86% |
| S&P Midcap 400 | 26.79% | 11.78% | 10.32% |
- Total Net Assets$46,353,006
- Number of Portfolio Holdings36
- Portfolio Turnover Rate31%
- Management Fees$262,285
Past performance does not guarantee future results. Call 800-GABELLI (800-422-3554) or visit www.gabelli.com/funds/open_ends for current month-end performance. The table and graph presented above do not reflect the deduction of taxes a shareholder would pay on fund distributions or the redemption of fund shares.
What did the Fund invest in?
Top 10 Holdings (% of net assets)
| VICI Properties Inc. | 8.7% |
| AT&T Inc. | 7.3% |
| Enterprise Products Partners LP | 7.1% |
| Qurate Retail Inc. | 6.8% |
| Blackstone Mortgage Trust Inc. | 6.8% |
| NextEra Energy Partners LP | 6.6% |
| Energy Transfer LP | 6.2% |
| Franklin BSP Realty Trust Inc. | 5.3% |
| Apollo Global Management Inc. | 5.0% |
| Kinder Morgan Inc. | 4.3% |
Portfolio Weighting (% of net assets)
| Common Stocks | 84.7% |
| Preferred Stocks | 11.1% |
| U.S. Government Obligations | 2.4% |
| Other Assets and Liabilities (Net) | 1.8% |
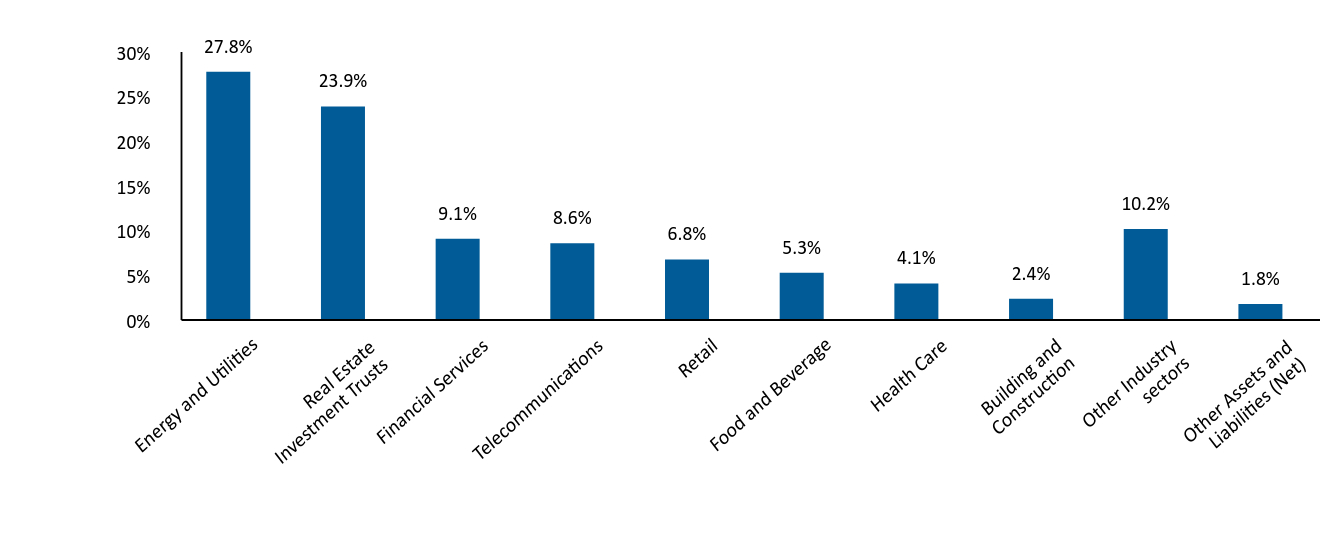
Industry Allocation (% of net assets)
| Industry Weighting | . |
|---|
| Energy and Utilities | 27.8% |
| Real Estate Investment Trusts | 23.9% |
| Financial Services | 9.1% |
| Telecommunications | 8.6% |
| Retail | 6.8% |
| Food and Beverage | 5.3% |
| Health Care | 4.1% |
| Building and Construction | 2.4% |
| Other Industry sectors | 10.2% |
| Other Assets and Liabilities (Net) | 1.8% |
The Gabelli Focused Growth and Income Fund
Annual Shareholder Report - September 30, 2024
Where can I find additional information about the Fund?
If you wish to view additional information about the Fund; including but not limited to financial statements or holdings, please visit www.gabelli.com/funds/open_ends.
Contact Us
Phone: 800-GABELLI (800-422-3554)
Email: info@gabelli.com
If you wish to receive a copy of this document at a new address, contact 800-GABELLI (800-422-3554)
The Gabelli Focused Growth and Income Fund
Annual Shareholder Report - September 30, 2024
This annual shareholder report contains important information about The Gabelli Focused Growth and Income Fund (the "Fund") for the period of October 1, 2023 to September 30, 2024. The Gabelli Focused Growth and Income Fund is a concentrated, actively managed strategy. The Fund invests in a global portfolio of common and preferred equities, REITs, bonds, and other securities that have the potential for capital appreciation while emphasizing a high level of current net investment income. You can find additional information about the Fund at www.gabelli.com/funds/open_ends. You can also request this information by contacting us at 800-GABELLI (800-422-3554).
What were the Fund costs for the last year?
(based on a hypothetical $10,000 investment)
| Class Name | Costs of a $10k Investment | Costs Paid as a % of a $10k Investment |
|---|
| The Gabelli Focused Growth and Income Fund - Class C | $264 | 2.39% |
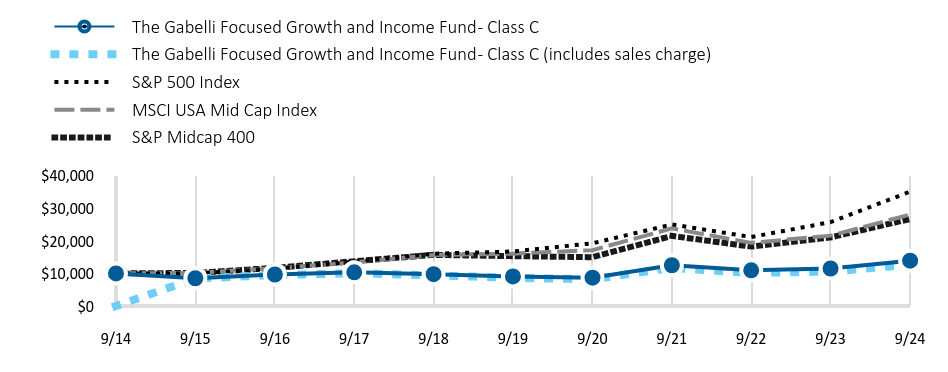
How did the Fund perform?
The Gabelli Focused Growth and Income Fund is a concentrated strategy emphasizing capital appreciation and current income. During the fiscal year ended September 30, 2024, the Fund underperformed its broad based index, the S&P 500 Index, and its comparative indices. 40% of the S&P’s gain can be attributed to the Magnificent 7, while income producing securities only recently began to benefit from a lower interest rate environment. The Fund is supported by a portfolio yield of approximately 7.4%. Contributors over the year included AT&T and Apollo Global Management. Detractors included New Fortress Energy and New York Community Bancorp.
How has the Fund performed over the past 10 years?
The performance chart of the fund class presented reflects a hypothetical $10,000 investment, assuming the maximum sales charge, compared to a broad-based securities market index and more narrowly based indices reflecting market sectors in which the Fund invests over a 10-year period. The chart uses total return NAV performance and assumes reinvestment of dividends and capital gains distribution. Fund expenses were deducted.
Total Return Based on a $10,000 Investment
| The Gabelli Focused Growth and Income Fund - Class C | The Gabelli Focused Growth and Income Fund - Class C (includes sales charge) | S&P 500 Index | MSCI USA Mid Cap Index | S&P Midcap 400 |
|---|
| 9/14 | 10,000 | 0 | 10,000 | 10,000 | 10,000 |
| 9/15 | 8,526 | 8,440 | 9,939 | 10,149 | 10,140 |
| 9/16 | 9,664 | 9,482 | 11,473 | 11,565 | 11,694 |
| 9/17 | 10,345 | 10,055 | 13,608 | 13,405 | 13,743 |
| 9/18 | 9,778 | 9,409 | 16,045 | 15,623 | 15,696 |
| 9/19 | 9,076 | 8,646 | 16,727 | 16,073 | 15,305 |
| 9/20 | 8,700 | 8,205 | 19,261 | 17,142 | 14,975 |
| 9/21 | 12,506 | 11,712 | 25,039 | 23,824 | 21,516 |
| 9/22 | 10,938 | 10,141 | 21,165 | 19,381 | 18,235 |
| 9/23 | 11,503 | 10,564 | 25,741 | 21,600 | 21,063 |
| 9/24 | 13,917 | 12,675 | 35,098 | 28,050 | 26,706 |
Average Annual Total Returns
| 1 Year | 5 Year | 10 Year |
|---|
| The Gabelli Focused Growth and Income Fund - Class C | 20.98% | 8.93% | 3.36% |
| The Gabelli Focused Growth and Income Fund - Class C (includes sales charge) | 19.98% | 8.93% | 3.36% |
| S&P 500 Index | 36.35% | 15.98% | 13.38% |
| MSCI USA Mid Cap Index | 29.86% | 11.78% | 10.86% |
| S&P Midcap 400 | 26.79% | 11.78% | 10.32% |
- Total Net Assets$46,353,006
- Number of Portfolio Holdings36
- Portfolio Turnover Rate31%
- Management Fees$262,285
Past performance does not guarantee future results. Call 800-GABELLI (800-422-3554) or visit www.gabelli.com/funds/open_ends for current month-end performance. The table and graph presented above do not reflect the deduction of taxes a shareholder would pay on fund distributions or the redemption of fund shares.
What did the Fund invest in?
Top 10 Holdings (% of net assets)
| VICI Properties Inc. | 8.7% |
| AT&T Inc. | 7.3% |
| Enterprise Products Partners LP | 7.1% |
| Qurate Retail Inc. | 6.8% |
| Blackstone Mortgage Trust Inc. | 6.8% |
| NextEra Energy Partners LP | 6.6% |
| Energy Transfer LP | 6.2% |
| Franklin BSP Realty Trust Inc. | 5.3% |
| Apollo Global Management Inc. | 5.0% |
| Kinder Morgan Inc. | 4.3% |
Portfolio Weighting (% of net assets)
| Common Stocks | 84.7% |
| Preferred Stocks | 11.1% |
| U.S. Government Obligations | 2.4% |
| Other Assets and Liabilities (Net) | 1.8% |
Industry Allocation (% of net assets)
| Industry Weighting | . |
|---|
| Energy and Utilities | 27.8% |
| Real Estate Investment Trusts | 23.9% |
| Financial Services | 9.1% |
| Telecommunications | 8.6% |
| Retail | 6.8% |
| Food and Beverage | 5.3% |
| Health Care | 4.1% |
| Building and Construction | 2.4% |
| Other Industry sectors | 10.2% |
| Other Assets and Liabilities (Net) | 1.8% |
The Gabelli Focused Growth and Income Fund
Annual Shareholder Report - September 30, 2024
Where can I find additional information about the Fund?
If you wish to view additional information about the Fund; including but not limited to financial statements or holdings, please visit www.gabelli.com/funds/open_ends.
Contact Us
Phone: 800-GABELLI (800-422-3554)
Email: info@gabelli.com
If you wish to receive a copy of this document at a new address, contact 800-GABELLI (800-422-3554)
The Gabelli Focused Growth and Income Fund
Annual Shareholder Report - September 30, 2024
This annual shareholder report contains important information about The Gabelli Focused Growth and Income Fund (the "Fund") for the period of October 1, 2023 to September 30, 2024. The Gabelli Focused Growth and Income Fund is a concentrated, actively managed strategy. The Fund invests in a global portfolio of common and preferred equities, REITs, bonds, and other securities that have the potential for capital appreciation while emphasizing a high level of current net investment income. You can find additional information about the Fund at www.gabelli.com/funds/open_ends. You can also request this information by contacting us at 800-GABELLI (800-422-3554).
What were the Fund costs for the last year?
(based on a hypothetical $10,000 investment)
| Class Name | Costs of a $10k Investment | Costs Paid as a % of a $10k Investment |
|---|
| The Gabelli Focused Growth and Income Fund - Class I | $89 | 0.80% |
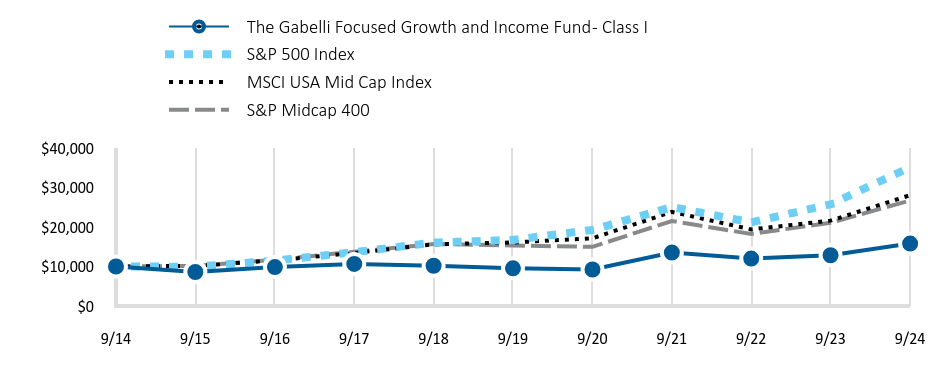
How did the Fund perform?
The Gabelli Focused Growth and Income Fund is a concentrated strategy emphasizing capital appreciation and current income. During the fiscal year ended September 30, 2024, the Fund underperformed its broad based index, the S&P 500 Index, and its comparative indices. 40% of the S&P’s gain can be attributed to the Magnificent 7, while income producing securities only recently began to benefit from a lower interest rate environment. The Fund is supported by a portfolio yield of approximately 7.4%. Contributors over the year included AT&T and Apollo Global Management. Detractors included New Fortress Energy and New York Community Bancorp.
How has the Fund performed over the past 10 years?
The performance chart of the fund class presented reflects a hypothetical $10,000 investment, assuming the maximum sales charge, compared to a broad-based securities market index and more narrowly based indices reflecting market sectors in which the Fund invests over a 10-year period. The chart uses total return NAV performance and assumes reinvestment of dividends and capital gains distribution. Fund expenses were deducted.
Total Return Based on a $10,000 Investment
| The Gabelli Focused Growth and Income Fund - Class I | S&P 500 Index | MSCI USA Mid Cap Index | S&P Midcap 400 |
|---|
| 9/14 | 10,000 | 10,000 | 10,000 | 10,000 |
| 9/15 | 8,610 | 9,939 | 10,149 | 10,140 |
| 9/16 | 9,859 | 11,473 | 11,565 | 11,694 |
| 9/17 | 10,659 | 13,608 | 13,405 | 13,743 |
| 9/18 | 10,179 | 16,045 | 15,623 | 15,696 |
| 9/19 | 9,538 | 16,727 | 16,073 | 15,305 |
| 9/20 | 9,238 | 19,261 | 17,142 | 14,975 |
| 9/21 | 13,508 | 25,039 | 23,824 | 21,516 |
| 9/22 | 12,012 | 21,165 | 19,381 | 18,235 |
| 9/23 | 12,850 | 25,741 | 21,600 | 21,063 |
| 9/24 | 15,792 | 35,098 | 28,050 | 26,706 |
Average Annual Total Returns
| 1 Year | 5 Year | 10 Year |
|---|
| The Gabelli Focused Growth and Income Fund - Class I | 22.90% | 10.61% | 4.67% |
| S&P 500 Index | 36.35% | 15.98% | 13.38% |
| MSCI USA Mid Cap Index | 29.86% | 11.78% | 10.86% |
| S&P Midcap 400 | 26.79% | 11.78% | 10.32% |
- Total Net Assets$46,353,006
- Number of Portfolio Holdings36
- Portfolio Turnover Rate31%
- Management Fees$262,285
Past performance does not guarantee future results. Call 800-GABELLI (800-422-3554) or visit www.gabelli.com/funds/open_ends for current month-end performance. The table and graph presented above do not reflect the deduction of taxes a shareholder would pay on fund distributions or the redemption of fund shares.
What did the Fund invest in?
Top 10 Holdings (% of net assets)
| VICI Properties Inc. | 8.7% |
| AT&T Inc. | 7.3% |
| Enterprise Products Partners LP | 7.1% |
| Qurate Retail Inc. | 6.8% |
| Blackstone Mortgage Trust Inc. | 6.8% |
| NextEra Energy Partners LP | 6.6% |
| Energy Transfer LP | 6.2% |
| Franklin BSP Realty Trust Inc. | 5.3% |
| Apollo Global Management Inc. | 5.0% |
| Kinder Morgan Inc. | 4.3% |
Portfolio Weighting (% of net assets)
| Common Stocks | 84.7% |
| Preferred Stocks | 11.1% |
| U.S. Government Obligations | 2.4% |
| Other Assets and Liabilities (Net) | 1.8% |
Industry Allocation (% of net assets)
| Industry Weighting | . |
|---|
| Energy and Utilities | 27.8% |
| Real Estate Investment Trusts | 23.9% |
| Financial Services | 9.1% |
| Telecommunications | 8.6% |
| Retail | 6.8% |
| Food and Beverage | 5.3% |
| Health Care | 4.1% |
| Building and Construction | 2.4% |
| Other Industry sectors | 10.2% |
| Other Assets and Liabilities (Net) | 1.8% |
The Gabelli Focused Growth and Income Fund
Annual Shareholder Report - September 30, 2024
Where can I find additional information about the Fund?
If you wish to view additional information about the Fund; including but not limited to financial statements or holdings, please visit www.gabelli.com/funds/open_ends.
Contact Us
Phone: 800-GABELLI (800-422-3554)
Email: info@gabelli.com
If you wish to receive a copy of this document at a new address, contact 800-GABELLI (800-422-3554)
The Gabelli Focused Growth and Income Fund
Annual Shareholder Report - September 30, 2024
This annual shareholder report contains important information about The Gabelli Focused Growth and Income Fund (the "Fund") for the period of October 1, 2023 to September 30, 2024. The Gabelli Focused Growth and Income Fund is a concentrated, actively managed strategy. The Fund invests in a global portfolio of common and preferred equities, REITs, bonds, and other securities that have the potential for capital appreciation while emphasizing a high level of current net investment income. You can find additional information about the Fund at www.gabelli.com/funds/open_ends. You can also request this information by contacting us at 800-GABELLI (800-422-3554).
What were the Fund costs for the last year?
(based on a hypothetical $10,000 investment)
| Class Name | Costs of a $10k Investment | Costs Paid as a % of a $10k Investment |
|---|
| The Gabelli Focused Growth and Income Fund - Class A | $139 | 1.25% |
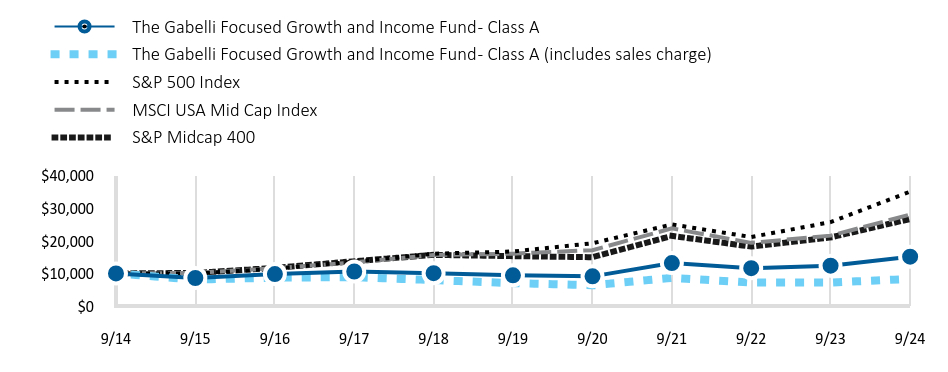
How did the Fund perform?
The Gabelli Focused Growth and Income Fund is a concentrated strategy emphasizing capital appreciation and current income. During the fiscal year ended September 30, 2024, the Fund underperformed its broad based index, the S&P 500 Index, and its comparative indices. 40% of the S&P’s gain can be attributed to the Magnificent 7, while income producing securities only recently began to benefit from a lower interest rate environment. The Fund is supported by a portfolio yield of approximately 7.4%. Contributors over the year included AT&T and Apollo Global Management. Detractors included New Fortress Energy and New York Community Bancorp.
How has the Fund performed over the past 10 years?
The performance chart of the fund class presented reflects a hypothetical $10,000 investment, assuming the maximum sales charge, compared to a broad-based securities market index and more narrowly based indices reflecting market sectors in which the Fund invests over a 10-year period. The chart uses total return NAV performance and assumes reinvestment of dividends and capital gains distribution. Fund expenses were deducted.
Total Return Based on a $10,000 Investment
| The Gabelli Focused Growth and Income Fund - Class A | The Gabelli Focused Growth and Income Fund - Class A (includes sales charge) | S&P 500 Index | MSCI USA Mid Cap Index | S&P Midcap 400 |
|---|
| 9/14 | 10,000 | 10,000 | 10,000 | 10,000 | 10,000 |
| 9/15 | 8,589 | 8,095 | 9,939 | 10,149 | 10,140 |
| 9/16 | 9,808 | 8,713 | 11,473 | 11,565 | 11,694 |
| 9/17 | 10,580 | 8,858 | 13,608 | 13,405 | 13,743 |
| 9/18 | 10,072 | 7,948 | 16,045 | 15,623 | 15,696 |
| 9/19 | 9,416 | 7,004 | 16,727 | 16,073 | 15,305 |
| 9/20 | 9,099 | 6,379 | 19,261 | 17,142 | 14,975 |
| 9/21 | 13,177 | 8,643 | 25,039 | 23,824 | 21,516 |
| 9/22 | 11,612 | 7,178 | 21,165 | 19,381 | 18,235 |
| 9/23 | 12,370 | 7,207 | 25,741 | 21,600 | 21,063 |
| 9/24 | 15,133 | 8,310 | 35,098 | 28,050 | 26,706 |
Average Annual Total Returns
| 1 Year | 5 Year | 10 Year |
|---|
| The Gabelli Focused Growth and Income Fund - Class A | 22.34% | 9.96% | 4.24% |
| The Gabelli Focused Growth and Income Fund - Class A (includes sales charge) | 15.31% | 8.67% | 3.62% |
| S&P 500 Index | 36.35% | 15.98% | 13.38% |
| MSCI USA Mid Cap Index | 29.86% | 11.78% | 10.86% |
| S&P Midcap 400 | 26.79% | 11.78% | 10.32% |
- Total Net Assets$46,353,006
- Number of Portfolio Holdings36
- Portfolio Turnover Rate31%
- Management Fees$262,285
Past performance does not guarantee future results. Call 800-GABELLI (800-422-3554) or visit www.gabelli.com/funds/open_ends for current month-end performance. The table and graph presented above do not reflect the deduction of taxes a shareholder would pay on fund distributions or the redemption of fund shares.
What did the Fund invest in?
Top 10 Holdings (% of net assets)
| VICI Properties Inc. | 8.7% |
| AT&T Inc. | 7.3% |
| Enterprise Products Partners LP | 7.1% |
| Qurate Retail Inc. | 6.8% |
| Blackstone Mortgage Trust Inc. | 6.8% |
| NextEra Energy Partners LP | 6.6% |
| Energy Transfer LP | 6.2% |
| Franklin BSP Realty Trust Inc. | 5.3% |
| Apollo Global Management Inc. | 5.0% |
| Kinder Morgan Inc. | 4.3% |
Portfolio Weighting (% of net assets)
| Common Stocks | 84.7% |
| Preferred Stocks | 11.1% |
| U.S. Government Obligations | 2.4% |
| Other Assets and Liabilities (Net) | 1.8% |
Industry Allocation (% of net assets)
| Industry Weighting | . |
|---|
| Energy and Utilities | 27.8% |
| Real Estate Investment Trusts | 23.9% |
| Financial Services | 9.1% |
| Telecommunications | 8.6% |
| Retail | 6.8% |
| Food and Beverage | 5.3% |
| Health Care | 4.1% |
| Building and Construction | 2.4% |
| Other Industry sectors | 10.2% |
| Other Assets and Liabilities (Net) | 1.8% |
The Gabelli Focused Growth and Income Fund
Annual Shareholder Report - September 30, 2024
Where can I find additional information about the Fund?
If you wish to view additional information about the Fund; including but not limited to financial statements or holdings, please visit www.gabelli.com/funds/open_ends.
Contact Us
Phone: 800-GABELLI (800-422-3554)
Email: info@gabelli.com
If you wish to receive a copy of this document at a new address, contact 800-GABELLI (800-422-3554)
The Gabelli Small Cap Growth Fund
Annual Shareholder Report - September 30, 2024
This annual shareholder report contains important information about The Gabelli Small Cap Growth Fund (the "Fund") for the period of October 1, 2023 to September 30, 2024. The Fund invests primarily in small cap companies that, through bottom-up fundamental research, the portfolio manager believes are attractively priced relative to their earnings growth potential or private market value. The Fund characterizes small capitalization companies as those companies with a market capitalization of $3 billion or less at the time of the Fund’s initial investment. You can find additional information about the Fund at www.gabelli.com/funds/open_ends. You can also request this information by contacting us at 800-GABELLI (800-422-3554).
What were the Fund costs for the last year?
(based on a hypothetical $10,000 investment)
| Class Name | Costs of a $10k Investment | Costs Paid as a % of a $10k Investment |
|---|
| The Gabelli Small Cap Growth Fund - Class AAA | $156 | 1.37% |
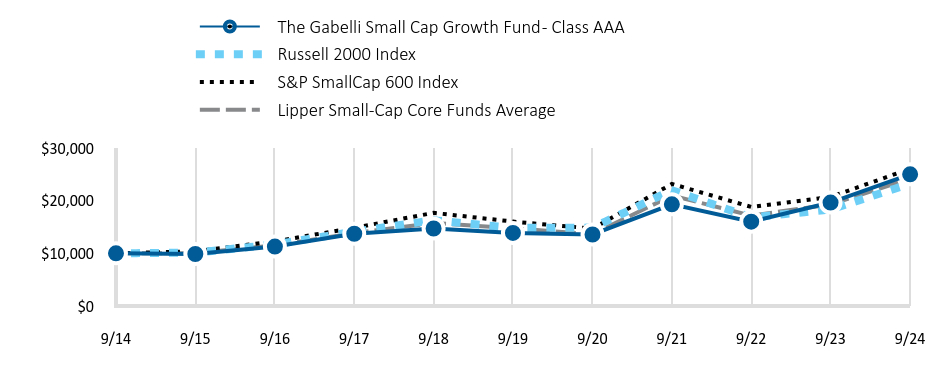
How did the Fund perform?
During the fiscal year ended September 30, 2024, the Gabelli Small Cap Growth Fund outperformed its broad-based benchmark, the Russell 2000 Index, as well as its comparative benchmarks, the Lipper Small-Cap Core Funds Average and the S&P SmallCap 600 Index. Top contributors to the Fund over the year were focused in the Financials, Industrials, and Consumer Discretionary sectors. Detractors to returns over the fiscal year came primarily from the Health Care and Energy sectors. The environment for small caps was challenged relative to large capitalization companies given investor sensitivity to higher interest rates and concerns of an economic slowdown.
How has the Fund performed over the past 10 years?
The performance chart of the fund class presented reflects a hypothetical $10,000 investment, assuming the maximum sales charge, compared to a broad-based securities market index and more narrowly based indices reflecting market sectors in which the Fund invests over a 10-year period. The chart uses total return NAV performance and assumes reinvestment of dividends and capital gains distribution. Fund expenses were deducted.
Total Return Based on a $10,000 Investment
| The Gabelli Small Cap Growth Fund - Class AAA | Russell 2000 Index | S&P SmallCap 600 Index | Lipper Small-Cap Core Funds Average |
|---|
| 9/14 | 10,000 | 10,000 | 10,000 | 10,000 |
| 9/15 | 9,875 | 10,125 | 10,381 | 10,032 |
| 9/16 | 11,283 | 11,691 | 12,262 | 11,503 |
| 9/17 | 13,716 | 14,116 | 14,843 | 13,823 |
| 9/18 | 14,705 | 16,267 | 17,675 | 15,751 |
| 9/19 | 13,864 | 14,821 | 16,024 | 14,773 |
| 9/20 | 13,575 | 14,879 | 14,696 | 13,619 |
| 9/21 | 19,299 | 21,973 | 23,167 | 20,950 |
| 9/22 | 16,004 | 16,810 | 18,804 | 17,173 |
| 9/23 | 19,637 | 18,311 | 20,700 | 19,246 |
| 9/24 | 24,987 | 23,211 | 26,053 | 24,196 |
Average Annual Total Returns
| 1 Year | 5 Year | 10 Year |
|---|
| The Gabelli Small Cap Growth Fund - Class AAA | 27.24% | 12.51% | 9.59% |
| Russell 2000 Index | 26.76% | 9.39% | 8.78% |
| S&P SmallCap 600 Index | 25.86% | 10.21% | 10.05% |
| Lipper Small-Cap Core Funds Average | 25.72% | 10.37% | 9.24% |
- Total Net Assets$1,809,518,511
- Number of Portfolio Holdings436
- Portfolio Turnover Rate2%
- Management Fees$16,940,565
Past performance does not guarantee future results. Call 800-GABELLI (800-422-3554) or visit www.gabelli.com/funds/open_ends for current month-end performance. The table and graph presented above do not reflect the deduction of taxes a shareholder would pay on fund distributions or the redemption of fund shares.
What did the Fund invest in?
Top 10 Holdings (% of net assets)
| KKR & Co. Inc. | 4.8% |
| AMETEK Inc. | 3.6% |
| Mueller Industries Inc. | 3.3% |
| Lennar Corp. | 3.1% |
| Crane Co. | 3.1% |
| GATX Corp. | 2.4% |
| Graco Inc. | 2.0% |
| Herc Holdings Inc. | 1.8% |
| Modine Manufacturing Co. | 1.8% |
| Textron Inc. | 1.6% |
Portfolio Weighting (% of net assets)
| Common Stocks | 98.9% |
| U.S. Government Obligations | 0.7% |
| Miscellaneous Investments | 0.4% |
| Preferred Stocks | 0.1% |
| Closed-End Funds | 0.1% |
| Other Assets and Liabilities (Net) | (0.2%) |
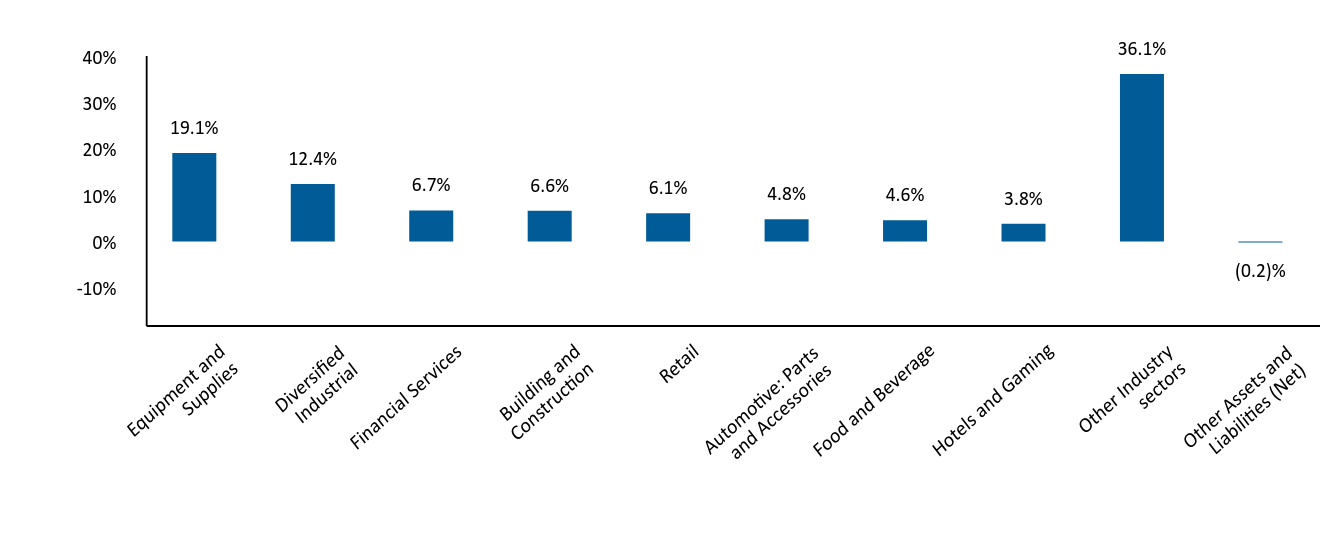
Industry Allocation (% of net assets)
| Industry Weighting | . |
|---|
| Equipment and Supplies | 19.1% |
| Diversified Industrial | 12.4% |
| Financial Services | 6.7% |
| Building and Construction | 6.6% |
| Retail | 6.1% |
| Automotive: Parts and Accessories | 4.8% |
| Food and Beverage | 4.6% |
| Hotels and Gaming | 3.8% |
| Other Industry sectors | 36.1% |
| Other Assets and Liabilities (Net) | (0.2)% |
The Gabelli Small Cap Growth Fund
Annual Shareholder Report - September 30, 2024
Where can I find additional information about the Fund?
If you wish to view additional information about the Fund; including but not limited to financial statements or holdings, please visit www.gabelli.com/funds/open_ends.
Contact Us
Phone: 800-GABELLI (800-422-3554)
Email: info@gabelli.com
If you wish to receive a copy of this document at a new address, contact 800-GABELLI (800-422-3554)
The Gabelli Small Cap Growth Fund
Annual Shareholder Report - September 30, 2024
This annual shareholder report contains important information about The Gabelli Small Cap Growth Fund (the "Fund") for the period of October 1, 2023 to September 30, 2024. The Fund invests primarily in small cap companies that, through bottom-up fundamental research, the portfolio manager believes are attractively priced relative to their earnings growth potential or private market value. The Fund characterizes small capitalization companies as those companies with a market capitalization of $3 billion or less at the time of the Fund’s initial investment. You can find additional information about the Fund at www.gabelli.com/funds/open_ends. You can also request this information by contacting us at 800-GABELLI (800-422-3554).
What were the Fund costs for the last year?
(based on a hypothetical $10,000 investment)
| Class Name | Costs of a $10k Investment | Costs Paid as a % of a $10k Investment |
|---|
| The Gabelli Small Cap Growth Fund - Class C | $240 | 2.12% |
How did the Fund perform?
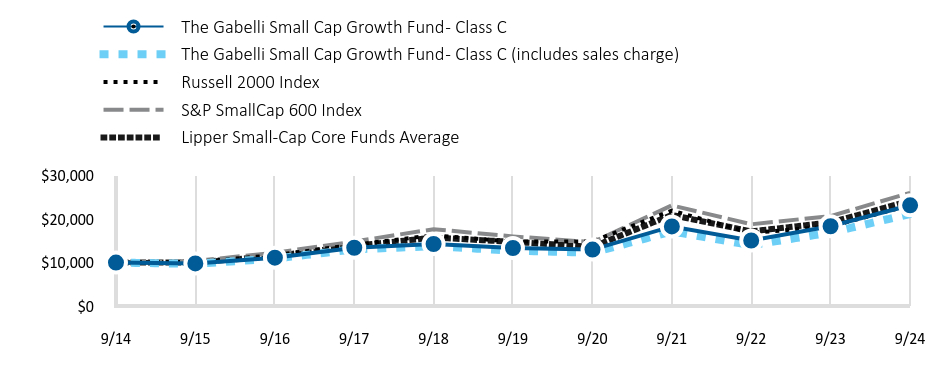
During the fiscal year ended September 30, 2024, the Gabelli Small Cap Growth Fund outperformed its broad-based benchmark, the Russell 2000 Index, as well as its comparative benchmarks, the Lipper Small-Cap Core Funds Average and the S&P SmallCap 600 Index. Top contributors to the Fund over the year were focused in the Financials, Industrials, and Consumer Discretionary sectors. Detractors to returns over the fiscal year came primarily from the Health Care and Energy sectors. The environment for small caps was challenged relative to large capitalization companies given investor sensitivity to higher interest rates and concerns of an economic slowdown.
How has the Fund performed over the past 10 years?
The performance chart of the fund class presented reflects a hypothetical $10,000 investment, assuming the maximum sales charge, compared to a broad-based securities market index and more narrowly based indices reflecting market sectors in which the Fund invests over a 10-year period. The chart uses total return NAV performance and assumes reinvestment of dividends and capital gains distribution. Fund expenses were deducted.
Total Return Based on a $10,000 Investment
| The Gabelli Small Cap Growth Fund - Class C | The Gabelli Small Cap Growth Fund - Class C (includes sales charge) | Russell 2000 Index | S&P SmallCap 600 Index | Lipper Small-Cap Core Funds Average |
|---|
| 9/14 | 10,000 | 10,000 | 10,000 | 10,000 | 10,000 |
| 9/15 | 9,802 | 9,704 | 10,125 | 10,381 | 10,032 |
| 9/16 | 11,116 | 10,908 | 11,691 | 12,262 | 11,503 |
| 9/17 | 13,412 | 13,052 | 14,116 | 14,843 | 13,823 |
| 9/18 | 14,272 | 13,758 | 16,267 | 17,675 | 15,751 |
| 9/19 | 13,353 | 12,743 | 14,821 | 16,024 | 14,773 |
| 9/20 | 12,979 | 12,262 | 14,879 | 14,696 | 13,619 |
| 9/21 | 18,313 | 17,179 | 21,973 | 23,167 | 20,950 |
| 9/22 | 15,073 | 13,998 | 16,810 | 18,804 | 17,173 |
| 9/23 | 18,358 | 16,908 | 18,311 | 20,700 | 19,246 |
| 9/24 | 23,184 | 21,184 | 23,211 | 26,053 | 24,196 |
Average Annual Total Returns
| 1 Year | 5 Year | 10 Year |
|---|
| The Gabelli Small Cap Growth Fund - Class C | 26.29% | 11.67% | 8.77% |
| The Gabelli Small Cap Growth Fund - Class C (includes sales charge) | 25.29% | 11.67% | 8.77% |
| Russell 2000 Index | 26.76% | 9.39% | 8.78% |
| S&P SmallCap 600 Index | 25.86% | 10.21% | 10.05% |
| Lipper Small-Cap Core Funds Average | 25.72% | 10.37% | 9.24% |
- Total Net Assets$1,809,518,511
- Number of Portfolio Holdings436
- Portfolio Turnover Rate2%
- Management Fees$16,940,565
Past performance does not guarantee future results. Call 800-GABELLI (800-422-3554) or visit www.gabelli.com/funds/open_ends for current month-end performance. The table and graph presented above do not reflect the deduction of taxes a shareholder would pay on fund distributions or the redemption of fund shares.
What did the Fund invest in?
Top 10 Holdings (% of net assets)
| KKR & Co. Inc. | 4.8% |
| AMETEK Inc. | 3.6% |
| Mueller Industries Inc. | 3.3% |
| Lennar Corp. | 3.1% |
| Crane Co. | 3.1% |
| GATX Corp. | 2.4% |
| Graco Inc. | 2.0% |
| Herc Holdings Inc. | 1.8% |
| Modine Manufacturing Co. | 1.8% |
| Textron Inc. | 1.6% |
Portfolio Weighting (% of net assets)
| Common Stocks | 98.9% |
| U.S. Government Obligations | 0.7% |
| Miscellaneous Investments | 0.4% |
| Preferred Stocks | 0.1% |
| Closed-End Funds | 0.1% |
| Other Assets and Liabilities (Net) | (0.2%) |
Industry Allocation (% of net assets)
| Industry Weighting | . |
|---|
| Equipment and Supplies | 19.1% |
| Diversified Industrial | 12.4% |
| Financial Services | 6.7% |
| Building and Construction | 6.6% |
| Retail | 6.1% |
| Automotive: Parts and Accessories | 4.8% |
| Food and Beverage | 4.6% |
| Hotels and Gaming | 3.8% |
| Other Industry sectors | 36.1% |
| Other Assets and Liabilities (Net) | (0.2)% |
The Gabelli Small Cap Growth Fund
Annual Shareholder Report - September 30, 2024
Where can I find additional information about the Fund?
If you wish to view additional information about the Fund; including but not limited to financial statements or holdings, please visit www.gabelli.com/funds/open_ends.
Contact Us
Phone: 800-GABELLI (800-422-3554)
Email: info@gabelli.com
If you wish to receive a copy of this document at a new address, contact 800-GABELLI (800-422-3554)
The Gabelli Small Cap Growth Fund
Annual Shareholder Report - September 30, 2024
This annual shareholder report contains important information about The Gabelli Small Cap Growth Fund (the "Fund") for the period of October 1, 2023 to September 30, 2024. The Fund invests primarily in small cap companies that, through bottom-up fundamental research, the portfolio manager believes are attractively priced relative to their earnings growth potential or private market value. The Fund characterizes small capitalization companies as those companies with a market capitalization of $3 billion or less at the time of the Fund’s initial investment. You can find additional information about the Fund at www.gabelli.com/funds/open_ends. You can also request this information by contacting us at 800-GABELLI (800-422-3554).
What were the Fund costs for the last year?
(based on a hypothetical $10,000 investment)
| Class Name | Costs of a $10k Investment | Costs Paid as a % of a $10k Investment |
|---|
| The Gabelli Small Cap Growth Fund - Class I | $127 | 1.12% |
How did the Fund perform?
During the fiscal year ended September 30, 2024, the Gabelli Small Cap Growth Fund outperformed its broad-based benchmark, the Russell 2000 Index, as well as its comparative benchmarks, the Lipper Small-Cap Core Funds Average and the S&P SmallCap 600 Index. Top contributors to the Fund over the year were focused in the Financials, Industrials, and Consumer Discretionary sectors. Detractors to returns over the fiscal year came primarily from the Health Care and Energy sectors. The environment for small caps was challenged relative to large capitalization companies given investor sensitivity to higher interest rates and concerns of an economic slowdown.
How has the Fund performed over the past 10 years?
The performance chart of the fund class presented reflects a hypothetical $10,000 investment, assuming the maximum sales charge, compared to a broad-based securities market index and more narrowly based indices reflecting market sectors in which the Fund invests over a 10-year period. The chart uses total return NAV performance and assumes reinvestment of dividends and capital gains distribution. Fund expenses were deducted.
Total Return Based on a $10,000 Investment
| The Gabelli Small Cap Growth Fund - Class I | Russell 2000 Index | S&P SmallCap 600 Index | Lipper Small-Cap Core Funds Average |
|---|
| 9/14 | 10,000 | 10,000 | 10,000 | 10,000 |
| 9/15 | 9,900 | 10,125 | 10,381 | 10,032 |
| 9/16 | 11,341 | 11,691 | 12,262 | 11,503 |
| 9/17 | 13,818 | 14,116 | 14,843 | 13,823 |
| 9/18 | 14,853 | 16,267 | 17,675 | 15,751 |
| 9/19 | 14,036 | 14,821 | 16,024 | 14,773 |
| 9/20 | 13,780 | 14,879 | 14,696 | 13,619 |
| 9/21 | 19,637 | 21,973 | 23,167 | 20,950 |
| 9/22 | 16,323 | 16,810 | 18,804 | 17,173 |
| 9/23 | 20,080 | 18,311 | 20,700 | 19,246 |
| 9/24 | 25,618 | 23,211 | 26,053 | 24,196 |
Average Annual Total Returns
| 1 Year | 5 Year | 10 Year |
|---|
| The Gabelli Small Cap Growth Fund - Class I | 27.58% | 12.79% | 9.87% |
| Russell 2000 Index | 26.76% | 9.39% | 8.78% |
| S&P SmallCap 600 Index | 25.86% | 10.21% | 10.05% |
| Lipper Small-Cap Core Funds Average | 25.72% | 10.37% | 9.24% |
- Total Net Assets$1,809,518,511
- Number of Portfolio Holdings436
- Portfolio Turnover Rate2%
- Management Fees$16,940,565
Past performance does not guarantee future results. Call 800-GABELLI (800-422-3554) or visit www.gabelli.com/funds/open_ends for current month-end performance. The table and graph presented above do not reflect the deduction of taxes a shareholder would pay on fund distributions or the redemption of fund shares.
What did the Fund invest in?
Top 10 Holdings (% of net assets)
| KKR & Co. Inc. | 4.8% |
| AMETEK Inc. | 3.6% |
| Mueller Industries Inc. | 3.3% |
| Lennar Corp. | 3.1% |
| Crane Co. | 3.1% |
| GATX Corp. | 2.4% |
| Graco Inc. | 2.0% |
| Herc Holdings Inc. | 1.8% |
| Modine Manufacturing Co. | 1.8% |
| Textron Inc. | 1.6% |
Portfolio Weighting (% of net assets)
| Common Stocks | 98.9% |
| U.S. Government Obligations | 0.7% |
| Miscellaneous Investments | 0.4% |
| Preferred Stocks | 0.1% |
| Closed-End Funds | 0.1% |
| Other Assets and Liabilities (Net) | (0.2%) |
Industry Allocation (% of net assets)
| Industry Weighting | . |
|---|
| Equipment and Supplies | 19.1% |
| Diversified Industrial | 12.4% |
| Financial Services | 6.7% |
| Building and Construction | 6.6% |
| Retail | 6.1% |
| Automotive: Parts and Accessories | 4.8% |
| Food and Beverage | 4.6% |
| Hotels and Gaming | 3.8% |
| Other Industry sectors | 36.1% |
| Other Assets and Liabilities (Net) | (0.2)% |
The Gabelli Small Cap Growth Fund
Annual Shareholder Report - September 30, 2024
Where can I find additional information about the Fund?
If you wish to view additional information about the Fund; including but not limited to financial statements or holdings, please visit www.gabelli.com/funds/open_ends.
Contact Us
Phone: 800-GABELLI (800-422-3554)
Email: info@gabelli.com
If you wish to receive a copy of this document at a new address, contact 800-GABELLI (800-422-3554)
The Gabelli Small Cap Growth Fund
Annual Shareholder Report - September 30, 2024
This annual shareholder report contains important information about The Gabelli Small Cap Growth Fund (the "Fund") for the period of October 1, 2023 to September 30, 2024. The Fund invests primarily in small cap companies that, through bottom-up fundamental research, the portfolio manager believes are attractively priced relative to their earnings growth potential or private market value. The Fund characterizes small capitalization companies as those companies with a market capitalization of $3 billion or less at the time of the Fund’s initial investment. You can find additional information about the Fund at www.gabelli.com/funds/open_ends. You can also request this information by contacting us at 800-GABELLI (800-422-3554).
What were the Fund costs for the last year?
(based on a hypothetical $10,000 investment)
| Class Name | Costs of a $10k Investment | Costs Paid as a % of a $10k Investment |
|---|
| The Gabelli Small Cap Growth Fund - Class A | $156 | 1.37% |
How did the Fund perform?
During the fiscal year ended September 30, 2024, the Gabelli Small Cap Growth Fund outperformed its broad-based benchmark, the Russell 2000 Index, as well as its comparative benchmarks, the Lipper Small-Cap Core Funds Average and the S&P SmallCap 600 Index. Top contributors to the Fund over the year were focused in the Financials, Industrials, and Consumer Discretionary sectors. Detractors to returns over the fiscal year came primarily from the Health Care and Energy sectors. The environment for small caps was challenged relative to large capitalization companies given investor sensitivity to higher interest rates and concerns of an economic slowdown.
How has the Fund performed over the past 10 years?
The performance chart of the fund class presented reflects a hypothetical $10,000 investment, assuming the maximum sales charge, compared to a broad-based securities market index and more narrowly based indices reflecting market sectors in which the Fund invests over a 10-year period. The chart uses total return NAV performance and assumes reinvestment of dividends and capital gains distribution. Fund expenses were deducted.
Total Return Based on a $10,000 Investment
| The Gabelli Small Cap Growth Fund - Class A | The Gabelli Small Cap Growth Fund - Class A (includes sales charge) | Russell 2000 Index | S&P SmallCap 600 Index | Lipper Small-Cap Core Funds Average |
|---|
| 9/14 | 10,000 | 10,000 | 10,000 | 10,000 | 10,000 |
| 9/15 | 9,875 | 9,307 | 10,125 | 10,381 | 10,032 |
| 9/16 | 11,283 | 10,023 | 11,691 | 12,262 | 11,503 |
| 9/17 | 13,715 | 11,482 | 14,116 | 14,843 | 13,823 |
| 9/18 | 14,704 | 11,603 | 16,267 | 17,675 | 15,751 |
| 9/19 | 13,861 | 10,309 | 14,821 | 16,024 | 14,773 |
| 9/20 | 13,573 | 9,514 | 14,879 | 14,696 | 13,619 |
| 9/21 | 19,296 | 12,749 | 21,973 | 23,167 | 20,950 |
| 9/22 | 16,001 | 9,963 | 16,810 | 18,804 | 17,173 |
| 9/23 | 19,636 | 11,523 | 18,311 | 20,700 | 19,246 |
| 9/24 | 24,985 | 13,819 | 23,211 | 26,053 | 24,196 |
Average Annual Total Returns
| 1 Year | 5 Year | 10 Year |
|---|
| The Gabelli Small Cap Growth Fund - Class A | 27.24% | 12.50% | 9.59% |
| The Gabelli Small Cap Growth Fund - Class A (includes sales charge) | 19.92% | 11.18% | 8.94% |
| Russell 2000 Index | 26.76% | 9.39% | 8.78% |
| S&P SmallCap 600 Index | 25.86% | 10.21% | 10.05% |
| Lipper Small-Cap Core Funds Average | 25.72% | 10.37% | 9.24% |
- Total Net Assets$1,809,518,511
- Number of Portfolio Holdings436
- Portfolio Turnover Rate2%
- Management Fees$16,940,565
Past performance does not guarantee future results. Call 800-GABELLI (800-422-3554) or visit www.gabelli.com/funds/open_ends for current month-end performance. The table and graph presented above do not reflect the deduction of taxes a shareholder would pay on fund distributions or the redemption of fund shares.
What did the Fund invest in?
Top 10 Holdings (% of net assets)
| KKR & Co. Inc. | 4.8% |
| AMETEK Inc. | 3.6% |
| Mueller Industries Inc. | 3.3% |
| Lennar Corp. | 3.1% |
| Crane Co. | 3.1% |
| GATX Corp. | 2.4% |
| Graco Inc. | 2.0% |
| Herc Holdings Inc. | 1.8% |
| Modine Manufacturing Co. | 1.8% |
| Textron Inc. | 1.6% |
Portfolio Weighting (% of net assets)
| Common Stocks | 98.9% |
| U.S. Government Obligations | 0.7% |
| Miscellaneous Investments | 0.4% |
| Preferred Stocks | 0.1% |
| Closed-End Funds | 0.1% |
| Other Assets and Liabilities (Net) | (0.2%) |
Industry Allocation (% of net assets)
| Industry Weighting | . |
|---|
| Equipment and Supplies | 19.1% |
| Diversified Industrial | 12.4% |
| Financial Services | 6.7% |
| Building and Construction | 6.6% |
| Retail | 6.1% |
| Automotive: Parts and Accessories | 4.8% |
| Food and Beverage | 4.6% |
| Hotels and Gaming | 3.8% |
| Other Industry sectors | 36.1% |
| Other Assets and Liabilities (Net) | (0.2)% |
The Gabelli Small Cap Growth Fund
Annual Shareholder Report - September 30, 2024
Where can I find additional information about the Fund?
If you wish to view additional information about the Fund; including but not limited to financial statements or holdings, please visit www.gabelli.com/funds/open_ends.
Contact Us
Phone: 800-GABELLI (800-422-3554)
Email: info@gabelli.com
If you wish to receive a copy of this document at a new address, contact 800-GABELLI (800-422-3554)
| (a) | The registrant, as of the end of the period covered by this report, has adopted a code of ethics that applies to the registrant’s principal executive officer, principal financial officer, principal accounting officer or controller, or persons performing similar functions, regardless of whether these individuals are employed by the registrant or a third party (the “Code of Ethics”). |
| (b) | There have been no amendments, during the period covered by this report, to a provision of the Code of Ethics that applies to the registrant’s principal executive officer, principal financial officer, principal accounting officer or controller, or persons performing similar functions, regardless of whether these individuals are employed by the registrant or a third party, and that relates to any element of the code of ethics definition enumerated in Item 2(b) of Form N-CSR. |
| (c) | The registrant has not granted any waivers, including an implicit waiver, from a provision of the code of ethics that applies to the registrant’s principal executive officer, principal financial officer, principal accounting officer or controller, or persons performing similar functions, regardless of whether these individuals are employed by the registrant or a third party, that relates to one or more of the items set forth in Item 2(b) of Form N-CSR. |
| (e) | A copy of the Code of Ethics is filed as an Exhibit. |
| Item 3. | Audit Committee Financial Expert. |
As of the end of the period covered by the report, the registrant’s board of directors has determined that Vincent D. Enright is qualified to serve as an audit committee financial expert serving on its audit committee and that he is “independent,” as defined in Item 3 of Form N-CSR.
| Item 4. | Principal Accountant Fees and Services. |
Audit Fees
| (a) | The aggregate fees billed for each of the last two fiscal years for professional services rendered by the principal accountant for the audit of the registrant’s annual financial statements or services that are normally provided by the accountant in connection with statutory and regulatory filings or engagements for those fiscal years are $116,800 in 2023 and $120,400 in 2024. |
Audit-Related Fees
| (b) | The aggregate fees billed in each of the last two fiscal years for assurance and related services by the principal accountant that are reasonably related to the performance of the audit of the registrant’s financial statements and are not reported under paragraph (a) of this Item are $0 in 2023 and $0 in 2024. |
Tax Fees
| (c) | The aggregate fees billed in each of the last two fiscal years for professional services rendered by the principal accountant for tax compliance, tax advice, and tax planning are $16,400 in 2023 and $22,000 in 2024. Tax fees represent tax compliance services provided in connection with the review of the Registrant’s tax returns. |
All Other Fees
| (d) | The aggregate fees billed in each of the last two fiscal years for products and services provided by the principal accountant, other than the services reported in paragraphs (a) through (c) of this Item are $2,019 in 2023 and $2,050 in 2024. The fees relate to Passive Foreign Investment Company identification database subscription fees billed on an annual basis. |
| (e)(1) | Audit committee’s pre-approval policies and procedures described in paragraph (c)(7) of Rule 2-01 of Regulation S-X. |
| | | |
| | | Pre-Approval Policies and Procedures. The Audit Committee (“Committee”) of the registrant is responsible for pre-approving (i) all audit and permissible non-audit services to be provided by the independent registered public accounting firm to the registrant and (ii) all permissible non-audit services to be provided by the independent registered public accounting firm to the Adviser, Gabelli Funds, LLC, and any affiliate of Gabelli Funds, LLC (“Gabelli”) that provides services to the registrant (a “Covered Services Provider”) if the independent registered public accounting firm’s engagement related directly to the operations and financial reporting of the registrant. The Committee may delegate its responsibility to pre-approve any such audit and permissible non-audit services to the Chairperson of the Committee, and the Chairperson must report to the Committee, at its next regularly scheduled meeting after the Chairperson’s pre-approval of such services, his or her decision(s). The Committee may also establish detailed pre-approval policies and procedures for pre-approval of such services in accordance with applicable laws, including the delegation of some or all of the Committee’s pre-approval responsibilities to the other persons (other than Gabelli or the registrant’s officers). Pre-approval by the Committee of any permissible non-audit services is not required so long as: (i) the permissible non-audit services were not recognized by the registrant at the time of the engagement to be non-audit services; and (ii) such services are promptly brought to the attention of the Committee and approved by the Committee or Chairperson prior to the completion of the audit. |
| (e)(2) | The percentage of services described in each of paragraphs (b) through (d) of this Item that were approved by the audit committee pursuant to paragraph (c)(7)(i)(C) of Rule 2-01 of Regulation S-X are as follows: |
| (f) | The percentage of hours expended on the principal accountant’s engagement to audit the registrant’s financial statements for the most recent fiscal year that were attributed to work performed by persons other than the principal accountant’s full-time, permanent employees was less than fifty percent. |
| (g) | The aggregate non-audit fees billed by the registrant’s accountant for services rendered to the registrant, and rendered to the registrant’s investment adviser (not including any sub-adviser whose role is primarily portfolio management and is subcontracted with or overseen by another investment adviser), and any entity controlling, controlled by, or under common control with the adviser that provides ongoing services to the registrant for each of the last two fiscal years of the registrant was $53,850 in 2023 and $60,650 in 2024. |
| (h) | The audit committee of the registrant’s board of directors has considered whether the provision of non-audit services that were rendered to the registrant’s investment adviser (not including any sub-adviser whose role is primarily portfolio management and is subcontracted with or overseen by another investment adviser), and any entity controlling, controlled by, or under common control with the investment adviser that provides ongoing services to the registrant that were not pre-approved pursuant to paragraph (c)(7)(ii) of Rule 2-01 of Regulation S-X is compatible with maintaining the principal accountant’s independence. |
| (j) | The registrant is not a foreign issuer. |
| Item 5. | Audit Committee of Listed Registrants. |
| (a) | Schedule of Investments in securities of unaffiliated issuers as of the close of the reporting period is included as part of the report to shareholders filed under Item 1(a) of this form. |
| Item 7. | Financial Statements and Financial Highlights for Open-End Management Investment Companies. |
| (a) | An open-end management investment company registered on Form N-1A [17 CFR 239.15A and 17 CFR 274.11A] must file its most recent annual or semi-annual financial statements required, and for the periods specified, by Regulation S-X. |
The annual financial statements are attached herewith.
The Gabelli Equity Income Fund
Annual Report — September 30, 2024
To Our Shareholders,
For the fiscal year ended September 30, 2024, the net asset value (NAV) total return per Class AAA Share of The Gabelli Equity Income Fund was 19.6% compared with a total return of 36.4% for the Standard & Poor’s (S&P) 500 Index. Other classes of shares are available.
Enclosed are the financial statements, including the schedule of investments, as of September 30, 2024.
Summary of Portfolio Holdings (Unaudited)
The following table presents portfolio holdings as a percent of net assets as of September 30, 2024:
The Gabelli Equity Income Fund
| Food and Beverage | | | 15.5 | % |
| Financial Services | | | 15.3 | % |
| Equipment and Supplies | | | 7.0 | % |
| Diversified Industrial | | | 6.6 | % |
| Retail | | | 4.7 | % |
| Health Care | | | 4.6 | % |
| Automotive: Parts and Accessories | | | 4.5 | % |
| Telecommunications | | | 4.0 | % |
| Business Services | | | 4.0 | % |
| Energy and Utilities: Oil | | | 3.5 | % |
| Machinery | | | 3.5 | % |
| Energy and Utilities: Natural Gas | | | 2.8 | % |
| Computer Software and Services | | | 2.7 | % |
| Electronics | | | 2.4 | % |
| Transportation | | | 2.4 | % |
| Metals and Mining | | | 2.3 | % |
| Building and Construction | | | 2.2 | % |
| Computer Hardware | | | 2.2 | % |
| Entertainment | | | 1.8 | % |
| Consumer Products | | | 1.3 | % |
| Specialty Chemicals | | | 0.9 | % |
| Energy and Utilities: Services | | | 0.8 | % |
| Energy and Utilities: Integrated | | | 0.8 | % |
| Automotive | | | 0.6 | % |
| Aerospace | | | 0.6 | % |
| Energy and Utilities: Electric | | | 0.4 | % |
| Real Estate Investment Trusts | | | 0.4 | % |
| Communications Equipment | | | 0.4 | % |
| Agriculture | | | 0.4 | % |
| Environmental Services | | | 0.4 | % |
| Broadcasting | | | 0.3 | % |
| Wireless Communications | | | 0.2 | % |
| Energy and Utilities: Water | | | 0.2 | % |
| Consumer Services | | | 0.1 | % |
| Hotels and Gaming | | | 0.1 | % |
| Publishing | | | 0.0 | %* |
| Cable and Satellite | | | 0.0 | %* |
| Other Assets and Liabilities (Net) | | | 0.1 | % |
| | | | 100.0 | % |
| * | Amount represents less than 0.05%. |
The Fund files a complete schedule of portfolio holdings with the Securities and Exchange Commission (the SEC) for the first and third quarters of each fiscal year on Form N-PORT. Shareholders may obtain this information at www.gabelli.com or by calling the Fund at 800-GABELLI (800-422-3554). The Fund’s Form N-PORT is available on the SEC’s website at www.sec.gov and may also be reviewed and copied at the SEC’s Public Reference Room in Washington, DC. Information on the operation of the Public Reference Room may be obtained by calling 800-SEC-0330.
Proxy Voting
The Fund files Form N-PX with its complete proxy voting record for the twelve months ended June 30, no later than August 31 of each year. A description of the Fund’s proxy voting policies, procedures, and how the Fund voted proxies relating to portfolio securities is available without charge, upon request, by (i) calling 800-GABELLI (800-422-3554); (ii) writing to The Gabelli Funds at One Corporate Center, Rye, NY 10580-1422; or (iii) visiting the SEC’s website at www.sec.gov.
The Gabelli Equity Income Fund
Schedule of Investments — September 30, 2024
| Shares | | | | | Cost | | | Market
Value | |
| | | | | COMMON STOCKS — 99.9% | | | | | | | | |
| | | | | Aerospace — 0.6% | | | | | | | | |
| | 1,000 | | | Ducommun Inc.† | | $ | 56,462 | | | $ | 65,830 | |
| | 800 | | | Hexcel Corp. | | | 49,583 | | | | 49,464 | |
| | 2,000 | | | Lockheed Martin Corp. | | | 47,350 | | | | 1,169,120 | |
| | 6,300 | | | Rockwell Automation Inc. | | | 189,266 | | | | 1,691,298 | |
| | | | | | | | 342,661 | | | | 2,975,712 | |
| | | | | Agriculture — 0.4% | | | | | | | | |
| | 25,500 | | | Archer-Daniels-Midland Co. | | | 653,929 | | | | 1,523,370 | |
| | 10,000 | | | The Mosaic Co. | | | 155,338 | | | | 267,800 | |
| | | | | | | | 809,267 | | | | 1,791,170 | |
| | | | | Automotive — 0.6% | | | | | | | | |
| | 2,000 | | | Daimler Truck Holding AG | | | 71,022 | | | | 74,870 | |
| | 20,000 | | | Iveco Group NV | | | 175,902 | | | | 200,768 | |
| | 14,500 | | | PACCAR Inc. | | | 370,272 | | | | 1,430,860 | |
| | 41,000 | | | Traton SE | | | 746,919 | | | | 1,341,791 | |
| | | | | | | | 1,364,115 | | | | 3,048,289 | |
| | | | | Automotive: Parts and Accessories — 4.5% | | | | | | | | |
| | 72,200 | | | Dana Inc. | | | 1,127,407 | | | | 762,432 | |
| | 152,000 | | | Genuine Parts Co. | | | 6,684,103 | | | | 21,231,360 | |
| | | | | | | | 7,811,510 | | | | 21,993,792 | |
| | | | | Broadcasting — 0.3% | | | | | | | | |
| | 29,000 | | | Sinclair Inc. | | | 461,443 | | | | 443,700 | |
| | 48,000 | | | TEGNA Inc. | | | 765,267 | | | | 757,440 | |
| | | | | | | | 1,226,710 | | | | 1,201,140 | |
| | | | | Building and Construction — 2.2% | | | | | | | | |
| | 20,300 | | | Carrier Global Corp. | | | 232,965 | | | | 1,633,947 | |
| | 32,500 | | | Fortune Brands Innovations Inc. | | | 276,977 | | | | 2,909,725 | |
| | 16,000 | | | Herc Holdings Inc. | | | 469,850 | | | | 2,550,880 | |
| | 37,400 | | | Johnson Controls International plc | | | 731,360 | | | | 2,902,614 | |
| | 7,500 | | | Knife River Corp.† | | | 271,664 | | | | 670,425 | |
| | | | | | | | 1,982,816 | | | | 10,667,591 | |
| | | | | Business Services — 4.0% | | | | | | | | |
| | 6,700 | | | Automatic Data Processing Inc. | | | 349,121 | | | | 1,854,091 | |
| | 16,400 | | | Mastercard Inc., Cl. A | | | 148,840 | | | | 8,098,320 | |
| | 2,400 | | | MSC Industrial Direct Co. Inc., Cl. A | | | 165,490 | | | | 206,544 | |
| | 29,200 | | | Pentair plc | | | 549,425 | | | | 2,855,468 | |
| | 12,200 | | | S&P Global Inc. | | | 552,131 | | | | 6,302,764 | |
| | | | | | | | 1,765,007 | | | | 19,317,187 | |
| | | | | Cable and Satellite — 0.0% | | | | | | | | |
| | 2,000 | | | EchoStar Corp., Cl. A† | | | 29,090 | | | | 49,640 | |
| | | | | | | | | | | | | |
| | | | | Communications Equipment — 0.4% | | | | | | | | |
| | 40,000 | | | Corning Inc. | | | 458,395 | | | | 1,806,000 | |
| Shares | | | | | Cost | | | Market
Value | |
| | | | | Computer Hardware — 2.2% | | | | | | | | |
| | 22,000 | | | Apple Inc. | | $ | 402,822 | | | $ | 5,126,000 | |
| | 24,200 | | | International Business Machines Corp. | | | 1,949,915 | | | | 5,350,136 | |
| | | | | | | | 2,352,737 | | | | 10,476,136 | |
| | | | | Computer Software and Services — 2.7% | | | | | | | | |
| | 76,000 | | | Hewlett Packard Enterprise Co. | | | 423,938 | | | | 1,554,960 | |
| | 26,800 | | | Microsoft Corp. | | | 748,792 | | | | 11,532,040 | |
| | | | | | | | 1,172,730 | | | | 13,087,000 | |
| | | | | Consumer Products — 1.3% | | | | | | | | |
| | 5,500 | | | Edgewell Personal Care Co. | | | 166,525 | | | | 199,870 | |
| | 39,000 | | | Energizer Holdings Inc. | | | 792,357 | | | | 1,238,640 | |
| | 25,000 | | | Essity AB, Cl. A | | | 383,569 | | | | 781,569 | |
| | 1,500 | | | National Presto Industries Inc. | | | 115,010 | | | | 112,710 | |
| | 31,700 | | | Reckitt Benckiser Group plc | | | 938,639 | | | | 1,939,793 | |
| | 4,500 | | | The Scotts Miracle-Gro Co. | | | 226,604 | | | | 390,150 | |
| | 22,000 | | | Unilever plc, ADR | | | 429,655 | | | | 1,429,120 | |
| | | | | | | | 3,052,359 | | | | 6,091,852 | |
| | | | | Consumer Services — 0.1% | | | | | | | | |
| | 1,400 | | | Allegion plc | | | 17,122 | | | | 204,036 | |
| | 10,000 | | | Rollins Inc. | | | 9,942 | | | | 505,800 | |
| | | | | | | | 27,064 | | | | 709,836 | |
| | | | | Diversified Industrial — 6.6% | | | | | | | | |
| | 1,400 | | | AMETEK Inc. | | | 201,828 | | | | 240,394 | |
| | 61,200 | | | Crane Co. | | | 1,162,266 | | | | 9,686,736 | |
| | 1,000 | | | Eaton Corp. plc | | | 36,959 | | | | 331,440 | |
| | 1,000 | | | Honeywell International Inc. | | | 21,440 | | | | 206,710 | |
| | 8,600 | | | Ingersoll Rand Inc. | | | 45,820 | | | | 844,176 | |
| | 45,700 | | | ITT Inc. | | | 916,099 | | | | 6,832,607 | |
| | 4,700 | | | Jardine Matheson Holdings Ltd. | | | 207,042 | | | | 183,582 | |
| | 2,000 | | | Modine Manufacturing Co.† | | | 41,603 | | | | 265,580 | |
| | 8,000 | | | Myers Industries Inc. | | | 139,985 | | | | 110,560 | |
| | 17,000 | | | nVent Electric plc | | | 178,392 | | | | 1,194,420 | |
| | 20,000 | | | Svenska Cellulosa AB SCA, Cl. A | | | 83,897 | | | | 290,276 | |
| | 98,000 | | | Textron Inc. | | | 868,564 | | | | 8,680,840 | |
| | 146,000 | | | Toray Industries Inc. | | | 973,915 | | | | 856,547 | |
| | 3,700 | | | Trane Technologies plc | | | 77,329 | | | | 1,438,301 | |
| | 22,000 | | | Trinity Industries Inc. | | | 326,755 | | | | 766,480 | |
| | | | | | | | 5,281,894 | | | | 31,928,649 | |
| | | | | Electronics — 2.4% | | | | | | | | |
| | 32,500 | | | Sony Group Corp. | | | 138,866 | | | | 628,066 | |
| | 30,900 | | | Sony Group Corp., ADR | | | 881,819 | | | | 2,984,013 | |
| | 40,500 | | | TE Connectivity plc | | | 1,310,415 | | | | 6,115,095 | |
| | 10,000 | | | Texas Instruments Inc. | | | 147,000 | | | | 2,065,700 | |
| | | | | | | | 2,478,100 | | | | 11,792,874 | |
See accompanying notes to financial statements.
The Gabelli Equity Income Fund
Schedule of Investments (Continued) — September 30, 2024
| Shares | | | | | Cost | | | Market
Value | |
| | | | | COMMON STOCKS (Continued) | | | | | | | | |
| | | | | Energy and Utilities: Electric — 0.4% | | | | | | | | |
| | 10,000 | | | Korea Electric Power Corp., ADR† | | $ | 105,418 | | | $ | 77,600 | |
| | 13,500 | | | Portland General Electric Co. | | | 586,781 | | | | 646,650 | |
| | 63,000 | | | The AES Corp. | | | 291,918 | | | | 1,263,780 | |
| | | | | | | | 984,117 | | | | 1,988,030 | |
| | | | | Energy and Utilities: Integrated — 0.8% | | | | | | | | |
| | 50,000 | | | Energy Transfer LP | | | 0 | | | | 802,500 | |
| | 21,000 | | | Eni SpA | | | 220,487 | | | | 319,832 | |
| | 3,000 | | | Iberdrola SA, ADR | | | 45,240 | | | | 185,970 | |
| | 56,500 | | | OGE Energy Corp. | | | 754,077 | | | | 2,317,630 | |
| | | | | | | | 1,019,804 | | | | 3,625,932 | |
| | | | | Energy and Utilities: Natural Gas — 2.8% | | | | | | | | |
| | 115,000 | | | National Fuel Gas Co. | | | 5,209,133 | | | | 6,970,150 | |
| | 11,500 | | | ONE Gas Inc. | | | 48,202 | | | | 855,830 | |
| | 56,500 | | | ONEOK Inc. | | | 0 | | | | 5,148,845 | |
| | 5,000 | | | Southwest Gas Holdings Inc. | | | 304,848 | | | | 368,800 | |
| | | | | | | | 5,562,183 | | | | 13,343,625 | |
| | | | | Energy and Utilities: Oil — 3.5% | | | | | | | | |
| | 14,900 | | | APA Corp. | | | 448,173 | | | | 364,454 | |
| | 32,500 | | | Chevron Corp. | | | 1,362,716 | | | | 4,786,275 | |
| | 4,000 | | | ConocoPhillips | | | 73,319 | | | | 421,120 | |
| | 6,800 | | | Devon Energy Corp. | | | 69,081 | | | | 266,016 | |
| | 9,500 | | | Exxon Mobil Corp. | | | 259,983 | | | | 1,113,590 | |
| | 48,500 | | | Hess Corp. | | | 2,271,639 | | | | 6,586,300 | |
| | 1,000 | | | Innovex International Inc.† | | | 20,240 | | | | 14,680 | |
| | 16,000 | | | Marathon Petroleum Corp. | | | 201,848 | | | | 2,606,560 | |
| | 13,000 | | | TotalEnergies SE, ADR | | | 222,755 | | | | 840,060 | |
| | 1,706 | | | Vitesse Energy Inc. | | | 11,197 | | | | 40,978 | |
| | | | | | | | 4,940,951 | | | | 17,040,033 | |
| | | | | Energy and Utilities: Services — 0.8% | | | | | | | | |
| | 95,000 | | | Halliburton Co. | | | 1,866,380 | | | | 2,759,750 | |
| | 20,000 | | | MDU Resources Group Inc. | | | 401,408 | | | | 548,200 | |
| | 11,000 | | | Schlumberger NV | | | 285,160 | | | | 461,450 | |
| | | | | | | | 2,552,948 | | | | 3,769,400 | |
| | | | | Energy and Utilities: Water — 0.2% | | | | | | | | |
| | 3,600 | | | Essential Utilities Inc. | | | 26,544 | | | | 138,852 | |
| | 21,000 | | | Severn Trent plc | | | 552,900 | | | | 741,767 | |
| | | | | | | | 579,444 | | | | 880,619 | |
| | | | | Entertainment — 1.8% | | | | | | | | |
| | 20,000 | | | Atlanta Braves Holdings Inc., Cl. A† | | | 598,398 | | | | 843,000 | |
| | 14,200 | | | Atlanta Braves Holdings Inc., Cl. C† | | | 522,512 | | | | 565,160 | |
| | 105,000 | | | Grupo Televisa SAB, ADR | | | 325,572 | | | | 268,800 | |
| Shares | | | | | Cost | | | Market
Value | |
| | 6,000 | | | Madison Square Garden Entertainment Corp.† | | $ | 69,853 | | | $ | 255,180 | |
| | 3,000 | | | Madison Square Garden Sports Corp.† | | | 393,581 | | | | 624,780 | |
| | 31,250 | | | Ollamani SAB† | | | 68,682 | | | | 58,977 | |
| | 251,500 | | | Paramount Global, Cl. A | | | 4,187,877 | | | | 5,497,790 | |
| | 10,000 | | | Sphere Entertainment Co.† | | | 188,767 | | | | 441,800 | |
| | | | | | | | 6,355,242 | | | | 8,555,487 | |
| | | | | Environmental Services — 0.4% | | | | | | | | |
| | 7,500 | | | Republic Services Inc. | | | 284,610 | | | | 1,506,300 | |
| | 2,000 | | | Veralto Corp. | | | 18,596 | | | | 223,720 | |
| | | | | | | | 303,206 | | | | 1,730,020 | |
| | | | | Equipment and Supplies — 7.0% | | | | | | | | |
| | 3,600 | | | A.O. Smith Corp. | | | 9,593 | | | | 323,388 | |
| | 13,200 | | | Danaher Corp. | | | 341,335 | | | | 3,669,864 | |
| | 146,000 | | | Flowserve Corp. | | | 1,907,242 | | | | 7,546,740 | |
| | 42,000 | | | Graco Inc. | | | 730,416 | | | | 3,675,420 | |
| | 18,000 | | | Minerals Technologies Inc. | | | 784,926 | | | | 1,390,140 | |
| | 130,000 | | | Mueller Industries Inc. | | | 1,147,517 | | | | 9,633,000 | |
| | 12,300 | | | Parker-Hannifin Corp. | | | 674,953 | | | | 7,771,386 | |
| | 200 | | | Watts Water Technologies Inc., Cl. A | | | 40,495 | | | | 41,438 | |
| | | | | | | | 5,636,477 | | | | 34,051,376 | |
| | | | | Financial Services — 15.3% | | | | | | | | |
| | 20,000 | | | AllianceBernstein Holding LP | | | 35,190 | | | | 697,800 | |
| | 10,000 | | | American Express Co. | | | 152,045 | | | | 2,712,000 | |
| | 17,000 | | | Ameris Bancorp | | | 176,921 | | | | 1,060,630 | |
| | 5,195 | | | Banco Santander Chile, ADR | | | 29,250 | | | | 107,848 | |
| | 30,000 | | | Bank of America Corp. | | | 216,984 | | | | 1,190,400 | |
| | 11,500 | | | BNP Paribas SA | | | 472,765 | | | | 787,916 | |
| | 1,800 | | | EXOR NV | | | 178,716 | | | | 192,653 | |
| | 27,500 | | | Interactive Brokers Group Inc., Cl. A | | | 411,366 | | | | 3,832,400 | |
| | 8,300 | | | Jefferies Financial Group Inc. | | | 175,730 | | | | 510,865 | |
| | 6,500 | | | JPMorgan Chase & Co. | | | 126,136 | | | | 1,370,590 | |
| | 43,500 | | | Julius Baer Group Ltd. | | | 1,386,445 | | | | 2,616,116 | |
| | 56,000 | | | Loews Corp. | | | 2,059,203 | | | | 4,426,800 | |
| | 10,000 | | | M&T Bank Corp. | | | 852,893 | | | | 1,781,200 | |
| | 9,500 | | | Marsh & McLennan Companies Inc. | | | 247,231 | | | | 2,119,355 | |
| | 5,800 | | | Morgan Stanley | | | 389,904 | | | | 604,592 | |
| | 5,500 | | | Popular Inc. | | | 87,561 | | | | 551,485 | |
| | 38,000 | | | SLM Corp. | | | 179,909 | | | | 869,060 | |
| | 117,500 | | | State Street Corp. | | | 5,359,977 | | | | 10,395,225 | |
| | 6,300 | | | T. Rowe Price Group Inc. | | | 157,957 | | | | 686,259 | |
| | 282,000 | | | The Bank of New York Mellon Corp. | | | 6,988,205 | | | | 20,264,520 | |
See accompanying notes to financial statements.
The Gabelli Equity Income Fund
Schedule of Investments (Continued) — September 30, 2024
| Shares | | | | | Cost | | | Market
Value | |
| | | | | COMMON STOCKS (Continued) | | | | | | | | |
| | | | | Financial Services (Continued) | | | | | | | | |
| | 11,600 | | | The Goldman Sachs Group Inc. | | $ | 1,495,592 | | | $ | 5,743,276 | |
| | 16,500 | | | The PNC Financial Services Group Inc. | | | 1,016,634 | | | | 3,050,025 | |
| | 2,100 | | | UBS Group AG | | | 48,790 | | | | 64,661 | |
| | 53,000 | | | Valley National Bancorp | | | 331,250 | | | | 480,180 | |
| | 60,000 | | | Webster Financial Corp. | | | 1,061,598 | | | | 2,796,600 | |
| | 94,000 | | | Wells Fargo & Co. | | | 2,608,962 | | | | 5,310,060 | |
| | | | | | | | 26,247,214 | | | | 74,222,516 | |
| | | | | Food and Beverage — 15.5% | | | | | | | | |
| | 1,000 | | | Anheuser-Busch InBev SA/ NV | | | 15,876 | | | | 66,099 | |
| | 180,500 | | | Brown-Forman Corp., Cl. A | | | 3,114,696 | | | | 8,678,440 | |
| | 37,000 | | | Campbell Soup Co. | | | 1,196,233 | | | | 1,810,040 | |
| | 19,000 | | | Coca-Cola Europacific Partners plc | | | 427,500 | | | | 1,496,250 | |
| | 10,000 | | | Coca-Cola Femsa SAB de CV, ADR | | | 340,563 | | | | 887,200 | |
| | 1,400 | | | Constellation Brands Inc., Cl. A | | | 63,767 | | | | 360,766 | |
| | 29,500 | | | Danone SA | | | 1,049,467 | | | | 2,145,630 | |
| | 40,000 | | | Davide Campari-Milano NV | | | 175,755 | | | | 338,398 | |
| | 49,500 | | | Diageo plc, ADR | | | 3,063,927 | | | | 6,946,830 | |
| | 77,600 | | | Fomento Economico Mexicano SAB de CV, ADR | | | 1,872,184 | | | | 7,659,896 | |
| | 1,000 | | | General Mills Inc. | | | 26,640 | | | | 73,850 | |
| | 1,420,000 | | | Grupo Bimbo SAB de CV, Cl. A | | | 1,144,436 | | | | 4,883,098 | |
| | 91,500 | | | Heineken NV | | | 4,364,943 | | | | 8,111,591 | |
| | 132,000 | | | ITO EN Ltd. | | | 2,344,495 | | | | 3,134,569 | |
| | 3,500 | | | Kellanova | | | 168,155 | | | | 282,485 | |
| | 4,000 | | | McCormick & Co. Inc. | | | 137,120 | | | | 330,160 | |
| | 31,200 | | | McCormick & Co. Inc., Non-Voting | | | 675,130 | | | | 2,567,760 | |
| | 23,000 | | | Mondelēz International Inc., Cl. A | | | 414,324 | | | | 1,694,410 | |
| | 30,500 | | | Nestlé SA | | | 627,215 | | | | 3,061,712 | |
| | 159,000 | | | Nissin Foods Holdings Co. Ltd. | | | 1,622,492 | | | | 4,432,861 | |
| | 23,500 | | | PepsiCo Inc. | | | 1,522,039 | | | | 3,996,175 | |
| | 23,800 | | | Pernod Ricard SA | | | 2,337,623 | | | | 3,592,447 | |
| | 31,200 | | | Remy Cointreau SA | | | 1,660,939 | | | | 2,425,910 | |
| | 30,000 | | | Sapporo Holdings Ltd. | | | 664,276 | | | | 1,650,861 | |
| | 1,800 | | | The Boston Beer Co. Inc., Cl. A† | | | 564,315 | | | | 520,452 | |
| | 8,500 | | | The Coca-Cola Co. | | | 177,140 | | | | 610,810 | |
| | 1,000 | | | The Hershey Co. | | | 36,300 | | | | 191,780 | |
| | 44,500 | | | The Kraft Heinz Co. | | | 1,249,902 | | | | 1,562,395 | |
| Shares | | | | | Cost | | | Market
Value | |
| | 8,400 | | | WK Kellogg Co. | | $ | 92,816 | | | $ | 143,724 | |
| | 64,000 | | | Yakult Honsha Co. Ltd. | | | 799,840 | | | | 1,477,934 | |
| | | | | | | | 31,950,108 | | | | 75,134,533 | |
| | | | | Health Care — 4.6% | | | | | | | | |
| | 4,200 | | | Abbott Laboratories | | | 129,857 | | | | 478,842 | |
| | 3,000 | | | AbbVie Inc. | | | 74,560 | | | | 592,440 | |
| | 3,000 | | | Alcon Inc. | | | 100,034 | | | | 300,210 | |
| | 75,000 | | | Baxter International Inc. | | | 1,657,103 | | | | 2,847,750 | |
| | 4,400 | | | Bio-Rad Laboratories Inc., Cl. A† | | | 432,651 | | | | 1,472,152 | |
| | 87,500 | | | Bristol-Myers Squibb Co. | | | 2,105,675 | | | | 4,527,250 | |
| | 69,000 | | | Demant A/S† | | | 667,858 | | | | 2,695,477 | |
| | 6,400 | | | GSK plc, ADR | | | 270,041 | | | | 261,632 | |
| | 4,000 | | | Haleon plc, ADR | | | 27,891 | | | | 42,320 | |
| | 32,000 | | | Henry Schein Inc.† | | | 483,167 | | | | 2,332,800 | |
| | 16,000 | | | Merck & Co. Inc. | | | 283,402 | | | | 1,816,960 | |
| | 12,000 | | | Novartis AG, ADR | | | 554,459 | | | | 1,380,240 | |
| | 19,000 | | | Perrigo Co. plc | | | 607,908 | | | | 498,370 | |
| | 23,000 | | | Pfizer Inc. | | | 425,721 | | | | 665,620 | |
| | 42,500 | | | Roche Holding AG, ADR | | | 781,653 | | | | 1,697,875 | |
| | 2,300 | | | Zimmer Biomet Holdings Inc. | | | 193,245 | | | | 248,285 | |
| | 10,000 | | | Zimvie Inc.† | | | 86,104 | | | | 158,700 | |
| | | | | | | | 8,881,329 | | | | 22,016,923 | |
| | | | | Hotels and Gaming — 0.1% | | | | | | | | |
| | 11,500 | | | MGM Resorts International† | | | 138,744 | | | | 449,535 | |
| | 1,500 | | | Wynn Resorts Ltd. | | | 71,983 | | | | 143,820 | |
| | | | | | | | 210,727 | | | | 593,355 | |
| | | | | Machinery — 3.5% | | | | | | | | |
| | 6,000 | | | Caterpillar Inc. | | | 35,181 | | | | 2,346,720 | |
| | 45,000 | | | CNH Industrial NV | | | 510,631 | | | | 499,500 | |
| | 31,000 | | | Deere & Co. | | | 930,905 | | | | 12,937,230 | |
| | 1,000 | | | Otis Worldwide Corp. | | | 60,383 | | | | 103,940 | |
| | 7,000 | | | Xylem Inc. | | | 224,089 | | | | 945,210 | |
| | | | | | | | 1,761,189 | | | | 16,832,600 | |
| | | | | Metals and Mining — 2.3% | | | | | | | | |
| | 76,500 | | | Freeport-McMoRan Inc. | | | 969,707 | | | | 3,818,880 | |
| | 136,000 | | | Newmont Corp. | | | 3,207,852 | | | | 7,269,200 | |
| | | | | | | | 4,177,559 | | | | 11,088,080 | |
| | | | | Publishing — 0.0% | | | | | | | | |
| | 3,000 | | | Value Line Inc. | | | 41,977 | | | | 139,500 | |
| | | | | | | | | | | | | |
| | | | | Real Estate Investment Trusts — 0.4% | | | | | | | | |
| | 58,000 | | | Weyerhaeuser Co. | | | 878,950 | | | | 1,963,880 | |
| | | | | | | | | | | | | |
| | | | | Retail — 4.7% | | | | | | | | |
| | 12,500 | | | Cie Financiere Richemont SA, Cl. A | | | 420,733 | | | | 1,976,133 | |
| | 72,700 | | | Copart Inc.† | | | 160,424 | | | | 3,809,480 | |
| | 5,500 | | | Costco Wholesale Corp. | | | 249,425 | | | | 4,875,860 | |
See accompanying notes to financial statements.
The Gabelli Equity Income Fund
Schedule of Investments (Continued) — September 30, 2024
| Shares | | | | | Cost | | | Market
Value | |
| | | | | COMMON STOCKS (Continued) | | | | | | | | |
| | | | | Retail (Continued) | | | | | | | | |
| | 75,500 | | | CVS Health Corp. | | $ | 2,544,143 | | | $ | 4,747,440 | |
| | 44,600 | | | Ingles Markets Inc., Cl. A | | | 693,507 | | | | 3,327,160 | |
| | 183,000 | | | Seven & i Holdings Co. Ltd. | | | 1,837,719 | | | | 2,733,699 | |
| | 3,000 | | | The Home Depot Inc. | | | 83,470 | | | | 1,215,600 | |
| | 3,000 | | | Walmart Inc. | | | 43,340 | | | | 242,250 | |
| | | | | | | | 6,032,761 | | | | 22,927,622 | |
| | | | | Specialty Chemicals — 0.9% | | | | | | | | |
| | 2,500 | | | Albemarle Corp. | | | 25,238 | | | | 236,775 | |
| | 2,500 | | | Ashland Inc. | | | 58,813 | | | | 217,425 | |
| | 2,200 | | | FMC Corp. | | | 57,788 | | | | 145,068 | |
| | 33,500 | | | H.B. Fuller Co. | | | 691,365 | | | | 2,659,230 | |
| | 1,800 | | | NewMarket Corp. | | | 6,947 | | | | 993,402 | |
| | 600 | | | Quaker Chemical Corp. | | | 6,478 | | | | 101,094 | |
| | | | | | | | 846,629 | | | | 4,352,994 | |
| | | | | Telecommunications — 4.0% | | | | | | | | |
| | 100,000 | | | BCE Inc. | | | 1,908,279 | | | | 3,480,000 | |
| | 190,000 | | | Deutsche Telekom AG, ADR | | | 2,540,248 | | | | 5,591,700 | |
| | 72,000 | | | Liberty Global Ltd., Cl. A† | | | 1,397,649 | | | | 1,519,920 | |
| | 14,000 | | | Orange SA, ADR | | | 160,021 | | | | 160,720 | |
| | 70,000 | | | Telefonica SA, ADR | | | 293,673 | | | | 340,200 | |
| | 160,000 | | | Telephone and Data Systems Inc. | | | 1,883,466 | | | | 3,720,000 | |
| | 94,000 | | | TELUS Corp. | | | 713,431 | | | | 1,577,320 | |
| Shares | | | | | Cost | | | Market
Value | |
| | 67,500 | | | Verizon Communications Inc. | | $ | 2,155,642 | | | $ | 3,031,425 | |
| | | | | | | | 11,052,409 | | | | 19,421,285 | |
| | | | | Transportation — 2.4% | | | | | | | | |
| | 87,000 | | | GATX Corp. | | | 2,805,441 | | | | 11,523,150 | |
| | | | | | | | | | | | | |
| | | | | Wireless Communications — 0.2% | | | | | | | | |
| | 60,000 | | | BT Group plc, Cl. A | | | 157,584 | | | | 118,641 | |
| | 37,000 | | | Telesat Corp.† | | | 338,913 | | | | 487,290 | |
| | 20,000 | | | Turkcell Iletisim Hizmetleri A/S, ADR | | | 91,562 | | | | 137,600 | |
| | 3,500 | | | United States Cellular Corp.† | | | 61,863 | | | | 191,275 | |
| | | | | | | | 649,922 | | | | 934,806 | |
| | | | | TOTAL COMMON STOCKS | | | 153,625,042 | | | | 483,072,634 | |
| | | | | | | | | | | | | |
| | | | | TOTAL INVESTMENTS — 99.9% | | $ | 153,625,042 | | | | 483,072,634 | |
| | | | | | | | | | | | | |
| | | | | Other Assets and Liabilities (Net) — 0.1% | | | | | | | 622,693 | |
| | | | | | | | | | | | | |
| | | | | NET ASSETS — 100.0% | | | | | | $ | 483,695,327 | |
| † | Non-income producing security. |
| | |
| ADR | American Depositary Receipt |
See accompanying notes to financial statements.
The Gabelli Equity Income Fund
Statement of Assets and Liabilities
September 30, 2024
| Assets: | | | | |
| Investments, at value (cost $153,625,042) | | $ | 483,072,634 | |
| Cash | | | 3,573 | |
| Receivable for Fund shares sold | | | 2,360,079 | |
| Receivable for investments sold | | | 528,322 | |
| Dividends and interest receivable | | | 1,481,217 | |
| Prepaid expenses | | | 87,163 | |
| Total Assets | | | 487,532,988 | |
| Liabilities: | | | | |
| Line of credit payable | | | 2,524,000 | |
| Payable for investments purchased | | | 14,260 | |
| Payable for Fund shares redeemed | | | 586,251 | |
| Payable for investment advisory fees | | | 398,366 | |
| Payable for distribution fees | | | 75,446 | |
| Payable for accounting fees | | | 11,250 | |
| Other accrued expenses | | | 228,088 | |
| Total Liabilities | | | 3,837,661 | |
| Net Assets | | | | |
| (applicable to 69,342,042 shares outstanding) | | $ | 483,695,327 | |
| | | | | |
| Net Assets Consist of: | | | | |
| Paid-in capital | | $ | 158,450,143 | |
| Total distributable earnings | | | 325,245,184 | |
| Net Assets | | $ | 483,695,327 | |
| | | | | |
| Shares of Capital Stock, each at $0.001 par value: | | | | |
| Class AAA: | | | | |
| Net Asset Value, offering, and redemption price per share ($193,593,149 ÷ 29,374,008 shares outstanding; 150,000,000 shares authorized) | | $ | 6.59 | |
| Class A: | | | | |
| Net Asset Value and redemption price per share ($121,991,809 ÷ 18,909,725 shares outstanding; 50,000,000 shares authorized) | | $ | 6.45 | |
| Maximum offering price per share (NAV ÷ 0.9425, based on maximum sales charge of 5.75% of the offering price) | | $ | 6.84 | |
| Class C: | | | | |
| Net Asset Value and offering price per share ($12,225,866 ÷ 1,553,159 shares outstanding; 50,000,000 shares authorized) | | $ | 7.87 | (a) |
| Class I: | | | | |
| Net Asset Value, offering, and redemption price per share ($155,884,503 ÷ 19,505,150 shares outstanding; 50,000,000 shares authorized) | | $ | 7.99 | |
| (a) | Redemption price varies based on the length of time held. |
Statement of Operations
For the Year Ended September 30, 2024
| Investment Income: | | | | |
| Dividends (net of foreign withholding taxes of $273,863) | | $ | 10,860,503 | |
| Interest | | | 34,436 | |
| Total Investment Income | | | 10,894,939 | |
| Expenses: | | | | |
| Investment advisory fees | | | 4,963,427 | |
| Distribution fees - Class AAA | | | 550,912 | |
| Distribution fees - Class A | | | 315,683 | |
| Distribution fees - Class C | | | 57,498 | |
| Distribution fees - Class C1 | | | 116,287 | |
| Shareholder services fees | | | 404,470 | |
| Shareholder communications expenses | | | 138,612 | |
| Legal and audit fees | | | 96,013 | |
| Custodian fees | | | 59,424 | |
| Accounting fees | | | 45,000 | |
| Directors’ fees | | | 36,228 | |
| Registration expenses | | | 29,009 | |
| Interest expense | | | 23,278 | |
| Miscellaneous expenses | | | 64,973 | |
| Total Expenses | | | 6,900,814 | |
| Less: | | | | |
| Expenses paid indirectly by broker (See Note 6) | | | (8,247 | ) |
| Net Expenses | | | 6,892,567 | |
| Net Investment Income | | | 4,002,372 | |
| | | | | |
| Net Realized and Unrealized Gain on Investments and Foreign Currency: | | | | |
| Net realized gain on investments | | | 61,357,052 | |
| Net realized gain on foreign currency transactions | | | 1,657 | |
| Net realized gain on investments and foreign currency transactions | | | 61,358,709 | |
| Net change in unrealized appreciation/depreciation: | | | | |
| on investments | | | 23,917,194 | |
| on foreign currency translations | | | 31,367 | |
| Net change in unrealized appreciation/depreciation on investments and foreign currency translations | | | 23,948,561 | |
| Net Realized and Unrealized Gain on Investments and Foreign Currency | | | 85,307,270 | |
| Net Increase in Net Assets Resulting from Operations | | $ | 89,309,642 | |
See accompanying notes to financial statements.
The Gabelli Equity Income Fund
Statement of Changes in Net Assets
| | | Year Ended
September 30,
2024 | | | Year Ended
September 30,
2023 | |
| Operations: | | | | | | | | |
| Net investment income | | $ | 4,002,372 | | | $ | 4,950,182 | |
| Net realized gain on investments and foreign currency transactions | | | 61,358,709 | | | | 43,102,333 | |
| Net change in unrealized appreciation/depreciation on investments and foreign currency translations | | | 23,948,561 | | | | 11,162,508 | |
| Net Increase in Net Assets Resulting from Operations | | | 89,309,642 | | | | 59,215,023 | |
| | | | | | | | | |
| Distributions to Shareholders: | | | | | | | | |
| Accumulated earnings | | | | | | | | |
| Class AAA | | | (28,668,097 | ) | | | (21,408,216 | ) |
| Class A | | | (16,654,021 | ) | | | (9,925,480 | ) |
| Class C | | | (640,197 | ) | | | (23,419 | ) |
| Class C1* | | | (5,137,841 | ) | | | (6,357,512 | ) |
| Class I | | | (14,166,260 | ) | | | (10,928,078 | ) |
| | | | (65,266,416 | ) | | | (48,642,705 | ) |
| Return of capital | | | | | | | | |
| Class AAA | | | (28,340,476 | ) | | | (29,821,849 | ) |
| Class A | | | (17,923,631 | ) | | | (14,580,547 | ) |
| Class C | | | (1,672,009 | ) | | | (33,597 | ) |
| Class C1* | | | (245,797 | ) | | | (5,018,493 | ) |
| Class I | | | (21,363,202 | ) | | | (16,447,112 | ) |
| | | | (69,545,115 | ) | | | (65,901,598 | ) |
| Total Distributions to Shareholders | | | (134,811,531 | ) | | | (114,544,303 | ) |
| | | | | | | | | |
| Capital Share Transactions: | | | | | | | | |
| Class AAA | | | (14,758,999 | ) | | | 19,288,612 | |
| Class A | | | 19,806,469 | | | | 32,868,398 | |
| Class C | | | 12,897,516 | | | | 699,312 | |
| Class C1* | | | (17,669,929 | ) | | | (3,091,637 | ) |
| Class I | | | 31,455,787 | | | | 16,984,005 | |
| Net Increase in Net Assets from Capital Share Transactions | | | 31,730,844 | | | | 66,748,690 | |
| | | | | | | | | |
| Redemption Fees | | | 257 | | | | 204 | |
| | | | | | | | | |
| Net Increase/(Decrease) in Net Assets | | | (13,770,788 | ) | | | 11,419,614 | |
| | | | | | | | | |
| Net Assets: | | | | | | | | |
| Beginning of year | | | 497,466,115 | | | | 486,046,501 | |
| End of year | | $ | 483,695,327 | | | $ | 497,466,115 | |
| * | On May 29, 2024, Class C1 shares converted into Class C shares. See Note 8. |
See accompanying notes to financial statements.
The Gabelli Equity Income Fund
Financial Highlights
Selected data for a share of capital stock outstanding throughout each year:
| | | | | | | Income (Loss) from Investment Operations | | | Distributions | | | | | | | | | | | | | | | Ratios to Average Net Assets/Supplemental Data | |
| Year Ended September 30 | | Net Asset Value,
Beginning
of Year | | | Net Investment
Income
(Loss)(a) | | | Net Realized
and Unrealized
Gain (Loss) on
Investments | | | Total from
Investment
Operations | | | Net Investment
Income | | | Net Realized
Gain on
Investments | | | Return of
Capital | | | Total
Distributions | | | Redemption
Fees(a)(b) | | | Net Asset Value,
End of Year | | | Total
Return† | | | Net Assets,
End of Year
(in 000’s) | | | Net Investment
Income (Loss) | | | Operating
Expenses(c)(d) | | | Portfolio
Turnover
Rate | |
| Class AAA | | | | | | | | | | | | | | | | | | | | | | | | | | | | | | | | | | | | | | | | | | | | | | | | | | | | | | | | | | | | |
| 2024 | | $ | 7.29 | | | $ | 0.06 | | | $ | 1.25 | | | $ | 1.31 | | | $ | (0.06 | ) | | $ | (0.90 | ) | | $ | (1.05 | ) | | $ | (2.01 | ) | | $ | 0.00 | | | $ | 6.59 | | | | 19.64 | % | | $ | 193,593 | | | | 0.77 | % | | | 1.43 | % | | | 1 | % |
| 2023 | | | 8.09 | | | | 0.08 | | | | 0.91 | | | | 0.99 | | | | (0.08 | ) | | | (0.67 | ) | | | (1.04 | ) | | | (1.79 | ) | | | 0.00 | | | | 7.29 | | | | 11.92 | | | | 227,248 | | | | 0.89 | | | | 1.43 | | | | 5 | |
| 2022 | | | 10.85 | | | | 0.06 | | | | (1.01 | ) | | | (0.95 | ) | | | (0.06 | ) | | | (0.78 | ) | | | (0.97 | ) | | | (1.81 | ) | | | 0.00 | | | | 8.09 | | | | (10.08 | ) | | | 230,926 | | | | 0.56 | | | | 1.42 | | | | 1 | |
| 2021 | | | 10.04 | | | | 0.07 | | | | 3.00 | | | | 3.07 | | | | (0.08 | ) | | | (1.24 | ) | | | (0.94 | ) | | | (2.26 | ) | | | 0.00 | | | | 10.85 | | | | 31.32 | | | | 297,369 | | | | 0.64 | | | | 1.42 | | | | 1 | |
| 2020 | | | 13.61 | | | | 0.10 | (e) | | | (0.02 | ) | | | 0.08 | | | | (0.11 | ) | | | (2.39 | ) | | | (1.15 | ) | | | (3.65 | ) | | | 0.00 | | | | 10.04 | | | | 0.93 | | | | 272,980 | | | | 0.75 | (e) | | | 1.45 | | | | 0 | (f) |
| Class A | | | | | | | | | | | | | | | | | | | | | | | | | | | | | | | | | | | | | | | | | | | | | | | | | | | | | | | | | | | | |
| 2024 | | $ | 7.16 | | | $ | 0.06 | | | $ | 1.22 | | | $ | 1.28 | | | $ | (0.06 | ) | | $ | (0.89 | ) | | $ | (1.04 | ) | | $ | (1.99 | ) | | $ | 0.00 | | | $ | 6.45 | | | | 19.52 | % | | $ | 121,992 | | | | 0.77 | % | | | 1.43 | % | | | 1 | % |
| 2023 | | | 7.96 | | | | 0.07 | | | | 0.91 | | | | 0.98 | | | | (0.08 | ) | | | (0.67 | ) | | | (1.03 | ) | | | (1.78 | ) | | | 0.00 | | | | 7.16 | | | | 11.94 | | | | 114,513 | | | | 0.90 | | | | 1.43 | | | | 5 | |
| 2022 | | | 10.69 | | | | 0.06 | | | | (0.99 | ) | | | (0.93 | ) | | | (0.06 | ) | | | (0.77 | ) | | | (0.97 | ) | | | (1.80 | ) | | | 0.00 | | | | 7.96 | | | | (10.05 | ) | | | 95,186 | | | | 0.57 | | | | 1.42 | | | | 1 | |
| 2021 | | | 9.92 | | | | 0.08 | | | | 2.95 | | | | 3.03 | | | | (0.08 | ) | | | (1.24 | ) | | | (0.94 | ) | | | (2.26 | ) | | | 0.00 | | | | 10.69 | | | | 31.31 | | | | 98,631 | | | | 0.65 | | | | 1.42 | | | | 1 | |
| 2020 | | | 13.49 | | | | 0.10 | (e) | | | (0.02 | ) | | | 0.08 | | | | (0.11 | ) | | | (2.39 | ) | | | (1.15 | ) | | | (3.65 | ) | | | 0.00 | | | | 9.92 | | | | 0.95 | | | | 69,201 | | | | 0.75 | (e) | | | 1.45 | | | | 0 | (f) |
| Class C | | | | | | | | | | | | | | | | | | | | | | | | | | | | | | | | | | | | | | | | | | | | | | | | | | | | | | | | | | | | |
| 2024 | | $ | 8.58 | | | $ | 0.01 | | | $ | 1.49 | | | $ | 1.50 | | | $ | (0.01 | ) | | $ | (0.83 | ) | | $ | (1.37 | ) | | $ | (2.21 | ) | | $ | 0.00 | | | $ | 7.87 | | | | 19.18 | % | | $ | 12,226 | | | | 0.10 | % | | | 2.18 | % | | | 1 | % |
| 2023(g) | | | 9.52 | | | | 0.01 | | | | 0.16 | | | | 0.17 | | | | (0.07 | ) | | | (0.55 | ) | | | (0.49 | ) | | | (1.11 | ) | | | 0.00 | | | | 8.58 | | | | 1.67 | | | | 608 | | | | 0.24 | (h) | | | 2.29 | (h) | | | 5 | |
| Class C1* | | | | | | | | | | | | | | | | | | | | | | | | | | | | | | | | | | | | | | | | | | | | | | | | | | | | | | | | | | | | |
| 2023 | | $ | 3.41 | | | $ | 0.00 | (b) | | $ | 0.42 | | | $ | 0.42 | | | $ | (0.07 | ) | | $ | (0.67 | ) | | $ | (0.60 | ) | | $ | (1.34 | ) | | $ | 0.00 | | | $ | 2.49 | | | | 11.34 | % | | $ | 21,071 | | | | 0.13 | % | | | 2.18 | % | | | 5 | % |
| 2022 | | | 5.24 | | | | (0.01 | ) | | | (0.42 | ) | | | (0.43 | ) | | | (0.04 | ) | | | (0.78 | ) | | | (0.58 | ) | | | (1.40 | ) | | | 0.00 | | | | 3.41 | | | | (10.84 | ) | | | 31,620 | | | | (0.21 | ) | | | 2.17 | | | | 1 | |
| 2021 | | | 5.81 | | | | (0.01 | ) | | | 1.70 | | | | 1.69 | | | | (0.05 | ) | | | (1.24 | ) | | | (0.97 | ) | | | (2.26 | ) | | | 0.00 | | | | 5.24 | | | | 30.29 | | | | 51,140 | | | | (0.12 | ) | | | 2.17 | | | | 1 | |
| 2020 | | | 9.48 | | | | 0.00 | (b)(e) | | | (0.02 | ) | | | (0.02 | ) | | | (0.06 | ) | | | (2.39 | ) | | | (1.20 | ) | | | (3.65 | ) | | | 0.00 | | | | 5.81 | | | | 0.27 | | | | 53,605 | | | | 0.00 | (e)(i) | | | 2.20 | | | | 0 | (f) |
| Class I | | | | | | | | | | | | | | | | | | | | | | | | | | | | | | | | | | | | | | | | | | | | | | | | | | | | | | | | | | | | |
| 2024 | | $ | 8.61 | | | $ | 0.09 | | | $ | 1.51 | | | $ | 1.60 | | | $ | (0.08 | ) | | $ | (0.88 | ) | | $ | (1.26 | ) | | $ | (2.22 | ) | | $ | 0.00 | | | $ | 7.99 | | | | 19.85 | % | | $ | 155,884 | | | | 1.01 | % | | | 1.18 | % | | | 1 | % |
| 2023 | | | 9.36 | | | | 0.12 | | | | 1.04 | | | | 1.16 | | | | (0.09 | ) | | | (0.67 | ) | | | (1.15 | ) | | | (1.91 | ) | | | 0.00 | | | | 8.61 | | | | 12.19 | | | | 134,026 | | | | 1.14 | | | | 1.18 | | | | 5 | |
| 2022 | | | 12.35 | | | | 0.10 | | | | (1.17 | ) | | | (1.07 | ) | | | (0.08 | ) | | | (0.77 | ) | | | (1.06 | ) | | | (1.92 | ) | | | 0.00 | | | | 9.36 | | | | (9.81 | ) | | | 128,315 | | | | 0.81 | | | | 1.17 | | | | 1 | |
| 2021 | | | 11.15 | | | | 0.12 | | | | 3.34 | | | | 3.46 | | | | (0.11 | ) | | | (1.24 | ) | | | (0.91 | ) | | | (2.26 | ) | | | 0.00 | | | | 12.35 | | | | 31.71 | | | | 134,073 | | | | 0.89 | | | | 1.17 | | | | 1 | |
| 2020 | | | 14.68 | | | | 0.14 | (e) | | | (0.02 | ) | | | 0.12 | | | | (0.14 | ) | | | (2.39 | ) | | | (1.12 | ) | | | (3.65 | ) | | | 0.00 | | | | 11.15 | | | | 1.14 | | | | 130,903 | | | | 1.00 | (e) | | | 1.20 | | | | 0 | (f) |
| * | On May 29, 2024, Class C1 shares converted into Class C shares. See Note 8. |
| † | Total return represents aggregate total return of a hypothetical investment at the beginning of the year and sold at the end of the year including reinvestment of distributions and does not reflect the applicable sales charges. |
| (a) | Per share amounts have been calculated using the average shares outstanding method. |
| (b) | Amount represents less than $0.005 per share. |
| (c) | The Fund received credits from a designated broker who agreed to pay certain Fund operating expenses. For all periods presented, there was no material impact on the expense ratios. |
| (d) | The Fund incurred interest expense during all fiscal years presented. If interest expense had not been incurred, the ratio of operating expenses to average net assets would have been, 1.42%, 1.42%, 1.41%, 1.41%, and 1.42%, (Class AAA and Class A), 2.17%, 2.16%, 2.16%, and 2.17%, (Class C1), 1.17%, 1.17%, 1.16%, 1.16%, 1.17% (Class I), and 2.17%, and 2.29% (Class C), respectively. |
| (e) | Includes income resulting from special dividends. Without these dividends, the per share income (loss) amounts would have been $0.09 (Class AAA and Class A), $(0.01) (Class C), and $0.13 (Class I), respectively, and the net investment income (loss) ratio would have been 0.68% (Class AAA and Class A), (0.07)% (Class C), and 0.93% (Class I), respectively. |
| (f) | Amount represents less than 0.5%. |
| (g) | Class C commenced on June 1, 2023. |
| (h) | Annualized. |
| (i) | Amount represents less than 0.005%. |
See accompanying notes to financial statements.
The Gabelli Equity Income Fund
Notes to Financial Statements
1. Organization. The Gabelli Equity Income Fund (the “Fund”), a series of the Gabelli Equity Series Funds, Inc. (the Corporation), was incorporated on July 25, 1991 in Maryland. The Fund is a diversified open-end management investment company registered under the Investment Company Act of 1940, as amended (the 1940 Act), and is one of four separately managed portfolios (collectively, the Portfolios) of the Corporation. The Fund seeks to provide a high level of total return on its assets with an emphasis on income. The Fund commenced investment operations on January 2, 1992.
Gabelli Funds, LLC (the “Adviser”), with its principal offices located at One Corporate Center, Rye, New York 10580-1422, serves as investment adviser to the Fund. The Adviser makes investment decisions for the Fund and continuously reviews and administers the Funds’ investment program and manages the operations of each Fund under the general supervision of the Company’s Board.
2. Significant Accounting Policies. As an investment company, the Fund follows the investment company accounting and reporting guidance, which is part of U.S. generally accepted accounting principles (GAAP) that may require the use of management estimates and assumptions in the preparation of its financial statements. Actual results could differ from those estimates. The following is a summary of significant accounting policies followed by the Fund in the preparation of its financial statements.
Security Valuation. Portfolio securities listed or traded on a nationally recognized securities exchange or traded in the U.S. over-the-counter market for which market quotations are readily available are valued at the last quoted sale price or a market’s official closing price as of the close of business on the day the securities are being valued. If there were no sales that day, the security is valued at the average of the closing bid and asked prices or, if there were no asked prices quoted on that day, then the security is valued at the closing bid price on that day. If no bid or asked prices are quoted on such day, the security is valued at the most recently available price or, if the Board of Directors (the Board) so determines, by such other method as the Board shall determine in good faith to reflect its fair market value. Portfolio securities traded on more than one national securities exchange or market are valued according to the broadest and most representative market, as determined by the Adviser.
Portfolio securities primarily traded on a foreign market are generally valued at the preceding closing values of such securities on the relevant market, but may be fair valued pursuant to procedures established by the Board if market conditions change significantly after the close of the foreign market, but prior to the close of business on the day the securities are being valued. Debt obligations for which market quotations are readily available are valued at the average of the latest bid and asked prices. If there were no asked prices quoted on such day, the security is valued using the closing bid price, unless the Board determines such amount does not reflect the securities’ fair value, in which case these securities will be fair valued as determined by the Board. Certain securities are valued principally using dealer quotations. Futures contracts are valued at the closing settlement price of the exchange or board of trade on which the applicable contract is traded. OTC futures and options on futures for which market quotations are readily available will be valued by quotations received from a pricing service or, if no quotations are available from a pricing service, by quotations obtained from one of more dealers in the instrument in question by the Adviser.
Securities and assets for which market quotations are not readily available are fair valued as determined by the Board. Fair valuation methodologies and procedures may include, but are not limited to: analysis and review of available financial and non-financial information about the company; comparisons with the valuation and changes in valuation of similar securities, including a comparison of foreign securities with the equivalent U.S.
The Gabelli Equity Income Fund
Notes to Financial Statements (Continued)
dollar value American Depositary Receipt securities at the close of the U.S. exchange; and evaluation of any other information that could be indicative of the value of the security.
The inputs and valuation techniques used to measure fair value of the Fund’s investments are summarized into three levels as described in the hierarchy below:
| ● | Level 1 — quoted prices in active markets for identical securities; |
| ● | Level 2 — other significant observable inputs (including quoted prices for similar securities, interest rates, prepayment speeds, credit risk, etc.); and |
| ● | Level 3 — significant unobservable inputs (including the Board’s determinations as to the fair value of investments). |
A financial instrument’s level within the fair value hierarchy is based on the lowest level of any input both individually and in the aggregate that is significant to the fair value measurement. The inputs or methodology used for valuing securities are not necessarily an indication of the risk associated with investing in those securities. The summary of the Fund’s investments in securities by inputs used to value the Fund’s investments as of September 30, 2024 is as follows:
| | | Valuation Inputs | | | Total | |
| | | Level 1
Quoted Prices | | | Market Value at 09/30/24 | |
| INVESTMENTS IN SECURITIES: | | | | | | | | |
| ASSETS (Market Value): | | | | | | | | |
| Common Stocks (a) | | $ | 483,072,634 | | | $ | 483,072,634 | |
| TOTAL INVESTMENTS SECURITIES – ASSETS | | $ | 483,072,634 | | | $ | 483,072,634 | |
| (a) | Please refer to the Schedule of Investments for the industry classifications of these portfolio holdings. |
Additional Information to Evaluate Qualitative Information.
General. The Fund uses recognized industry pricing services – approved by the Board and unaffiliated with the Adviser – to value most of its securities, and uses broker quotes provided by market makers of securities not valued by these and other recognized pricing sources. Several different pricing feeds are received to value domestic equity securities, international equity securities, preferred equity securities, and fixed income securities. The data within these feeds are ultimately sourced from major stock exchanges and trading systems where these securities trade. The prices supplied by external sources are checked by obtaining quotations or actual transaction prices from market participants. If a price obtained from the pricing source is deemed unreliable, prices will be sought from another pricing service or from a broker/dealer that trades that security or similar securities.
Fair Valuation. Fair valued securities may be common or preferred equities, warrants, options, rights, or fixed income obligations. Where appropriate, Level 3 securities are those for which market quotations are not available, such as securities not traded for several days, or for which current bids are not available, or which are restricted as to transfer. When fair valuing a security, factors to consider include recent prices of comparable securities that are publicly traded, reliable prices of securities not publicly traded, the use of valuation models, current analyst reports, valuing the income or cash flow of the issuer, or cost if the preceding factors do not apply. A significant change in the unobservable inputs could result in a lower or higher value in Level 3 securities. The
The Gabelli Equity Income Fund
Notes to Financial Statements (Continued)
circumstances of Level 3 securities are frequently monitored to determine if fair valuation measures continue to apply.
The Adviser reports quarterly to the Board the results of the application of fair valuation policies and procedures. These may include backtesting the prices realized in subsequent trades of these fair valued securities to fair values previously recognized.
Securities Sold Short. The Fund enters into short sale transactions. Short selling involves selling securities that may or may not be owned and, at times, borrowing the same securities for delivery to the purchaser, with an obligation to replace such borrowed securities at a later date. The proceeds received from short sales are recorded as liabilities and the Fund records an unrealized gain or loss to the extent of the difference between the proceeds received and the value of an open short position on the day of determination. The Fund records a realized gain or loss when the short position is closed out. By entering into a short sale, the Fund bears the market risk of an unfavorable change in the price of the security sold short. Dividends on short sales are recorded as an expense by the Fund on the ex-dividend date and interest expense is recorded on the accrual basis. The broker retains collateral for the value of the open positions, which is adjusted periodically as the value of the position fluctuates. At September 30, 2024, there were no short sales outstanding.
Foreign Currency Translations. The books and records of the Fund are maintained in U.S. dollars. Foreign currencies, investments, and other assets and liabilities are translated into U.S. dollars at current exchange rates. Purchases and sales of investment securities, income, and expenses are translated at the exchange rate prevailing on the respective dates of such transactions. Unrealized gains and losses that result from changes in foreign exchange rates and/or changes in market prices of securities have been included in unrealized appreciation/depreciation on investments and foreign currency translations. Net realized foreign currency gains and losses resulting from changes in exchange rates include foreign currency gains and losses between trade date and settlement date on investment securities transactions, foreign currency transactions, and the difference between the amounts of interest and dividends recorded on the books of the Fund and the amounts actually received. The portion of foreign currency gains and losses related to fluctuation in exchange rates between the initial purchase trade date and subsequent sale trade date is included in realized gain/(loss) on investments.
Foreign Securities. The Fund may directly purchase securities of foreign issuers. Investing in securities of foreign issuers involves special risks not typically associated with investing in securities of U.S. issuers. The risks include possible revaluation of currencies, the inability to repatriate funds, less complete financial information about companies, and possible future adverse political and economic developments. Moreover, securities of many foreign issuers and their markets may be less liquid and their prices more volatile than securities of comparable U.S. issuers.
Foreign Taxes. The Fund may be subject to foreign taxes on income, gains on investments, or currency repatriation, a portion of which may be recoverable. The Fund will accrue such taxes and recoveries as applicable, based upon its current interpretation of tax rules and regulations that exist in the markets in which it invests.
Restricted Securities. The Fund may invest up to 15% of its net assets in securities for which the markets are restricted. Restricted securities include securities whose disposition is subject to substantial legal or contractual restrictions. The sale of restricted securities often requires more time and results in higher brokerage charges or dealer discounts and other selling expenses than the sale of securities eligible for trading on national securities exchanges or in the over-the-counter markets. Restricted securities may sell at a price lower than similar
The Gabelli Equity Income Fund
Notes to Financial Statements (Continued)
securities that are not subject to restrictions on resale. Securities freely saleable among qualified institutional investors under special rules adopted by the SEC may be treated as liquid if they satisfy liquidity standards established by the Board. The continued liquidity of such securities is not as well assured as that of publicly traded securities, and accordingly the Board will monitor their liquidity. At September 30, 2024, the Fund did not hold any restricted securities.
Securities Transactions and Investment Income. Securities transactions are accounted for on the trade date with realized gain/(loss) on investments determined by using the identified cost method. Interest income (including amortization of premium and accretion of discount) is recorded on an accrual basis. Premiums and discounts on debt securities are amortized using the effective yield to maturity method or amortized to earliest call date, if applicable. Dividend income is recorded on the ex-dividend date, except for certain dividends from foreign securities that are recorded as soon after the ex-dividend date as the Fund becomes aware of such dividends.
Determination of Net Asset Value and Calculation of Expenses. Certain administrative expenses are common to, and allocated among, various affiliated funds. Such allocations are made on the basis of each fund’s average net assets or other criteria directly affecting the expenses as determined by the Adviser pursuant to procedures established by the Board.
In calculating the NAV per share of each class, investment income, realized and unrealized gains and losses, redemption fees, and expenses other than class specific expenses are allocated daily to each class of shares based upon the proportion of net assets of each class at the beginning of each day. Distribution expenses are borne solely by the class incurring the expense.
Distributions to Shareholders. Distributions to shareholders are recorded on the ex-dividend date. The characterization of distributions to shareholders is based on income and capital gains as determined in accordance with federal income tax regulations, which may differ from income and capital gains as determined under GAAP. These differences are primarily due to differing treatments of income and gains on various investment securities and foreign currency transactions held by the Fund, timing differences, and differing characterizations of distributions made by the Fund. Distributions from net investment income for federal income tax purposes include net realized gains on foreign currency transactions. These book/tax differences are either temporary or permanent in nature. To the extent these differences are permanent, adjustments are made to the appropriate capital accounts in the period when the differences arise. Permanent differences were primarily due to re-designation of dividends paid, reversal of prior year Real Estate Investment Trust distributions to capital gain, and non-deductible partnership expense. These reclassifications have no impact on the NAV of the Fund. For the fiscal year ended September 30, 2024, reclassifications were made to decrease paid-in capital by $21,620, with an offsetting adjustment to total distributable earnings.
The Gabelli Equity Income Fund
Notes to Financial Statements (Continued)
The Fund has a fixed distribution policy. Under the policy, the Fund declares and pays monthly distributions from net investment income, capital gains, and paid-in capital. The actual source of the distribution is determined after the end of the calendar year. Pursuant to this policy, distributions during the calendar year are made in excess of required distributions. To the extent such distributions are made from current earnings and profits, they are considered ordinary income or long term capital gains. Distributions sourced from paid-in capital should not be considered as dividend yield or the total return from an investment in the Fund. The Board continues to evaluate its distribution policy in light of ongoing economic and market conditions and may change the amount of the monthly distributions in the future.
The tax character of distributions paid during the fiscal years ended September 30, 2024 and 2023 was as follows:
| | | Year ended
September 30,
2024 | | | Year ended
September 30,
2023 | |
| Distributions paid from: | | | | | | | | |
| Ordinary income | | $ | 4,497,175 | | | $ | 5,241,338 | |
| Net long term capital gains | | | 60,769,241 | | | | 43,401,367 | |
| Return of capital | | | 69,545,115 | | | | 65,901,598 | |
| Total distributions paid | | $ | 134,811,531 | | | $ | 114,544,303 | |
Provision for Income Taxes. The Fund intends to continue to qualify as a regulated investment company under Subchapter M of the Internal Revenue Code of 1986, as amended (the Code). It is the policy of the Fund to comply with the requirements of the Code applicable to regulated investment companies and to distribute substantially all of its net investment company taxable income and net capital gains. Therefore, no provision for federal income taxes is required.
At September 30, 2024, the components of accumulated earnings/losses on a tax basis were as follows:
| Net unrealized appreciation on investments and foreign currency translations | | $ | 325,245,184 | |
| Total | | $ | 325,245,184 | |
At September 30, 2024, the temporary difference between book basis and tax basis net unrealized appreciation on investments was due to deferral of losses from wash sales for tax purposes and tax basis adjustments on investments in partnerships.
The following summarizes the tax cost of investments and the related net unrealized appreciation at September 30, 2024:
| | | | Cost | | | Gross
Unrealized
Appreciation | | | Gross
Unrealized
Depreciation | | | Net
Unrealized
Appreciation | |
| Investments | | | $ | 157,854,362
| | | $ | 335,478,434 | | | $ | (10,260,162 | ) | | $ | 325,218,272 | |
The Gabelli Equity Income Fund
Notes to Financial Statements (Continued)
The Fund is required to evaluate tax positions taken or expected to be taken in the course of preparing the Fund’s tax returns to determine whether the tax positions are “more-likely-than-not” of being sustained by the applicable tax authority. Income tax and related interest and penalties would be recognized by the Fund as tax expense in the Statement of Operations if the tax positions were deemed not to meet the more-likely-than-not threshold. During the fiscal year ended September 30, 2024, the Fund did not incur any income tax, interest, or penalties. As of September 30, 2024, the Adviser has reviewed all open tax years and concluded that there was no impact to the Fund’s net assets or results of operations. The Fund’s federal and state tax returns for the prior three fiscal years remain open, subject to examination. On an ongoing basis, the Adviser will monitor the Fund’s tax positions to determine if adjustments to this conclusion are necessary.
3. Investment Advisory Agreement and Other Transactions. The Fund has entered into an investment advisory agreement (the Advisory Agreement) with the Adviser which provides that the Fund will pay the Adviser a fee, computed daily and paid monthly, at the annual rate of 1.00% of the value of its average daily net assets. In accordance with the Advisory Agreement, the Adviser provides a continuous investment program for the Fund’s portfolio, oversees the administration of all aspects of the Fund’s business and affairs, and pays the compensation of all Officers and Directors of the Fund who are affiliated persons of the Adviser.
4. Distribution Plan. The Fund’s Board has adopted a distribution plan (the Plan) for each class of shares, except for Class I Shares, pursuant to Rule 12b-1 under the 1940 Act. Under the Class AAA, Class A, and Class C Share Plans, payments are authorized to G.distributors, LLC (the Distributor), an affiliate of the Adviser, at annual rates of 0.25%, 0.25%, and 1.00%, respectively, of the average daily net assets of those classes, the annual limitations under each Plan. Such payments are accrued daily and paid monthly.
5. Portfolio Securities. Purchases and sales of securities during the fiscal year ended September 30, 2024, other than short term securities and U.S. Government obligations, aggregated $3,324,083 and $98,561,058, respectively.
6. Transactions with Affiliates and Other Arrangements. During the fiscal year ended September 30, 2024, the Fund paid $13,487 in brokerage commissions on security trades to G.research, LLC, an affiliate of the Adviser. Additionally, the Distributor retained a total of $125,150 from investors representing commissions (sales charges and underwriting fees) on sales and redemptions of Fund shares.
During the fiscal year ended September 30, 2024, the Fund received credits from a designated broker who agreed to pay certain Fund operating expenses. The amount of such expenses paid through this directed brokerage arrangement during this period was $8,247.
The cost of calculating the Fund’s NAV per share is a Fund expense pursuant to the Advisory Agreement. During the fiscal year ended September 30, 2024, the Fund accrued $45,000, in connection with the cost of computing the Fund’s NAV.
The Corporation pays retainer and per meeting fees to Directors not affiliated with the Adviser, plus specified amounts to the Lead Director and Audit Committee Chairman. Directors are also reimbursed for out of pocket expenses incurred in attending meetings. Directors who are directors or employees of the Adviser or an affiliated company receive no compensation or expense reimbursement from the Corporation.
7. Line of Credit. The Fund participates in an unsecured line of credit, which expires on February 26, 2025 and may be renewed annually, of up to $75,000,000 under which it may borrow up to 10% of its net assets from
The Gabelli Equity Income Fund
Notes to Financial Statements (Continued)
the bank for temporary borrowing purposes. Borrowings under this arrangement bear interest at a floating rate equal to the higher of the Overnight Federal Funds Rate plus 135 basis points or the Overnight Bank Funding Rate plus 135 basis points in effect on that day. This amount, if any, would be included in “Interest expense” in the Statement of Operations. At September 30, 2024, there was $2,524,000 outstanding under the line of credit.
The average daily amount of borrowings outstanding under the line of credit for 159 days of borrowings during the fiscal year ended September 30, 2024 was $1,523,107 with a weighted average interest rate of 6.55%. The maximum amount borrowed at any time during the fiscal year ended September 30, 2024 was $8,936,000.
8. Capital Stock. The Fund offers four classes of shares – Class AAA Shares, Class A Shares, Class C Shares, and Class I Shares. On March 13, 2023, Class C shares were renamed Class C1 shares, and effective March 15 through May 30, 2023, the Fund temporarily reopened its Class C1 shares to purchases by new investors. After May 30, 2023, neither new nor existing shareholders may purchase additional C1 shares. Class C shares were issued beginning May 30, 2023. These changes have no effect on existing Class C1 shareholders’ ability to redeem these shares. Class AAA and Class I shares are offered without a sales charge. Class A Shares are subject to a maximum front-end sales charge of 5.75%. Class C Shares are subject to a 1.00% contingent deferred sales charge for one year after purchase. On May 29, 2024 shareholders owning Class C1 shares had their Class C1 shares converted to Class C shares of the fund equal to the aggregate value of each shareholder’s Class C1 shares.
The Fund imposes a redemption fee of 2.00% on all classes of shares that are redeemed or exchanged on or before the seventh day after the date of a purchase. The redemption fee is deducted from the proceeds otherwise payable to the redeeming shareholders and is retained by the Fund as an increase in paid-in capital. The redemption fees retained by the Fund during the fiscal years ended September 30, 2024 and 2023, if any, can be found in the Statement of Changes in Net Assets under Redemption Fees.
The Gabelli Equity Income Fund
Notes to Financial Statements (Continued)
Transactions in shares of capital stock were as follows:
| | | Year Ended
September 30,
2024 | | | Year Ended
September 30,
2023 | |
| | | Shares | | | Amount | | | Shares | | | Amount | |
| Class AAA | | | | | | | | | | | | | | | | |
| Shares sold | | | 1,510,162 | | | $ | 11,079,749 | | | | 1,174,663 | | | $ | 10,172,938 | |
| Shares issued upon reinvestment of distributions | | | 7,937,941 | | | | 55,430,150 | | | | 6,147,305 | | | | 49,649,725 | |
| Shares redeemed | | | (11,225,929 | ) | | | (81,268,898 | ) | | | (4,706,054 | ) | | | (40,534,051 | ) |
| Net increase/(decrease) | | | (1,777,826 | ) | | $ | (14,758,999 | ) | | | 2,615,914 | | | $ | 19,288,612 | |
| | | | | | | | | | | | | | | | | |
| Class A | | | | | | | | | | | | | | | | |
| Shares sold | | | 4,808,239 | | | $ | 34,911,262 | | | | 4,258,757 | | | $ | 36,060,183 | |
| Shares issued upon reinvestment of distributions | | | 4,886,202 | | | | 33,335,255 | | | | 2,979,277 | | | | 23,521,783 | |
| Shares redeemed | | | (6,780,523 | ) | | | (48,440,048 | ) | | | (3,201,866 | ) | | | (26,713,568 | ) |
| Net increase | | | 2,913,918 | | | $ | 19,806,469 | | | | 4,036,168 | | | $ | 32,868,398 | |
| | | | | | | | | | | | | | | | | |
| Class C | | | | | | | | | | | | | | | | |
| Shares sold | | | 236,296 | | | $ | 2,092,438 | | | | 78,914 | | | $ | 783,387 | |
| Shares issued upon reinvestment of distributions | | | 285,263 | | | | 2,310,279 | | | | 6,499 | | | | 57,017 | |
| Shares redeemed | | | (506,929 | ) | | | (4,387,777 | ) | | | (14,550 | ) | | | (141,092 | ) |
| Shares issued from conversion | | | 1,467,665 | | | | 12,882,576 | | | | — | | | | — | |
| Net increase | | | 1,482,295 | | | $ | 12,897,516 | | | | 70,863 | | | $ | 699,312 | |
| | | | | | | | | | | | | | | | | |
| Class C1* | | | | | | | | | | | | | | | | |
| Shares sold | | | 35,904 | | | $ | 81,023 | | | | 238,073 | | | $ | 769,577 | |
| Shares issued upon reinvestment of distributions | | | 2,347,461 | | | | 5,258,223 | | | | 3,538,227 | | | | 11,034,199 | |
| Shares redeemed | | | (4,503,878 | ) | | | (10,126,599 | ) | | | (4,569,461 | ) | | | (14,895,413 | ) |
| Shares converted and exchanged | | | (6,350,620 | ) | | | (12,882,576 | ) | | | — | | | | — | |
| Net decrease | | | (8,471,133 | ) | | $ | (17,669,929 | ) | | | (793,161 | ) | | $ | (3,091,637 | ) |
| | | | | | | | | | | | | | | | | |
| Class I | | | | | | | | | | | | | | | | |
| Shares sold | | | 6,454,026 | | | $ | 55,775,646 | | | | 3,283,389 | | | $ | 33,307,281 | |
| Shares issued upon reinvestment of distributions | | | 3,879,962 | | | | 32,236,852 | | | | 2,861,760 | | | | 26,958,291 | |
| Shares redeemed | | | (6,393,684 | ) | | | (56,556,711 | ) | | | (4,294,132 | ) | | | (43,281,567 | ) |
| Net increase | | | 3,940,304 | | | $ | 31,455,787 | | | | 1,851,017 | | | $ | 16,984,005 | |
| * | On May 29, 2024, Class C1 shares converted into Class C shares. See Note 8. |
9. Indemnifications. The Fund enters into contracts that contain a variety of indemnifications. The Fund’s maximum exposure under these arrangements is unknown. However, the Fund has not had prior claims or losses pursuant to these contracts. Management has reviewed the Fund’s existing contracts and expects the risk of loss to be remote.
10. Subsequent Events. Management has evaluated the impact on the Fund of all subsequent events occurring through the date the financial statements were issued and has determined that there were no subsequent events requiring recognition or disclosure in the financial statements.
The Gabelli Equity Income Fund
Report of Independent Registered Public Accounting Firm
To the Shareholders of The Gabelli Equity Income Fund
and the Board of Directors of Gabelli Equity Series Funds, Inc.
Opinion on the Financial Statements
We have audited the accompanying statement of assets and liabilities of The Gabelli Equity Income Fund (the “Fund”) (one of the funds constituting Gabelli Equity Series Funds, Inc. (the “Corporation”)), including the schedule of investments, as of September 30, 2024, and the related statement of operations for the year then ended, the statements of changes in net assets for each of the two years in the period then ended, the financial highlights for each of the five years in the period then ended and the related notes (collectively referred to as the “financial statements”). In our opinion, the financial statements present fairly, in all material respects, the financial position of the Fund (one of the funds constituting Gabelli Equity Series Funds, Inc.) at September 30, 2024, the results of its operations for the year then ended, the changes in its net assets for each of the two years in the period then ended and its financial highlights for each of the five years in the period then ended, in conformity with U.S. generally accepted accounting principles.
Basis for Opinion
These financial statements are the responsibility of the Corporation’s management. Our responsibility is to express an opinion on the Fund’s financial statements based on our audits. We are a public accounting firm registered with the Public Company Accounting Oversight Board (United States) (“PCAOB”) and are required to be independent with respect to the Corporation in accordance with the U.S. federal securities laws and the applicable rules and regulations of the Securities and Exchange Commission and the PCAOB.
We conducted our audits in accordance with the standards of the PCAOB. Those standards require that we plan and perform the audit to obtain reasonable assurance about whether the financial statements are free of material misstatement, whether due to error or fraud. The Corporation is not required to have, nor were we engaged to perform, an audit of the Corporation’s internal control over financial reporting. As part of our audits we are required to obtain an understanding of internal control over financial reporting but not for the purpose of expressing an opinion on the effectiveness of the Corporation’s internal control over financial reporting. Accordingly, we express no such opinion.
Our audits included performing procedures to assess the risks of material misstatement of the financial statements, whether due to error or fraud, and performing procedures that respond to those risks. Such procedures included examining, on a test basis, evidence regarding the amounts and disclosures in the financial statements. Our procedures included confirmation of securities owned as of September 30, 2024, by correspondence with the custodian and brokers; when replies were not received from brokers, we performed other auditing procedures. Our audits also included evaluating the accounting principles used and significant estimates made by management, as well as evaluating the overall presentation of the financial statements. We believe that our audits provide a reasonable basis for our opinion.

We have served as the auditor of one or more Gabelli Funds investment companies since 1992.
New York, New York
November 29, 2024
The Gabelli Equity Income Fund
Liquidity Risk Management Program (Unaudited)
In accordance with Rule 22e-4 under the 1940 Act, the Fund has established a liquidity risk management program (the LRM Program) to govern its approach to managing liquidity risk. The LRM Program is administered by the Liquidity Committee (the Committee), which is comprised of members of Gabelli Funds, LLC management. The Board has designated the Committee to administer the LRM Program.
The LRM Program’s principal objectives include supporting the Fund’s compliance with limits on investments in illiquid assets and mitigating the risk that the Fund will be unable to meet its redemption obligations in a timely manner. The LRM Program also includes elements that support the management and assessment of liquidity risk, including an annual assessment of factors that influence the Fund’s liquidity and the monthly classification and re-classification of certain investments that reflect the Committee’s assessment of their relative liquidity under current market conditions.
At a meeting of the Board held on May 15, 2024, the Board received a written report from the Committee regarding the design and operational effectiveness of the LRM Program. The Committee determined, and reported to the Board, that the LRM Program is reasonably designed to assess and manage the Fund’s liquidity risk and has operated adequately and effectively since its implementation. The Committee reported that there were no liquidity events that impacted the Fund or its ability to timely meet redemptions without dilution to existing shareholders. The Committee noted that the Fund is primarily invested in highly liquid securities and, accordingly, continues to be exempt from the requirement to determine a “highly liquid investment minimum” as defined in the Rule 22e-4. Because of that continued qualification for the exemption, the Fund has not adopted a “highly liquid investment minimum” amount. The Committee further noted that while changes to the LRM Program were made during the Review Period and reported to the Board, no material changes were made to the LRM Program as a result of the Committee’s annual review.
There can be no assurance that the LRM Program will achieve its objectives in the future. Please refer to the Fund’s Prospectus for more information regarding its exposure to liquidity risk and other principal risks to which an investment in the Fund may be subject.
THE GABELLI EQUITY INCOME FUND
2024 TAX NOTICE TO SHAREHOLDERS (Unaudited)
During the fiscal year ended September 30, 2024, the Fund paid to shareholders ordinary income distributions totaling $0.06, $0.06, $0.07, and $0.08 for each of Class AAA, Class A, Class C, and Class I, respectively, and long term capital gains totaling $60,769,241, or the maximum allowable. The distribution of long term capital gains has been designated as a capital gain dividend by the Fund’s Board of Directors. For the fiscal year ended September 30, 2024, 100% of the ordinary income distribution qualifies for the dividends received deduction available to corporations. The Fund designates 100% of the ordinary income distribution as qualified dividend income pursuant to the Jobs and Growth Tax Relief Reconciliation Act of 2003. The Fund designates 0.45% of the ordinary income distribution as qualified interest income pursuant to the Tax Relief, Unemployment Reauthorization, and Job Creation Act of 2010. The Fund designates 100% of the ordinary income distribution as qualified short term capital gain pursuant to the American Jobs Creation Act of 2004.
U.S. Government Income:
The percentage of the ordinary income distribution paid by the Fund during the fiscal year ended September 30, 2024 which was derived from U.S. Treasury securities was 0.4%. Such income is exempt from state and local tax in all states. However, many states, including New York and California, allow a tax exemption for a portion of the income earned only if a mutual fund has invested at least 50% of its assets at the end of each quarter of the Fund’s fiscal year in U.S. Government securities. The Gabelli Equity Income Fund did not meet this strict requirement in 2024. The percentage of U.S. Government securities held as of September 30, 2024 was 0.0%. Due to the diversity in state and local tax law, it is recommended that you consult your personal tax adviser as to the applicability of the information provided to your specific situation.
All designations are based on financial information available as of the date of this annual report and, accordingly, are subject to change. For each item, it is the intention of the Fund to designate the maximum amount permitted under the Internal Revenue Code and the regulations thereunder.
Gabelli Funds and Your Personal Privacy
Who are we?
The Gabelli Funds are investment companies registered with the Securities and Exchange Commission under the Investment Company Act of 1940. We are managed by Gabelli Funds, LLC, which is affiliated with GAMCO Investors, Inc., a publicly held company with subsidiaries and affiliates that provide investment advisory services for a variety of clients.
What kind of non-public information do we collect about you if you become a fund shareholder?
If you apply to open an account directly with us, you will be giving us some non-public information about yourself. The non-public information we collect about you is:
| ● | Information you give us on your application form. This could include your name, address, telephone number, social security number, bank account number, and other information. |
| ● | Information about your transactions with us, any transactions with our affiliates, and transactions with the entities we hire to provide services to you. This would include information about the shares that you buy or redeem. If we hire someone else to provide services — like a transfer agent — we will also have information about the transactions that you conduct through them. |
What information do we disclose and to whom do we disclose it?
We do not disclose any non-public personal information about our customers or former customers to anyone other than our affiliates, our service providers who need to know such information, and as otherwise permitted by law. If you want to find out what the law permits, you can read the privacy rules adopted by the Securities and Exchange Commission. They are in volume 17 of the Code of Federal Regulations, Part 248. The Commission often posts information about its regulations on its website, www.sec.gov.
What do we do to protect your personal information?
We restrict access to non-public personal information about you to the people who need to know that information in order to provide services to you or the fund and to ensure that we are complying with the laws governing the securities business. We maintain physical, electronic, and procedural safeguards to keep your personal information.
This page was intentionally left blank.
This page was intentionally left blank.
The Gabelli Small Cap Growth Fund
Annual Report — September 30, 2024
To Our Shareholders,
For the fiscal year ended September 30, 2024, the net asset value (NAV) total return per Class AAA Share of The Gabelli Small Cap Growth Fund (the Fund) was 27.2% compared with a total return of 25.9% for the Standard & Poor’s (S&P) SmallCap 600 Index. Other classes of shares are available.
Enclosed are the financial statements, including the summary schedule of investments, as of September 30, 2024.
Summary of Portfolio Holdings (Unaudited)
The following table presents portfolio holdings as a percent of net assets as of September 30, 2024:
The Gabelli Small Cap Growth Fund
| Equipment and Supplies | | 19.1 | % |
| Diversified Industrial | | 12.4 | % |
| Financial Services | | 6.7 | % |
| Building and Construction | | 6.6 | % |
| Retail | | 6.1 | % |
| Automotive: Parts and Accessories | | 4.8 | % |
| Food and Beverage | | 4.6 | % |
| Hotels and Gaming | | 3.8 | % |
| Electronics | | 3.6 | % |
| Health Care | | 3.3 | % |
| Business Services | | 2.8 | % |
| Transportation | | 2.5 | % |
| Entertainment | | 2.4 | % |
| Energy and Utilities | | 2.3 | % |
| Machinery | | 2.1 | % |
| Specialty Chemicals | | 2.0 | % |
| Manufactured Housing and Recreational Vehicles | | 2.0 | % |
| Real Estate | | 1.8 | % |
| Aviation: Parts and Services | | 1.7 | % |
| Consumer Products | | 1.5 | % |
| Computer Software and Services | | 1.4 | % |
| Broadcasting | | 1.3 | % |
| Consumer Services | | 1.0 | % |
| Telecommunications | | 0.8 | % |
| Environmental Services | | 0.7 | % |
| U.S. Government Obligations | | 0.7 | % |
| Automotive | | 0.4 | % |
| Miscellaneous Investments | | 0.4 | % |
| Publishing | | 0.3 | % |
| Home Furnishings | | 0.3 | % |
| Wireless Communications | | 0.2 | % |
| Cable | | 0.1 | % |
| Communications Equipment | | 0.1 | % |
| Closed-End Funds | | 0.1 | % |
| Metals and Mining | | 0.1 | % |
| Aerospace | | 0.1 | % |
| Agriculture | | 0.1 | % |
| Other Assets and Liabilities (Net) | | (0.2 | )% |
| | | 100.0 | % |
The Fund files a complete schedule of portfolio holdings with the Securities and Exchange Commission (the SEC) for the first and third quarters of each fiscal year on Form N-PORT. Shareholders may obtain this information at www.gabelli.com or by calling the Fund at 800-GABELLI (800-422-3554). The Fund’s Form N-PORT is available on the SEC’s website at www.sec.gov and may also be reviewed and copied at the SEC’s Public Reference Room in Washington, DC. Information on the operation of the Public Reference Room may be obtained by calling 800-SEC-0330.
Proxy Voting
The Fund files Form N-PX with its complete proxy voting record for the twelve months ended June 30, no later than August 31 of each year. A description of the Fund’s proxy voting policies, procedures, and how the Fund voted proxies relating to portfolio securities is available without charge, upon request, by (i) calling 800-GABELLI (800-422-3554); (ii) writing to The Gabelli Funds at One Corporate Center, Rye, NY 10580-1422; or (iii) visiting the SEC’s website at www.sec.gov.
The Gabelli Small Cap Growth Fund
Schedule of Investments — September 30, 2024
| Shares | | | | | Cost | | | Market Value | |
| | | | | COMMON STOCKS — 98.9% | | | | | | | | |
| | | | | Aerospace — 0.1% | | | | | | | | |
| | 30,500 | | | Allient Inc. | | $ | 675,972 | | | $ | 579,195 | |
| | 2,500 | | | Embraer SA, ADR† | | | 68,200 | | | | 88,425 | |
| | 58,585 | | | Innovative Solutions and Support Inc.† | | | 247,373 | | | | 381,974 | |
| | 7,000 | | | Kratos Defense & Security Solutions Inc.† | | | 109,611 | | | | 163,100 | |
| | 26,500 | | | Triumph Group Inc.† | | | 370,317 | | | | 341,585 | |
| | | | | | | | 1,471,473 | | | | 1,554,279 | |
| | | | | Agriculture — 0.1% | | | | | | | | |
| | 10,000 | | | Cadiz Inc.† | | | 67,958 | | | | 30,300 | |
| | 56,000 | | | Limoneira Co. | | | 944,351 | | | | 1,484,000 | |
| | | | | | | | 1,012,309 | | | | 1,514,300 | |
| | | | | Automotive — 0.4% | | | | | | | | |
| | 33,000 | | | Blue Bird Corp.† | | | 680,082 | | | | 1,582,680 | |
| | 480,000 | | | Iveco Group NV | | | 2,104,981 | | | | 4,818,426 | |
| | 56,000 | | | The Shyft Group Inc. | | | 267,412 | | | | 702,800 | |
| | | | | | | | 3,052,475 | | | | 7,103,906 | |
| | | | | Automotive: Parts and Accessories — 4.7% | | | | | | | | |
| | 147,500 | | | BorgWarner Inc. | | | 609,138 | | | | 5,352,775 | |
| | 836,000 | | | Brembo NV | | | 1,544,528 | | | | 9,150,525 | |
| | 94,022 | | | China Automotive Systems Inc. | | | 443,798 | | | | 432,501 | |
| | 75,500 | | | Commercial Vehicle Group Inc.† | | | 662,307 | | | | 245,375 | |
| | 1,087,000 | | | Dana Inc. | | | 8,505,324 | | | | 11,478,720 | |
| | 238,500 | | | Modine Manufacturing Co.† | | | 1,487,767 | | | | 31,670,415 | |
| | 55,000 | | | Monro Inc. | | | 1,318,392 | | | | 1,587,300 | |
| | 4,300 | | | O’Reilly Automotive Inc.† | | | 92,532 | | | | 4,951,880 | |
| | 29,000 | | | Phinia Inc. | | | 80,435 | | | | 1,334,870 | |
| | 45,000 | | | Puradyn Filter Technologies Inc.† | | | 11,732 | | | | 0 | |
| | 185,000 | | | Standard Motor Products Inc. | | | 1,504,158 | | | | 6,142,000 | |
| | 253,000 | | | Strattec Security Corp.†(a) | | | 4,905,435 | | | | 10,792,980 | |
| | 18,400 | | | Thor Industries Inc. | | | 170,396 | | | | 2,021,976 | |
| | | | | | | | 21,335,942 | | | | 85,161,317 | |
| | | | | Aviation: Parts and Services — 1.7% | | | | | | | | |
| | 20,000 | | | AAR Corp.† | | | 230,415 | | | | 1,307,200 | |
| | 9,500 | | | Astronics Corp.† | | | 13,628 | | | | 185,060 | |
| | 23,200 | | | Astronics Corp., Cl. B† | | | 38,561 | | | | 455,880 | |
| | 55,374 | | | Ducommun Inc.† | | | 1,426,830 | | | | 3,645,271 | |
| | 87,900 | | | Moog Inc., Cl. A | | | 956,459 | | | | 17,757,558 | |
| | 18,112 | | | Moog Inc., Cl. B | | | 638,257 | | | | 3,622,943 | |
| | 19,500 | | | Woodward Inc. | | | 140,128 | | | | 3,344,445 | |
| | | | | | | | 3,444,278 | | | | 30,318,357 | |
| Shares | | | | | Cost | | | Market
Value | |
| | | | | Broadcasting — 1.3% | | | | | | | | |
| | 8,500 | | | Beasley Broadcast Group Inc., Cl. A† | | $ | 473,492 | | | $ | 91,460 | |
| | 10,000 | | | Cogeco Communications Inc. | | | 340,851 | | | | 528,670 | |
| | 24,000 | | | Cogeco Inc. | | | 632,315 | | | | 1,061,540 | |
| | 200,000 | | | Corus Entertainment Inc., Cl. B† | | | 305,699 | | | | 25,140 | |
| | 36,500 | | | Fox Corp., Cl. A | | | 1,508,655 | | | | 1,545,045 | |
| | 5,000 | | | Fox Corp., Cl. B | | | 143,665 | | | | 194,000 | |
| | 25,000 | | | Gray Television Inc. | | | 73,674 | | | | 134,000 | |
| | 71,700 | | | Gray Television Inc., Cl. A | | | 377,715 | | | | 499,032 | |
| | 650,000 | | | Grupo Televisa SAB, ADR | | | 2,090,521 | | | | 1,664,000 | |
| | 280,000 | | | ITV plc | | | 497,942 | | | | 299,664 | |
| | 13,000 | | | Liberty Broadband Corp., Cl. A† | | | 78,211 | | | | 998,660 | |
| | 11,000 | | | Liberty Broadband Corp., Cl. C† | | | 57,594 | | | | 850,190 | |
| | 20,000 | | | Liberty Media Corp.-Liberty Formula One, Cl. A† | | | 64,270 | | | | 1,430,600 | |
| | 27,000 | | | Liberty Media Corp.-Liberty Formula One, Cl. C† | | | 88,133 | | | | 2,090,610 | |
| | 22,000 | | | Nexstar Media Group Inc. | | | 1,349,700 | | | | 3,637,700 | |
| | 100,000 | | | Salem Media Group Inc.† | | | 0 | | | | 25,550 | |
| | 132,454 | | | Sirius XM Holdings Inc. | | | 786,296 | | | | 3,132,526 | |
| | 95,000 | | | Sphere Entertainment Co.† | | | 1,063,999 | | | | 4,197,100 | |
| | 15,000 | | | TEGNA Inc. | | | 220,751 | | | | 236,700 | |
| | 37,000 | | | Townsquare Media Inc., Cl. A | | | 374,479 | | | | 375,920 | |
| | | | | | | | 10,527,962 | | | | 23,018,107 | |
| | | | | Building and Construction — 6.6% | | | | | | | | |
| | 76,500 | | | Arcosa Inc. | | | 908,099 | | | | 7,249,140 | |
| | 200,000 | | | Armstrong Flooring Inc.† | | | 26,719 | | | | 40 | |
| | 7,000 | | | D.R. Horton Inc. | | | 63,123 | | | | 1,335,390 | |
| | 31,000 | | | Gibraltar Industries Inc.† | | | 669,410 | | | | 2,167,830 | |
| | 207,800 | | | Herc Holdings Inc. | | | 6,763,248 | | | | 33,129,554 | |
| | 37,500 | | | KB Home | | | 273,655 | | | | 3,213,375 | |
| | 3,000 | | | Legacy Housing Corp.† | | | 38,431 | | | | 82,050 | |
| | 324,000 | | | Lennar Corp., Cl. B | | | 7,532,303 | | | | 56,032,560 | |
| | 1,000 | | | Meritage Homes Corp. | | | 15,039 | | | | 205,070 | |
| | 1,100 | | | NVR Inc.† | | | 735,215 | | | | 10,792,980 | |
| | 22,500 | | | PulteGroup Inc. | | | 90,350 | | | | 3,229,425 | |
| | 427 | | | The Monarch Cement Co. | | | 64,411 | | | | 81,130 | |
| | 70,500 | | | Titan Machinery Inc.† | | | 1,154,359 | | | | 982,065 | |
| | 5,700 | | | Toll Brothers Inc. | | | 84,695 | | | | 880,593 | |
| | | | | | | | 18,419,057 | | | | 119,381,202 | |
| | | | | Business Services — 2.8% | | | | | | | | |
| | 13,000 | | | ACCO Brands Corp. | | | 60,332 | | | | 71,110 | |
| | 1,200,000 | | | Clear Channel Outdoor Holdings Inc.† | | | 1,797,253 | | | | 1,920,000 | |
| | 59,000 | | | Element Solutions Inc. | | | 527,596 | | | | 1,602,440 | |
See accompanying notes to financial statements.
The Gabelli Small Cap Growth Fund
Schedule of Investments (Continued) — September 30, 2024
| Shares | | | | | Cost | | | Market
Value | |
| | | | | COMMON STOCKS (Continued) | | | | | | | | |
| | | | | Business Services (Continued) | | | | | | | | |
| | 22,900 | | | Keweenaw Land Association Ltd.† | | $ | 505,517 | | | $ | 744,369 | |
| | 35,500 | | | Live Nation Entertainment Inc.† | | | 298,668 | | | | 3,886,895 | |
| | 40,000 | | | Loomis AB | | | 402,123 | | | | 1,314,710 | |
| | 92,340 | | | Madison Square Garden Entertainment Corp.† | | | 1,166,708 | | | | 3,927,220 | |
| | 14,000 | | | McGrath RentCorp | | | 358,155 | | | | 1,473,920 | |
| | 31,000 | | | Outfront Media Inc., REIT | | | 478,744 | | | | 569,780 | |
| | 65,000 | | | Ranpak Holdings Corp.† | | | 461,522 | | | | 424,450 | |
| | 21,200 | | | RB Global Inc. | | | 314,375 | | | | 1,706,388 | |
| | 350,000 | | | S4 Capital plc† | | | 187,717 | | | | 181,371 | |
| | 20,000 | | | Sealed Air Corp. | | | 587,044 | | | | 726,000 | |
| | 345,000 | | | Sohgo Security Services Co. Ltd. | | | 799,632 | | | | 2,484,432 | |
| | 66,000 | | | The Interpublic Group of Companies Inc. | | | 233,166 | | | | 2,087,580 | |
| | 25,000 | | | TransAct Technologies Inc.† | | | 115,198 | | | | 121,500 | |
| | 1,600,000 | | | Trans-Lux Corp.†(a) | | | 1,575,044 | | | | 1,162,400 | |
| | 32,000 | | | United Rentals Inc. | | | 194,497 | | | | 25,911,360 | |
| | | | | | | | 10,063,291 | | | | 50,315,925 | |
| | | | | Cable — 0.1% | | | | | | | | |
| | 54,500 | | | AMC Networks Inc., Cl. A† | | | 36,140 | | | | 473,605 | |
| | 60,000 | | | EchoStar Corp., Cl. A† | | | 865,139 | | | | 1,489,200 | |
| | 105,000 | | | WideOpenWest Inc.† | | | 810,857 | | | | 551,250 | |
| | | | | | | | 1,712,136 | | | | 2,514,055 | |
| | | | | Communications Equipment — 0.1% | | | | | | | | |
| | 149,200 | | | Telesat Corp.† | | | 1,828,135 | | | | 1,964,964 | |
| | | | | | | | | | | | | |
| | | | | Computer Software and Services — 1.4% | | | | | | | | |
| | 370,000 | | | Alithya Group Inc., Cl. A† | | | 1,101,651 | | | | 477,300 | |
| | 11,000 | | | MKS Instruments Inc. | | | 189,530 | | | | 1,195,810 | |
| | 21,200 | | | Rockwell Automation Inc. | | | 479,154 | | | | 5,691,352 | |
| | 30,800 | | | Tyler Technologies Inc.† | | | 61,265 | | | | 17,978,576 | |
| | | | | | | | 1,831,600 | | | | 25,343,038 | |
| | | | | Consumer Products — 1.5% | | | | | | | | |
| | 170,000 | | | 1-800-Flowers.com Inc., Cl. A† | | | 1,642,706 | | | | 1,348,100 | |
| | 67,000 | | | Brunswick Corp. | | | 1,342,085 | | | | 5,615,940 | |
| | 32,000 | | | Chofu Seisakusho Co. Ltd. | | | 461,495 | | | | 437,947 | |
| | 39,700 | | | Church & Dwight Co. Inc. | | | 67,573 | | | | 4,157,384 | |
| | 57,500 | | | Energizer Holdings Inc. | | | 1,915,682 | | | | 1,826,200 | |
| | 2,000 | | | Harley-Davidson Inc. | | | 4,713 | | | | 77,060 | |
| | 2,500 | | | Kobayashi Pharmaceutical Co. Ltd. | | | 103,323 | | | | 99,200 | |
| | 3,200 | | | LCI Industries | | | 52,915 | | | | 385,728 | |
| | 216,000 | | | Marine Products Corp. | | | 133,661 | | | | 2,093,040 | |
| | 7,000 | | | National Presto Industries Inc. | | | 390,588 | | | | 525,980 | |
| Shares | | | | | Cost | | | Market
Value | |
| 205,000 | | | Sally Beauty Holdings Inc.† | | $ | 1,221,770 | | | $ | 2,781,850 | |
| | 210,000 | | | Samick Musical Instruments Co. Ltd. | | | 279,549 | | | | 172,471 | |
| | 3,700 | | | Shimano Inc. | | | 414,540 | | | | 699,454 | |
| | 9,500 | | | Steven Madden Ltd. | | | 19,995 | | | | 465,405 | |
| | 18,000 | | | The Scotts Miracle-Gro Co. | | | 689,938 | | | | 1,560,600 | |
| | 8,000 | | | Vista Outdoor Inc.† | | | 219,630 | | | | 313,440 | |
| | 9,500 | | | WD-40 Co. | | | 248,399 | | | | 2,449,860 | |
| | 120,000 | | | Wolverine World Wide Inc. | | | 781,633 | | | | 2,090,400 | |
| | | | | | | | 9,990,195 | | | | 27,100,059 | |
| | | | | Consumer Services — 1.0% | | | | | | | | |
| | 53,000 | | | Bowlin Travel Centers Inc.† | | | 53,948 | | | | 201,135 | |
| | 16,000 | | | H&E Equipment Services Inc. | | | 554,892 | | | | 778,880 | |
| | 5,000 | | | IAC Inc.† | | | 11,719 | | | | 269,100 | |
| | 180,000 | | | OPENLANE Inc.† | | | 893,854 | | | | 3,038,400 | |
| | 270,500 | | | Rollins Inc. | | | 251,534 | | | | 13,681,890 | |
| | | | | | | | 1,765,947 | | | | 17,969,405 | |
| | | | | Diversified Industrial — 12.4% | | | | | | | | |
| | 10,000 | | | Acuity Brands Inc. | | | 94,378 | | | | 2,753,900 | |
| | 50,500 | | | Albany International Corp., Cl. A | | | 975,483 | | | | 4,486,925 | |
| | 200,000 | | | Ampco-Pittsburgh Corp.† | | | 924,662 | | | | 400,000 | |
| | 25,000 | | | Ardagh Group SA† | | | 98,100 | | | | 120,375 | |
| | 74,000 | | | Burnham Holdings Inc., Cl. A | | | 1,203,845 | | | | 1,017,500 | |
| | 351,200 | | | Crane Co. | | | 4,811,745 | | | | 55,587,936 | |
| | 143,500 | | | Crane NXT Co. | | | 737,943 | | | | 8,050,350 | |
| | 99,000 | | | Distribution Solutions Group Inc.† | | | 693,477 | | | | 3,812,490 | |
| | 5,000 | | | Enerpac Tool Group Corp. | | | 127,850 | | | | 209,450 | |
| | 65,700 | | | Enpro Inc. | | | 3,109,928 | | | | 10,655,226 | |
| | 103,500 | | | Greif Inc., Cl. A | | | 1,839,821 | | | | 6,485,310 | |
| | 93,500 | | | Greif Inc., Cl. B | | | 4,205,680 | | | | 6,529,105 | |
| | 183,000 | | | Griffon Corp. | | | 1,501,698 | | | | 12,810,000 | |
| | 31,500 | | | Hyster-Yale Inc. | | | 1,151,003 | | | | 2,008,755 | |
| | 19,000 | | | INNOVATE Corp.† | | | 314,688 | | | | 70,300 | |
| | 6,000 | | | JSP Corp. | | | 97,960 | | | | 80,905 | |
| | 114,000 | | | L.B. Foster Co., Cl. A† | | | 1,587,505 | | | | 2,329,020 | |
| | 38,000 | | | Lincoln Electric Holdings Inc. | | | 966,947 | | | | 7,296,760 | |
| | 30,200 | | | Lindsay Corp. | | | 590,816 | | | | 3,764,128 | |
| | 37,500 | | | Matthews International Corp., Cl. A | | | 959,116 | | | | 870,000 | |
| | 965,200 | | | Myers Industries Inc. | | | 13,349,441 | | | | 13,339,064 | |
| | 70,000 | | | Oil-Dri Corp. of America | | | 479,897 | | | | 4,829,300 | |
| | 13,000 | | | Olin Corp. | | | 203,184 | | | | 623,740 | |
| | 323,300 | | | Park-Ohio Holdings Corp. | | | 2,994,312 | | | | 9,925,310 | |
| | 12,500 | | | Pentair plc | | | 296,897 | | | | 1,222,375 | |
| | 13,700 | | | Roper Technologies Inc. | | | 257,432 | | | | 7,623,228 | |
| | 53,200 | | | Sonoco Products Co. | | | 1,529,361 | | | | 2,906,316 | |
See accompanying notes to financial statements.
The Gabelli Small Cap Growth Fund
Schedule of Investments (Continued) — September 30, 2024
| Shares | | | | | Cost | | | Market
Value | |
| | | | | COMMON STOCKS (Continued) | | | | | | | |
| | | | | Diversified Industrial (Continued) | | | | | | | | |
| | 48,900 | | | Standex International Corp. | | $ | 1,250,732 | | | $ | 8,937,942 | |
| | 84,500 | | | Steel Partners Holdings LP† | | | 1,113,551 | | | | 3,460,275 | |
| | 13,000 | | | T. Hasegawa Co. Ltd. | | | 236,726 | | | | 296,225 | |
| | 7,000 | | | Terex Corp. | | | 166,670 | | | | 370,370 | |
| | 332,000 | | | Textron Inc. | | | 2,003,603 | | | | 29,408,560 | |
| | 624,300 | | | Tredegar Corp.† | | | 6,449,707 | | | | 4,551,147 | |
| | 217,000 | | | Trinity Industries Inc. | | | 2,450,992 | | | | 7,560,280 | |
| | | | | | | | 58,775,150 | | | | 224,392,567 | |
| | | | | Electronics — 3.6% | | | | | | | | |
| | 103,000 | | | Badger Meter Inc. | | | 1,252,144 | | | | 22,496,230 | |
| | 169,000 | | | Bel Fuse Inc., Cl. A(a) | | | 2,869,215 | | | | 16,803,670 | |
| | 394,000 | | | CTS Corp. | | | 3,232,685 | | | | 19,061,720 | |
| | 58,000 | | | Daktronics Inc.† | | | 424,446 | | | | 748,780 | |
| | 120,000 | | | Gentex Corp. | | | 1,305,089 | | | | 3,562,800 | |
| | 20,000 | | | IMAX Corp.† | | | 158,565 | | | | 410,200 | |
| | 10,000 | | | Napco Security Technologies Inc. | | | 232,442 | | | | 404,600 | |
| | 30,000 | | | Renesas Electronics Corp. | | | 194,117 | | | | 433,954 | |
| | 60,000 | | | Stoneridge Inc.† | | | 288,850 | | | | 671,400 | |
| | | | | | | | 9,957,553 | | | | 64,593,354 | |
| | | | | Energy and Utilities — 2.3% | | | | | | | | |
| | 32,000 | | | APA Corp. | | | 765,019 | | | | 782,720 | |
| | 9,800 | | | Chesapeake Utilities Corp. | | | 127,440 | | | | 1,216,866 | |
| | 35,000 | | | CMS Energy Corp. | | | 67,088 | | | | 2,472,050 | |
| | 20,000 | | | Consolidated Water Co. Ltd. | | | 233,823 | | | | 504,200 | |
| | 35,100 | | | Diamondback Energy Inc. | | | 1,730,067 | | | | 6,051,240 | |
| | 74,000 | | | Energy Recovery Inc.† | | | 316,427 | | | | 1,286,860 | |
| | 29,000 | | | Landis+Gyr Group AG | | | 1,762,989 | | | | 2,693,212 | |
| | 21,000 | | | Marathon Petroleum Corp. | | | 101,401 | | | | 3,421,110 | |
| | 3,500 | | | Middlesex Water Co. | | | 54,166 | | | | 228,340 | |
| | 60,000 | | | NextEra Energy Partners LP | | | 1,320,300 | | | | 1,657,200 | |
| | 65,000 | | | Northwest Natural Holding Co. | | | 2,502,625 | | | | 2,653,300 | |
| | 21,500 | | | Northwestern Energy Group Inc. | | | 582,609 | | | | 1,230,230 | |
| | 10,000 | | | Otter Tail Corp. | | | 213,560 | | | | 781,600 | |
| | 42,206 | | | RGC Resources Inc. | | | 801,117 | | | | 952,589 | |
| | 1,680,000 | | | RPC Inc. | | | 681,607 | | | | 10,684,800 | |
| | 8,000 | | | SJW Group | | | 107,086 | | | | 464,880 | |
| | 32,000 | | | Southwest Gas Holdings Inc. | | | 504,977 | | | | 2,360,320 | |
| | 6,800 | | | Spire Inc. | | | 267,758 | | | | 457,572 | |
| | 31,000 | | | The York Water Co. | | | 433,596 | | | | 1,161,260 | |
| | 54,000 | | | Vestas Wind Systems A/S† | | | 92,624 | | | | 1,192,241 | |
| | | | | | | | 12,666,279 | | | | 42,252,590 | |
| | | | | Entertainment — 2.4% | | | | | | | | |
| | 166,321 | | | Atlanta Braves Holdings Inc., Cl. A† | | | 4,254,932 | | | | 7,010,430 | |
| Shares | | | | | Cost | | | Market
Value | |
| | 242,000 | | | Atlanta Braves Holdings Inc., Cl. C† | | $ | 4,631,452 | | | $ | 9,631,600 | |
| | 92,000 | | | Inspired Entertainment Inc.† | | | 672,379 | | | | 852,840 | |
| | 16,856 | | | Liberty Media Corp.-Liberty Live, Cl. A† | | | 54,885 | | | | 834,541 | |
| | 9,768 | | | Liberty Media Corp.-Liberty Live, Cl. C† | | | 65,382 | | | | 501,391 | |
| | 350,000 | | | Lions Gate Entertainment Corp., Cl. A† | | | 3,429,764 | | | | 2,740,500 | |
| | 65,000 | | | Lions Gate Entertainment Corp., Cl. B† | | | 597,710 | | | | 449,800 | |
| | 35,000 | | | Lionsgate Studios Corp.† | | | 315,052 | | | | 250,250 | |
| | 36,000 | | | Madison Square Garden Sports Corp.† | | | 562,187 | | | | 7,497,360 | |
| | 105,100 | | | Manchester United plc, Cl. A† | | | 1,526,468 | | | | 1,700,518 | |
| | 290,000 | | | Ollamani SAB† | | | 560,435 | | | | 547,303 | |
| | 233,000 | | | Sinclair Inc. | | | 2,702,677 | | | | 3,564,900 | |
| | 7,800 | | | Take-Two Interactive Software Inc.† | | | 58,796 | | | | 1,198,938 | |
| | 3,500 | | | The Walt Disney Co. | | | 20,071 | | | | 336,665 | |
| | 45,400 | | | TKO Group Holdings Inc.† | | | 478,075 | | | | 5,616,434 | |
| | 35,000 | | | Universal Entertainment Corp. | | | 210,518 | | | | 340,929 | |
| | 104,000 | | | Warner Bros Discovery Inc.† | | | 922,964 | | | | 858,000 | |
| | | | | | | | 21,063,747 | | | | 43,932,399 | |
| | | | | Environmental Services — 0.7% | | | | | | | | |
| | 58,500 | | | Republic Services Inc. | | | 528,450 | | | | 11,749,140 | |
| | | | | | | | | | | | | |
| | | | | Equipment and Supplies — 19.1% | | | | | | | | |
| | 17,200 | | | A.O. Smith Corp. | | | 35,260 | | | | 1,545,076 | |
| | 384,500 | | | AMETEK Inc. | | | 654,262 | | | | 66,022,495 | |
| | 40,000 | | | Ardagh Metal Packaging SA | | | 145,261 | | | | 150,800 | |
| | 54,500 | | | AZZ Inc. | | | 1,892,055 | | | | 4,502,245 | |
| | 9,200 | | | Chart Industries Inc.† | | | 301,823 | | | | 1,142,088 | |
| | 311,200 | | | Core Molding Technologies Inc.† | | | 598,967 | | | | 5,355,752 | |
| | 91,500 | | | Crown Holdings Inc. | | | 368,540 | | | | 8,773,020 | |
| | 2,025 | | | Danaher Corp. | | | 11,649 | | | | 562,990 | |
| | 100,000 | | | Donaldson Co. Inc. | | | 575,112 | | | | 7,370,000 | |
| | 38,700 | | | Entegris Inc. | | | 164,986 | | | | 4,354,911 | |
| | 174,200 | | | Federal Signal Corp. | | | 911,626 | | | | 16,280,732 | |
| | 237,000 | | | Flowserve Corp. | | | 1,382,660 | | | | 12,250,530 | |
| | 151,500 | | | Franklin Electric Co. Inc. | | | 590,790 | | | | 15,880,230 | |
| | 412,000 | | | Graco Inc. | | | 2,164,307 | | | | 36,054,120 | |
| | 32,000 | | | IDEX Corp. | | | 117,254 | | | | 6,864,000 | |
| | 125,000 | | | Interpump Group SpA | | | 547,330 | | | | 5,827,340 | |
| | 6,800 | | | Littelfuse Inc. | | | 54,921 | | | | 1,803,700 | |
| | 110,000 | | | Maezawa Kyuso Industries Co. Ltd. | | | 359,609 | | | | 971,995 | |
| | 65,000 | | | Minerals Technologies Inc. | | | 2,808,132 | | | | 5,019,950 | |
See accompanying notes to financial statements.
The Gabelli Small Cap Growth Fund
Schedule of Investments (Continued) — September 30, 2024
| Shares | | | | | Cost | | | Market
Value | |
| | | | | COMMON STOCKS (Continued) | | | | | | | | |
| | | | | Equipment and Supplies (Continued) | | | | | | | | |
| | 6,000 | | | MSA Safety Inc. | | $ | 179,592 | | | $ | 1,064,040 | |
| | 809,500 | | | Mueller Industries Inc. | | | 9,533,630 | | | | 59,983,950 | |
| | 330,000 | | | Mueller Water Products Inc., Cl. A | | | 2,200,230 | | | | 7,161,000 | |
| | 3,500 | | | Teleflex Inc. | | | 53,317 | | | | 865,620 | |
| | 163,800 | | | Tennant Co. | | | 2,710,194 | | | | 15,731,352 | |
| | 728,400 | | | The Gorman-Rupp Co. | | | 10,989,699 | | | | 28,371,180 | |
| | 87,000 | | | The Greenbrier Companies Inc. | | | 921,001 | | | | 4,427,430 | |
| | 50,500 | | | The Manitowoc Co. Inc.† | | | 499,591 | | | | 485,810 | |
| | 50,000 | | | The Middleby Corp.† | | | 533,815 | | | | 6,956,500 | |
| | 36,000 | | | The Timken Co. | | | 1,219,448 | | | | 3,034,440 | |
| | 30,000 | | | The Toro Co. | | | 524,020 | | | | 2,601,900 | |
| | 5,400 | | | Valmont Industries Inc. | | | 72,895 | | | | 1,565,730 | |
| | 7,875 | | | Watsco Inc., Cl. B | | | 23,627 | | | | 3,893,243 | |
| | 43,000 | | | Watts Water Technologies Inc., Cl. A | | | 816,108 | | | | 8,909,170 | |
| | | | | | | | 43,961,711 | | | | 345,783,339 | |
| | | | | Financial Services — 6.7% | | | | | | | | |
| | 7,000 | | | Ameris Bancorp | | | 49,547 | | | | 436,730 | |
| | 12,300 | | | Capitol Federal Financial Inc. | | | 121,803 | | | | 71,832 | |
| | 20,800 | | | Crazy Woman Creek Bancorp Inc.† | | | 318,236 | | | | 686,400 | |
| | 44,500 | | | Eagle Bancorp Inc. | | | 1,321,632 | | | | 1,004,810 | |
| | 325,000 | | | Energy Transfer LP | | | 0 | | | | 5,216,250 | |
| | 230 | | | Farmers & Merchants Bank of Long Beach | | | 1,394,972 | | | | 1,230,500 | |
| | 355,000 | | | Flushing Financial Corp. | | | 5,740,119 | | | | 5,175,900 | |
| | 66,000 | | | FNB Corp. | | | 659,922 | | | | 931,260 | |
| | 275,000 | | | GAM Holding AG† | | | 144,304 | | | | 63,165 | |
| | 25,000 | | | Hanover Bancorp Inc. | | | 525,000 | | | | 447,250 | |
| | 270,000 | | | Hope Bancorp Inc. | | | 2,987,671 | | | | 3,391,200 | |
| | 410,000 | | | Huntington Bancshares Inc. | | | 3,921,829 | | | | 6,027,000 | |
| | 659,500 | | | KKR & Co. Inc. | | | 2,625,041 | | | | 86,117,510 | |
| | 80,000 | | | Medallion Financial Corp. | | | 362,763 | | | | 651,200 | |
| | 8,000 | | | PROG Holdings Inc. | | | 5,116 | | | | 387,920 | |
| | 50,000 | | | Sandy Spring Bancorp Inc. | | | 1,560,919 | | | | 1,568,500 | |
| | 11,500 | | | Southern First Bancshares Inc.† | | | 425,553 | | | | 391,920 | |
| | 47,000 | | | Synovus Financial Corp. | | | 1,218,657 | | | | 2,090,090 | |
| | 16,000 | | | TFS Financial Corp. | | | 234,831 | | | | 205,760 | |
| | 15,000 | | | Thomasville Bancshares Inc. | | | 570,703 | | | | 1,000,500 | |
| | 230,000 | | | Valley National Bancorp | | | 1,437,500 | | | | 2,083,800 | |
| | 34,308 | | | Value Line Inc. | | | 425,084 | | | | 1,595,322 | |
| | 10,000 | | | Waterloo Investment Holdings Ltd.†(b) | | | 1,373 | | | | 5,000 | |
| | 18,500 | | | Webster Financial Corp. | | | 307,623 | | | | 862,285 | |
| Shares | | | | | Cost | | | Market
Value | |
| | 130,000 | | | Wright Investors’ Service Holdings Inc.† | | $ | 82,906 | | | $ | 24,050 | |
| | | | | | | | 26,443,104 | | | | 121,666,154 | |
| | | | | Food and Beverage — 4.6% | | | | | | | | |
| | 424,500 | | | Arca Continental SAB de CV | | | 762,263 | | | | 3,966,240 | |
| | 13,700 | | | BellRing Brands Inc.† | | | 14,184 | | | | 831,864 | |
| | 74,700 | | | Brown-Forman Corp., Cl. A | | | 404,338 | | | | 3,591,576 | |
| | 40,000 | | | Bull-Dog Sauce Co. Ltd. | | | 95,622 | | | | 480,083 | |
| | 82,000 | | | China Tontine Wines Group Ltd.† | | | 85,944 | | | | 4,536 | |
| | 266,500 | | | Crimson Wine Group Ltd.† | | | 2,328,460 | | | | 1,681,615 | |
| | 220,000 | | | Denny’s Corp.† | | | 736,620 | | | | 1,419,000 | |
| | 500,000 | | | Dynasty Fine Wines Group Ltd.† | | | 74,726 | | | | 24,441 | |
| | 96,000 | | | Farmer Brothers Co.† | | | 584,295 | | | | 190,080 | |
| | 400,000 | | | Flowers Foods Inc. | | | 950,682 | | | | 9,228,000 | |
| | 114,000 | | | ITO EN Ltd. | | | 2,136,608 | | | | 2,707,128 | |
| | 92,000 | | | Iwatsuka Confectionery Co. Ltd. | | | 1,584,932 | | | | 1,643,806 | |
| | 23,000 | | | J & J Snack Foods Corp. | | | 509,737 | | | | 3,958,760 | |
| | 93,000 | | | Kameda Seika Co. Ltd. | | | 3,552,601 | | | | 2,895,634 | |
| | 1,200,000 | | | Kikkoman Corp. | | | 1,630,295 | | | | 13,592,625 | |
| | 70,000 | | | Krispy Kreme Inc. | | | 910,332 | | | | 751,800 | |
| | 635,000 | | | Maple Leaf Foods Inc. | | | 11,018,968 | | | | 10,399,830 | |
| | 12,000 | | | MEIJI Holdings Co. Ltd. | | | 117,526 | | | | 299,739 | |
| | 8,000 | | | MGP Ingredients Inc. | | | 6,395 | | | | 666,000 | |
| | 124,000 | | | Morinaga Milk Industry Co. Ltd. | | | 1,182,249 | | | | 3,030,871 | |
| | 7,500 | | | National Beverage Corp. | | | 330,160 | | | | 352,050 | |
| | 130,500 | | | Nissin Foods Holdings Co. Ltd. | | | 1,444,598 | | | | 3,638,292 | |
| | 13,000 | | | Post Holdings Inc.† | | | 36,151 | | | | 1,504,750 | |
| | 60,000 | | | Rock Field Co. Ltd. | | | 402,002 | | | | 612,837 | |
| | 3,500 | | | The Boston Beer Co. Inc., Cl. A† | | | 598,838 | | | | 1,011,990 | |
| | 70,000 | | | The Hain Celestial Group Inc.† | | | 705,657 | | | | 604,100 | |
| | 56,000 | | | The J.M. Smucker Co. | | | 1,289,479 | | | | 6,781,600 | |
| | 625,000 | | | Tingyi (Cayman Islands) Holding Corp. | | | 1,326,207 | | | | 902,063 | |
| | 33,475 | | | Tootsie Roll Industries Inc. | | | 261,510 | | | | 1,036,721 | |
| | 370,000 | | | Vina Concha y Toro SA | | | 676,676 | | | | 455,372 | |
| | 950,000 | | | Vitasoy International Holdings Ltd. | | | 542,729 | | | | 675,791 | |
| | 20,000 | | | Willamette Valley Vineyards Inc.† | | | 73,225 | | | | 69,600 | |
| | 15,000 | | | WK Kellogg Co. | | | 151,800 | | | | 256,650 | |
| | 205,000 | | | Yakult Honsha Co. Ltd. | | | 2,470,225 | | | | 4,734,006 | |
| | | | | | | | 38,996,034 | | | | 83,999,450 | |
| | | | | Health Care — 3.3% | | | | | | | | |
| | 1,400 | | | Align Technology Inc.† | | | 9,766 | | | | 356,048 | |
See accompanying notes to financial statements.
The Gabelli Small Cap Growth Fund
Schedule of Investments (Continued) — September 30, 2024
| Shares | | | | | Cost | | | Market
Value | |
| | | | | COMMON STOCKS (Continued) | | | | | | | | |
| | | | | Health Care (Continued) | | | | | | | | |
| | 6,700 | | | Bio-Rad Laboratories Inc., Cl. A† | | $ | 283,604 | | | $ | 2,241,686 | |
| | 12,500 | | | Bruker Corp. | | | 95,311 | | | | 863,250 | |
| | 600 | | | Chemed Corp. | | | 8,238 | | | | 360,582 | |
| | 21,000 | | | CONMED Corp. | | | 429,146 | | | | 1,510,320 | |
| | 226,000 | | | Cutera Inc.† | | | 1,827,035 | | | | 178,269 | |
| | 50,000 | | | Dexcom Inc.† | | | 68,464 | | | | 3,352,000 | |
| | 28,675 | | | Electromed Inc.† | | | 404,307 | | | | 615,652 | |
| | 44,000 | | | Evolent Health Inc., Cl. A† | | | 823,898 | | | | 1,244,320 | |
| | 214,800 | | | Globus Medical Inc., Cl. A† | | | 5,530,787 | | | | 15,366,792 | |
| | 70,000 | | | Henry Schein Inc.† | | | 480,305 | | | | 5,103,000 | |
| | 28,000 | | | ICU Medical Inc.† | | | 892,631 | | | | 5,102,160 | |
| | 33,000 | | | Masimo Corp.† | | | 790,451 | | | | 4,399,890 | |
| | 45,000 | | | Neogen Corp.† | | | 430,861 | | | | 756,450 | |
| | 4,000 | | | NeoGenomics Inc.† | | | 49,880 | | | | 59,000 | |
| | 30,000 | | | Neuronetics Inc.† | | | 81,297 | | | | 22,794 | |
| | 170,000 | | | OPKO Health Inc.† | | | 393,670 | | | | 253,300 | |
| | 144,000 | | | Orthofix Medical Inc.† | | | 2,960,247 | | | | 2,249,280 | |
| | 23,000 | | | Patterson Companies Inc. | | | 512,829 | | | | 502,320 | |
| | 70,500 | | | QuidelOrtho Corp.† | | | 312,578 | | | | 3,214,800 | |
| | 22,000 | | | Seikagaku Corp. | | | 240,251 | | | | 130,110 | |
| | 22,500 | | | STERIS plc | | | 1,035,510 | | | | 5,457,150 | |
| | 19,000 | | | Straumann Holding AG | | | 170,618 | | | | 3,103,621 | |
| | 3,000 | | | Stryker Corp. | | | 142,188 | | | | 1,083,780 | |
| | 22,500 | | | SurModics Inc.† | | | 449,069 | | | | 872,550 | |
| | 6,500 | | | Teladoc Health Inc.† | | | 168,750 | | | | 59,670 | |
| | 400 | | | The Cooper Companies Inc.† | | | 3,627 | | | | 44,136 | |
| | 38,000 | | | United-Guardian Inc. | | | 332,419 | | | | 603,440 | |
| | 37,350 | | | Zimvie Inc.† | | | 593,193 | | | | 592,745 | |
| | | | | | | | 19,520,930 | | | | 59,699,115 | |
| | | | | Home Furnishings — 0.3% | | | | | | | | |
| | 161,500 | | | Bassett Furniture Industries Inc. | | | 1,528,689 | | | | 2,333,675 | |
| | 5,000 | | | Ethan Allen Interiors Inc. | | | 116,387 | | | | 159,450 | |
| | 54,500 | | | La-Z-Boy Inc. | | | 846,180 | | | | 2,339,685 | |
| | | | | | | | 2,491,256 | | | | 4,832,810 | |
| | | | | Hotels and Gaming — 3.8% | | | | | | | | |
| | 9,000 | | | Bally’s Corp.† | | | 94,759 | | | | 155,250 | |
| | 48,000 | | | Boyd Gaming Corp. | | | 203,631 | | | | 3,103,200 | |
| | 190,000 | | | Canterbury Park Holding Corp. | | | 1,949,758 | | | | 3,667,000 | |
| | 132,500 | | | Churchill Downs Inc. | | | 524,245 | | | | 17,915,325 | |
| | 120,000 | | | Formosa International Hotels Corp. | | | 775,629 | | | | 769,754 | |
| | 533,500 | | | Full House Resorts Inc.† | | | 1,559,776 | | | | 2,678,170 | |
| | 48,000 | | | Gaming and Leisure Properties Inc., REIT | | | 361,392 | | | | 2,469,600 | |
| | 750,000 | | | Genting Singapore Ltd. | | | 688,148 | | | | 510,601 | |
| Shares | | | | | Cost | | | Market
Value | |
| | 120,000 | | | Golden Entertainment Inc. | | $ | 1,800,595 | | | $ | 3,814,800 | |
| | 2,250,000 | | | Mandarin Oriental International Ltd. | | | 2,913,165 | | | | 3,825,000 | |
| | 3,000 | | | Penn Entertainment Inc.† | | | 13,028 | | | | 56,580 | |
| | 234,000 | | | Ryman Hospitality Properties Inc., REIT | | | 3,622,466 | | | | 25,094,160 | |
| | 2,500,000 | | | The Hongkong & Shanghai Hotels Ltd. | | | 2,476,225 | | | | 1,842,716 | |
| | 160,000 | | | The Marcus Corp. | | | 1,763,202 | | | | 2,411,200 | |
| | 13,300 | | | Wynn Resorts Ltd. | | | 23,676 | | | | 1,275,204 | |
| | | | | | | | 18,769,695 | | | | 69,588,560 | |
| | | | | Machinery — 2.1% | | | | | | | | |
| | 355,000 | | | Astec Industries Inc. | | | 12,305,160 | | | | 11,338,700 | |
| | 1,415,000 | | | CNH Industrial NV | | | 3,631,392 | | | | 15,706,500 | |
| | 100,000 | | | Kennametal Inc. | | | 1,912,660 | | | | 2,593,000 | |
| | 4,700 | | | Nordson Corp. | | | 77,665 | | | | 1,234,361 | |
| | 159,600 | | | The Eastern Co. | | | 3,107,044 | | | | 5,179,020 | |
| | 150,000 | | | Twin Disc Inc. | | | 1,669,489 | | | | 1,873,500 | |
| | | | | | | | 22,703,410 | | | | 37,925,081 | |
| | | | | Manufactured Housing and Recreational Vehicles — 2.0% | | | | | | | | |
| | 53,400 | | | Cavco Industries Inc.† | | | 1,033,544 | | | | 22,868,016 | |
| | 77,000 | | | Champion Homes Inc.† | | | 439,309 | | | | 7,303,450 | |
| | 73,000 | | | Nobility Homes Inc. | | | 857,853 | | | | 2,774,000 | |
| | 51,500 | | | Winnebago Industries Inc. | | | 584,494 | | | | 2,992,665 | |
| | | | | | | | 2,915,200 | | | | 35,938,131 | |
| | | | | Metals and Mining — 0.1% | | | | | | | | |
| | 45,000 | | | Ivanhoe Mines Ltd., Cl. A† | | | 117,783 | | | | 669,452 | |
| | 95,000 | | | Kinross Gold Corp. | | | 412,123 | | | | 889,200 | |
| | 50,000 | | | Sierra Metals Inc.† | | | 8,130 | | | | 28,500 | |
| | | | | | | | 538,036 | | | | 1,587,152 | |
| | | | | Publishing — 0.3% | | | | | | | | |
| | 2,700 | | | Graham Holdings Co., Cl. B | | | 1,295,342 | | | | 2,218,644 | |
| | 4,500 | | | John Wiley & Sons Inc., Cl. B | | | 17,438 | | | | 217,350 | |
| | 50,000 | | | Lee Enterprises Inc.† | | | 516,251 | | | | 435,500 | |
| | 34,000 | | | News Corp., Cl. A | | | 48,038 | | | | 905,420 | |
| | 771,000 | | | The E.W. Scripps Co., Cl. A† | | | 3,879,763 | | | | 1,730,895 | |
| | | | | | | | 5,756,832 | | | | 5,507,809 | |
| | | | | Real Estate — 1.8% | | | | | | | | |
| | 82,500 | | | Capital Properties Inc., Cl. A | | | 978,284 | | | | 815,100 | |
| | 18,007 | | | Gyrodyne LLC† | | | 295,989 | | | | 142,616 | |
| | 17,500 | | | Lamar Advertising Co., Cl. A, REIT | | | 115,464 | | | | 2,338,000 | |
| | 89,500 | | | Morguard Corp. | | | 1,134,374 | | | | 8,173,422 | |
| | 30,000 | | | Reading International Inc., Cl. A† | | | 133,615 | | | | 48,900 | |
| | 5,000 | | | Reading International Inc., Cl. B† | | | 90,515 | | | | 41,550 | |
See accompanying notes to financial statements.
The Gabelli Small Cap Growth Fund
Schedule of Investments (Continued) — September 30, 2024
| Shares | | | | | Cost | | | Market
Value | |
| | | | | COMMON STOCKS (Continued) | | | | | | | | |
| | | | | Real Estate (Continued) | | | | | | | | |
| | 32,500 | | | Seritage Growth Properties, Cl. A† | | $ | 346,745 | | | $ | 151,125 | |
| | 130,200 | | | Tejon Ranch Co.† | | | 2,851,518 | | | | 2,285,010 | |
| | 321,000 | | | The St. Joe Co. | | | 4,765,799 | | | | 18,717,510 | |
| | 100,000 | | | Trinity Place Holdings Inc.† | | | 174,522 | | | | 4,000 | |
| | | | | | | | 10,886,825 | | | | 32,717,233 | |
| | | | | Retail — 6.1% | | | | | | | | |
| | 105,800 | | | AutoNation Inc.† | | | 1,668,530 | | | | 18,929,736 | |
| | 117,500 | | | Big 5 Sporting Goods Corp. | | | 722,782 | | | | 245,575 | |
| | 1,100 | | | Biglari Holdings Inc., Cl. A† | | | 742,432 | | | | 915,596 | |
| | 294,500 | | | Copart Inc.† | | | 616,708 | | | | 15,431,800 | |
| | 126,000 | | | Hertz Global Holdings Inc.† | | | 879,093 | | | | 415,800 | |
| | 200,500 | | | Ingles Markets Inc., Cl. A | | | 2,581,815 | | | | 14,957,300 | |
| | 52,000 | | | Lands’ End Inc.† | | | 564,895 | | | | 898,040 | |
| | 70,000 | | | Movado Group Inc. | | | 1,036,083 | | | | 1,302,000 | |
| | 157,000 | | | Nathan’s Famous Inc. | | | 264,162 | | | | 12,701,300 | |
| | 68,000 | | | Penske Automotive Group Inc. | | | 990,762 | | | | 11,044,560 | |
| | 80,000 | | | Pets at Home Group plc | | | 137,119 | | | | 326,644 | |
| | 478,000 | | | Rush Enterprises Inc., Cl. B | | | 2,252,274 | | | | 22,920,100 | |
| | 18,500 | | | Salvatore Ferragamo SpA | | | 298,939 | | | | 142,711 | |
| | 15,000 | | | The Cheesecake Factory Inc. | | | 285,074 | | | | 608,250 | |
| | 23,500 | | | Tractor Supply Co. | | | 201,429 | | | | 6,836,855 | |
| | 59,200 | | | Village Super Market Inc., Cl. A | | | 1,442,885 | | | | 1,881,968 | |
| | 500 | | | Winmark Corp. | | | 34,190 | | | | 191,465 | |
| | | | | | | | 14,719,172 | | | | 109,749,700 | |
| | | | | Specialty Chemicals — 2.0% | | | | | | | | |
| | 3,200 | | | Albemarle Corp. | | | 47,663 | | | | 303,072 | |
| | 28,000 | | | Ashland Inc. | | | 210,127 | | | | 2,435,160 | |
| | 231,200 | | | H.B. Fuller Co. | | | 2,424,872 | | | | 18,352,656 | |
| | 35,700 | | | Hawkins Inc. | | | 582,452 | | | | 4,550,679 | |
| | 25,000 | | | Huntsman Corp. | | | 74,302 | | | | 605,000 | |
| | 5,600 | | | NewMarket Corp. | | | 561,284 | | | | 3,090,584 | |
| | 8,400 | | | Quaker Chemical Corp. | | | 128,365 | | | | 1,415,316 | |
| | 5,000 | | | Rogers Corp.† | | | 543,500 | | | | 565,050 | |
| | 23,500 | | | Sensient Technologies Corp. | | | 453,240 | | | | 1,885,170 | |
| | 2,500 | | | Takasago International Corp. | | | 66,073 | | | | 95,843 | |
| | 91,200 | | | The General Chemical Group Inc.†(b) | | | 1,186 | | | | 0 | |
| | 75,000 | | | Treatt plc | | | 443,245 | | | | 449,716 | |
| | 72,000 | | | Valvoline Inc.† | | | 203,561 | | | | 3,013,200 | |
| | | | | | | | 5,739,870 | | | | 36,761,446 | |
| | | | | Telecommunications — 0.8% | | | | | | | | |
| | 9,000 | | | Consolidated Communications Holdings Inc.† | | | 46,804 | | | | 41,760 | |
| | 61,000 | | | Gogo Inc.† | | | 292,823 | | | | 437,980 | |
| Shares | | | | | Cost | | | Market
Value | |
| | 3,500 | | | IDT Corp., Cl. B | | $ | 11,346 | | | $ | 133,595 | |
| | 165,000 | | | Liberty Global Ltd., Cl. A† | | | 3,351,386 | | | | 3,483,150 | |
| | 132,000 | | | Liberty Global Ltd., Cl. C† | | | 2,462,120 | | | | 2,852,520 | |
| | 57,718 | | | Liberty Latin America Ltd., Cl. A† | | | 462,756 | | | | 552,938 | |
| | 100 | | | Liberty Latin America Ltd., Cl. B† | | | 1,002 | | | | 1,600 | |
| | 85,200 | | | Nuvera Communications Inc.† | | | 625,848 | | | | 681,600 | |
| | 82,000 | | | Rogers Communications Inc., Cl. B | | | 293,920 | | | | 3,297,220 | |
| | 110,000 | | | Shenandoah Telecommunications Co. | | | 875,253 | | | | 1,552,100 | |
| | 40,000 | | | Telephone and Data Systems Inc. | | | 517,071 | | | | 930,000 | |
| | 42,856 | | | VEON Ltd., ADR† | | | 953,027 | | | | 1,303,680 | |
| | | | | | | | 9,893,356 | | | | 15,268,143 | |
| | | | | Transportation — 2.5% | | | | | | | | |
| | 324,000 | | | GATX Corp. | | | 9,044,282 | | | | 42,913,800 | |
| | 18,600 | | | Irish Continental Group plc | | | 13,660 | | | | 113,875 | |
| | 124,000 | | | Navigator Holdings Ltd. | | | 1,188,912 | | | | 1,992,680 | |
| | 52,511 | | | Steel Connect Inc.† | | | 576,811 | | | | 553,991 | |
| | | | | | | | 10,823,665 | | | | 45,574,346 | |
| | | | | Wireless Communications — 0.2% | | | | | | | | |
| | 49,000 | | | United States Cellular Corp.† | | | 1,270,628 | | | | 2,677,850 | |
| | | | | | | | | | | | | |
| | | | | TOTAL COMMON STOCKS | | | 424,875,703 | | | | 1,789,455,283 | |
| | | | | | | | | | | | | |
| | | | | CLOSED-END FUNDS — 0.1% | | | | | | | | |
| | 39,000 | | | The Central Europe, Russia, and Turkey Fund Inc. | | | 652,397 | | | | 418,080 | |
| | 32,229 | | | The European Equity Fund Inc. | | | 319,370 | | | | 302,308 | |
| | 109,000 | | | The New Germany Fund Inc. | | | 1,435,943 | | | | 973,370 | |
| | | | | | | | 2,407,710 | | | | 1,693,758 | |
| | | | | TOTAL CLOSED-END FUNDS | | | 2,407,710 | | | | 1,693,758 | |
| | | | | | | | | | | | | |
| | | | | PREFERRED STOCKS — 0.1% | | | | | | | | |
| | | | | Automotive: Parts and Accessories — 0.1% | | | | | | | | |
| | 82,500 | | | Jungheinrich AG | | | 563,490 | | | | 2,485,052 | |
| | | | | | | | | | | | | |
| | | | | RIGHTS — 0.0% | | | | | | | | |
| | | | | Communications Equipment — 0.0% | | | | | | | | |
| | 60,500 | | | Pineapple Energy Inc., CVR† | | | 0 | | | | 63,840 | |
See accompanying notes to financial statements.
The Gabelli Small Cap Growth Fund
Schedule of Investments (Continued) — September 30, 2024
| Shares | | | | | Cost | | | Market
Value | |
| | | | | WARRANTS — 0.0% | | | | | | | | |
| | | | | Diversified Industrial — 0.0% | | | | | | | | |
| | 140,000 | | | Ampco-Pittsburgh Corp., expire 08/01/25† | | $ | 95,648 | | | $ | 14,350 | |
| | | | | | | | | | | | | |
Principal
Amount | | | | | | | | | |
| | | | | CONVERTIBLE CORPORATE BONDS — 0.0% | | | | | | | | |
| | | | | Cable — 0.0% | | | | | | | | |
| $ | 200,000 | | | AMC Networks Inc., | | | | | | | | |
| | | | | 4.250%, 02/15/29(c) | | | 197,972 | | | | 184,500 | |
| | | | | | | | | | | | | |
| | | | | U.S. GOVERNMENT OBLIGATIONS — 0.7% | | | | | | | | |
| | 11,845,000 | | | U.S. Treasury Bills, | | | | | | | | |
| | | | | 4.535% to 5.042%††, 11/29/24 to 12/26/24 | | | 11,726,879 | | | | 11,728,510 | |
| | | | | | | | | | | | | |
| | | | | TOTAL MISCELLANEOUS INVESTMENTS — 0.4%(d) | | | 8,269,369 | | | | 7,024,112 | |
| | | | | | | | | | | | | |
| | | | | TOTAL INVESTMENTS — 100.2% | | $ | 448,136,771 | | | | 1,812,649,405 | |
| | | | | | | | | | | | | |
| | | | | Other Assets and Liabilities (Net) — (0.2)% | | | | | | | (3,130,894 | ) |
| | | | | | | | | | | | | |
| | | | | NET ASSETS — 100.0% | | | | | | $ | 1,809,518,511 | |
| (a) | Security considered an affiliated holding because the Fund owns at least 5% of its outstanding shares. See Note 9. |
| (b) | Security is valued using significant unobservable inputs and is classified as Level 3 in the fair value hierarchy. |
| (c) | Security exempt from registration under Rule 144A of the Securities Act of 1933, as amended. This security may be resold in transactions exempt from registration, normally to qualified institutional buyers. |
| (d) | Represents undisclosed, unrestricted securities which the Fund has held for less than one year. |
| † | Non-income producing security. |
| †† | Represents annualized yields at dates of purchase. |
| | |
| ADR | American Depositary Receipt |
| CVR | Contingent Value Right |
| REIT | Real Estate Investment Trust |
See accompanying notes to financial statements.
The Gabelli Small Cap Growth Fund
Statement of Assets and Liabilities
September 30, 2024
| Assets: | | | | |
| Investments, at value (cost $438,787,077) | | $ | 1,783,890,355 | |
| Investments in affiliates, at value (cost $9,349,694) | | | 28,759,050 | |
| Cash | | | 34,519 | |
| Foreign currency, at value (cost $104,272) | | | 103,833 | |
| Receivable for Fund shares sold | | | 1,010,903 | |
| Receivable for investments sold | | | 138,076 | |
| Dividends and interest receivable | | | 1,368,181 | |
| Prepaid expenses | | | 97,401 | |
| Total Assets | | | 1,815,402,318 | |
| Liabilities: | | | | |
| Payable for investments purchased | | | 51,029 | |
| Payable for Fund shares redeemed | | | 3,908,224 | |
| Payable for investment advisory fees | | | 1,432,727 | |
| Payable for distribution fees | | | 195,548 | |
| Payable for accounting fees | | | 11,250 | |
| Other accrued expenses | | | 285,029 | |
| Total Liabilities | | | 5,883,807 | |
| Net Assets | | | | |
| (applicable to 37,863,886 shares outstanding) | | $ | 1,809,518,511 | |
| | | | | |
| Net Assets Consist of: | | | | |
| Paid-in capital | | $ | 360,750,028 | |
| Total distributable earnings | | | 1,448,768,483 | |
| Net Assets | | $ | 1,809,518,511 | |
| | | | | |
| Shares of Capital Stock, each at $0.001 par value: | | | | |
| Class AAA: | | | | |
| Net Asset Value, offering, and redemption price per share ($736,555,080 ÷ 15,702,069 shares outstanding; 150,000,000 shares authorized) | | $ | 46.91 | |
| Class A: | | | | |
| Net Asset Value and redemption price per share ($147,123,073 ÷ 3,140,143 shares outstanding; 50,000,000 shares authorized) | | $ | 46.85 | |
| Maximum offering price per share (NAV ÷ 0.9425, based on maximum sales charge of 5.75% of the offering price) | | $ | 49.71 | |
| Class C: | | | | |
| Net Asset Value and offering price per share ($23,113,621 ÷ 668,188 shares outstanding; 50,000,000 shares authorized) | | $ | 34.59 | (a) |
| Class I: | | | | |
| Net Asset Value, offering, and redemption price per share ($902,726,737 ÷ 18,353,486 shares outstanding; 50,000,000 shares authorized) | | $ | 49.19 | |
| (a) | Redemption price varies based on the length of time held. |
Statement of Operations
For the Year Ended September 30, 2024
| Investment Income: | | | | |
| Dividends - unaffiliated (net of foreign withholding taxes of $290,619) | | $ | 23,347,358 | |
| Dividends - affiliated | | | 48,618 | |
| Interest | | | 980,106 | |
| Total Investment Income | | | 24,376,082 | |
| Expenses: | | | | |
| Investment advisory fees | | | 17,017,074 | |
| Distribution fees - Class AAA | | | 2,219,843 | |
| Distribution fees - Class A | | | 339,454 | |
| Distribution fees - Class C | | | 257,420 | |
| Shareholder services fees | | | 1,295,728 | |
| Shareholder communications expenses | | | 329,056 | |
| Custodian fees | | | 140,247 | |
| Directors’ fees | | | 121,899 | |
| Legal and audit fees | | | 100,658 | |
| Accounting fees | | | 45,000 | |
| Registration expenses | | | 38,284 | |
| Interest expense | | | 1,112 | |
| Miscellaneous expenses | | | 137,487 | |
| Total Expenses | | | 22,043,262 | |
| Less: | | | | |
| Advisory fee reduction on unsupervised assets (See Note 3) | | | (76,509 | ) |
| Expenses paid indirectly by broker (See Note 6) | | | (23,682 | ) |
| Total Reductions | | | (100,191 | ) |
| Net Expenses | | | 21,943,071 | |
| Net Investment Income | | | 2,433,011 | |
| | | | | |
| Net Realized and Unrealized Gain/(Loss) on Investments and Foreign Currency: | | | | |
| Net realized gain on investments - unaffiliated | | | 118,464,394 | |
| Net realized gain on investments - affiliated | | | 2,275,526 | |
| Net realized loss on foreign currency transactions | | | (12,554 | ) |
| Net realized gain on investments and foreign currency transactions | | | 120,727,366 | |
| Net change in unrealized appreciation/depreciation: | | | | |
| on investments - unaffiliated | | | 265,848,650 | |
| on investments - affiliated | | | 13,411,984 | |
| on foreign currency translations | | | 11,763 | |
| Net change in unrealized appreciation/depreciation on investments and foreign currency translations | | | 279,272,397 | |
| Net Realized and Unrealized Gain/(Loss) on Investments and Foreign Currency | | | 399,999,763 | |
| Net Increase in Net Assets Resulting from Operations | | $ | 402,432,774 | |
See accompanying notes to financial statements.
The Gabelli Small Cap Growth Fund
Statement of Changes in Net Assets
| | | Year Ended
September 30,
2024 | | | Year Ended
September 30,
2023 | |
| Operations: | | | | | | | | |
| Net investment income | | $ | 2,433,011 | | | $ | 3,104,898 | |
| Net realized gain on investments and foreign currency transactions | | | 120,727,366 | | | | 153,029,636 | |
| Net change in unrealized appreciation/depreciation on investments and foreign currency translations | | | 279,272,397 | | | | 157,495,632 | |
| Net Increase in Net Assets Resulting from Operations | | | 402,432,774 | | | | 313,630,166 | |
| | | | | | | | | |
| Distributions to Shareholders: | | | | | | | | |
| Accumulated earnings | | | | | | | | |
| Class AAA | | | (80,231,713 | ) | | | (78,244,179 | ) |
| Class A | | | (10,652,797 | ) | | | (10,316,268 | ) |
| Class C | | | (2,482,651 | ) | | | (3,309,037 | ) |
| Class I | | | (45,194,453 | ) | | | (46,912,815 | ) |
| Total Distributions to Shareholders | | | (138,561,614 | ) | | | (138,782,299 | ) |
| | | | | | | | | |
| Capital Share Transactions: | | | | | | | | |
| Class AAA | | | (285,189,970 | ) | | | 591,787 | |
| Class A | | | 7,078,402 | | | | 1,334,405 | |
| Class C | | | (9,320,759 | ) | | | (10,408,315 | ) |
| Class I | | | 269,055,155 | | | | (9,319,216 | ) |
| Net Decrease in Net Assets from Capital Share Transactions | | | (18,377,172 | ) | | | (17,801,339 | ) |
| | | | | | | | | |
| Redemption Fees | | | 1,198 | | | | 2,662 | |
| | | | | | | | | |
| Net Increase in Net Assets | | | 245,495,186 | | | | 157,049,190 | |
| | | | | | | | | |
| Net Assets: | | | | | | | | |
| Beginning of year | | | 1,564,023,325 | | | | 1,406,974,135 | |
| End of year | | $ | 1,809,518,511 | | | $ | 1,564,023,325 | |
See accompanying notes to financial statements.
The Gabelli Small Cap Growth Fund
Financial Highlights
Selected data for a share of capital stock outstanding throughout each year:
| | | | | | Income (Loss) from Investment Operations | | | Distributions | | | | | | | | | Ratios to Average Net Assets/Supplemental Data | |
| Year Ended September 30 | | Net Asset Value,
Beginning
of Year | | | Net Investment
Income
(Loss)(a)(b) | | | Net Realized
and Unrealized
Gain (Loss) on
Investments | | | Total from
Investment
Operations | | | Net Investment
Income | | | Net Realized
Gain on
Investments | | | Total
Distributions | | | Redemption
Fees(a)(c) | | | Net Asset Value,
End of Year | | | Total
Return† | | | Net Assets,
End of Year
(in 000’s) | | | Net Investment
Income (Loss)(b) | | | Operating
Expenses
Before
Reimbursement | | | Operating
Expenses
Net of
Reimbursement(d)(e)(f) | | | Portfolio
Turnover
Rate | |
| Class AAA | | | | | | | | | | | | | | | | | | | | | | | | | | | | | | | | | | | | | | | | | | | | | | | | | | | | | | | | | | | | |
| 2024 | | $ | 40.51 | | | $ | 0.03 | | | $ | 10.00 | | | $ | 10.03 | | | $ | (0.08 | ) | | $ | (3.55 | ) | | $ | (3.63 | ) | | $ | 0.00 | | | $ | 46.91 | | | | 27.24 | % | | $ | 736,555 | | | | 0.06 | % | | | 1.38 | % | | | 1.37 | % | | | 2 | % |
| 2023 | | | 36.11 | | | | 0.05 | | | | 7.96 | | | | 8.01 | | | | (0.01 | ) | | | (3.60 | ) | | | (3.61 | ) | | | 0.00 | | | | 40.51 | | | | 22.70 | | | | 899,376 | | | | 0.13 | | | | 1.39 | | | | 1.39 | | | | 1 | |
| 2022 | | | 49.61 | | | | 0.02 | | | | (7.13 | ) | | | (7.11 | ) | | | (0.05 | ) | | | (6.34 | ) | | | (6.39 | ) | | | 0.00 | | | | 36.11 | | | | (17.07 | ) | | | 798,836 | | | | 0.05 | | | | 1.39 | | | | 1.39 | | | | 1 | |
| 2021 | | | 43.30 | | | | 0.04 | | | | 15.83 | | | | 15.87 | | | | — | | | | (9.56 | ) | | | (9.56 | ) | | | 0.00 | | | | 49.61 | | | | 42.16 | | | | 1,054,894 | | | | 0.09 | | | | 1.38 | | | | 1.38 | | | | 1 | |
| 2020 | | | 53.92 | | | | 0.04 | | | | (0.63 | ) | | | (0.59 | ) | | | (0.07 | ) | | | (9.96 | ) | | | (10.03 | ) | | | 0.00 | | | | 43.30 | | | | (2.08 | ) | | | 884,341 | | | | 0.08 | | | | 1.41 | | | | 1.41 | | | | 0 | (g) |
| Class A | | | | | | | | | | | | | | | | | | | | | | | | | | | | | | | | | | | | | | | | | | | | | | | | | | | | | | | | | | | | |
| 2024 | | $ | 40.46 | | | $ | 0.02 | | | $ | 10.00 | | | $ | 10.02 | | | $ | (0.08 | ) | | $ | (3.55 | ) | | $ | (3.63 | ) | | $ | 0.00 | | | $ | 46.85 | | | | 27.24 | % | | $ | 147,123 | | | | 0.06 | % | | | 1.38 | % | | | 1.37 | % | | | 2 | % |
| 2023 | | | 36.06 | | | | 0.05 | | | | 7.95 | | | | 8.00 | | | | 0.00 | (c) | | | (3.60 | ) | | | (3.60 | ) | | | 0.00 | | | | 40.46 | | | | 22.72 | | | | 118,557 | | | | 0.13 | | | | 1.39 | | | | 1.39 | | | | 1 | |
| 2022 | | | 49.56 | | | | 0.02 | | | | (7.13 | ) | | | (7.11 | ) | | | (0.05 | ) | | | (6.34 | ) | | | (6.39 | ) | | | 0.00 | | | | 36.06 | | | | (17.08 | ) | | | 104,317 | | | | 0.04 | | | | 1.39 | | | | 1.39 | | | | 1 | |
| 2021 | | | 43.26 | | | | 0.04 | | | | 15.82 | | | | 15.86 | | | | — | | | | (9.56 | ) | | | (9.56 | ) | | | 0.00 | | | | 49.56 | | | | 42.17 | | | | 134,005 | | | | 0.08 | | | | 1.38 | | | | 1.38 | | | | 1 | |
| 2020 | | | 53.89 | | | | 0.05 | | | | (0.64 | ) | | | (0.59 | ) | | | (0.08 | ) | | | (9.96 | ) | | | (10.04 | ) | | | 0.00 | | | | 43.26 | | | | (2.08 | ) | | | 110,975 | | | | 0.11 | | | | 1.41 | | | | 1.41 | | | | 0 | (g) |
| Class C | | | | | | | | | | | | | | | | | | | | | | | | | | | | | | | | | | | | | | | | | | | | | | | | | | | | | | | | | | | | |
| 2024 | | $ | 30.09 | | | $ | (0.22 | ) | | $ | 7.41 | | | $ | 7.19 | | | $ | (0.06 | ) | | $ | (2.63 | ) | | $ | (2.69 | ) | | $ | 0.00 | | | $ | 34.59 | | | | 26.29 | % | | $ | 23,114 | | | | (0.70 | )% | | | 2.13 | % | | | 2.12 | % | | | 2 | % |
| 2023 | | | 27.02 | | | | (0.19 | ) | | | 5.95 | | | | 5.76 | | | | — | | | | (2.69 | ) | | | (2.69 | ) | | | 0.00 | | | | 30.09 | | | | 21.79 | | | | 28,818 | | | | (0.64 | ) | | | 2.14 | | | | 2.14 | | | | 1 | |
| 2022 | | | 38.86 | | | | (0.24 | ) | | | (5.26 | ) | | | (5.50 | ) | | | — | | | | (6.34 | ) | | | (6.34 | ) | | | 0.00 | | | | 27.02 | | | | (17.69 | ) | | | 35,068 | | | | (0.72 | ) | | | 2.14 | | | | 2.14 | | | | 1 | |
| 2021 | | | 35.95 | | | | (0.24 | ) | | | 12.71 | | | | 12.47 | | | | — | | | | (9.56 | ) | | | (9.56 | ) | | | 0.00 | | | | 38.86 | | | | 41.10 | | | | 66,467 | | | | (0.64 | ) | | | 2.13 | | | | 2.13 | | | | 1 | |
| 2020 | | | 46.63 | | | | (0.24 | ) | | | (0.48 | ) | | | (0.72 | ) | | | — | | | | (9.96 | ) | | | (9.96 | ) | | | 0.00 | | | | 35.95 | | | | (2.80 | ) | | | 75,505 | | | | (0.65 | ) | | | 2.16 | | | | 2.16 | | | | 0 | (g) |
| Class I | | | | | | | | | | | | | | | | | | | | | | | | | | | | | | | | | | | | | | | | | | | | | | | | | | | | | | | | | | | | |
| 2024 | | $ | 42.36 | | | $ | 0.13 | | | $ | 10.49 | | | $ | 10.62 | | | $ | (0.08 | ) | | $ | (3.71 | ) | | $ | (3.79 | ) | | $ | 0.00 | | | $ | 49.19 | | | | 27.58 | % | | $ | 902,727 | | | | 0.30 | % | | | 1.13 | % | | | 1.12 | % | | | 2 | % |
| 2023 | | | 37.76 | | | | 0.16 | | | | 8.32 | | | | 8.48 | | | | (0.11 | ) | | | (3.77 | ) | | | (3.88 | ) | | | 0.00 | | | | 42.36 | | | | 23.02 | | | | 517,272 | | | | 0.38 | | | | 1.14 | | | | 1.14 | | | | 1 | |
| 2022 | | | 51.62 | | | | 0.13 | | | | (7.47 | ) | | | (7.34 | ) | | | (0.18 | ) | | | (6.34 | ) | | | (6.52 | ) | | | 0.00 | | | | 37.76 | | | | (16.88 | ) | | | 468,753 | | | | 0.29 | | | | 1.14 | | | | 1.14 | | | | 1 | |
| 2021 | | | 44.62 | | | | 0.17 | | | | 16.39 | | | | 16.56 | | | | — | | | | (9.56 | ) | | | (9.56 | ) | | | 0.00 | | | | 51.62 | | | | 42.51 | | | | 644,066 | | | | 0.34 | | | | 1.13 | | | | 1.13 | | | | 1 | |
| 2020 | | | 55.29 | | | | 0.15 | | | | (0.64 | ) | | | (0.49 | ) | | | (0.22 | ) | | | (9.96 | ) | | | (10.18 | ) | | | 0.00 | | | | 44.62 | | | | (1.83 | ) | | | 568,065 | | | | 0.34 | | | | 1.16 | | | | 1.16 | | | | 0 | (g) |
| † | Total return represents aggregate total return of a hypothetical investment at the beginning of the year and sold at the end of the year including reinvestment of distributions and does not reflect the applicable sales charges. |
| (a) | Per share amounts have been calculated using the average shares outstanding method. |
| (b) | Due to capital share activity throughout the period, net investment income/(loss) per share and the ratio to average net assets may not be necessarily correlated among the different classes of shares. |
| (c) | Amount represents less than $0.005 per share. |
| (d) | The Fund received credits from a designated broker who agreed to pay certain Fund operating expenses. For all the years presented, there was no material impact to the expense ratios. |
| (e) | The Fund incurred interest expense for all years presented. For the fiscal years ended September 30, 2023, 2022, 2021, and 2020, if interest expense had not been incurred, the ratios of operating expenses to average net assets would have been 1.38%, 1.38%, 1.37%, and 1.39% (Class AAA and Class A), 2.13%, 2.13%, 2.12%, and 2.14% (Class C), and 1.13%, 1.13%, 1.12%, and 1.14% (Class I), respectively. For the fiscal year ended September 30, 2024, there was no material impact to the expense ratios. |
| (f) | Ratio of operating expenses includes advisory fee reduction on unsupervised assets totaling 0.01% of net assets for the fiscal year ended September 30, 2020. For the fiscal years ended September 30, 2024, 2023, 2022, and 2021, there was no material impact on the expense ratios. |
| (g) | Amount represents less than 0.5%. |
See accompanying notes to financial statements.
The Gabelli Small Cap Growth Fund
Notes to Financial Statements
1. Organization. The Gabelli Small Cap Growth Fund, a series of the Gabelli Equity Series Funds, Inc. (the Corporation), was incorporated on July 25, 1991 in Maryland. The Fund is a diversified open-end management investment company registered under the Investment Company Act of 1940, as amended (the 1940 Act), and is one of four separately managed portfolios (collectively, the Portfolios) of the Corporation. The Fund seeks to provide a high level of capital appreciation. The Fund commenced investment operations on October 22, 1991. The Adviser currently characterizes small capitalization companies for the Fund as those with total common stock market values of $3 billion or less at the time of investment.
Gabelli Funds, LLC (the “Adviser”), with its principal offices located at One Corporate Center, Rye, New York 10580-1422, serves as investment adviser to the Fund. The Adviser makes investment decisions for the Fund and continuously reviews and administers the Funds’ investment program and manages the operations of each Fund under the general supervision of the Company’s Board.
2. Significant Accounting Policies. As an investment company, the Fund follows the investment company accounting and reporting guidance, which is part of U.S. generally accepted accounting principles (GAAP) that may require the use of management estimates and assumptions in the preparation of its financial statements. Actual results could differ from those estimates. The following is a summary of significant accounting policies followed by the Fund in the preparation of its financial statements.
Security Valuation. Portfolio securities listed or traded on a nationally recognized securities exchange or traded in the U.S. over-the-counter market for which market quotations are readily available are valued at the last quoted sale price or a market’s official closing price as of the close of business on the day the securities are being valued. If there were no sales that day, the security is valued at the average of the closing bid and asked prices or, if there were no asked prices quoted on that day, then the security is valued at the closing bid price on that day. If no bid or asked prices are quoted on such day, the security is valued at the most recently available price or, if the Board of Directors (the Board) so determines, by such other method as the Board shall determine in good faith to reflect its fair market value. Portfolio securities traded on more than one national securities exchange or market are valued according to the broadest and most representative market, as determined by the Adviser.
Portfolio securities primarily traded on a foreign market are generally valued at the preceding closing values of such securities on the relevant market, but may be fair valued pursuant to procedures established by the Board if market conditions change significantly after the close of the foreign market, but prior to the close of business on the day the securities are being valued. Debt obligations for which market quotations are readily available are valued at the average of the latest bid and asked prices. If there were no asked prices quoted on such day, the security is valued using the closing bid price, unless the Board determines such amount does not reflect the securities’ fair value, in which case these securities will be fair valued as determined by the Board. Certain securities are valued principally using dealer quotations. Futures contracts are valued at the closing settlement price of the exchange or board of trade on which the applicable contract is traded. OTC futures and options on futures for which market quotations are readily available will be valued by quotations received from a pricing service or, if no quotations are available from a pricing service, by quotations obtained from one of more dealers in the instrument in question by the Adviser.
Securities and assets for which market quotations are not readily available are fair valued as determined by the Board. Fair valuation methodologies and procedures may include, but are not limited to: analysis and review of available financial and non-financial information about the company; comparisons with the valuation and
The Gabelli Small Cap Growth Fund
Notes to Financial Statements (Continued)
changes in valuation of similar securities, including a comparison of foreign securities with the equivalent U.S. dollar value American Depositary Receipt securities at the close of the U.S. exchange; and evaluation of any other information that could be indicative of the value of the security.
The inputs and valuation techniques used to measure fair value of the Fund’s investments are summarized into three levels as described in the hierarchy below:
| ● | Level 1 — quoted prices in active markets for identical securities; |
| ● | Level 2 — other significant observable inputs (including quoted prices for similar securities, interest rates, prepayment speeds, credit risk, etc.); and |
| ● | Level 3 — significant unobservable inputs (including the Board’s determinations as to the fair value of investments). |
A financial instrument’s level within the fair value hierarchy is based on the lowest level of any input both individually and in the aggregate that is significant to the fair value measurement. The inputs or methodology used for valuing securities are not necessarily an indication of the risk associated with investing in those securities. The summary of the Fund’s investments in securities by inputs used to value the Fund’s investments as of September 30, 2024 is as follows:
| | | Valuation Inputs | | | | |
| | | Level 1
Quoted Prices | | | Level 2
Other Significant
Observable
Inputs(a) | | | Level 3
Significant
Unobservable
Inputs(b) | | | Total
Market Value
at 09/30/24 | |
| INVESTMENTS IN SECURITIES: | | | | | | | | | | | | | | | | |
| ASSETS (Market Value): | | | | | | | | | | | | | | | | |
| Common Stocks: | | | | | | | | | | | | | | | | |
| Automotive: Parts and Accessories | | $ | 85,979,317 | | | $ | 0 | | | | — | | | $ | 85,979,317 | |
| Aviation: Parts and Services | | | 26,695,414 | | | | 3,622,943 | | | | — | | | | 30,318,357 | |
| Business Services | | | 49,153,525 | | | | 1,162,400 | | | | — | | | | 50,315,925 | |
| Consumer Services | | | 17,768,270 | | | | 201,135 | | | | — | | | | 17,969,405 | |
| Diversified Industrial | | | 223,364,508 | | | | 1,137,875 | | | | — | | | | 224,502,383 | |
| Equipment and Supplies | | | 342,201,496 | | | | 3,893,243 | | | | — | | | | 346,094,739 | |
| Financial Services | | | 121,119,944 | | | | 710,450 | | | $ | 5,000 | | | | 121,835,394 | |
| Food and Beverage | | | 84,711,660 | | | | 4,536 | | | | — | | | | 84,716,196 | |
| Manufactured Housing and Recreational Vehicles | | | 33,164,131 | | | | 2,774,000 | | | | — | | | | 35,938,131 | |
| Real Estate | | | 32,574,617 | | | | 142,616 | | | | — | | | | 32,717,233 | |
| Specialty Chemicals | | | 36,761,446 | | | | — | | | | 0 | | | | 36,761,446 | |
| Telecommunications | | | 15,266,543 | | | | 1,600 | | | | — | | | | 15,268,143 | |
| Other Industries (c) | | | 714,062,726 | | | | — | | | | — | | | | 714,062,726 | |
| Total Common Stocks | | | 1,782,823,597 | | | | 13,650,798 | | | | 5,000 | | | | 1,796,479,395 | |
| Closed-End Funds | | | 1,693,758 | | | | — | | | | — | | | | 1,693,758 | |
| Preferred Stocks (c) | | | 2,485,052 | | | | — | | | | — | | | | 2,485,052 | |
| Rights (c) | | | — | | | | 63,840 | | | | — | | | | 63,840 | |
| Warrants (c) | | | 14,350 | | | | — | | | | — | | | | 14,350 | |
| Convertible Corporate Bonds (c) | | | — | | | | 184,500 | | | | — | | | | 184,500 | |
| U.S. Government Obligations | | | — | | | | 11,728,510 | | | | — | | | | 11,728,510 | |
| TOTAL INVESTMENTS IN SECURITIES – ASSETS | | $ | 1,787,016,757 | | | $ | 25,627,648 | | | $ | 5,000 | | | $ | 1,812,649,405 | |
The Gabelli Small Cap Growth Fund
Notes to Financial Statements (Continued)
| (a) | Per pricing procedures approved by the Board, the Level 2 common stock securities used mean prices as there was no trading volume on the valuation date. |
| (b) | The inputs for these securities are not readily available and are derived based on the judgment of the Adviser according to procedures approved by the Board. |
| (c) | Please refer to the Schedule of Investments for the industry classifications of these portfolio holdings. |
Additional Information to Evaluate Qualitative Information.
General. The Fund uses recognized industry pricing services – approved by the Board and unaffiliated with the Adviser – to value most of its securities, and uses broker quotes provided by market makers of securities not valued by these and other recognized pricing sources. Several different pricing feeds are received to value domestic equity securities, international equity securities, preferred equity securities, and fixed income securities. The data within these feeds are ultimately sourced from major stock exchanges and trading systems where these securities trade. The prices supplied by external sources are checked by obtaining quotations or actual transaction prices from market participants. If a price obtained from the pricing source is deemed unreliable, prices will be sought from another pricing service or from a broker/dealer that trades that security or similar securities.
Fair Valuation. Fair valued securities may be common or preferred equities, warrants, options, rights, or fixed income obligations. Where appropriate, Level 3 securities are those for which market quotations are not available, such as securities not traded for several days, or for which current bids are not available, or which are restricted as to transfer. When fair valuing a security, factors to consider include recent prices of comparable securities that are publicly traded, reliable prices of securities not publicly traded, the use of valuation models, current analyst reports, valuing the income or cash flow of the issuer, or cost if the preceding factors do not apply. A significant change in the unobservable inputs could result in a lower or higher value in Level 3 securities. The circumstances of Level 3 securities are frequently monitored to determine if fair valuation measures continue to apply.
The Adviser reports quarterly to the Board the results of the application of fair valuation policies and procedures. These may include backtesting the prices realized in subsequent trades of these fair valued securities to fair values previously recognized.
Foreign Currency Translations. The books and records of the Fund are maintained in U.S. dollars. Foreign currencies, investments, and other assets and liabilities are translated into U.S. dollars at current exchange rates. Purchases and sales of investment securities, income, and expenses are translated at the exchange rate prevailing on the respective dates of such transactions. Unrealized gains and losses that result from changes in foreign exchange rates and/or changes in market prices of securities have been included in unrealized appreciation/depreciation on investments and foreign currency translations. Net realized foreign currency gains and losses resulting from changes in exchange rates include foreign currency gains and losses between trade date and settlement date on investment securities transactions, foreign currency transactions, and the difference between the amounts of interest and dividends recorded on the books of the Fund and the amounts actually received. The portion of foreign currency gains and losses related to fluctuation in exchange rates between the initial purchase trade date and subsequent sale trade date is included in realized gain/(loss) on investments.
Foreign Securities. The Fund may directly purchase securities of foreign issuers. Investing in securities of foreign issuers involves special risks not typically associated with investing in securities of U.S. issuers. The risks include possible revaluation of currencies, the inability to repatriate funds, less complete financial information
The Gabelli Small Cap Growth Fund
Notes to Financial Statements (Continued)
about companies, and possible future adverse political and economic developments. Moreover, securities of many foreign issuers and their markets may be less liquid and their prices more volatile than securities of comparable U.S. issuers.
Foreign Taxes. The Fund may be subject to foreign taxes on income, gains on investments, or currency repatriation, a portion of which may be recoverable. The Fund will accrue such taxes and recoveries as applicable, based upon its current interpretation of tax rules and regulations that exist in the markets in which it invests.
Restricted Securities. The Fund may invest up to 15% of its net assets in securities for which the markets are restricted. Restricted securities include securities whose disposition is subject to substantial legal or contractual restrictions. The sale of restricted securities often requires more time and results in higher brokerage charges or dealer discounts and other selling expenses than the sale of securities eligible for trading on national securities exchanges or in the over-the-counter markets. Restricted securities may sell at a price lower than similar securities that are not subject to restrictions on resale. Securities freely saleable among qualified institutional investors under special rules adopted by the SEC may be treated as liquid if they satisfy liquidity standards established by the Board. The continued liquidity of such securities is not as well assured as that of publicly traded securities, and accordingly the Board will monitor their liquidity. At September 30, 2024, the Fund did not hold any restricted securities.
Investments in Other Investment Companies. The Fund may invest, from time to time, in shares of other investment companies (or entities that would be considered investment companies but are excluded from the definition pursuant to certain exceptions under the 1940 Act) (the Acquired Funds) in accordance with the 1940 Act and related rules. Shareholders in the Fund would bear the pro rata portion of the periodic expenses of the Acquired Funds in addition to the Fund’s expenses. For the fiscal year ended September 30, 2024, the Fund’s pro rata portion of the periodic expenses charged by the Acquired Funds was less than one basis point.
Securities Transactions and Investment Income. Securities transactions are accounted for on the trade date with realized gain/(loss) on investments determined by using the identified cost method. Interest income (including amortization of premium and accretion of discount) is recorded on an accrual basis. Premiums and discounts on debt securities are amortized using the effective yield to maturity method or amortized to earliest call date, if applicable. Dividend income is recorded on the ex-dividend date, except for certain dividends from foreign securities that are recorded as soon after the ex-dividend date as the Fund becomes aware of such dividends.
Determination of Net Asset Value and Calculation of Expenses. Certain administrative expenses are common to, and allocated among, various affiliated funds. Such allocations are made on the basis of each fund’s average net assets or other criteria directly affecting the expenses as determined by the Adviser pursuant to procedures established by the Board.
In calculating the NAV per share of each class, investment income, realized and unrealized gains and losses, redemption fees, and expenses other than class specific expenses are allocated daily to each class of shares based upon the proportion of net assets of each class at the beginning of each day. Distribution expenses are borne solely by the class incurring the expense.
Distributions to Shareholders. Distributions to shareholders are recorded on the ex-dividend date. Distributions to shareholders are based on income and capital gains as determined in accordance with federal income tax regulations, which may differ from income and capital gains as determined under GAAP. These differences are
The Gabelli Small Cap Growth Fund
Notes to Financial Statements (Continued)
primarily due to differing treatments of income and gains as determined under the GAAP. Distributions from net investment income for federal income tax purposes include net realized gains on foreign currency transactions. These book/tax differences are either temporary or permanent in nature. To the extent these differences are permanent, adjustments are made to the appropriate capital accounts in the period when the differences arise. Permanent differences were primarily due to utilization of tax equalization. These reclassifications have no impact on the NAV of the Fund. For the fiscal year ended September 30, 2024, reclassifications were made to increase paid-in capital by $7,714,441, with an offsetting adjustment to total distributable earnings.
The tax character of distributions paid during the fiscal years ended September 30, 2024 and 2023 was as follows:
| | | Year ended
September 30,
2024* | | | Year ended
September 30,
2023* | |
| Distributions paid from: | | | | | | | | |
| Ordinary income (inclusive of short term capital gains) | | $ | 3,883,698 | | | $ | 2,325,442 | |
| Net long term capital gains | | | 142,401,412 | | | | 146,113,135 | |
| Total distributions paid | | $ | 146,285,110 | | | $ | 148,438,577 | |
| * | Total distributions paid differs from the Statement of Changes in Net Assets due to the utilization of equalization. |
Provision for Income Taxes. The Fund intends to continue to qualify as a regulated investment company under Subchapter M of the Internal Revenue Code of 1986, as amended (the Code). It is the policy of the Fund to comply with the requirements of the Code applicable to regulated investment companies and to distribute substantially all of its net investment company taxable income and net capital gains. Therefore, no provision for federal income taxes is required.
At September 30, 2024, the components of accumulated earnings/losses on a tax basis were as follows:
| Undistributed ordinary income | | $ | 2,710,394 | |
| Undistributed long term capital gains | | | 101,579,551 | |
| Net unrealized appreciation on investments and foreign currency translations | | | 1,344,478,538 | |
| Total | | $ | 1,448,768,483 | |
At September 30, 2024, the temporary difference between book basis and tax basis net unrealized appreciation on investments was due to deferral of losses from wash sales for tax purposes, mark-to-market adjustments on investments considered passive foreign investment companies, tax basis adjustments on investments in partnerships, and tax basis adjustments on investments in real estate investment trusts.
The following summarizes the tax cost of investments and the related net unrealized appreciation at September 30, 2024:
| | | | Cost | | | Gross
Unrealized
Appreciation | | | Gross
Unrealized
Depreciation | | | Net
Unrealized
Appreciation | |
| Investments | | | $ | 468,165,886 | | | $ | 1,394,756,032 | | | $ | (50,272,513 | ) | | $ | 1,344,483,519 | |
The Gabelli Small Cap Growth Fund
Notes to Financial Statements (Continued)
The Fund is required to evaluate tax positions taken or expected to be taken in the course of preparing the Fund’s tax returns to determine whether the tax positions are “more-likely-than-not” of being sustained by the applicable tax authority. Income tax and related interest and penalties would be recognized by the Fund as tax expense in the Statement of Operations if the tax positions were deemed not to meet the more-likely-than-not threshold. During the fiscal year ended September 30, 2024, the Fund did not incur any income tax, interest, or penalties. As of September 30, 2024, the Adviser has reviewed all open tax years and concluded that there was no impact to the Fund’s net assets or results of operations. The Fund’s federal and state tax returns for the prior three fiscal years remain open, subject to examination. On an ongoing basis, the Adviser will monitor the Fund’s tax positions to determine if adjustments to this conclusion are necessary.
3. Investment Advisory Agreement and Other Transactions. The Fund has entered into an investment advisory agreement (the Advisory Agreement) with the Adviser which provides that the Fund will pay the Adviser a fee, computed daily and paid monthly, at the annual rate of 1.00% of the value of its average daily net assets. In accordance with the Advisory Agreement, the Adviser provides a continuous investment program for the Fund’s portfolio, oversees the administration of all aspects of the Fund’s business and affairs, and pays the compensation of all Officers and Directors of the Fund who are affiliated persons of the Adviser.
There was a reduction in the advisory fee paid to the Adviser relating to certain portfolio holdings, i.e., unsupervised assets, of the Fund with respect to which the Adviser transferred dispositive and voting control to the Fund’s Proxy Voting Committee. During the fiscal year ended September 30, 2024, the Fund’s Proxy Voting Committee exercised control and discretion over all rights to vote or consent with respect to such securities (L.S. Starrett Co. and Strattec Security Corp.), and the Adviser reduced its fee with respect to such securities by $76,509.
4. Distribution Plan. The Fund’s Board has adopted a distribution plan (the Plan) for each class of shares, except for Class I Shares, pursuant to Rule 12b-1 under the 1940 Act. Under the Class AAA, Class A, and Class C Share Plans, payments are authorized to G.distributors, LLC (the Distributor), an affiliate of the Adviser, at annual rates of 0.25%, 0.25%, and 1.00%, respectively, of the average daily net assets of those classes, the annual limitations under each Plan. Such payments are accrued daily and paid monthly.
5. Portfolio Securities. Purchases and sales of securities during the fiscal year ended September 30, 2024, other than short term securities and U.S. Government obligations, aggregated $41,509,949 and $171,262,526, respectively.
6. Transactions with Affiliates and Other Arrangements. During the fiscal year ended September 30, 2024, the Fund paid $44,939 in brokerage commissions on security trades to G.research, LLC, an affiliate of the Adviser. Additionally, the Distributor retained a total of $19,973 from investors representing commissions (sales charges and underwriting fees) on sales and redemptions of Fund shares.
During the fiscal year ended September 30, 2024, the Fund received credits from a designated broker who agreed to pay certain Fund operating expenses. The amount of such expenses paid through this directed brokerage arrangement during this period was $23,682.
The cost of calculating the Fund’s NAV per share is a Fund expense pursuant to the Advisory Agreement. During the fiscal year ended September 30, 2024, the Fund accrued $45,000 in connection with the cost of computing the Fund’s NAV.
The Gabelli Small Cap Growth Fund
Notes to Financial Statements (Continued)
The Corporation pays retainer and per meeting fees to Directors not affiliated with the Adviser, plus specified amounts to the Lead Director and Audit Committee Chairman. Directors are also reimbursed for out of pocket expenses incurred in attending meetings. Directors who are directors or employees of the Adviser or an affiliated company receive no compensation or expense reimbursement from the Corporation.
During the fiscal year ended September 30, 2024, the Fund engaged in purchase and sale transactions with funds that have a common investment adviser. These transactions complied with Rule 17a-7 under the Act and amounted to $33,900 and $64,200 in purchases and sales transactions, respectively.
7. Line of Credit. The Fund participates in an unsecured line of credit, which expires on February 26, 2025 and may be renewed annually, of up to $75,000,000 under which it may borrow up to 10% of its net assets from the bank for temporary borrowing purposes. Borrowings under this arrangement bear interest at a floating rate equal to the higher of the Overnight Federal Funds Rate plus 135 basis points or the Overnight Bank Funding Rate plus 135 basis points in effect on that day. This amount, if any, would be included in “Interest expense” in the Statement of Operations. At September 30, 2024, there were no borrowings outstanding under the line of credit.
The average daily amount of borrowings outstanding under the line of credit for 7 days of borrowings during the fiscal year ended September 30, 2024 was $14,651,714 with a weighted average interest rate of 6.58%. The maximum amount borrowed at any time during the fiscal year ended September 30, 2024 was $26,020,000.
8. Capital Stock. The Fund offers four classes of shares – Class AAA Shares, Class A Shares, Class C Shares, and Class I Shares. Class AAA and Class I Shares are offered without a sales charge. Class A Shares are subject to a maximum front-end sales charge of 5.75%. Class C Shares are subject to a 1.00% contingent deferred sales charge for one year after purchase.
The Fund imposes a redemption fee of 2.00% on all classes of shares that are redeemed or exchanged on or before the seventh day after the date of a purchase. The redemption fee is deducted from the proceeds otherwise payable to the redeeming shareholders and is retained by the Fund as an increase in paid-in capital. The redemption fees retained by the Fund during the fiscal years ended September 30, 2024 and 2023, if any, can be found in the Statement of Changes in Net Assets under Redemption Fees.
The Gabelli Small Cap Growth Fund
Notes to Financial Statements (Continued)
Transactions in shares of capital stock were as follows:
| | | Year Ended
September 30,
2024 | | | Year Ended
September 30,
2023 | |
| | | Shares | | | Amount | | | Shares | | | Amount | |
| Class AAA | | | | | | | | | | | | | | | | |
| Shares sold | | | 1,334,397 | | | $ | 55,387,301 | | | | 1,459,702 | | | $ | 59,287,899 | |
| Shares issued upon reinvestment of distributions | | | 2,122,481 | | | | 78,001,154 | | | | 1,968,082 | | | | 75,790,825 | |
| Shares redeemed | | | (9,956,447 | ) | | | (418,578,425 | ) | | | (3,350,834 | ) | | | (134,486,937 | ) |
| Net increase/(decrease) | | | (6,499,569 | ) | | $ | (285,189,970 | ) | | | 76,950 | | | $ | 591,787 | |
| | | | | | | | | | | | | | | | | |
| Class A | | | | | | | | | | | | | | | | |
| Shares sold | | | 529,785 | | | $ | 22,053,755 | | | | 386,753 | | | $ | 15,677,854 | |
| Shares issued upon reinvestment of distributions | | | 276,050 | | | | 10,131,018 | | | | 253,242 | | | | 9,739,703 | |
| Shares redeemed | | | (595,857 | ) | | | (25,106,371 | ) | | | (602,502 | ) | | | (24,083,151 | ) |
| Net increase | | | 209,978 | | | $ | 7,078,402 | | | | 37,493 | | | $ | 1,334,406 | |
| | | | | | | | | | | | | | | | | |
| Class C | | | | | | | | | | | | | | | | |
| Shares sold | | | 185,116 | | | $ | 5,795,194 | | | | 72,924 | | | $ | 2,251,044 | |
| Shares issued upon reinvestment of distributions | | | 90,809 | | | | 2,478,175 | | | | 114,578 | | | | 3,297,561 | |
| Shares redeemed | | | (565,446 | ) | | | (17,594,128 | ) | | | (527,702 | ) | | | (15,956,920 | ) |
| Net decrease | | | (289,521 | ) | | $ | (9,320,759 | ) | | | (340,200 | ) | | $ | (10,408,315 | ) |
| | | | | | | | | | | | | | | | | |
| Class I | | | | | | | | | | | | | | | | |
| Shares sold | | | 7,871,168 | | | $ | 350,032,189 | | | | 1,930,594 | | | $ | 82,465,637 | |
| Shares issued upon reinvestment of distributions | | | 1,152,679 | | | | 44,308,968 | | | | 1,139,763 | | | | 45,807,093 | |
| Shares redeemed | | | (2,880,702 | ) | | | (125,286,002 | ) | | | (3,272,433 | ) | | | (137,591,946 | ) |
| Net increase/(decrease) | | | 6,143,145 | | | $ | 269,055,155 | | | | (202,076 | ) | | $ | (9,319,216 | ) |
9. Transactions in Securities of Affiliated Issuers. The 1940 Act defines affiliated issuers as those in which the Fund’s holdings of an issuer represent 5% or more of the outstanding voting securities of the issuer. A summary of the Fund’s transactions in the securities of these issuers during the fiscal year ended September 30, 2024 is set forth below:
| | | Market
Value at
September 30,
2023 | | | Purchases | | | Sales
Proceeds | | | Realized
Gain | | | Change In
Unrealized
Appreciation | | | Market
Value at
September 30,
2024 | | | Dividend
Income | | | Percent
Owned of
Shares | |
| Bel Fuse Inc., Cl. A | | $ | 9,732,345 | | | | — | | | $ | 3,233,785 | | | $ | 2,275,526 | | | $ | 8,029,584 | | | $ | 16,803,670 | | | $ | 48,618 | | | | 8.00 | % |
| Strattec Security Corp.† | | | 5,751,900 | | | $ | 101,080 | | | | — | | | | — | | | | 4,940,000 | | | | 10,792,980 | | | | — | | | | 6.00 | % |
| Trans-Lux Corp.† | | | 720,000 | | | | — | | | | — | | | | — | | | | 442,400 | | | | 1,162,400 | | | | — | | | | 12.00 | % |
| Total | | | | | | | | | | | | | | $ | 2,275,526 | | | $ | 13,411,984 | | | $ | 28,759,050 | | | $ | 48,618 | | | | | |
| † | Non-income producing security. |
The Gabelli Small Cap Growth Fund
Notes to Financial Statements (Continued)
10. Indemnifications. The Fund enters into contracts that contain a variety of indemnifications. The Fund’s maximum exposure under these arrangements is unknown. However, the Fund has not had prior claims or losses pursuant to these contracts. Management has reviewed the Fund’s existing contracts and expects the risk of loss to be remote.
11. Subsequent Events. Management has evaluated the impact on the Fund of all subsequent events occurring through the date the financial statements were issued and has determined that there were no subsequent events requiring recognition or disclosure in the financial statements.
The Gabelli Small Cap Growth Fund
Report of Independent Registered Public Accounting Firm
To the Shareholders and the Board of Directors of The Gabelli Small Cap Growth Fund
Opinion on the Financial Statements
We have audited the accompanying statement of assets and liabilities of The Gabelli Small Cap Growth Fund (the “Fund”) (one of the funds constituting Gabelli Equity Series Funds, Inc. (the “Corporation”)), including the schedule of investments, as of September 30, 2024, and the related statement of operations for the year then ended, the statements of changes in net assets for each of the two years in the period then ended, the financial highlights for each of the five years in the period then ended and the related notes (collectively referred to as the “financial statements”). In our opinion, the financial statements present fairly, in all material respects, the financial position of the Fund (one of the funds constituting Gabelli Equity Series Funds, Inc.) at September 30, 2024, the results of its operations for the year then ended, the changes in its net assets for each of the two years in the period then ended and its financial highlights for each of the five years in the period then ended, in conformity with U.S. generally accepted accounting principles.
Basis for Opinion
These financial statements are the responsibility of the Corporation’s management. Our responsibility is to express an opinion on the Fund’s financial statements based on our audits. We are a public accounting firm registered with the Public Company Accounting Oversight Board (United States) (“PCAOB”) and are required to be independent with respect to the Corporation in accordance with the U.S. federal securities laws and the applicable rules and regulations of the Securities and Exchange Commission and the PCAOB.
We conducted our audits in accordance with the standards of the PCAOB. Those standards require that we plan and perform the audit to obtain reasonable assurance about whether the financial statements are free of material misstatement, whether due to error or fraud. The Corporation is not required to have, nor were we engaged to perform, an audit of the Corporation’s internal control over financial reporting. As part of our audits we are required to obtain an understanding of internal control over financial reporting but not for the purpose of expressing an opinion on the effectiveness of the Corporation’s internal control over financial reporting. Accordingly, we express no such opinion.
Our audits included performing procedures to assess the risks of material misstatement of the financial statements, whether due to error or fraud, and performing procedures that respond to those risks. Such procedures included examining, on a test basis, evidence regarding the amounts and disclosures in the financial statements. Our procedures included confirmation of securities owned as of September 30, 2024, by correspondence with the custodian and brokers; when replies were not received from brokers, we performed other auditing procedures. Our audits also included evaluating the accounting principles used and significant estimates made by management, as well as evaluating the overall presentation of the financial statements. We believe that our audits provide a reasonable basis for our opinion.

We have served as the auditor of one or more Gabelli Funds investment companies since 1992.
New York, New York
November 29, 2024
The Gabelli Small Cap Growth Fund
Liquidity Risk Management Program (Unaudited)
In accordance with Rule 22e-4 under the 1940 Act, the Fund has established a liquidity risk management program (the LRM Program) to govern its approach to managing liquidity risk. The LRM Program is administered by the Liquidity Committee (the Committee), which is comprised of members of Gabelli Funds, LLC management. The Board has designated the Committee to administer the LRM Program.
The LRM Program’s principal objectives include supporting the Fund’s compliance with limits on investments in illiquid assets and mitigating the risk that the Fund will be unable to meet its redemption obligations in a timely manner. The LRM Program also includes elements that support the management and assessment of liquidity risk, including an annual assessment of factors that influence the Fund’s liquidity and the monthly classification and re-classification of certain investments that reflect the Committee’s assessment of their relative liquidity under current market conditions.
At a meeting of the Board held on May 15, 2024, the Board received a written report from the Committee regarding the design and operational effectiveness of the LRM Program. The Committee determined, and reported to the Board, that the LRM Program is reasonably designed to assess and manage the Fund’s liquidity risk and has operated adequately and effectively since its implementation. The Committee reported that there were no liquidity events that impacted the Fund or its ability to timely meet redemptions without dilution to existing shareholders. The Committee noted that the Fund is primarily invested in highly liquid securities and, accordingly, continues to be exempt from the requirement to determine a “highly liquid investment minimum” as defined in the Rule 22e-4. Because of that continued qualification for the exemption, the Fund has not adopted a “highly liquid investment minimum” amount. The Committee further noted that while changes to the LRM Program were made during the Review Period and reported to the Board, no material changes were made to the LRM Program as a result of the Committee’s annual review.
There can be no assurance that the LRM Program will achieve its objectives in the future. Please refer to the Fund’s Prospectus for more information regarding its exposure to liquidity risk and other principal risks to which an investment in the Fund may be subject.
THE GABELLI SMALL CAP GROWTH FUND
2024 TAX NOTICE TO SHAREHOLDERS (Unaudited)
During the fiscal year ended September 30, 2024, the Fund paid to shareholders ordinary income distributions (comprised of net investment income and short term capital gains) totaling $0.0935, $0.0934, $0.0693, and $0.0977 for each of Class AAA, Class A, Class C, and Class I, respectively, and long term capital gains totaling $142,401,412, or the maximum allowable. The distribution of long term capital gains has been designated as a capital gain dividend by the Fund’s Board of Directors. For the fiscal year ended September 30, 2024, 100% of the ordinary income distribution qualifies for the dividends received deduction available to corporations. The Fund designates 100% of the ordinary income distribution as qualified dividend income pursuant to the Jobs and Growth Tax Relief Reconciliation Act of 2003. The Fund designates 2.76% of the ordinary income distribution as qualified interest income pursuant to the Tax Relief, Unemployment Reauthorization, and Job Creation Act of 2010. The Fund designates 100% of the ordinary income distribution as qualified short term capital gain pursuant to the American Jobs Creation Act of 2004.
U.S. Government Income:
The percentage of the ordinary income distribution paid by the Fund during the fiscal year ended September 30, 2024 which was derived from U.S. Treasury securities was 2.33%. Such income is exempt from state and local tax in all states. However, many states, including New York and California, allow a tax exemption for a portion of the income earned only if a mutual fund has invested at least 50% of its assets at the end of each quarter of the Fund’s fiscal year in U.S. Government securities. The Gabelli Small Cap Growth Fund did not meet this strict requirement in 2024. The percentage of U.S. Government securities held as of September 30, 2024 was 0.7%. Due to the diversity in state and local tax law, it is recommended that you consult your personal tax adviser as to the applicability of the information provided to your specific situation.
All designations are based on financial information available as of the date of this annual report and, accordingly, are subject to change. For each item, it is the intention of the Fund to designate the maximum amount permitted under the Internal Revenue Code and the regulations thereunder.
Gabelli Funds and Your Personal Privacy
Who are we?
The Gabelli Funds are investment companies registered with the Securities and Exchange Commission under the Investment Company Act of 1940. We are managed by Gabelli Funds, LLC, which is affiliated with GAMCO Investors, Inc., a publicly held company with subsidiaries and affiliates that provide investment advisory services for a variety of clients.
What kind of non-public information do we collect about you if you become a fund shareholder?
If you apply to open an account directly with us, you will be giving us some non-public information about yourself. The non-public information we collect about you is:
| ● | Information you give us on your application form. This could include your name, address, telephone number, social security number, bank account number, and other information. |
| ● | Information about your transactions with us, any transactions with our affiliates, and transactions with the entities we hire to provide services to you. This would include information about the shares that you buy or redeem. If we hire someone else to provide services — like a transfer agent — we will also have information about the transactions that you conduct through them. |
What information do we disclose and to whom do we disclose it?
We do not disclose any non-public personal information about our customers or former customers to anyone other than our affiliates, our service providers who need to know such information, and as otherwise permitted by law. If you want to find out what the law permits, you can read the privacy rules adopted by the Securities and Exchange Commission. They are in volume 17 of the Code of Federal Regulations, Part 248. The Commission often posts information about its regulations on its website, www.sec.gov.
What do we do to protect your personal information?
We restrict access to non-public personal information about you to the people who need to know that information in order to provide services to you or the fund and to ensure that we are complying with the laws governing the securities business. We maintain physical, electronic, and procedural safeguards to keep your personal information confidential.
This page was intentionally left blank.
This page was intentionally left blank.

| | The Gabelli Focused Growth and Income Fund Annual Report — September 30, 2024 | |  |
| | | | Daniel M. Miller Portfolio Manager GAMCO Investors
BS, University of Miami |
To Our Shareholders,
For the fiscal year ended September 30, 2024, the net asset value (NAV) total return per Class I Share of The Gabelli Focused Growth and Income Fund (the Fund) was 22.9% compared with a total return of 27.2% for the Lipper Equity Income Fund Average. Other classes of shares are available.
Enclosed are the financial statements, including the schedule of investments, as of September 30, 2024.
Summary of Portfolio Holdings (Unaudited)
The following table presents portfolio holdings as a percent of net assets as of September 30, 2024:
The Gabelli Focused Growth and Income Fund
| Energy and Utilities | | | 27.8 | % |
| Real Estate Investment Trusts | | | 23.9 | % |
| Financial Services | | | 9.1 | % |
| Telecommunications | | | 8.6 | % |
| Retail | | | 6.8 | % |
| Food and Beverage | | | 5.3 | % |
| Health Care | | | 4.1 | % |
| U.S. Government Obligations | | | 2.4 | % |
| Building and Construction | | | 2.4 | % |
| Metals and Mining | | | 2.3 | % |
| Computer Software and Services | | | 1.8 | % |
| Diversified Industrial | | | 1.8 | % |
| Automotive: Parts and Accessories | | | 0.9 | % |
| Specialty Chemicals | | | 0.7 | % |
| Entertainment | | | 0.3 | % |
| Other Assets and Liabilities (Net) | | | 1.8 | % |
| | | | 100.0 | % |
The Fund files a complete schedule of portfolio holdings with the Securities and Exchange Commission (the SEC) for the first and third quarters of each fiscal year on Form N-PORT. Shareholders may obtain this information at www.gabelli.com or by calling the Fund at 800-GABELLI (800-422-3554). The Fund’s Form N-PORT is available on the SEC’s website at www.sec.gov and may also be reviewed and copied at the SEC’s Public Reference Room in Washington, DC. Information on the operation of the Public Reference Room may be obtained by calling 800-SEC-0330.
Proxy Voting
The Fund files Form N-PX with its complete proxy voting record for the twelve months ended June 30, no later than August 31 of each year. A description of the Fund’s proxy voting policies, procedures, and how the Fund voted proxies relating to portfolio securities is available without charge, upon request, by (i) calling 800-GABELLI (800-422-3554); (ii) writing to The Gabelli Funds at One Corporate Center, Rye, NY 10580-1422; or (iii) visiting the SEC’s website at www.sec.gov.
The Gabelli Focused Growth and Income Fund
Schedule of Investments — September 30, 2024
| Shares | | | | | Cost | | | Market
Value | |
| | | | | COMMON STOCKS — 84.7% | | | | | | | | |
| | | | | Automotive: Parts and Accessories — 0.9% | | | | | | | | |
| | 6,000 | | | Aptiv plc† | | $ | 311,893 | | | $ | 432,060 | |
| | | | | | | | | | | | | |
| | | | | Building and Construction — 2.4% | | | | | | | | |
| | 6,850 | | | Herc Holdings Inc. | | | 131,198 | | | | 1,092,096 | |
| | | | | | | | | | | | | |
| | | | | Computer Software and Services — 1.8% | | | | | | | | |
| | 5,000 | | | Alphabet Inc., Cl. C | | | 148,299 | | | | 835,950 | |
| | | | | | | | | | | | | |
| | | | | Energy and Utilities — 27.8% | | | | | | | | |
| | 180,000 | | | Energy Transfer LP | | | 1,117,106 | | | | 2,889,000 | |
| | 112,500 | | | Enterprise Products Partners LP | | | 1,760,762 | | | | 3,274,875 | |
| | 90,000 | | | Kinder Morgan Inc. | | | 872,518 | | | | 1,988,100 | |
| | 52,500 | | | New Fortress Energy Inc. | | | 1,282,926 | | | | 477,225 | |
| | 110,000 | | | NextEra Energy Partners LP | | | 3,031,795 | | | | 3,038,200 | |
| | 27,500 | | | TXNM Energy Inc. | | | 998,626 | | | | 1,203,675 | |
| | | | | | | | 9,063,733 | | | | 12,871,075 | |
| | | | | Entertainment — 0.3% | | | | | | | | |
| | 15,000 | | | Paramount Global, Cl. B | | | 191,326 | | | | 159,300 | |
| | | | | | | | | | | | | |
| | | | | Financial Services — 6.6% | | | | | | | | |
| | 18,500 | | | Apollo Global Management Inc. | | | 550,916 | | | | 2,310,835 | |
| | 7,000 | | | Morgan Stanley | | | 265,487 | | | | 729,680 | |
| | | | | | | | 816,403 | | | | 3,040,515 | |
| | | | | Food and Beverage — 5.3% | | | | | | | | |
| | 107,500 | | | Maple Leaf Foods Inc. | | | 1,763,345 | | | | 1,760,601 | |
| | 8,000 | | | Mondelēz International Inc., Cl. A | | | 327,345 | | | | 589,360 | |
| | 1,000 | | | Post Holdings Inc.† | | | 22,462 | | | | 115,750 | |
| | | | | | | | 2,113,152 | | | | 2,465,711 | |
| | | | | Health Care — 4.1% | | | | | | | | |
| | 5,000 | | | AbbVie Inc. | | | 526,416 | | | | 987,400 | |
| | 30,000 | | | Option Care Health Inc.† | | | 234,811 | | | | 939,000 | |
| | | | | | | | 761,227 | | | | 1,926,400 | |
| | | | | Metals and Mining — 2.3% | | | | | | | | |
| | 20,000 | | | Newmont Corp. | | | 669,152 | | | | 1,069,000 | |
| | | | | | | | | | | | | |
| | | | | Real Estate Investment Trusts — 23.9% | | | | | | | | |
| | 165,000 | | | Blackstone Mortgage Trust Inc., Cl. A | | | 3,161,589 | | | | 3,136,650 | |
| | 190,000 | | | Franklin BSP Realty Trust Inc. | | | 2,488,517 | | | | 2,481,400 | |
| | 55,000 | | | Medical Properties Trust Inc. | | | 224,261 | | | | 321,750 | |
| | 6,500 | | | Simon Property Group Inc. | | | 751,924 | | | | 1,098,630 | |
| | 120,705 | | | VICI Properties Inc. | | | 2,096,251 | | | | 4,020,684 | |
| | | | | | | | 8,722,542 | | | | 11,059,114 | |
| Shares | | | | | Cost | | | Market
Value | |
| | | | | Specialty Chemicals — 0.7% | | | | | | | | |
| | 3,000 | | | International Flavors & Fragrances Inc. | | $ | 188,944 | | | $ | 314,790 | |
| | | | | | | | | | | | | |
| | | | | Telecommunications — 8.6% | | | | | | | | |
| | 154,000 | | | AT&T Inc. | | | 2,395,984 | | | | 3,388,000 | |
| | 4,000 | | | GCI Liberty Inc., Escrow†(a) | | | 0 | | | | 0 | |
| | 2,850 | | | T-Mobile US Inc. | | | 204,462 | | | | 588,126 | |
| | | | | | | | 2,600,446 | | | | 3,976,126 | |
| | | | | TOTAL COMMON STOCKS | | | 25,718,315 | | | | 39,242,137 | |
| | | | | | | | | | | | | |
| | | | | PREFERRED STOCKS — 11.1% | | | | | | | | |
| | | | | Diversified Industrial — 1.8% | | | | | | | | |
| | 9,086 | | | Babcock & Wilcox Enterprises Inc., | | | | | | | | |
| | | | | 8.125%, 02/28/26 | | | 160,433 | | | | 212,158 | |
| | 25,018 | | | Steel Partners Holdings LP, Ser. A, | | | | | | | | |
| | | | | 6.000%, 02/07/26 | | | 500,277 | | | | 607,937 | |
| | | | | | | | 660,710 | | | | 820,095 | |
| | | | | Financial Services — 2.5% | | | | | | | | |
| | 36,528 | | | FTAI Aviation Ltd., Ser. A, | | | | | | | | |
| | | | | 12.094% | | | 725,283 | | | | 931,829 | |
| | 25,626 | | | Greenidge Generation Holdings Inc., | | | | | | | | |
| | | | | 8.500%, 10/31/26 | | | 154,854 | | | | 227,559 | |
| | | | | | | | 880,137 | | | | 1,159,388 | |
| | | | | Retail — 6.8% | | | | | | | | |
| | 73,069 | | | Qurate Retail Inc., 8.000%, 03/15/31 | | | 2,932,697 | | | | 3,178,502 | |
| | | | | | | | | | | | | |
| | | | | TOTAL PREFERRED STOCKS | | | 4,473,544 | | | | 5,157,985 | |
Principal
Amount | | | | | | | | | |
| | | | | U.S. GOVERNMENT OBLIGATIONS — 2.4% | | | | | | | | |
| $ | 1,125,000 | | | U.S. Treasury Bills, | | | | | | | | |
| | | | | 4.764% to 5.129%††, 11/14/24 to 12/12/24 | | | 1,115,071 | | | | 1,115,694 | |
| | | | | | | | | | | | | |
| | | | | TOTAL INVESTMENTS — 98.2% | | $ | 31,306,930 | | | | 45,515,816 | |
| | | | | | | | | | | | | |
| | | | | Other Assets and Liabilities (Net) — 1.8% | | | | | | | 837,190 | |
| | | | | | | | | | | | | |
| | | | | NET ASSETS — 100.0% | | | | | | $ | 46,353,006 | |
| (a) | Security is valued using significant unobservable inputs and is classified as Level 3 in the fair value hierarchy. |
| † | Non-income producing security. |
| †† | Represents annualized yields at dates of purchase. |
See accompanying notes to financial statements.
The Gabelli Focused Growth and Income Fund
Statement of Assets and Liabilities
September 30, 2024
| Assets: | | | | |
| Investments, at value (cost $31,306,930) | | $ | 45,515,816 | |
| Cash | | | 94,540 | |
| Foreign currency, at value (cost $14,925) | | | 14,864 | |
| Receivable for investments sold | | | 573,783 | |
| Receivable for Fund shares sold | | | 4,523 | |
| Dividends receivable | | | 219,590 | |
| Prepaid expenses | | | 51,706 | |
| Total Assets | | | 46,474,822 | |
| Liabilities: | | | | |
| Payable for Fund shares redeemed | | | 31,926 | |
| Payable for investment advisory fees | | | 43,930 | |
| Payable for distribution fees | | | 6,965 | |
| Payable for legal and audit fees | | | 28,672 | |
| Other accrued expenses | | | 10,323 | |
| Total Liabilities | | | 121,816 | |
| Commitments and Contingencies (See Note 3) | | | | |
| Net Assets | | | | |
| (applicable to 2,602,410 shares outstanding) | | $ | 46,353,006 | |
| | | | | |
| Net Assets Consist of: | | | | |
| Paid-in capital | | $ | 32,901,050 | |
| Total distributable earnings | | | 13,451,956 | |
| Net Assets | | $ | 46,353,006 | |
| | | | | |
| Shares of Capital Stock, each at $0.001 par value: | | | | |
| Class AAA: | | | | |
| Net Asset Value, offering, and redemption price per share ($5,051,287 ÷ 290,807 shares outstanding; 100,000,000 shares authorized) | | $ | 17.37 | |
| Class A: | | | | |
| Net Asset Value and redemption price per share ($21,387,991 ÷ 1,211,343 shares outstanding; 50,000,000 shares authorized) | | $ | 17.66 | |
| Maximum offering price per share (NAV ÷ 0.9425, based on maximum sales charge of 5.75% of the offering price) | | $ | 18.74 | |
| Class C: | | | | |
| Net Asset Value and offering price per share ($2,055,353 ÷ 147,880 shares outstanding; 50,000,000 shares authorized) | | $ | 13.90 | (a) |
| Class I: | | | | |
| Net Asset Value, offering, and redemption price per share ($17,858,375 ÷ 952,380 shares outstanding; 50,000,000 shares authorized) | | $ | 18.75 | |
| (a) | Redemption price varies based on the length of time held. |
Statement of Operations
For the Year Ended September 30, 2024
| Investment Income: | | | | |
| Dividends (net of foreign withholding taxes of $7,558) | | $ | 2,513,087 | |
| Interest | | | 127,665 | |
| Total Investment Income | | | 2,640,752 | |
| Expenses: | | | | |
| Investment advisory fees | | | 430,071 | |
| Distribution fees - Class AAA | | | 13,283 | |
| Distribution fees - Class A | | | 48,955 | |
| Distribution fees - Class C | | | 22,888 | |
| Legal and audit fees | | | 51,635 | |
| Shareholder communications expenses | | | 33,474 | |
| Registration expenses | | | 33,211 | |
| Shareholder services fees | | | 21,360 | |
| Custodian fees | | | 8,180 | |
| Directors’ fees | | | 3,082 | |
| Interest expense | | | 682 | |
| Miscellaneous expenses | | | 14,427 | |
| Total Expenses | | | 681,248 | |
| Less: | | | | |
| Expense reimbursements (See Note 3) | | | (167,786 | ) |
| Net Expenses | | | 513,462 | |
| Net Investment Income | | | 2,127,290 | |
| | | | | |
| Net Realized and Unrealized Gain/(Loss) on Investments and Foreign Currency: | | | | |
| Net realized gain on investments | | | 18,721 | |
| Net realized loss on foreign currency transactions | | | (587 | ) |
| Net realized gain on investments and foreign currency transactions | | | 18,134 | |
| Net change in unrealized appreciation/depreciation: | | | | |
| on investments | | | 6,523,736 | |
| on foreign currency translations | | | (72 | ) |
| Net change in unrealized appreciation/depreciation on investments and foreign currency translations | | | 6,523,664 | |
| Net Realized and Unrealized Gain/(Loss) on Investments and Foreign Currency | | | 6,541,798 | |
| Net Increase in Net Assets Resulting from Operations | | $ | 8,669,088 | |
See accompanying notes to financial statements.
The Gabelli Focused Growth and Income Fund
Statement of Changes in Net Assets
| | | Year Ended
September 30,
2024 | | | Year Ended
September 30,
2023 | |
| Operations: | | | | | | | | |
| Net investment income | | $ | 2,127,290 | | | $ | 1,659,953 | |
| Net realized gain/(loss) on investments and foreign currency transactions | | | 18,134 | | | | (718,637 | ) |
| Net change in unrealized appreciation/depreciation on investments and foreign currency translations | | | 6,523,664 | | | | 1,475,084 | |
| Net Increase in Net Assets Resulting from Operations | | | 8,669,088 | | | | 2,416,400 | |
| | | | | | | | | |
| Distributions to Shareholders: | | | | | | | | |
| Class AAA | | | (239,749 | ) | | | (247,172 | ) |
| Class A | | | (1,002,056 | ) | | | (683,676 | ) |
| Class C | | | (128,575 | ) | | | (207,466 | ) |
| Class I | | | (767,597 | ) | | | (723,663 | ) |
| Total Distributions to Shareholders | | | (2,137,977 | ) | | | (1,861,977 | ) |
| | | | | | | | | |
| Capital Share Transactions: | | | | | | | | |
| Class AAA | | | (1,060,551 | ) | | | 123,815 | |
| Class A | | | 2,053,952 | | | | 5,597,058 | |
| Class C | | | (922,558 | ) | | | (1,733,319 | ) |
| Class I | | | 190,803 | | | | (4,309,454 | ) |
| Net Increase/(Decrease) in Net Assets from Capital Share Transactions | | | 261,646 | | | | (321,900 | ) |
| | | | | | | | | |
| Redemption Fees | | | — | | | | 60 | |
| | | | | | | | | |
| Net Increase in Net Assets | | | 6,792,757 | | | | 232,583 | |
| | | | | | | | | |
| Net Assets: | | | | | | | | |
| Beginning of year | | | 39,560,249 | | | | 39,327,666 | |
| End of year | | $ | 46,353,006 | | | $ | 39,560,249 | |
See accompanying notes to financial statements.
The Gabelli Focused Growth and Income Fund
Financial Highlights
Selected data for a share of capital stock outstanding throughout each year:
| | | | | | Income (Loss) from Investment Operations | | | Distributions | | | | | | | | | | | | | Ratios to Average Net Assets/Supplemental Data | |
| Year Ended September 30 | | Net Asset Value,
Beginning
of Year | | | Net Investment
Income
(Loss)(a)(b) | | | Net Realized
and Unrealized
Gain (Loss) on
Investments | | | Total from
Investment
Operations | | | Net Investment
Income | | | Net Realized
Gain on
Investments | | | Total
Distributions | | | Redemption
Fees(a) | | | Net Asset Value,
End of Year | | | Total
Return† | | | Net Assets,
End of Year
(in 000’s) | | | Net Investment
Income (Loss)(b) | | | Operating
Expenses
Before
Reimbursement | | | Operating
Expenses
Net of
Reimbursement(c) | | | Portfolio
Turnover
Rate | |
| Class AAA | | | | | | | | | | | | | | | | | | | | | | | | | | | | | | | | | | | | | | | | | | | | | | | | | | | | | | | | | | | | |
| 2024 | | $ | 14.91 | | | $ | 0.72 | | | $ | 2.46 | | | $ | 3.18 | | | $ | (0.72 | ) | | $ | — | | | $ | (0.72 | ) | | $ | — | | | $ | 17.37 | | | | 21.88 | % | | $ | 5,051 | | | | 4.51 | % | | | 1.64 | % | | | 1.64 | % | | | 31 | % |
| 2023 | | | 14.79 | | | | 0.59 | | | | 0.29 | | | | 0.88 | | | | (0.66 | ) | | | (0.10 | ) | | | (0.76 | ) | | | 0.00 | (d) | | | 14.91 | | | | 5.91 | | | | 5,321 | | | | 3.79 | | | | 1.79 | | | | 1.79 | | | | 36 | |
| 2022 | | | 17.50 | | | | 0.32 | | | | (2.31 | ) | | | (1.99 | ) | | | (0.66 | ) | | | (0.06 | ) | | | (0.72 | ) | | | — | | | | 14.79 | | | | (11.85 | ) | | | 5,134 | | | | 1.85 | | | | 1.72 | | | | 1.72 | | | | 46 | |
| 2021 | | | 12.48 | | | | 0.34 | | | | 5.22 | | | | 5.56 | | | | (0.54 | ) | | | — | | | | (0.54 | ) | | | — | | | | 17.50 | | | | 44.76 | | | | 6,927 | | | | 2.15 | | | | 1.96 | | | | 1.96 | | | | 54 | |
| 2020 | | | 12.93 | | | | (0.03 | ) | | | (0.42 | ) | | | (0.45 | ) | | | — | | | | — | | | | — | | | | 0.00 | (d) | | | 12.48 | | | | (3.48 | ) | | | 8,713 | | | | (0.24 | ) | | | 1.71 | | | | 1.71 | | | | 59 | |
| Class A | | | | | | | | | | | | | | | | | | | | | | | | | | | | | | | | | | | | | | | | | | | | | | | | | | | | | | | | | | | | |
| 2024 | | $ | 15.19 | | | $ | 0.80 | | | $ | 2.49 | | | $ | 3.29 | | | $ | (0.82 | ) | | $ | — | | | $ | (0.82 | ) | | $ | — | | | $ | 17.66 | | | | 22.34 | % | | $ | 21,388 | | | | 4.89 | % | | | 1.64 | % | | | 1.25 | %(e) | | | 31 | % |
| 2023 | | | 14.97 | | | | 0.70 | | | | 0.28 | | | | 0.98 | | | | (0.66 | ) | | | (0.10 | ) | | | (0.76 | ) | | | 0.00 | (d) | | | 15.19 | | | | 6.53 | | | | 16,368 | | | | 4.43 | | | | 1.79 | | | | 1.26 | (e) | | | 36 | |
| 2022 | | | 17.71 | | | | 0.34 | | | | (2.36 | ) | | | (2.02 | ) | | | (0.66 | ) | | | (0.06 | ) | | | (0.72 | ) | | | — | | | | 14.97 | | | | (11.88 | ) | | | 10,810 | | | | 1.94 | | | | 1.72 | | | | 1.70 | (e) | | | 46 | |
| 2021 | | | 12.62 | | | | 0.30 | | | | 5.33 | | | | 5.63 | | | | (0.54 | ) | | | — | | | | (0.54 | ) | | | — | | | | 17.71 | | | | 44.82 | | | | 8,958 | | | | 1.83 | | | | 1.96 | | | | 1.96 | | | | 54 | |
| 2020 | | | 13.06 | | | | (0.03 | ) | | | (0.41 | ) | | | (0.44 | ) | | | — | | | | — | | | | — | | | | 0.00 | (d) | | | 12.62 | | | | (3.37 | ) | | | 6,644 | | | | (0.24 | ) | | | 1.71 | | | | 1.71 | | | | 59 | |
| Class C | | | | | | | | | | | | | | | | | | | | | | | | | | | | | | | | | | | | | | | | | | | | | | | | | | | | | | | | | | | | |
| 2024 | | $ | 12.15 | | | $ | 0.48 | | | $ | 1.99 | | | $ | 2.47 | | | $ | (0.72 | ) | | $ | — | | | $ | (0.72 | ) | | $ | — | | | $ | 13.90 | | | | 20.98 | % | | $ | 2,055 | | | | 3.72 | % | | | 2.39 | % | | | 2.39 | % | | | 31 | % |
| 2023 | | | 12.25 | | | | 0.37 | | | | 0.27 | | | | 0.64 | | | | (0.66 | ) | | | (0.08 | ) | | | (0.74 | ) | | | 0.00 | (d) | | | 12.15 | | | | 5.17 | | | | 2,666 | | | | 2.90 | | | | 2.54 | | | | 2.54 | | | | 36 | |
| 2022 | | | 14.73 | | | | 0.15 | | | | (1.91 | ) | | | (1.76 | ) | | | (0.66 | ) | | | (0.06 | ) | | | (0.72 | ) | | | — | | | | 12.25 | | | | (12.54 | ) | | | 4,357 | | | | 1.02 | | | | 2.47 | | | | 2.47 | | | | 46 | |
| 2021 | | | 10.64 | | | | 0.15 | | | | 4.48 | | | | 4.63 | | | | (0.54 | ) | | | — | | | | (0.54 | ) | | | — | | | | 14.73 | | | | 43.75 | | | | 8,143 | | | | 1.13 | | | | 2.71 | | | | 2.71 | | | | 54 | |
| 2020 | | | 11.10 | | | | (0.11 | ) | | | (0.35 | ) | | | (0.46 | ) | | | — | | | | — | | | | — | | | | 0.00 | (d) | | | 10.64 | | | | (4.14 | ) | | | 6,926 | | | | (1.00 | ) | | | 2.46 | | | | 2.46 | | | | 59 | |
| Class I | | | | | | | | | | | | | | | | | | | | | | | | | | | | | | | | | | | | | | | | | | | | | | | | | | | | | | | | | | | | |
| 2024 | | $ | 16.01 | | | $ | 0.92 | | | $ | 2.64 | | | $ | 3.56 | | | $ | (0.82 | ) | | $ | — | | | $ | (0.82 | ) | | $ | — | | | $ | 18.75 | | | | 22.90 | % | | $ | 17,859 | | | | 5.33 | % | | | 1.39 | % | | | 0.80 | %(e) | | | 31 | % |
| 2023 | | | 15.68 | | | | 0.79 | | | | 0.31 | | | | 1.10 | | | | (0.66 | ) | | | (0.11 | ) | | | (0.77 | ) | | | 0.00 | (d) | | | 16.01 | | | | 6.97 | | | | 15,205 | | | | 4.77 | | | | 1.54 | | | | 0.81 | (e) | | | 36 | |
| 2022 | | | 18.35 | | | | 0.54 | | | | (2.49 | ) | | | (1.95 | ) | | | (0.66 | ) | | | (0.06 | ) | | | (0.72 | ) | | | — | | | | 15.68 | | | | (11.07 | ) | | | 19,027 | | | | 2.94 | | | | 1.47 | | | | 0.80 | (e) | | | 46 | |
| 2021 | | | 12.94 | | | | 0.46 | | | | 5.49 | | | | 5.95 | | | | (0.54 | ) | | | — | | | | (0.54 | ) | | | — | | | | 18.35 | | | | 46.21 | | | | 16,215 | | | | 2.70 | | | | 1.71 | | | | 0.95 | (e) | | | 54 | |
| 2020 | | | 13.36 | | | | 0.00 | (d) | | | (0.42 | ) | | | (0.42 | ) | | | — | | | | — | | | | — | | | | 0.00 | (d) | | | 12.94 | | | | (3.14 | ) | | | 8,333 | | | | 0.01 | | | | 1.46 | | | | 1.46 | | | | 59 | |
| † | Total return represents aggregate total return of a hypothetical investment at the beginning of the year and sold at the end of the year including reinvestment of distributions and does not reflect the applicable sales charges. |
| (a) | Per share amounts have been calculated using the average shares outstanding method. |
| (b) | Due to capital share activity, net investment income/(loss) per share and the ratio to average net assets may not be necessarily correlated among the different classes of shares. |
| (c) | The Fund incurred interest expense. For the fiscal years ended September 30, 2024, 2023, 2022, and 2020, if interest expense had not been incurred, the ratios of operating expenses to average net assets would have been 1.63%, 1.78%, 1.72%, and 1.70% (Class AAA), 1.25%, 1.25%, 1.69%, and 1.70% (Class A), 2.38%, 2.53%, 2.47%, and 2.45% (Class C), and 0.80%, 0.80%, 0.80%, and 1.45% (Class I), respectively. For the fiscal years ended September 30, 2021, the effect of interest expense was minimal. |
| (d) | Amount represents less than $0.005 per share. |
| (e) | Under an expense reimbursement agreement with the Adviser, the Adviser reimbursed expenses of $167,786, $187,761, $119,130 and $97,862 for the fiscal years ended September 30, 2024, 2023, 2022, and 2021, respectively. |
See accompanying notes to financial statements.
The Gabelli Focused Growth and Income Fund
Notes to Financial Statements
1. Organization. The Gabelli Focused Growth and Income Fund, a series of the Gabelli Equity Series Funds, Inc. (the Corporation), was incorporated on July 25, 1991 in Maryland. The Fund is a diversified open-end management investment company registered under the Investment Company Act of 1940, as amended (the 1940 Act), and is one of four separately managed portfolios (collectively, the Portfolios) of the Corporation. The Fund seeks to provide a high level of capital appreciation. The Fund commenced investment operations on December 31, 2002. Effective January 14, 2021, The Gabelli Focus Five Fund changed its name to Gabelli Focused Growth and Income Fund with a corresponding change in the name of each of its Classes of Shares.
Gabelli Funds, LLC (the “Adviser”), with its principal offices located at One Corporate Center, Rye, New York 10580-1422, serves as investment adviser to the Fund. The Adviser makes investment decisions for the Fund and continuously reviews and administers the Funds’ investment program and manages the operations of each Fund under the general supervision of the Company’s Board.
2. Significant Accounting Policies. As an investment company, the Fund follows the investment company accounting and reporting guidance, which is part of U.S. generally accepted accounting principles (GAAP) that may require the use of management estimates and assumptions in the preparation of its financial statements. Actual results could differ from those estimates. The following is a summary of significant accounting policies followed by the Fund in the preparation of its financial statements.
Security Valuation. Portfolio securities listed or traded on a nationally recognized securities exchange or traded in the U.S. over-the-counter market for which market quotations are readily available are valued at the last quoted sale price or a market’s official closing price as of the close of business on the day the securities are being valued. If there were no sales that day, the security is valued at the average of the closing bid and asked prices or, if there were no asked prices quoted on that day, then the security is valued at the closing bid price on that day. If no bid or asked prices are quoted on such day, the security is valued at the most recently available price or, if the Board of Directors (the Board) so determines, by such other method as the Board shall determine in good faith to reflect its fair market value. Portfolio securities traded on more than one national securities exchange or market are valued according to the broadest and most representative market, as determined by the Adviser.
Portfolio securities primarily traded on a foreign market are generally valued at the preceding closing values of such securities on the relevant market, but may be fair valued pursuant to procedures established by the Board if market conditions change significantly after the close of the foreign market, but prior to the close of business on the day the securities are being valued. Debt obligations for which market quotations are readily available are valued at the average of the latest bid and asked prices. If there were no asked prices quoted on such day, the security is valued using the closing bid price, unless the Board determines such amount does not reflect the securities’ fair value, in which case these securities will be fair valued as determined by the Board. Certain securities are valued principally using dealer quotations. Futures contracts are valued at the closing settlement price of the exchange or board of trade on which the applicable contract is traded. OTC futures and options on futures for which market quotations are readily available will be valued by quotations received from a pricing service or, if no quotations are available from a pricing service, by quotations obtained from one of more dealers in the instrument in question by the Adviser.
Securities and assets for which market quotations are not readily available are fair valued as determined by the Board. Fair valuation methodologies and procedures may include, but are not limited to: analysis and review of available financial and non-financial information about the company; comparisons with the valuation and
The Gabelli Focused Growth and Income Fund
Notes to Financial Statements (Continued)
changes in valuation of similar securities, including a comparison of foreign securities with the equivalent U.S. dollar value American Depositary Receipt securities at the close of the U.S. exchange; and evaluation of any other information that could be indicative of the value of the security.
The inputs and valuation techniques used to measure fair value of the Fund’s investments are summarized into three levels as described in the hierarchy below:
| ● | Level 1 — quoted prices in active markets for identical securities; |
| ● | Level 2 — other significant observable inputs (including quoted prices for similar securities, interest rates, prepayment speeds, credit risk, etc.); and |
| ● | Level 3 — significant unobservable inputs (including the Board’s determinations as to the fair value of investments). |
A financial instrument’s level within the fair value hierarchy is based on the lowest level of any input both individually and in the aggregate that is significant to the fair value measurement. The inputs or methodology used for valuing securities are not necessarily an indication of the risk associated with investing in those securities. The summary of the Fund’s investments in securities by inputs used to value the Fund’s investments as of September 30, 2024 is as follows:
| | | Valuation Inputs | | | | |
| | | Level 1
Quoted Prices | | | Level 2
Other Significant
Observable
Inputs | | | Level 3
Significant
Unobservable
Inputs(a) | | | Total
Market Value
at 09/30/24 | |
| INVESTMENTS IN SECURITIES: | | | | | | | | | | | | | | | | |
| ASSETS (Market Value): | | | | | | | | | | | | | | | | |
| Common Stocks: | | | | | | | | | | | | | | | | |
| Telecommunications | | $ | 3,976,126 | | | | — | | | $ | 0 | | | $ | 3,976,126 | |
| Other Industries (b) | | | 35,266,011 | | | | — | | | | — | | | | 35,266,011 | |
| Total Common Stocks | | | 39,242,137 | | | | — | | | | 0 | | | | 39,242,137 | |
| Preferred Stocks (b) | | | 5,157,985 | | | | — | | | | — | | | | 5,157,985 | |
| U.S. Government Obligations | | | — | | | $ | 1,115,694 | | | | — | | | | 1,115,694 | |
| TOTAL INVESTMENTS IN SECURITIES – ASSETS | | $ | 44,400,122 | | | $ | 1,115,694 | | | $ | 0 | | | $ | 45,515,816 | |
| (a) | The inputs for this security are not readily available and are derived based on the judgment of the Adviser according to procedures approved by the Board. |
| (b) | Please refer to the Schedule of Investments for the industry classifications of these portfolio holdings. |
Additional Information to Evaluate Qualitative Information.
General. The Fund uses recognized industry pricing services – approved by the Board and unaffiliated with the Adviser – to value most of its securities, and uses broker quotes provided by market makers of securities not valued by these and other recognized pricing sources. Several different pricing feeds are received to value domestic equity securities, international equity securities, preferred equity securities, and fixed income securities. The data within these feeds are ultimately sourced from major stock exchanges and trading systems where these securities trade. The prices supplied by external sources are checked by obtaining quotations or actual transaction prices from market participants. If a price obtained from the pricing source is deemed unreliable, prices will be sought from another pricing service or from a broker/dealer that trades that security or similar securities.
The Gabelli Focused Growth and Income Fund
Notes to Financial Statements (Continued)
Fair Valuation. Fair valued securities may be common or preferred equities, warrants, options, rights, or fixed income obligations. Where appropriate, Level 3 securities are those for which market quotations are not available, such as securities not traded for several days, or for which current bids are not available, or which are restricted as to transfer. When fair valuing a security, factors to consider include recent prices of comparable securities that are publicly traded, reliable prices of securities not publicly traded, the use of valuation models, current analyst reports, valuing the income or cash flow of the issuer, or cost if the preceding factors do not apply. A significant change in the unobservable inputs could result in a lower or higher value in Level 3 securities. The circumstances of Level 3 securities are frequently monitored to determine if fair valuation measures continue to apply.
The Adviser reports quarterly to the Board the results of the application of fair valuation policies and procedures. These may include backtesting the prices realized in subsequent trades of these fair valued securities to fair values previously recognized.
Foreign Currency Translations. The books and records of the Fund are maintained in U.S. dollars. Foreign currencies, investments, and other assets and liabilities are translated into U.S. dollars at current exchange rates. Purchases and sales of investment securities, income, and expenses are translated at the exchange rate prevailing on the respective dates of such transactions. Unrealized gains and losses that result from changes in foreign exchange rates and/or changes in market prices of securities have been included in unrealized appreciation/depreciation on investments and foreign currency translations. Net realized foreign currency gains and losses resulting from changes in exchange rates include foreign currency gains and losses between trade date and settlement date on investment securities transactions, foreign currency transactions, and the difference between the amounts of interest and dividends recorded on the books of the Fund and the amounts actually received. The portion of foreign currency gains and losses related to fluctuation in exchange rates between the initial purchase trade date and subsequent sale trade date is included in realized gain/(loss) on investments.
Foreign Securities. The Fund may directly purchase securities of foreign issuers. Investing in securities of foreign issuers involves special risks not typically associated with investing in securities of U.S. issuers. The risks include possible revaluation of currencies, the inability to repatriate funds, less complete financial information about companies, and possible future adverse political and economic developments. Moreover, securities of many foreign issuers and their markets may be less liquid and their prices more volatile than securities of comparable U.S. issuers.
Foreign Taxes. The Fund may be subject to foreign taxes on income, gains on investments, or currency repatriation, a portion of which may be recoverable. The Fund will accrue such taxes and recoveries as applicable, based upon its current interpretation of tax rules and regulations that exist in the markets in which it invests.
Securities Transactions and Investment Income. Securities transactions are accounted for on the trade date with realized gain/(loss) on investments determined by using the identified cost method. Interest income (including amortization of premium and accretion of discount) is recorded on an accrual basis. Premiums and discounts on debt securities are amortized using the effective yield to maturity method or amortized to earliest call date, if applicable. Dividend income is recorded on the ex-dividend date, except for certain dividends from foreign securities that are recorded as soon after the ex-dividend date as the Fund becomes aware of such dividends.
The Gabelli Focused Growth and Income Fund
Notes to Financial Statements (Continued)
Determination of Net Asset Value and Calculation of Expenses. Certain administrative expenses are common to, and allocated among, various affiliated funds. Such allocations are made on the basis of each fund’s average net assets or other criteria directly affecting the expenses as determined by the Adviser pursuant to procedures established by the Board.
In calculating the NAV per share of each class, investment income, realized and unrealized gains and losses, redemption fees, and expenses other than class specific expenses are allocated daily to each class of shares based upon the proportion of net assets of each class at the beginning of each day. Distribution expenses are borne solely by the class incurring the expense.
Distributions to Shareholders. Distributions to shareholders are recorded on the ex-dividend date. Distributions to shareholders are based on income and capital gains as determined in accordance with federal income tax regulations, which may differ from income and capital gains as determined under GAAP. These differences are primarily due to differing treatments of income and gains on various investment securities and foreign currency transactions held by the Fund, timing differences, and differing characterizations of distributions made by the Fund. These book/tax differences are either temporary or permanent in nature. To the extent these differences are permanent, adjustments are made to the appropriate capital accounts in the period when the differences arise. Permanent differences were primarily due to non-deductible partnership expense. These reclassifications have no impact on the NAV of the Fund. For the fiscal year ended September 30, 2024, reclassifications were made to decrease paid-in capital by $931, with an offsetting adjustment to total distributable earnings.
The Fund has a fixed distribution policy. Under the policy, the Fund declares and pays monthly distributions from net investment income, capital gains, and paid-in capital. The actual source of the distribution is determined after the end of the calendar year. Pursuant to this policy, distributions during the calendar year are made in excess of required distributions. To the extent such distributions are made from current earnings and profits, they are considered ordinary income or long term capital gains. Distributions sourced from paid-in capital should not be considered as dividend yield or the total return from an investment in the Fund. The Board continues to evaluate its distribution policy in light of ongoing economic and market conditions and may change the amount of the monthly distributions in the future.
The tax character of distributions paid during the fiscal years ended September 30, 2024 and 2023 was as follows:
| | | Year ended
September 30,
2024 | | | Year ended
September 30,
2023 | |
| Distributions paid from: | | | | | | | | |
| Ordinary income | | $ | 2,137,977 | | | $ | 1,600,441 | |
| Net long term capital gains | | | — | | | | 261,536 | |
| Total distributions paid | | $ | 2,137,977 | | | $ | 1,861,977 | |
Provision for Income Taxes. The Fund intends to continue to qualify as a regulated investment company under Subchapter M of the Internal Revenue Code of 1986, as amended (the Code). It is the policy of the Fund to comply with the requirements of the Code applicable to regulated investment companies and to distribute substantially all of its net investment company taxable income and net capital gains. Therefore, no provision for federal income taxes is required.
The Gabelli Focused Growth and Income Fund
Notes to Financial Statements (Continued)
At September 30, 2024, the components of accumulated earnings/losses on a tax basis were as follows:
| Undistributed ordinary income | | $ | 487,488 | |
| Accumulated capital loss carryforwards | | | (1,246,813 | ) |
| Net unrealized appreciation on investments and foreign currency translations | | | 14,211,281 | |
| Total | | $ | 13,451,956 | |
The Fund is permitted to carry capital losses forward for an unlimited period. Capital losses that are carried forward will retain their character as either short term or long term capital losses. The Fund has a short term capital loss carryforward with no expiration of $1,135,934 and a long term capital loss carryforward with no expiration of $110,879.
At September 30, 2024, the temporary difference between book basis and tax basis net unrealized appreciation on investments was due to tax basis adjustments on investments in partnerships, tax basis adjustments on investments in real estate investment trusts, and deferral of losses from wash sales for tax purposes.
The following summarizes the tax cost of investments and the related net unrealized appreciation at September 30, 2024:
| | | Cost | | | Gross
Unrealized
Appreciation | | | Gross
Unrealized
Depreciation | | | Net
Unrealized
Appreciation | |
| Investments | | $ | 31,304,473 | | | $ | 15,318,321 | | | $ | (1,106,978 | ) | | $ | 14,211,343 | |
The Fund is required to evaluate tax positions taken or expected to be taken in the course of preparing the Fund’s tax returns to determine whether the tax positions are “more-likely-than-not” of being sustained by the applicable tax authority. Income tax and related interest and penalties would be recognized by the Fund as tax expense in the Statement of Operations if the tax positions were deemed not to meet the more-likely-than-not threshold. During the fiscal year ended September 30, 2024, the Fund did not incur any income tax, interest, or penalties. As of September 30, 2024, the Adviser has reviewed all open tax years and concluded that there was no impact to the Fund’s net assets or results of operations. The Fund’s federal and state tax returns for the prior three fiscal years remain open, subject to examination. On an ongoing basis, the Adviser will monitor the Fund’s tax positions to determine if adjustments to this conclusion are necessary.
3. Investment Advisory Agreement and Other Transactions. The Fund has entered into an investment advisory agreement (the Advisory Agreement) with the Adviser which provides that the Fund will pay the Adviser a fee, computed daily and paid monthly, at the annual rate of 1.00% of the value of its average daily net assets. In accordance with the Advisory Agreement, the Adviser provides a continuous investment program for the Fund’s portfolio, oversees the administration of all aspects of the Fund’s business and affairs, and pays the compensation of all Officers and Directors of the Fund who are affiliated persons of the Adviser.
Effective August 17, 2022, the Adviser agreed to add the Fund’s Class A shares to the classes of shares of the Fund for which the Adviser has contractually agreed to waive its investment advisory fees and/or to reimburse expenses of the Fund to the extent necessary to maintain the annualized total operating expenses of Class I and Class A (excluding brokerage costs, acquired fund fees and expenses, interest, taxes, and extraordinary expenses) at no more than an annual rate of 0.80% and 1.25% of the value of that class’s average daily net
The Gabelli Focused Growth and Income Fund
Notes to Financial Statements (Continued)
assets. This agreement is in effect through January 31, 2025 for Class I and Class A, and may be terminated only by the Board before such time. During the fiscal year ended September 30, 2024, the Adviser reimbursed expenses in the amount of $167,786 for Class I and Class A. In addition, the Fund has agreed, during the two year period following any waiver or reimbursement by the Adviser, to repay such amount to the extent, that after giving effect to the repayment, such adjusted annualized total operating expenses would not exceed 0.80% and 1.25% of the value of the average daily net assets of Class I and Class A, respectively. At September 30, 2024, the cumulative amount which the Fund may repay the Adviser, subject to the terms above, is $355,547:
| For the fiscal year ended September 30, 2023, expiring September 30, 2025 | | $ | 187,761 | |
| For the fiscal year ended September 30, 2024, expiring September 30, 2026 | | | 167,786 | |
| | | $ | 355,547 | |
4. Distribution Plan. The Fund’s Board has adopted a distribution plan (the Plan) for each class of shares, except for Class I Shares, pursuant to Rule 12b-1 under the 1940 Act. Under the Class AAA, Class A, and Class C Share Plans, payments are authorized to G.distributors, LLC (the Distributor), an affiliate of the Adviser, at annual rates of 0.25%, 0.25%, and 1.00%, respectively, of the average daily net assets of those classes, the annual limitations under each Plan. Such payments are accrued daily and paid monthly.
5. Portfolio Securities. Purchases and sales of securities during the fiscal year ended September 30, 2024, other than short term securities and U.S. Government obligations, aggregated $14,419,372 and $12,670,241, respectively.
6. Transactions with Affiliates and Other Arrangements. During the fiscal year ended September 30, 2024, the Fund paid $30 in brokerage commissions on security trades to G.research, LLC, an affiliate of the Adviser. Additionally, the Distributor retained a total of $18,729 from investors representing commissions (sales charges and underwriting fees) on sales and redemptions of Fund shares.
The Corporation pays retainer and per meeting fees to Directors not affiliated with the Adviser, plus specified amounts to the Lead Director and Audit Committee Chairman. Directors are also reimbursed for out of pocket expenses incurred in attending meetings. Directors who are directors or employees of the Adviser or an affiliated company receive no compensation or expense reimbursement from the Corporation.
7. Line of Credit. The Fund participates in an unsecured line of credit, which expires on February 26, 2025 and may be renewed annually, of up to $75,000,000 under which it may borrow up to 10% of its net assets from the bank for temporary borrowing purposes. Borrowings under this arrangement bear interest at a floating rate equal to the higher of the Overnight Federal Funds Rate plus 135 basis points or the Overnight Bank Funding Rate plus 135 basis points in effect on that day. This amount, if any, would be included in “Interest expense” in the Statement of Operations. During the fiscal year ended September 30, 2024, there were no borrowings outstanding under the line of credit.
8. Capital Stock. The Fund offers four classes of shares – Class AAA Shares, Class A Shares, Class C Shares, and Class I Shares. From January 3, 2022 through March 14, 2023, the Fund’s Class C Shares were closed to all purchases. On March 15, 2023, Class C Shares were re-opened for purchases. Class AAA and Class I Shares are offered without a sales charge. Class A Shares are subject to a maximum front-end sales charge of 5.75%. Class C Shares are subject to a 1.00% contingent deferred sales charge for one year after purchase.
The Gabelli Focused Growth and Income Fund
Notes to Financial Statements (Continued)
The Fund imposes a redemption fee of 2.00% on all classes of shares that are redeemed or exchanged on or before the seventh day after the date of a purchase. The redemption fee is deducted from the proceeds otherwise payable to the redeeming shareholders and is retained by the Fund as an increase in paid-in capital. The redemption fees retained by the Fund during the fiscal years ended September 30, 2024 and 2023, if any, can be found in the Statement of Changes in Net Assets under Redemption Fees.
Transactions in shares of capital stock were as follows:
| | | Year Ended
September 30,
2024 | | | Year Ended
September 30,
2023 | |
| | | Shares | | | Amount | | | Shares | | | Amount | |
| Class AAA | | | | | | | | | | | | |
| Shares sold | | | 23,114 | | | $ | 356,897 | | | | 82,978 | | | $ | 1,292,550 | |
| Shares issued upon reinvestment of distributions | | | 14,895 | | | | 237,184 | | | | 15,953 | | | | 244,989 | |
| Shares redeemed | | | (103,972 | ) | | | (1,654,632 | ) | | | (89,323 | ) | | | (1,413,724 | ) |
| Net increase/(decrease) | | | (65,963 | ) | | $ | (1,060,551 | ) | | | 9,608 | | | $ | 123,815 | |
| | | | | | | | | | | | | | | | | |
| Class A | | | | | | | | | | | | | | | | |
| Shares sold | | | 301,441 | | | $ | 4,801,975 | | | | 444,081 | | | $ | 6,994,691 | |
| Shares issued upon reinvestment of distributions | | | 59,044 | | | | 962,453 | | | | 41,391 | | | | 645,659 | |
| Shares redeemed | | | (226,620 | ) | | | (3,710,476 | ) | | | (129,980 | ) | | | (2,043,292 | ) |
| Net increase | | | 133,865 | | | $ | 2,053,952 | | | | 355,492 | | | $ | 5,597,058 | |
| | | | | | | | | | | | | | | | | |
| Class C | | | | | | | | | | | | | | | | |
| Shares sold | | | 39,627 | | | $ | 507,504 | | | | 7,733 | | | $ | 98,511 | |
| Shares issued upon reinvestment of distributions | | | 9,831 | | | | 125,993 | | | | 16,264 | | | | 205,883 | |
| Shares redeemed | | | (121,020 | ) | | | (1,556,055 | ) | | | (160,129 | ) | | | (2,037,713 | ) |
| Net decrease | | | (71,562 | ) | | $ | (922,558 | ) | | | (136,132 | ) | | $ | (1,733,319 | ) |
| | | | | | | | | | | | | | | | | |
| Class I | | | | | | | | | | | | | | | | |
| Shares sold | | | 284,507 | | | $ | 4,919,181 | | | | 388,157 | | | $ | 6,526,936 | |
| Shares issued upon reinvestment of distributions | | | 41,208 | | | | 711,221 | | | | 41,222 | | | | 674,944 | |
| Shares redeemed | | | (322,820 | ) | | | (5,439,599 | ) | | | (693,181 | ) | | | (11,511,334 | ) |
| Net increase/(decrease) | | | 2,895 | | | $ | 190,803 | | | | (263,802 | ) | | $ | (4,309,454 | ) |
9. Indemnifications. The Fund enters into contracts that contain a variety of indemnifications. The Fund’s maximum exposure under these arrangements is unknown. However, the Fund has not had prior claims or losses pursuant to these contracts. Management has reviewed the Fund’s existing contracts and expects the risk of loss to be remote.
10. Subsequent Events. Management has evaluated the impact on the Fund of all subsequent events occurring through the date the financial statements were issued and has determined that there were no subsequent events requiring recognition or disclosure in the financial statements.
The Gabelli Focused Growth and Income Fund
Report of Independent Registered Public Accounting Firm
To the Shareholders and the Board of Directors of The Gabelli Focused Growth and Income Fund
Opinion on the Financial Statements
We have audited the accompanying statement of assets and liabilities of The Gabelli Focused Growth and Income Fund (the “Fund”) (one of the funds constituting Gabelli Equity Series Funds, Inc. (the “Corporation”)), including the schedule of investments, as of September 30, 2024, and the related statement of operations for the year then ended, the statements of changes in net assets for each of the two years in the period then ended, the financial highlights for each of the five years in the period then ended and the related notes (collectively referred to as the “financial statements”). In our opinion, the financial statements present fairly, in all material respects, the financial position of the Fund (one of the funds constituting Gabelli Equity Series Funds, Inc.) at September 30, 2024, the results of its operations for the year then ended, the changes in its net assets for each of the two years in the period then ended and its financial highlights for each of the five years in the period then ended, in conformity with U.S. generally accepted accounting principles.
Basis for Opinion
These financial statements are the responsibility of the Corporation’s management. Our responsibility is to express an opinion on the Fund’s financial statements based on our audits. We are a public accounting firm registered with the Public Company Accounting Oversight Board (United States) (“PCAOB”) and are required to be independent with respect to the Corporation in accordance with the U.S. federal securities laws and the applicable rules and regulations of the Securities and Exchange Commission and the PCAOB.
We conducted our audits in accordance with the standards of the PCAOB. Those standards require that we plan and perform the audit to obtain reasonable assurance about whether the financial statements are free of material misstatement, whether due to error or fraud. The Corporation is not required to have, nor were we engaged to perform, an audit of the Corporation’s internal control over financial reporting. As part of our audits we are required to obtain an understanding of internal control over financial reporting but not for the purpose of expressing an opinion on the effectiveness of the Corporation’s internal control over financial reporting. Accordingly, we express no such opinion.
Our audits included performing procedures to assess the risks of material misstatement of the financial statements, whether due to error or fraud, and performing procedures that respond to those risks. Such procedures included examining, on a test basis, evidence regarding the amounts and disclosures in the financial statements. Our procedures included confirmation of securities owned as of September 30, 2024, by correspondence with the custodian and brokers; when replies were not received from brokers, we performed other auditing procedures. Our audits also included evaluating the accounting principles used and significant estimates made by management, as well as evaluating the overall presentation of the financial statements. We believe that our audits provide a reasonable basis for our opinion.

We have served as the auditor of one or more Gabelli Funds investment companies since 1992.
New York, New York
November 29, 2024
The Gabelli Focused Growth and Income Fund
Liquidity Risk Management Program (Unaudited)
In accordance with Rule 22e-4 under the 1940 Act, the Fund has established a liquidity risk management program (the LRM Program) to govern its approach to managing liquidity risk. The LRM Program is administered by the Liquidity Committee (the Committee), which is comprised of members of Gabelli Funds, LLC management. The Board has designated the Committee to administer the LRM Program.
The LRM Program’s principal objectives include supporting the Fund’s compliance with limits on investments in illiquid assets and mitigating the risk that the Fund will be unable to meet its redemption obligations in a timely manner. The LRM Program also includes elements that support the management and assessment of liquidity risk, including an annual assessment of factors that influence the Fund’s liquidity and the monthly classification and re-classification of certain investments that reflect the Committee’s assessment of their relative liquidity under current market conditions.
At a meeting of the Board held on May 15, 2024, the Board received a written report from the Committee regarding the design and operational effectiveness of the LRM Program. The Committee determined, and reported to the Board, that the LRM Program is reasonably designed to assess and manage the Fund’s liquidity risk and has operated adequately and effectively since its implementation. The Committee reported that there were no liquidity events that impacted the Fund or its ability to timely meet redemptions without dilution to existing shareholders. The Committee noted that the Fund is primarily invested in highly liquid securities and, accordingly, continues to be exempt from the requirement to determine a “highly liquid investment minimum” as defined in the Rule 22e-4. Because of that continued qualification for the exemption, the Fund has not adopted a “highly liquid investment minimum” amount. The Committee further noted that while changes to the LRM Program were made during the Review Period and reported to the Board, no material changes were made to the LRM Program as a result of the Committee’s annual review.
There can be no assurance that the LRM Program will achieve its objectives in the future. Please refer to the Fund’s Prospectus for more information regarding its exposure to liquidity risk and other principal risks to which an investment in the Fund may be subject.
Gabelli Funds and Your Personal Privacy
Who are we?
The Gabelli Funds are investment companies registered with the Securities and Exchange Commission under the Investment Company Act of 1940. We are managed by Gabelli Funds, LLC, which is affiliated with GAMCO Investors, Inc., a publicly held company with subsidiaries and affiliates that provide investment advisory services for a variety of clients.
What kind of non-public information do we collect about you if you become a fund shareholder?
If you apply to open an account directly with us, you will be giving us some non-public information about yourself. The non-public information we collect about you is:
| ● | Information you give us on your application form. This could include your name, address, telephone number, social security number, bank account number, and other information. |
| ● | Information about your transactions with us, any transactions with our affiliates, and transactions with the entities we hire to provide services to you. This would include information about the shares that you buy or redeem. If we hire someone else to provide services — like a transfer agent — we will also have information about the transactions that you conduct through them. |
What information do we disclose and to whom do we disclose it?
We do not disclose any non-public personal information about our customers or former customers to anyone other than our affiliates, our service providers who need to know such information, and as otherwise permitted by law. If you want to find out what the law permits, you can read the privacy rules adopted by the Securities and Exchange Commission. They are in volume 17 of the Code of Federal Regulations, Part 248. The Commission often posts information about its regulations on its website, www.sec.gov.
What do we do to protect your personal information?
We restrict access to non-public personal information about you to the people who need to know that information in order to provide services to you or the fund and to ensure that we are complying with the laws governing the securities business. We maintain physical, electronic, and procedural safeguards to keep your personal information confidential.
This page was intentionally left blank.
This page was intentionally left blank.
THE GABELLI FOCUSED GROWTH AND INCOME FUND
2024 TAX NOTICE TO SHAREHOLDERS (Unaudited)
During the fiscal year ended September 30, 2024, the Fund paid to shareholders ordinary income distributions totaling $0.7218, $0.8221, $0.7218, and $0.8221 for each of Class AAA, Class A, Class C, and Class I, respectively. For the fiscal year ended September 30, 2024, 61.98% of the ordinary income distribution qualifies for the dividends received deduction available to corporations. The Fund designates 67.34% of the ordinary income distribution as qualified dividend income pursuant to the Jobs and Growth Tax Relied Reconciliation Act of 2003. The Fund designates 4.16% of the ordinary income distribution as qualified interest income pursuant to the Tax Relief, Unemployment Reauthorization, and Job Creation Act of 2010.
U.S. Government Income:
The percentage of the ordinary income distribution paid by the Fund during the fiscal year ended September 30, 2024 which was derived from U.S. Treasury securities was 4.16%. Such income is exempt from state and local tax in all states. However, many states, including New York and California, allow a tax exemption for a portion of the income earned only if a mutual fund has invested at least 50% of its assets at the end of each quarter of the Fund’s fiscal year in U.S. Government securities. The Gabelli Focused Growth and Income Fund did not meet this strict requirement in 2024. The percentage of U.S. Government securities held as of September 30, 2024 was 2.4%. Due to the diversity in state and local tax law, it is recommended that you consult your personal tax adviser as to the applicability of the information provided to your specific situation.
All designations are based on financial information available as of the date of this annual report and, accordingly, are subject to change. For each item, it is the intention of the Fund to designate the maximum amount permitted under the Internal Revenue Code and the regulations thereunder.
| | The Gabelli Global Financial Services Fund Annual Report — September 30, 2024 | |  |
| | | | Ian Lapey
Portfolio Manager
BA, Williams College
MS, Northeastern University
MBA, New York University |
To Our Shareholders,
For the fiscal year ended September 30, 2024, the net asset value (NAV) total return per Class AAA Share of The Gabelli Global Financial Services Fund (the Fund) was 39.0% compared with a total return of 38.8% for the Morgan Stanley Capital International (MSCI) World Financials Index. Other classes of shares are available.
Enclosed are the financial statements, including the schedule of investments, as of September 30, 2024.
Summary of Portfolio Holdings (Unaudited)
The following table presents portfolio holdings as a percent of net assets as of September 30, 2024:
The Gabelli Global Financial Services Fund
| Banks | | | 26.1 | % |
| Diversified Banks | | | 13.2 | % |
| Insurance | | | 12.7 | % |
| Investment Management | | | 8.7 | % |
| Institutional Trust, Fiduciary, and Custody | | | 6.6 | % |
| Automobiles | | | 5.4 | % |
| Institutional Brokerage | | | 5.1 | % |
| Consumer Finance | | | 5.1 | % |
| Homebuilders | | | 4.6 | % |
| U.S. Government Obligations | | | 3.9 | % |
| Reinsurance | | | 3.4 | % |
| Institutional Banking | | | 2.8 | % |
| Energy and Utilities | | | 2.2 | % |
| Other Assets and Liabilities (Net) | | | 0.2 | % |
| | | | 100.0 | % |
The Fund files a complete schedule of portfolio holdings with the Securities and Exchange Commission (the SEC) for the first and third quarters of each fiscal year on Form N-PORT. Shareholders may obtain this information at www.gabelli.com or by calling the Fund at 800-GABELLI (800-422-3554). The Fund’s Form N-PORT is available on the SEC’s website at www.sec.gov and may also be reviewed and copied at the SEC’s Public Reference Room in Washington, DC. Information on the operation of the Public Reference Room may be obtained by calling 800-SEC-0330.
Proxy Voting
The Fund files Form N-PX with its complete proxy voting record for the twelve months ended June 30, no later than August 31 of each year. A description of the Fund’s proxy voting policies, procedures, and how the Fund voted proxies relating to portfolio securities is available without charge, upon request, by (i) calling 800-GABELLI (800-422-3554); (ii) writing to The Gabelli Funds at One Corporate Center, Rye, NY 10580-1422; or (iii) visiting the SEC’s website at www.sec.gov.
The Gabelli Global Financial Services Fund
Schedule of Investments — September 30, 2024
| | | | | | | | | Market | |
| Shares | | | | | Cost | | | Value | |
| | | | | COMMON STOCKS — 95.9% | | | | | | | | |
| | | | | Automobiles — 5.4% | | | | | | | | |
| | 24,199 | | | Daimler Truck Holding AG | | $ | 706,209 | | | $ | 905,895 | |
| | 8,050 | | | Mercedes-Benz Group AG | | | 438,934 | | | | 520,088 | |
| | 5,335 | | | Toyota Motor Corp., ADR | | | 748,505 | | | | 952,671 | |
| | | | | | | | 1,893,648 | | | | 2,378,654 | |
| | | | | Banks — 26.1% | | | | | | | | |
| | 82,500 | | | Banco Bilbao Vizcaya Argentaria SA | | | 435,552 | | | | 891,533 | |
| | 82,000 | | | Commerzbank AG | | | 475,767 | | | | 1,508,374 | |
| | 1,042,500 | | | Dah Sing Banking Group Ltd. | | | 823,361 | | | | 934,701 | |
| | 352,900 | | | Dah Sing Financial Holdings Ltd. | | | 824,840 | | | | 1,123,546 | |
| | 976 | | | First Citizens BancShares Inc., Cl. A | | | 311,950 | | | | 1,796,767 | |
| | 33,663 | | | Flushing Financial Corp. | | | 428,622 | | | | 490,807 | |
| | 36,500 | | | ING Groep NV | | | 311,739 | | | | 661,212 | |
| | 44,900 | | | Japan Post Bank Co. Ltd. | | | 452,399 | | | | 417,994 | |
| | 15,550 | | | Shinhan Financial Group Co. Ltd., ADR | | | 439,746 | | | | 658,854 | |
| | 19,718 | | | Southern First Bancshares Inc.† | | | 585,724 | | | | 671,989 | |
| | 10,050 | | | Texas Capital Bancshares Inc.† | | | 596,731 | | | | 718,173 | |
| | 41,405 | | | TrustCo Bank Corp. NY | | | 1,225,245 | | | | 1,369,263 | |
| | 6,700 | | | Webster Financial Corp. | | | 192,559 | | | | 312,287 | |
| | | | | | | | 7,104,235 | | | | 11,555,500 | |
| | | | | Consumer Finance — 5.1% | | | | | | | | |
| | 19,680 | | | Ally Financial Inc. | | | 476,800 | | | | 700,411 | |
| | 10,310 | | | Capital One Financial Corp. | | | 919,647 | | | | 1,543,717 | |
| | | | | | | | 1,396,447 | | | | 2,244,128 | |
| | | | | Diversified Banks — 13.2% | | | | | | | | |
| | 118,000 | | | Barclays plc | | | 211,594 | | | | 354,250 | |
| | 15,050 | | | Citigroup Inc. | | | 670,751 | | | | 942,130 | |
| | 42,170 | | | Credit Agricole SA | | | 461,451 | | | | 644,273 | |
| | 17,668 | | | Hana Financial Group Inc. | | | 519,656 | | | | 794,432 | |
| | 169,785 | | | NatWest Group plc | | | 393,522 | | | | 780,632 | |
| | 9,110 | | | Societe Generale SA | | | 183,438 | | | | 226,647 | |
| | 111,200 | | | Standard Chartered plc | | | 733,968 | | | | 1,178,944 | |
| | 20,700 | | | UniCredit SpA | | | 270,951 | | | | 907,056 | |
| | | | | | | | 3,445,331 | | | | 5,828,364 | |
| | | | | Energy and Utilities — 2.2% | | | | | | | | |
| | 41,522 | | | Vitesse Energy Inc. | | | 595,875 | | | | 997,358 | |
| | | | | | | | | | | | | |
| | | | | Homebuilders — 4.6% | | | | | | | | |
| | 3,400 | | | Cavco Industries Inc.† | | | 577,021 | | | | 1,456,016 | |
| | 20,413 | | | Legacy Housing Corp.† | | | 234,612 | | | | 558,296 | |
| | | | | | | | 811,633 | | | | 2,014,312 | |
| | | | | | | | | Market | |
| Shares | | | | | Cost | | | Value | |
| | | | | Institutional Banking — 2.8% | | | | | | | | |
| | 18,100 | | | Moelis & Co., Cl. A | | $ | 649,635 | | | $ | 1,240,031 | |
| | | | | | | | | | | | | |
| | | | | Institutional Brokerage — 5.1% | | | | | | | | |
| | 118,500 | | | Daiwa Securities Group Inc. | | | 588,107 | | | | 828,614 | |
| | 23,310 | | | Jefferies Financial Group Inc. | | | 425,633 | | | | 1,434,730 | |
| | | | | | | | 1,013,740 | | | | 2,263,344 | |
| | | | | Institutional Trust, Fiduciary, and Custody — 6.6% | |
| | 14,180 | | | State Street Corp. | | | 849,827 | | | | 1,254,505 | |
| | 23,300 | | | The Bank of New York Mellon Corp. | | | 994,781 | | | | 1,674,338 | |
| | | | | | | | 1,844,608 | | | | 2,928,843 | |
| | | | | Insurance — 12.7% | | | | | | | | |
| | 145,618 | | | Aegon Ltd. | | | 569,173 | | | | 934,962 | |
| | 1,527 | | | E-L Financial Corp. Ltd. | | | 1,097,457 | | | | 1,428,264 | |
| | 27,670 | | | First American Financial Corp. | | | 1,525,933 | | | | 1,826,497 | |
| | 72,345 | | | HG Holdings Inc.† | | | 578,362 | | | | 446,730 | |
| | 19,505 | | | NN Group NV | | | 765,656 | | | | 972,263 | |
| | | | | | | | 4,536,581 | | | | 5,608,716 | |
| | | | | Investment Management — 8.7% | | | | | | | | |
| | 6,686 | | | Diamond Hill Investment Group Inc. | | | 1,056,649 | | | | 1,080,524 | |
| | 17,950 | | | Janus Henderson Group plc | | | 491,616 | | | | 683,356 | |
| | 341,500 | | | The Westaim Corp.† | | | 752,847 | | | | 1,004,969 | |
| | 74,963 | | | Westwood Holdings Group Inc. | | | 890,037 | | | | 1,064,475 | |
| | | | | | | | 3,191,149 | | | | 3,833,324 | |
| | | | | Reinsurance — 3.4% | | | | | | | | |
| | 18,800 | | | Axis Capital Holdings Ltd. | | | 949,439 | | | | 1,496,668 | |
| | | | | | | | | | | | | |
| | | | | TOTAL COMMON STOCKS | | | 27,432,321 | | | | 42,389,242 | |
| | | | | | | | | | | | | |
Principal
Amount | | | | | | | | | | | |
| | | | | U.S. GOVERNMENT OBLIGATIONS — 3.9% | | | | | | | | |
| $ | 1,712,000 | | | U.S. Treasury Bills, | | | | | | | | |
| | | | | 4.540% to 5.265%††, 10/17/24 to 12/26/24 | | | 1,699,503 | | | | 1,700,303 | |
| | | | | | | | | | | | | |
| | | | | TOTAL INVESTMENTS — 99.8% | | $ | 29,131,824 | | | | 44,089,545 | |
| | | | | | | | | | | | | |
| | | | | Other Assets and Liabilities (Net) — 0.2% | | | | | | | 103,575 | |
| | | | | | | | | | | | | |
| | | | | NET ASSETS — 100.0% | | | | | | $ | 44,193,120 | |
| † | Non-income producing security. |
| †† | Represents annualized yields at dates of purchase. |
| | |
| ADR | American Depositary Receipt |
See accompanying notes to financial statements.
The Gabelli Global Financial Services Fund
Statement of Assets and Liabilities
September 30, 2024
| Assets: | | | | |
| Investments, at value (cost $29,131,824) | | $ | 44,089,545 | |
| Cash | | | 26,157 | |
| Receivable for Fund shares sold | | | 15,000 | |
| Receivable from Adviser | | | 14,144 | |
| Dividends and interest receivable | | | 111,851 | |
| Prepaid expenses | | | 64,252 | |
| Total Assets | | | 44,320,949 | |
| Liabilities: | | | | |
| Payable for investments purchased | | | 53,555 | |
| Payable for investment advisory fees | | | 35,493 | |
| Payable for distribution fees | | | 439 | |
| Payable for legal and audit fees | | | 29,011 | |
| Other accrued expenses | | | 9,331 | |
| Total Liabilities | | | 127,829 | |
| Commitments and Contingencies (See Note 3) | | | | |
| Net Assets | | | | |
| (applicable to 2,854,130 shares outstanding) | | $ | 44,193,120 | |
| | | | | |
| Net Assets Consist of: | | | | |
| Paid-in capital | | $ | 28,977,489 | |
| Total distributable earnings | | | 15,215,631 | |
| Net Assets | | $ | 44,193,120 | |
| | | | | |
| Shares of Capital Stock, each at $0.001 par value: | | | | |
| Class AAA: | | | | |
| Net Asset Value, offering, and redemption price per share ($2,161,732 ÷ 139,700 shares outstanding; 120,000,000 shares authorized) | | $ | 15.47 | |
| Class A: | | | | |
| Net Asset Value and redemption price per share ($15,387 ÷ 984.66 shares outstanding; 60,000,000 shares authorized) | | $ | 15.63 | |
| Maximum offering price per share (NAV ÷ 0.9425, based on maximum sales charge of 5.75% of the offering price) | | $ | 16.58 | |
| Class C: | | | | |
| Net Asset Value and offering price per share ($1,655 ÷ 108.07 shares outstanding; 20,000,000 shares authorized) | | $ | 15.31 | (a) |
| Class I: | | | | |
| Net Asset Value, offering, and redemption price per share ($42,014,346 ÷ 2,713,337 shares outstanding; 150,000,000 shares authorized) | | $ | 15.48 | |
| (a) | Redemption price varies based on the length of time held. |
Statement of Operations
For the Year Ended September 30, 2024
| Investment Income: | | | | |
| Dividends (net of foreign withholding taxes of $99,089) | | $ | 1,431,850 | |
| Interest | | | 55,822 | |
| Total Investment Income | | | 1,487,672 | |
| Expenses: | | | | |
| Investment advisory fees | | | 362,714 | |
| Distribution fees - Class AAA | | | 3,897 | |
| Distribution fees - Class A | | | 20 | |
| Distribution fees - Class C | | | 14 | |
| Legal and audit fees | | | 51,879 | |
| Registration expenses | | | 43,474 | |
| Shareholder communications expenses | | | 23,490 | |
| Custodian fees | | | 21,403 | |
| Shareholder services fees | | | 12,462 | |
| Directors’ fees | | | 2,524 | |
| Miscellaneous expenses | | | 12,723 | |
| Total Expenses | | | 534,600 | |
| Less: | | | | |
| Expense reimbursements (See Note 3) | | | (166,565 | ) |
| Expenses paid indirectly by broker (See Note 6) | | | (1,390 | ) |
| Total Credits and Reimbursements | | | (167,955 | ) |
| Net Expenses | | | 366,645 | |
| Net Investment Income | | | 1,121,027 | |
| | | | | |
| Net Realized and Unrealized Gain/(Loss) on Investments and Foreign Currency: | | | | |
| Net realized loss on investments | | | (337,328 | ) |
| Net realized loss on foreign currency transactions | | | (1,102 | ) |
| Net realized loss on investments and foreign currency transactions | | | (338,430 | ) |
| Net change in unrealized appreciation/depreciation: | | | | |
| on investments | | | 11,136,591 | |
| on foreign currency translations | | | 2,040 | |
| Net change in unrealized appreciation/depreciation on investments and foreign currency translations | | | 11,138,631 | |
| Net Realized and Unrealized Gain/(Loss) on Investments and Foreign Currency | | | 10,800,201 | |
| Net Increase in Net Assets Resulting from Operations | | $ | 11,921,228 | |
See accompanying notes to financial statements.
The Gabelli Global Financial Services Fund
Statement of Changes in Net Assets
| | | Year Ended | | | Year Ended | |
| | | September 30,
2024 | | | September 30,
2023 | |
| Operations: | | | | | | | | |
| Net investment income | | $ | 1,121,027 | | | $ | 734,654 | |
| Net realized gain/(loss) on investments and foreign currency transactions | | | (338,430 | ) | | | 368,100 | |
| Net change in unrealized appreciation/depreciation on investments and foreign currency translations | | | 11,138,631 | | | | 4,714,056 | |
| Net Increase in Net Assets Resulting from Operations | | | 11,921,228 | | | | 5,816,810 | |
| | | | | | | | | |
| Distributions to Shareholders: | | | | | | | | |
| Accumulated earnings | | | | | | | | |
| Class AAA | | | (17,033 | ) | | | (10,218 | ) |
| Class A | | | (137 | ) | | | (451 | ) |
| Class C | | | (24 | ) | | | (20 | ) |
| Class I | | | (815,347 | ) | | | (705,030 | ) |
| Total Distributions to Shareholders | | | (832,541 | ) | | | (715,719 | ) |
| | | | | | | | | |
| Capital Share Transactions: | | | | | | | | |
| Class AAA | | | 1,134,515 | | | | 140,135 | |
| Class A | | | 7,687 | | | | (13,049 | ) |
| Class C | | | 24 | | | | 20 | |
| Class I | | | 3,735,397 | | | | 1,514,982 | |
| Net Increase in Net Assets from Capital Share Transactions | | | 4,877,623 | | | | 1,642,088 | |
| | | | | | | | | |
| Redemption Fees | | | 482 | | | | 2 | |
| | | | | | | | | |
| Net Increase in Net Assets | | | 15,966,792 | | | | 6,743,181 | |
| | | | | | | | | |
| Net Assets: | | | | | | | | |
| Beginning of year | | | 28,226,328 | | | | 21,483,147 | |
| End of year | | $ | 44,193,120 | | | $ | 28,226,328 | |
See accompanying notes to financial statements.
The Gabelli Global Financial Services Fund
Financial Highlights
Selected data for a share of capital stock outstanding throughout each year:
| | | | | | Income (Loss) from Investment Operations | | | Distributions | | | | | | | | | | | | Ratios to Average Net Assets/Supplemental Data | |
| Year Ended September 30 | | Net Asset Value,
Beginning
of Period | | | Net Investment
Income(a) | | | Net Realized
and Unrealized
Gain (Loss) on
Investments | | | Total from
Investment
Operations | | | Net Investment
Income | | | Total
Distributions | | | Redemption
Fees(a) | | | Net Asset Value,
End of Period | | | Total
Return† | | | Net Assets,
End of Period
(in 000’s) | | | Net Investment
Income | | | Operating
Expenses
Before
Reimbursement | | | Operating
Expenses
Net of
Reimbursement(b)(c) | | | Portfolio
Turnover
Rate | |
| Class AAA | | | | | | | | | | | | | | | | | | | | | | | | | | | | | | | | | | | | | | | | | | | | | | | | | | | | | | | | |
| 2024 | | $ | 11.43 | | | $ | 0.41 | | | $ | 3.94 | | | $ | 4.35 | | | $ | (0.31 | ) | | $ | (0.31 | ) | | $ | 0.00 | (d) | | $ | 15.47 | | | | 38.95 | % | | $ | 2,162 | | | | 3.05 | % | | | 1.71 | % | | | 1.25 | % | | | 9 | % |
| 2023 | | | 9.28 | | | | 0.28 | | | | 2.14 | | | | 2.42 | | | | (0.27 | ) | | | (0.27 | ) | | | — | | | | 11.43 | | | | 26.47 | | | | 577 | | | | 2.57 | | | | 1.91 | | | | 1.25 | | | | 21 | |
| 2022 | | | 11.80 | | | | 0.27 | (e) | | | (2.56 | ) | | | (2.29 | ) | | | (0.23 | ) | | | (0.23 | ) | | | — | | | | 9.28 | | | | (19.79) | | | | 339 | | | | 2.39 | (e) | | | 1.88 | | | | 1.27 | (f) | | | 26 | |
| 2021 | | | 7.08 | | | | 0.33 | | | | 4.52 | | | | 4.85 | | | | (0.13 | ) | | | (0.13 | ) | | | — | | | | 11.80 | | | | 69.04 | | | | 564 | | | | 2.99 | | | | 2.04 | | | | 1.25 | | | | 19 | |
| 2020 | | | 9.09 | | | | 0.11 | | | | (1.90 | ) | | | (1.79 | ) | | | (0.22 | ) | | | (0.22 | ) | | | 0.00 | (d) | | | 7.08 | | | | (20.33) | | | | 47 | | | | 1.34 | | | | 2.51 | | | | 1.25 | | | | 18 | |
| Class A | | | | | | | | | | | | | | | | | | | | | | | | | | | | | | | | | | | | | | | | | | | | | | | | | | | | | | | | |
| 2024 | | $ | 11.50 | | | $ | 0.37 | | | $ | 4.03 | | | $ | 4.40 | | | $ | (0.27 | ) | | $ | (0.27 | ) | | $ | 0.00 | (d) | | $ | 15.63 | | | | 39.09 | % | | $ | 15 | | | | 2.76 | % | | | 1.71 | % | | | 1.25 | % | | | 9 | % |
| 2023 | | | 9.34 | | | | 0.27 | | | | 2.17 | | | | 2.44 | | | | (0.28 | ) | | | (0.28 | ) | | | — | | | | 11.50 | | | | 26.44 | | | | 6 | | | | 2.51 | | | | 1.91 | | | | 1.25 | | | | 21 | |
| 2022 | | | 11.86 | | | | 0.27 | (e) | | | (2.57 | ) | | | (2.30 | ) | | | (0.22 | ) | | | (0.22 | ) | | | — | | | | 9.34 | | | | (19.75) | | | | 15 | | | | 2.34 | (e) | | | 1.88 | | | | 1.27 | (f) | | | 26 | |
| 2021 | | | 7.08 | | | | 0.32 | | | | 4.54 | | | | 4.86 | | | | (0.08 | ) | | | (0.08 | ) | | | — | | | | 11.86 | | | | 69.07 | | | | 33 | | | | 2.94 | | | | 2.04 | | | | 1.25 | | | | 19 | |
| 2020 | | | 9.10 | | | | 0.16 | | | | (1.94 | ) | | | (1.78 | ) | | | (0.24 | ) | | | (0.24 | ) | | | 0.00 | (d) | | | 7.08 | | | | (20.24) | | | | 8 | | | | 2.12 | | | | 2.51 | | | | 1.25 | | | | 18 | |
| Class C | | | | | | | | | | | | | | | | | | | | | | | | | | | | | | | | | | | | | | | | | | | | | | | | | | | | | | | | |
| 2024 | | $ | 11.32 | | | $ | 0.27 | | | $ | 3.95 | | | $ | 4.22 | | | $ | (0.23 | ) | | $ | (0.23 | ) | | $ | 0.00 | (d) | | $ | 15.31 | | | | 37.93 | % | | $ | 2 | | | | 2.05 | % | | | 2.46 | % | | | 2.00 | % | | | 9 | % |
| 2023 | | | 9.19 | | | | 0.19 | | | | 2.13 | | | | 2.32 | | | | (0.19 | ) | | | (0.19 | ) | | | — | | | | 11.32 | | | | 25.48 | | | | 1 | | | | 1.72 | | | | 2.66 | | | | 2.00 | | | | 21 | |
| 2022 | | | 11.68 | | | | 0.29 | (e) | | | (2.64 | ) | | | (2.35 | ) | | | (0.14 | ) | | | (0.14 | ) | | | — | | | | 9.19 | | | | (20.35) | | | | 1 | | | | 2.62 | (e) | | | 2.63 | | | | 2.02 | (f) | | | 26 | |
| 2021 | | | 7.03 | | | | 0.18 | | | | 4.55 | | | | 4.73 | | | | (0.08 | ) | | | (0.08 | ) | | | — | | | | 11.68 | | | | 67.59 | | | | 1 | | | | 1.77 | | | | 2.79 | | | | 2.00 | | | | 19 | |
| 2020 | | | 9.05 | | | | 0.06 | | | | (1.91 | ) | | | (1.85 | ) | | | (0.17 | ) | | | (0.17 | ) | | | 0.00 | (d) | | | 7.03 | | | | (20.97) | | | | 1 | | | | 0.76 | | | | 3.26 | | | | 2.00 | | | | 18 | |
| Class I | | | | | | | | | | | | | | | | | | | | | | | | | | | | | | | | | | | | | | | | | | | | | | | | | | | | | | | | |
| 2024 | | $ | 11.44 | | | $ | 0.41 | | | $ | 3.97 | | | $ | 4.38 | | | $ | (0.34 | ) | | $ | (0.34 | ) | | $ | 0.00 | (d) | | $ | 15.48 | | | | 39.25 | % | | $ | 42,014 | | | | 3.09 | % | | | 1.46 | % | | | 1.00 | % | | | 9 | % |
| 2023 | | | 9.29 | | | | 0.30 | | | | 2.16 | | | | 2.46 | | | | (0.31 | ) | | | (0.31 | ) | | | 0.00 | (d) | | | 11.44 | | | | 26.82 | | | | 27,642 | | | | 2.77 | | | | 1.66 | | | | 1.00 | | | | 21 | |
| 2022 | | | 11.80 | | | | 0.31 | (e) | | | (2.57 | ) | | | (2.26 | ) | | | (0.25 | ) | | | (0.25 | ) | | | — | | | | 9.29 | | | | (19.57) | | | | 21,128 | | | | 2.76 | (e) | | | 1.63 | | | | 1.02 | (f) | | | 26 | |
| 2021 | | | 7.08 | | | | 0.29 | | | | 4.58 | | | | 4.87 | | | | (0.15 | ) | | | (0.15 | ) | | | — | | | | 11.80 | | | | 69.45 | | | | 24,221 | | | | 2.79 | | | | 1.79 | | | | 1.00 | | | | 19 | |
| 2020 | | | 9.11 | | | | 0.14 | | | | (1.91 | ) | | | (1.77 | ) | | | (0.26 | ) | | | (0.26 | ) | | | 0.00 | (d) | | | 7.08 | | | | (20.17) | | | | 13,445 | | | | 1.84 | | | | 2.26 | | | | 1.00 | | | | 18 | |
| † | Total return represents aggregate total return of a hypothetical investment at the beginning of the year and sold at the end of the year including reinvestment of distributions and does not reflect the applicable sales charges. |
| (a) | Per share amounts have been calculated using the average shares outstanding method. |
| (b) | Under an expense reimbursement agreement with the Adviser, the Adviser reimbursed expenses of $166,565, $174,121, $149,730, $165,217, and $174,126 during all fiscal years presented, respectively. |
| (c) | The Fund received credits from a designated broker who agreed to pay certain Fund operating expenses. For the fiscal years ended September 30, 2023, 2022, 2021, and 2020, if credits had not been received, the expense ratios would have been 1.26%, 1.28%, 1.26%, and 1.26% (Class AAA and Class A), 2.01%, 2.02%, 2.01%, and 2.01% (Class C), and 1.01%, 1.03%, 1.01%, and 1.01% (Class I), respectively. For the fiscal year ended September 30, 2024, there was no material impact to the expense ratios. |
| (d) | Amount represents less than $0.005 per share. |
| (e) | Includes income resulting from special dividends. Without these dividends, the per share income amounts would have been $0.21 (Class AAA and Class A), $0.23 (Class C), and $0.25 (Class I), and the net investment income ratios would have been 1.88% (Class AAA), 1.84% (Class A), 2.12% (Class C), and 2.25% (Class I) for the fiscal year ended September 30, 2022. |
| (f) | The Fund incurred tax expense for the fiscal year ended September 30, 2022. If tax expense had not been incurred, the ratios of operating expenses to average net assets would have been 1.25% (Class AAA and Class A), 2.00% (Class C), and 1.00% (Class I). |
See accompanying notes to financial statements.
The Gabelli Global Financial Services Fund
Notes to Financial Statements
1. Organization. The Gabelli Global Financial Services Fund, a series of the Gabelli Equity Series Funds, Inc. (the Corporation), was incorporated on July 25, 1991 in Maryland. The Fund is a non-diversified open-end management investment company registered under the Investment Company Act of 1940, as amended (the 1940 Act), and is one of four separately managed portfolios (collectively, the Portfolios) of the Corporation. The Fund seeks to provide capital appreciation. The Fund commenced investment operations on October 1, 2018.
Gabelli Funds, LLC (the “Adviser”), with its principal offices located at One Corporate Center, Rye, New York 10580-1422, serves as investment adviser to the Fund. The Adviser makes investment decisions for the Fund and continuously reviews and administers the Funds’ investment program and manages the operations of each Fund under the general supervision of the Company’s Board.
2. Significant Accounting Policies. As an investment company, the Fund follows the investment company accounting and reporting guidance, which is part of U.S. generally accepted accounting principles (GAAP) that may require the use of management estimates and assumptions in the preparation of its financial statements. Actual results could differ from those estimates. The following is a summary of significant accounting policies followed by the Fund in the preparation of its financial statements.
Security Valuation. Portfolio securities listed or traded on a nationally recognized securities exchange or traded in the U.S. over-the-counter market for which market quotations are readily available are valued at the last quoted sale price or a market’s official closing price as of the close of business on the day the securities are being valued. If there were no sales that day, the security is valued at the average of the closing bid and asked prices or, if there were no asked prices quoted on that day, then the security is valued at the closing bid price on that day. If no bid or asked prices are quoted on such day, the security is valued at the most recently available price or, if the Board of Directors (the Board) so determines, by such other method as the Board shall determine in good faith to reflect its fair market value. Portfolio securities traded on more than one national securities exchange or market are valued according to the broadest and most representative market, as determined by Gabelli Funds, LLC (the Adviser).
Portfolio securities primarily traded on a foreign market are generally valued at the preceding closing values of such securities on the relevant market, but may be fair valued pursuant to procedures established by the Board if market conditions change significantly after the close of the foreign market, but prior to the close of business on the day the securities are being valued. Debt obligations for which market quotations are readily available are valued at the average of the latest bid and asked prices. If there were no asked prices quoted on such day, the security is valued using the closing bid price, unless the Board determines such amount does not reflect the securities’ fair value, in which case these securities will be fair valued as determined by the Board. Certain securities are valued principally using dealer quotations. Futures contracts are valued at the closing settlement price of the exchange or board of trade on which the applicable contract is traded. OTC futures and options on futures for which market quotations are readily available will be valued by quotations received from a pricing service or, if no quotations are available from a pricing service, by quotations obtained from one of more dealers in the instrument in question by the Adviser.
Securities and assets for which market quotations are not readily available are fair valued as determined by the Board. Fair valuation methodologies and procedures may include, but are not limited to: analysis and review of available financial and non-financial information about the company; comparisons with the valuation and changes in valuation of similar securities, including a comparison of foreign securities with the equivalent U.S.
The Gabelli Global Financial Services Fund
Notes to Financial Statements (Continued)
dollar value American Depositary Receipt securities at the close of the U.S. exchange; and evaluation of any other information that could be indicative of the value of the security.
The inputs and valuation techniques used to measure fair value of the Fund’s investments are summarized into three levels as described in the hierarchy below:
| ● | Level 1 — quoted prices in active markets for identical securities; |
| ● | Level 2 — other significant observable inputs (including quoted prices for similar securities, interest rates, prepayment speeds, credit risk, etc.); and |
| ● | Level 3 — significant unobservable inputs (including the Board’s determinations as to the fair value of investments). |
A financial instrument’s level within the fair value hierarchy is based on the lowest level of any input both individually and in the aggregate that is significant to the fair value measurement. The inputs or methodology used for valuing securities are not necessarily an indication of the risk associated with investing in those securities. The summary of the Fund’s investments in securities by inputs used to value the Fund’s investments as of September 30, 2024 is as follows:
| | | Valuation Inputs | | | | |
| | | Level 1
Quoted Prices | | | Level 2
Other Significant
Observable
Inputs(a) | | | Total
Market Value
at 09/30/24 | |
| INVESTMENTS IN SECURITIES: | | | | | | | | | | | | |
| ASSETS (Market Value): | | | | | | | | | | | | |
| Common Stocks | | | | | | | | | | | | |
| Insurance | | $ | 3,733,722 | | | $ | 1,874,994 | | | $ | 5,608,716 | |
| Other Industries (b) | | | 36,780,526 | | | | — | | | | 36,780,526 | |
| Total Common Stocks | | | 40,514,248 | | | | 1,874,994 | | | | 42,389,242 | |
| U.S. Government Obligations | | | — | | | | 1,700,303 | | | | 1,700,303 | |
| TOTAL INVESTMENTS IN SECURITIES – ASSETS | | $ | 40,514,248 | | | $ | 3,575,297 | | | $ | 44,089,545 | |
| (a) | Per pricing procedures approved by the Board, the Level 2 securities used mean prices as there was no trading volume on the valuation date. |
| (b) | Please refer to the Schedule of Investments for the industry classifications of these portfolio holdings. |
Additional Information to Evaluate Qualitative Information.
General. The Fund uses recognized industry pricing services – approved by the Board and unaffiliated with the Adviser – to value most of its securities, and uses broker quotes provided by market makers of securities not valued by these and other recognized pricing sources. Several different pricing feeds are received to value domestic equity securities, international equity securities, preferred equity securities, and fixed income securities. The data within these feeds are ultimately sourced from major stock exchanges and trading systems where these securities trade. The prices supplied by external sources are checked by obtaining quotations or actual transaction prices from market participants. If a price obtained from the pricing source is deemed unreliable, prices will be sought from another pricing service or from a broker/dealer that trades that security or similar securities.
The Gabelli Global Financial Services Fund
Notes to Financial Statements (Continued)
Fair Valuation. Fair valued securities may be common or preferred equities, warrants, options, rights, or fixed income obligations. Where appropriate, Level 3 securities are those for which market quotations are not available, such as securities not traded for several days, or for which current bids are not available, or which are restricted as to transfer. When fair valuing a security, factors to consider include recent prices of comparable securities that are publicly traded, reliable prices of securities not publicly traded, the use of valuation models, current analyst reports, valuing the income or cash flow of the issuer, or cost if the preceding factors do not apply. A significant change in the unobservable inputs could result in a lower or higher value in Level 3 securities. The circumstances of Level 3 securities are frequently monitored to determine if fair valuation measures continue to apply.
The Adviser reports quarterly to the Board the results of the application of fair valuation policies and procedures. These may include backtesting the prices realized in subsequent trades of these fair valued securities to fair values previously recognized.
Foreign Currency Translations. The books and records of the Fund are maintained in U.S. dollars. Foreign currencies, investments, and other assets and liabilities are translated into U.S. dollars at current exchange rates. Purchases and sales of investment securities, income, and expenses are translated at the exchange rate prevailing on the respective dates of such transactions. Unrealized gains and losses that result from changes in foreign exchange rates and/or changes in market prices of securities have been included in unrealized appreciation/depreciation on investments and foreign currency translations. Net realized foreign currency gains and losses resulting from changes in exchange rates include foreign currency gains and losses between trade date and settlement date on investment securities transactions, foreign currency transactions, and the difference between the amounts of interest and dividends recorded on the books of the Fund and the amounts actually received. The portion of foreign currency gains and losses related to fluctuation in exchange rates between the initial purchase trade date and subsequent sale trade date is included in realized gain/(loss) on investments.
Foreign Securities. The Fund may directly purchase securities of foreign issuers. Investing in securities of foreign issuers involves special risks not typically associated with investing in securities of U.S. issuers. The risks include possible revaluation of currencies, the inability to repatriate funds, less complete financial information about companies, and possible future adverse political and economic developments. Moreover, securities of many foreign issuers and their markets may be less liquid and their prices more volatile than securities of comparable U.S. issuers.
Foreign Taxes. The Fund may be subject to foreign taxes on income, gains on investments, or currency repatriation, a portion of which may be recoverable. The Fund will accrue such taxes and recoveries as applicable, based upon its current interpretation of tax rules and regulations that exist in the markets in which it invests.
Restricted Securities. The Fund may invest up to 15% of its net assets in securities for which the markets are restricted. Restricted securities include securities whose disposition is subject to substantial legal or contractual restrictions. The sale of restricted securities often requires more time and results in higher brokerage charges or dealer discounts and other selling expenses than the sale of securities eligible for trading on national securities exchanges or in the over-the-counter markets. Restricted securities may sell at a price lower than similar securities that are not subject to restrictions on resale. Securities freely saleable among qualified institutional investors under special rules adopted by the SEC may be treated as liquid if they satisfy liquidity standards established by the Board. The continued liquidity of such securities is not as well assured as that of publicly
The Gabelli Global Financial Services Fund
Notes to Financial Statements (Continued)
traded securities, and accordingly the Board will monitor their liquidity. At September 30, 2024, the Fund did not hold any restricted securities.
Securities Transactions and Investment Income. Securities transactions are accounted for on the trade date with realized gain/(loss) on investments determined by using the identified cost method. Interest income (including amortization of premium and accretion of discount) is recorded on an accrual basis. Premiums and discounts on debt securities are amortized using the effective yield to maturity method or amortized to earliest call date, if applicable. Dividend income is recorded on the ex-dividend date, except for certain dividends from foreign securities that are recorded as soon after the ex-dividend date as the Fund becomes aware of such dividends.
Determination of Net Asset Value and Calculation of Expenses. Certain administrative expenses are common to, and allocated among, various affiliated funds. Such allocations are made on the basis of each fund’s average net assets or other criteria directly affecting the expenses as determined by the Adviser pursuant to procedures established by the Board.
In calculating the NAV per share of each class, investment income, realized and unrealized gains and losses, redemption fees, and expenses other than class specific expenses are allocated daily to each class of shares based upon the proportion of net assets of each class at the beginning of each day. Distribution expenses are borne solely by the class incurring the expense.
Distributions to Shareholders. Distributions to shareholders are recorded on the ex-dividend date. The characterization of distributions to shareholders is based on income and capital gains as determined in accordance with federal income tax regulations, which may differ from income and capital gains as determined under GAAP. These differences are primarily due to differing treatments of income and gains on various investment securities and foreign currency transactions, timing differences, and differing characterizations of distributions made by the Fund. Distributions from net investment income for federal income tax purposes include net realized gains on foreign currency transactions. These book/tax differences are either temporary or permanent in nature. To the extent these differences are permanent, adjustments are made to the appropriate capital accounts in the period when the differences arise. Permanent differences were primarily due to the tax treatment of currency gains and losses. These reclassifications have no impact on the NAV of the Fund.
The tax character of distributions paid during the fiscal years ended September 30, 2024 and 2023 was as follows:
| | | Year ended | | | Year ended | |
| | | September 30, 2024 | | | September 30, 2023 | |
| Distributions paid from: | | | | | | | | |
| Ordinary income | | $ | 832,541 | | | $ | 715,719 | |
| Total distributions paid | | $ | 832,541 | | | $ | 715,719 | |
Provision for Income Taxes. The Fund intends to continue to qualify as a regulated investment company under Subchapter M of the Internal Revenue Code of 1986, as amended (the Code). It is the policy of the Fund to comply with the requirements of the Code applicable to regulated investment companies and to distribute
The Gabelli Global Financial Services Fund
Notes to Financial Statements (Continued)
substantially all of its net investment company taxable income and net capital gains. Therefore, no provision for federal income taxes is required.
At September 30, 2024, the components of accumulated earnings/losses on a tax basis were as follows:
| Undistributed ordinary income | | $ | 995,707 | |
| Accumulated capital loss carryforwards | | | (709,419 | ) |
| Net unrealized appreciation on investments and foreign currency translations | | | 14,929,343 | |
| Total | | $ | 15,215,631 | |
The Fund is permitted to carry capital losses forward for an unlimited period. Capital losses that are carried forward will retain their character as either short term or long term capital losses. The Fund had a short term capital loss carryforward with no expiration of $253,831 and a long term capital loss carryforward with no expiration of $455,588.
At September 30, 2024, the temporary difference between book basis and tax basis net unrealized appreciation on investments was primarily due to the deferral of losses from wash sales for tax purposes and mark-to-market adjustments on investments in passive foreign investment companies.
The following summarizes the tax cost of investments and the related net unrealized appreciation at September 30, 2024:
| | | Cost | | | Gross
Unrealized
Appreciation | | | Gross
Unrealized
Depreciation | | | Net
Unrealized
Appreciation | |
| Investments | | $ | 29,160,800 | | | $ | 15,404,695 | | | $ | (475,950 | ) | | $ | 14,928,745 | |
The Fund is required to evaluate tax positions taken or expected to be taken in the course of preparing the Fund’s tax returns to determine whether the tax positions are “more-likely-than-not” of being sustained by the applicable tax authority. Income tax and related interest and penalties would be recognized by the Fund as tax expense in the Statement of Operations if the tax positions were deemed not to meet the more-likely-than-not threshold. During the fiscal year ended September 30, 2024, the Fund did not incur any income tax, interest, or penalties. As of September 30, 2024, the Adviser has reviewed all open tax years and concluded that there was no impact to the Fund’s net assets or results of operations. The Fund’s federal and state tax returns for the prior three fiscal years remain open, subject to examination. On an ongoing basis, the Adviser will monitor the Fund’s tax positions to determine if adjustments to this conclusion are necessary.
3. Investment Advisory Agreement and Other Transactions. The Fund has entered into an investment advisory agreement (the Advisory Agreement) with the Adviser which provides that the Fund will pay the Adviser a fee, computed daily and paid monthly, at the annual rate of 1.00% of the value of its average daily net assets. In accordance with the Advisory Agreement, the Adviser provides a continuous investment program for the Fund’s portfolio, oversees the administration of all aspects of the Fund’s business and affairs, and pays the compensation of all Officers and Directors of the Fund who are affiliated persons of the Adviser.
The Gabelli Global Financial Services Fund
Notes to Financial Statements (Continued)
The Adviser has contractually agreed to waive its investment advisory fees and/or to reimburse expenses of the Fund to the extent necessary to maintain the annualized total operating expenses of the Fund (excluding brokerage costs, acquired fund fees and expenses, interest, taxes, and extraordinary expenses) at no more than an annual rate of 1.25%, 1.25%, 2.00%, and 1.00% for Class AAA, Class A, Class C, and Class I shares, respectively. This arrangement is in effect through January 31, 2025. For the fiscal year ended September 30, 2024, the Adviser reimbursed the Fund in the amount of $166,565. In addition, the Fund has also agreed, during the two year period following any waiver or reimbursement by the Adviser, to repay such amount to the extent, that after giving effect to the repayments, such adjusted annualized total operating expenses of the Fund would not exceed the foregoing expense limitations of the value of the Fund’s average daily net assets for Class AAA, Class A, Class C, and Class I Shares. At September 30, 2024, the cumulative amount which the Fund may repay the Adviser, subject to the terms above, is $340,686:
| For the fiscal year ended September 30, 2023, expiring September 30, 2025 | | $ | 174,121 | |
| For the fiscal year ended September 30, 2024, expiring September 30, 2026 | | | 166,565 | |
| | | $ | 340,686 | |
4. Distribution Plan. The Fund’s Board has adopted a distribution plan (the Plan) for each class of shares, except for Class I Shares, pursuant to Rule 12b-1 under the 1940 Act. Under the Class AAA, Class A, and Class C Share Plans, payments are authorized to G.distributors, LLC (the Distributor), an affiliate of the Adviser, at annual rates of 0.25%, 0.25%, and 1.00%, respectively, of the average daily net assets of those classes, the annual limitations under each Plan. Such payments are accrued daily and paid monthly.
5. Portfolio Securities. Purchases and sales of securities during the fiscal year ended September 30, 2024, other than short term securities and U.S. Government obligations, aggregated $7,359,520 and $3,239,041, respectively.
6. Transactions with Affiliates and Other Arrangements. During the fiscal year ended September 30, 2024, the Fund paid $2,443 in brokerage commissions on security trades to G.research, LLC, an affiliate of the Adviser.
During the fiscal year ended September 30, 2024, the Fund received credits from a designated broker who agreed to pay certain Fund operating expenses. The amount of such expenses paid through this directed brokerage arrangement during this period was $1,390.
The cost of calculating the Fund’s NAV per share is a Fund expense pursuant to the Advisory Agreement. The Adviser did not seek a reimbursement during the fiscal year ended September 30, 2024.
The Corporation pays retainer and per meeting fees to Directors not affiliated with the Adviser, plus specified amounts to the Lead Director and Audit Committee Chairman. Directors are also reimbursed for out of pocket expenses incurred in attending meetings. Directors who are directors or employees of the Adviser or an affiliated company receive no compensation or expense reimbursement from the Corporation.
7. Line of Credit. The Fund participates in an unsecured line of credit, which expires on February 26, 2025 and may be renewed annually, of up to $75,000,000 under which it may borrow up to 10% of its net assets from the bank for temporary borrowing purposes. Borrowings under this arrangement bear interest at a floating rate equal to the higher of the Overnight Federal Funds Rate plus 135 basis points or the Overnight Bank Funding Rate plus 135 basis points in effect on that day. This amount, if any, would be included in “Interest expense”
The Gabelli Global Financial Services Fund
Notes to Financial Statements (Continued)
in the Statement of Operations. During the fiscal year ended September 30, 2024, there were no borrowings outstanding under the line of credit.
8. Capital Stock. The Fund offers four classes of shares – Class AAA Shares, Class A Shares, Class C Shares, and Class I Shares. Class AAA and Class I Shares are offered without a sales charge. Class A Shares are subject to a maximum front-end sales charge of 5.75%. Class C Shares are subject to a 1.00% contingent deferred sales charge for one year after purchase.
The Fund imposes a redemption fee of 2.00% on all classes of shares that are redeemed or exchanged on or before the seventh day after the date of a purchase. The redemption fee is deducted from the proceeds otherwise payable to the redeeming shareholders and is retained by the Fund as an increase in paid-in capital. The redemption fees retained by the Fund during the fiscal years ended September 30, 2024 and 2023, if any, can be found in the Statement of Changes in Net Assets under Redemption Fees.
Transactions in shares of capital stock were as follows:
| | | Year Ended | | | Year Ended | |
| | | September 30,
2024 | | | September 30,
2023 | |
| | | Shares | | | Amount | | | Shares | | | Amount | |
| Class AAA | | | | | | | | | | | | | | | | |
| Shares sold | | | 134,942 | | | $ | 1,745,685 | | | | 34,107 | | | $ | 370,430 | |
| Shares issued upon reinvestment of distributions | | | 1,455 | | | | 16,911 | | | | 987 | | | | 10,111 | |
| Shares redeemed | | | (47,221 | ) | | | (628,081 | ) | | | (21,125 | ) | | | (240,406 | ) |
| Net increase | | | 89,176 | | | $ | 1,134,515 | | | | 13,969 | | | $ | 140,135 | |
| | | | | | | | | | | | | | | | | |
| Class A | | | | | | | | | | | | | | | | |
| Shares sold | | | 1,044 | | | $ | 14,325 | | | | 136 | | | $ | 1,500 | |
| Shares issued upon reinvestment of distributions | | | 12 | | | | 137 | | | | 44 | | | | 451 | |
| Shares redeemed | | | (549 | ) | | | (6,775 | ) | | | (1,302 | ) | | | (15,000 | ) |
| Net increase/(decrease) | | | 507 | | | $ | 7,687 | | | | (1,122 | ) | | $ | (13,049 | ) |
| | | | | | | | | | | | | | | | | |
| Class C | | | | | | | | | | | | | | | | |
| Shares issued upon reinvestment of distributions | | | 2 | | | $ | 24 | | | | 2 | | | $ | 20 | |
| Net increase | | | 2 | | | $ | 24 | | | | 2 | | | $ | 20 | |
| | | | | | | | | | | | | | | | | |
| Class I | | | | | | | | | | | | | | | | |
| Shares sold | | | 255,224 | | | $ | 3,334,197 | | | | 111,795 | | | $ | 1,212,544 | |
| Shares issued upon reinvestment of distributions | | | 69,967 | | | | 811,618 | | | | 68,655 | | | | 701,651 | |
| Shares redeemed | | | (28,659 | ) | | | (410,418 | ) | | | (37,638 | ) | | | (399,213 | ) |
| Net increase | | | 296,532 | | | $ | 3,735,397 | | | | 142,812 | | | $ | 1,514,982 | |
9. Significant Shareholder. As of September 30, 2024, 87.1% of the Fund was beneficially owned by the Adviser and its affiliates, including managed accounts for which the affiliates of the Adviser have voting control but disclaim pecuniary interest.
10. Indemnifications. The Fund enters into contracts that contain a variety of indemnifications. The Fund’s maximum exposure under these arrangements is unknown. However, the Fund has not had prior claims or
The Gabelli Global Financial Services Fund
Notes to Financial Statements (Continued)
losses pursuant to these contracts. Management has reviewed the Fund’s existing contracts and expects the risk of loss to be remote.
11. Subsequent Events. Management has evaluated the impact on the Fund of all subsequent events occurring through the date the financial statements were issued and has determined that there were no subsequent events requiring recognition or disclosure in the financial statements.
The Gabelli Global Financial Services Fund
Report of Independent Registered Public Accounting Firm
To the Shareholders and the Board of Directors of The Gabelli Global Financial Services Fund
Opinion on the Financial Statements
We have audited the accompanying statement of assets and liabilities of The Gabelli Global Financial Services Fund (the “Fund”) (one of the funds constituting Gabelli Equity Series Funds, Inc. (the “Corporation”)), including the schedule of investments, as of September 30, 2024, and the related statement of operations for the year then ended, the statements of changes in net assets for each of the two years in the period then ended, the financial highlights for each of the five years in the period then ended and the related notes (collectively referred to as the “financial statements”). In our opinion, the financial statements present fairly, in all material respects, the financial position of the Fund (one of the funds constituting Gabelli Equity Series Funds, Inc.) at September 30, 2024, the results of its operations for the year then ended, the changes in its net assets for each of the two years in the period then ended and its financial highlights for each of the five years in the period then ended, in conformity with U.S. generally accepted accounting principles.
Basis for Opinion
These financial statements are the responsibility of the Corporation’s management. Our responsibility is to express an opinion on the Fund’s financial statements based on our audits. We are a public accounting firm registered with the Public Company Accounting Oversight Board (United States) ("PCAOB") and are required to be independent with respect to the Corporation in accordance with the U.S. federal securities laws and the applicable rules and regulations of the Securities and Exchange Commission and the PCAOB.
We conducted our audits in accordance with the standards of the PCAOB. Those standards require that we plan and perform the audit to obtain reasonable assurance about whether the financial statements are free of material misstatement, whether due to error or fraud. The Corporation is not required to have, nor were we engaged to perform, an audit of the Corporation’s internal control over financial reporting. As part of our audits we are required to obtain an understanding of internal control over financial reporting but not for the purpose of expressing an opinion on the effectiveness of the Corporation’s internal control over financial reporting. Accordingly, we express no such opinion.
Our audits included performing procedures to assess the risks of material misstatement of the financial statements, whether due to error or fraud, and performing procedures that respond to those risks. Such procedures included examining, on a test basis, evidence regarding the amounts and disclosures in the financial statements. Our procedures included confirmation of securities owned as of September 30, 2024, by correspondence with the custodian and brokers; when replies were not received from brokers, we performed other auditing procedures. Our audits also included evaluating the accounting principles used and significant estimates made by management, as well as evaluating the overall presentation of the financial statements. We believe that our audits provide a reasonable basis for our opinion.

We have served as the auditor of one or more Gabelli Funds investment companies since 1992.
New York, New York
November 29, 2024
The Gabelli Global Financial Services Fund
Liquidity Risk Managment Program (Unaudited)
In accordance with Rule 22e-4 under the 1940 Act, the Fund has established a liquidity risk management program (the LRM Program) to govern its approach to managing liquidity risk. The LRM Program is administered by the Liquidity Committee (the Committee), which is comprised of members of Gabelli Funds, LLC management. The Board has designated the Committee to administer the LRM Program.
The LRM Program’s principal objectives include supporting the Fund’s compliance with limits on investments in illiquid assets and mitigating the risk that the Fund will be unable to meet its redemption obligations in a timely manner. The LRM Program also includes elements that support the management and assessment of liquidity risk, including an annual assessment of factors that influence the Fund’s liquidity and the monthly classification and re-classification of certain investments that reflect the Committee’s assessment of their relative liquidity under current market conditions.
At a meeting of the Board held on May 15, 2024, the Board received a written report from the Committee regarding the design and operational effectiveness of the LRM Program. The Committee determined, and reported to the Board, that the LRM Program is reasonably designed to assess and manage the Fund’s liquidity risk and has operated adequately and effectively since its implementation. The Committee reported that there were no liquidity events that impacted the Fund or its ability to timely meet redemptions without dilution to existing shareholders. The Committee noted that the Fund is primarily invested in highly liquid securities and, accordingly, continues to be exempt from the requirement to determine a “highly liquid investment minimum” as defined in the Rule 22e-4. Because of that continued qualification for the exemption, the Fund has not adopted a “highly liquid investment minimum” amount. The Committee further noted that while changes to the LRM Program were made during the Review Period and reported to the Board, no material changes were made to the LRM Program as a result of the Committee’s annual review.
There can be no assurance that the LRM Program will achieve its objectives in the future. Please refer to the Fund’s Prospectus for more information regarding its exposure to liquidity risk and other principal risks to which an investment in the Fund may be subject.
Gabelli Funds and Your Personal Privacy
Who are we?
The Gabelli Funds are investment companies registered with the Securities and Exchange Commission under the Investment Company Act of 1940. We are managed by Gabelli Funds, LLC, which is affiliated with GAMCO Investors, Inc., a publicly held company with subsidiaries and affiliates that provide investment advisory services for a variety of clients.
What kind of non-public information do we collect about you if you become a fund shareholder?
If you apply to open an account directly with us, you will be giving us some non-public information about yourself. The non-public information we collect about you is:
| ● | Information you give us on your application form. This could include your name, address, telephone number, social security number, bank account number, and other information. |
| ● | Information about your transactions with us, any transactions with our affiliates, and transactions with the entities we hire to provide services to you. This would include information about the shares that you buy or redeem. If we hire someone else to provide services — like a transfer agent — we will also have information about the transactions that you conduct through them. |
What information do we disclose and to whom do we disclose it?
We do not disclose any non-public personal information about our customers or former customers to anyone other than our affiliates, our service providers who need to know such information, and as otherwise permitted by law. If you want to find out what the law permits, you can read the privacy rules adopted by the Securities and Exchange Commission. They are in volume 17 of the Code of Federal Regulations, Part 248. The Commission often posts information about its regulations on its website, www.sec.gov.
What do we do to protect your personal information?
We restrict access to non-public personal information about you to the people who need to know that information in order to provide services to you or the fund and to ensure that we are complying with the laws governing the securities business. We maintain physical, electronic, and procedural safeguards to keep your personal information.
This page was intentionally left blank.
The Gabelli Global Financial Services Fund
2024 TAX NOTICE TO SHAREHOLDERS (Unaudited)
During the fiscal year ended September 30, 2024, the Fund paid to shareholders ordinary income distributions totaling $0.3098, $0.2739, $0.2295, and $0.3371 per share for each of Class AAA, Class A, Class C, and Class I, respectively. For the fiscal year ended September 30, 2024, 53.54% of the ordinary income distribution qualifies for the dividends received deduction available to corporations. The Fund designates 100% of the ordinary income distribution as qualified dividend income pursuant to the Jobs and Growth Tax Relief Reconciliation Act of 2003. The Fund designates 2.52% of the ordinary income distribution as qualified interest income pursuant to the Tax Relief, Unemployment Reauthorization, and Job Creation Act of 2010.
U.S. Government Income:
The percentage of the ordinary income distribution paid by the Fund during the fiscal year ended September 30, 2024 which was derived from U.S. Treasury securities was 2.50%. Such income is exempt from state and local tax in all states. However, many states, including New York and California, allow a tax exemption for a portion of the income earned only if a mutual fund has invested at least 50% of its assets at the end of each quarter of the Fund’s fiscal year in U.S. Government securities. The Gabelli Global Financial Services Fund did not meet this strict requirement in 2024. The percentage of U.S. Government securities held as of September 30, 2024 was 3.9%. Due to the diversity in state and local tax law, it is recommended that you consult your personal tax adviser as to the applicability of the information provided to your specific situation.
All designations are based on financial information available as of the date of this annual report and, accordingly, are subject to change. For each item, it is the intention of the Fund to designate the maximum amount permitted under the Internal Revenue Code and the regulations thereunder.
| (b) | An open-end management investment company registered on Form N-1A [17 CFR 239.15A and 17 CFR 274.11A] must file the information required by Item 13 of Form N-1A. |
The Financial Highlights are attached herewith.
The Gabelli Equity Income Fund
Financial Highlights
Selected data for a share of capital stock outstanding throughout each year:
| | | | | | | Income (Loss) from Investment Operations | | | Distributions | | | | | | | | | | | | | | | Ratios to Average Net Assets/Supplemental Data | |
| Year Ended September 30 | | Net Asset Value,
Beginning
of Year | | | Net Investment
Income
(Loss)(a) | | | Net Realized
and Unrealized
Gain (Loss) on
Investments | | | Total from
Investment
Operations | | | Net Investment
Income | | | Net Realized
Gain on
Investments | | | Return of
Capital | | | Total
Distributions | | | Redemption
Fees(a)(b) | | | Net Asset Value,
End of Year | | | Total
Return† | | | Net Assets,
End of Year
(in 000’s) | | | Net Investment
Income (Loss) | | | Operating
Expenses(c)(d) | | | Portfolio
Turnover
Rate | |
| Class AAA | | | | | | | | | | | | | | | | | | | | | | | | | | | | | | | | | | | | | | | | | | | | | | | | | | | | | | | | | | | | |
| 2024 | | $ | 7.29 | | | $ | 0.06 | | | $ | 1.25 | | | $ | 1.31 | | | $ | (0.06 | ) | | $ | (0.90 | ) | | $ | (1.05 | ) | | $ | (2.01 | ) | | $ | 0.00 | | | $ | 6.59 | | | | 19.64 | % | | $ | 193,593 | | | | 0.77 | % | | | 1.43 | % | | | 1 | % |
| 2023 | | | 8.09 | | | | 0.08 | | | | 0.91 | | | | 0.99 | | | | (0.08 | ) | | | (0.67 | ) | | | (1.04 | ) | | | (1.79 | ) | | | 0.00 | | | | 7.29 | | | | 11.92 | | | | 227,248 | | | | 0.89 | | | | 1.43 | | | | 5 | |
| 2022 | | | 10.85 | | | | 0.06 | | | | (1.01 | ) | | | (0.95 | ) | | | (0.06 | ) | | | (0.78 | ) | | | (0.97 | ) | | | (1.81 | ) | | | 0.00 | | | | 8.09 | | | | (10.08 | ) | | | 230,926 | | | | 0.56 | | | | 1.42 | | | | 1 | |
| 2021 | | | 10.04 | | | | 0.07 | | | | 3.00 | | | | 3.07 | | | | (0.08 | ) | | | (1.24 | ) | | | (0.94 | ) | | | (2.26 | ) | | | 0.00 | | | | 10.85 | | | | 31.32 | | | | 297,369 | | | | 0.64 | | | | 1.42 | | | | 1 | |
| 2020 | | | 13.61 | | | | 0.10 | (e) | | | (0.02 | ) | | | 0.08 | | | | (0.11 | ) | | | (2.39 | ) | | | (1.15 | ) | | | (3.65 | ) | | | 0.00 | | | | 10.04 | | | | 0.93 | | | | 272,980 | | | | 0.75 | (e) | | | 1.45 | | | | 0 | (f) |
| Class A | | | | | | | | | | | | | | | | | | | | | | | | | | | | | | | | | | | | | | | | | | | | | | | | | | | | | | | | | | | | |
| 2024 | | $ | 7.16 | | | $ | 0.06 | | | $ | 1.22 | | | $ | 1.28 | | | $ | (0.06 | ) | | $ | (0.89 | ) | | $ | (1.04 | ) | | $ | (1.99 | ) | | $ | 0.00 | | | $ | 6.45 | | | | 19.52 | % | | $ | 121,992 | | | | 0.77 | % | | | 1.43 | % | | | 1 | % |
| 2023 | | | 7.96 | | | | 0.07 | | | | 0.91 | | | | 0.98 | | | | (0.08 | ) | | | (0.67 | ) | | | (1.03 | ) | | | (1.78 | ) | | | 0.00 | | | | 7.16 | | | | 11.94 | | | | 114,513 | | | | 0.90 | | | | 1.43 | | | | 5 | |
| 2022 | | | 10.69 | | | | 0.06 | | | | (0.99 | ) | | | (0.93 | ) | | | (0.06 | ) | | | (0.77 | ) | | | (0.97 | ) | | | (1.80 | ) | | | 0.00 | | | | 7.96 | | | | (10.05 | ) | | | 95,186 | | | | 0.57 | | | | 1.42 | | | | 1 | |
| 2021 | | | 9.92 | | | | 0.08 | | | | 2.95 | | | | 3.03 | | | | (0.08 | ) | | | (1.24 | ) | | | (0.94 | ) | | | (2.26 | ) | | | 0.00 | | | | 10.69 | | | | 31.31 | | | | 98,631 | | | | 0.65 | | | | 1.42 | | | | 1 | |
| 2020 | | | 13.49 | | | | 0.10 | (e) | | | (0.02 | ) | | | 0.08 | | | | (0.11 | ) | | | (2.39 | ) | | | (1.15 | ) | | | (3.65 | ) | | | 0.00 | | | | 9.92 | | | | 0.95 | | | | 69,201 | | | | 0.75 | (e) | | | 1.45 | | | | 0 | (f) |
| Class C | | | | | | | | | | | | | | | | | | | | | | | | | | | | | | | | | | | | | | | | | | | | | | | | | | | | | | | | | | | | |
| 2024 | | $ | 8.58 | | | $ | 0.01 | | | $ | 1.49 | | | $ | 1.50 | | | $ | (0.01 | ) | | $ | (0.83 | ) | | $ | (1.37 | ) | | $ | (2.21 | ) | | $ | 0.00 | | | $ | 7.87 | | | | 19.18 | % | | $ | 12,226 | | | | 0.10 | % | | | 2.18 | % | | | 1 | % |
| 2023(g) | | | 9.52 | | | | 0.01 | | | | 0.16 | | | | 0.17 | | | | (0.07 | ) | | | (0.55 | ) | | | (0.49 | ) | | | (1.11 | ) | | | 0.00 | | | | 8.58 | | | | 1.67 | | | | 608 | | | | 0.24 | (h) | | | 2.29 | (h) | | | 5 | |
| Class C1* | | | | | | | | | | | | | | | | | | | | | | | | | | | | | | | | | | | | | | | | | | | | | | | | | | | | | | | | | | | | |
| 2023 | | $ | 3.41 | | | $ | 0.00 | (b) | | $ | 0.42 | | | $ | 0.42 | | | $ | (0.07 | ) | | $ | (0.67 | ) | | $ | (0.60 | ) | | $ | (1.34 | ) | | $ | 0.00 | | | $ | 2.49 | | | | 11.34 | % | | $ | 21,071 | | | | 0.13 | % | | | 2.18 | % | | | 5 | % |
| 2022 | | | 5.24 | | | | (0.01 | ) | | | (0.42 | ) | | | (0.43 | ) | | | (0.04 | ) | | | (0.78 | ) | | | (0.58 | ) | | | (1.40 | ) | | | 0.00 | | | | 3.41 | | | | (10.84 | ) | | | 31,620 | | | | (0.21 | ) | | | 2.17 | | | | 1 | |
| 2021 | | | 5.81 | | | | (0.01 | ) | | | 1.70 | | | | 1.69 | | | | (0.05 | ) | | | (1.24 | ) | | | (0.97 | ) | | | (2.26 | ) | | | 0.00 | | | | 5.24 | | | | 30.29 | | | | 51,140 | | | | (0.12 | ) | | | 2.17 | | | | 1 | |
| 2020 | | | 9.48 | | | | 0.00 | (b)(e) | | | (0.02 | ) | | | (0.02 | ) | | | (0.06 | ) | | | (2.39 | ) | | | (1.20 | ) | | | (3.65 | ) | | | 0.00 | | | | 5.81 | | | | 0.27 | | | | 53,605 | | | | 0.00 | (e)(i) | | | 2.20 | | | | 0 | (f) |
| Class I | | | | | | | | | | | | | | | | | | | | | | | | | | | | | | | | | | | | | | | | | | | | | | | | | | | | | | | | | | | | |
| 2024 | | $ | 8.61 | | | $ | 0.09 | | | $ | 1.51 | | | $ | 1.60 | | | $ | (0.08 | ) | | $ | (0.88 | ) | | $ | (1.26 | ) | | $ | (2.22 | ) | | $ | 0.00 | | | $ | 7.99 | | | | 19.85 | % | | $ | 155,884 | | | | 1.01 | % | | | 1.18 | % | | | 1 | % |
| 2023 | | | 9.36 | | | | 0.12 | | | | 1.04 | | | | 1.16 | | | | (0.09 | ) | | | (0.67 | ) | | | (1.15 | ) | | | (1.91 | ) | | | 0.00 | | | | 8.61 | | | | 12.19 | | | | 134,026 | | | | 1.14 | | | | 1.18 | | | | 5 | |
| 2022 | | | 12.35 | | | | 0.10 | | | | (1.17 | ) | | | (1.07 | ) | | | (0.08 | ) | | | (0.77 | ) | | | (1.06 | ) | | | (1.92 | ) | | | 0.00 | | | | 9.36 | | | | (9.81 | ) | | | 128,315 | | | | 0.81 | | | | 1.17 | | | | 1 | |
| 2021 | | | 11.15 | | | | 0.12 | | | | 3.34 | | | | 3.46 | | | | (0.11 | ) | | | (1.24 | ) | | | (0.91 | ) | | | (2.26 | ) | | | 0.00 | | | | 12.35 | | | | 31.71 | | | | 134,073 | | | | 0.89 | | | | 1.17 | | | | 1 | |
| 2020 | | | 14.68 | | | | 0.14 | (e) | | | (0.02 | ) | | | 0.12 | | | | (0.14 | ) | | | (2.39 | ) | | | (1.12 | ) | | | (3.65 | ) | | | 0.00 | | | | 11.15 | | | | 1.14 | | | | 130,903 | | | | 1.00 | (e) | | | 1.20 | | | | 0 | (f) |
| * | On May 29, 2024, Class C1 shares converted into Class C shares. See Note 8. |
| † | Total return represents aggregate total return of a hypothetical investment at the beginning of the year and sold at the end of the year including reinvestment of distributions and does not reflect the applicable sales charges. |
| (a) | Per share amounts have been calculated using the average shares outstanding method. |
| (b) | Amount represents less than $0.005 per share. |
| (c) | The Fund received credits from a designated broker who agreed to pay certain Fund operating expenses. For all periods presented, there was no material impact on the expense ratios. |
| (d) | The Fund incurred interest expense during all fiscal years presented. If interest expense had not been incurred, the ratio of operating expenses to average net assets would have been, 1.42%, 1.42%, 1.41%, 1.41%, and 1.42%, (Class AAA and Class A), 2.17%, 2.16%, 2.16%, and 2.17%, (Class C1), 1.17%, 1.17%, 1.16%, 1.16%, 1.17% (Class I), and 2.17%, and 2.29% (Class C), respectively. |
| (e) | Includes income resulting from special dividends. Without these dividends, the per share income (loss) amounts would have been $0.09 (Class AAA and Class A), $(0.01) (Class C), and $0.13 (Class I), respectively, and the net investment income (loss) ratio would have been 0.68% (Class AAA and Class A), (0.07)% (Class C), and 0.93% (Class I), respectively. |
| (f) | Amount represents less than 0.5%. |
| (g) | Class C commenced on June 1, 2023. |
| (h) | Annualized. |
| (i) | Amount represents less than 0.005%. |
See accompanying notes to financial statements.
The Gabelli Small Cap Growth Fund
Financial Highlights
Selected data for a share of capital stock outstanding throughout each year:
| | | | | | Income (Loss) from Investment Operations | | | Distributions | | | | | | | | | Ratios to Average Net Assets/Supplemental Data | |
| Year Ended September 30 | | Net Asset Value,
Beginning
of Year | | | Net Investment
Income
(Loss)(a)(b) | | | Net Realized
and Unrealized
Gain (Loss) on
Investments | | | Total from
Investment
Operations | | | Net Investment
Income | | | Net Realized
Gain on
Investments | | | Total
Distributions | | | Redemption
Fees(a)(c) | | | Net Asset Value,
End of Year | | | Total
Return† | | | Net Assets,
End of Year
(in 000’s) | | | Net Investment
Income (Loss)(b) | | | Operating
Expenses
Before
Reimbursement | | | Operating
Expenses
Net of
Reimbursement(d)(e)(f) | | | Portfolio
Turnover
Rate | |
| Class AAA | | | | | | | | | | | | | | | | | | | | | | | | | | | | | | | | | | | | | | | | | | | | | | | | | | | | | | | | | | | | |
| 2024 | | $ | 40.51 | | | $ | 0.03 | | | $ | 10.00 | | | $ | 10.03 | | | $ | (0.08 | ) | | $ | (3.55 | ) | | $ | (3.63 | ) | | $ | 0.00 | | | $ | 46.91 | | | | 27.24 | % | | $ | 736,555 | | | | 0.06 | % | | | 1.38 | % | | | 1.37 | % | | | 2 | % |
| 2023 | | | 36.11 | | | | 0.05 | | | | 7.96 | | | | 8.01 | | | | (0.01 | ) | | | (3.60 | ) | | | (3.61 | ) | | | 0.00 | | | | 40.51 | | | | 22.70 | | | | 899,376 | | | | 0.13 | | | | 1.39 | | | | 1.39 | | | | 1 | |
| 2022 | | | 49.61 | | | | 0.02 | | | | (7.13 | ) | | | (7.11 | ) | | | (0.05 | ) | | | (6.34 | ) | | | (6.39 | ) | | | 0.00 | | | | 36.11 | | | | (17.07 | ) | | | 798,836 | | | | 0.05 | | | | 1.39 | | | | 1.39 | | | | 1 | |
| 2021 | | | 43.30 | | | | 0.04 | | | | 15.83 | | | | 15.87 | | | | — | | | | (9.56 | ) | | | (9.56 | ) | | | 0.00 | | | | 49.61 | | | | 42.16 | | | | 1,054,894 | | | | 0.09 | | | | 1.38 | | | | 1.38 | | | | 1 | |
| 2020 | | | 53.92 | | | | 0.04 | | | | (0.63 | ) | | | (0.59 | ) | | | (0.07 | ) | | | (9.96 | ) | | | (10.03 | ) | | | 0.00 | | | | 43.30 | | | | (2.08 | ) | | | 884,341 | | | | 0.08 | | | | 1.41 | | | | 1.41 | | | | 0 | (g) |
| Class A | | | | | | | | | | | | | | | | | | | | | | | | | | | | | | | | | | | | | | | | | | | | | | | | | | | | | | | | | | | | |
| 2024 | | $ | 40.46 | | | $ | 0.02 | | | $ | 10.00 | | | $ | 10.02 | | | $ | (0.08 | ) | | $ | (3.55 | ) | | $ | (3.63 | ) | | $ | 0.00 | | | $ | 46.85 | | | | 27.24 | % | | $ | 147,123 | | | | 0.06 | % | | | 1.38 | % | | | 1.37 | % | | | 2 | % |
| 2023 | | | 36.06 | | | | 0.05 | | | | 7.95 | | | | 8.00 | | | | 0.00 | (c) | | | (3.60 | ) | | | (3.60 | ) | | | 0.00 | | | | 40.46 | | | | 22.72 | | | | 118,557 | | | | 0.13 | | | | 1.39 | | | | 1.39 | | | | 1 | |
| 2022 | | | 49.56 | | | | 0.02 | | | | (7.13 | ) | | | (7.11 | ) | | | (0.05 | ) | | | (6.34 | ) | | | (6.39 | ) | | | 0.00 | | | | 36.06 | | | | (17.08 | ) | | | 104,317 | | | | 0.04 | | | | 1.39 | | | | 1.39 | | | | 1 | |
| 2021 | | | 43.26 | | | | 0.04 | | | | 15.82 | | | | 15.86 | | | | — | | | | (9.56 | ) | | | (9.56 | ) | | | 0.00 | | | | 49.56 | | | | 42.17 | | | | 134,005 | | | | 0.08 | | | | 1.38 | | | | 1.38 | | | | 1 | |
| 2020 | | | 53.89 | | | | 0.05 | | | | (0.64 | ) | | | (0.59 | ) | | | (0.08 | ) | | | (9.96 | ) | | | (10.04 | ) | | | 0.00 | | | | 43.26 | | | | (2.08 | ) | | | 110,975 | | | | 0.11 | | | | 1.41 | | | | 1.41 | | | | 0 | (g) |
| Class C | | | | | | | | | | | | | | | | | | | | | | | | | | | | | | | | | | | | | | | | | | | | | | | | | | | | | | | | | | | | |
| 2024 | | $ | 30.09 | | | $ | (0.22 | ) | | $ | 7.41 | | | $ | 7.19 | | | $ | (0.06 | ) | | $ | (2.63 | ) | | $ | (2.69 | ) | | $ | 0.00 | | | $ | 34.59 | | | | 26.29 | % | | $ | 23,114 | | | | (0.70 | )% | | | 2.13 | % | | | 2.12 | % | | | 2 | % |
| 2023 | | | 27.02 | | | | (0.19 | ) | | | 5.95 | | | | 5.76 | | | | — | | | | (2.69 | ) | | | (2.69 | ) | | | 0.00 | | | | 30.09 | | | | 21.79 | | | | 28,818 | | | | (0.64 | ) | | | 2.14 | | | | 2.14 | | | | 1 | |
| 2022 | | | 38.86 | | | | (0.24 | ) | | | (5.26 | ) | | | (5.50 | ) | | | — | | | | (6.34 | ) | | | (6.34 | ) | | | 0.00 | | | | 27.02 | | | | (17.69 | ) | | | 35,068 | | | | (0.72 | ) | | | 2.14 | | | | 2.14 | | | | 1 | |
| 2021 | | | 35.95 | | | | (0.24 | ) | | | 12.71 | | | | 12.47 | | | | — | | | | (9.56 | ) | | | (9.56 | ) | | | 0.00 | | | | 38.86 | | | | 41.10 | | | | 66,467 | | | | (0.64 | ) | | | 2.13 | | | | 2.13 | | | | 1 | |
| 2020 | | | 46.63 | | | | (0.24 | ) | | | (0.48 | ) | | | (0.72 | ) | | | — | | | | (9.96 | ) | | | (9.96 | ) | | | 0.00 | | | | 35.95 | | | | (2.80 | ) | | | 75,505 | | | | (0.65 | ) | | | 2.16 | | | | 2.16 | | | | 0 | (g) |
| Class I | | | | | | | | | | | | | | | | | | | | | | | | | | | | | | | | | | | | | | | | | | | | | | | | | | | | | | | | | | | | |
| 2024 | | $ | 42.36 | | | $ | 0.13 | | | $ | 10.49 | | | $ | 10.62 | | | $ | (0.08 | ) | | $ | (3.71 | ) | | $ | (3.79 | ) | | $ | 0.00 | | | $ | 49.19 | | | | 27.58 | % | | $ | 902,727 | | | | 0.30 | % | | | 1.13 | % | | | 1.12 | % | | | 2 | % |
| 2023 | | | 37.76 | | | | 0.16 | | | | 8.32 | | | | 8.48 | | | | (0.11 | ) | | | (3.77 | ) | | | (3.88 | ) | | | 0.00 | | | | 42.36 | | | | 23.02 | | | | 517,272 | | | | 0.38 | | | | 1.14 | | | | 1.14 | | | | 1 | |
| 2022 | | | 51.62 | | | | 0.13 | | | | (7.47 | ) | | | (7.34 | ) | | | (0.18 | ) | | | (6.34 | ) | | | (6.52 | ) | | | 0.00 | | | | 37.76 | | | | (16.88 | ) | | | 468,753 | | | | 0.29 | | | | 1.14 | | | | 1.14 | | | | 1 | |
| 2021 | | | 44.62 | | | | 0.17 | | | | 16.39 | | | | 16.56 | | | | — | | | | (9.56 | ) | | | (9.56 | ) | | | 0.00 | | | | 51.62 | | | | 42.51 | | | | 644,066 | | | | 0.34 | | | | 1.13 | | | | 1.13 | | | | 1 | |
| 2020 | | | 55.29 | | | | 0.15 | | | | (0.64 | ) | | | (0.49 | ) | | | (0.22 | ) | | | (9.96 | ) | | | (10.18 | ) | | | 0.00 | | | | 44.62 | | | | (1.83 | ) | | | 568,065 | | | | 0.34 | | | | 1.16 | | | | 1.16 | | | | 0 | (g) |
| † | Total return represents aggregate total return of a hypothetical investment at the beginning of the year and sold at the end of the year including reinvestment of distributions and does not reflect the applicable sales charges. |
| (a) | Per share amounts have been calculated using the average shares outstanding method. |
| (b) | Due to capital share activity throughout the period, net investment income/(loss) per share and the ratio to average net assets may not be necessarily correlated among the different classes of shares. |
| (c) | Amount represents less than $0.005 per share. |
| (d) | The Fund received credits from a designated broker who agreed to pay certain Fund operating expenses. For all the years presented, there was no material impact to the expense ratios. |
| (e) | The Fund incurred interest expense for all years presented. For the fiscal years ended September 30, 2023, 2022, 2021, and 2020, if interest expense had not been incurred, the ratios of operating expenses to average net assets would have been 1.38%, 1.38%, 1.37%, and 1.39% (Class AAA and Class A), 2.13%, 2.13%, 2.12%, and 2.14% (Class C), and 1.13%, 1.13%, 1.12%, and 1.14% (Class I), respectively. For the fiscal year ended September 30, 2024, there was no material impact to the expense ratios. |
| (f) | Ratio of operating expenses includes advisory fee reduction on unsupervised assets totaling 0.01% of net assets for the fiscal year ended September 30, 2020. For the fiscal years ended September 30, 2024, 2023, 2022, and 2021, there was no material impact on the expense ratios. |
| (g) | Amount represents less than 0.5%. |
See accompanying notes to financial statements.
The Gabelli Focused Growth and Income Fund
Financial Highlights
Selected data for a share of capital stock outstanding throughout each year:
| | | | | | Income (Loss) from Investment Operations | | | Distributions | | | | | | | | | | | | | Ratios to Average Net Assets/Supplemental Data | |
| Year Ended September 30 | | Net Asset Value,
Beginning
of Year | | | Net Investment
Income
(Loss)(a)(b) | | | Net Realized
and Unrealized
Gain (Loss) on
Investments | | | Total from
Investment
Operations | | | Net Investment
Income | | | Net Realized
Gain on
Investments | | | Total
Distributions | | | Redemption
Fees(a) | | | Net Asset Value,
End of Year | | | Total
Return† | | | Net Assets,
End of Year
(in 000’s) | | | Net Investment
Income (Loss)(b) | | | Operating
Expenses
Before
Reimbursement | | | Operating
Expenses
Net of
Reimbursement(c) | | | Portfolio
Turnover
Rate | |
| Class AAA | | | | | | | | | | | | | | | | | | | | | | | | | | | | | | | | | | | | | | | | | | | | | | | | | | | | | | | | | | | | |
| 2024 | | $ | 14.91 | | | $ | 0.72 | | | $ | 2.46 | | | $ | 3.18 | | | $ | (0.72 | ) | | $ | — | | | $ | (0.72 | ) | | $ | — | | | $ | 17.37 | | | | 21.88 | % | | $ | 5,051 | | | | 4.51 | % | | | 1.64 | % | | | 1.64 | % | | | 31 | % |
| 2023 | | | 14.79 | | | | 0.59 | | | | 0.29 | | | | 0.88 | | | | (0.66 | ) | | | (0.10 | ) | | | (0.76 | ) | | | 0.00 | (d) | | | 14.91 | | | | 5.91 | | | | 5,321 | | | | 3.79 | | | | 1.79 | | | | 1.79 | | | | 36 | |
| 2022 | | | 17.50 | | | | 0.32 | | | | (2.31 | ) | | | (1.99 | ) | | | (0.66 | ) | | | (0.06 | ) | | | (0.72 | ) | | | — | | | | 14.79 | | | | (11.85 | ) | | | 5,134 | | | | 1.85 | | | | 1.72 | | | | 1.72 | | | | 46 | |
| 2021 | | | 12.48 | | | | 0.34 | | | | 5.22 | | | | 5.56 | | | | (0.54 | ) | | | — | | | | (0.54 | ) | | | — | | | | 17.50 | | | | 44.76 | | | | 6,927 | | | | 2.15 | | | | 1.96 | | | | 1.96 | | | | 54 | |
| 2020 | | | 12.93 | | | | (0.03 | ) | | | (0.42 | ) | | | (0.45 | ) | | | — | | | | — | | | | — | | | | 0.00 | (d) | | | 12.48 | | | | (3.48 | ) | | | 8,713 | | | | (0.24 | ) | | | 1.71 | | | | 1.71 | | | | 59 | |
| Class A | | | | | | | | | | | | | | | | | | | | | | | | | | | | | | | | | | | | | | | | | | | | | | | | | | | | | | | | | | | | |
| 2024 | | $ | 15.19 | | | $ | 0.80 | | | $ | 2.49 | | | $ | 3.29 | | | $ | (0.82 | ) | | $ | — | | | $ | (0.82 | ) | | $ | — | | | $ | 17.66 | | | | 22.34 | % | | $ | 21,388 | | | | 4.89 | % | | | 1.64 | % | | | 1.25 | %(e) | | | 31 | % |
| 2023 | | | 14.97 | | | | 0.70 | | | | 0.28 | | | | 0.98 | | | | (0.66 | ) | | | (0.10 | ) | | | (0.76 | ) | | | 0.00 | (d) | | | 15.19 | | | | 6.53 | | | | 16,368 | | | | 4.43 | | | | 1.79 | | | | 1.26 | (e) | | | 36 | |
| 2022 | | | 17.71 | | | | 0.34 | | | | (2.36 | ) | | | (2.02 | ) | | | (0.66 | ) | | | (0.06 | ) | | | (0.72 | ) | | | — | | | | 14.97 | | | | (11.88 | ) | | | 10,810 | | | | 1.94 | | | | 1.72 | | | | 1.70 | (e) | | | 46 | |
| 2021 | | | 12.62 | | | | 0.30 | | | | 5.33 | | | | 5.63 | | | | (0.54 | ) | | | — | | | | (0.54 | ) | | | — | | | | 17.71 | | | | 44.82 | | | | 8,958 | | | | 1.83 | | | | 1.96 | | | | 1.96 | | | | 54 | |
| 2020 | | | 13.06 | | | | (0.03 | ) | | | (0.41 | ) | | | (0.44 | ) | | | — | | | | — | | | | — | | | | 0.00 | (d) | | | 12.62 | | | | (3.37 | ) | | | 6,644 | | | | (0.24 | ) | | | 1.71 | | | | 1.71 | | | | 59 | |
| Class C | | | | | | | | | | | | | | | | | | | | | | | | | | | | | | | | | | | | | | | | | | | | | | | | | | | | | | | | | | | | |
| 2024 | | $ | 12.15 | | | $ | 0.48 | | | $ | 1.99 | | | $ | 2.47 | | | $ | (0.72 | ) | | $ | — | | | $ | (0.72 | ) | | $ | — | | | $ | 13.90 | | | | 20.98 | % | | $ | 2,055 | | | | 3.72 | % | | | 2.39 | % | | | 2.39 | % | | | 31 | % |
| 2023 | | | 12.25 | | | | 0.37 | | | | 0.27 | | | | 0.64 | | | | (0.66 | ) | | | (0.08 | ) | | | (0.74 | ) | | | 0.00 | (d) | | | 12.15 | | | | 5.17 | | | | 2,666 | | | | 2.90 | | | | 2.54 | | | | 2.54 | | | | 36 | |
| 2022 | | | 14.73 | | | | 0.15 | | | | (1.91 | ) | | | (1.76 | ) | | | (0.66 | ) | | | (0.06 | ) | | | (0.72 | ) | | | — | | | | 12.25 | | | | (12.54 | ) | | | 4,357 | | | | 1.02 | | | | 2.47 | | | | 2.47 | | | | 46 | |
| 2021 | | | 10.64 | | | | 0.15 | | | | 4.48 | | | | 4.63 | | | | (0.54 | ) | | | — | | | | (0.54 | ) | | | — | | | | 14.73 | | | | 43.75 | | | | 8,143 | | | | 1.13 | | | | 2.71 | | | | 2.71 | | | | 54 | |
| 2020 | | | 11.10 | | | | (0.11 | ) | | | (0.35 | ) | | | (0.46 | ) | | | — | | | | — | | | | — | | | | 0.00 | (d) | | | 10.64 | | | | (4.14 | ) | | | 6,926 | | | | (1.00 | ) | | | 2.46 | | | | 2.46 | | | | 59 | |
| Class I | | | | | | | | | | | | | | | | | | | | | | | | | | | | | | | | | | | | | | | | | | | | | | | | | | | | | | | | | | | | |
| 2024 | | $ | 16.01 | | | $ | 0.92 | | | $ | 2.64 | | | $ | 3.56 | | | $ | (0.82 | ) | | $ | — | | | $ | (0.82 | ) | | $ | — | | | $ | 18.75 | | | | 22.90 | % | | $ | 17,859 | | | | 5.33 | % | | | 1.39 | % | | | 0.80 | %(e) | | | 31 | % |
| 2023 | | | 15.68 | | | | 0.79 | | | | 0.31 | | | | 1.10 | | | | (0.66 | ) | | | (0.11 | ) | | | (0.77 | ) | | | 0.00 | (d) | | | 16.01 | | | | 6.97 | | | | 15,205 | | | | 4.77 | | | | 1.54 | | | | 0.81 | (e) | | | 36 | |
| 2022 | | | 18.35 | | | | 0.54 | | | | (2.49 | ) | | | (1.95 | ) | | | (0.66 | ) | | | (0.06 | ) | | | (0.72 | ) | | | — | | | | 15.68 | | | | (11.07 | ) | | | 19,027 | | | | 2.94 | | | | 1.47 | | | | 0.80 | (e) | | | 46 | |
| 2021 | | | 12.94 | | | | 0.46 | | | | 5.49 | | | | 5.95 | | | | (0.54 | ) | | | — | | | | (0.54 | ) | | | — | | | | 18.35 | | | | 46.21 | | | | 16,215 | | | | 2.70 | | | | 1.71 | | | | 0.95 | (e) | | | 54 | |
| 2020 | | | 13.36 | | | | 0.00 | (d) | | | (0.42 | ) | | | (0.42 | ) | | | — | | | | — | | | | — | | | | 0.00 | (d) | | | 12.94 | | | | (3.14 | ) | | | 8,333 | | | | 0.01 | | | | 1.46 | | | | 1.46 | | | | 59 | |
| † | Total return represents aggregate total return of a hypothetical investment at the beginning of the year and sold at the end of the year including reinvestment of distributions and does not reflect the applicable sales charges. |
| (a) | Per share amounts have been calculated using the average shares outstanding method. |
| (b) | Due to capital share activity, net investment income/(loss) per share and the ratio to average net assets may not be necessarily correlated among the different classes of shares. |
| (c) | The Fund incurred interest expense. For the fiscal years ended September 30, 2024, 2023, 2022, and 2020, if interest expense had not been incurred, the ratios of operating expenses to average net assets would have been 1.63%, 1.78%, 1.72%, and 1.70% (Class AAA), 1.25%, 1.25%, 1.69%, and 1.70% (Class A), 2.38%, 2.53%, 2.47%, and 2.45% (Class C), and 0.80%, 0.80%, 0.80%, and 1.45% (Class I), respectively. For the fiscal years ended September 30, 2021, the effect of interest expense was minimal. |
| (d) | Amount represents less than $0.005 per share. |
| (e) | Under an expense reimbursement agreement with the Adviser, the Adviser reimbursed expenses of $167,786, $187,761, $119,130 and $97,862 for the fiscal years ended September 30, 2024, 2023, 2022, and 2021, respectively. |
See accompanying notes to financial statements.
The Gabelli Global Financial Services Fund
Financial Highlights
Selected data for a share of capital stock outstanding throughout each year:
| | | | | | Income (Loss) from Investment Operations | | | Distributions | | | | | | | | | | | | Ratios to Average Net Assets/Supplemental Data | |
| Year Ended September 30 | | Net Asset Value,
Beginning
of Period | | | Net Investment
Income(a) | | | Net Realized
and Unrealized
Gain (Loss) on
Investments | | | Total from
Investment
Operations | | | Net Investment
Income | | | Total
Distributions | | | Redemption
Fees(a) | | | Net Asset Value,
End of Period | | | Total
Return† | | | Net Assets,
End of Period
(in 000’s) | | | Net Investment
Income | | | Operating
Expenses
Before
Reimbursement | | | Operating
Expenses
Net of
Reimbursement(b)(c) | | | Portfolio
Turnover
Rate | |
| Class AAA | | | | | | | | | | | | | | | | | | | | | | | | | | | | | | | | | | | | | | | | | | | | | | | | | | | | | | | | |
| 2024 | | $ | 11.43 | | | $ | 0.41 | | | $ | 3.94 | | | $ | 4.35 | | | $ | (0.31 | ) | | $ | (0.31 | ) | | $ | 0.00 | (d) | | $ | 15.47 | | | | 38.95 | % | | $ | 2,162 | | | | 3.05 | % | | | 1.71 | % | | | 1.25 | % | | | 9 | % |
| 2023 | | | 9.28 | | | | 0.28 | | | | 2.14 | | | | 2.42 | | | | (0.27 | ) | | | (0.27 | ) | | | — | | | | 11.43 | | | | 26.47 | | | | 577 | | | | 2.57 | | | | 1.91 | | | | 1.25 | | | | 21 | |
| 2022 | | | 11.80 | | | | 0.27 | (e) | | | (2.56 | ) | | | (2.29 | ) | | | (0.23 | ) | | | (0.23 | ) | | | — | | | | 9.28 | | | | (19.79) | | | | 339 | | | | 2.39 | (e) | | | 1.88 | | | | 1.27 | (f) | | | 26 | |
| 2021 | | | 7.08 | | | | 0.33 | | | | 4.52 | | | | 4.85 | | | | (0.13 | ) | | | (0.13 | ) | | | — | | | | 11.80 | | | | 69.04 | | | | 564 | | | | 2.99 | | | | 2.04 | | | | 1.25 | | | | 19 | |
| 2020 | | | 9.09 | | | | 0.11 | | | | (1.90 | ) | | | (1.79 | ) | | | (0.22 | ) | | | (0.22 | ) | | | 0.00 | (d) | | | 7.08 | | | | (20.33) | | | | 47 | | | | 1.34 | | | | 2.51 | | | | 1.25 | | | | 18 | |
| Class A | | | | | | | | | | | | | | | | | | | | | | | | | | | | | | | | | | | | | | | | | | | | | | | | | | | | | | | | |
| 2024 | | $ | 11.50 | | | $ | 0.37 | | | $ | 4.03 | | | $ | 4.40 | | | $ | (0.27 | ) | | $ | (0.27 | ) | | $ | 0.00 | (d) | | $ | 15.63 | | | | 39.09 | % | | $ | 15 | | | | 2.76 | % | | | 1.71 | % | | | 1.25 | % | | | 9 | % |
| 2023 | | | 9.34 | | | | 0.27 | | | | 2.17 | | | | 2.44 | | | | (0.28 | ) | | | (0.28 | ) | | | — | | | | 11.50 | | | | 26.44 | | | | 6 | | | | 2.51 | | | | 1.91 | | | | 1.25 | | | | 21 | |
| 2022 | | | 11.86 | | | | 0.27 | (e) | | | (2.57 | ) | | | (2.30 | ) | | | (0.22 | ) | | | (0.22 | ) | | | — | | | | 9.34 | | | | (19.75) | | | | 15 | | | | 2.34 | (e) | | | 1.88 | | | | 1.27 | (f) | | | 26 | |
| 2021 | | | 7.08 | | | | 0.32 | | | | 4.54 | | | | 4.86 | | | | (0.08 | ) | | | (0.08 | ) | | | — | | | | 11.86 | | | | 69.07 | | | | 33 | | | | 2.94 | | | | 2.04 | | | | 1.25 | | | | 19 | |
| 2020 | | | 9.10 | | | | 0.16 | | | | (1.94 | ) | | | (1.78 | ) | | | (0.24 | ) | | | (0.24 | ) | | | 0.00 | (d) | | | 7.08 | | | | (20.24) | | | | 8 | | | | 2.12 | | | | 2.51 | | | | 1.25 | | | | 18 | |
| Class C | | | | | | | | | | | | | | | | | | | | | | | | | | | | | | | | | | | | | | | | | | | | | | | | | | | | | | | | |
| 2024 | | $ | 11.32 | | | $ | 0.27 | | | $ | 3.95 | | | $ | 4.22 | | | $ | (0.23 | ) | | $ | (0.23 | ) | | $ | 0.00 | (d) | | $ | 15.31 | | | | 37.93 | % | | $ | 2 | | | | 2.05 | % | | | 2.46 | % | | | 2.00 | % | | | 9 | % |
| 2023 | | | 9.19 | | | | 0.19 | | | | 2.13 | | | | 2.32 | | | | (0.19 | ) | | | (0.19 | ) | | | — | | | | 11.32 | | | | 25.48 | | | | 1 | | | | 1.72 | | | | 2.66 | | | | 2.00 | | | | 21 | |
| 2022 | | | 11.68 | | | | 0.29 | (e) | | | (2.64 | ) | | | (2.35 | ) | | | (0.14 | ) | | | (0.14 | ) | | | — | | | | 9.19 | | | | (20.35) | | | | 1 | | | | 2.62 | (e) | | | 2.63 | | | | 2.02 | (f) | | | 26 | |
| 2021 | | | 7.03 | | | | 0.18 | | | | 4.55 | | | | 4.73 | | | | (0.08 | ) | | | (0.08 | ) | | | — | | | | 11.68 | | | | 67.59 | | | | 1 | | | | 1.77 | | | | 2.79 | | | | 2.00 | | | | 19 | |
| 2020 | | | 9.05 | | | | 0.06 | | | | (1.91 | ) | | | (1.85 | ) | | | (0.17 | ) | | | (0.17 | ) | | | 0.00 | (d) | | | 7.03 | | | | (20.97) | | | | 1 | | | | 0.76 | | | | 3.26 | | | | 2.00 | | | | 18 | |
| Class I | | | | | | | | | | | | | | | | | | | | | | | | | | | | | | | | | | | | | | | | | | | | | | | | | | | | | | | | |
| 2024 | | $ | 11.44 | | | $ | 0.41 | | | $ | 3.97 | | | $ | 4.38 | | | $ | (0.34 | ) | | $ | (0.34 | ) | | $ | 0.00 | (d) | | $ | 15.48 | | | | 39.25 | % | | $ | 42,014 | | | | 3.09 | % | | | 1.46 | % | | | 1.00 | % | | | 9 | % |
| 2023 | | | 9.29 | | | | 0.30 | | | | 2.16 | | | | 2.46 | | | | (0.31 | ) | | | (0.31 | ) | | | 0.00 | (d) | | | 11.44 | | | | 26.82 | | | | 27,642 | | | | 2.77 | | | | 1.66 | | | | 1.00 | | | | 21 | |
| 2022 | | | 11.80 | | | | 0.31 | (e) | | | (2.57 | ) | | | (2.26 | ) | | | (0.25 | ) | | | (0.25 | ) | | | — | | | | 9.29 | | | | (19.57) | | | | 21,128 | | | | 2.76 | (e) | | | 1.63 | | | | 1.02 | (f) | | | 26 | |
| 2021 | | | 7.08 | | | | 0.29 | | | | 4.58 | | | | 4.87 | | | | (0.15 | ) | | | (0.15 | ) | | | — | | | | 11.80 | | | | 69.45 | | | | 24,221 | | | | 2.79 | | | | 1.79 | | | | 1.00 | | | | 19 | |
| 2020 | | | 9.11 | | | | 0.14 | | | | (1.91 | ) | | | (1.77 | ) | | | (0.26 | ) | | | (0.26 | ) | | | 0.00 | (d) | | | 7.08 | | | | (20.17) | | | | 13,445 | | | | 1.84 | | | | 2.26 | | | | 1.00 | | | | 18 | |
| † | Total return represents aggregate total return of a hypothetical investment at the beginning of the year and sold at the end of the year including reinvestment of distributions and does not reflect the applicable sales charges. |
| (a) | Per share amounts have been calculated using the average shares outstanding method. |
| (b) | Under an expense reimbursement agreement with the Adviser, the Adviser reimbursed expenses of $166,565, $174,121, $149,730, $165,217, and $174,126 during all fiscal years presented, respectively. |
| (c) | The Fund received credits from a designated broker who agreed to pay certain Fund operating expenses. For the fiscal years ended September 30, 2023, 2022, 2021, and 2020, if credits had not been received, the expense ratios would have been 1.26%, 1.28%, 1.26%, and 1.26% (Class AAA and Class A), 2.01%, 2.02%, 2.01%, and 2.01% (Class C), and 1.01%, 1.03%, 1.01%, and 1.01% (Class I), respectively. For the fiscal year ended September 30, 2024, there was no material impact to the expense ratios. |
| (d) | Amount represents less than $0.005 per share. |
| (e) | Includes income resulting from special dividends. Without these dividends, the per share income amounts would have been $0.21 (Class AAA and Class A), $0.23 (Class C), and $0.25 (Class I), and the net investment income ratios would have been 1.88% (Class AAA), 1.84% (Class A), 2.12% (Class C), and 2.25% (Class I) for the fiscal year ended September 30, 2022. |
| (f) | The Fund incurred tax expense for the fiscal year ended September 30, 2022. If tax expense had not been incurred, the ratios of operating expenses to average net assets would have been 1.25% (Class AAA and Class A), 2.00% (Class C), and 1.00% (Class I). |
See accompanying notes to financial statements.
| Item 8. | Changes in and Disagreements with Accountants for Open-End Management Investment Companies. |
Not applicable.
| Item 9. | Proxy Disclosures for Open-End Management Investment Companies. |
Not applicable.
| Item 10. | Remuneration Paid to Directors, Officers, and Others of Open-End Management Investment Companies. |
Unless the following information is disclosed as part of the financial statements included in Item 7, an open-end management investment company registered on Form N-1A [17 CFR 239.15A and 17 CFR 274.11A] must disclose the aggregate remuneration paid by the company during the period covered by the report to:
(1) All directors and all members of any advisory board for regular compensation;
| Elizabeth C. Bogan | $28,000 |
| Anthony J. Colavita (deceased) | $24,000 |
| Vincent D. Enright | $31,000 |
| Robert Morrissey | $26,000 |
| Anthonie C. van Ekris | $26,000 |
| Salvatore J. Zizza | $28,000 |
(2) Each director and each member of an advisory board for special compensation; $0
(3) All officers; $0 and
(4) Each person of whom any officer or director of the Fund is an affiliated person. $0
| Item 11. | Statement Regarding Basis for Approval of Investment Advisory Contract. |
Not applicable.
| Item 12. | Disclosure of Proxy Voting Policies and Procedures for Closed-End Management Investment Companies. |
Not applicable.
| Item 13. | Portfolio Managers of Closed-End Management Investment Companies. |
Not applicable.
| Item 14. | Purchases of Equity Securities by Closed-End Management Investment Company and Affiliated Purchasers. |
Not applicable.
| Item 15. | Submission of Matters to a Vote of Security Holders. |
There have been no material changes to the procedures by which shareholders may recommend nominees to the registrant’s board of trustees, where those changes were implemented after the registrant last provided disclosure in response to the requirements of Item 407(c)(2)(iv) of Regulation S-K (17 CFR 229.407) (as required by Item 22(b)(15) of Schedule 14A (17 CFR 240.14a-101)), or this Item.
| Item 16. | Controls and Procedures. |
| (a) | The registrant’s principal executive officer and principal financial officer have concluded, based on their evaluation of the effectiveness of the design and operation of the registrant’s disclosure controls and procedures (as defined in Rule 30a-3(c) under the Investment Company Act of 1940 (17 CFR 270.30a-3(c))) as of a date within 90 days of the filing date of this report, that the design and operation of such procedures are effective to provide reasonable assurance that information required to be disclosed by the registrant on Form N-CSR is recorded, processed, summarized and reported within the time periods specified in the Securities and Exchange Commission’s rules and forms, and that information required to be disclosed by the registrant in the reports that it files or submits on Form N-CSR is accumulated and communicated to the registrant’s management, including its principal executive and principal financial officers, as appropriate to allow timely decisions regarding required disclosure. |
| (b) | There were no changes in the registrant’s internal control over financial reporting (as defined in Rule 30a-3(d) under the 1940 Act (17 CFR 270.30a-3(d))) that occurred during the period covered by this report that have materially affected, or are reasonably likely to materially affect, the registrant’s internal control over financial reporting. |
| Item 17. | Disclosure of Securities Lending Activities for Closed-End Management Investment Companies. |
Not applicable.
| Item 18. | Recovery of Erroneously Awarded Compensation. |
Not Applicable.
| (a)(3)(1) | | There were no written solicitations to purchase securities under Rule 23c-1 under the Act sent or given during the period covered by the report by or on behalf of the Registrant to 10 or more persons. |
| (a)(3)(2) | | There was no change in the Registrant’s independent public accountant during the period covered by the report. |
SIGNATURES
Pursuant to the requirements of the Securities Exchange Act of 1934 and the Investment Company Act of 1940, the registrant has duly caused this report to be signed on its behalf by the undersigned, thereunto duly authorized.
| (Registrant) | Gabelli Equity Series Funds, Inc. | |
| | | |
| By (Signature and Title)* | /s/ John C. Ball | |
| | John C. Ball, Principal Executive Officer | |
| | | |
| Date | 12/5/24 | |
Pursuant to the requirements of the Securities Exchange Act of 1934 and the Investment Company Act of 1940, this report has been signed below by the following persons on behalf of the registrant and in the capacities and on the dates indicated.
| By (Signature and Title)* | /s/ John C. Ball | |
| | John C. Ball, Principal Executive Officer | |
| | | |
| Date | 12/5/24 | |
| By (Signature and Title)* | /s/ John C. Ball | |
| | John C. Ball, Principal Financial Officer and Treasurer | |
| | | |
| Date | 12/5/24 | |
| * | Print the name and title of each signing officer under his or her signature. |