SUPPLEMENTAL INFORMATION
March 31, 2014
Table of Contents
This Supplemental Information and other materials we have filed or may file with the Securities and Exchange Commission, as well as information included in oral statements made, or to be made, by our senior management contain certain “forward-looking” statements as that term is defined by the Private Securities Litigation Reform Act of 1995. All statements regarding our expected future financial position, results of operations, cash flows, funds from operations, continued performance improvements, ability to service and refinance our debt obligations, ability to finance growth opportunities, and similar statements including, without limitations, those containing words such as “may,” “will,” “believes,” anticipates,” “expects,” “intends,” “estimates,” “plans,” and other similar expressions are forward-looking statements.
Forward-looking statements involve known and unknown risks and uncertainties that may cause our actual results in future periods to differ materially from those projected or contemplated in the forward-looking. Such risks and uncertainties include, among other things, the following risks, which are described in more detail under the heading “Risk Factors” in Item 1A in our Form 10-K for the year ended December 31, 2013:
| |
| • | We depend on the operating success of our customers (facility operators) for collection of our revenues during this time of uncertain economic conditions in the U.S.; |
| |
| • | We are exposed to the risk that our tenants and borrowers may not be able to meet the rent, principal and interest or other payments due us, which may result in an operator bankruptcy or insolvency, or that an operator might become subject to bankruptcy or insolvency proceedings for other reasons; |
| |
| • | We are exposed to risks related to governmental regulations and payors, principally Medicare and Medicaid, and the effect that lower reimbursement rates will have on our tenants’ and borrowers’ business; |
| |
| • | We are exposed to the risk that the cash flows of our tenants and borrowers will be adversely affected by increased liability claims and general and professional liability insurance costs; |
| |
| • | We are exposed to risks related to environmental laws and the costs associated with the liability related to hazardous substances; |
| |
| • | We are exposed to the risk that we may not be indemnified by our lessees and borrowers against future litigation; |
| |
| • | We depend on the success of future acquisitions and investments; |
| |
| • | We depend on the ability to reinvest cash in real estate investments in a timely manner and on acceptable terms; |
| |
| • | We may need to incur more debt in the future, which may not be available on terms acceptable to the Company; |
| |
| • | We have covenants related to our indebtedness which impose certain operational limitations and a breach of those covenants could materially adversely affect our financial condition and results of operations; |
| |
| • | We are exposed to the risk that the illiquidity of real estate investments could impede our ability to respond to adverse changes in the performance of our properties; |
| |
| • | We are exposed to risks associated with our investments in unconsolidated entities, including our lack of sole decision-making authority and our reliance on the financial condition of other interests; |
| |
| • | We depend on revenues derived mainly from fixed rate investments in real estate assets, while our debt capital used to finance those investments is primarily at variable rates. This circumstance creates interest rate risk to the Company; |
| |
| • | We are exposed to the risk that our assets may be subject to impairment charges; |
| |
| • | We depend on the ability to continue to qualify as a real estate investment trust; |
| |
| • | We have ownership limits in our charter with respect to our common stock and other classes of capital stock which may delay, defer or prevent a transaction or a change of control that might involve a premium price for our common stock or might otherwise be in the best interests of our stockholders; |
| |
| • | We are subject to certain provisions of Maryland law and our charter and bylaws that could hinder, delay or prevent a change in control transaction, even if the transaction involves a premium price for our common stock or our stockholders believe such transaction to be otherwise in their best interests. |
In this Supplemental Information, we refer to non-GAAP financial measures. These non-GAAP measures are not prepared in accordance with generally accepted accounting principles. A reconciliation of the non-GAAP financial measures to the most directly comparable GAAP measures is included in this presentation.
Throughout this presentation, certain abbreviations and acronyms are used to simplify the format. A list of definitions is provided at the end of this presentation to clarify the meaning of any reference that may be ambiguous.
Unless otherwise noted, all amounts are unaudited and are as of or for the year to date period ended March 31st.

|
|
| March 2014 |
| |
| Selective Growth. |
| Shareholder Value. |
NATIONAL HEALTH INVESTORS, INC. (NYSE: NHI), a Maryland corporation incorporated and publicly listed in 1991, is a healthcare real estate investment trust (REIT) specializing in financing healthcare real estate by purchase and leaseback transactions, RIDEA transactions and by mortgage loans. NHI's investments include senior housing (independent living, assisted living & senior living campuses), skilled nursing facilities, medical office buildings, and hospitals.
|
|
| HIGHLIGHTS |
| |
| Geographic & asset class diversification |
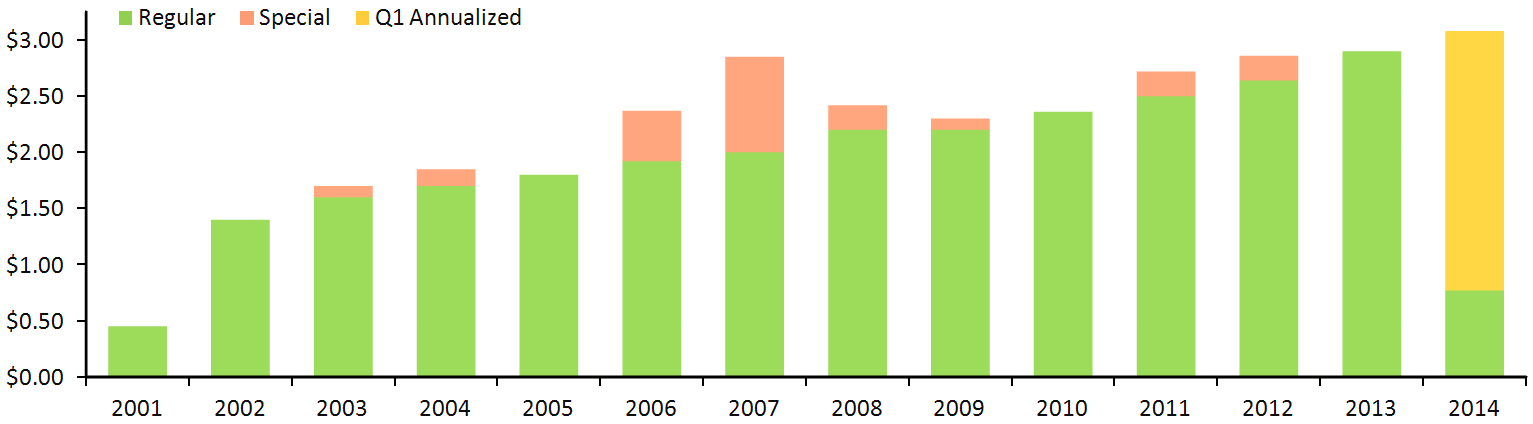
| Consistent dividend growth since 2001 |
| Low-leverage balance sheet |
| Cash flow growth from lease escalators |
| |
| STRATEGY |
| |
| Partner with top-tier operators |
| Prioritize direct referrals and existing customers |
| Continue focus on need-driven senior care |
| Prioritize toward AL and newer SNF campuses |
| Prioritize toward private pay and Medicare potential |
| Develop assisted and memory care communities |
|
| | |
| GEOGRAPHIC DIVERSIFICATION |
| | | |
| 30 Partners | 30 States | 172 Properties |

|
| | |
| 95 |
| Senior Housing |
| 71 |
| Skilled Nursing |
| 4 |
| Hospital |
| 2 |
| Medical Office Building |
| | |
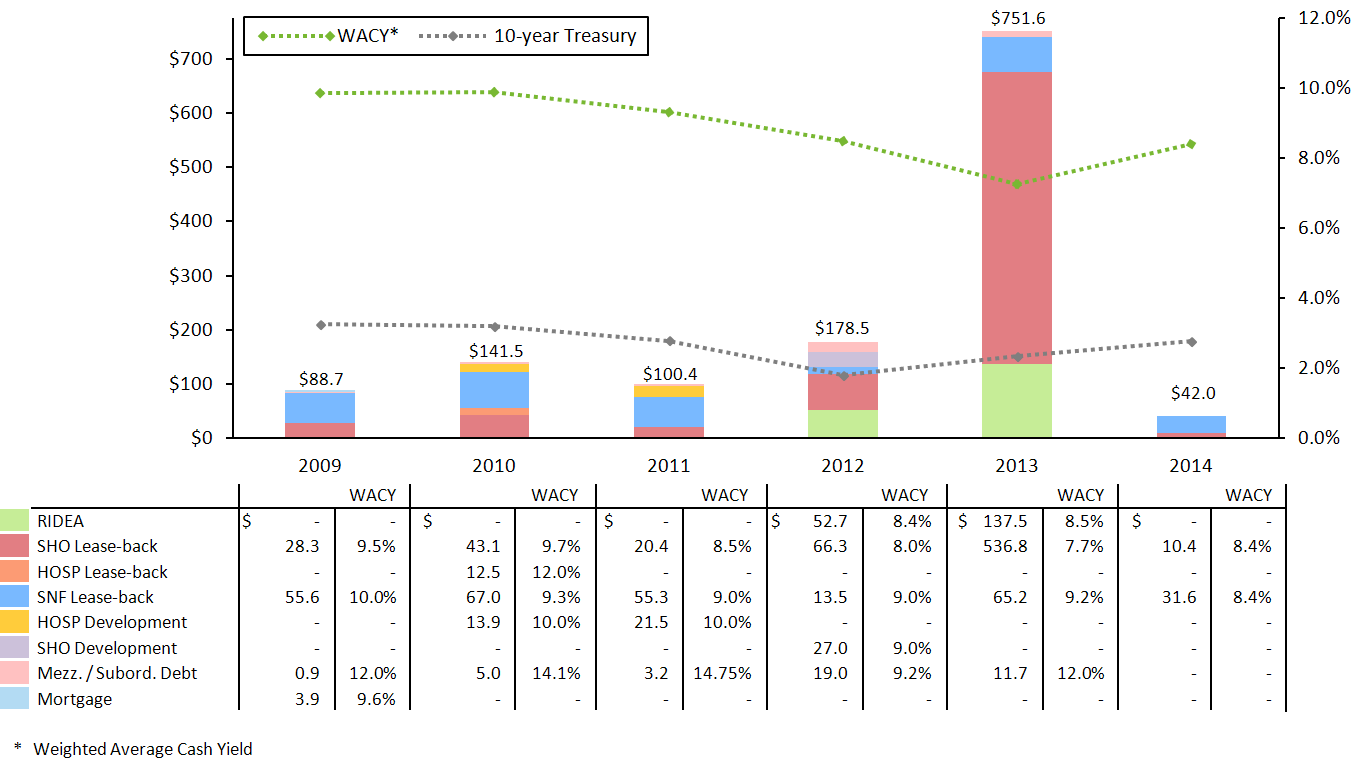
(in millions)
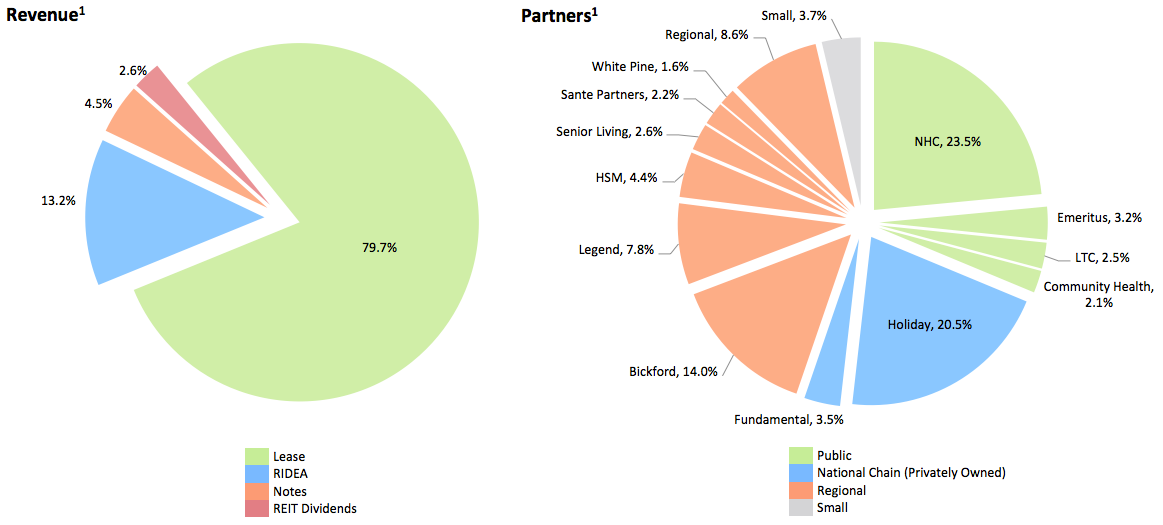
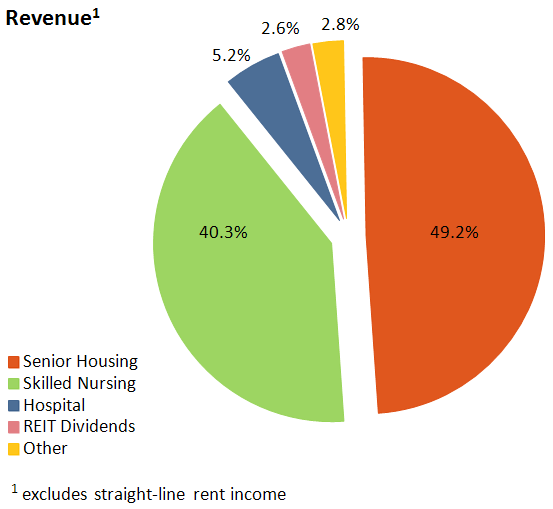
1 excludes straight-line rent income
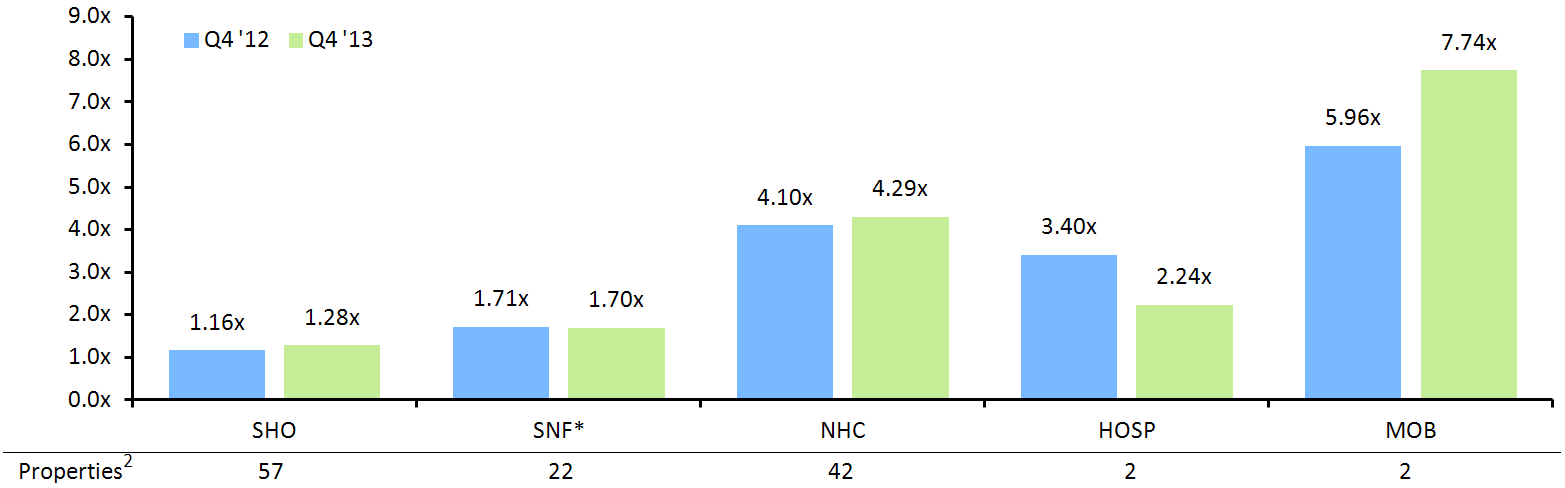
STABILIZED LEASE PORTFOLIO
EBITDARM Coverage1
|
|
1 based on trailing twelve months; full portfolio coverage is 2.43 |
2 includes Holiday; excludes development, RIDEA, assets sold and notes |
| * excludes NHC |
RIDEA ASSETS
Bickford Senior Living
FINANCIAL HIGHLIGHTS
The Board of Directors approves a regular quarterly dividend which is reflective of expected taxable income on a recurring basis. Company transactions that are infrequent and non-recurring that generate additional taxable income have been distributed to shareholders in the form of special dividends. Taxable income is determined in accordance with the Internal Revenue Code and differs from net income for financial statement purposes determined in accordance with US GAAP.
|
|
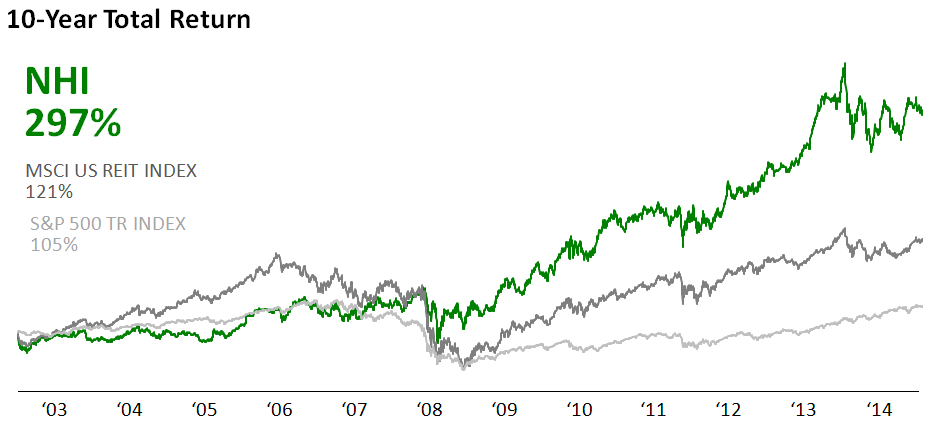
“NHI's long history of outperforming the market has returned significant value to our shareholders.”
|
| Justin Hutchens, President & CEO |
| |

|
|
| Justin Hutchens |
| President & CEO |
| |

|
|
| Kristin S. Gaines |
| Chief Credit Officer |
| |

|
|
| Mandi Hogan |
| National Director, |
| Marketing |

|
|
| Roger R. Hopkins |
| Chief Accounting |
| Officer |

|
|
| Kevin Pascoe |
| Senior VP, |
| Investments |

(615) 890-9100 - investorrelations@nhireit.com
(in thousands, except share amounts)
|
| | | | | | | |
| As of March 31, | 2014 |
| | 2013 |
|
| Assets: | | | |
| Real estate properties: | | | |
| Land | $ | 93,290 |
| | $ | 58,869 |
|
| Buildings and improvements | 1,363,727 |
| | 637,043 |
|
| Construction in progress | 11,198 |
| | 4,922 |
|
| | 1,468,215 |
| | 700,834 |
|
| Less accumulated depreciation | (183,488 | ) | | (167,549 | ) |
| Real estate properties, net | 1,284,727 |
| | 533,285 |
|
| Mortgage and other notes receivable, net | 60,871 |
| | 80,059 |
|
| Investment in preferred stock, at cost | 38,132 |
| | 38,132 |
|
| Cash and cash equivalents | 6,245 |
| | 6,050 |
|
| Marketable securities | 13,438 |
| | 14,845 |
|
| Straight-line rent receivable | 22,886 |
| | 13,652 |
|
| Equity-method investment and other assets | 46,903 |
| | 12,507 |
|
| Assets held for sale, net | — |
| | 1,611 |
|
| Total Assets | $ | 1,473,202 |
| | $ | 700,141 |
|
| | | | |
| Liabilities and Stockholders' Equity: | | | |
| Debt | $ | 629,033 |
| | $ | 203,250 |
|
| Real estate purchase liabilities | 4,000 |
| | 4,256 |
|
| Accounts payable and accrued expenses | 7,058 |
| | 3,590 |
|
| Dividends payable | 25,450 |
| | 19,375 |
|
| Lease deposit liabilities | 22,775 |
| | — |
|
| Deferred income | 1,701 |
| | 1,294 |
|
| Earnest money deposit | — |
| | — |
|
| Total Liabilities | 690,017 |
| | 231,765 |
|
| | | | |
| Commitments and Contingencies | | | |
| | | | |
| National Health Investors Stockholders' Equity: | | | |
| Common stock, $.01 par value; 40,000,000 shares authorized; | | | |
| 33,051,999 and 27,876,176 shares issued and outstanding, respectively | 330 |
| | 279 |
|
| Capital in excess of par value | 762,483 |
| | 469,569 |
|
| Cumulative net income in excess (deficit) of dividends | 1,126 |
| | (22,127 | ) |
| Accumulated other comprehensive income | 8,741 |
| | 9,786 |
|
| Total National Health Investors Stockholders' Equity | 772,680 |
| | 457,507 |
|
| Noncontrolling interest | 10,505 |
| | 10,869 |
|
| Total Equity | 783,185 |
| | 468,376 |
|
| Total Liabilities and Stockholders' Equity | $ | 1,473,202 |
| | $ | 700,141 |
|
(in thousands, except share and per share amounts)
|
| | | | | | | | | | | |
| Year to date as of March 31, | 2014 |
| | 2013 |
| | 2012 |
|
| Revenues: | | | | | |
| Rental income | $ | 40,313 |
| | $ | 24,105 |
| | $ | 20,410 |
|
| Interest income from mortgage and other notes | 1,756 |
| | 1,969 |
| | 1,702 |
|
| Investment income and other | 1,067 |
| | 1,052 |
| | 1,060 |
|
| | 43,136 |
| | 27,126 |
| | 23,172 |
|
| Expenses: | | | | | |
| Depreciation and amortization | 9,237 |
| | 4,248 |
| | 3,240 |
|
| Interest, including amortization of debt discount and issuance costs | 6,887 |
| | 1,123 |
| | 575 |
|
| Legal | 73 |
| | 277 |
| | 91 |
|
| Franchise, excise and other taxes | 306 |
| | 144 |
| | 125 |
|
| General and administrative | 2,935 |
| | 3,089 |
| | 2,786 |
|
| Loan impairments | — |
| | 4,037 |
| | — |
|
| | 19,438 |
| | 12,918 |
| | 6,817 |
|
| Income before equity-method investee, discontinued operations and noncontrolling interest | 23,698 |
| | 14,208 |
| | 16,355 |
|
| Income from equity-method investee | 158 |
| | 22 |
| | — |
|
| Income from continuing operations | 23,856 |
| | 14,230 |
| | 16,355 |
|
| Income from discontinued operations | — |
| | 1,693 |
| | 1,995 |
|
| Net income | 23,856 |
| | 15,923 |
| | 18,350 |
|
| Net income attributable to noncontrolling interest | (323 | ) | | (180 | ) | | — |
|
| Net income attributable to common stockholders | $ | 23,533 |
| | $ | 15,743 |
| | $ | 18,350 |
|
| | | | | | |
| Weighted average common shares outstanding: | | | | | |
| Basic | 33,051,415 |
| | 27,876,176 |
| | 27,776,104 |
|
| Diluted | 33,085,232 |
| | 27,911,584 |
| | 27,803,222 |
|
| Earnings per common share: | | | | | |
| Basic: | | | | | |
| Income from continuing operations attributable to common stockholders | $ | .71 |
| | $ | .50 |
| | $ | .59 |
|
| Discontinued operations | — |
| | .06 |
| | .07 |
|
| Net income attributable to common stockholders | $ | .71 |
| | $ | .56 |
| | $ | .66 |
|
| Diluted: | | | | | |
| Income from continuing operations attributable to common stockholders | $ | .71 |
| | $ | .50 |
| | $ | .59 |
|
| Discontinued operations | — |
| | .06 |
| | .07 |
|
| Net income attributable to common stockholders | $ | .71 |
| | $ | .56 |
| | $ | .66 |
|
| | | | | | |
| Regular dividends declared per common share | $ | .77 |
| | $ | .695 |
| | $ | .65 |
|
(in thousands, except share and per share amounts)
|
| | | | | | | | | | | |
| Year to date as of March 31, | 2014 |
| | 2013 |
| | 2012 |
|
| Net income attributable to common stockholders | $ | 23,533 |
| | $ | 15,743 |
| | $ | 18,350 |
|
| Elimination of certain non-cash items in net income: | | | | | |
| Depreciation in continuing operations | 9,237 |
| | 4,248 |
| | 3,240 |
|
| Depreciation related to noncontrolling interest | (246 | ) | | (87 | ) | | — |
|
| Depreciation in discontinued operations | — |
| | 167 |
| | 126 |
|
| Net gain on sales of real estate | — |
| | — |
| | — |
|
| Funds from operations | 32,524 |
| | 20,071 |
| | 21,716 |
|
| Debt issuance costs expensed due to credit facility modifications | 2,145 |
| | — |
| | — |
|
| Loan impairment | — |
| | 4,037 |
| | — |
|
| Normalized FFO | 34,669 |
| | 24,108 |
| | 21,716 |
|
| Straight-line lease revenue, net | (4,195 | ) | | (1,283 | ) | | (1,063 | ) |
| Straight-line lease revenue, net, related to noncontrolling interest | 17 |
| | — |
| | — |
|
| Amortization of original issue discount | 15 |
| | — |
| | — |
|
| Amortization of debt issuance costs | 368 |
| | 82 |
| | 76 |
|
| Normalized AFFO | 30,874 |
| | 22,907 |
| | 20,729 |
|
| Non-cash stock based compensation | 1,349 |
| | 1,580 |
| | 1,433 |
|
| Normalized FAD | $ | 32,223 |
| | $ | 24,487 |
| | $ | 22,162 |
|
| | | | | | |
| | | | | | |
| BASIC | | | | | |
| Weighted average common shares outstanding | 33,051,415 |
| | 27,876,176 |
| | 27,776,104 |
|
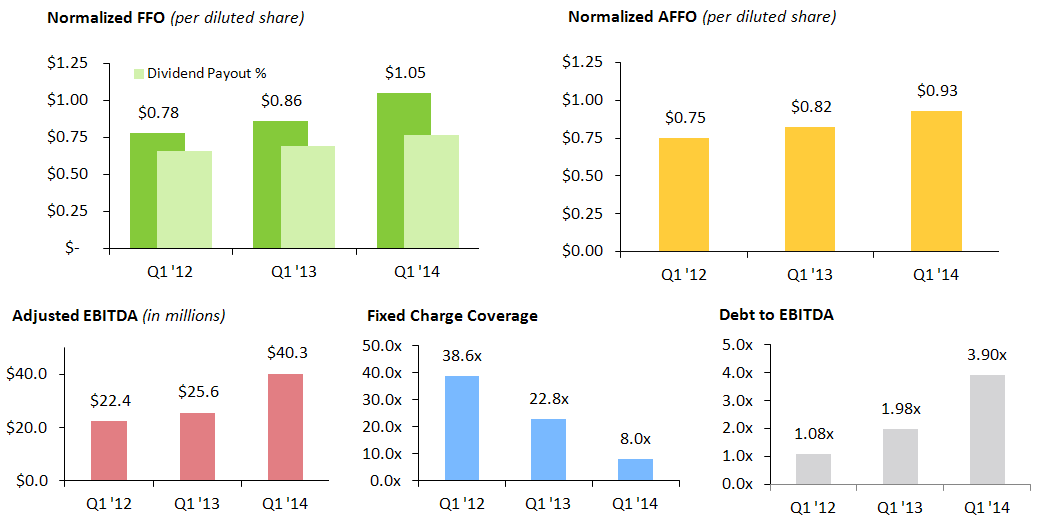
| FFO per common share | $ | .98 |
| | $ | .72 |
| | $ | .78 |
|
| Normalized FFO per common share | $ | 1.05 |
| | $ | .86 |
| | $ | .78 |
|
| Normalized AFFO per common share | $ | .93 |
| | $ | .82 |
| | $ | .75 |
|
| Normalized FAD per common share | $ | .97 |
| | $ | .88 |
| | $ | .80 |
|
| | | | | | |
| DILUTED | | | | | |
| Weighted average common shares outstanding | 33,085,232 |
| | 27,911,584 |
| | 27,803,222 |
|
| FFO per common share | $ | .98 |
| | $ | .72 |
| | $ | .78 |
|
| Normalized FFO per common share | $ | 1.05 |
| | $ | .86 |
| | $ | .78 |
|
| Normalized AFFO per common share | $ | .93 |
| | $ | .82 |
| | $ | .75 |
|
| Normalized FAD per common share | $ | .97 |
| | $ | .88 |
| | $ | .80 |
|
| | | | | | |
| Payout ratios: | | | | | |
| Regular dividends declared per common share | $ | .77 |
| | $ | .695 |
| | $ | .65 |
|
| Normalized FFO payout ratio per diluted common share | 73.3 | % | | 80.8 | % | | 83.3 | % |
| Normalized AFFO payout ratio per diluted common share | 82.8 | % | | 84.8 | % | | 86.7 | % |
| Normalized FAD payout ratio per diluted common share | 79.4 | % | | 79.0 | % | | 81.3 | % |
NOTE: FFO and Normalized FFO per diluted common share for the three months ended March 31, 2013 differ by $.02 and $.01, respectively, from the amounts previously reported as a result of our revised interpretation of the NAREIT definition of FFO. Normalized FAD per diluted common share for the three months ended March 31, 2013 differs by $.01, from the amount previously reported as a result of changes we made to our definition of FAD.
For the three months ended March 31, 2012, FFO and Normalized FFO per diluted common share increased by $.01 and $.01, respectively, from the amounts previously reported as a result of our revised interpretation of the NAREIT definition of FFO. Normalized FAD per diluted common share for the three months ended March 31, 2013 also increased by $.01, from the amount previously reported as a result of changes we made to our definition of FAD.
See our Form 8-K dated May 5, 2014 which describes these revisions.
(dollars in thousands)
|
| | | | | | | | | | | |
| Year to date as of March 31, | 2014 |
| | 2013 |
| | 2012 |
|
| | | | | | |
| Net income | $ | 23,856 |
| | $ | 15,923 |
| | $ | 18,350 |
|
| Interest expense, including amortization of debt discount and issuance costs | 4,742 |
| | 1,123 |
| | 575 |
|
| Franchise, excise and other taxes | 306 |
| | 144 |
| | 125 |
|
| Depreciation in continuing and discontinued operations | 9,237 |
| | 4,415 |
| | 3,365 |
|
| Debt issuance costs expensed due to credit facility modifications | 2,145 |
| | — |
| | — |
|
| Loan impairment | — |
| | 4,037 |
| | — |
|
| Adjusted EBITDA | $ | 40,286 |
| | $ | 25,642 |
| | $ | 22,415 |
|
| | | | | | |
| Interest expense | $ | 4,742 |
| | $ | 1,123 |
| | $ | 575 |
|
| Principal payments | 276 |
| | — |
| | — |
|
| Fixed Charges | $ | 5,018 |
| | $ | 1,123 |
| | $ | 575 |
|
| | | | | | |
| Fixed Charge Coverage Ratio | 8:1 |
| | 23:1 |
| | 39:1 |
|
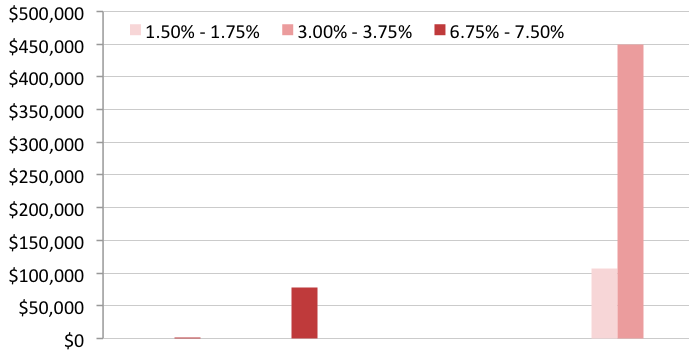
(in thousands)
|
| | | | | | | | | | | | | | | | | | | |
| | 2014 | | 2015 | | 2016 | | 2017 | | Thereafter |
| Revolving credit facility - unsecured | $ | — |
| | $ | — |
| | $ | — |
| | $ | — |
| | $ | 107,000 |
|
| Convertible senior notes - unsecured | — |
| | — |
| | — |
| | — |
| | 200,000 |
|
| Bank term loans - unsecured | — |
| | — |
| | — |
| | — |
| | 250,000 |
|
| Fannie Mae term loans - secured | 781 |
| | 77,268 |
| | — |
| | — |
| | — |
|
| | $ | 781 |
| | $ | 77,268 |
| | $ | — |
| | $ | — |
| | $ | 557,000 |
|
(dollars in thousands)
|
| | | | | | | | | | |
| | | Properties | | Units/ Sq. Ft. | | YTD Revenue |
| Leases | | | | | |
| | Skilled Nursing1 | 64 |
| | 8,370 |
| | $ | 15,621 |
|
| | Senior Housing | 92 |
| | 6,873 |
| | 22,584 |
|
| | Hospitals | 3 |
| | 181 |
| | 1,872 |
|
| | Medical Office Buildings | 2 |
| | 88,517 |
| | 236 |
|
| | Total Leases | 161 |
| | | | $ | 40,313 |
|
| | | | | | | |
1 | Skilled Nursing | | | | | |
| | NHC facilities | 39 |
| | 5,404 |
| | $ | 9,118 |
|
| | All other facilities | 25 |
| | 2,966 |
| | 6,503 |
|
| | | 64 |
| | 8,370 |
| | $ | 15,621 |
|
| | | | | | | |
| Mortgages and Other Notes Receivable | | | | | |
| | Skilled Nursing | 7 |
| | 594 |
| | $ | 349 |
|
| | Senior Housing | 3 |
| | 386 |
| | 276 |
|
| | Hospital | 1 |
| | 70 |
| | 297 |
|
| | Other Notes Receivable | — |
| | — |
| | 834 |
|
| | Total Mortgages | 11 |
| | 1,050 |
| | $ | 1,756 |
|
LEASE MATURITIES
(annualized 2014 cash rent; in thousands)
TENANT PURCHASE OPTIONS
(% of annualized 2014 cash rent)
|
| | | | | | | | | | | | | | | | | | | | | | | | | | | | | | | | | |
| Property Type | | Option Open Date | |
| | | 2014 | | 2015 | | 2016 | | 2017 | | 2018 | | 2019 | | 2020 | | 2021 | | 2022 | | 2023 | | 2024 | | 2025 | | Thereafter |
| SHO | | — |
| | — | | — |
| | — | | — |
| | — | | 3.3 | % | | — | | — |
| | — | | — | | — |
| | — |
|
| SNF | | — |
| | — | | 4.1 | % | | — | | 4.0 | % | | — | | — |
| | — | | — |
| | — | | — | | 2.3 | % | | 0.3 | % |
| HOSP | | — |
| | — | | — |
| | — | | 1.5 | % | | — | | 1.1 | % | | — | | 2.1 | % | | — | | — | | — |
| | — |
|
| MOB | | 0.5 | % | | — | | — |
| | — | | — |
| | — | | — |
| | — | | — |
| | — | | — | | — |
| | — |
|
| | | 0.5 | % | | — | | 4.1 | % | | — | | 5.5 | % | | — | | 4.4 | % | | — | | 2.1 | % | | — | | — | | 2.3 | % | | 0.3 | % |
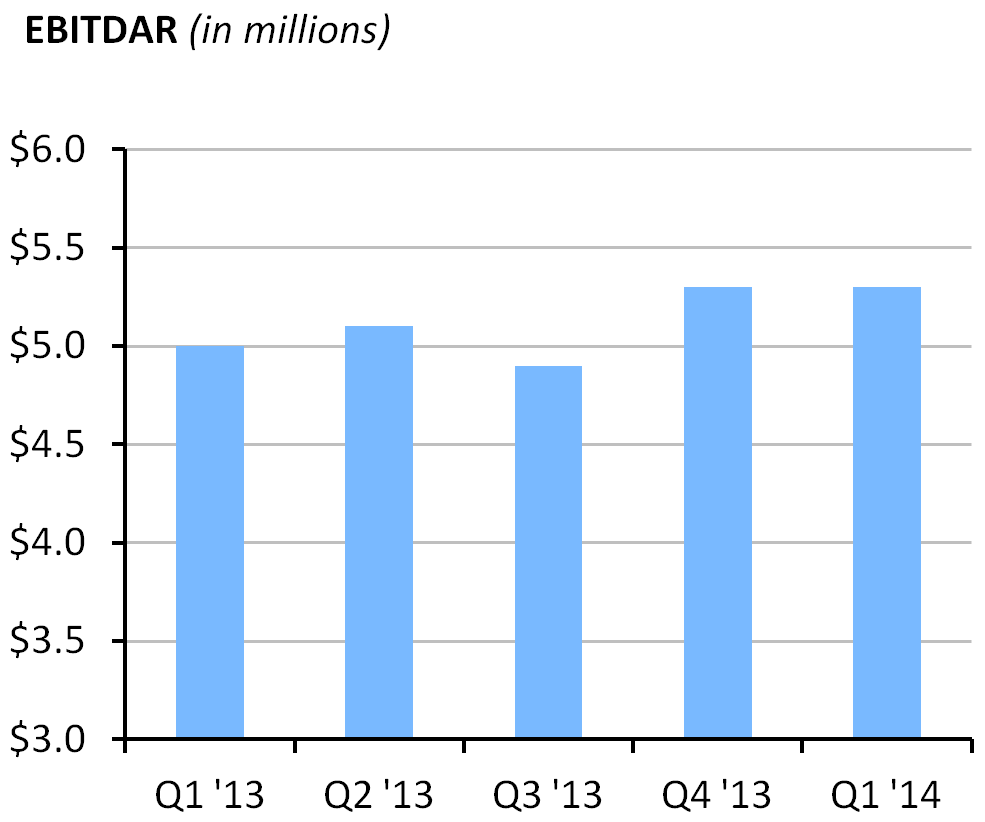
RIDEA ASSETS
Bickford Senior Living
(dollars in thousands)
|
| | | | | | | | | | | | | | | | | | | |
| As of and for the three months ended | Q1 '14 | | Q4 '13 | | Q3 '13 | | Q2 '13 | | Q1 '13 |
| Properties | 27 |
| | 27 |
| | 27 |
| | 27 |
| | 27 |
|
| Average age (years) | 13 |
| | 13 |
| | 13 |
| | 12 |
| | 12 |
|
| Units | 1,239 |
| | 1,239 |
| | 1,239 |
| | 1,239 |
| | 1,239 |
|
| Total occupancy | 85.5 | % | | 86.2 | % | | 84.8 | % | | 84.3 | % | | 85.2 | % |
| | | | | | | | | | |
| Revenues | $ | 15,194 |
| | $ | 15,262 |
| | $ | 14,838 |
| | $ | 14,641 |
| | $ | 14,692 |
|
Operating expenses1 | 9,901 |
| | 10,001 |
| | 9,962 |
| | 9,509 |
| | 9,641 |
|
| EBITDAR | $ | 5,293 |
| | $ | 5,261 |
| | $ | 4,876 |
| | $ | 5,132 |
| | $ | 5,051 |
|
| Contractual adjustments for capital expenditures and other terms of the joint venture agreement | $ | — |
| | $ | (26 | ) | | $ | 560 |
| | $ | (3 | ) | | $ | 98 |
|
| Net operating income | $ | 5,293 |
| | $ | 5,235 |
| | $ | 5,436 |
| | $ | 5,129 |
| | $ | 5,149 |
|
| | | | | | | | | | |
1 includes a 5% management fee | | | | | | | | | |
The term Annualized Revenue refers to the amount of revenue that our portfolio would generate if all leases and mortgages were in effect for the twelve-month calendar year, regardless of the commencement date, maturity date, or renewals. Therefore, annualized revenue is used for financial analysis purposes, and is not indicative of actual or expected results.
We consider Adjusted EBITDA to be an important supplemental measure because it provides information which we use to evaluate our performance and serves as an indication of our ability to service debt. We define Adjusted EBITDA as consolidated earnings before interest, taxes, depreciation and amortization, including amounts in discontinued operations, excluding real estate asset impairments and gains on dispositions and certain items which, due to their infrequent or unpredictable nature, may create some difficulty in comparing Adjusted EBITDA for the current period to similar prior periods, and may include, but are not limited to, impairment of non-real estate assets, gains and losses attributable to the acquisition and disposition of assets and liabilities, and recoveries of previous write-downs. Since others may not use our definition of Adjusted EBITDA, caution should be exercised when comparing our Adjusted EBITDA to that of other companies.
EBITDARM is earnings before interest, taxes, depreciation, amortization, rent and management fees.
SHO - Senior housing HOSP - Hospital
MOB - Medical office building SNF -Skilled nursing facility
The term Fixed Charges refers to payments for interest expense and debt principal.
These operating performance measures may not be comparable to similarly titled measures used by other REITs. Consequently, our FFO, normalized FFO, normalized AFFO & normalized FAD may not provide a meaningful measure of our performance as compared to that of other REITs. Since other REITs may not use our definition of these operating performance measures, caution should be exercised when comparing our Company's FFO, normalized FFO, normalized AFFO & normalized FAD to that of other REITs. These financial performance measures do not represent cash generated from operating activities in accordance with generally accepted accounting principles (“GAAP”) (these measures do not include changes in operating assets and liabilities) and therefore should not be considered an alternative to net earnings as an indication of operating performance, or to net cash flow from operating activities as determined by GAAP as a measure of liquidity, and is not necessarily indicative of cash available to fund cash needs.
FFO, as defined by the National Association of Real Estate Investment Trusts ("NAREIT") and applied by us, is net income (computed in accordance with GAAP), excluding gains (or losses) from sales of real estate property, plus real estate depreciation and amortization, and after adjustments for unconsolidated partnerships and joint ventures, if any. The Company’s computation of FFO may not be comparable to FFO reported by other REITs that do not define the term in accordance with the current NAREIT definition or have a different interpretation of the current NAREIT definition from that of the Company; therefore, caution should be exercised when comparing our Company’s FFO to that of other REITs. Diluted FFO assumes the exercise of stock options and other potentially dilutive securities. Normalized FFO excludes from FFO certain items which, due to their infrequent or unpredictable nature, may create some difficulty in comparing FFO for the current period to similar prior periods, and may include, but are not limited to, impairment of non-real estate assets, gains and losses attributable to the acquisition and disposition of assets and liabilities, and recoveries of previous write-downs.
We believe that FFO and normalized FFO are important supplemental measures of operating performance for a REIT. Because the historical cost accounting convention used for real estate assets requires depreciation (except on land), such accounting presentation implies that the value of real estate assets diminishes predictably over time. Since real estate values instead have historically risen and fallen with market conditions, presentations of operating results for a REIT that uses historical cost accounting for depreciation could be less informative, and should be supplemented with a measure such as FFO. The term FFO was designed by the REIT industry to address this issue.
We believe that normalized AFFO is an important supplemental measure of operating performance for a REIT. GAAP requires a lessor to recognize contractual lease payments into income on a straight-line basis over the expected term of the lease. This straight-line adjustment has the effect of reporting lease income that is significantly more or less than the contractual cash flows received pursuant to the terms of the lease agreement. GAAP also requires the original issue discount of our convertible senior notes and debt issuance costs to be amortized as a non-cash adjustment to earnings. Normalized AFFO
is useful to our investors as it reflects the growth inherent in our contractual lease payments without the distortion caused by non-cash amortization.
We believe that normalized FAD is an important supplemental measure of operating performance for a REIT, also providing a useful indicator of the ability to distribute dividends to shareholders.
A newly acquired triple-net lease property is generally considered stabilized upon lease-up (typically when senior-care residents occupy at least 80% of the total number of certified units). Newly completed developments, including redevelopments, are considered stabilized upon lease-up, as described above.
The term Total Return refers to the total return an investor would have realized on an annual basis over a certain period assuming that all dividends are reinvested on the dividend payment date.
Our joint ventures are designed to be compliant with the provisions of the REIT Diversification and Empowerment Act of 2007, or RIDEA.
The term WACY refers to Weighted Average Cash Yield, which is the anticipated rate of return upon initial investment excluding the impact of any discounts received or premiums paid.