UNITED STATES
SECURITIES AND EXCHANGE COMMISSION
Washington, D.C. 20549
FORM N-CSR
CERTIFIED SHAREHOLDER REPORT OF REGISTERED
MANAGEMENT INVESTMENT COMPANIES
Investment Company Act file number: 811-06373
Sit Mutual Funds, Inc.
(Exact name of registrant as specified in charter)
80 South Eighth Street
3300 IDS Center
Minneapolis, MN 55402
(Address of principal executive offices)
Paul E. Rasmussen, VP Treasurer
Sit Mutual Funds, Inc.
80 South Eighth Street
3300 IDS Center
Minneapolis, MN 55402
(Name and address of agent for service)
Registrant’s telephone number, including area code: (612) 332-3223
Date of fiscal year end: June 30, 2023
Date of reporting period: December 31, 2023
| Item 1: | Reports to Stockholders |
Semi-Annual Report
December 31, 2023
|
Balanced Fund
Dividend Growth Fund
Global Dividend Growth Fund
Large Cap Growth Fund
ESG Growth Fund
Mid Cap Growth Fund
Small Cap Dividend Growth Fund
Small Cap Growth Fund
International Growth Fund
Developing Markets Growth Fund
 Sit Mutual Funds
Sit Mutual Funds STOCK FUNDS SEMI-ANNUAL REPORT
|
| Page | ||||
| 2 | ||||
Fund Review and Schedules of Investments | ||||
| 4 | ||||
| 10 | ||||
| 14 | ||||
| 18 | ||||
| 22 | ||||
| 26 | ||||
| 30 | ||||
| 34 | ||||
| 40 | ||||
| 46 | ||||
| 50 | ||||
| 52 | ||||
| 54 | ||||
| 58 | ||||
| 72 | ||||
| 79 | ||||
| 81 | ||||
This document must be preceded or accompanied by a Prospectus.
February 5, 2024
Dear Fellow Shareholders:
2023 was a solid year for global equities, as investors looked forward to the end of the Federal Reserve tightening cycle amidst a resilient U.S. economy. After a year of spectacular returns for technology stocks, highlighted by the “Magnificent Seven,” we expect a broadening of participation in equity gains in 2024.
Economic Summary
The U.S. economy enters 2024 on a solid footing. Supply chains have largely normalized; labor markets are becoming less tight; inflation continues to recede; and consumer spending remains resilient. Not only did the economy avert a widely-predicted recession in 2023, but it also grew faster than it did in the previous year – at least in real GDP terms. The Atlanta Fed’s GDPNow model projects fourth quarter 2023 real GDP growth of +2.3%, bringing full-year growth to +2.5% year over year versus +1.9% in 2022. The more dire predictions for 2023 failed to materialize due to some fortuitous developments. A continued recovery in immigration helped the labor force grow by 2.8 million (putting it 1.4 million above its historical trend), thus halting a wage-price spiral. The regional banking crisis also did not broaden into a credit crunch. In addition, atypical pro-cyclical fiscal stimulus boosted GDP, and consumers did not skip a beat by tapping excess savings and credit to sustain spending. However, the surging personal debt, at very high interest rates, could soon become a headwind rather than a tailwind. Also, some of these 2023 tailwinds will dissipate in the year ahead, just as the full effects of restrictive monetary policy set in, resulting in softer growth in 2024. But how soft?
Admittedly, soft and hard landings typically follow similar paths until the lagged effects of monetary tightening hit the labor market (which responds slowly to policy changes). Further, in addition to the different time lags, the actual size and scope of the response to monetary policy varies widely. Also, while many leading indicators have continued to signal an imminent recession, the historical lag between the first rate hike (or even the yield curve inversion) put a recession in play through 2025. The bottom line is the economy is not out of the woods yet, following the most aggressive monetary tightening cycle in decades, and is especially vulnerable to a shock. Yet, there are undeniable positives. The recent uptick in productivity is encouraging and remains the critical factor driving real GDP growth potential, while keeping a lid on inflation. Plus, higher-end consumers still have excess cash to spend; private credit is filling the gaps left by weakening bank loan growth; inventory destocking is less of a drag; and the outlook for single-family housing is improving.
The Federal Reserve surprised financial markets in December by pivoting from a hawkish hold to a dovish bias. The “dot plot” now signals three 25-basis point fed funds rate cuts in 2024 based on
a median PCE inflation forecast of +2.4% at year end. Monetary policymakers seem comforted by the recent pace of disinflation. However, we should be mindful that even if the Fed stays put on rates, monetary policy will become incrementally more restrictive on a real basis as inflation continues to ebb. Which is not to mention the added tightening tied to the Fed’s ongoing balance sheet reduction. Naturally, investors, previously braced for “higher-for-longer” rates, swung eagerly on the Fed’s dovish (or less hawkish) pivot and are currently interpreting three cuts as six, with the first coming in midyear. The easier (market-driven) financial conditions that have followed could lift economic growth, but therein lies the rub. Higher demand might also cause inflation pressures to reemerge, putting the Fed back on the offensive and making a soft landing less likely.
Overseas economies are generally struggling, particularly the Euro Area, which is teetering on the brink of a technical recession, after bouncing along the bottom over the last four quarters. Given the slump in economic growth, the European Central Bank (ECB) likely pushed through its final rate hike last September. While growth is likely to remain tepid, at best, improving real disposable incomes, excess savings, and resilient labor markets should support consumer spending, keeping a recession relatively shallow if one occurs at all. In China, we anticipate the post-pandemic decelerating trend to continue into 2024. Consumption, a key growth driver, will moderate as the reopening effects fade, and investment growth will likely remain stable or slightly improve, partially reflecting policy support. We also expect growth to slow in Japan after a relatively solid year in 2023, as the services recovery that sustained growth since early 2022 has run its course. An inflation-burdened consumer and embattled manufacturing sector may not sufficiently take up the baton.
Equity Strategy
Global stocks posted exceptionally strong returns in 2023, aided by a broad-based rally in the final two months of the year. Still-high economic uncertainty, elevated policy/geopolitical risks, and “fair” equity valuations support our quality bias amidst a better environment for stock pickers in 2024.
Investors piled into U.S. stocks in the final two months of 2023, with about $96 billion flowing into U.S. equity mutual funds and ETFs in November and December. According to the American Association of Individual Investors (AAII) Investor Sentiment Survey, retail investor sentiment also swung from “panic” in early November to “euphoria” by mid-December, although the AAII survey often is used as a contrarian indicator. As for institutional investors, the NAAIM Exposure Index shows that active portfolio managers progressively increased risk exposure in November and December, before paring back in the year’s final week. Overbought technical
| 2 | SIT MUTUAL FUNDS SEMI-ANNUAL REPORT | |
conditions and elevated sentiment imply stocks are susceptible to profit-taking or at least a pause in the near term, as investors digest recent gains. Looking further out, we expect the U.S. presidential election will undoubtedly add to already-elevated economic, policy, and geopolitical uncertainty. On average, the S&P 500® Index has historically moved sideways in the first half of a presidential election year but rallied in the second to deliver a +6.9% annual return. But the 2024 election promises to be anything but average.
The spectacular performance of the “Magnificent Seven” (M7) stocks (i.e., Alphabet, Amazon, Apple, Meta, Microsoft, Nvidia, and Tesla) dominated headlines over the past year, and we suspect those companies will continue to garner a lot of investor attention in the year ahead. While valuations for the M7 stocks have moved well above market averages, it is important to note that earnings growth has been a key basis for investor enthusiasm, as the group grew earnings by over +40% year over year, on average. In contrast, overall S&P 500® earnings decelerated to low-single-digit growth in 2023. Yet, we believe that elevated valuations and more difficult earnings comparisons for the M7 stocks relative to the rest of the market may set the stage for broader equity gains in 2024. We generally maintain positions in the most attractive M7 stocks but also see compelling opportunities in other technology segments, including semiconductors, software/services, and cybersecurity. In addition to technology, we expect early cycle and rate-sensitive sectors to fare well in the year ahead. Transportation companies, for example, have been struggling with excess customer inventories and cost pressures, but pricing has remained solid, and the freight backdrop is set to rebound in 2024. Sentiment is also broadly improving for financial stocks. Given pent-up demand for initial public offerings, debt issuance, and M&A, we see the most attractive opportunities for a strong rebound in capital markets businesses. We are emphasizing segments such as property and casualty companies and broad financial services.
Due to several factors, dividend-paying stocks produced their weakest relative returns in years, especially against the AI-driven rally that pushed the M7 and other non-dividend-paying tech stocks much higher in 2023. Looking ahead, we see an emerging backdrop that has historically led to solid relative performance for high-quality dividend-paying growth stocks. Key elements of our forecast include modest economic growth, lower interest rates (including fed funds rate cuts), and the likelihood of an increase in market volatility from the exceptionally low levels at present. In addition to the groups noted above, we see attractive growth and income opportunities in diverse areas, such as energy, P&C insurance, drug distributors, and select pharmaceutical companies. The sharp rise in interest rates in 2023 provided stiff competition for dividend payers from bonds, particularly for slower growth “bond proxies,” including utilities,
consumer staples, and REITs. While we prefer “growthier” stocks, these low-beta sectors are cheap insurance against market volatility or a severe recession and offer modest earnings growth, well-above-average dividend yields, and attractive valuations.
For international portfolios, we generally remain cautious on Europe, as tepid economic growth will constrain company earnings growth, although there are select opportunities in industrials, health care, and technology. In emerging markets, we are positive on South Korea, Singapore, India, Australia, Mexico, and Brazil. Chinese equities derated in 2023 owing to disappointing economic growth and rising geopolitical tensions. Although Chinese stocks currently trade at highly depressed valuations, we remain highly selective until there is more clarity on economic growth catalysts, which may take some time. Overall, we believe emerging market stocks are attractively valued, with the MSCI Emerging Market Index trading at the low end of its historical range relative to the MSCI USA Index. Still, underlying corporate earnings prospects are highly variable, making country emphasis and stock selection critical in the year ahead.

| Roger J. Sit |
| Chairman, President, CEO and Global CIO |
| DECEMBER 31, 2023 | 3 | |
OBJECTIVE & STRATEGY
The dual objectives of the Sit Balanced Fund are to seek long-term growth of capital consistent with the preservation of principal and to provide regular income. It pursues its objectives by investing in a diversified portfolio of stocks and bonds. The Fund may emphasize either equity securities or fixed-income securities, or hold equal amounts of each, dependent upon the Adviser’s analysis of market, financial and economic conditions.
The Fund’s permissible investment allocation is: 35-65% in equity securities and 35-65% in fixed-income securities. At all times at least 25% of the fixed-income assets will be invested in fixed-income senior securities.
Fund Performance
The Sit Balanced Fund’s return for the 6-month period ended December 31, 2023 was +8.39%. The S&P 500® Index return was +8.04% over the period, while the Bloomberg Aggregate Bond Index increased +3.37%.
Factors that Influenced the Fund’s Performance
For the 6-month period ended December 31, 2023, returns for the fixed income portion of the Fund outperformed the Bloomberg Aggregate Bond Index. The fixed income portfolio primarily benefitted from its income advantage during the period, while price increases in the bond holdings also outpaced the price return of the index. Corporate bonds were the best performing sector during the period, as declining inflation and strong economic growth pushed recession fears lower and drove strong returns from credit-sensitive sectors. Mortgage pass-through securities struggled during the period despite their income advantage, as their lower overall interest rate sensitivity resulted in mortgage securities not keeping up with other sectors as bond prices rose. The outperformance in the equity portion of the Fund during the period was driven heavily by strong stock selection in the technology services and electronic technology sectors, combined with an underweight position in the lagging consumer durables sector. Key holdings included Broad-com, Intuit, Salesforce, and Lululemon Athletic. Conversely, an underweight position in the finance sector and negative stock selection in the consumer non-durables sector detracted from performance.
Outlook and Positioning
The yield curve twisted during the 6-month period. Interest rates on securities inside of six months to maturity increased, in conjunction with the last increase to the federal funds target rate in July, while 10+ year maturity interest rates rose modestly. This was in stark contrast to a drop in interest rates for intermediate maturity bonds, as the apparent end to the Federal Reserve’s rate hiking cycle resulted in a shift in sentiment. Looking ahead, investors now believe that the rapidly declining inflation picture means the next likely change in the fed funds rate will be a cut rather than another hike. We believe the large gap between the current rate target of 5.25% to 5.50% and core inflation of closer to 2.5% gives the Fed ample room to eventually cut rates, while remaining restrictive to keep inflation subdued. We now expect the Fed may successfully engineer a short, shallow recession or a “soft landing,” characterized by continued economic growth and inflation within 0.5% of their 2% target. As such, we have maintained an overweight to spread-sensitive sectors, which should outperform in a growing economy. We expect banks, in particular, to outperform, as the yield curve reverts to its normal upward-sloping shape. Overall, for 2024, we expect the fixed income
HYPOTHETICAL GROWTH OF $10,000
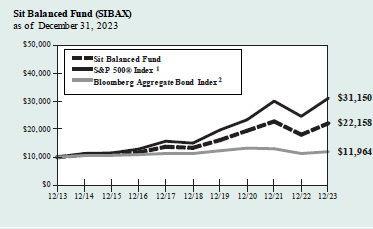
The chart above illustrates the total value of a hypothetical $10,000 investment in the Fund over the past 10 years as compared to the performance of the S&P 500® Index and the Bloomberg Aggregate Bond Index. Past performance does not guarantee future results. Returns include the reinvestment of distributions. The chart does not reflect the deduction of taxes that a shareholder would pay on Fund distributions or the redemption of Fund shares.
1 S&P 500® Index is an unmanaged capitalization-weighted index that measures the performance of 500 widely held common stocks of large-cap companies. It is not possible to invest directly in an index. This is the primary index for the equity portion of the Fund.
2 Bloomberg Aggregate Bond Index is an unmanaged market value weighted index which measures the performance of investment grade debt securities with maturities of at least one year. It is not possible to invest directly in an index. This is the primary index for the fixed income portion of the Fund.
portion of the portfolio’s yield advantage to drive outperformance, regardless of the change in the level of interest rates or the shape of the yield curve. In the equity portion of the Fund, we have maintained a large overweight position in technology companies that should benefit from secular trends, such as artificial intelligence, cloud spending, and Big Data. Additionally, we are looking to selectively grow our exposure to early-stage cyclicals, such as producer manufacturing, which should benefit more than the market as economic growth improves during 2024.
As of December 31, 2023, the asset allocation of the Fund was 63.2% equity, 32.7% fixed income, and 4.1% cash and equivalents.
Roger J. Sit
Bryce A.
Doty Ronald D. Sit
Portfolio Managers
| 4 | SIT MUTUAL FUNDS SEMI-ANNUAL REPORT | |
|
COMPARATIVE RATES OF RETURNS
as of December 31, 2023
| Sit Balanced Fund | | S&P 500® Index1 |
| | Bloomberg Aggregate Bond Index2 |
| ||||||
Six Month | 8.39% | 8.04 | % | 3.37 | % | |||||||
One Year | 22.64 | 26.29 | 5.53 | |||||||||
Five Year | 10.63 | 15.69 | 1.10 | |||||||||
Ten Year | 8.28 | 12.03 | 1.81 | |||||||||
Since Inception (12/31/93) | 7.37 | 10.14 | 4.41 | |||||||||
Performance figures are historical and do not guarantee future results. Investment returns and principal value will vary, and you may have a gain or loss when you sell shares. Current performance may be lower or higher than the performance data quoted. Contact the Fund for performance data current to the most recent month-end. Returns include changes in share price as well as reinvestment of all dividends and capital gains. Returns do not reflect the deduction of taxes that a shareholder would pay on Fund distributions or the redemption of Fund shares. Management fees and administrative expenses are included in the Fund’s performance. Returns for periods greater than one year are compounded average annual rates of return.
1 S&P 500® Index is an unmanaged capitalization-weighted index that measures the performance of 500 widely held common stocks of large-cap companies. It is not possible to invest directly in an index.
2 Bloomberg Aggregate Bond Index is an unmanaged market value weighted index which measures the performance of investment grade debt securities with maturities of at least one year.
PORTFOLIO SUMMARY
Net Asset Value 12/31/23: | $30.83 Per Share | |
Net Asset Value 6/30/23: | $28.76 Per Share | |
Net Assets: | $55.9 Million | |
TOP HOLDINGS
Top Equity Holdings:
1. Microsoft Corp.
2. Apple, Inc.
3. Alphabet, Inc.
4. NVIDIA Corp.
5. Broadcom, Inc.
Top Fixed Income Holdings:
1. U.S. Treasury Notes, 4.50%, 11/15/33
2. Federal National Mortgage Association, 6.00%, 10/1/53
3. Federal National Mortgage Association, 4.50%, 9/1/52
4. Federal National Mortgage Association, 4.50%, 7/1/52
5. JP Morgan Mortgage Trust, 5.00%, 7/25/52
Based on net assets as of December 31, 2023.
FUND DIVERSIFICATION
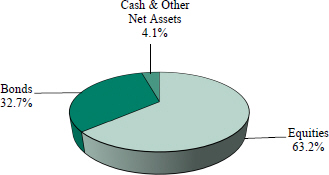
Based on net assets as of December 31, 2023.
| DECEMBER 31, 2023 | 5 | |
SCHEDULE OF INVESTMENTS (Unaudited)
December 31, 2023
Sit Balanced Fund
Investments are grouped by economic sectors.
| Name of Issuer | Quantity | Fair Value ($) | ||||||
Common Stocks - 63.2% | ||||||||
Consumer Durables - 0.3% | ||||||||
YETI Holdings, Inc. * | 3,500 | 181,230 | ||||||
|
| |||||||
Consumer Non-Durables - 2.2% | ||||||||
Constellation Brands, Inc. | 2,750 | 664,813 | ||||||
Mondelez International, Inc. | 3,400 | 246,262 | ||||||
PepsiCo, Inc. | 1,825 | 309,958 | ||||||
|
| |||||||
| 1,221,033 | ||||||||
|
| |||||||
Consumer Services - 2.1% | ||||||||
McDonald’s Corp. | 1,450 | 429,939 | ||||||
Visa, Inc. | 2,800 | 728,980 | ||||||
|
| |||||||
| 1,158,919 | ||||||||
|
| |||||||
Electronic Technology - 13.4% | ||||||||
Apple, Inc. | 13,700 | 2,637,661 | ||||||
Applied Materials, Inc. | 2,600 | 421,382 | ||||||
Arista Networks, Inc. * | 765 | 180,165 | ||||||
Broadcom, Inc. | 1,485 | 1,657,631 | ||||||
NVIDIA Corp. | 4,025 | 1,993,260 | ||||||
Palo Alto Networks, Inc. * | 1,835 | 541,105 | ||||||
|
| |||||||
| 7,431,204 | ||||||||
|
| |||||||
Energy Minerals - 1.5% | ||||||||
ConocoPhillips | 5,775 | 670,304 | ||||||
Shell, PLC, ADR | 2,400 | 157,920 | ||||||
|
| |||||||
| 828,224 | ||||||||
|
| |||||||
Finance - 3.4% | ||||||||
Ameriprise Financial, Inc. | 1,150 | 436,805 | ||||||
Chubb, Ltd. | 1,400 | 316,400 | ||||||
Goldman Sachs Group, Inc. | 1,600 | 617,232 | ||||||
JPMorgan Chase & Co. | 2,925 | 497,542 | ||||||
|
| |||||||
| 1,867,979 | ||||||||
|
| |||||||
Health Services - 3.0% | ||||||||
Centene Corp. * | 2,475 | 183,670 | ||||||
HCA Healthcare, Inc. | 850 | 230,078 | ||||||
UnitedHealth Group, Inc. | 2,450 | 1,289,851 | ||||||
|
| |||||||
| 1,703,599 | ||||||||
|
| |||||||
Health Technology - 4.0% | ||||||||
Abbott Laboratories | 3,550 | 390,749 | ||||||
Dexcom, Inc. * | 5,260 | 652,713 | ||||||
Gilead Sciences, Inc. | 3,925 | 317,964 | ||||||
Johnson & Johnson | 1,250 | 195,925 | ||||||
Thermo Fisher Scientific, Inc. | 1,200 | 636,948 | ||||||
|
| |||||||
| 2,194,299 | ||||||||
|
| |||||||
Industrial Services - 0.8% | ||||||||
Cheniere Energy, Inc. | 2,750 | 469,453 | ||||||
|
| |||||||
Process Industries - 1.5% | ||||||||
Linde, PLC | 1,225 | 503,120 | ||||||
Sherwin-Williams Co. | 1,000 | 311,900 | ||||||
|
| |||||||
| 815,020 | ||||||||
|
| |||||||
Producer Manufacturing - 5.2% | ||||||||
Aptiv, PLC * | 2,375 | 213,085 | ||||||
General Dynamics Corp. | 700 | 181,769 | ||||||
Honeywell International, Inc. | 1,450 | 304,079 | ||||||
Motorola Solutions, Inc. | 1,400 | 438,326 | ||||||
| Name of Issuer | Quantity | Fair Value ($) | ||||||
Northrop Grumman Corp. | 375 | 175,552 | ||||||
Parker-Hannifin Corp. | 1,350 | 621,945 | ||||||
Safran SA, ADR | 11,550 | 509,701 | ||||||
Siemens AG, ADR | 5,175 | 484,069 | ||||||
|
| |||||||
| 2,928,526 | ||||||||
|
| |||||||
Retail Trade - 6.5% | ||||||||
Amazon.com, Inc. * | 9,700 | 1,473,818 | ||||||
Home Depot, Inc. | 1,825 | 632,454 | ||||||
Lululemon Athletica, Inc. * | 885 | 452,492 | ||||||
Netflix, Inc. * | 460 | 223,965 | ||||||
TJX Cos., Inc. | 5,100 | 478,431 | ||||||
Ulta Beauty, Inc. * | 795 | 389,542 | ||||||
|
| |||||||
| 3,650,702 | ||||||||
|
| |||||||
Technology Services - 17.2% | ||||||||
Accenture, PLC | 2,025 | 710,593 | ||||||
Adobe, Inc. * | 810 | 483,246 | ||||||
Alphabet, Inc. - Class A * | 12,400 | 1,732,156 | ||||||
Alphabet, Inc. - Class C * | 4,100 | 577,813 | ||||||
Atlassian Corp. * | 1,050 | 249,753 | ||||||
Autodesk, Inc. * | 1,275 | 310,437 | ||||||
Dynatrace, Inc. * | 4,250 | 232,433 | ||||||
Intuit, Inc. | 1,200 | 750,036 | ||||||
Meta Platforms, Inc. * | 635 | 224,765 | ||||||
Microsoft Corp. | 7,800 | 2,933,112 | ||||||
Paycom Software, Inc. | 600 | 124,032 | ||||||
Salesforce, Inc. * | 3,650 | 960,461 | ||||||
ServiceNow, Inc. * | 560 | 395,634 | ||||||
|
| |||||||
| 9,684,471 | ||||||||
|
| |||||||
Transportation - 1.7% | ||||||||
FedEx Corp. | 1,775 | 449,022 | ||||||
Union Pacific Corp. | 2,050 | 503,521 | ||||||
|
| |||||||
| 952,543 | ||||||||
|
| |||||||
Utilities - 0.4% | ||||||||
NextEra Energy, Inc. | 4,140 | 251,464 | ||||||
|
| |||||||
Total Common Stocks | 35,338,666 | |||||||
|
| |||||||
| Name of Issuer | Principal Amount ($) | Fair Value ($) | ||||||
Bonds – 29.1% | ||||||||
Asset-Backed Securities - 0.3% | ||||||||
Small Business Administration: | ||||||||
2008-20A 1, 5.17%, 1/1/28 | 10,230 | 10,104 | ||||||
2007-20H 1, 5.78%, 8/1/27 | 9,396 | 9,326 | ||||||
Towd Point Mortgage Trust: | ||||||||
2020-MH1 A1A, 2.18%, 2/25/60 1, 4 | 64,815 | 61,679 | ||||||
2019-MH1 A2, 3.00%, 11/25/58 1, 4 | 100,000 | 98,252 | ||||||
|
| |||||||
| 179,361 | ||||||||
|
| |||||||
Collateralized Mortgage Obligations - 6.3% |
| |||||||
Chase Home Lending Mortgage Trust: | ||||||||
2023-6 A2, 6.00%, 6/25/54 1, 4 | 147,071 | 147,421 | ||||||
See accompanying notes to financial statements.
| 6 | SIT MUTUAL FUNDS SEMI-ANNUAL REPORT | |
| Name of Issuer | Principal Amount ($) | Fair Value ($) | ||||||
Fannie Mae: | ||||||||
2017-84 JP, 2.75%, 10/25/47 | 16,745 | 14,835 | ||||||
2003-34 A1, 6.00%, 4/25/43 | 22,695 | 22,922 | ||||||
2004-T1 1A1, 6.00%, 1/25/44 | 13,645 | 13,842 | ||||||
1999-17 C, 6.35%, 4/25/29 | 3,965 | 3,996 | ||||||
2001-82 ZA, 6.50%, 1/25/32 | 6,552 | 6,635 | ||||||
2009-30 AG, 6.50%, 5/25/39 | 23,942 | 24,990 | ||||||
2013-28 WD, 6.50%, 5/25/42 | 21,594 | 23,021 | ||||||
2004-T1 1A2, 6.50%, 1/25/44 | 34,832 | 35,656 | ||||||
2004-W9 2A1, 6.50%, 2/25/44 | 23,398 | 23,852 | ||||||
2010-108 AP, 7.00%, 9/25/40 | 290 | 302 | ||||||
2004-T3 1A3, 7.00%, 2/25/44 | 4,774 | 4,948 | ||||||
Freddie Mac: | ||||||||
5280 A, 3.50%, 1/25/50 | 152,570 | 142,693 | ||||||
4812 CZ, 4.00%, 5/15/48 | 158,446 | 149,906 | ||||||
4293 BA, 5.27%, 10/15/47 1 | 7,301 | 7,476 | ||||||
2122 ZE, 6.00%, 2/15/29 | 21,296 | 21,614 | ||||||
2126 C, 6.00%, 2/15/29 | 14,837 | 14,992 | ||||||
2480 Z, 6.00%, 8/15/32 | 18,095 | 18,345 | ||||||
2485 WG, 6.00%, 8/15/32 | 18,457 | 18,952 | ||||||
2575 QE, 6.00%, 2/15/33 | 7,173 | 7,362 | ||||||
2980 QA, 6.00%, 5/15/35 | 9,584 | 9,965 | ||||||
5354 AB, 6.00%, 5/25/49 | 194,669 | 200,359 | ||||||
2357 ZJ, 6.50%, 9/15/31 | 14,342 | 14,469 | ||||||
4520 HM, 6.50%, 8/15/45 | 11,954 | 12,817 | ||||||
3704 CT, 7.00%, 12/15/36 | 7,741 | 8,219 | ||||||
2238 PZ, 7.50%, 6/15/30 | 6,227 | 6,529 | ||||||
Government National Mortgage Association: |
| |||||||
2021-86 WB, 4.74%, 5/20/51 1 | 134,236 | 133,183 | ||||||
2021-104 HT, 5.50%, 6/20/51 | 169,077 | 172,358 | ||||||
2021-27 AW, 5.85%, 2/20/51 1 | 183,318 | 192,976 | ||||||
2015-80 BA, 7.00%, 6/20/45 1 | 6,527 | 6,814 | ||||||
2018-147 AM, 7.00%, 10/20/48 | 22,396 | 23,706 | ||||||
2018-160 DA, 7.00%, 11/20/48 | 21,782 | 23,006 | ||||||
2014-69 W, 7.20%, 11/20/34 1 | 10,252 | 10,724 | ||||||
2013-133 KQ, 7.30%, 8/20/38 1 | 12,303 | 12,960 | ||||||
2005-74 HA, 7.50%, 9/16/35 | 219 | 222 | ||||||
JP Morgan Mortgage Trust: | ||||||||
2021-6 A4, 2.50%, 10/25/51 1, 4 | 288,026 | 251,672 | ||||||
2021-13 A4, 2.50%, 4/25/52 1, 4 | 258,191 | 225,046 | ||||||
2021-6 A12, 5.00%, 10/25/51 1, 4 | 276,517 | 269,276 | ||||||
2021-13 A11, 5.00%, 4/25/52 1, 4 | 281,143 | 260,643 | ||||||
2022-1 A11, 5.00%, 7/25/52 1, 4 | 329,208 | 303,241 | ||||||
2022-2 A11, 5.00%, 8/25/52 1, 4 | 311,398 | 288,546 | ||||||
2023-6 A2, 6.00%, 12/26/53 1, 4 | 140,568 | 141,079 | ||||||
2023-10 A8, 6.00%, 5/25/54 1, 4 | 150,000 | 152,990 | ||||||
New Residential Mortgage Loan Trust: | ||||||||
2018-3A A1, 4.50%, 5/25/58 1, 4 | 33,126 | 32,009 | ||||||
Sequoia Mortgage Trust: | ||||||||
2020-4 A5, 2.50%, 11/25/50 1, 4 | 39,938 | 35,929 | ||||||
Vendee Mortgage Trust: | ||||||||
2008-1 B, 5.80%, 3/15/25 1 | 6,183 | 6,275 | ||||||
Wells Fargo Mortgaged Backed Securities Trust: | ||||||||
2020-5 A3, 2.50%, 9/25/50 1, 4 | 32,506 | 29,121 | ||||||
|
| |||||||
| 3,527,894 | ||||||||
|
| |||||||
| Name of Issuer | Principal Amount ($) | Fair Value ($) | ||||||
Corporate Bonds - 11.2% | ||||||||
American Tower Trust, 5.49%, 3/15/28 4 | 150,000 | 152,258 | ||||||
Bank of America Corp., 5.20%, 4/25/29 1 | 50,000 | 50,350 | ||||||
Bank of New York Mellon Corp., 6.47%, 10/25/34 1 | 175,000 | 194,113 | ||||||
Booz Allen Hamilton, Inc., 5.95%, 8/4/33 | 75,000 | 79,230 | ||||||
British Airways 2020-1 Class B Pass Through Trust, 8.38%, 11/15/28 4 | 39,707 | 41,032 | ||||||
Charles Stark Draper Lab., Inc., 4.39%, 9/1/48 | 100,000 | 91,004 | ||||||
Consolidated Edison Co. of New York, Inc., 5.90%, 11/15/53 | 175,000 | 193,205 | ||||||
Consumers Energy Co., 4.35%, 8/31/64 | 50,000 | 41,780 | ||||||
CVS Health Corp., 5.05%, 3/25/48 | 200,000 | 187,925 | ||||||
CVS Pass-Through Trust, 7.51%, 1/10/32 4 | 136,327 | 143,508 | ||||||
Delta Air Lines 2015-1 Class AA Pass Through Trust, 3.63%, 7/30/27 | 114,005 | 107,421 | ||||||
Dow Chemical Co., 6.90%, 5/15/53 | 175,000 | 211,091 | ||||||
Duke Energy Florida, LLC: | ||||||||
2.54%, 9/1/29 | 42,928 | 40,196 | ||||||
2.86%, 3/1/33 | 120,000 | 105,547 | ||||||
Entergy Louisiana, LLC, 4.95%, 1/15/45 | 200,000 | 183,833 | ||||||
Equifax, Inc., 7.00%, 7/1/37 | 116,000 | 129,774 | ||||||
Evergy Kansas Central, Inc., 5.90%, 11/15/33 | 175,000 | 187,544 | ||||||
Exelon Corp., 7.60%, 4/1/32 | 75,000 | 85,270 | ||||||
Fairfax Financial Holdings, 7.75%, 7/15/37 | 150,000 | 163,720 | ||||||
First-Citizens Bank & Trust Co. | 175,000 | 168,941 | ||||||
GATX Corp., 6.90%, 5/1/34 | 175,000 | 192,974 | ||||||
Genuine Parts Co., 1.88%, 11/1/30 | 200,000 | 162,744 | ||||||
Georgia-Pacific, LLC, 8.88%, 5/15/31 | 150,000 | 187,044 | ||||||
Halliburton Co., 7.60%, 8/15/96 4 | 75,000 | 90,951 | ||||||
J M Smucker Co., 6.50%, 11/15/53 | 175,000 | 202,765 | ||||||
JPMorgan Chase & Co., 4.59%, 4/26/33 1 | 100,000 | 96,790 | ||||||
Kellanova, 7.45%, 4/1/31 | 125,000 | 143,394 | ||||||
KeyCorp, 2.55%, 10/1/29 | 225,000 | 191,607 | ||||||
Leidos, Inc., 7.13%, 7/1/32 | 50,000 | 54,812 | ||||||
Louisville Gas & Electric Co., 5.45%, 4/15/33 | 50,000 | 52,176 | ||||||
Lowe’s Cos., Inc., 5.85%, 4/1/63 | 200,000 | 210,371 | ||||||
Morgan Stanley, 5.12%, 2/1/29 1 | 100,000 | 100,540 | ||||||
Nationwide Mutual Insurance Co. | 195,000 | 194,808 | ||||||
Northern Trust Corp. (Subordinated), 3 Mo. | 250,000 | 231,299 | ||||||
Polar Tankers, Inc., 5.95%, 5/10/37 4 | 93,479 | 96,754 | ||||||
SBA Tower Trust, 6.60%, 1/15/28 4 | 145,000 | 149,130 | ||||||
Security Benefit Life Insurance Co. (Subordinated), 7.45%, 10/1/33 4 | 100,000 | 93,907 | ||||||
State Street Corp., 5.16%, 5/18/34 1 | 175,000 | 176,639 | ||||||
Tennessee Gas Pipeline, LLC, 7.00%, 10/15/28 | 213,000 | 230,827 | ||||||
Textron, Inc., 6.10%, 11/15/33 | 175,000 | 186,863 | ||||||
Truist Financial Corp., 7.16%, 10/30/29 1 | 175,000 | 189,203 | ||||||
Union Electric Co., 4.00%, 4/1/48 | 100,000 | 82,094 | ||||||
United Airlines 2019-2 Class AA Pass Through Trust, 2.70%, 5/1/32 | 125,021 | 105,854 | ||||||
Unum Group, 7.25%, 3/15/28 | 25,000 | 26,639 | ||||||
US Bancorp, 5.78%, 6/12/29 1 | 175,000 | 179,924 | ||||||
Westlake Corp., 3.38%, 8/15/61 | 150,000 | 96,954 | ||||||
|
| |||||||
| 6,284,805 | ||||||||
|
| |||||||
See accompanying notes to financial statements.
| DECEMBER 31, 2023 | 7 | |
SCHEDULE OF INVESTMENTS (Unaudited)
December 31, 2023
Sit Balanced Fund (Continued)
| Name of Issuer | Principal Amount ($) | Fair Value ($) | ||||||
Federal Home Loan Mortgage Corporation - 0.2% |
| |||||||
7.50%, 7/1/29 | 43,060 | 44,212 | ||||||
8.50%, 5/1/31 | 47,976 | 49,663 | ||||||
|
| |||||||
| 93,875 | ||||||||
|
| |||||||
Federal National Mortgage Association - 2.9% |
| |||||||
4.50%, 7/1/52 | 319,412 | 310,057 | ||||||
4.50%, 9/1/52 | 322,934 | 313,476 | ||||||
5.00%, 1/1/30 | 139,418 | 139,678 | ||||||
5.50%, 8/1/56 | 154,726 | 160,067 | ||||||
6.00%, 7/1/41 | 128,739 | 134,370 | ||||||
6.00%, 9/1/53 | 169,555 | 172,291 | ||||||
6.00%, 10/1/53 | 344,904 | 351,008 | ||||||
6.50%, 9/1/27 | 13,754 | 14,095 | ||||||
7.00%, 1/1/32 | 4,255 | 4,248 | ||||||
7.00%, 3/1/33 | 8,278 | 8,410 | ||||||
7.00%, 12/1/38 | 6,902 | 7,007 | ||||||
8.40%, 7/15/26 | 594 | 593 | ||||||
|
| |||||||
| 1,615,300 | ||||||||
|
| |||||||
Government National Mortgage Association - 1.8% |
| |||||||
3.50%, 2/20/52 | 262,641 | 244,616 | ||||||
4.00%, 9/20/52 | 238,029 | 221,306 | ||||||
5.00%, 5/20/48 | 23,789 | 24,124 | ||||||
5.50%, 9/20/52 | 88,537 | 87,499 | ||||||
5.50%, 8/20/62 | 218,225 | 217,481 | ||||||
6.00%, 9/20/53 | 174,233 | 175,430 | ||||||
6.50%, 11/20/38 | 8,798 | 8,965 | ||||||
7.00%, 12/15/24 | 1,144 | 1,143 | ||||||
7.00%, 11/20/27 | 3,556 | 3,659 | ||||||
7.00%, 9/20/29 | 11,461 | 11,823 | ||||||
7.00%, 9/20/38 | 5,673 | 5,973 | ||||||
7.50%, 4/20/32 | 7,449 | 7,604 | ||||||
|
| |||||||
| 1,009,623 | ||||||||
|
| |||||||
Taxable Municipal Securities - 5.1% | ||||||||
Benton & Polk Sch. Dist. No. 17J G.O., 5.47%, 6/15/27 | 150,000 | 154,283 | ||||||
Chicago Park Dist., 2.53%, 1/1/34 | 235,000 | 189,347 | ||||||
CO Health Facs. Auth., 3.13%, 5/15/27 | 250,000 | 224,722 | ||||||
Colorado Edu. & Cultural Fac. Auth., 3.97%, 3/1/56 | 205,000 | 165,939 | ||||||
Coventry Local Sch. Dist., 2.20%, 11/1/29 | 200,000 | 175,064 | ||||||
LaGrange Co. Regional Utility Dist., 2.98%, 1/1/40 | 230,000 | 184,209 | ||||||
Maricopa Co. Industrial Dev. Auth., 3.50%, 7/1/44 4 | 100,000 | 76,182 | ||||||
Massachusetts Edu. Auth.: | ||||||||
4.00%, 1/1/32 | 20,000 | 19,552 | ||||||
4.41%, 7/1/34 | 15,000 | 14,681 | ||||||
4.95%, 7/1/38 | 200,000 | 192,980 | ||||||
5.95%, 7/1/44 | 150,000 | 153,890 | ||||||
MN Hsg. Fin. Agy., 2.31%, 1/1/27 | 135,000 | 125,894 | ||||||
NJ Higher Edu. Student Assit. Auth., 3.50%, 12/1/39 8 | 70,000 | 67,584 | ||||||
NY State Dormitory Auth., 2.69%, 7/1/35 | 200,000 | 161,390 | ||||||
Oregon State Fac. Auth., 2.68%, 7/1/31 | 350,000 | 289,170 | ||||||
Public Fin. Auth., 4.23%, 7/1/32 | 105,000 | 100,173 | ||||||
State of Connecticut G.O., 5.09%, 10/1/30 | 100,000 | 100,804 | ||||||
Texas Children’s Hospital, 3.37%, 10/1/29 17 | 115,000 | 109,624 | ||||||
| Name of Issuer | Principal Amount ($) | Fair Value ($) | ||||||
Utah Charter Sch. Fin. Auth., 2.40%, 10/15/27 | 205,000 | 189,432 | ||||||
VA Hsg. Dev. Auth., 2.13%, 7/25/51 | 1,254 | 952 | ||||||
WA State Hsg. Fin. Comm., 3.50%, 7/1/24 4 | 20,000 | 19,752 | ||||||
Wichita Falls, 1.65%, 9/1/28 | 145,000 | 128,714 | ||||||
|
| |||||||
| 2,844,338 | ||||||||
|
| |||||||
U.S. Treasury / Federal Agency Securities - 1.3% |
| |||||||
U.S. Treasury - 1.3% |
| |||||||
U.S. Treasury Bonds: | ||||||||
3.63%, 2/15/53 | 275,000 | 255,170 | ||||||
4.13%, 8/15/53 | 75,000 | 76,172 | ||||||
U.S. Treasury Notes 4.50%, 11/15/33 | 400,000 | 420,812 | ||||||
|
| |||||||
| 752,154 | ||||||||
|
| |||||||
Total Bonds | 16,307,350 | |||||||
|
| |||||||
| Name of Issuer | Quantity | Fair Value ($) | ||||||
Investment Companies 3.6% | ||||||||
BlackRock Credit Allocation Income Trust | 17,750 | 183,180 | ||||||
BlackRock Enhanced Government Fund | 4,174 | 40,632 | ||||||
BlackRock Income Trust, Inc. | 5,300 | 64,554 | ||||||
BlackRock Municipal Income Fund, Inc. | 2,300 | 26,772 | ||||||
BlackRock Municipal Income Trust | 2,100 | 21,147 | ||||||
BlackRock Taxable Municipal Bond Trust | 10,671 | 173,511 | ||||||
DWS Municipal Income Trust | 9,800 | 87,122 | ||||||
Eaton Vance California Municipal Bond Fund | 1,700 | 15,555 | ||||||
First Trust Mortgage Income Fund | 3,800 | 46,056 | ||||||
MFS Intermediate Income Trust | 63,700 | 170,716 | ||||||
Nuveen AMT-Free Muni Credit Income Fund | 20,900 | 247,038 | ||||||
Nuveen AMT-Free Quality Muni Income Fund | 15,100 | 166,100 | ||||||
Nuveen Multi-Market Income Fund | 13,253 | 78,325 | ||||||
Nuveen Quality Municipal Income Fund | 12,500 | 143,125 | ||||||
Nuveen Taxable Municipal Income Fund | 5,967 | 94,219 | ||||||
Putnam Master Intermediate Income Trust | 61,000 | 194,590 | ||||||
Putnam Premier Income Trust | 45,692 | 163,120 | ||||||
TCW Strategic Income Fund, Inc. | 18,000 | 82,620 | ||||||
|
| |||||||
Total Investment Companies | 1,998,382 | |||||||
|
| |||||||
Short-Term Securities - 3.5% | ||||||||
Fidelity Inst. Money Mkt. Gvt. Fund, 5.29% | 1,973,150 | 1,973,150 | ||||||
|
| |||||||
Total Investments in Securities - 99.4% |
| 55,617,548 | ||||||
Other Assets and Liabilities, net - 0.6% |
| 320,060 | ||||||
|
| |||||||
Net Assets - 100.0% | $55,937,608 | |||||||
|
| |||||||
See accompanying notes to financial statements.
| 8 | SIT MUTUAL FUNDS SEMI-ANNUAL REPORT | |
| * | Non-income producing security. |
| 1 | Variable rate security. Rate disclosed is as of December 31, 2023. Certain variable rate securities are not based on a published reference rate and spread but are determined by the issuer or agent and are based on current market conditions, or, for mortgage-backed securities, are impacted by the individual mortgages which are paying off over time. These securities do not indicate a reference rate and spread in their descriptions. |
| 4 | 144A Restricted Security. The total value of such securities as of December 31, 2023 was $3,355,186 and represented 6.0% of net assets. These securities have been determined to be liquid by the Adviser in accordance with guidelines established by the Board of Directors. |
| 8 | Securities the income from which is treated as a tax preference that is included in alternative minimum taxable income for purposes of computing federal alternative minimum tax (AMT). At December 31, 2023, 0.1% of net assets in the Fund was invested in such securities. |
| 17 | Security that is either an absolute and unconditional obligation of the United States Government or is collateralized by securities, loans, or leases guaranteed by the U.S. Government or its agencies or instrumentalities. |
ADR — American Depositary Receipt |
LLC — Limited Liability Company |
PLC — Public Limited Company |
Numeric footnotes not disclosed are not applicable to this Schedule of Investments.
A summary of the levels for the Fund’s investments as of December 31, 2023 is as follows (see Note 2 - significant accounting policies in the notes to financial statements):
Investment in Securities | ||||||||||||||||
| Level 1 | Level 2 | Level 3 | ||||||||||||||
| Quoted | Other significant | Significant | ||||||||||||||
| Prices ($) | observable inputs ($) | unobservable inputs ($) | Total ($) | |||||||||||||
Common Stocks** | 35,338,666 | — | — | 35,338,666 | ||||||||||||
Asset-Backed Securities | — | 179,361 | — | 179,361 | ||||||||||||
Collateralized Mortgage Obligations | — | 3,527,894 | — | 3,527,894 | ||||||||||||
Corporate Bonds | — | 6,284,805 | — | 6,284,805 | ||||||||||||
Federal Home Loan Mortgage Corporation | — | 93,875 | — | 93,875 | ||||||||||||
Federal National Mortgage Association | — | 1,615,300 | — | 1,615,300 | ||||||||||||
Government National Mortgage Association | — | 1,009,623 | — | 1,009,623 | ||||||||||||
Taxable Municipal Securities | — | 2,844,338 | — | 2,844,338 | ||||||||||||
U.S. Treasury / Federal Agency Securities | — | 752,154 | — | 752,154 | ||||||||||||
Investment Companies | 1,998,382 | — | — | 1,998,382 | ||||||||||||
Short-Term Securities | 1,973,150 | — | — | 1,973,150 | ||||||||||||
Total: | 39,310,198 | 16,307,350 | — | 55,617,548 | ||||||||||||
| ** | For equity securities categorized in a single level, refer to the detail above for further breakdown. |
There were no transfers into or out of level 3 during the reporting period.
See accompanying notes to financial statements.
| DECEMBER 31, 2023 | 9 | |
OBJECTIVE & STRATEGY
The objective of the Sit Dividend Growth Fund is to provide current income that exceeds the dividend yield of the S&P 500® Index and that grows over a period of years. Secondarily, the Fund seeks long-term capital appreciation.
The Fund seeks to achieve its objectives by investing, under normal market conditions, at least 80% of its net assets in dividend-paying common stocks. The Fund may invest the balance of its assets in preferred stocks, convertible bonds, U.S. Treasury securities and closed-end investment companies.
Fund Performance
The Sit Dividend Growth Fund Class I posted a +6.27% return during the 6-month period ended December 31, 2023, compared to the +8.04% return for the S&P 500® Index. The Fund’s gross dividend yield (before deducting Fund expenses) was 1.99% as of 12/31/23, compared to 1.48% for the S&P 500® Index.
Factors that Influenced the Fund’s Performance
The Fund posted positive absolute returns over the 6-month period, although it underperformed the S&P500® Index. The primary reason for the underperformance was that lower beta, dividend payers lagged the overall market. Investors embraced riskier technology stocks linked to artificial intelligence (AI), such as NVIDIA and Salesforce. A second reason for trailing performance was not owning any weight loss drug (GLP-1) producers, such as Eli Lilly, which saw strong stock appreciation. Strong stock selection in the producer manufacturing sector added to returns. Key holdings here were General Dynamics, which benefitted from strong global defense spending and Gulfstream demand, and Eaton, a beneficiary of increased utility spending and the growth of electrification. An underweight position in the consumer durables sector, specifically not owning Tesla due to the stock’s expensive valuation further enhanced performance.
Outlook and Positioning
Due to several factors, dividend-paying stocks produced their weakest relative returns in years, especially against the AI-driven rally that pushed the “Magnificent Seven” and other non-dividend-paying tech stocks much higher in 2023. Looking ahead, we see an emerging backdrop that has historically led to solid relative performance for high-quality, dividend-paying growth stocks. Key elements of our forecast include modest economic growth, lower interest rates (including fed funds rate cuts), and the likelihood of an increase in stock price volatility from exceptionally low levels. In addition to technology, early cycle and rate-sensitive sectors, such as transportation and producer manufacturing should fare well in the year ahead. We also see attractive
HYPOTHETICAL GROWTH OF $10,000
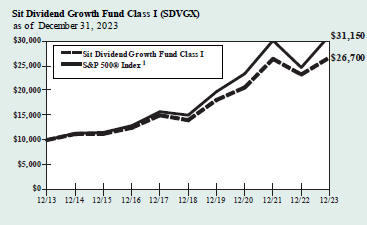
The chart above illustrates the total value of a hypothetical $10,000 investment in the Fund over the past 10 years as compared to the performance of the S&P 500® Index. Past performance does not guarantee future results. Returns include the reinvestment of distributions. The chart does not reflect the deduction of taxes that a shareholder would pay on Fund distributions or the redemption of Fund shares.
1 S&P 500® Index is an unmanaged capitalization-weighted index that measures the performance of 500 widely held common stocks of large-cap companies. It is not possible to invest directly in an index. This is the Fund’s primary index.
growth and income opportunities in diverse areas, including energy, P&C insurance, drug distributors, and select pharmaceutical companies. The sharp rise in interest rates in 2023 provided stiff competition for dividend payers from bonds, particularly for slower growth “bond proxies,” including utilities, consumer staples, and REITs. While we prefer “growthier” stocks, these low-beta sectors are cheap insurance against market volatility or a severe recession and offer earnings growth, well-above-average dividend yields, and attractive valuations.
Roger J. Sit
Kent L. Johnson
Portfolio Managers
Information on this page is unaudited.
| 10 | SIT MUTUAL FUNDS SEMI-ANNUAL REPORT | |
|
COMPARATIVE RATES OF RETURNS
as of December 31, 2023
| Sit Dividend Growth Fund | ||||||||||||
| Class I | Class S | | S&P 500® Index1 | | ||||||||
Six Month | 6.27 | % | 6.12 | % | 8.04 | % | ||||||
One Year | 14.88 | 14.62 | 26.29 | |||||||||
Five Year | 13.75 | 13.48 | 15.69 | |||||||||
Ten Year | 10.32 | 10.04 | 12.03 | |||||||||
Since Inception-Class I | 9.97 | n/a | 9.69 | |||||||||
(12/31/03) | ||||||||||||
Since Inception-Class S | n/a | 9.45 | 9.78 | |||||||||
(3/31/06) | ||||||||||||
Performance figures are historical and do not guarantee future results. Investment returns and principal value will vary, and you may have a gain or loss when you sell shares. Current performance may be lower or higher than the performance data quoted. Contact the Fund for performance data current to the most recent month-end. Returns include changes in share price as well as reinvestment of all dividends and capital gains. Returns do not reflect the deduction of the 2% redemption fee imposed if shares are redeemed or exchanged within 30 calendar days from their date of purchase. If imposed, the fee would reduce the performance quoted. Returns do not reflect the deduction of taxes that a shareholder would pay on Fund distributions or the redemption of Fund shares. Management fees and administrative expenses are included in the Fund’s performance. Returns for periods greater than one year are compounded average annual rates of return.
1 S&P 500® Index is an unmanaged capitalization-weighted index that measures the performance of 500 widely held common stocks of large-cap companies. It is not possible to invest directly in an index.
PORTFOLIO SUMMARY
Class I: | ||||||
Net Asset Value 12/31/23: | $ | 14.90 | Per Share | |||
Net Asset Value 6/30/23: | $ | 14.64 | Per Share | |||
Net Assets: | $ | 204.3 | Million | |||
Class S: | ||||||
Net Asset Value 12/31/23: | $ | 14.80 | Per Share | |||
Net Asset Value 6/30/23: | $ | 14.54 | Per Share | |||
Net Assets: | $ | 21.3 | Million | |||
Weighted Average Market Cap: | $ | 565.7 | Billion | |||
TOP 10 HOLDINGS
1. Microsoft Corp.
2. Apple, Inc.
3. Broadcom, Inc.
4. UnitedHealth Group, Inc.
5. Exxon Mobil Corp.
6. Johnson & Johnson
7. ConocoPhillips
8. JPMorgan Chase & Co.
9. Alphabet, Inc. - Class A
10. Oracle Corp.
Based on net assets as of December 31, 2023.
SECTOR ALLOCATION
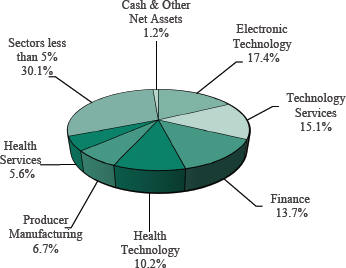
Based on net assets as of December 31, 2023.
Information on this page is unaudited.
| DECEMBER 31, 2023 | 11 | |
SCHEDULE OF INVESTMENTS (Unaudited)
December 31, 2023
Sit Dividend Growth Fund
Investments are grouped by economic sectors.
| Name of Issuer | Quantity | Fair Value ($) | ||||||
Common Stocks - 98.8% | ||||||||
Commercial Services - 2.8% | ||||||||
Booz Allen Hamilton Holding Corp. | 15,200 | 1,944,232 | ||||||
S&P Global, Inc. | 6,260 | 2,757,655 | ||||||
Sysco Corp. | 21,100 | 1,543,043 | ||||||
|
| |||||||
| 6,244,930 | ||||||||
|
| |||||||
Communications - 0.8% | ||||||||
American Tower Corp. | 8,750 | 1,888,950 | ||||||
|
| |||||||
Consumer Non-Durables - 4.9% | ||||||||
Mondelez International, Inc. | 33,675 | 2,439,080 | ||||||
NIKE, Inc. | 12,750 | 1,384,268 | ||||||
PepsiCo, Inc. | 20,975 | 3,562,394 | ||||||
Procter & Gamble Co. | 24,625 | 3,608,547 | ||||||
|
| |||||||
| 10,994,289 | ||||||||
|
| |||||||
Consumer Services - 3.2% | ||||||||
McDonald’s Corp. | 7,725 | 2,290,540 | ||||||
Starbucks Corp. | 17,600 | 1,689,776 | ||||||
Visa, Inc. | 12,010 | 3,126,803 | ||||||
|
| |||||||
| 7,107,119 | ||||||||
|
| |||||||
Electronic Technology - 17.4% | ||||||||
Analog Devices, Inc. | 9,650 | 1,916,104 | ||||||
Apple, Inc. | 69,235 | 13,329,815 | ||||||
Applied Materials, Inc. | 21,900 | 3,549,333 | ||||||
Broadcom, Inc. | 7,250 | 8,092,812 | ||||||
Cisco Systems, Inc. | 30,425 | 1,537,071 | ||||||
Garmin, Ltd. | 18,275 | 2,349,068 | ||||||
International Business Machines Corp. | 16,275 | 2,661,776 | ||||||
NVIDIA Corp. | 5,885 | 2,914,370 | ||||||
TE Connectivity, Ltd. | 20,150 | 2,831,075 | ||||||
|
| |||||||
| 39,181,424 | ||||||||
|
| |||||||
Energy Minerals - 4.2% | ||||||||
ConocoPhillips | 34,400 | 3,992,808 | ||||||
Exxon Mobil Corp. | 53,725 | 5,371,425 | ||||||
|
| |||||||
| 9,364,233 | ||||||||
|
| |||||||
Finance - 13.7% | ||||||||
Air Lease Corp. | 35,850 | 1,503,549 | ||||||
American International Group, Inc. | 33,125 | 2,244,219 | ||||||
Ameriprise Financial, Inc. | 4,550 | 1,728,227 | ||||||
Axis Capital Holdings, Ltd. | 26,450 | 1,464,537 | ||||||
Bank of New York Mellon Corp. | 53,750 | 2,797,687 | ||||||
Carlyle Group, Inc. | 36,500 | 1,485,185 | ||||||
Chubb, Ltd. | 1,325 | 299,450 | ||||||
Everest Group, Ltd. | 7,290 | 2,577,598 | ||||||
Goldman Sachs Group, Inc. | 5,600 | 2,160,312 | ||||||
Intercontinental Exchange, Inc. | 21,075 | 2,706,662 | ||||||
JPMorgan Chase & Co. | 23,300 | 3,963,330 | ||||||
Morgan Stanley | 19,860 | 1,851,945 | ||||||
Realty Income Corp. | 57,653 | 3,310,435 | ||||||
Reinsurance Group of America, Inc. | 17,950 | 2,903,951 | ||||||
|
| |||||||
| 30,997,087 | ||||||||
|
| |||||||
Health Services - 5.6% | ||||||||
Cardinal Health, Inc. | 18,975 | 1,912,680 | ||||||
HCA Healthcare, Inc. | 6,630 | 1,794,609 | ||||||
Quest Diagnostics, Inc. | 20,525 | 2,829,987 | ||||||
| Name of Issuer | Quantity | Fair Value ($) | ||||||
UnitedHealth Group, Inc. | 11,790 | 6,207,081 | ||||||
|
| |||||||
| 12,744,357 | ||||||||
|
| |||||||
Health Technology - 10.2% | ||||||||
Abbott Laboratories | 28,885 | 3,179,372 | ||||||
AbbVie, Inc. | 9,325 | 1,445,095 | ||||||
AstraZeneca, PLC, ADR | 51,225 | 3,450,004 | ||||||
Gilead Sciences, Inc. | 35,190 | 2,850,742 | ||||||
Johnson & Johnson | 32,125 | 5,035,272 | ||||||
Medtronic, PLC | 22,425 | 1,847,371 | ||||||
Novo Nordisk A/S, ADR | 13,100 | 1,355,195 | ||||||
Thermo Fisher Scientific, Inc. | 2,445 | 1,297,782 | ||||||
Zimmer Biomet Holdings, Inc. | 21,325 | 2,595,253 | ||||||
|
| |||||||
| 23,056,086 | ||||||||
|
| |||||||
Industrial Services - 2.1% | ||||||||
Waste Management, Inc. | 14,900 | 2,668,590 | ||||||
Williams Cos., Inc. | 57,690 | 2,009,343 | ||||||
|
| |||||||
| 4,677,933 | ||||||||
|
| |||||||
Non-Energy Minerals - 0.5% | ||||||||
Glencore, PLC, ADR | 103,310 | 1,237,654 | ||||||
|
| |||||||
Process Industries - 1.2% | ||||||||
Air Products & Chemicals, Inc. | 10,100 | 2,765,380 | ||||||
|
| |||||||
Producer Manufacturing - 6.7% | ||||||||
Eaton Corp., PLC | 9,750 | 2,347,995 | ||||||
Emerson Electric Co. | 28,675 | 2,790,938 | ||||||
General Dynamics Corp. | 12,650 | 3,284,825 | ||||||
Honeywell International, Inc. | 13,175 | 2,762,929 | ||||||
Lockheed Martin Corp. | 1,375 | 623,205 | ||||||
Parker-Hannifin Corp. | 3,635 | 1,674,645 | ||||||
Siemens AG, ADR | 18,550 | 1,735,167 | ||||||
|
| |||||||
| 15,219,704 | ||||||||
|
| |||||||
Retail Trade - 2.9% | ||||||||
Home Depot, Inc. | 7,740 | 2,682,297 | ||||||
Target Corp. | 6,500 | 925,730 | ||||||
TJX Cos., Inc. | 30,160 | 2,829,310 | ||||||
|
| |||||||
| 6,437,337 | ||||||||
|
| |||||||
Technology Services - 15.1% | ||||||||
Accenture, PLC | 10,250 | 3,596,827 | ||||||
Adobe, Inc. * | 5,025 | 2,997,915 | ||||||
Alphabet, Inc. - Class A * | 27,790 | 3,881,985 | ||||||
Intuit, Inc. | 4,890 | 3,056,397 | ||||||
Microsoft Corp. | 44,700 | 16,808,988 | ||||||
Oracle Corp. | 35,425 | 3,734,858 | ||||||
|
| |||||||
| 34,076,970 | ||||||||
|
| |||||||
Transportation - 3.6% | ||||||||
FedEx Corp. | 13,725 | 3,472,013 | ||||||
TFI International, Inc. | 11,100 | 1,509,378 | ||||||
Union Pacific Corp. | 12,375 | 3,039,548 | ||||||
|
| |||||||
| 8,020,939 | ||||||||
|
| |||||||
Utilities - 3.9% | ||||||||
DTE Energy Co. | 22,875 | 2,522,198 | ||||||
NiSource, Inc. | 106,575 | 2,829,566 | ||||||
See accompanying notes to financial statements.
| 12 | SIT MUTUAL FUNDS SEMI-ANNUAL REPORT | |
| Name of Issuer | Quantity | Fair Value ($) | ||||||
PPL Corp. | 126,600 | 3,430,860 | ||||||
|
| |||||||
| 8,782,624 | ||||||||
|
| |||||||
Total Common Stocks | 222,797,016 | |||||||
|
| |||||||
Short-Term Securities - 1.0% | ||||||||
Fidelity Inst. Money Mkt. Gvt. Fund, 5.29% | 2,300,344 | 2,300,344 | ||||||
|
| |||||||
Total Investments in Securities - 99.8% | 225,097,360 | |||||||
Other Assets and Liabilities, net - 0.2% | 492,872 | |||||||
|
| |||||||
Net Assets - 100.0% | $ | 225,590,232 | ||||||
|
| |||||||
| * | Non-income producing security. |
ADR — American Depositary Receipt |
PLC — Public Limited Company |
Numeric footnotes not disclosed are not applicable to this Schedule of Investments.
A summary of the levels for the Fund’s investments as of December 31, 2023 is as follows (see Note 2 - significant accounting policies in the notes to financial statements):
| Investment in Securities | ||||||||||||||||
Level 1 Quoted Prices ($) | Level 2 Other significant | Level 3 Significant unobservable inputs ($) | Total ($) | |||||||||||||
Common Stocks** | 222,797,016 | — | — | 222,797,016 | ||||||||||||
Short-Term Securities | 2,300,344 | — | — | 2,300,344 | ||||||||||||
Total: | 225,097,360 | — | — | 225,097,360 | ||||||||||||
| ** | For equity securities categorized in a single level, refer to the detail above for further breakdown. |
There were no transfers into or out of level 3 during the reporting period.
See accompanying notes to financial statements.
| DECEMBER 31, 2023 | 13 | |
OBJECTIVE & STRATEGY
The objective of the Sit Global Dividend Growth Fund is to provide current income that exceeds the dividend yield of the MSCI World Index and that grows over a period of years. Secondarily, the Fund seeks long-term capital appreciation. The Fund seeks to achieve its objectives by investing, under normal market conditions, at least 80% of its net assets in dividend-paying common stocks issued by U.S. and foreign companies. The Fund may invest the balance of its assets in preferred stocks, convertible bonds, U.S. Treasury securities and closed-end investment companies.
Fund Performance
The Sit Global Dividend Growth Fund Class I shares provided a return of +8.23% during the 6-month period ended December 31, 2023, compared to the return of the MSCI World Index of +7.56%. The Fund’s gross dividend yield (before deducting Fund expenses) was 1.91% as of December 31, 2023, compared to 1.94% for the MSCI World Index.
Factors that Influenced the Fund’s Performance
The Fund recorded strong absolute returns during the 6-month period and outperformed the MSCI World Index. Strong overall stock selection was partially offset by a negative allocation effect, as the highest P/E stocks and the lowest yielding and non-yielding stocks outperformed, and these issues were underweighted in the Fund. The Fund’s holdings in the financial services sector performed well on an absolute basis, helped by an overweight position and positive returns relative to the benchmark sector. Here, strong stock performances in Partners Group Holdings AG and Goldman Sachs augmented returns. The technology sectors also contributed favorably to Fund returns during the period, led by Broadcom, Logitech International S.A., and Atlassian. Performance was also enhanced by stock selection in the capital goods sector, where the Fund held BAE Systems plc and Trane Technologies plc. The biggest detractor to the Fund’s performance during the period was holdings in the pharmaceuticals biotechnology & life sciences sector. The Fund did not hold stocks with exposure to GLP-1 drugs used to treat Type 2 diabetes and prescribed for weight loss, which outperformed during the period. Company-specific issues also hurt the Fund’s holdings in Lonza Group AG and Astellas Pharma. In addition, exposure to the food beverage & tobacco sector hurt returns, due to the “risk-on” investment mode that prevailed during much of the period. Geographically, the Fund’s exposure to Asia/Pacific ex Japan, Non-Euroland, and Euroland added value during the period due to strong stock selection, while its exposure to North America detracted from performance.
Outlook and Positioning
Still-high economic uncertainty, elevated policy/geopolitical risks, and “fair” equity valuations support our quality bias within a better environment for stock pickers in 2024. We generally maintain positions in the most attractive “Magnificent Seven” stocks but also see compelling opportunities in other technology segments, including semiconductors, software/services, and cybersecurity. Sentiment is also broadly improving for financial stocks. Given pent-up demand for initial public
HYPOTHETICAL GROWTH OF $10,000
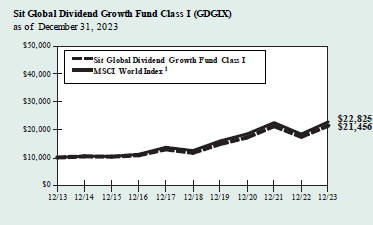
The chart above illustrates the total value of a hypothetical $10,000 investment in the Fund over the past 10 years as compared to the performance of the MSCI World Index. Past performance does not guarantee future results. Returns include the reinvestment of distributions. The chart does not reflect the deduction of taxes that a shareholder would pay on Fund distributions or the redemption of Fund shares.
1 The MSCI World Index is a free float-adjusted market capitalization weighted index that is designed to measure the equity market performance of developed markets. It is not possible to invest directly in an index.
offerings, debt issuance, and M&A, we see the most attractive opportunities for a strong rebound in capital markets businesses. We also see an emerging backdrop that has historically led to solid relative performance for high-quality, dividend-paying growth stocks. In addition to the groups noted above, we see attractive growth and income opportunities in diverse areas, including energy, P&C insurance, drug distributors, and select pharmaceutical companies. Internationally, we remain positive on equities in China, South Korea, Singapore, India, Australia, Mexico, and Brazil. We favor high-quality industries with improving fundamentals, like life insurance, Macau gaming, and some internet names. At the same time, we are keeping defensive exposure in consumer staples, healthcare, and utilities.
Roger J. Sit Raymond E. Sit
Kent L. Johnson
Portfolio Managers
Information on this page is unaudited.
| 14 | SIT MUTUAL FUNDS SEMI-ANNUAL REPORT | |
|
COMPARATIVE RATES OF RETURNS
as of December 31, 2023 | ||||||
| Sit Global Dividend Growth Fund | ||||||||||||
| Class I | Class S | | MSCI World Index | 1 | ||||||||
Six Month | 8.23% | 8.14 | % | 7.56 | % | |||||||
One Year | 23.12 | 22.78 | 23.79 | |||||||||
Five Year | 12.88 | 12.60 | 12.80 | |||||||||
Ten Year | 7.93 | 7.66 | 8.60 | |||||||||
Since Inception (9/30/08) | 9.16 | 8.88 | 8.75 | |||||||||
Performance figures are historical and do not guarantee future results. Investment returns and principal value will vary, and you may have a gain or loss when you sell shares. Current performance may be lower or higher than the performance data quoted. Contact the Fund for performance data current to the most recent month-end. Returns include changes in share price as well as reinvestment of all dividends and capital gains. Returns do not reflect the deduction of the 2% redemption fee imposed if shares are redeemed or exchanged within 30 calendar days from their date of purchase. If imposed, the fee would reduce the performance quoted. Returns do not reflect the deduction of taxes that a shareholder would pay on Fund distributions or the redemption of Fund shares. Management fees and administrative expenses are included in the Fund’s performance. Returns for periods greater than one year are compounded average annual rates of return.
1 The MSCI World Index is a free float-adjusted market capitalization weighted index that is designed to measure the equity market performance of developed markets. It is not possible to invest directly in an index.
| PORTFOLIO SUMMARY | ||||||||
| Class I: | ||||||||
Net Asset Value 12/31/23: | $24.41 | Per Share | ||||||
Net Asset Value 6/30/23: | $22.75 | Per Share | ||||||
Net Assets: | $44.1 | Million | ||||||
| Class S: | ||||||||
Net Asset Value 12/31/23: | $24.39 | Per Share | ||||||
Net Asset Value 6/30/23: | $22.71 | Per Share | ||||||
Net Assets: | $4.2 | Million | ||||||
Weighted Average Market Cap: | $625.7 | Billion | ||||||
TOP 10 HOLDINGS
1. Microsoft Corp.
2. Apple, Inc.
3. Broadcom, Inc.
4. Shell, PLC, ADR
5. Applied Materials, Inc.
6. Alphabet, Inc. - Class A
7. JPMorgan Chase & Co.
8. Accenture, PLC
9. Johnson & Johnson
10. BAE Systems, PLC
Based on net assets as of December 31, 2023.
SECTOR ALLOCATION
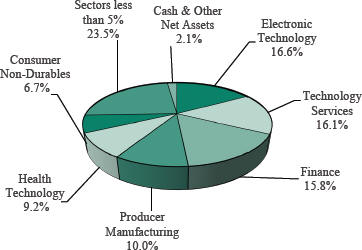
Based on net assets as of December 31, 2023.
Information on this page is unaudited.
| DECEMBER 31, 2023 | 15 | |
SCHEDULE OF INVESTMENTS (Unaudited)
December 31, 2023
Sit Global Dividend Growth Fund
Investments are grouped by geographic region
| Name of Issuer | Quantity | Fair Value ($) | ||||||
Common Stocks - 97.9% | ||||||||
Asia - 6.2% | ||||||||
Australia - 3.5% | ||||||||
Atlassian Corp. * | 3,445 | 819,428 | ||||||
BHP Group, Ltd. ADR | 6,010 | 410,543 | ||||||
Macquarie Group, Ltd. | 3,810 | 476,763 | ||||||
|
| |||||||
| 1,706,734 | ||||||||
|
| |||||||
Japan - 1.7% | ||||||||
Astellas Pharma, Inc. | 29,200 | 349,157 | ||||||
Recruit Holdings Co., Ltd. | 10,600 | 448,282 | ||||||
|
| |||||||
| 797,439 | ||||||||
|
| |||||||
Singapore - 1.0% | ||||||||
Singapore Technologies Engineering, Ltd. | 155,000 | 456,867 | ||||||
|
| |||||||
Europe - 32.9% | ||||||||
France - 0.7% | ||||||||
Safran SA, ADR | 7,520 | 331,858 | ||||||
|
| |||||||
Germany - 5.7% | ||||||||
Allianz SE, ADR | 34,190 | 912,531 | ||||||
Deutsche Post AG | 3,960 | 196,090 | ||||||
Infineon Technologies AG | 6,275 | 261,851 | ||||||
Muenchener Rueckversicherungs AG | 1,470 | 608,715 | ||||||
Siemens AG | 4,250 | 797,229 | ||||||
|
| |||||||
| 2,776,416 | ||||||||
|
| |||||||
Ireland - 4.7% | ||||||||
Accenture, PLC | 3,285 | 1,152,739 | ||||||
Linde, PLC | 1,445 | 593,476 | ||||||
Trane Technologies, PLC | 2,125 | 518,288 | ||||||
|
| |||||||
| 2,264,503 | ||||||||
|
| |||||||
Spain - 1.6% | ||||||||
Iberdrola SA | 59,010 | 773,260 | ||||||
|
| |||||||
Switzerland - 6.4% | ||||||||
Chubb, Ltd. | 2,590 | 585,340 | ||||||
Logitech International SA | 4,150 | 394,499 | ||||||
Lonza Group AG | 930 | 391,107 | ||||||
Nestle SA | 5,935 | 688,094 | ||||||
Partners Group Holding AG | 705 | 1,016,783 | ||||||
|
| |||||||
| 3,075,823 | ||||||||
|
| |||||||
United Kingdom - 13.8% | ||||||||
AstraZeneca, PLC, ADR | 15,040 | 1,012,944 | ||||||
BAE Systems, PLC | 72,955 | 1,032,677 | ||||||
Compass Group, PLC | 14,170 | 387,606 | ||||||
Diageo, PLC, ADR | 4,125 | 600,848 | ||||||
Glencore, PLC, ADR | 24,620 | 294,948 | ||||||
London Stock Exchange Group, PLC | 6,715 | 793,787 | ||||||
Man Group, PLC | 216,290 | 641,264 | ||||||
RELX, PLC | 14,120 | 558,354 | ||||||
Shell, PLC, ADR | 20,055 | 1,319,619 | ||||||
|
| |||||||
| 6,642,047 | ||||||||
|
| |||||||
North America - 58.8% | ||||||||
United States - 58.8% | ||||||||
Abbott Laboratories | 7,230 | 795,806 | ||||||
Alphabet, Inc. - Class A * | 8,790 | 1,227,875 | ||||||
| Name of Issuer | Quantity | Fair Value ($) | ||||||
Apple, Inc. | 18,220 | 3,507,897 | ||||||
Applied Materials, Inc. | 7,985 | 1,294,129 | ||||||
Arthur J Gallagher & Co. | 3,685 | 828,683 | ||||||
Broadcom, Inc. | 1,785 | 1,992,506 | ||||||
Cheniere Energy, Inc. | 2,830 | 483,109 | ||||||
ConocoPhillips | 4,025 | 467,182 | ||||||
Constellation Brands, Inc. | 2,690 | 650,307 | ||||||
FedEx Corp. | 1,900 | 480,643 | ||||||
Gilead Sciences, Inc. | 2,665 | 215,892 | ||||||
Goldman Sachs Group, Inc. | 1,370 | 528,505 | ||||||
Home Depot, Inc. | 2,490 | 862,909 | ||||||
Honeywell International, Inc. | 3,130 | 656,392 | ||||||
Johnson & Johnson | 6,765 | 1,060,346 | ||||||
JPMorgan Chase & Co. | 7,180 | 1,221,318 | ||||||
Lockheed Martin Corp. | 1,525 | 691,191 | ||||||
McDonald’s Corp. | 1,820 | 539,648 | ||||||
Microsoft Corp. | 10,475 | 3,939,019 | ||||||
Mondelez International, Inc. | 6,940 | 502,664 | ||||||
NVIDIA Corp. | 1,150 | 569,503 | ||||||
Otis Worldwide Corp. | 3,785 | 338,644 | ||||||
PepsiCo, Inc. | 4,765 | 809,288 | ||||||
Salesforce, Inc. * | 705 | 185,514 | ||||||
Sherwin-Williams Co. | 1,835 | 572,336 | ||||||
Thermo Fisher Scientific, Inc. | 1,145 | 607,755 | ||||||
Union Pacific Corp. | 3,960 | 972,655 | ||||||
UnitedHealth Group, Inc. | 1,585 | 834,455 | ||||||
Waste Management, Inc. | 4,980 | 891,918 | ||||||
WEC Energy Group, Inc. | 6,010 | 505,862 | ||||||
Williams Cos., Inc. | 4,490 | 156,387 | ||||||
|
| |||||||
| 28,390,338 | ||||||||
|
| |||||||
Total Common Stocks | 47,215,285 | |||||||
|
| |||||||
Short-Term Securities - 2.0% | ||||||||
Fidelity Inst. Money Mkt. Gvt. Fund, 5.29% | 989,060 | 989,060 | ||||||
|
| |||||||
Total Investments in Securities - 99.9% | 48,204,345 | |||||||
Other Assets and Liabilities, net - 0.1% | 66,411 | |||||||
|
| |||||||
Net Assets - 100.0% | $ | 48,270,756 | ||||||
|
| |||||||
| * | Non-income producing security. |
ADR — American Depositary Receipt |
PLC — Public Limited Company |
Numeric footnotes not disclosed are not applicable to this Schedule of Investments.
See accompanying notes to financial statements.
| 16 | SIT MUTUAL FUNDS SEMI-ANNUAL REPORT | |
A summary of the levels for the Fund’s investments as of December 31, 2023 is as follows (see Note 2 - significant accounting policies in the notes to financial statements):
| Investment in Securities | ||||||||||||||||
| Level 1 | Level 2 | Level 3 | ||||||||||||||
| Quoted | Other significant | Significant | ||||||||||||||
| Prices ($) | observable inputs ($) | unobservable inputs ($) | Total ($) | |||||||||||||
Common Stocks | ||||||||||||||||
Australia | 1,706,734 | — | — | 1,706,734 | ||||||||||||
France | 331,858 | — | — | 331,858 | ||||||||||||
Germany | 2,776,416 | — | — | 2,776,416 | ||||||||||||
Ireland | 2,264,503 | — | — | 2,264,503 | ||||||||||||
Japan | 797,439 | — | — | 797,439 | ||||||||||||
Singapore | 456,867 | — | — | 456,867 | ||||||||||||
Spain | 773,260 | — | — | 773,260 | ||||||||||||
Switzerland | 3,075,823 | — | — | 3,075,823 | ||||||||||||
United Kingdom | 6,642,047 | — | — | 6,642,047 | ||||||||||||
United States | 28,390,338 | — | — | 28,390,338 | ||||||||||||
Short-Term Securities | 989,060 | — | — | 989,060 | ||||||||||||
Total: | 48,204,345 | — | — | 48,204,345 | ||||||||||||
Level 1 securities of foreign issuers are primarily American Depositary Receipts (ADRs), Public Limited Companies (PLCs) or Global Depositary Receipts (GDRs). There were no transfers into or out of level 3 during the reporting period.
See accompanying notes to financial statements.
| DECEMBER 31, 2023 | 17 | |
OBJECTIVE & STRATEGY
The objective of the Sit Large Cap Growth Fund is to maximize long-term capital appreciation. The Fund pursues this objective by investing, under normal market conditions, at least 80% of its net assets in the common stocks of domestic growth companies with capitalizations of $5 billion or more at the time of purchase.
Fund Performance
The Sit Large Cap Growth Fund’s return was +10.46% during the 6-month period ended December 31, 2023, compared to a +10.59% return for the Russell 1000® Growth Index. The S&P 500® Index return for the period was +8.04%.
Factors that Influenced the Fund’s Performance
The Fund posted strong, positive returns, that were in line with the Russell 1000® Growth Index during the period. The largest contributor to positive performance was an underweight allocation and stock selection in the consumer durables sector, where the Fund’s holdings (+27% sector return) outperformed the benchmark’s return (-5%). Key holdings here were Yeti and Activision Blizzard, which was acquired by Microsoft. The Fund was also helped by strong stock selection in the electronic technology sector. Its position in Broadcom, which benefited from increasing spending surrounding artificial intelligence, was a key holding. Palo Alto Networks was another important holding in this sector, as the company continues to benefit from strong cybersecurity spending. Finally, stock selection in the retail trade sector augmented returns. Holdings here were supported by a resilient consumer, with Lululemon representing one of the Fund’s strongest holdings during the period. While being underweight the health technology sector helped returns, stock selection in this sector detracted from performance. An overweight position in the consumer non-durables sector and stock selection within the sector also detracted from returns.
Outlook and Positioning
Investors entered 2023 in full “risk-on” mode, hopeful that the Federal Reserve would begin cutting rates by midyear and the economy would achieve a soft landing (or only a mild recession). Yet, stronger-than-expected inflation and jobs data dashed those hopes in February, and investors became fearful the Fed would continue tightening, which caused a rotation to “risk-off.” Equity investors repeated several iterations of this pattern during the year, but enthusiasm for artificial intelligence (AI) companies remained a prominent theme. The AI craze drove extraordinary gains for a handful of stocks dubbed the “Magnificent Seven” (M7) – Alphabet, Amazon, Apple, Meta, Microsoft, Nvidia, and Tesla. These seven stocks generated a cap-weighted price return of +76.8% in 2023, while the other 493 stocks in the S&P 500® Index (as a group) returned +11.5%. Strong relative earnings growth explains much of the
HYPOTHETICAL GROWTH OF $10,000
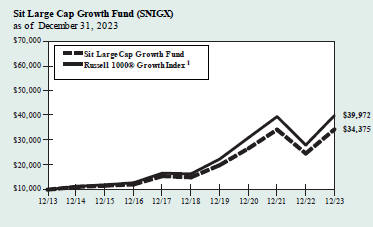
The chart above illustrates the total value of a hypothetical $10,000 investment in the Fund over the past 10 years as compared to the performance of the Russell 1000® Growth Index. Past performance does not guarantee future results. Returns include the reinvestment of distributions. The chart does not reflect the deduction of taxes that a shareholder would pay on Fund distributions or the redemption of Fund shares.
1 Russell 1000® Growth Index is an unmanaged index that measures the performance of those Russell 1000 Index companies with higher price-to-book ratios and higher forecasted growth values. It is not possible to invest directly in an index. This is the Fund’s primary index.
M7’s stock price outperformance in 2023, though valuation multiple expansion also played a role. However, given comparatively tepid earnings expectations and attractive valuations for many other companies, we believe the tide may shift in favor of the “other 493” in the S&P 500®. Still-high economic uncertainty, elevated policy/geopolitical risks, and “fair” equity valuations support our quality bias within a better environment for stock pickers in 2024. We generally maintain positions in the most attractive M7 stocks but also see compelling opportunities in other technology segments, including semiconductors, software/services, and cybersecurity. In addition to technology, early cycle and rate-sensitive sectors should fare well in the year ahead. Transportation companies, for example, have been struggling with excess customer inventories and cost pressures, but pricing has remained solid and the freight backdrop is set to rebound in 2024. Sentiment is also broadly improving for financial stocks. We see the most attractive opportunities for a strong rebound in capital markets businesses, given pent-up demand for initial public offerings, debt issuance, and M&A.
Roger J. Sit
Ronald D. Sit
Portfolio Managers
| 18 | SIT MUTUAL FUNDS SEMI-ANNUAL REPORT | |
|
COMPARATIVE RATES OF RETURNS
as of December 31, 2023
| Sit Large Cap Growth Fund | Russell 1000® Growth Index1 | Russell 1000® Index2 | ||||||||||
Six Month | 10.46 | % | 10.59% | 8.44 | % | |||||||
One Year | 39.69 | 42.68 | 26.53 | |||||||||
Five Year | 18.06 | 19.50 | 15.52 | |||||||||
Ten Year | 13.14 | 14.86 | 11.80 | |||||||||
Since Inception 3 | 10.78 | 12.00 | 11.92 | |||||||||
(9/2/82) | ||||||||||||
Performance figures are historical and do not guarantee future results. Investment returns and principal value will vary, and you may have a gain or loss when you sell shares. Current performance may be lower or higher than the performance data quoted. Contact the Fund for performance data current to the most recent month-end. Returns include changes in share price as well as reinvestment of all dividends and capital gains. Returns do not reflect the deduction of the 2% redemption fee imposed if shares are redeemed or exchanged within 30 calendar days from their date of purchase. If imposed, the fee would reduce the performance quoted. Returns do not reflect the deduction of taxes that a shareholder would pay on Fund distributions or the redemption of Fund shares. Management fees and administrative expenses are included in the Fund’s performance. Returns for periods greater than one year are compounded average annual rates of return.
1 Russell 1000® Growth Index is an unmanaged index that measures the performance of those Russell 1000 Index companies with higher price-to-book ratios and higher forecasted growth values. It is not possible to invest directly in an index.
2 Russell 1000® Index is an unmanaged index that measures the performance of approximately 1,000 of the largest U.S. companies by market capitalization.
3 On 6/6/93, the Fund’s investment objective changed to allow for a portfolio of 100% stocks. Prior to that time, the portfolio was required to contain no more than 80% stocks.
PORTFOLIO SUMMARY
Net Asset Value 12/31/23: | $63.18 Per Share | |
Net Asset Value 6/30/23: | $58.26 Per Share | |
Net Assets: | $176.7 Million | |
Weighted Average Market Cap: | $1043.2 Billion |
TOP HOLDINGS
| 1. | Microsoft Corp. | |||
| 2. | Apple, Inc. | |||
| 3. | Alphabet, Inc. | |||
| 4. | NVIDIA Corp. | |||
| 5. | Amazon.com, Inc. | |||
| 6. | Broadcom, Inc. | |||
| 7. | UnitedHealth Group, Inc. | |||
| 8. | salesforce.com, Inc. | |||
| 9. | Adobe, Inc. | |||
| 10. | Applied Materials, Inc. | |||
Based on net assets as of December 31, 2023.
SECTOR ALLOCATION
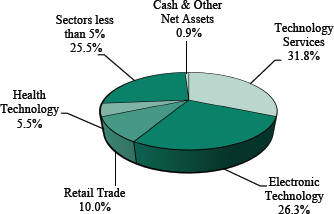
Based on net assets as of December 31, 2023.
| DECEMBER 31, 2023 | 19 | |
SCHEDULE OF INVESTMENTS (Unaudited)
December 31, 2023
Sit Large Cap Growth Fund
Investments are grouped by economic sectors.
| Name of Issuer | Quantity | Fair Value ($) | ||||||
Common Stocks - 99.1% | ||||||||
Consumer Durables - 0.5% | ||||||||
YETI Holdings, Inc. * | 17,000 | 880,260 | ||||||
|
| |||||||
Consumer Non-Durables - 3.1% | ||||||||
Constellation Brands, Inc. | 7,425 | 1,794,994 | ||||||
Mondelez International, Inc. | 12,850 | 930,726 | ||||||
NIKE, Inc. | 9,050 | 982,558 | ||||||
PepsiCo, Inc. | 10,000 | 1,698,400 | ||||||
|
| |||||||
| 5,406,678 | ||||||||
|
| |||||||
Consumer Services - 3.1% | ||||||||
McDonald’s Corp. | 6,650 | 1,971,791 | ||||||
Visa, Inc. | 13,650 | 3,553,778 | ||||||
|
| |||||||
| 5,525,569 | ||||||||
|
| |||||||
Electronic Technology - 26.3% | ||||||||
Apple, Inc. | 110,825 | 21,337,137 | ||||||
Applied Materials, Inc. | 22,175 | 3,593,902 | ||||||
Arista Networks, Inc. * | 3,750 | 883,163 | ||||||
Broadcom, Inc. | 7,075 | 7,897,469 | ||||||
NVIDIA Corp. | 20,250 | 10,028,205 | ||||||
Palo Alto Networks, Inc. * | 9,225 | 2,720,268 | ||||||
|
| |||||||
| 46,460,144 | ||||||||
|
| |||||||
Energy Minerals - 1.8% | ||||||||
Chevron Corp. | 2,100 | 313,236 | ||||||
ConocoPhillips | 24,600 | 2,855,322 | ||||||
|
| |||||||
| 3,168,558 | ||||||||
|
| |||||||
Finance - 2.2% | ||||||||
Chubb, Ltd. | 5,050 | 1,141,300 | ||||||
Goldman Sachs Group, Inc. | 5,150 | 1,986,715 | ||||||
JPMorgan Chase & Co. | 4,900 | 833,490 | ||||||
|
| |||||||
| 3,961,505 | ||||||||
|
| |||||||
Health Services - 4.3% | ||||||||
Centene Corp. * | 16,425 | 1,218,899 | ||||||
HCA Healthcare, Inc. | 4,125 | 1,116,555 | ||||||
UnitedHealth Group, Inc. | 10,125 | 5,330,509 | ||||||
|
| |||||||
| 7,665,963 | ||||||||
|
| |||||||
Health Technology - 5.5% | ||||||||
Abbott Laboratories | 15,500 | 1,706,085 | ||||||
Dexcom, Inc. * | 22,000 | 2,729,980 | ||||||
Gilead Sciences, Inc. | 19,550 | 1,583,746 | ||||||
Johnson & Johnson | 6,150 | 963,951 | ||||||
Thermo Fisher Scientific, Inc. | 5,250 | 2,786,647 | ||||||
|
| |||||||
| 9,770,409 | ||||||||
|
| |||||||
Industrial Services - 1.3% | ||||||||
Cheniere Energy, Inc. | 13,675 | 2,334,459 | ||||||
|
| |||||||
Process Industries - 1.5% | ||||||||
Linde, PLC | 2,650 | 1,088,382 | ||||||
Sherwin-Williams Co. | 5,225 | 1,629,677 | ||||||
|
| |||||||
| 2,718,059 | ||||||||
|
| |||||||
Producer Manufacturing - 4.8% | ||||||||
Aptiv, PLC * | 11,650 | 1,045,238 | ||||||
General Dynamics Corp. | 3,550 | 921,828 | ||||||
Honeywell International, Inc. | 8,425 | 1,766,807 | ||||||
| Name of Issuer | Quantity | Fair Value ($) | ||||||
Northrop Grumman Corp. | 1,875 | 877,763 | ||||||
Parker-Hannifin Corp. | 3,950 | 1,819,765 | ||||||
Siemens AG, ADR | 21,675 | 2,027,479 | ||||||
|
| |||||||
| 8,458,880 | ||||||||
|
| |||||||
Retail Trade - 10.0% | ||||||||
Amazon.com, Inc. * | 63,000 | 9,572,220 | ||||||
Home Depot, Inc. | 8,425 | 2,919,684 | ||||||
Lululemon Athletica, Inc. * | 4,425 | 2,262,458 | ||||||
Netflix, Inc. * | 2,300 | 1,119,824 | ||||||
TJX Cos., Inc. | 18,075 | 1,695,616 | ||||||
|
| |||||||
| 17,569,802 | ||||||||
|
| |||||||
Technology Services - 31.8% | ||||||||
Accenture, PLC | 10,200 | 3,579,282 | ||||||
Adobe, Inc. * | 6,250 | 3,728,750 | ||||||
Alphabet, Inc. - Class A * | 12,500 | 1,746,125 | ||||||
Alphabet, Inc. - Class C * | 73,500 | 10,358,355 | ||||||
Atlassian Corp. * | 7,675 | 1,825,576 | ||||||
Autodesk, Inc. * | 6,300 | 1,533,924 | ||||||
Intuit, Inc. | 5,200 | 3,250,156 | ||||||
Meta Platforms, Inc. * | 3,200 | 1,132,672 | ||||||
Microsoft Corp. | 57,600 | 21,659,904 | ||||||
Paycom Software, Inc. | 2,500 | 516,800 | ||||||
salesforce.com, Inc. * | 15,225 | 4,006,306 | ||||||
ServiceNow, Inc. * | 2,275 | 1,607,265 | ||||||
Splunk, Inc. * | 8,100 | 1,234,035 | ||||||
|
| |||||||
| 56,179,150 | ||||||||
|
| |||||||
Transportation - 2.4% | ||||||||
FedEx Corp. | 7,575 | 1,916,248 | ||||||
Union Pacific Corp. | 9,200 | 2,259,704 | ||||||
|
| |||||||
| 4,175,952 | ||||||||
|
| |||||||
Utilities - 0.5% | ||||||||
NextEra Energy, Inc. | 13,100 | 795,694 | ||||||
|
| |||||||
Total Common Stocks | 175,071,082 | |||||||
|
| |||||||
Short-Term Securities - 0.8% | 1,385,498 | 1,385,498 | ||||||
|
| |||||||
Total Investments in Securities - 99.9% | 176,456,580 | |||||||
Other Assets and Liabilities, net - 0.1% | 239,367 | |||||||
|
| |||||||
Net Assets - 100.0% | $176,695,947 | |||||||
|
| |||||||
| * | Non-income producing security. |
ADR — American Depositary Receipt |
PLC — Public Limited Company |
See accompanying notes to financial statements.
| 20 | SIT MUTUAL FUNDS SEMI-ANNUAL REPORT | |
Numeric footnotes not disclosed are not applicable to this Schedule of Investments.
A summary of the levels for the Fund’s investments as of December 31, 2023 is as follows (see Note 2 - significant accounting policies in the notes to financial statements):
| Investment in Securities | ||||||||||||||
| Level 1 | Level 2 | Level 3 | ||||||||||||
| Quoted | Other significant | Significant | ||||||||||||
| Prices ($) | observable inputs ($) | unobservable inputs ($) | Total ($) | |||||||||||
Common Stocks** | 175,071,082 | — | — | 175,071,082 | ||||||||||
Short-Term Securities | 1,385,498 | — | — | 1,385,498 | ||||||||||
Total: | 176,456,580 | — | — | 176,456,580 | ||||||||||
| ** | For equity securities categorized in a single level, refer to the detail above for further breakdown. |
There were no transfers into or out of level 3 during the reporting period.
See accompanying notes to financial statements.
| DECEMBER 31, 2023 | 21 | |
OBJECTIVE & STRATEGY
The objective of the Sit ESG Growth Fund is to maximize long-term capital appreciation. The Fund seeks to achieve its objectives by investing, under normal market conditions, at least 80% of its net assets in companies that the Adviser believes have strong environmental, social and corporate governance (ESG) practices at the time of purchase. The Fund invests primarily in common stocks of U.S. and foreign companies, primarily of large to medium capitalizations (companies with market capitalization in excess of $2 billion).
Fund Performance
The Sit ESG Growth Fund Class I shares provided a return of +6.99% during the 6-month period ended December 31, 2023, compared to the return of the MSCI World Index of +7.56%.
Factors that Influenced the Fund’s Performance
The Fund recorded strong absolute returns during the 6-month period but underperformed the MSCI World Index. While the Fund’s performance in larger capitalization stocks added value during the period, stock selection in the smallest capitalization issues more than offset the positive contributions. The Fund was also underweighted to the highest P/E stocks, which generated the highest returns during the period. The Fund’s holdings in the capital goods sector performed well on an absolute basis, helped by both an overweight position and positive returns relative to the benchmark sector. Here, strong stock performances in Trane Technologies plc and BAE Systems plc augmented returns. The software & services sector also contributed favorably to Fund returns during the period, led by Salesforce and Adobe. In addition, strong individual stock performances in Logitech International S.A., Recruit Holdings, and Broadcom enhanced returns. The biggest detractor to the Fund’s performance was holdings in the pharmaceuticals biotechnology & life sciences sector. The Fund did not hold stocks with exposure to GLP-1 drugs used to treat Type 2 diabetes and prescribed for weight loss, which outperformed during the period. Company specific issues also hurt the Fund’s holdings in Lonza Group AG and Astellas Pharma. Geographically, the Fund’s exposure to North America and Euroland added value during the period due to strong stock selection, while its exposure to the United Kingdom detracted from performance.
Outlook and Positioning
Still-high economic uncertainty, elevated policy/geopolitical risks, and “fair” equity valuations support our quality bias within a better environment for stock pickers in 2024. We generally maintain positions in the most attractive “Magnificent Seven” stocks but also see compelling opportunities in other technology segments, including semiconductors, software/services, and cybersecurity. Sentiment is also broadly improving for financial stocks. Given pent-up demand for initial public offerings, debt issuance, and M&A, we see the most attractive opportunities
HYPOTHETICAL GROWTH OF $10,000
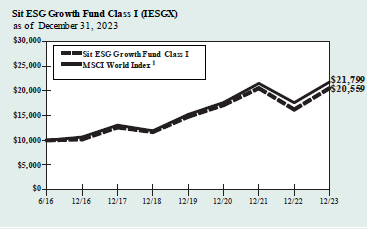
The chart above illustrates the total value of a hypothetical $10,000 investment in the Fund over the past 10 years (or for the life of the Fund if shorter) as compared to the performance of the MSCI World Index. Past performance does not guarantee future results. Returns include the reinvestment of distributions. The chart does not reflect the deduction of taxes that a shareholder would pay on Fund distributions or the redemption of Fund shares.
1 The MSCI World Index is a free float-adjusted market capitalization weighted index that is designed to measure the equity market performance of developed markets. It is not possible to invest directly in an index. This is the Fund’s primary index.
for a strong rebound in capital markets businesses. We also see an emerging backdrop that has historically led to solid relative performance for high-quality, dividend-paying growth stocks. In addition to the groups noted above, we see attractive growth and income opportunities in diverse areas, including energy, P&C insurance, drug distributors, and select pharmaceutical companies. Internationally, we remain positive on equities in China, South Korea, Singapore, India, Australia, Mexico, and Brazil. We favor high-quality industries with improving fundamentals like life insurance, Macau gaming, and some internet names. At the same time, we are keeping defensive exposure in consumer staples, healthcare, and utilities.
Roger J. Sit
David A. Brown
Kent L. Johnson
Michael T. Manns
Portfolio Managers
Information on this page is unaudited.
| 22 | SIT MUTUAL FUNDS SEMI-ANNUAL REPORT | |
|
COMPARATIVE RATES OF RETURNS
as of December 31, 2023
| Sit ESG Growth Fund | ||||||||||||
| Class I | Class S | MSCI World Index1 | ||||||||||
Six Month | 6.99 | % | 6.88 | % | 7.56 | % | ||||||
One Year | 26.67 | 26.35 | 23.79 | |||||||||
Five Year | 11.95 | 11.66 | 12.80 | |||||||||
Since Inception | 10.08 | 9.79 | 10.94 | |||||||||
(6/30/16) | ||||||||||||
Performance figures are historical and do not guarantee future results. Investment returns and principal value will vary, and you may have a gain or loss when you sell shares. Current performance may be lower or higher than the performance data quoted. Contact the Fund for performance data current to the most recent month-end. Returns include changes in share price as well as reinvestment of all dividends and capital gains. Returns do not reflect the deduction of taxes that a shareholder would pay on Fund distributions or the redemption of Fund shares. Management fees and administrative expenses are included in the Fund’s performance. Returns for periods greater than one year are compounded average annual rates of return.
1 The MSCI World Index is a free float-adjusted market capitalization weighted index that is designed to measure the equity market performance of developed markets. It is not possible to invest directly in an index.
PORTFOLIO SUMMARY
Class I: | ||||
Net Asset Value 12/31/23: | $18.59 | Per Share | ||
Net Asset Value 6/30/23: | $17.51 | Per Share | ||
Net Assets:
| $5.2
| Million
| ||
Class S: | ||||
Net Asset Value 12/31/23: | $18.42 | Per Share | ||
Net Asset Value 6/30/23: | $17.33 | Per Share | ||
Net Assets: | $4.6 | Million | ||
Weighted Average Market Cap: | $649.5 | Billion | ||
TOP HOLDINGS
| 1. | Microsoft Corp. | |||
| 2. | Apple, Inc. | |||
| 3. | NVIDIA Corp. | |||
| 4. | Alphabet, Inc. - Class A | |||
| 5. | Adobe, Inc. | |||
| 6. | UnitedHealth Group, Inc. | |||
| 7. | Accenture, PLC | |||
| 8. | Home Depot, Inc. | |||
| 9. | AstraZeneca, PLC, ADR | |||
| 10. | Allianz SE, ADR | |||
Based on net assets as of December 31, 2023.
SECTOR ALLOCATION
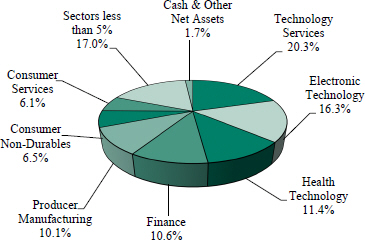
Based on net assets as of December 31, 2023.
Information on this page is unaudited.
| DECEMBER 31, 2023 | 23 | |
SCHEDULE OF INVESTMENTS (Unaudited)
December 31, 2023
Sit ESG Growth Fund
Investments are grouped by geographic region.
| Name of Issuer | Quantity | Fair Value ($) | ||||||
Common Stocks - 98.3% | ||||||||
Asia - 6.9% | ||||||||
Japan - 5.8% | ||||||||
Astellas Pharma, Inc. | 6,400 | 76,528 | ||||||
Keyence Corp. | 200 | 88,114 | ||||||
Recruit Holdings Co., Ltd. | 3,100 | 131,101 | ||||||
Sony Group Corp., ADR | 1,925 | 182,278 | ||||||
Terumo Corp. | 2,600 | 85,228 | ||||||
|
| |||||||
| 563,249 | ||||||||
|
| |||||||
Singapore - 1.1% | ||||||||
Singapore Technologies Engineering, Ltd. | 37,400 | 110,238 | ||||||
|
| |||||||
Europe - 36.0% | ||||||||
France - 1.8% | ||||||||
Forvia SE * | 2,358 | 53,156 | ||||||
Safran SA, ADR | 2,750 | 121,357 | ||||||
|
| |||||||
| 174,513 | ||||||||
|
| |||||||
Germany - 6.6% | ||||||||
Allianz SE, ADR | 8,800 | 234,872 | ||||||
Deutsche Post AG | 1,550 | 76,752 | ||||||
Infineon Technologies AG | 1,225 | 51,119 | ||||||
Muenchener Rueckversicherungs AG | 275 | 113,875 | ||||||
Siemens AG, ADR | 1,775 | 166,034 | ||||||
|
| |||||||
| 642,652 | ||||||||
|
| |||||||
Ireland - 6.3% | ||||||||
Accenture, PLC | 750 | 263,183 | ||||||
CRH, PLC | 1,200 | 82,992 | ||||||
Medtronic, PLC | 725 | 59,726 | ||||||
Trane Technologies, PLC | 875 | 213,412 | ||||||
|
| |||||||
| 619,313 | ||||||||
|
| |||||||
Netherlands - 0.5% | ||||||||
ASML Holding NV | 65 | 49,200 | ||||||
|
| |||||||
Spain - 2.2% | ||||||||
Iberdrola SA, ADR | 4,050 | 212,625 | ||||||
|
| |||||||
Switzerland - 4.1% | ||||||||
Chubb, Ltd. | 250 | 56,500 | ||||||
Logitech International SA | 850 | 80,801 | ||||||
Lonza Group AG | 185 | 77,801 | ||||||
Nestle SA, ADR | 1,200 | 138,756 | ||||||
Novartis AG, ADR | 450 | 45,436 | ||||||
|
| |||||||
| 399,294 | ||||||||
|
| |||||||
United Kingdom - 14.5% | ||||||||
AstraZeneca, PLC, ADR | 3,625 | 244,144 | ||||||
BAE Systems, PLC, ADR | 3,500 | 202,363 | ||||||
Coca-Cola Europacific Partners, PLC | 2,100 | 140,154 | ||||||
Compass Group, PLC | 3,600 | 98,474 | ||||||
Diageo, PLC, ADR | 785 | 114,343 | ||||||
Entain, PLC | 6,900 | 87,441 | ||||||
Man Group, PLC | 55,725 | 165,215 | ||||||
RELX, PLC, ADR | 4,700 | 186,402 | ||||||
Rentokil Initial, PLC, ADR | 2,375 | 67,949 | ||||||
Smith & Nephew, PLC | 8,050 | 110,664 | ||||||
|
| |||||||
| 1,417,149 | ||||||||
|
| |||||||
| Name of Issuer | Quantity | Fair Value ($) | ||||||
North America - 55.4% | ||||||||
United States - 55.4% | ||||||||
Adobe, Inc. * | 450 | 268,470 | ||||||
AES Corp. | 3,025 | 58,231 | ||||||
Alphabet, Inc. - Class A * | 2,500 | 349,225 | ||||||
Apple, Inc. | 3,600 | 693,108 | ||||||
Broadcom, Inc. | 125 | 139,531 | ||||||
Cheniere Energy, Inc. | 775 | 132,300 | ||||||
Dexcom, Inc. * | 1,080 | 134,017 | ||||||
Ecolab, Inc. | 325 | 64,464 | ||||||
FedEx Corp. | 375 | 94,864 | ||||||
Gilead Sciences, Inc. | 1,190 | 96,402 | ||||||
Goldman Sachs Group, Inc. | 600 | 231,462 | ||||||
Home Depot, Inc. | 745 | 258,180 | ||||||
Johnson & Johnson | 1,175 | 184,169 | ||||||
JPMorgan Chase & Co. | 1,075 | 182,857 | ||||||
Lockheed Martin Corp. | 275 | 124,641 | ||||||
Microsoft Corp. | 2,000 | 752,080 | ||||||
NIKE, Inc. | 850 | 92,285 | ||||||
NVIDIA Corp. | 1,000 | 495,220 | ||||||
PepsiCo, Inc. | 875 | 148,610 | ||||||
salesforce.com, Inc. * | 850 | 223,669 | ||||||
Starbucks Corp. | 1,000 | 96,010 | ||||||
T Rowe Price Group, Inc. | 475 | 51,153 | ||||||
TJX Cos., Inc. | 1,380 | 129,458 | ||||||
UnitedHealth Group, Inc. | 500 | 263,235 | ||||||
Visa, Inc. | 475 | 123,666 | ||||||
Williams Cos., Inc. | 900 | 31,347 | ||||||
|
| |||||||
| 5,418,654 | ||||||||
|
| |||||||
Total Common Stocks | 9,606,887 | |||||||
|
| |||||||
Short-Term Securities - 1.6% | ||||||||
Fidelity Inst. Money Mkt. Gvt. Fund, 5.29% | 159,354 | 159,354 | ||||||
|
| |||||||
Total Investments in Securities - 99.9% | 9,766,241 | |||||||
Other Assets and Liabilities, net - 0.1% | 11,788 | |||||||
|
| |||||||
Net Assets - 100.0% | $ | 9,778,029 | ||||||
|
| |||||||
| * | Non-income producing security. |
ADR — American Depositary Receipt |
PLC — Public Limited Company |
Numeric footnotes not disclosed are not applicable to this Schedule of Investments.
See accompanying notes to financial statements.
| 24 | SIT MUTUAL FUNDS SEMI-ANNUAL REPORT | |
A summary of the levels for the Fund’s investments as of December 31, 2023 is as follows (see Note 2 - significant accounting policies in the notes to financial statements):
| Investment in Securities | ||||||||||||||||
| Level 1 Quoted Prices ($) | Level 2 Other significant observable inputs ($) | Level 3 Significant | Total ($) | |||||||||||||
Common Stocks | ||||||||||||||||
France | 174,513 | — | — | 174,513 | ||||||||||||
Germany | 642,652 | — | — | 642,652 | ||||||||||||
Ireland | 619,313 | — | — | 619,313 | ||||||||||||
Japan | 563,249 | — | — | 563,249 | ||||||||||||
Netherlands | 49,200 | — | — | 49,200 | ||||||||||||
Singapore | 110,238 | — | — | 110,238 | ||||||||||||
Spain | 212,625 | — | — | 212,625 | ||||||||||||
Switzerland | 399,294 | — | — | 399,294 | ||||||||||||
United Kingdom | 1,417,149 | — | — | 1,417,149 | ||||||||||||
United States | 5,418,654 | — | — | 5,418,654 | ||||||||||||
Short-Term Securities | 159,354 | — | — | 159,354 | ||||||||||||
Total: | 9,766,241 | — | — | 9,766,241 | ||||||||||||
Level 1 securities of foreign issuers are primarily American Depositary Receipts (ADRs), Public Limited Companies (PLCs) or Global Depositary Receipts (GDRs). There were no transfers into or out of level 3 during the reporting period.
See accompanying notes to financial statements.
| DECEMBER 31, 2023 | 25 | |
OBJECTIVE & STRATEGY
The objective of the Sit Mid Cap Growth Fund is to maximize long-term capital appreciation. The Fund pursues this objective by investing, under normal market conditions, at least 80% of its net assets in common stocks that, at the time of purchase, have market capitalizations that fall within the range of companies included in the Russell Midcap® Growth Index during the most recent 12-month period. The Russell Midcap® Growth Index ranged from approximately $394 million to $73 billion during the 12-month period ended December 31, 2023.
Fund Performance
The Sit Mid Cap Growth Fund’s return during the 6-month period ended December 31, 2023 was +7.88%, compared to a +8.56% return for the Russell Midcap® Growth Index. The Russell Midcap® Index increased +7.54% during the period.
Factors that Influenced the Fund’s Performance
Despite posting strong absolute returns, the Fund underperformed the Russell Midcap® Growth Index during the period. The biggest detractor to performance was holdings in the health technology sector, where many of the Fund’s holdings were adversely affected by the rapid growth of GLP-1 drugs. During the period, investors became increasingly concerned that these drugs would reduce the necessity of diabetes and obesity-related treatments, threatening future growth prospects for companies, such as DexCom and Insulet. Negative clinical data and financial announcements also weighed on holdings, such as Sarepta and InMode. Conversely, strong stock selection within the electronic technology sector added to performance. Here, the Fund’s holdings in Arista Networks and Broadcom were large beneficiaries of increasing spending on artificial intelligence and cloud computing. Stock selection within the retail trade sector also augmented performance during the period, where holdings such as Lululemon Athletica and TJX Cos. saw price appreciation in conjunction with resilient consumer spending and strong brand offerings. An underweight position in the consumer non-durables sector added to performance, where many companies were negatively affected by inflation and a normalization of pandemic-related spending.
Outlook and Positioning
Investors piled into U.S. stocks in the final two months of 2023, with about $96 billion flowing into U.S. equity mutual funds and ETFs in November and December. The year-end equity rally pushed the S&P 500 Index into overbought territory, at least based on the 14-day and 14-week relative strength indices. As for institutional investors, the NAAIM Exposure Index shows that active portfolio managers progressively increased risk exposure in November and December, before paring back in the year’s final week. Overbought technical conditions and elevated sentiment imply stocks are susceptible to profit-taking or at least a pause in the near term as investors digest recent gains. Moreover, Treasury spreads indicate market volatility, as measured by the CBOE Volatility Index, will rise through mid-2026. Quality stocks should continue to outperform against the anticipated backdrop of below-trend real GDP growth, increasing market volatility, and tighter liquidity. As
HYPOTHETICAL GROWTH OF $10,000
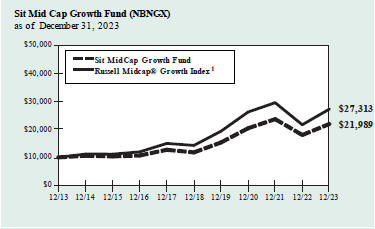
The chart above illustrates the total value of a hypothetical $10,000 investment in the Fund over the past 10 years as compared to the performance of the Russell Midcap® Growth Index. Past performance does not guarantee future results. Returns include the reinvestment of distributions. The chart does not reflect the deduction of taxes that a shareholder would pay on Fund distributions or the redemption of Fund shares.
1 Russell Midcap® Growth Index is an unmanaged index that measures the performance of those Russell Midcap Index companies with higher price-to-book ratios and higher forecasted growth values. It is not possible to invest directly in an index. This is the Fund’s primary index.
captured by the MSCI USA Quality Index, quality growth stocks outperformed the broader MSCI USA Index by over nine percentage points in 2023, or a total return of +36.3% versus +27.1%. Over the last four decades, the MSCI USA Quality Index has generated an annualized return of +13.2%, compared to +11.4% for its parent index. High-beta, lower-quality stocks tend to do better exiting a recession when enormous monetary (and fiscal) easing lifts all boats. We do not foresee a deep economic downturn or massive monetary stimulus on the horizon. The absence of a surge in monetary easing amidst a slower growth, disinflationary environment continues to support a quality bias within equity portfolios. Key characteristics include secular/visible sales growth, cost discipline, free cash flow generation, limited leverage, and management teams that consistently return capital to shareholders via dividends or share repurchases.
Roger J. Sit
Kent L. Johnson
Robert W. Sit
Portfolio Managers
Information on this page is unaudited.
| 26 | SIT MUTUAL FUNDS SEMI-ANNUAL REPORT | |
|
| COMPARATIVE RATES OF RETURNS |
| |||||||||||
as of December 31, 2023 |
| |||||||||||
| | Sit Mid Cap Growth Fund | | | Russell Midcap® Growth Index1 |
| | Russell Midcap® Index2 |
| ||||
Six Month | 7.88 | % | 8.56 | % | 7.54 | % | ||||||
One Year | 21.97 | 25.87 | 17.23 | |||||||||
Five Year | 13.26 | 13.81 | 12.68 | |||||||||
Ten Year | 8.20 | 10.57 | 9.42 | |||||||||
| Since Inception (9/2/82) | 11.24 | n/a | n/a | |||||||||
Performance figures are historical and do not guarantee future results. Investment returns and principal value will vary, and you may have a gain or loss when you sell shares. Current performance may be lower or higher than the performance data quoted. Contact the Fund for performance data current to the most recent month-end. Returns include changes in share price as well as reinvestment of all dividends and capital gains. Returns do not reflect the deduction of taxes that a shareholder would pay on Fund distributions or the redemption of Fund shares. Management fees and administrative expenses are included in the Fund’s performance. Returns for periods greater than one year are compounded average annual rates of return.
1 Russell Midcap® Growth Index is an unmanaged index that measures the performance of those Russell Midcap Index companies with higher price-to-book ratios and higher forecasted growth values. It is not possible to invest directly in an index.
2 Russell Midcap® Index is an unmanaged index that measures the performance of approximately 800 of the smallest companies in the Russell 1000® Index.
| PORTFOLIO SUMMARY | ||
Net Asset Value 12/31/23: | $21.56 Per Share | |
Net Asset Value 6/30/23: | $20.07 Per Share | |
Net Assets: | $194.1 Million | |
Weighted Average Market Cap: | $57.6 Billion | |
TOP 10 HOLDINGS
1. Arista Networks, Inc.
2. Broadcom, Inc.
3. PTC, Inc.
4. Dexcom, Inc.
5. TJX Cos., Inc.
6. Ulta Beauty, Inc.
7. Atlassian Corp.
8. HubSpot, Inc.
9. Applied Materials, Inc.
10. ANSYS, Inc.
Based on net assets as of December 31, 2023.
SECTOR ALLOCATION
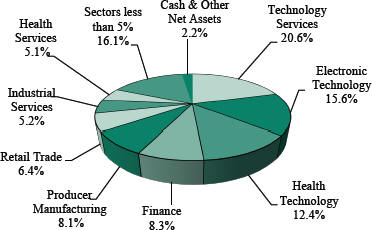
Based on net assets as of December 31, 2023.
Information on this page is unaudited.
| DECEMBER 31, 2023 | 27 | |
SCHEDULE OF INVESTMENTS (Unaudited)
December 31, 2023
Sit Mid Cap Growth Fund
Investments are grouped by economic sectors.
| Name of Issuer | Quantity | Fair Value ($) | ||||||
Common Stocks - 97.8% | ||||||||
Commercial Services - 3.2% | ||||||||
ASGN, Inc. * | 13,525 | 1,300,699 | ||||||
Booz Allen Hamilton Holding Corp. | 27,550 | 3,523,921 | ||||||
Copart, Inc. * | 16,000 | 784,000 | ||||||
FactSet Research Systems, Inc. | 1,100 | 524,755 | ||||||
|
| |||||||
| 6,133,375 | ||||||||
|
| |||||||
Communications - 1.0% | ||||||||
Iridium Communications, Inc. | 47,300 | 1,946,868 | ||||||
|
| |||||||
Consumer Durables - 1.2% | ||||||||
Take-Two Interactive Software, Inc. * | 4,892 | 787,367 | ||||||
YETI Holdings, Inc. * | 28,100 | 1,455,018 | ||||||
|
| |||||||
| 2,242,385 | ||||||||
|
| |||||||
Consumer Non-Durables - 1.4% | ||||||||
Coca-Cola Europacific Partners, PLC | 40,700 | 2,716,318 | ||||||
|
| |||||||
Consumer Services - 2.3% | ||||||||
Nexstar Media Group, Inc. | 18,250 | 2,860,688 | ||||||
Vail Resorts, Inc. | 7,700 | 1,643,719 | ||||||
|
| |||||||
| 4,504,407 | ||||||||
|
| |||||||
Electronic Technology - 15.6% | ||||||||
Applied Materials, Inc. | 24,350 | 3,946,405 | ||||||
Arista Networks, Inc. * | 39,100 | 9,208,441 | ||||||
Broadcom, Inc. | 8,085 | 9,024,881 | ||||||
Ciena Corp. * | 16,525 | 743,790 | ||||||
MKS Instruments, Inc. | 15,100 | 1,553,337 | ||||||
Monolithic Power Systems, Inc. | 5,400 | 3,406,212 | ||||||
Skyworks Solutions, Inc. | 21,400 | 2,405,788 | ||||||
|
| |||||||
| 30,288,854 | ||||||||
|
| |||||||
Energy Minerals - 3.6% | ||||||||
Northern Oil & Gas, Inc. | 73,100 | 2,709,817 | ||||||
Oasis Petroleum, Inc. | 18,850 | 3,133,436 | ||||||
Texas Pacific Land Corp. | 765 | 1,202,924 | ||||||
|
| |||||||
| 7,046,177 | ||||||||
|
| |||||||
Finance - 8.3% | ||||||||
Air Lease Corp. | 32,900 | 1,379,826 | ||||||
Ameriprise Financial, Inc. | 10,000 | 3,798,300 | ||||||
Arthur J Gallagher & Co. | 11,600 | 2,608,608 | ||||||
Carlyle Group, Inc. | 85,700 | 3,487,133 | ||||||
Intercontinental Exchange, Inc. | 25,300 | 3,249,279 | ||||||
Reinsurance Group of America, Inc. | 10,300 | 1,666,334 | ||||||
|
| |||||||
| 16,189,480 | ||||||||
|
| |||||||
Health Services - 5.1% | ||||||||
Encompass Health Corp. | 41,200 | 2,748,864 | ||||||
Molina Healthcare, Inc. * | 9,150 | 3,305,986 | ||||||
Tenet Healthcare Corp. * | 50,950 | 3,850,292 | ||||||
|
| |||||||
| 9,905,142 | ||||||||
|
| |||||||
Health Technology - 12.4% | ||||||||
Align Technology, Inc. * | 6,025 | 1,650,850 | ||||||
BioMarin Pharmaceutical, Inc. * | 23,500 | 2,265,870 | ||||||
Bio-Techne Corp. | 32,900 | 2,538,564 | ||||||
Dexcom, Inc. * | 48,040 | 5,961,283 | ||||||
Exact Sciences Corp. * | 21,350 | 1,579,473 | ||||||
Inmode, Ltd. * | 55,400 | 1,232,096 | ||||||
| Name of Issuer | Quantity | Fair Value ($) | ||||||
Insulet Corp. * | 14,100 | 3,059,418 | ||||||
Jazz Pharmaceuticals, PLC * | 5,700 | 701,100 | ||||||
Sarepta Therapeutics, Inc. * | 19,225 | 1,853,867 | ||||||
Thermo Fisher Scientific, Inc. | 6,100 | 3,237,819 | ||||||
|
| |||||||
| 24,080,340 | ||||||||
|
| |||||||
Industrial Services - 5.2% | ||||||||
Cheniere Energy, Inc. | 20,000 | 3,414,200 | ||||||
Jacobs Solutions, Inc. | 24,700 | 3,206,060 | ||||||
Waste Connections, Inc. | 23,400 | 3,492,918 | ||||||
|
| |||||||
| 10,113,178 | ||||||||
|
| |||||||
Non-Energy Minerals - 1.6% | ||||||||
Trex Co., Inc. * | 38,625 | 3,197,764 | ||||||
|
| |||||||
Producer Manufacturing - 8.1% | ||||||||
AGCO Corp. | 12,700 | 1,541,907 | ||||||
AMETEK, Inc. | 14,675 | 2,419,761 | ||||||
Aptiv, PLC * | 13,800 | 1,238,136 | ||||||
Carlisle Cos., Inc. | 10,075 | 3,147,732 | ||||||
Donaldson Co., Inc. | 22,950 | 1,499,782 | ||||||
Dover Corp. | 21,875 | 3,364,594 | ||||||
Hubbell, Inc. | 7,500 | 2,466,975 | ||||||
|
| |||||||
| 15,678,887 | ||||||||
|
| |||||||
Retail Trade - 6.4% | ||||||||
Lululemon Athletica, Inc. * | 4,700 | 2,403,063 | ||||||
TJX Cos., Inc. | 55,175 | 5,175,967 | ||||||
Ulta Beauty, Inc. * | 9,700 | 4,752,903 | ||||||
|
| |||||||
| 12,331,933 | ||||||||
|
| |||||||
Technology Services - 20.6% | ||||||||
Altair Engineering, Inc. * | 24,800 | 2,086,920 | ||||||
ANSYS, Inc. * | 10,750 | 3,900,960 | ||||||
Aspen Technology, Inc. * | 8,358 | 1,840,014 | ||||||
Atlassian Corp. * | 16,950 | 4,031,727 | ||||||
Autodesk, Inc. * | 14,800 | 3,603,504 | ||||||
Booking Holdings, Inc. * | 450 | 1,596,249 | ||||||
Dynatrace, Inc. * | 65,375 | 3,575,359 | ||||||
Euronet Worldwide, Inc. * | 16,075 | 1,631,452 | ||||||
Globant SA * | 9,450 | 2,248,911 | ||||||
HubSpot, Inc. * | 6,825 | 3,962,185 | ||||||
Paycom Software, Inc. | 7,600 | 1,571,072 | ||||||
PTC, Inc. * | 35,200 | 6,158,592 | ||||||
Splunk, Inc. * | 20,900 | 3,184,115 | ||||||
Spotify Technology SA * | 3,250 | 610,707 | ||||||
|
| |||||||
| 40,001,767 | ||||||||
|
| |||||||
Transportation - 1.2% | ||||||||
Alaska Air Group, Inc. * | 17,300 | 675,911 | ||||||
Knight-Swift Transportation Holdings, Inc. | 28,500 | 1,643,025 | ||||||
|
| |||||||
| 2,318,936 | ||||||||
|
| |||||||
Utilities - 0.6% | ||||||||
WEC Energy Group, Inc. | 12,800 | 1,077,376 | ||||||
|
| |||||||
Total Common Stocks | 189,773,187 | |||||||
|
| |||||||
See accompanying notes to financial statements.
| 28 | SIT MUTUAL FUNDS SEMI-ANNUAL REPORT | |
| Name of Issuer | Quantity | Fair Value ($) | ||||||
Short-Term Securities - 1.9% | ||||||||
Fidelity Inst. Money Mkt. Gvt. Fund, 5.29% | 3,680,240 | 3,680,240 | ||||||
|
| |||||||
Total Investments in Securities - 99.7% | 193,453,427 | |||||||
Other Assets and Liabilities, net - 0.3% | 619,234 | |||||||
|
| |||||||
Net Assets - 100.0% | $194,072,661 | |||||||
|
| |||||||
| * | Non-income producing security. |
PLC — Public Limited Company
Numeric footnotes not disclosed are not applicable to this Schedule of Investments.
A summary of the levels for the Fund’s investments as of December 31, 2023 is as follows (see Note 2 - significant accounting policies in the notes to financial statements):
Investment in Securities | ||||||||||
| Level 1 Quoted Prices ($) | Level 2 Other significant observable inputs ($) | Level 3 Significant | Total ($) | |||||||
Common Stocks** | 189,773,187 | — | — | 189,773,187 | ||||||
Short-Term Securities | 3,680,240 | — | — | 3,680,240 | ||||||
Total: | 193,453,427 | — | — | 193,453,427 | ||||||
| ** | For equity securities categorized in a single level, refer to the detail above for further breakdown. |
There were no transfers into or out of level 3 during the reporting period.
See accompanying notes to financial statements.
| DECEMBER 31, 2023 | 29 | |
OBJECTIVE & STRATEGY
The objective of the Sit Small Cap Dividend Growth Fund is to provide current income that exceeds the Fund’s benchmark index and that grows over a period of years. Secondarily the Fund seeks long-term capital appreciation. The Fund seeks to achieve its objectives by investing, under normal market conditions, at least 80% of its net assets in small cap dividend-paying common stocks that have market capitalizations at the time of purchase of up to $3.0 billion, or up to the market capitalization of the largest company included in the Russell 2000® Index measured at the end of the previous twelve months ($17.3 billion as of December 31, 2023). The Fund may invest the balance of its assets in preferred stocks, convertible bonds, U.S Treasury securities (including Treasury bills, notes and bonds), and closed-end investment companies.
Fund Performance
The Sit Small Cap Dividend Growth Fund Class I posted a +5.54% return for the 6-month period ended December 31, 2023, compared to the +8.18% return for the Russell 2000® Index. The Fund’s gross dividend yield (before deducting Fund expenses) was 1.79% as of 12/31/23, compared to a yield of 1.39% for the Russell 2000® Index.
Factors that Influenced the Fund’s Performance
During the 6-month period ending December 31, 2023, the Fund posted positive returns; however, it underperformed the benchmark Russell 2000® Index. Strong stock selection in the commercial services sector helped returns. Here, Colliers International saw stock price appreciation due to an anticipated rebound in real estate transaction activity, driven by investor expectations for lower interest rates in 2024, and Booz Allen Hamilton benefited from increasing government IT investment. An underweight position in electronic technology, combined with positive stock selection, also augmented returns. Monolithic Power was a key holding here, with strong equity appreciation linked to increasing demand for the company’s artificial intelligence networking products. The largest detractor from performance during the period was stock selection within the health technology sector, where some of the Fund’s holdings were adversely affected by negative clinical data, while it also did not own some of the best performing equities within the space that were either acquired or saw stock price appreciation related to positive clinical trials.
Outlook and Positioning
Dividend growth also remains a compelling and underappreciated style within small cap stock investing. Our internal research reveals Russell 2000 dividend payers materially outperformed the overall index over the last four decades and with lower volatility. Companies that can consistently generate free cash flow tend to outperform over time, while speculative/unprofitable ones that naturally do not pay dividends tend to lag. In addition to many of the areas noted above, we see attractive total return opportunities in diverse segments, including REITs, industrials, investment banks, and asset managers. We believe that the long period of underperformance of U.S. small cap stocks has largely run its course. However, we recognize the prospect of structurally slower GDP growth may prevent the asset class from delivering its historic significant
HYPOTHETICAL GROWTH OF $10,000
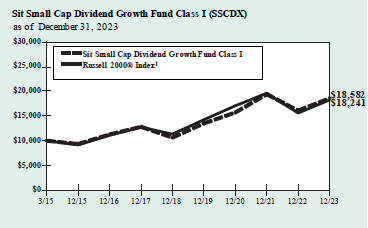
The chart above illustrates the total value of a hypothetical $10,000 investment in the Fund over the past 10 years (or for the life of the Fund if shorter) as compared to the performance of the Russell 2000® Index. Past performance does not guarantee future results. Returns include the reinvestment of distributions. The chart does not reflect the deduction of taxes that a shareholder would pay on Fund distributions or the redemption of Fund shares.
1 Russell 2000® Index is an unmanaged index that measures the performance of the 2,000 smallest companies in the Russell 3000® Index, an index consisting of the 3,000 largest U.S. companies based on market capitalization. It is not possible to invest directly in an index. This is the Fund’s primary index.
outperformance over larger stocks. While this backdrop may create headwinds for many smaller companies, investors will be greatly rewarded for identifying dynamic firms that can generate differentiated growth over time. Small cap stocks can also offer unique opportunities for exposure to cyclical recoveries in a particular industry. For example, property and casualty companies are in the midst of a “hard” pricing market for premiums, with investment income rising on the heels of higher interest rates. Despite higher interest rates, homebuilders have also prospered, as limited supply has kept demand and pricing solid. Finally, trucking and logistics firms have experienced a sharp fall in business following the surge in the demand for durable goods during the pandemic. However, reduced competitive capacity and customer inventories set the stage for a stronger 2024 for these companies.
| Roger J. Sit | Michael T. Manns | |
| Kent L. Johnson | Robert W. Sit | |
| Portfolio Managers |
Information on this page is unaudited.
| 30 | SIT MUTUAL FUNDS SEMI-ANNUAL REPORT | |
|
COMPARATIVE RATES OF RETURNS
as of December 31, 2023
| Sit Small Cap Dividend Growth Fund | ||||||||||||
| Class I | Class S | | Russell 2000® Index1 |
| ||||||||
Six Month | 5.54 | % | 5.35 | % | 8.18 | % | ||||||
One Year | 15.49 | 15.22 | 16.93 | |||||||||
Five Year | 11.82 | 11.52 | 9.97 | |||||||||
Since Inception (3/31/15) | 7.33 | 7.06 | 7.10 | |||||||||
Performance figures are historical and do not guarantee future results. Investment returns and principal value will vary, and you may have a gain or loss when you sell shares. Current performance may be lower or higher than the performance data quoted. Contact the Fund for performance data current to the most recent month-end. Returns include changes in share price as well as reinvestment of all dividends and capital gains. Returns do not reflect the deduction of the 2% redemption fee imposed if shares are redeemed or exchanged within 30 calendar days from their date of purchase. If imposed, the fee would reduce the performance quoted. Returns do not reflect the deduction of taxes that a shareholder would pay on Fund distributions or the redemption of Fund shares. Management fees and administrative expenses are included in the Fund’s performance. Returns for periods greater than one year are compounded average annual rates of return.
1 Russell 2000® Index is an unmanaged index that measures the performance of the 2,000 smallest companies in the Russell 3000® Index, an index consisting of the 3,000 largest U.S. companies based on market capitalization. It is not possible to directly invest in an index.
| PORTFOLIO SUMMARY | ||
| Class I: | ||
Net Asset Value 12/31/23: | $14.97 Per Share | |
Net Asset Value 6/30/23: | $14.31 Per Share | |
Net Assets: | $17.3 Million | |
Class S: | ||
Net Asset Value 12/31/23: | $14.96 Per Share | |
Net Asset Value 6/30/23: | $14.30 Per Share | |
Net Assets: | $5.3 Million | |
Weighted Average Market Cap: | $7.0 Billion | |
TOP 10 HOLDINGS
1. Monolithic Power Systems, Inc.
2. KBR, Inc.
3. Oasis Petroleum, Inc.
4. Northern Oil & Gas, Inc.
5. Tenet Healthcare Corp.
6. Stifel Financial Corp.
7. Olin Corp.
8. EMCOR Group, Inc.
9. TFI International, Inc.
10. CNO Financial Group, Inc.
Based on net assets as of December 31, 2023.
SECTOR ALLOCATION
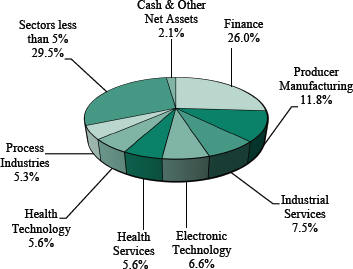
Based on net assets as of December 31, 2023.
Information on this page is unaudited.
| DECEMBER 31, 2023 | 31 | |
SCHEDULE OF INVESTMENTS (Unaudited)
December 31, 2023
Sit Small Cap Dividend Growth Fund
Investments are grouped by economic sectors.
| Name of Issuer | Quantity | Fair Value ($) | ||||||
Common Stocks - 97.9% | ||||||||
Commercial Services - 4.5% | ||||||||
Booz Allen Hamilton Holding Corp. | 2,700 | 345,357 | ||||||
Brink’s Co. | 1,825 | 160,509 | ||||||
Colliers International Group, Inc. | 2,050 | 259,366 | ||||||
FTI Consulting, Inc. * | 600 | 119,490 | ||||||
World Kinect Corp. | 5,850 | 133,263 | ||||||
|
|
| ||||||
| 1,017,985 | ||||||||
|
|
| ||||||
Communications - 1.0% | ||||||||
Iridium Communications, Inc. | 5,375 | 221,235 | ||||||
|
|
| ||||||
Consumer Durables - 1.9% | ||||||||
MDC Holdings, Inc. | 4,050 | 223,763 | ||||||
National Presto Industries, Inc. | 750 | 60,210 | ||||||
YETI Holdings, Inc. * | 2,700 | 139,806 | ||||||
|
|
| ||||||
| 423,779 | ||||||||
|
|
| ||||||
Consumer Non-Durables - 1.6% | ||||||||
Crocs, Inc. * | 2,100 | 196,161 | ||||||
Sensient Technologies Corp. | 2,450 | 161,700 | ||||||
|
|
| ||||||
| 357,861 | ||||||||
|
|
| ||||||
Consumer Services - 2.6% | ||||||||
Nexstar Media Group, Inc. | 2,250 | 352,688 | ||||||
Vail Resorts, Inc. | 1,100 | 234,817 | ||||||
|
|
| ||||||
| 587,505 | ||||||||
|
|
| ||||||
Electronic Technology - 6.6% | ||||||||
Coherent Corp. * | 2,450 | 106,648 | ||||||
Entegris, Inc. | 991 | 118,742 | ||||||
MKS Instruments, Inc. | 3,275 | 336,899 | ||||||
Monolithic Power Systems, Inc. | 1,050 | 662,319 | ||||||
Power Integrations, Inc. | 3,400 | 279,174 | ||||||
|
|
| ||||||
| 1,503,782 | ||||||||
|
|
| ||||||
Energy Minerals - 4.5% | ||||||||
Northern Oil & Gas, Inc. | 13,125 | 486,544 | ||||||
Oasis Petroleum, Inc. | 3,210 | 533,598 | ||||||
|
|
| ||||||
| 1,020,142 | ||||||||
|
|
| ||||||
Finance - 26.0% | ||||||||
Air Lease Corp. | 6,675 | 279,949 | ||||||
American Financial Group, Inc. | 1,000 | 118,890 | ||||||
Artisan Partners Asset Management, Inc. | 5,350 | 236,363 | ||||||
Axis Capital Holdings, Ltd. | 6,750 | 373,747 | ||||||
Broadstone Net Lease, Inc. | 11,800 | 203,196 | ||||||
Cadence Bank | 9,450 | 279,626 | ||||||
Carlyle Group, Inc. | 8,075 | 328,572 | ||||||
CNO Financial Group, Inc. | 14,000 | 390,600 | ||||||
CubeSmart | 5,250 | 243,337 | ||||||
Essential Properties Realty Trust, Inc. | 10,050 | 256,878 | ||||||
Evercore Partners, Inc. | 1,900 | 324,995 | ||||||
H&E Equipment Services, Inc. | 6,750 | 353,160 | ||||||
Hannon Armstrong Sust. Inf. Cap., Inc. | 4,825 | 133,074 | ||||||
Hanover Insurance Group, Inc. | 2,500 | 303,550 | ||||||
Hercules Capital, Inc. | 7,725 | 128,776 | ||||||
Horace Mann Educators Corp. | 3,625 | 118,537 | ||||||
Mercury General Corp. | 3,550 | 132,451 | ||||||
Old National Bancorp | 20,675 | 349,201 | ||||||
Physicians Realty Trust | 11,250 | 149,737 | ||||||
Piper Sandler Cos. | 1,450 | 253,562 | ||||||
| Name of Issuer | Quantity | Fair Value ($) | ||||||
PotlatchDeltic Corp. | 2,810 | 137,971 | ||||||
Provident Financial Services, Inc. | 12,400 | 223,572 | ||||||
Stifel Financial Corp. | 6,000 | 414,900 | ||||||
Western Alliance Bancorp | 2,100 | 138,159 | ||||||
|
|
| ||||||
| 5,872,803 | ||||||||
|
|
| ||||||
Health Services - 5.6% | ||||||||
Addus HomeCare Corp. * | 3,650 | 338,903 | ||||||
Encompass Health Corp. | 4,200 | 280,224 | ||||||
Patterson Cos., Inc. | 7,325 | 208,396 | ||||||
Tenet Healthcare Corp. * | 5,900 | 445,863 | ||||||
|
|
| ||||||
| 1,273,386 | ||||||||
|
|
| ||||||
Health Technology - 5.6% | ||||||||
AtriCure, Inc. * | 5,500 | 196,295 | ||||||
Bio-Techne Corp. | 1,300 | 100,308 | ||||||
Halozyme Therapeutics, Inc. * | 2,475 | 91,476 | ||||||
Inmode, Ltd. * | 6,250 | 139,000 | ||||||
Intellia Therapeutics, Inc. * | 4,050 | 123,484 | ||||||
Lantheus Holdings, Inc. * | 3,900 | 241,800 | ||||||
Seres Therapeutics, Inc. * | 40,625 | 56,875 | ||||||
STERIS, PLC | 975 | 214,354 | ||||||
Supernus Pharmaceuticals, Inc. * | 1,150 | 33,281 | ||||||
Vericel Corp. * | 1,700 | 60,537 | ||||||
|
|
| ||||||
| 1,257,410 | ||||||||
|
|
| ||||||
Industrial Services - 7.5% | ||||||||
DT Midstream, Inc. | 3,850 | 210,980 | ||||||
EMCOR Group, Inc. | 1,850 | 398,545 | ||||||
KBR, Inc. | 10,775 | 597,043 | ||||||
MYR Group, Inc. * | 1,400 | 202,482 | ||||||
TechnipFMC, PLC | 14,150 | 284,981 | ||||||
|
|
| ||||||
| 1,694,031 | ||||||||
|
|
| ||||||
Non-Energy Minerals - 3.8% | ||||||||
AZEK Co., Inc. * | 5,700 | 218,025 | ||||||
Commercial Metals Co. | 3,950 | 197,658 | ||||||
Eagle Materials, Inc. | 1,575 | 319,473 | ||||||
MP Materials Corp. * | 6,600 | 131,010 | ||||||
|
|
| ||||||
| 866,166 | ||||||||
|
|
| ||||||
Process Industries - 5.3% | ||||||||
Avient Corp. | 2,125 | 88,336 | ||||||
Cabot Corp. | 1,550 | 129,425 | ||||||
Huntsman Corp. | 4,650 | 116,854 | ||||||
Olin Corp. | 7,625 | 411,369 | ||||||
Silgan Holdings, Inc. | 6,650 | 300,913 | ||||||
Stepan Co. | 1,525 | 144,189 | ||||||
|
|
| ||||||
| 1,191,086 | ||||||||
|
|
| ||||||
Producer Manufacturing - 11.8% | ||||||||
AeroVironment, Inc. * | 1,075 | 135,493 | ||||||
AGCO Corp. | 1,350 | 163,903 | ||||||
AZZ, Inc. | 3,650 | 212,029 | ||||||
Belden, Inc. | 3,175 | 245,269 | ||||||
Carlisle Cos., Inc. | 775 | 242,133 | ||||||
Crane Co. | 3,275 | 386,909 | ||||||
Crane NXT Co. | 3,275 | 186,249 | ||||||
Donaldson Co., Inc. | 2,675 | 174,811 | ||||||
EnPro, Inc. | 1,575 | 246,866 | ||||||
Hubbell, Inc. | 850 | 279,590 | ||||||
Lincoln Electric Holdings, Inc. | 1,075 | 233,769 | ||||||
See accompanying notes to financial statements.
| 32 | SIT MUTUAL FUNDS SEMI-ANNUAL REPORT | |
| Name of Issuer | Quantity | Fair Value ($) | ||||||
Regal Rexnord Corp. | 1,042 | 154,237 | ||||||
|
|
| ||||||
| 2,661,258 | ||||||||
|
|
| ||||||
Retail Trade - 2.4% | ||||||||
Boot Barn Holdings, Inc. * | 3,475 | 266,741 | ||||||
Casey’s General Stores, Inc. | 1,025 | 281,609 | ||||||
|
|
| ||||||
| 548,350 | ||||||||
|
|
| ||||||
Technology Services - 2.8% | ||||||||
Altair Engineering, Inc. * | 1,725 | 145,159 | ||||||
Globant SA * | 1,625 | 386,717 | ||||||
nCino, Inc. * | 3,100 | 104,253 | ||||||
|
|
| ||||||
| 636,129 | ||||||||
|
|
| ||||||
Transportation - 3.5% | ||||||||
Knight-Swift Transportation Holdings, Inc. | 3,700 | 213,305 | ||||||
Marten Transport, Ltd. | 8,450 | 177,281 | ||||||
TFI International, Inc. | 2,875 | 390,942 | ||||||
|
|
| ||||||
| 781,528 | ||||||||
|
|
| ||||||
Utilities - 0.9% | ||||||||
Chesapeake Utilities Corp. | 1,975 | 208,619 | ||||||
|
|
| ||||||
Total Common Stocks | 22,123,055 | |||||||
|
|
| ||||||
Short-Term Securities - 2.2% | ||||||||
Fidelity Inst. Money Mkt. Gvt. Fund, 5.29% (cost $496,071) | 496,071 | 496,071 | ||||||
|
|
| ||||||
Total Investments in Securities - 100.1% (cost $16,428,542) | 22,619,126 | |||||||
Other Assets and Liabilities, net - (0.1)% | (23,967 | ) | ||||||
|
|
| ||||||
Net Assets - 100.0% | $22,595,159 | |||||||
|
|
| ||||||
| * | Non-income producing security. |
PLC — Public Limited Company
Numeric footnotes not disclosed are not applicable to this Schedule of Investments.
A summary of the levels for the Fund’s investments as of December 31, 2023 is as follows (see Note 2 - significant accounting policies in the notes to financial statements):
| Investment in Securities | ||||||||||
Level 1 Quoted Prices ($) | Level 2 Other significant observable inputs ($) | Level 3 Significant | Total ($) | |||||||
Common Stocks** | 22,123,055 | — | — | 22,123,055 | ||||||
Short-Term Securities | 496,071 | — | — | 496,071 | ||||||
Total: | 22,619,126 | — | — | 22,619,126 | ||||||
| ** | For equity securities categorized in a single level, refer to the detail above for further breakdown. |
There were no transfers into or out of level 3 during the reporting period.
See accompanying notes to financial statements.
| DECEMBER 31, 2023 | 33 | |
OBJECTIVE & STRATEGY
The objective of the Sit Small Cap Growth Fund is to maximize long-term capital appreciation. The Fund seeks to achieve its objective by investing, under normal market conditions, at least 80% of its net assets in common stocks of companies with market capitalizations at the time of purchase of up to $3.0 billion, or up to the market capitalization of the largest company included in the Russell 2000® measured at the end of the previous twelve months ($17.3 billion as of December 31, 2023). The Adviser invests in a diversified group of growing small companies it believes exhibit the potential for superior growth. The Adviser believes that a company’s earnings growth is the primary determinant of its potential long-term return and evaluates a company’s potential for above average long-term earnings and revenue growth.
Fund Performance
The Sit Small Cap Growth Fund return was +3.26% over the 6-month period ended December 31, 2023. This compares to the return of +4.50% for the Russell 2000® Growth Index and a +8.18% increase for the Russell 2000® Index.
Factors that Influenced the Fund’s Performance
During the 6-month period ending December 31, 2023, the Fund had positive relative returns, while lagging the Russell 2000® Growth Index. The main reason for underperformance was stock selection within the health technology sector, where the Fund’s holdings were adversely affected by negative clinical data, while it did not own some of the best performing equities within the space that were either acquired or saw stock price appreciation related to positive clinical trials. Concerns around increasing penetration of GLP-1 treatments leading to a decrease in diabetes and obesity treatments also weighed on holdings, such as Insulet. Countering this, strong stock selection in the electronic technology sector enhanced performance. Here, the Fund benefitted from positive stock selection, with holdings returning +12% in aggregate in this sector, compared to the Russell 2000® Growth Index’s sector return of -4%. Key holdings in this sector were Arista Networks and Monolithic Power Systems, both of which benefitted from increased spending on artificial intelligence and cloud computing networks. Stock selection was also strong in the commercial services sector. Here, ASGN was a beneficiary of continued strength in the labor market, Booz Allen Hamilton was helped by increasing government information technology investment, and Colliers International was boosted by an anticipated rebound in real estate transaction activity driven by investor expectations for lower interest rates in 2024.
Outlook and Positioning
Stock selection (versus sector influences) within small cap investing tends to be the dominant source of alpha relative to benchmarks, such as the Russell 2000® Index. The earnings of small companies are intrinsically more volatile vis-à-vis larger peers, and thus investors must give added consideration to the quality of management, business models, and financial statements. The small cap universe has become lower quality in recent years on some measures. For example, more than 30% of companies in the Russell 2000 are unprofitable, with an even higher percentage of firms carrying substantial debt, often at floating rates. However, our experience managing small cap portfolios over the last three decades has reinforced our view that focusing on quality stocks will requite investors over time. While sluggish economic growth
HYPOTHETICAL GROWTH OF $10,000
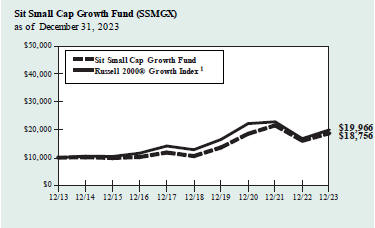
The chart above illustrates the total value of a hypothetical $10,000 investment in the Fund over the past 10 years as compared to the performance of the Russell 2000® Growth Index. Past performance does not guarantee future results. Returns include the reinvestment of distributions. The chart does not reflect the deduction of taxes that a shareholder would pay on Fund distributions or the redemption of Fund shares.
1 Russell 2000® Growth Index is an unmanaged index that measures the performance of those Russell 2000 Index companies with higher price-to-book ratios and higher forecasted growth values. It is not possible to invest directly in an index. This is the Fund’s primary index.
presents a challenge in 2024, identifying small cap firms that can generate double-digit earnings growth should reward investors. Consistent with our investment strategy across market capitalizations, small cap portfolios focus primarily on secular growth companies. For example, software is a sizable weight in our small cap portfolios and includes companies focused on cloud computing, digital transformation, and workforce productivity. Information technology consulting is another high-growth area for firms levered to cybersecurity, business transformation, and artificial intelligence adoption. Finally, although historically a highly cyclical industry, many engineering and construction firms will continue to benefit from higher infrastructure spending and secular growth in key end markets, including renewable energy, electrical grid modernization, and the reshoring of U.S. manufacturing.
| Roger J. Sit | Kent L. Johnson | |
| Robert W. Sit | ||
| Portfolio Managers | ||
Information on this page is unaudited.
| 34 | SIT MUTUAL FUNDS SEMI-ANNUAL REPORT | |
|
| COMPARATIVE RATES OF RETURNS |
| |||||||||||
as of December 31, 2023
|
| |||||||||||
| | Sit Small Cap Growth Fund | | | Russell 2000® Growth Index1 |
| | Russell 2000® Index 2 |
| ||||
Six Month | 3.26 | % | 4.50 | % | 8.18 | % | ||||||
One Year | 16.83 | 18.66 | 16.93 | |||||||||
Five Year | 12.16 | 9.22 | 9.97 | |||||||||
Ten Year | 6.49 | 7.16 | 7.16 | |||||||||
| Since Inception (7/1/94) | 9.76 | 7.83 | 8.94 | |||||||||
Performance figures are historical and do not guarantee future results. Investment returns and principal value will vary, and you may have a gain or loss when you sell shares. Current performance may be lower or higher than the performance data quoted. Contact the Fund for performance data current to the most recent month-end. Returns include changes in share price as well as reinvestment of all dividends and capital gains. Return do not reflect the deduction of the 2% redemption fee imposed if shares are redeemed or exchanged within 30 calendar days from their date of purchase. If imposed, the fee would reduce the performance quoted. Returns do not reflect the deduction of taxes that a shareholder would pay on Fund distributions or the redemption of Fund shares. Management fees and administrative expenses are included in the Fund’s performance. Returns for periods greater than one year are compounded average annual rates of return.
1 Russell 2000® Growth Index is an unmanaged index that measures the performance of those Russell 2000 Index companies with higher price-to-book ratios and higher forecasted growth values. It is not possible to invest directly in an index.
2 Russell 2000® Index is an unmanaged index that measures the performance of the 2,000 smallest companies in the Russell 3000® Index, an index consisting of the 3,000 largest U.S. companies based on market capitalization.
| PORTFOLIO SUMMARY | ||
Net Asset Value 12/31/23: | $60.34 Per Share | |
Net Asset Value 6/30/23: | $60.29 Per Share | |
Net Assets: | $109.2 Million | |
Weighted Average Market Cap: | $11.9 Billion | |
TOP 10 HOLDINGS
1. Monolithic Power Systems, Inc.
2. Arista Networks, Inc.
3. PTC, Inc.
4. Globant SA
5. Oasis Petroleum, Inc.
6. Northern Oil & Gas, Inc.
7. KBR, Inc.
8. Tenet Healthcare Corp.
9. TFI International, Inc.
10. Olin Corp.
Based on net assets as of December 31, 2023.
SECTOR ALLOCATION
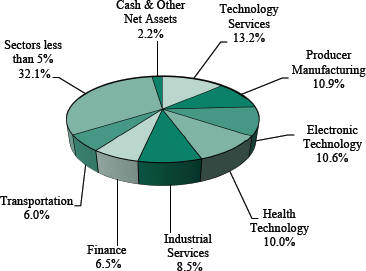
Based on net assets as of December 31, 2023.
Information on this page is unaudited.
| DECEMBER 31, 2023 | 35 | |
SCHEDULE OF INVESTMENTS (Unaudited)
December 31, 2023
Sit Small Cap Growth Fund
Investments are grouped by economic sectors.
| Name of Issuer | Quantity | Fair Value ($) | ||||||
Common Stocks - 97.8% | ||||||||
Commercial Services - 4.9% | ||||||||
ASGN, Inc. * | 17,500 | 1,682,975 | ||||||
Booz Allen Hamilton Holding Corp. | 13,150 | 1,682,017 | ||||||
Colliers International Group, Inc. | 11,050 | 1,398,046 | ||||||
FTI Consulting, Inc. * | 3,075 | 612,386 | ||||||
|
| |||||||
| 5,375,424 | ||||||||
|
| |||||||
Communications - 1.0% | ||||||||
Iridium Communications, Inc. | 26,175 | 1,077,363 | ||||||
|
| |||||||
Consumer Durables - 1.4% | ||||||||
Take-Two Interactive Software, Inc. * | 4,075 | 655,871 | ||||||
YETI Holdings, Inc. * | 15,850 | 820,713 | ||||||
|
| |||||||
| 1,476,584 | ||||||||
|
| |||||||
Consumer Non-Durables - 0.9% | ||||||||
Crocs, Inc. * | 10,675 | 997,152 | ||||||
|
| |||||||
Consumer Services - 2.3% | ||||||||
Nexstar Media Group, Inc. | 11,400 | 1,786,950 | ||||||
Vail Resorts, Inc. | 3,550 | 757,818 | ||||||
|
| |||||||
| 2,544,768 | ||||||||
|
| |||||||
Electronic Technology - 10.6% | ||||||||
Arista Networks, Inc. * | 13,325 | 3,138,171 | ||||||
Ciena Corp. * | 14,150 | 636,892 | ||||||
Coherent Corp. * | 20,075 | 873,865 | ||||||
Entegris, Inc. | 5,249 | 628,935 | ||||||
MKS Instruments, Inc. | 13,400 | 1,378,458 | ||||||
Monolithic Power Systems, Inc. | 5,025 | 3,169,669 | ||||||
Skyworks Solutions, Inc. | 9,500 | 1,067,990 | ||||||
Stratasys, Ltd. * | 46,175 | 659,379 | ||||||
|
| |||||||
| 11,553,359 | ||||||||
|
| |||||||
Energy Minerals - 4.5% | ||||||||
Northern Oil & Gas, Inc. | 65,575 | 2,430,865 | ||||||
Oasis Petroleum, Inc. | 15,100 | 2,510,073 | ||||||
|
| |||||||
| 4,940,938 | ||||||||
|
| |||||||
Finance - 6.5% | ||||||||
Air Lease Corp. | 33,325 | 1,397,651 | ||||||
Artisan Partners Asset Management, Inc. | 25,750 | 1,137,635 | ||||||
Axis Capital Holdings, Ltd. | 26,600 | 1,472,842 | ||||||
H&E Equipment Services, Inc. | 29,700 | 1,553,904 | ||||||
Hannon Armstrong Sust. Inf. Cap., Inc. | 25,800 | 711,564 | ||||||
Stifel Financial Corp. | 11,800 | 815,970 | ||||||
|
| |||||||
| 7,089,566 | ||||||||
|
| |||||||
Health Services - 4.9% | ||||||||
Addus HomeCare Corp. * | 18,550 | 1,722,368 | ||||||
Encompass Health Corp. | 19,675 | 1,312,716 | ||||||
| Name of Issuer | Quantity | Fair Value ($) | ||||||
Tenet Healthcare Corp. * | 30,700 | 2,319,999 | ||||||
|
| |||||||
| 5,355,083 | ||||||||
|
| |||||||
Health Technology - 10.0% | ||||||||
Align Technology, Inc. * | 2,150 | 589,100 | ||||||
AtriCure, Inc. * | 28,300 | 1,010,027 | ||||||
Bio-Techne Corp. | 14,800 | 1,141,968 | ||||||
Exact Sciences Corp. * | 12,425 | 919,202 | ||||||
Halozyme Therapeutics, Inc. * | 11,900 | 439,824 | ||||||
Inmode, Ltd. * | 23,350 | 519,304 | ||||||
Insulet Corp. * | 3,525 | 764,854 | ||||||
Intellia Therapeutics, Inc. * | 20,750 | 632,668 | ||||||
Lantheus Holdings, Inc. * | 28,075 | 1,740,650 | ||||||
Sarepta Therapeutics, Inc. * | 9,450 | 911,263 | ||||||
Seres Therapeutics, Inc. * | 206,150 | 288,610 | ||||||
STERIS, PLC | 6,675 | 1,467,499 | ||||||
Supernus Pharmaceuticals, Inc. * | 5,575 | 161,340 | ||||||
Vericel Corp. * | 8,525 | 303,575 | ||||||
|
| |||||||
| 10,889,884 | ||||||||
|
| |||||||
Industrial Services - 8.5% | ||||||||
EMCOR Group, Inc. | 9,600 | 2,068,128 | ||||||
KBR, Inc. | 43,500 | 2,410,335 | ||||||
MYR Group, Inc. * | 8,675 | 1,254,665 | ||||||
TechnipFMC, PLC | 73,550 | 1,481,297 | ||||||
Waste Connections, Inc. | 14,025 | 2,093,512 | ||||||
|
| |||||||
| 9,307,937 | ||||||||
|
| |||||||
Non-Energy Minerals - 4.9% | ||||||||
AZEK Co., Inc. * | 24,200 | 925,650 | ||||||
Eagle Materials, Inc. | 10,300 | 2,089,252 | ||||||
MP Materials Corp. * | 33,350 | 661,997 | ||||||
Trex Co., Inc. * | 20,825 | 1,724,102 | ||||||
|
| |||||||
| 5,401,001 | ||||||||
|
| |||||||
Process Industries - 3.1% | ||||||||
Avient Corp. | 13,200 | 548,724 | ||||||
Cabot Corp. | 7,700 | 642,950 | ||||||
Olin Corp. | 40,475 | 2,183,626 | ||||||
|
| |||||||
| 3,375,300 | ||||||||
|
| |||||||
Producer Manufacturing - 10.9% | ||||||||
AeroVironment, Inc. * | 5,225 | 658,559 | ||||||
AZZ, Inc. | 22,575 | 1,311,382 | ||||||
Belden, Inc. | 15,850 | 1,224,413 | ||||||
Carlisle Cos., Inc. | 2,200 | 687,346 | ||||||
Crane Co. | 16,050 | 1,896,147 | ||||||
Crane NXT Co. | 19,075 | 1,084,795 | ||||||
Donaldson Co., Inc. | 13,575 | 887,126 | ||||||
Hubbell, Inc. | 4,375 | 1,439,069 | ||||||
See accompanying notes to financial statements.
| 36 | SIT MUTUAL FUNDS SEMI-ANNUAL REPORT | |
| Name of Issuer | Quantity | Fair Value ($) | ||||||
Lincoln Electric Holdings, Inc. | 5,400 | 1,174,284 | ||||||
Regal Rexnord Corp. | 6,755 | 999,875 | ||||||
Zurn Water Solutions Corp. | 19,325 | 568,348 | ||||||
|
| |||||||
| 11,931,344 | ||||||||
|
| |||||||
Retail Trade - 3.7% | ||||||||
Boot Barn Holdings, Inc. * | 17,525 | 1,345,219 | ||||||
Casey’s General Stores, Inc. | 4,300 | 1,181,382 | ||||||
Ulta Beauty, Inc. * | 3,050 | 1,494,470 | ||||||
|
| |||||||
| 4,021,071 | ||||||||
|
| |||||||
Technology Services - 13.2% | ||||||||
Altair Engineering, Inc. * | 25,933 | 2,182,262 | ||||||
ANSYS, Inc. * | 2,950 | 1,070,496 | ||||||
Aspen Technology, Inc. * | 5,281 | 1,162,612 | ||||||
Euronet Worldwide, Inc. * | 5,050 | 512,525 | ||||||
Globant SA * | 11,350 | 2,701,073 | ||||||
HubSpot, Inc. * | 3,175 | 1,843,214 | ||||||
nCino, Inc. * | 15,975 | 537,239 | ||||||
Paycom Software, Inc. | 6,225 | 1,286,832 | ||||||
PTC, Inc. * | 17,600 | 3,079,296 | ||||||
|
| |||||||
| 14,375,549 | ||||||||
|
| |||||||
Transportation - 6.0% | ||||||||
Alaska Air Group, Inc. * | 17,675 | 690,562 | ||||||
Golar LNG, Ltd. | 68,100 | 1,565,619 | ||||||
Knight-Swift Transportation Holdings, Inc. | 18,725 | 1,079,496 | ||||||
Marten Transport, Ltd. | 48,000 | 1,007,040 | ||||||
TFI International, Inc. | 16,525 | 2,247,070 | ||||||
|
| |||||||
| 6,589,787 | ||||||||
|
| |||||||
Utilities - 0.5% | ||||||||
Chesapeake Utilities Corp. | 4,925 | 520,228 | ||||||
|
| |||||||
Total Common Stocks | 106,822,338 | |||||||
|
| |||||||
Short-Term Securities - 2.0% | ||||||||
Fidelity Inst. Money Mkt. Gvt. Fund, 5.29% | 2,134,515 | 2,134,515 | ||||||
|
| |||||||
Total Investments in Securities - 99.8% | 108,956,853 | |||||||
Other Assets and Liabilities, net - 0.2% | 241,684 | |||||||
|
| |||||||
Net Assets - 100.0% | $109,198,537 | |||||||
|
| |||||||
| * | Non-income producing security. |
PLC — Public Limited Company
Numeric footnotes not disclosed are not applicable to this Schedule of Investments.
See accompanying notes to financial statements.
| DECEMBER 31, 2023 | 37 | |
SCHEDULE OF INVESTMENTS (Unaudited)
December 31, 2023
Sit Small Cap Growth Fund (Continued)
A summary of the levels for the Fund’s investments as of December 31, 2023 is as follows (see Note 2 - significant accounting policies in the notes to financial statements):
| Investment in Securities | ||||||||||||||||
| Level 1 | Level 2 | Level 3 | ||||||||||||||
| Quoted | Other significant | Significant | ||||||||||||||
| Prices ($) | observable inputs ($) | unobservable inputs ($) | Total ($) | |||||||||||||
Common Stocks** | 106,822,338 | — | — | 106,822,338 | ||||||||||||
Short-Term Securities | 2,134,515 | — | — | 2,134,515 | ||||||||||||
Total: | 108,956,853 | — | — | 108,956,853 | ||||||||||||
| ** | For equity securities categorized in a single level, refer to the detail above for further breakdown. |
There were no transfers into or out of level 3 during the reporting period.
See accompanying notes to financial statements.
| 38 | SIT MUTUAL FUNDS SEMI-ANNUAL REPORT | |
|
[This page is intentionally left blank.]
| DECEMBER 31, 2023 | 39 | |
OBJECTIVE & STRATEGY
The objective of the Sit International Growth Fund is long-term growth. The Fund seeks to achieve its objective by investing, under normal market conditions, at least 90% of its net assets in common stocks of growth companies domiciled outside the United States. In selecting investments for the Fund, the Adviser begins by selecting countries or regions in which to invest by considering several factors affecting the economy and equity market of foreign countries and regions. After the country and regional allocations are determined, the Adviser seeks industries and sectors that it believes have earnings growth prospects that are greater than the average. Within the selected industries and sectors, the Adviser invests in foreign growth-oriented companies it believes exhibit the potential for superior growth.
Fund Performance
The Sit International Growth Fund posted a return of +5.24% for the 6-month period ended December 31, 2023, underperforming the MSCI EAFE Index return of +5.88%.
Factors that Influenced the Fund’s Performance
The Fund underperformed its benchmark during the 6-month period due to weak economic growth in the euro area, China’s slower-than-expected economic recovery, elevated inflation, high interest rates, and geopolitical tensions. Contributing to underperformance were the Fund’s holdings in pharmaceuticals biotechnology & life sciences sector, where it owned Lonza Group AG and AstraZeneca plc and did not own Novo Nordisk, and materials, where it owned LG Chem. The Fund’s large underweight in banks also detracted from returns. Conversely, performance was helped by exposure to the software & services, financial services, and semiconductors & semiconductor equipment sectors, including positions in Atlassian, Globant SA, Partners Group, and Broadcom. Geographically, holdings in the United Kingdom and Japan detracted from performance, whereas those in Euroland, Latin America, and North America added to returns.
Outlook and Positioning
The U.S. economy enters 2024 on a solid footing, as supply chains have largely normalized, labor markets are becoming less tight, inflation continues to recede, and consumer spending remains resilient. Moreover, global central banks are shifting toward coordinated monetary loosening on declining inflation risks and heightened recession worries. Euro area growth expectations remain subdued amidst geopolitical tensions and a sluggish economic environment, yet there is room for optimism as real wages return to growth, consumer excess savings remain elevated, and diminishing inflation fuels the prospect of lower rates. In Japan, we project real GDP growth will moderate to +1.0% in 2024 from +1.8% in 2023, as the services recovery that sustained growth since early 2022 has run its course. As for China, we expect the post-pandemic decelerating trend there to continue into 2024, with real GDP growing +4.5% to +5.0%, as the economy is still undergoing structural rebalancing. China’s key growth driver, consumption, will moderate as the reopening effects fade, and investment growth will likely remain stable or slightly improve, partially reflecting policy support. Emerging Markets ex-
HYPOTHETICAL GROWTH OF $10,000
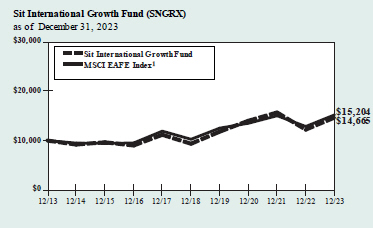
The chart above illustrates the total value of a hypothetical $10,000 investment in the Fund over the past 10 years as compared to the performance of the MSCI EAFE Index. Past performance does not guarantee future results. Returns include the reinvestment of distributions. The chart does not reflect the deduction of taxes that a shareholder would pay on Fund distributions or the redemption of Fund shares.
1 MSCI EAFE Index (Europe, Australasia, Far East) is an unmanaged free float adjusted market capitalization index that measures the equity market performance of developed markets, excluding the US & Canada. It is not possible to invest directly in an index. This is the Fund’s primary index.
China growth has recovered on strong domestic demand and manufacturing cycle recovery. Yet, EM inflation remains elevated because of higher services and food costs. Regarding strategy, as Europe’s economic environment gradually improves and interest rates come down, early cyclicals look attractive, and we expect improved conditions for long-duration, pure growth, and small cap stocks, supported by expectations that lower rates will support higher valuations. We continue to underweight Japanese equities, as moderating real GDP growth and an uncertain monetary policy backdrop give us pause near-term, while structural challenges, such as an aging population and elevated public debt levels, keep us cautious longer term. Our Japan holdings have exposure to more dynamic overseas markets and defensive domestic consumption stocks. In China, we have adopted a barbell strategy of cyclical/secular growth and defensive stocks. We favor high-quality industries with improving fundamentals, such as life insurance, Macau gaming, internet names, consumer staples, healthcare, and utilities.
Roger J. Sit
Portfolio Manager
Information on this page is unaudited.
| 40 | SIT MUTUAL FUNDS SEMI-ANNUAL REPORT | |
|
COMPARATIVE RATES OF RETURNS
|
| |||||||
as of December 31, 2023 |
| |||||||
Sit International | MSCI EAFE Index1 | |||||||
Six Month | 5.24% | 5.88 | % | |||||
One Year | 19.96 | 18.24 | ||||||
Five Year | 9.39 | 8.16 | ||||||
Ten Year | 3.90 | 4.28 | ||||||
Since Inception (11/1/91) | 4.28 | 5.35 | ||||||
Performance figures are historical and do not guarantee future results. Investment returns and principal value will vary, and you may have a gain or loss when you sell shares. Current performance may be lower or higher than the performance data quoted. Contact the Fund for performance data current to the most recent month-end. Returns include changes in share price as well as reinvestment of all dividends and capital gains and all fee waivers. Without the fee waivers total return and yield figures would have been lower. Returns do not reflect the deduction of the 2% redemption fee imposed if shares are redeemed or exchanged within 30 calendar days from their date of purchase. If imposed, the fee would reduce the performance quoted. Returns do not reflect the deduction of taxes that a shareholder would pay on Fund distributions or the redemption of Fund shares. Management fees and administrative expenses are included in the Fund’s performance. Returns for periods greater than one year are compounded average annual rates of return.
1 MSCI EAFE Index (Europe, Australasia Far East) is an unmanaged free float adjusted market capitalization index that measures the equity market performance of developed markets, excluding the US & Canada.
FUND DIVERSIFICATION-BY REGION
| Sit International Growth Fund | MSCI EAFE Index | |||
Europe | 63.7% | 64.8% | ||
Asia/Pacific | 22.8 | 34.5 | ||
North America | 10.6 | — | ||
Latin America | 1.8 | — | ||
Africa/Middle East | — | 0.7 | ||
Cash & Other Net Assets | 1.1 | — |
Based on net assets as of December 31, 2023.
PORTFOLIO SUMMARY
| ||||
Net Asset Value 12/31/23: | $21.25 Per Share | |||
Net Asset Value 6/30/23: | $20.62 Per Share | |||
Net Assets: | $27.3 Million | |||
Weighted Average Market Cap: | $106.9 Billion | |||
TOP 10 HOLDINGS
|
1. Broadcom, Inc.
2. Schneider Electric SE
3. Shell, PLC, ADR
4. ASML Holding NV
5. BAE Systems, PLC
6. Partners Group Holding AG
7. AstraZeneca, PLC, ADR
8. London Stock Exchange Group, PLC
9. Iberdrola SA
10. Allianz SE
Based on net assets as of December 31, 2023.
SECTOR ALLOCATION
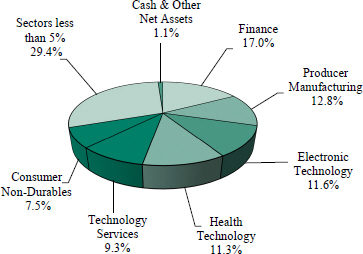
Based on net assets as of December 31, 2023.
Information on this page is unaudited.
| DECEMBER 31, 2023 | 41 | |
SCHEDULE OF INVESTMENTS (Unaudited)
December 31, 2023
Sit International Growth Fund
Investments are grouped by geographic region.
| Name of Issuer | Quantity | Fair Value ($) | ||||||
Common Stocks - 98.3% | ||||||||
Asia - 22.2% | ||||||||
Australia - 6.1% | ||||||||
Atlassian Corp. * | 1,825 | 434,094 | ||||||
BHP Group, Ltd., ADR | 4,200 | 286,902 | ||||||
Lynas Rare Earths, Ltd. * | 46,625 | 227,492 | ||||||
Macquarie Group, Ltd. | 2,225 | 278,425 | ||||||
Rio Tinto, PLC, ADR | 4,400 | 327,624 | ||||||
Westpac Banking Corp. | 4,425 | 69,053 | ||||||
Woodside Energy Group, Ltd., ADR | 1,517 | 31,994 | ||||||
|
|
| ||||||
| 1,655,584 | ||||||||
|
|
| ||||||
China/Hong Kong - 2.8% | ||||||||
AIA Group, Ltd. | 32,200 | 280,619 | ||||||
Baidu, Inc., ADR * | 1,075 | 128,022 | ||||||
Budweiser Brewing Co. APAC, Ltd. 4 | 45,100 | 84,442 | ||||||
ENN Energy Holdings, Ltd. | 18,400 | 135,493 | ||||||
Ping An Insurance Group Co. of China, Ltd. | 33,500 | 151,658 | ||||||
|
|
| ||||||
| 780,234 | ||||||||
|
|
| ||||||
Japan - 8.3% | ||||||||
Astellas Pharma, Inc. | 17,700 | 211,647 | ||||||
Keyence Corp. | 1,000 | 440,567 | ||||||
Recruit Holdings Co., Ltd. | 11,200 | 473,657 | ||||||
Shiseido Co., Ltd. | 4,100 | 123,639 | ||||||
Sony Group Corp., ADR | 6,300 | 596,547 | ||||||
Terumo Corp. | 13,100 | 429,420 | ||||||
|
|
| ||||||
| 2,275,477 | ||||||||
|
|
| ||||||
Singapore - 2.6% | ||||||||
DBS Group Holdings, Ltd. | 15,600 | 394,920 | ||||||
Singapore Technologies Engineering, Ltd. | 104,800 | 308,901 | ||||||
|
|
| ||||||
| 703,821 | ||||||||
|
|
| ||||||
South Korea - 2.4% | ||||||||
LG Chem, Ltd. | 975 | 377,766 | ||||||
Samsung Electronics Co., Ltd., GDR | 185 | 277,130 | ||||||
|
|
| ||||||
| 654,896 | ||||||||
|
|
| ||||||
Europe - 63.7% | ||||||||
Denmark - 0.8% | ||||||||
Novo Nordisk A/S, ADR | 2,125 | 219,831 | ||||||
|
|
| ||||||
France - 9.8% | ||||||||
AXA SA | 11,750 | 382,527 | ||||||
Dassault Systemes SE | 11,700 | 571,349 | ||||||
Elis SA | 8,125 | 169,435 | ||||||
Forvia SE * | 7,166 | 161,541 | ||||||
Safran SA | 2,925 | 514,905 | ||||||
Schneider Electric SE | 4,400 | 882,974 | ||||||
|
|
| ||||||
| 2,682,731 | ||||||||
|
|
| ||||||
Germany - 7.4% | ||||||||
Allianz SE | 2,250 | 600,977 | ||||||
Deutsche Post AG | 6,550 | 324,341 | ||||||
Infineon Technologies AG | 4,100 | 171,090 | ||||||
Muenchener Rueckversicherungs AG | 800 | 331,273 | ||||||
Siemens AG | 3,100 | 581,508 | ||||||
|
|
| ||||||
| 2,009,189 | ||||||||
|
|
| ||||||
| Name of Issuer | Quantity | Fair Value ($) | ||||||
Ireland - 4.0% | ||||||||
Accenture, PLC | 550 | 193,001 | ||||||
Aptiv, PLC * | 1,225 | 109,907 | ||||||
CRH, PLC | 4,800 | 331,968 | ||||||
Linde, PLC | 500 | 205,355 | ||||||
STERIS, PLC | 1,175 | 258,324 | ||||||
|
|
| ||||||
| 1,098,555 | ||||||||
|
|
| ||||||
Netherlands - 4.6% | ||||||||
Adyen NV *, 4 | 84 | 108,181 | ||||||
ASML Holding NV | 1,025 | 775,843 | ||||||
Stellantis NV | 16,375 | 381,865 | ||||||
|
|
| ||||||
| 1,265,889 | ||||||||
|
|
| ||||||
Spain - 2.9% | ||||||||
Cellnex Telecom SA 4 | 5,200 | 204,708 | ||||||
Iberdrola SA | 45,900 | 601,468 | ||||||
|
|
| ||||||
| 806,176 | ||||||||
|
|
| ||||||
Sweden - 1.1% | ||||||||
Evolution AB, ADR | 1,000 | 119,410 | ||||||
Hexagon AB | 16,200 | 194,267 | ||||||
|
|
| ||||||
| 313,677 | ||||||||
|
|
| ||||||
Switzerland - 10.0% | ||||||||
Logitech International SA | 2,325 | 221,015 | ||||||
Lonza Group AG | 590 | 248,122 | ||||||
Nestle SA | 3,600 | 417,378 | ||||||
Novartis AG | 1,325 | 133,705 | ||||||
On Holding AG * | 8,625 | 232,616 | ||||||
Partners Group Holding AG | 490 | 706,700 | ||||||
Roche Holding AG | 875 | 254,370 | ||||||
TE Connectivity, Ltd. | 1,100 | 154,550 | ||||||
Zurich Insurance Group AG | 680 | 355,422 | ||||||
|
|
| ||||||
| 2,723,878 | ||||||||
|
|
| ||||||
United Kingdom - 23.1% | ||||||||
Ashtead Group, PLC | 3,075 | 214,086 | ||||||
AstraZeneca, PLC, ADR | 10,125 | 681,919 | ||||||
BAE Systems, PLC | 52,600 | 744,552 | ||||||
Coca-Cola Europacific Partners, PLC | 5,400 | 360,396 | ||||||
Compass Group, PLC | 10,625 | 290,636 | ||||||
Dechra Pharmaceuticals, PLC | 6,300 | 309,809 | ||||||
Diageo, PLC, ADR | 1,840 | 268,014 | ||||||
Entain, PLC | 20,350 | 257,887 | ||||||
Glencore, PLC, ADR | 14,500 | 173,710 | ||||||
London Stock Exchange Group, PLC | 5,100 | 602,876 | ||||||
Man Group, PLC | 93,600 | 277,509 | ||||||
Reckitt Benckiser Group, PLC | 3,100 | 214,167 | ||||||
RELX, PLC | 12,275 | 485,396 | ||||||
Rentokil Initial, PLC | 47,250 | 265,482 | ||||||
Shell, PLC, ADR | 12,250 | 806,050 | ||||||
Smith & Nephew, PLC | 25,250 | 347,114 | ||||||
|
|
| ||||||
| 6,299,603 | ||||||||
|
|
| ||||||
Latin America - 1.8% | ||||||||
Argentina - 1.8% | ||||||||
Globant SA * | 2,050 | 487,859 | ||||||
|
|
| ||||||
See accompanying notes to financial statements.
| 42 | SIT MUTUAL FUNDS SEMI-ANNUAL REPORT | |
| Name of Issuer | Quantity | Fair Value ($) | ||||||
North America - 10.6% | ||||||||
Canada - 4.6% | ||||||||
Alimentation Couche-Tard, Inc. | 7,400 | 435,774 | ||||||
Colliers International Group, Inc. | 1,600 | 202,432 | ||||||
Lululemon Athletica, Inc. * | 400 | 204,516 | ||||||
Waste Connections, Inc. | 2,750 | 410,492 | ||||||
|
| |||||||
| 1,253,214 | ||||||||
|
| |||||||
United States - 6.0% | ||||||||
Broadcom, Inc. | 1,025 | 1,144,156 | ||||||
Euronet Worldwide, Inc. * | 1,375 | 139,549 | ||||||
Mondelez International, Inc. | 4,800 | 347,664 | ||||||
|
| |||||||
| 1,631,369 | ||||||||
|
| |||||||
Total Common Stocks | 26,861,983 | |||||||
|
| |||||||
Investment Companies 0.6% | ||||||||
iShares MSCI India ETF | 3,200 | 156,192 | ||||||
|
| |||||||
Short-Term Securities - 0.8% | ||||||||
Fidelity Inst. Money Mkt. Gvt. Fund, 5.29% | 211,633 | 211,633 | ||||||
|
| |||||||
Total Investments in Securities - 99.7% | 27,229,808 | |||||||
Other Assets and Liabilities, net - 0.3% | 94,918 | |||||||
|
| |||||||
Net Assets - 100.0% | $27,324,726 | |||||||
|
| |||||||
| * | Non-income producing security. |
| 4 | 144A Restricted Security. The total value of such securities as of December 31, 2023 was $397,331 and represented 1.5% of net assets. These securities have been determined to be liquid by the Adviser in accordance with guidelines established by the Board of Directors. |
ADR — American Depositary Receipt
GDR — Global Depositary Receipt
PLC — Public Limited Company
Numeric footnotes not disclosed are not applicable to this Schedule of Investments.
See accompanying notes to financial statements.
| DECEMBER 31, 2023 | 43 | |
SCHEDULE OF INVESTMENTS (Unaudited)
December 31, 2023
Sit International Growth Fund (Continued)
A summary of the levels for the Fund’s investments as of December 31, 2023 is as follows (see Note 2 - significant accounting policies in the notes to financial statements):
| Investment in Securities | ||||||||||||||||
| Level 1 | Level 2 | Level 3 | ||||||||||||||
| Quoted | Other significant | Significant | ||||||||||||||
| Prices ($) | observable inputs ($) | unobservable inputs ($) | Total ($) | |||||||||||||
Common Stocks | ||||||||||||||||
Argentina | 487,859 | — | — | 487,859 | ||||||||||||
Australia | 1,655,584 | — | — | 1,655,584 | ||||||||||||
Canada | 1,253,214 | — | — | 1,253,214 | ||||||||||||
China/Hong Kong | 780,234 | — | — | 780,234 | ||||||||||||
Denmark | 219,831 | — | — | 219,831 | ||||||||||||
France | 2,682,731 | — | — | 2,682,731 | ||||||||||||
Germany | 2,009,189 | — | — | 2,009,189 | ||||||||||||
Ireland | 1,098,555 | — | — | 1,098,555 | ||||||||||||
Japan | 2,275,477 | — | — | 2,275,477 | ||||||||||||
Netherlands | 1,265,889 | — | — | 1,265,889 | ||||||||||||
Singapore | 703,821 | — | — | 703,821 | ||||||||||||
South Korea | 654,896 | — | — | 654,896 | ||||||||||||
Spain | 806,176 | — | — | 806,176 | ||||||||||||
Sweden | 313,677 | — | — | 313,677 | ||||||||||||
Switzerland | 2,723,878 | — | — | 2,723,878 | ||||||||||||
United Kingdom | 6,299,603 | — | — | 6,299,603 | ||||||||||||
United States | 1,631,369 | — | — | 1,631,369 | ||||||||||||
Investment Companies | 156,192 | — | — | 156,192 | ||||||||||||
Short-Term Securities | 211,633 | — | — | 211,633 | ||||||||||||
Total: | 27,229,808 | — | — | 27,229,808 | ||||||||||||
Level 1 securities of foreign issuers are primarily American Depositary Receipts (ADRs), Public Limited Companies (PLCs) or Global Depositary Receipts (GDRs). There were no transfers into or out of level 3 during the reporting period.
See accompanying notes to financial statements.
| 44 | SIT MUTUAL FUNDS SEMI-ANNUAL REPORT | |
|
[This page is intentionally left blank.]
| DECEMBER 31, 2023 | 45 | |
OBJECTIVE & STRATEGY
The objective of the Sit Developing Markets Growth Fund is to maximize long-term capital appreciation. The Fund seeks to achieve its objective by investing, under normal market conditions, at least 80% of its net assets in common stocks of companies domiciled or operating in a developing market. In selecting investments for the Fund, the Adviser begins by selecting countries or regions in which to invest by considering several factors affecting the economy and equity market of foreign countries and regions. After the country and regional allocations are determined, the Adviser seeks industries and sectors that appear to have strong earnings growth prospects. Within the selected industries and sectors, the Adviser invests in foreign growth-oriented companies it believes exhibit the potential for superior growth.
Fund Performance
The Sit Developing Markets Growth Fund returned +0.38% during the 6-month period ended December 31, 2023, compared to the MSCI Emerging Markets Index return of +3.46%.
Factors that Influenced the Fund’s Performance
The Fund underperformed its benchmark on China’s slower-than-expected economic recovery, elevated inflation, high interest rates, and geopolitical tensions. Contributing to underperformance during the 6-month period were the Fund’s stock selection in the utilities, consumer discretionary distribution & retail, and food beverage & tobacco sectors, including holdings of ENN Energy Holdings, China Mengniu Dairy, and Budweiser Brewing. On the positive side, sectors that helped performance were semiconductors & semiconductor equipment and software & services, where the Fund held Broadcom, Globant SA, and Atlassian. Geographically, stock selection in the Asia/Pacific Ex Japan region hurt performance the most, while the underweight in Africa/Mideast also detracted from returns. Conversely, holdings in Latin America and North America helped performance.
Outlook and Positioning
We forecast emerging market GDP growth of +4.0% in 2024, driven by strong India economic growth, expected interest rate cuts, and China’s continued economic expansion. India’s GDP should grow about +7.0% in fiscal year 2024 on resilient domestic demand and investment. Additionally, we anticipate better economic growth for Mexico and Brazil, fueled by domestic consumption and industrial activity. Emerging markets’ inflation has peaked, due to lower oil/commodity prices and supply chain improvements. However, elevated inflation from higher services and food costs is delaying interest rate cuts. Still, we foresee inflation continuing to subside as global supply chains improve, leading to renewed interest rate cuts. Brazil’s central bank has cut interest rates -200 basis points to 11.75%, as inflation fell to +4.62% in December 2023. China’s economic recovery was bumpy and uneven in 2023, and we anticipate the post-pandemic decelerating trend to continue into 2024. China’s economy is still undergoing structural rebalancing away from a property-driven and debt-driven GDP growth. We forecast China will grow +4.5% to +5.0% in 2024, led by consumption, investment, accommodative monetary policy, and a more prominent role of fiscal policy.
HYPOTHETICAL GROWTH OF $10,000
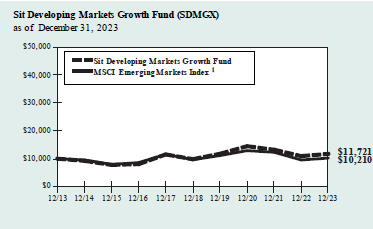
The chart above illustrates the total value of a hypothetical $10,000 investment in the Fund over the past 10 years as compared to the performance of the MSCI Emerging Markets Index. Past performance does not guarantee future results. Returns include the reinvestment of distributions. The chart does not reflect the deduction of taxes that a shareholder would pay on Fund distributions or the redemption of Fund shares.
1 MSCI Emerging Markets Index is an unmanaged free float-adjusted market capitalization index that measures equity market performance of emerging markets. It is not possible to invest directly in an index. This is the Fund’s primary index.
We are optimistic the macro recovery will regain momentum and for an improvement in U.S./China relations. Emerging Markets Ex-China growth has recovered on strong domestic demand and manufacturing cycle recovery. Yet, EM inflation remains elevated because of higher services and food costs. Regarding strategy, we remain positive on equities in China, South Korea, Singapore, India, Mexico, and Brazil on improving economic and earnings outlooks. In China, we have adopted a barbell strategy of cyclical/secular growth and defensive stocks. We favor high-quality industries with improving fundamentals, like life insurance, Macau gaming, and some internet names, balanced with defensive exposure in consumer staples, healthcare, and utilities. Our preferred sectors in EM are financials, e-commerce, gaming, consumer staples, industrials, renewable energy, technology, and basic materials.
Roger J. Sit | Raymond E. Sit | |
Portfolio Managers | ||
Information on this page is unaudited.
| 46 | SIT MUTUAL FUNDS SEMI-ANNUAL REPORT | |
|
COMPARATIVE RATES OF RETURNS
as of December 31, 2023
| Sit Developing Markets Growth Fund | MSCI Emerging Markets Index1 | |||||||
Six Month | 0.38% | 3.46% | ||||||
One Year | 7.33 | 7.04 | ||||||
Five Year | 3.62 | 1.17 | ||||||
Ten Year | 1.60 | 0.21 | ||||||
Since Inception (7/1/94) | 3.64 | 2.60 | ||||||
Performance figures are historical and do not guarantee future results. Investment returns and principal value will vary, and you may have a gain or loss when you sell shares. Current performance may be lower or higher than the performance data quoted. Contact the Fund for performance data current to the most recent month-end. Returns include changes in share price as well as reinvestment of all dividends and capital gains. Returns do not reflect the deduction of the 2% redemption fee imposed if shares are redeemed or exchanged within 30 calendar days from their date of purchase. If imposed, the fee would reduce the performance quoted. Returns do not reflect the deduction of taxes that a shareholder would pay on Fund distributions or the redemption of Fund shares. Management fees and administrative expenses are included in the Fund’s performance. Returns for periods greater than one year are compounded average annual rates of return.
1 MSCI Emerging Markets Index is an unmanaged free float-adjusted market capitalization index that measures equity market performance of emerging markets. It is not possible to invest directly in an index.
FUND DIVERSIFICATION BY- REGION
| Sit Developing Markets Growth Fund | MSCI Emerging Markets Index | |||
Asia/Pacific | 70.4% | 77.8% | ||
Latin America | 9.4 | 9.5 | ||
North America | 9.3 | — | ||
Africa/Middle East | 8.7 | 10.2 | ||
Europe | 1.2 | 2.5 | ||
Cash & Other Net Assets | 1.0 | — |
Based on net assets as of December 31, 2023.
PORTFOLIO SUMMARY
Net Asset Value 12/31/23: | $15.79 Per Share | |
Net Asset Value 6/30/23: | $16.06 Per Share | |
Net Assets: | $9.6 Million | |
Weighted Average Market Cap: | $137.7 Billion |
TOP 10 HOLDINGS
1. Taiwan Semiconductor Co.
2. Samsung Electronics Co., Ltd.
3. Broadcom, Inc.
4. iShares MSCI India ETF
5. DBS Group Holdings, Ltd.
6. HDFC Bank, Ltd., ADR
7. Southern Copper Corp.
8. Tencent Holdings, Ltd.
9. Bid Corp., Ltd.
10. Globant SA
Based on net assets as of December 31, 2023.
SECTOR ALLOCATION
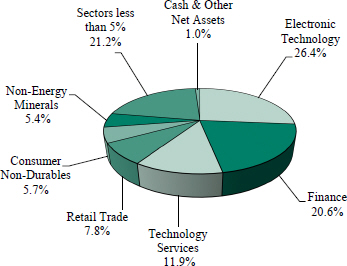
Based on net assets as of December 31, 2023.
Information on this page is unaudited.
| DECEMBER 31, 2023 | 47 | |
SCHEDULE OF INVESTMENTS (Unaudited)
December 31, 2023
Sit Developing Markets Growth Fund
Investments are grouped by geographic region.
| Name of Issuer | Quantity | Fair Value ($) | ||||||
Common Stocks - 94.0% | ||||||||
Africa/Middle East - 8.7% | ||||||||
Israel - 2.2% | ||||||||
NICE, Ltd., ADR * | 1,050 | 209,486 | ||||||
|
| |||||||
South Africa - 6.5% | ||||||||
Bid Corp., Ltd. | 13,200 | 307,874 | ||||||
Bidvest Group, Ltd. | 5,525 | 76,201 | ||||||
Naspers, Ltd. | 1,425 | 243,673 | ||||||
|
| |||||||
| 627,748 | ||||||||
|
| |||||||
Asia - 65.4% | ||||||||
Australia - 3.0% | ||||||||
Atlassian Corp. * | 450 | 107,037 | ||||||
Rio Tinto, PLC, ADR | 2,475 | 184,289 | ||||||
|
| |||||||
| 291,326 | ||||||||
|
| |||||||
China/Hong Kong - 24.6% | ||||||||
AIA Group, Ltd. | 21,400 | 186,498 | ||||||
Alibaba Group Holding, Ltd., ADR | 2,700 | 209,277 | ||||||
Baidu, Inc., ADR * | 1,100 | 130,999 | ||||||
Budweiser Brewing Co. APAC, Ltd. 4 | 46,000 | 86,127 | ||||||
China International Capital Corp., Ltd. 4 | 58,400 | 85,710 | ||||||
China Mengniu Dairy Co., Ltd. | 43,000 | 115,643 | ||||||
China Petroleum & Chemical Corp. | 140,000 | 73,330 | ||||||
CSPC Pharmaceutical Group, Ltd. | 192,400 | 178,885 | ||||||
ENN Energy Holdings, Ltd. | 19,800 | 145,803 | ||||||
GDS Holdings, Ltd., ADR * | 1,000 | 9,120 | ||||||
Hong Kong Exchanges & Clearing, Ltd. | 5,100 | 175,040 | ||||||
JD.com, Inc., ADR | 1,700 | 49,113 | ||||||
Jiumaojiu International Holdings, Ltd. 4 | 9,000 | 7,031 | ||||||
LK Technology Holdings, Ltd. | 72,500 | 46,795 | ||||||
Meituan *, 4 | 6,820 | 71,532 | ||||||
Ping An Insurance Group Co. of China, Ltd. | 19,900 | 90,090 | ||||||
Sands China, Ltd. * | 42,400 | 124,075 | ||||||
Sinopharm Group Co., Ltd. | 44,900 | 117,590 | ||||||
Tencent Holdings, Ltd. | 8,200 | 308,320 | ||||||
Trip.com Group, Ltd., ADR * | 4,450 | 160,245 | ||||||
|
| |||||||
| 2,371,223 | ||||||||
|
| |||||||
India - 3.7% | ||||||||
HDFC Bank, Ltd., ADR | 5,350 | 359,039 | ||||||
|
| |||||||
Indonesia - 1.9% | ||||||||
Astra International Tbk PT | 176,000 | 64,584 | ||||||
XL Axiata Tbk PT | 948,800 | 123,245 | ||||||
|
| |||||||
| 187,829 | ||||||||
|
| |||||||
Singapore - 7.0% | ||||||||
DBS Group Holdings, Ltd. | 14,500 | 367,073 | ||||||
Flex, Ltd. * | 4,000 | 121,840 | ||||||
Sea, Ltd, ADR * | 1,225 | 49,613 | ||||||
Singapore Technologies Engineering, Ltd. | 44,000 | 129,691 | ||||||
|
| |||||||
| 668,217 | ||||||||
|
| |||||||
South Korea - 12.4% | ||||||||
LG Chem, Ltd. | 575 | 222,785 | ||||||
NAVER Corp. * | 450 | 78,267 | ||||||
Samsung Electronics Co., Ltd. | 10,925 | 665,900 | ||||||
| Name of Issuer | Quantity | Fair Value ($) | ||||||
Shinhan Financial Group Co., Ltd. | 7,200 | 224,458 | ||||||
|
| |||||||
| 1,191,410 | ||||||||
|
| |||||||
Taiwan - 11.1% | ||||||||
Cathay Financial Holding Co., Ltd. | 88,784 | 132,349 | ||||||
Hon Hai Precision Industry Co., Ltd., GDR | 23,700 | 161,634 | ||||||
Taiwan Semiconductor Co. | 37,482 | 724,225 | ||||||
Taiwan Semiconductor Co., ADR | 460 | 47,840 | ||||||
|
| |||||||
| 1,066,048 | ||||||||
|
| |||||||
Thailand - 1.7% | ||||||||
Bangkok Bank PCL | 36,500 | 167,355 | ||||||
|
| |||||||
Europe - 1.2% | ||||||||
Netherlands - 1.2% | ||||||||
Prosus NV | 3,705 | 110,372 | ||||||
|
| |||||||
Latin America - 9.4% | ||||||||
Argentina - 2.9% | ||||||||
Globant SA * | 1,175 | 279,626 | ||||||
|
| |||||||
Brazil - 2.0% | ||||||||
Ambev SA, ADR | 21,575 | 60,410 | ||||||
Banco Bradesco SA | 30,350 | 106,778 | ||||||
Lojas Renner SA | 8,130 | 29,155 | ||||||
|
| |||||||
| 196,343 | ||||||||
|
| |||||||
Chile - 1.0% | ||||||||
Banco Santander Chile, ADR | 4,700 | 91,603 | ||||||
|
| |||||||
Peru - 3.5% | ||||||||
Southern Copper Corp. | 3,900 | 335,673 | ||||||
|
| |||||||
North America - 9.3% | ||||||||
Mexico - 3.0% | ||||||||
Fomento Economico Mexicano, ADR | 1,575 | 205,301 | ||||||
Grupo Bimbo SAB de CV | 16,000 | 80,900 | ||||||
|
| |||||||
| 286,201 | ||||||||
|
| |||||||
United States - 6.3% | ||||||||
Broadcom, Inc. | 470 | 524,638 | ||||||
Skyworks Solutions, Inc. | 775 | 87,125 | ||||||
|
| |||||||
| 611,763 | ||||||||
|
| |||||||
Total Common Stocks | 9,051,262 | |||||||
|
| |||||||
Investment Companies 5.0% | ||||||||
iShares MSCI India ETF | 9,750 | 475,898 | ||||||
|
| |||||||
Short-Term Securities - 0.9% | ||||||||
Fidelity Inst. Money Mkt. Gvt. Fund, 5.29% | 90,137 | 90,137 | ||||||
|
| |||||||
Total Investments in Securities - 99.9% | 9,617,297 | |||||||
Other Assets and Liabilities, net - 0.1% | 14,165 | |||||||
|
| |||||||
Net Assets - 100.0% | $9,631,462 | |||||||
|
| |||||||
See accompanying notes to financial statements.
| 48 | SIT MUTUAL FUNDS SEMI-ANNUAL REPORT | |
| * | Non-income producing security. |
| 4 | 144A Restricted Security. The total value of such securities as of December 31, 2023 was $250,400 and represented 2.6% of net assets. These securities have been determined to be liquid by the Adviser in accordance with guidelines established by the Board of Directors. |
ADR — American Depositary Receipt
GDR — Global Depositary Receipt
PLC — Public Limited Company
Numeric footnotes not disclosed are not applicable to this Schedule of Investments.
A summary of the levels for the Fund’s investments as of December 31, 2023 is as follows (see Note 2 - significant accounting policies in the notes to financial statements):
| Investment in Securities | ||||||||||||||||
Level 1 | Level 2 | Level 3 | ||||||||||||||
| Quoted Prices ($) | Other significant observable inputs ($) | Significant unobservable inputs ($) | Total ($) | |||||||||||||
Common Stocks | ||||||||||||||||
Argentina | 279,626 | — | — | 279,626 | ||||||||||||
Australia | 291,326 | — | — | 291,326 | ||||||||||||
Brazil | 196,343 | — | — | 196,343 | ||||||||||||
Chile | 91,603 | — | — | 91,603 | ||||||||||||
China/Hong Kong | 2,371,223 | — | — | 2,371,223 | ||||||||||||
India | 359,039 | — | — | 359,039 | ||||||||||||
Indonesia | 187,829 | — | — | 187,829 | ||||||||||||
Israel | 209,486 | — | — | 209,486 | ||||||||||||
Mexico | 286,201 | — | — | 286,201 | ||||||||||||
Netherlands | 110,372 | — | — | 110,372 | ||||||||||||
Peru | 335,673 | — | — | 335,673 | ||||||||||||
Singapore | 668,217 | — | — | 668,217 | ||||||||||||
South Africa | 627,748 | — | — | 627,748 | ||||||||||||
South Korea | 1,191,410 | — | — | 1,191,410 | ||||||||||||
Taiwan | 1,066,048 | — | — | 1,066,048 | ||||||||||||
Thailand | 167,355 | — | — | 167,355 | ||||||||||||
United States | 611,763 | — | — | 611,763 | ||||||||||||
Investment Companies | 475,898 | — | — | 475,898 | ||||||||||||
Short-Term Securities | 90,137 | — | — | 90,137 | ||||||||||||
Total: | 9,617,297 | — | — | 9,617,297 | ||||||||||||
Level 1 securities of foreign issuers are primarily American Depositary Receipts (ADRs), Public Limited Companies (PLCs) or Global Depositary Receipts (GDRs). There were no transfers into or out of level 3 during the reporting period.
See accompanying notes to financial statements.
| DECEMBER 31, 2023 | 49 | |
STATEMENTS OF ASSETS AND LIABILITIES (Unaudited)
December 31, 2023
| Sit Balanced Fund | Sit Dividend Growth Fund | Sit Global Dividend Growth Fund | ||||||||||
ASSETS | ||||||||||||
Investments in securities, at identified cost | $38,177,053 | $169,796,753 | $24,866,707 | |||||||||
|
|
|
|
|
| |||||||
Investments in securities, at fair value - see accompanying schedule for detail | $55,617,548 | $225,097,360 | $48,204,345 | |||||||||
Cash in bank on demand deposit | 383 | — | 8 | |||||||||
Accrued interest and dividends receivable | 162,504 | 253,434 | 103,449 | |||||||||
Receivable for investment securities sold | 104,425 | 368,514 | — | |||||||||
Receivable for Fund shares sold | 96,594 | 19,936 | 2,233 | |||||||||
|
|
|
|
|
| |||||||
Total assets | 55,981,454 | 225,739,244 | 48,310,035 | |||||||||
|
|
|
|
|
| |||||||
LIABILITIES | ||||||||||||
Payable for investment securities purchased | — | — | — | |||||||||
Payable for Fund shares redeemed | 9,736 | 21,534 | 1,381 | |||||||||
Accrued investment management fees and advisory fees | 34,110 | 123,352 | 37,083 | |||||||||
Accrued Rule 12b-1 fees (Class S) | — | 4,126 | 815 | |||||||||
|
|
|
|
|
| |||||||
Total liabilities | 43,846 | 149,012 | 39,279 | |||||||||
|
|
|
|
|
| |||||||
Net assets applicable to outstanding capital stock | $55,937,608 | $225,590,232 | $48,270,756 | |||||||||
|
|
|
|
|
| |||||||
Net assets consist of: | ||||||||||||
Capital (par value and paid-in surplus) | $38,936,903 | $168,318,528 | $24,800,838 | |||||||||
Total distributable earnings (loss), including unrealized appreciation (depreciation) | 17,000,705 | 57,271,704 | 23,469,918 | |||||||||
|
|
|
|
|
| |||||||
| $55,937,608 | $225,590,232 | $48,270,756 | ||||||||||
|
|
|
|
|
| |||||||
Outstanding shares: | ||||||||||||
Common Shares (Class I)* | 1,814,336 | 13,714,594 | 1,805,416 | |||||||||
|
|
|
|
|
| |||||||
Common Shares (Class S)* | — | 1,436,161 | 172,152 | |||||||||
|
|
|
|
|
| |||||||
Net assets applicable to outstanding shares: | ||||||||||||
Common Shares (Class I)* | $55,937,608 | $204,339,448 | $44,071,975 | |||||||||
|
|
|
|
|
| |||||||
Common Shares (Class S)* | — | 21,250,784 | 4,198,781 | |||||||||
|
|
|
|
|
| |||||||
Net asset value per share of outstanding capital stock: | ||||||||||||
Common Shares (Class I)* | $30.83 | $14.90 | $24.41 | |||||||||
|
|
|
|
|
| |||||||
Common Shares (Class S)* | — | 14.80 | 24.39 | |||||||||
|
|
|
|
|
| |||||||
| * | Dividend Growth, Global Dividend Growth, ESG Growth and Small Cap Dividend Growth Funds offer multiple share classes (I and S). All other Funds offer a single share class. |
See accompanying notes to financial statements.
| 50 | SIT MUTUAL FUNDS SEMI-ANNUAL REPORT | |
| Sit Large Cap Growth Fund | Sit ESG Growth Fund | Sit Mid Cap Growth Fund | Sit Small Cap Dividend Growth Fund | Sit Small Cap Growth Fund | Sit International Growth Fund | Sit Developing Markets Growth Fund | ||||||||||||||||||||
| $57,957,685 | $5,636,370 | $90,809,594 | $16,428,542 | $64,648,194 | $18,206,598 | $7,474,014 | ||||||||||||||||||||
|
|
|
|
|
|
|
|
|
|
|
|
|
| |||||||||||||
| $176,456,580 | $9,766,241 | $193,453,427 | $22,619,126 | $108,956,853 | $27,229,808 | $9,617,297 | ||||||||||||||||||||
| — | 2 | — | — | — | 168 | 1 | ||||||||||||||||||||
| 54,156 | 20,271 | 79,584 | 37,655 | 103,668 | 111,746 | 20,043 | ||||||||||||||||||||
| 362,875 | — | 725,751 | — | 494,711 | — | — | ||||||||||||||||||||
| 33,886 | — | 4,038 | 2,302 | 5,443 | 1,539 | 1,723 | ||||||||||||||||||||
|
|
|
|
|
|
|
|
|
|
|
|
|
| |||||||||||||
| 176,907,497 | 9,786,514 | 194,262,800 | 22,659,083 | 109,560,675 | 27,343,261 | 9,639,064 | ||||||||||||||||||||
|
|
|
|
|
|
|
|
|
|
|
|
|
| |||||||||||||
| — | — | — | 47,489 | 237,444 | — | — | ||||||||||||||||||||
| 73,955 | — | 4,476 | — | 372 | 738 | 618 | ||||||||||||||||||||
| 137,595 | 7,593 | 185,663 | 15,436 | 124,322 | 17,797 | 6,984 | ||||||||||||||||||||
| — | 892 | — | 999 | — | — | — | ||||||||||||||||||||
|
|
|
|
|
|
|
|
|
|
|
|
|
| |||||||||||||
| 211,550 | 8,485 | 190,139 | 63,924 | 362,138 | 18,535 | 7,602 | ||||||||||||||||||||
|
|
|
|
|
|
|
|
|
|
|
|
|
| |||||||||||||
| $176,695,947 | $9,778,029 | $194,072,661 | $22,595,159 | $109,198,537 | $27,324,726 | $9,631,462 | ||||||||||||||||||||
|
|
|
|
|
|
|
|
|
|
|
|
|
| |||||||||||||
| $57,075,874 | $5,736,142 | $90,174,110 | $16,270,768 | $63,126,992 | $18,252,162 | $7,451,651 | ||||||||||||||||||||
| 119,620,073 | 4,041,887 | 103,898,551 | 6,324,391 | 46,071,545 | 9,072,564 | 2,179,811 | ||||||||||||||||||||
|
|
|
|
|
|
|
|
|
|
|
|
|
| |||||||||||||
| $176,695,947 | $9,778,029 | $194,072,661 | $22,595,159 | $109,198,537 | $27,324,726 | $9,631,462 | ||||||||||||||||||||
|
|
|
|
|
|
|
|
|
|
|
|
|
| |||||||||||||
| 2,796,798 | 279,638 | 9,003,209 | 1,153,834 | 1,809,590 | 1,285,862 | 610,019 | ||||||||||||||||||||
|
|
|
|
|
|
|
|
|
|
|
|
|
| |||||||||||||
| — | 248,688 | — | 355,891 | — | — | — | ||||||||||||||||||||
|
|
|
|
|
|
|
|
|
|
|
|
|
| |||||||||||||
| $176,695,947 | $5,197,105 | $194,072,661 | $17,270,116 | $109,198,537 | $27,324,726 | $9,631,462 | ||||||||||||||||||||
|
|
|
|
|
|
|
|
|
|
|
|
|
| |||||||||||||
| — | 4,580,924 | — | 5,325,043 | — | — | — | ||||||||||||||||||||
|
|
|
|
|
|
|
|
|
|
|
|
|
| |||||||||||||
| $63.18 | $18.59 | $21.56 | $14.97 | $60.34 | $21.25 | $15.79 | ||||||||||||||||||||
|
|
|
|
|
|
|
|
|
|
|
|
|
| |||||||||||||
| — | 18.42 | — | 14.96 | — | — | — | ||||||||||||||||||||
|
|
|
|
|
|
|
|
|
|
|
|
|
| |||||||||||||
| DECEMBER 31, 2023 | 51 | |
STATEMENTS OF OPERATIONS (Unaudited)
Six Months Ended December 31, 2023
| Sit Balanced Fund | Sit Dividend Growth Fund | Sit Global Dividend Growth Fund | ||||||||||
Investment income: | ||||||||||||
Income: | ||||||||||||
Dividends* | $218,884 | $2,293,739 | $392,024 | |||||||||
Interest | 385,930 | 33,974 | 19,055 | |||||||||
|
|
|
|
|
|
|
|
| ||||
Total income | 604,814 | 2,327,713 | 411,079 | |||||||||
|
|
|
|
|
|
|
|
| ||||
Expenses (note 4): | ||||||||||||
Investment management and advisory service fee | 250,617 | 1,105,925 | 288,092 | |||||||||
12b-1 fees (Class S) | — | 25,533 | 4,887 | |||||||||
|
|
|
|
|
|
|
|
| ||||
Total expenses | 250,617 | 1,131,458 | 292,979 | |||||||||
|
|
|
|
|
|
|
|
| ||||
Less fees and expenses waived by investment adviser | (50,123 | ) | (331,777 | ) | (57,618 | ) | ||||||
|
|
|
|
|
|
|
|
| ||||
Total net expenses | 200,494 | 799,681 | 235,361 | |||||||||
|
|
|
|
|
|
|
|
| ||||
Net investment income (loss) | 404,320 | 1,528,032 | 175,718 | |||||||||
|
|
|
|
|
|
|
|
| ||||
Realized and unrealized gain (loss): | ||||||||||||
Net realized gain (loss) on investments | (106,369 | ) | 5,511,205 | 801,910 | ||||||||
Net realized gain (loss) on foreign currency transactions | — | — | 1,156 | |||||||||
Net change in unrealized appreciation (depreciation) on investments and foreign currency transactions | 3,905,652 | 6,137,233 | 2,687,537 | |||||||||
|
|
|
|
|
|
|
|
| ||||
Net gain (loss) | 3,799,283 | 11,648,438 | 3,490,603 | |||||||||
|
|
|
|
|
|
|
|
| ||||
Net increase (decrease) in net assets resulting from operations | $4,203,603 | $13,176,470 | $3,666,321 | |||||||||
|
|
|
|
|
|
|
|
| ||||
| ||||||||||||
* Foreign taxes withheld on dividends received | — | $666 | $5,492 | |||||||||
See accompanying notes to financial statements.
| 52 | SIT MUTUAL FUNDS SEMI-ANNUAL REPORT | |
| Sit | Sit | |||||||||||||||||||||||||
| Sit | Sit | Sit | Small Cap | Sit | Sit | Developing | ||||||||||||||||||||
| Large Cap | ESG | Mid Cap | Dividend | Small Cap | International | Markets | ||||||||||||||||||||
| Growth | Growth | Growth | Growth | Growth | Growth | Growth | ||||||||||||||||||||
| Fund | Fund | Fund | Fund | Fund | Fund | Fund | ||||||||||||||||||||
| $727,844 | $64,419 | $826,795 | $206,730 | $585,579 | $188,015 | $91,899 | ||||||||||||||||||||
| 32,721 | 6,239 | 57,738 | 10,175 | 26,626 | 6,730 | 6,266 | ||||||||||||||||||||
|
|
|
|
|
|
|
|
|
|
|
|
|
|
|
|
|
|
|
|
| ||||||
| 760,565 | 70,658 | 884,533 | 216,905 | 612,205 | 194,745 | 98,165 | ||||||||||||||||||||
|
|
|
|
|
|
|
|
|
|
|
|
|
|
|
|
|
|
|
|
| ||||||
| 814,451 | 56,736 | 1,115,686 | 130,278 | 774,132 | 190,704 | 94,970 | ||||||||||||||||||||
| — | 5,324 | — | 6,029 | — | — | — | ||||||||||||||||||||
|
|
|
|
|
|
|
|
|
|
|
|
|
|
|
|
|
|
|
|
| ||||||
| 814,451 | 62,060 | 1,115,686 | 136,307 | 774,132 | 190,704 | 94,970 | ||||||||||||||||||||
|
|
|
|
|
|
|
|
|
|
|
|
|
|
|
|
|
|
|
|
| ||||||
| — | (11,347 | ) | — | (36,478 | ) | — | (82,638 | ) | (49,859 | ) | ||||||||||||||||
|
|
|
|
|
|
|
|
|
|
|
|
|
|
|
|
|
|
|
|
| ||||||
| 814,451 | 50,713 | 1,115,686 | 99,829 | 774,132 | 108,066 | 45,111 | ||||||||||||||||||||
|
|
|
|
|
|
|
|
|
|
|
|
|
|
|
|
|
|
|
|
| ||||||
| (53,886) | 19,945 | (231,153 | ) | 117,076 | (161,927 | ) | 86,679 | 53,054 | ||||||||||||||||||
|
|
|
|
|
|
|
|
|
|
|
|
|
|
|
|
|
|
|
|
| ||||||
| 1,175,066 | 32,626 | 3,029,253 | 167,927 | 3,803,053 | 141,446 | 58,556 | ||||||||||||||||||||
| — | (72 | ) | — | — | — | 611 | 74 | |||||||||||||||||||
| 15,681,230 | 579,878 | 11,372,463 | 853,101 | (304,248 | ) | 1,106,784 | (107,615 | ) | ||||||||||||||||||
|
|
|
|
|
|
|
|
|
|
|
|
|
|
|
|
|
|
|
|
| ||||||
| 16,856,296 | 612,432 | 14,401,716 | 1,021,028 | 3,498,805 | 1,248,841 | (48,985 | ) | |||||||||||||||||||
|
|
|
|
|
|
|
|
|
|
|
|
|
|
|
|
|
|
|
|
| ||||||
| $16,802,410 | $632,377 | $14,170,563 | $1,138,104 | $3,336,878 | $1,335,520 | $4,069 | ||||||||||||||||||||
|
|
|
|
|
|
|
|
|
|
|
|
|
|
|
|
|
|
|
|
| ||||||
| — | $1,415 | $3,159 | $602 | $3,244 | $8,230 | $10,373 | ||||||||||||||||||||
| DECEMBER 31, 2023 | 53 | |
STATEMENTS OF CHANGES IN NET ASSETS
| Sit Balanced Fund | Sit Dividend Growth Fund | |||||||||||||||
| Six Months Ended | Year | Six Months Ended | Year | |||||||||||||
| December 31, 2023 | Ended | December 31, 2023 | Ended | |||||||||||||
| (Unaudited) | June 30, 2023 | (Unaudited) | June 30, 2023 | |||||||||||||
Operations: | ||||||||||||||||
Net investment income (loss) | $404,320 | $665,714 | $1,528,032 | $3,156,391 | ||||||||||||
Net realized gain (loss) on investments and foreign currency transactions | (106,369 | ) | (296,792 | ) | 5,511,205 | 8,612,443 | ||||||||||
Net change in unrealized appreciation (depreciation) of investments and foreign currency transactions | 3,905,652 | 5,025,324 | 6,137,233 | 18,864,045 | ||||||||||||
|
|
|
|
|
|
|
|
|
|
|
| |||||
Net increase (decrease) in net assets resulting from operations | 4,203,603 | 5,394,246 | 13,176,470 | 30,632,879 | ||||||||||||
|
|
|
|
|
|
|
|
|
|
|
| |||||
Distributions from: | ||||||||||||||||
Net investment income and net realized gains | ||||||||||||||||
Common shares (Class I) | (564,003 | ) | (2,221,064 | ) | (8,679,165 | ) | (21,774,304 | ) | ||||||||
Common shares (Class S) | — | — | (856,756 | ) | (2,372,811 | ) | ||||||||||
|
|
|
|
|
|
|
|
|
|
|
| |||||
Total distributions | (564,003 | ) | (2,221,064 | ) | (9,535,921 | ) | (24,147,115 | ) | ||||||||
|
|
|
|
|
|
|
|
|
|
|
| |||||
Capital share transactions: | ||||||||||||||||
Proceeds from shares sold | ||||||||||||||||
Common Shares (Class I) | 5,553,424 | 3,894,958 | 5,413,702 | 16,884,847 | ||||||||||||
Common Shares (Class S) | — | — | 1,038,745 | 1,073,831 | ||||||||||||
Reinvested distributions | ||||||||||||||||
Common Shares (Class I) | 516,165 | 2,174,246 | 7,988,200 | 20,490,706 | ||||||||||||
Common Shares (Class S) | — | — | 843,299 | 2,366,839 | ||||||||||||
Payments for shares redeemed | ||||||||||||||||
Common Shares (Class I) | (3,223,442 | ) | (7,916,953 | ) | (22,199,296 | ) | (24,480,723 | ) | ||||||||
Common Shares (Class S) | — | — | (2,289,573 | ) | (4,592,175 | ) | ||||||||||
|
|
|
|
|
|
|
|
|
|
|
| |||||
Increase (decrease) in net assets from capital transactions | 2,846,147 | (1,847,749 | ) | (9,204,923 | ) | 11,743,325 | ||||||||||
|
|
|
|
|
|
|
|
|
|
|
| |||||
Total increase (decrease) in net assets | 6,485,747 | 1,325,433 | (5,564,374 | ) | 18,229,089 | |||||||||||
Net assets: | ||||||||||||||||
Beginning of period | 49,451,861 | 48,126,428 | 231,154,606 | 212,925,517 | ||||||||||||
|
|
|
|
|
|
|
|
|
|
|
| |||||
End of period | $55,937,608 | $49,451,861 | $225,590,232 | $231,154,606 | ||||||||||||
|
|
|
|
|
|
|
|
|
|
|
| |||||
Capital transactions in shares: | ||||||||||||||||
Sold | ||||||||||||||||
Common Shares (Class I) | 188,725 | 141,588 | 371,391 | 1,190,785 | ||||||||||||
Common Shares (Class S) | — | — | 72,840 | 74,506 | ||||||||||||
Reinvested distributions | ||||||||||||||||
Common Shares (Class I) | 17,752 | 83,352 | 543,665 | 1,492,898 | ||||||||||||
Common Shares (Class S) | — | — | 57,741 | 173,605 | ||||||||||||
Redeemed | ||||||||||||||||
Common Shares (Class I) | (111,769 | ) | (296,842 | ) | (1,532,953 | ) | (1,717,513 | ) | ||||||||
Common Shares (Class S) | — | — | (159,652 | ) | (326,696 | ) | ||||||||||
|
|
|
|
|
|
|
|
|
|
|
| |||||
Net increase (decrease) | 94,708 | (71,902 | ) | (646,968 | ) | 887,585 | ||||||||||
|
|
|
|
|
|
|
|
|
|
|
| |||||
See accompanying notes to financial statements.
| 54 | SIT MUTUAL FUNDS SEMI-ANNUAL REPORT | |
| Sit Global Dividend Growth Fund | Sit Large Cap Growth Fund | Sit ESG Growth Fund | ||||||||||||||||||||
| Six Months Ended | Year | Six Months Ended | Year | Six Months Ended | Year | |||||||||||||||||
| December 31, 2023 | Ended | December 31, 2023 | Ended | December 31, 2023 | Ended | |||||||||||||||||
| (Unaudited) | June 30, 2023 | (Unaudited) | June 30, 2023 | (Unaudited) | June 30, 2023 | |||||||||||||||||
| $175,718 | $490,399 | ($53,886 | ) | $148,920 | $19,945 | $61,364 | ||||||||||||||||
| 803,066 | (553,795 | ) | 1,175,066 | 3,554,651 | 32,554 | (122,024 | ) | |||||||||||||||
| 2,687,537 | 6,762,490 | 15,681,230 | 29,320,184 | 579,878 | 1,653,170 | |||||||||||||||||
|
|
|
|
|
|
|
|
|
|
|
|
|
|
|
|
|
| |||||
| 3,666,321 | 6,699,094 | 16,802,410 | 33,023,755 | 632,377 | 1,592,510 | |||||||||||||||||
|
|
|
|
|
|
|
|
|
|
|
|
|
|
|
|
|
| |||||
| (369,812 | ) | (446,552 | ) | (3,193,469 | ) | (4,952,920 | ) | (39,839 | ) | (120,779 | ) | |||||||||||
| (27,192 | ) | (31,454 | ) | — | — | (25,161 | ) | (116,450 | ) | |||||||||||||
|
|
|
|
|
|
|
|
|
|
|
|
|
|
|
|
|
| |||||
| (397,004 | ) | (478,006 | ) | (3,193,469 | ) | (4,952,920 | ) | (65,000 | ) | (237,229 | ) | |||||||||||
|
|
|
|
|
|
|
|
|
|
|
|
|
|
|
|
|
| |||||
| 861,759 | 1,615,055 | 2,599,521 | 3,760,728 | 82,517 | 347,403 | |||||||||||||||||
| 148,596 | 300,231 | — | — | 17,926 | 125,749 | |||||||||||||||||
| 344,465 | 417,990 | 2,846,419 | 4,756,966 | 7,307 | 120,779 | |||||||||||||||||
| 26,221 | 31,454 | — | — | 3,159 | 116,450 | |||||||||||||||||
| (4,010,736 | ) | (915,118 | ) | (5,131,433 | ) | (10,251,212 | ) | (56,105 | ) | (55,305 | ) | |||||||||||
| (296,346 | ) | (190,973 | ) | — | — | (16,310 | ) | (155,989 | ) | |||||||||||||
|
|
|
|
|
|
|
|
|
|
|
|
|
|
|
|
|
| |||||
| (2,926,041 | ) | 1,258,639 | 314,507 | (1,733,518 | ) | 38,494 | 499,087 | |||||||||||||||
|
|
|
|
|
|
|
|
|
|
|
|
|
|
|
|
|
| |||||
| 343,276 | 7,479,727 | 13,923,448 | 26,337,317 | 605,871 | 1,854,368 | |||||||||||||||||
| 47,927,480 | 40,447,753 | 162,772,499 | 136,435,182 | 9,172,158 | 7,317,790 | |||||||||||||||||
|
|
|
|
|
|
|
|
|
|
|
|
|
|
|
|
|
| |||||
| $48,270,756 | $47,927,480 | $176,695,947 | $162,772,499 | $9,778,029 | $9,172,158 | |||||||||||||||||
|
|
|
|
|
|
|
|
|
|
|
|
|
|
|
|
|
| |||||
| 36,253 | 79,480 | 43,389 | 71,837 | 4,540 | 21,896 | |||||||||||||||||
| 6,365 | 13,785 | — | — | 1,013 | 7,983 | |||||||||||||||||
| 15,251 | 21,219 | 45,579 | 100,912 | 398 | 8,057 | |||||||||||||||||
| 1,168 | 1,602 | — | — | 174 | 7,836 | |||||||||||||||||
| (175,785 | ) | (45,193 | ) | (86,035 | ) | (204,325 | ) | (3,256 | ) | (3,587 | ) | |||||||||||
| (13,005 | ) | (9,514 | ) | — | — | (918 | ) | (10,041 | ) | |||||||||||||
|
|
|
|
|
|
|
|
|
|
|
|
|
|
|
|
|
| |||||
| (129,753 | ) | 61,379 | 2,933 | (31,576 | ) | 1,951 | 32,144 | |||||||||||||||
|
|
|
|
|
|
|
|
|
|
|
|
|
|
|
|
|
| |||||
| DECEMBER 31, 2023 | 55 | |
STATEMENTS OF CHANGES IN NET ASSETS
| Sit Mid Cap Growth Fund | Sit Small Cap Dividend Growth Fund | |||||||||||||||
| Six Months Ended | Year | Six Months Ended | Year | |||||||||||||
| December 31, 2023 | Ended | December 31, 2023 | �� | Ended | ||||||||||||
| (Unaudited) | June 30, 2023 | (Unaudited) | June 30, 2023 | |||||||||||||
Operations: | ||||||||||||||||
Net investment income (loss) | ($231,153 | ) | ($55,293 | ) | $117,076 | $270,497 | ||||||||||
Net realized gain (loss) on investments and foreign currency transactions | 3,029,253 | 818,612 | 167,927 | 205,652 | ||||||||||||
Net change in unrealized appreciation (depreciation) of investments and foreign currency transactions | 11,372,463 | 33,871,734 | 853,101 | 2,493,454 | ||||||||||||
|
|
|
|
|
|
|
|
|
|
|
| |||||
Net increase (decrease) in net assets resulting from operations | 14,170,563 | 34,635,053 | 1,138,104 | 2,969,603 | ||||||||||||
|
|
|
|
|
|
|
|
|
|
|
| |||||
Distributions from: | ||||||||||||||||
Net investment income and net realized gains | ||||||||||||||||
Common shares (Class I) | (903,590 | ) | (5,106,424 | ) | (145,188 | ) | (619,836 | ) | ||||||||
Common shares (Class S) | — | — | (34,813 | ) | (182,623 | ) | ||||||||||
|
|
|
|
|
|
|
|
|
|
|
| |||||
Total distributions | (903,590 | ) | (5,106,424 | ) | (180,001 | ) | (802,459 | ) | ||||||||
|
|
|
|
|
|
|
|
|
|
|
| |||||
Capital share transactions: | ||||||||||||||||
Proceeds from shares sold | ||||||||||||||||
Common Shares (Class I) | 534,987 | 1,684,465 | 416,035 | 698,064 | ||||||||||||
Common Shares (Class S) | — | — | 152,774 | 169,792 | ||||||||||||
Reinvested distributions | ||||||||||||||||
Common Shares (Class I) | 691,910 | 4,614,072 | 128,987 | 576,207 | ||||||||||||
Common Shares (Class S) | — | — | 25,079 | 177,090 | ||||||||||||
Payments for shares redeemed | ||||||||||||||||
Common Shares (Class I) | (5,641,688 | ) | (15,036,435 | ) | (509,126 | ) | (634,237 | ) | ||||||||
Common Shares (Class S) | — | — | (49,648 | ) | (213,821 | ) | ||||||||||
|
|
|
|
|
|
|
|
|
|
|
| |||||
Increase (decrease) in net assets from capital transactions | (4,414,791 | ) | (8,737,898 | ) | 164,101 | 773,095 | ||||||||||
|
|
|
|
|
|
|
|
|
|
|
| |||||
Total increase (decrease) in net assets | 8,852,182 | 20,790,731 | 1,122,204 | 2,940,239 | ||||||||||||
Net assets: | ||||||||||||||||
Beginning of period | 185,220,479 | 164,429,748 | 21,472,955 | 18,532,716 | ||||||||||||
|
|
|
|
|
|
|
|
|
|
|
| |||||
End of period | $194,072,661 | $185,220,479 | $22,595,159 | $21,472,955 | ||||||||||||
|
|
|
|
|
|
|
|
|
|
|
| |||||
Capital transactions in shares: | ||||||||||||||||
Sold | ||||||||||||||||
Common Shares (Class I) | 26,795 | 89,278 | 29,414 | 50,029 | ||||||||||||
Common Shares (Class S) | — | — | 10,283 | 12,109 | ||||||||||||
Reinvested distributions | ||||||||||||||||
Common Shares (Class I) | 32,606 | 256,911 | 9,074 | 44,217 | ||||||||||||
Common Shares (Class S) | — | — | 1,780 | 13,592 | ||||||||||||
Redeemed | ||||||||||||||||
Common Shares (Class I) | (282,675 | ) | (813,255 | ) | (38,075 | ) | (46,458 | ) | ||||||||
Common Shares (Class S) | — | — | (3,394 | ) | (15,223 | ) | ||||||||||
|
|
|
|
|
|
|
|
|
|
|
| |||||
Net increase (decrease) | (223,274 | ) | (467,066 | ) | 9,082 | 58,266 | ||||||||||
|
|
|
|
|
|
|
|
|
|
|
| |||||
See accompanying notes to financial statements.
| 56 | SIT MUTUAL FUNDS SEMI-ANNUAL REPORT | |
| Sit Small Cap Growth Fund | Sit International Growth Fund | Sit Developing Markets Growth Fund | ||||||||||||||||||||
| Six Months Ended | Year | Six Months Ended | Year | Six Months Ended | Year | |||||||||||||||||
| December 31, 2023 | Ended | December 31, 2023 | Ended | December 31, 2023 | Ended | |||||||||||||||||
| (Unaudited) | June 30, 2023 | (Unaudited) | June 30, 2023 | (Unaudited) | June 30, 2023 | |||||||||||||||||
| ($161,927 | ) | ($248,567 | ) | $86,679 | $363,272 | $53,054 | $139,410 | |||||||||||||||
| 3,803,053 |
| 2,436,365 | 142,057 | 325,687 | 58,630 | 34,339 | |||||||||||||||
| (304,248 | ) | 14,084,650 | 1,106,784 | 3,397,851 | (107,615 | ) | 419,970 | |||||||||||||||
|
|
|
|
|
|
|
|
|
|
|
|
|
|
|
|
|
| |||||
| 3,336,878 | 16,272,448 | 1,335,520 | 4,086,810 | 4,069 | 593,719 | |||||||||||||||||
|
|
|
|
|
|
|
|
|
|
|
|
|
|
|
|
|
| |||||
| (3,306,617 | ) | (1,688,086 | ) | (557,510 | ) | (453,404 | ) | (193,142 | ) | (222,145 | ) | |||||||||||
| — | — | — | — | — | — | |||||||||||||||||
|
|
|
|
|
|
|
|
|
|
|
|
|
|
|
|
|
| |||||
| (3,306,617 | ) | (1,688,086 | ) | (557,510 | ) | (453,404 | ) | (193,142 | ) | (222,145 | ) | |||||||||||
|
|
|
|
|
|
|
|
|
|
|
|
|
|
|
|
|
| |||||
| 1,363,907 | 1,523,686 | 167,313 | 1,165,079 | 101,697 | 998,232 | |||||||||||||||||
| — | — | — | — | — | — | |||||||||||||||||
| 2,854,962 | 1,564,134 | 417,004 | 420,136 | 174,028 | 216,826 | |||||||||||||||||
| — | — | — | — | — | — | |||||||||||||||||
| (4,874,744 | ) | (6,292,024 | ) | (661,161 | ) | (1,048,990 | ) | (553,041 | ) | (888,402 | ) | |||||||||||
| — | — | — | — | — | — | |||||||||||||||||
|
|
|
|
|
|
|
|
|
|
|
|
|
|
|
|
|
| |||||
| (655,875 | ) | (3,204,204 | ) | (76,844 | ) | 536,225 | (277,316 | ) | 326,656 | |||||||||||||
|
|
|
|
|
|
|
|
|
|
|
|
|
|
|
|
|
| |||||
| (625,614 | ) | 11,380,158 | 701,166 | 4,169,631 | (466,389 | ) | 698,230 | |||||||||||||||
| 109,824,151 | 98,443,993 | 26,623,560 | 22,453,929 | 10,097,851 | 9,399,621 | |||||||||||||||||
|
|
|
|
|
|
|
|
|
|
|
|
|
|
|
|
|
| |||||
| $109,198,537 | $109,824,151 | $27,324,726 | $26,623,560 | $9,631,462 | $10,097,851 | |||||||||||||||||
|
|
|
|
|
|
|
|
|
|
|
|
|
|
|
|
|
| |||||
| 22,850 | 26,818 | 8,152 | 60,251 | 6,625 | 63,927 | |||||||||||||||||
| — | — | — | — | — | — | |||||||||||||||||
| 48,055 | 29,138 | 20,068 | 22,996 | 11,375 | 14,484 | |||||||||||||||||
| — | — | — | — | — | — | |||||||||||||||||
| (82,857 | ) | (112,711 | ) | (33,705 | ) | (54,715 | ) | (36,786 | ) | (57,576 | ) | |||||||||||
| — | — | — | — | — | — | |||||||||||||||||
|
|
|
|
|
|
|
|
|
|
|
|
|
|
|
|
|
| |||||
| (11,952 | ) | (56,755 | ) | (5,485 | ) | 28,532 | (18,786 | ) | 20,835 | |||||||||||||
|
|
|
|
|
|
|
|
|
|
|
|
|
|
|
|
|
| |||||
| DECEMBER 31, 2023 | 57 | |
Per share income and capital changes for a share outstanding throughout the period. See accompanying notes to financial statements.
Sit Balanced Fund
| Six Months Ended | Year Ended June 30, | |||||||||||||||||||||||||||
| December 31, 2023 (Unaudited) | 2023 | 2022 | 2021 | 2020 | 2019 | |||||||||||||||||||||||
Net Asset Value: | ||||||||||||||||||||||||||||
Beginning of period | $28.76 | $26.86 | $32.85 | $26.37 | $25.06 | $23.76 | ||||||||||||||||||||||
Operations: | ||||||||||||||||||||||||||||
Net investment income 1 | 0.23 | 0.38 | 0.23 | 0.22 | 0.25 | 0.32 | ||||||||||||||||||||||
Net realized and unrealized gains (losses) | 2.16 | 2.84 | (4.86 | ) | 6.71 | 2.64 | 1.52 | |||||||||||||||||||||
Total from operations | 2.39 | 3.22 | (4.63 | ) | 6.93 | 2.89 | 1.84 | |||||||||||||||||||||
Distributions to Shareholders: | ||||||||||||||||||||||||||||
From net investment income | (0.32 | ) | (0.36 | ) | (0.22 | ) | (0.20 | ) | (0.27 | ) | (0.31 | ) | ||||||||||||||||
From net realized gains | — | (0.96 | ) | (1.14 | ) | (0.25 | ) | (1.31 | ) | (0.23 | ) | |||||||||||||||||
Total distributions | (0.32 | ) | (1.32 | ) | (1.36 | ) | (0.45 | ) | (1.58 | ) | (0.54 | ) | ||||||||||||||||
Net Asset Value | ||||||||||||||||||||||||||||
End of period | $30.83 | $28.76 | $26.86 | $32.85 | $26.37 | $25.06 | ||||||||||||||||||||||
Total investment return 2 | 8.39 | % | 12.53 | % | (14.87 | %) | 26.48 | % | 11.91 | % | 7.98 | % | ||||||||||||||||
Net assets at end of period (000’s omitted) | $55,938 | $49,452 | $48,126 | $66,243 | $46,658 | $34,465 | ||||||||||||||||||||||
Ratios: 3 | ||||||||||||||||||||||||||||
Expenses (without waiver) | 1.00 | %4 | 1.00 | %4 | 1.00 | %4 | 1.00 | % | 1.00 | % | 1.00 | % | ||||||||||||||||
Expenses (with waiver) | 0.80 | %4 | 0.80 | %4 | 0.91 | %4 | — | — | — | |||||||||||||||||||
Net investment income (without waiver) | 1.41 | % | 1.22 | % | 0.62 | % | 0.74 | % | 0.99 | % | 1.33 | % | ||||||||||||||||
Net investment income (with waiver) | 1.61 | % | 1.42 | % | 0.71 | % | — | — | — | |||||||||||||||||||
Portfolio turnover rate (excluding short-term securities) | 17.84 | %5 | 39.71 | % | 39.92 | % | 38.30 | % | 58.63 | % | 50.45 | % | ||||||||||||||||
| 1 | The net investment income per share is based on average shares outstanding for the period. |
| 2 | Total investment return is based on the change in net asset value of a share during the period (not annualized) and assumes reinvestment of distributions at net asset value. |
| 3 | Ratios are annualized for periods less than one year. In addition to fees and expenses which the Fund bears directly, the Fund indirectly bears a pro rata share of the fees and expenses of the acquired funds in which it invests. Such indirect expenses are not included in the above reported expense ratios. |
| 4 | Total Fund expenses are limited to 1.00% of average daily net assets. However, during the period above, the investment adviser voluntarily absorbed expenses that were otherwise payable by the Fund. |
| 5 | Not annualized. |
| 58 | SIT MUTUAL FUNDS SEMI-ANNUAL REPORT | |
FINANCIAL HIGHLIGHTS
Per share income and capital changes for a share outstanding throughout the period. See accompanying notes to financial statements.
Sit Dividend Growth Fund
| Class I | Six Months Ended | Year Ended June 30, | ||||||||||||||||||||||||||
| December 31, 2023 (Unaudited) | 2023 | 2022 | 2021 | 2020 | 2019 | |||||||||||||||||||||||
Net Asset Value: | ||||||||||||||||||||||||||||
Beginning of period | $14.64 | $14.29 | $17.37 | $13.48 | $14.45 | $16.69 | ||||||||||||||||||||||
Operations: | ||||||||||||||||||||||||||||
Net investment income 1 | 0.10 | 0.21 | 0.24 | 0.21 | 0.22 | 0.38 | ||||||||||||||||||||||
Net realized and unrealized gains (losses) | 0.80 | 1.78 | (1.19 | ) | 4.75 | 0.64 | 0.55 | |||||||||||||||||||||
Total from operations | 0.90 | 1.99 | (0.95 | ) | 4.96 | 0.86 | 0.93 | |||||||||||||||||||||
Redemption fee | — | — | 2 | — | 2 | — | 2 | — | 2 | — | 2 | |||||||||||||||||
Distributions to Shareholders: | ||||||||||||||||||||||||||||
From net investment income | (0.16 | ) | (0.20 | ) | (0.24 | ) | (0.21 | ) | (0.24 | ) | (0.40 | ) | ||||||||||||||||
From net realized gains | (0.48 | ) | (1.44 | ) | (1.89 | ) | (0.86 | ) | (1.59 | ) | (2.77 | ) | ||||||||||||||||
Total distributions | (0.64 | ) | (1.64 | ) | (2.13 | ) | (1.07 | ) | (1.83 | ) | (3.17 | ) | ||||||||||||||||
Net Asset Value | ||||||||||||||||||||||||||||
End of period | $14.90 | $14.64 | $14.29 | $17.37 | $13.48 | $14.45 | ||||||||||||||||||||||
Total investment return 3 | 6.27 | % | 14.76 | % | (7.27 | %) | 38.13 | % | 5.46 | % | 8.37 | % | ||||||||||||||||
Net assets at end of period (000’s omitted) | $204,339 | $209,856 | $191,010 | $207,378 | $172,746 | $214,204 | ||||||||||||||||||||||
Ratios: 4 | ||||||||||||||||||||||||||||
Expenses (without waiver) 5 | 1.00 | % | 1.00 | % | 1.00 | % | 1.00 | % | 1.00 | % | 1.00 | % | ||||||||||||||||
Expenses (with waiver) 5 | 0.70 | % | 0.70 | % | 0.70 | % | 0.70 | % | 0.70 | % | 0.70 | % | ||||||||||||||||
Net investment income (without waiver) | 1.10 | % | 1.15 | % | 1.11 | % | 1.08 | % | 1.30 | % | 2.04 | % | ||||||||||||||||
Net investment income (with waiver) | 1.40 | % | 1.45 | % | 1.41 | % | 1.38 | % | 1.60 | % | 2.34 | % | ||||||||||||||||
Portfolio turnover rate (excluding short-term securities) | 21.49 | %6 | 51.49 | % | 58.96 | % | 42.93 | % | 68.43 | % | 51.52 | % | ||||||||||||||||
| 1 | The net investment income per share is based on average shares outstanding for the period. |
| 2 | Amount represents less than $0.01 per share. |
| 3 | Total investment return is based on the change in net asset value of a share during the period (not annualized) and assumes reinvestment of distributions at net asset value. |
| 4 | Ratios are annualized for periods less than one year. In addition to fees and expenses which the Fund bears directly, the Fund indirectly bears a pro rata share of the fees and expenses of the acquired funds in which it invests. Such indirect expenses are not included in the above reported expense ratios. |
| 5 | Total Fund expenses are limited to 1.00% of average daily net assets. However, during the period above, the investment adviser voluntarily absorbed expenses that were otherwise payable by the Fund. |
| 6 | Not annualized. |
| DECEMBER 31, 2023 | 59 | |
FINANCIAL HIGHLIGHTS
Per share income and capital changes for a share outstanding throughout the period. See accompanying notes to financial statements.
Sit Dividend Growth Fund
| Class S | Six Months Ended | Year Ended June 30, | ||||||||||||||||||||||||||
| December 31, 2023 (Unaudited) | 2023 | 2022 | 2021 | 2020 | 2019 | |||||||||||||||||||||||
Net Asset Value: | ||||||||||||||||||||||||||||
Beginning of period | $14.54 | $14.20 | $17.27 | $13.40 | $14.37 | $16.61 | ||||||||||||||||||||||
Operations: | ||||||||||||||||||||||||||||
Net investment income 1 | 0.08 | 0.17 | 0.19 | 0.17 | 0.19 | 0.32 | ||||||||||||||||||||||
Net realized and unrealized gains (losses) | 0.79 | 1.77 | (1.17 | ) | 4.73 | 0.63 | 0.57 | |||||||||||||||||||||
Total from operations | 0.87 | 1.94 | (0.98 | ) | 4.90 | 0.82 | 0.89 | |||||||||||||||||||||
Redemption fee | — | 2 | — | 2 | — | — | 2 | — | 2 | — | 2 | |||||||||||||||||
Distributions to Shareholders: | ||||||||||||||||||||||||||||
From net investment income | (0.13 | ) | (0.16 | ) | (0.20 | ) | (0.17 | ) | (0.20 | ) | (0.36 | ) | ||||||||||||||||
From net realized gains | (0.48 | ) | (1.44 | ) | (1.89 | ) | (0.86 | ) | (1.59 | ) | (2.77 | ) | ||||||||||||||||
Total distributions | (0.61 | ) | (1.60 | ) | (2.09 | ) | (1.03 | ) | (1.79 | ) | (3.13 | ) | ||||||||||||||||
Net Asset Value | ||||||||||||||||||||||||||||
End of period | $14.80 | $14.54 | $14.20 | $17.27 | $13.40 | $14.37 | ||||||||||||||||||||||
Total investment return 3 | 6.12 | % | 14.47 | % | (7.50 | %) | 37.87 | % | 5.19 | % | 8.12 | % | ||||||||||||||||
Net assets at end of period (000’s omitted) | $21,251 | $21,299 | $21,915 | $31,295 | $29,106 | $39,729 | ||||||||||||||||||||||
Ratios: 4 | ||||||||||||||||||||||||||||
Expenses (without waiver) 5 | 1.25 | % | 1.25 | % | 1.25 | % | 1.25 | % | 1.25 | % | 1.25 | % | ||||||||||||||||
Expenses (with waiver) 5 | 0.95 | % | 0.95 | % | 0.95 | % | 0.95 | % | 0.95 | % | 0.95 | % | ||||||||||||||||
Net investment income (without waiver) | 0.86 | % | 0.90 | % | 0.85 | % | 0.83 | % | 1.05 | % | 1.80 | % | ||||||||||||||||
Net investment income (with waiver) | 1.16 | % | 1.20 | % | 1.15 | % | 1.13 | % | 1.35 | % | 2.10 | % | ||||||||||||||||
Portfolio turnover rate (excluding short-term securities) | 21.49 | %6 | 51.49 | % | 58.96 | % | 42.93 | % | 68.43 | % | 51.52 | % | ||||||||||||||||
| 1 | The net investment income per share is based on average shares outstanding for the period. |
| 2 | Amount represents less than $0.01 per share. |
| 3 | Total investment return is based on the change in net asset value of a share during the period (not annualized) and assumes reinvestment of distributions at net asset value. |
| 4 | Ratios are annualized for periods less than one year. In addition to fees and expenses which the Fund bears directly, the Fund indirectly bears a pro rata share of the fees and expenses of the acquired funds in which it invests. Such indirect expenses are not included in the above reported expense ratios. |
| 5 | Total Fund expenses are limited to 1.25% of average daily net assets. However, during the period above, the investment adviser voluntarily absorbed expenses that were otherwise payable by the Fund. |
| 6 | Not annualized. |
| 60 | SIT MUTUAL FUNDS SEMI-ANNUAL REPORT | |
FINANCIAL HIGHLIGHTS
Per share income and capital changes for a share outstanding throughout the period. See accompanying notes to financial statements.
| Sit Global Dividend Growth Fund | ||||||||||||||||||||||||||||||
Class I | Six Months Ended | Year Ended June 30, | ||||||||||||||||||||||||||
| December 31, 2023 (Unaudited) | 2023 | 2022 | 2021 | 2020 | 2019 | |||||||||||||||||||||||
Net Asset Value: | ||||||||||||||||||||||||||||
Beginning of period | $22.75 | $19.77 | $22.47 | $16.87 | $16.34 | $15.24 | ||||||||||||||||||||||
Operations: | ||||||||||||||||||||||||||||
Net investment income 1 | 0.09 | 0.24 | 0.21 | 0.20 | 0.22 | 0.28 | ||||||||||||||||||||||
Net realized and unrealized gains (losses) | 1.77 | 2.98 | (2.73 | ) | 5.59 | 0.57 | 1.10 | |||||||||||||||||||||
Total from operations | 1.86 | 3.22 | (2.52 | ) | 5.79 | 0.79 | 1.38 | |||||||||||||||||||||
Redemption fee | — | 2 | — | — | — | — | 2 | — | 2 | |||||||||||||||||||
Distributions to Shareholders: | ||||||||||||||||||||||||||||
From net investment income | (0.20 | ) | (0.24 | ) | (0.18 | ) | (0.19 | ) | (0.26 | ) | (0.28 | ) | ||||||||||||||||
Net Asset Value | ||||||||||||||||||||||||||||
End of period | $24.41 | $22.75 | $19.77 | $22.47 | $16.87 | $16.34 | ||||||||||||||||||||||
Total investment return 3 | 8.23 | % | 16.46 | % | (11.31 | %) | 34.61 | % | 4.93 | % | 9.18 | % | ||||||||||||||||
Net assets at end of period (000’s omitted) | $44,072 | $43,893 | $37,057 | $41,461 | $31,361 | $30,823 | ||||||||||||||||||||||
Ratios: 4 | ||||||||||||||||||||||||||||
Expenses (without waiver) 5 | 1.25 | % | 1.25 | % | 1.25 | % | 1.25 | % | 1.25 | % | 1.25 | % | ||||||||||||||||
Expenses (with waiver) 5 | 1.00 | % | 1.00 | % | 1.00 | % | 1.00 | % | 1.00 | % | 1.00 | % | ||||||||||||||||
Net investment income (without waiver) | 0.53 | % | 0.91 | % | 0.66 | % | 0.77 | % | 1.11 | % | 1.53 | % | ||||||||||||||||
Net investment income (with waiver) | 0.78 | % | 1.16 | % | 0.91 | % | 1.02 | % | 1.36 | % | 1.78 | % | ||||||||||||||||
Portfolio turnover rate (excluding short-term securities) | 2.04 | %6 | 6.09 | % | 4.64 | % | 11.55 | % | 22.15 | % | 15.07 | % | ||||||||||||||||
| 1 | The net investment income per share is based on average shares outstanding for the period. |
| 2 | Amount represents less than $0.01 per share. |
| 3 | Total investment return is based on the change in net asset value of a share during the period (not annualized) and assumes reinvestment of distributions at net asset value. |
| 4 | Ratios are annualized for periods less than one year. In addition to fees and expenses which the Fund bears directly, the Fund indirectly bears a pro rata share of the fees and expenses of the acquired funds in which it invests. Such indirect expenses are not included in the above reported expense ratios. |
| 5 | Total Fund expenses are limited to 1.25% of average daily net assets. However, during the period above, the investment adviser voluntarily absorbed expenses that were otherwise payable by the Fund. |
| 6 | Not annualized. |
| DECEMBER 31, 2023 | 61 | |
FINANCIAL HIGHLIGHTS
Per share income and capital changes for a share outstanding throughout the period. See accompanying notes to financial statements.
Sit Global Dividend Growth Fund
| Class S | Six Months Ended | Year Ended June 30, | ||||||||||||||||||||||||||||||||||||||
| December 31, 2023 (Unaudited) | 2023 | 2022 | 2021 | 2020 | 2019 | |||||||||||||||||||||||||||||||||||
Net Asset Value: | ||||||||||||||||||||||||||||||||||||||||
Beginning of period | $22.71 | $19.74 | $22.45 | $16.85 | $16.33 | $15.22 | ||||||||||||||||||||||||||||||||||
Operations: | ||||||||||||||||||||||||||||||||||||||||
Net investment income 1 | 0.06 | 0.19 | 0.15 | 0.15 | 0.18 | 0.24 | ||||||||||||||||||||||||||||||||||
Net realized and unrealized gains (losses) | 1.78 | 2.96 | (2.73 | ) | 5.60 | 0.56 | 1.11 | |||||||||||||||||||||||||||||||||
Total from operations | 1.84 | 3.15 | (2.58 | ) | 5.75 | 0.74 | 1.35 | |||||||||||||||||||||||||||||||||
Redemption fee | — | 2 | — | — | — | 2 | — | 2 | — | |||||||||||||||||||||||||||||||
Distributions to Shareholders: | ||||||||||||||||||||||||||||||||||||||||
From net investment income | (0.16 | ) | (0.18 | ) | (0.13 | ) | (0.15 | ) | (0.22 | ) | (0.24 | ) | ||||||||||||||||||||||||||||
Net Asset Value | ||||||||||||||||||||||||||||||||||||||||
End of period | $24.39 | $22.71 | $19.74 | $22.45 | $16.85 | $16.33 | ||||||||||||||||||||||||||||||||||
Total investment return 3 | 8.14 | % | 16.13 | % | (11.58 | %) | 34.32 | % | 4.60 | % | 8.98 | % | ||||||||||||||||||||||||||||
Net assets at end of period (000’s omitted) | $4,199 | $4,034 | $3,391 | $4,093 | $3,391 | $3,241 | ||||||||||||||||||||||||||||||||||
Ratios: 4 | ||||||||||||||||||||||||||||||||||||||||
Expenses (without waiver) 5 | 1.50 | % | 1.50 | % | 1.50 | % | 1.50 | % | 1.50 | % | 1.50 | % | ||||||||||||||||||||||||||||
Expenses (with waiver) 5 | 1.25 | % | 1.25 | % | 1.25 | % | 1.25 | % | 1.25 | % | 1.25 | % | ||||||||||||||||||||||||||||
Net investment income (without waiver) | 0.27 | % | 0.66 | % | 0.39 | % | 0.52 | % | 0.87 | % | 1.28 | % | ||||||||||||||||||||||||||||
Net investment income (with waiver) | 0.52 | % | 0.91 | % | 0.64 | % | 0.77 | % | 1.12 | % | 1.53 | % | ||||||||||||||||||||||||||||
Portfolio turnover rate (excluding short-term securities) | 2.04 | %6 | 6.09 | % | 4.64 | % | 11.55 | % | 22.15 | % | 15.07 | % | ||||||||||||||||||||||||||||
| 1 | The net investment income per share is based on average shares outstanding for the period. |
| 2 | Amount represents less than $0.01 per share. |
| 3 | Total investment return is based on the change in net asset value of a share during the period (not annualized) and assumes reinvestment of distributions at net asset value. |
| 4 | Ratios are annualized for periods less than one year. In addition to fees and expenses which the Fund bears directly, the Fund indirectly bears a pro rata share of the fees and expenses of the acquired funds in which it invests. Such indirect expenses are not included in the above reported expense ratios. |
| 5 | Total Fund expenses are limited to 1.50% of average daily net assets. However, during the period above, the investment adviser voluntarily absorbed expenses that were otherwise payable by the Fund. |
| 6 | Not annualized. |
| 62 | SIT MUTUAL FUNDS SEMI-ANNUAL REPORT | |
FINANCIAL HIGHLIGHTS
Per share income and capital changes for a share outstanding throughout the period. See accompanying notes to financial statements.
Sit Large Cap Growth Fund
| Six Months Ended | Year Ended June 30, | |||||||||||||||||||||||||||||||||||||||
| December 31, 2023 (Unaudited) | 2023 | 2022 | 2021 | 2020 | 2019 | |||||||||||||||||||||||||||||||||||
Net Asset Value: | ||||||||||||||||||||||||||||||||||||||||
Beginning of period | $58.26 | $48.29 | $63.04 | $47.07 | $42.53 | $42.40 | ||||||||||||||||||||||||||||||||||
Operations: | ||||||||||||||||||||||||||||||||||||||||
Net investment income (loss) 1 | (0.02 | ) | 0.05 | (0.09 | ) | (0.06 | ) | 0.07 | 0.16 | |||||||||||||||||||||||||||||||
Net realized and unrealized gains (losses) | 6.10 | 11.70 | (10.74 | ) | 18.95 | 8.60 | 3.61 | |||||||||||||||||||||||||||||||||
Total from operations | 6.08 | 11.75 | (10.83 | ) | 18.89 | 8.67 | 3.77 | |||||||||||||||||||||||||||||||||
Redemption fee | — | 2 | — | 2 | — | — | 2 | — | 2 | — | 2 | |||||||||||||||||||||||||||||
Distributions to Shareholders: | ||||||||||||||||||||||||||||||||||||||||
From net investment income | (0.04 | ) | — | — | (0.02 | ) | (0.12 | ) | (0.15 | ) | ||||||||||||||||||||||||||||||
From net realized gains | (1.12 | ) | (1.78 | ) | (3.92 | ) | (2.90 | ) | (4.01 | ) | (3.49 | ) | ||||||||||||||||||||||||||||
Total distributions | (1.16 | ) | (1.78 | ) | (3.92 | ) | (2.92 | ) | (4.13 | ) | (3.64 | ) | ||||||||||||||||||||||||||||
Net Asset Value | ||||||||||||||||||||||||||||||||||||||||
End of period | $63.18 | $58.26 | $48.29 | $63.04 | $47.07 | $42.53 | ||||||||||||||||||||||||||||||||||
Total investment return 3 | 10.46 | % | �� | 25.20 | % | (18.78 | %) | 41.12 | % | 21.34 | % | 10.54 | % | |||||||||||||||||||||||||||
Net assets at end of period (000’s omitted) | $176,696 | $162,772 | $136,435 | $177,096 | $129,154 | $116,581 | ||||||||||||||||||||||||||||||||||
Ratios: 4 | ||||||||||||||||||||||||||||||||||||||||
Expenses | 1.00 | % | 1.00 | % | 1.00 | % | 1.00 | % | 1.00 | % | 1.00 | % | ||||||||||||||||||||||||||||
Net investment income (loss) | (0.07 | %) | 0.10 | % | (0.15 | %) | (0.11 | %) | 0.17 | % | 0.39 | % | ||||||||||||||||||||||||||||
Portfolio turnover rate (excluding short-term securities) | 2.93 | %5 | 2.96 | % | 10.83 | % | 9.75 | % | 14.53 | % | 16.02 | % | ||||||||||||||||||||||||||||
| 1 | The net investment income per share is based on average shares outstanding for the period. |
| 2 | Amount represents less than $0.01 per share. |
| 3 | Total investment return is based on the change in net asset value of a share during the period (not annualized) and assumes reinvestment of distributions at net asset value. |
| 4 | Ratios are annualized for periods less than one year. In addition to fees and expenses which the Fund bears directly, the Fund indirectly bears a pro rata share of the fees and expenses of the acquired funds in which it invests. Such indirect expenses are not included in the above reported expense ratios. |
| 5 | Not annualized. |
| DECEMBER 31, 2023 | 63 | |
FINANCIAL HIGHLIGHTS
Per share income and capital changes for a share outstanding throughout the period. See accompanying notes to financial statements.
Sit ESG Growth Fund
| Class I | Six Months Ended | Year Ended June 30, | ||||||||||||||||||||||||||
| December 31, 2023 (Unaudited) | 2023 | 2022 | 2021 | 2020 | 2019 | |||||||||||||||||||||||
Net Asset Value: | ||||||||||||||||||||||||||||
Beginning of period | $ | 17.51 | $ | 14.87 | $ | 18.17 | $ | 13.85 | $ | 13.21 | $ | 12.37 | ||||||||||||||||
Operations: | ||||||||||||||||||||||||||||
Net investment income 1 | 0.05 | 0.14 | 0.10 | 0.12 | 0.12 | 0.17 | ||||||||||||||||||||||
Net realized and unrealized gains (losses) | 1.17 | 2.99 | (3.13 | ) | 4.30 | 0.74 | 0.83 | |||||||||||||||||||||
Total from operations | 1.22 | 3.13 | (3.03 | ) | 4.42 | 0.86 | 1.00 | |||||||||||||||||||||
Redemption fee | — | — | — | — | 2 | — | — | |||||||||||||||||||||
Distributions to Shareholders: | ||||||||||||||||||||||||||||
From net investment income | (0.14 | ) | (0.10 | ) | (0.08 | ) | (0.10 | ) | (0.17 | ) | (0.16 | ) | ||||||||||||||||
From net realized gains | — | (0.39 | ) | (0.19 | ) | — | (0.05 | ) | — | |||||||||||||||||||
Total distributions | (0.14 | ) | (0.49 | ) | (0.27 | ) | (0.10 | ) | (0.22 | ) | (0.16 | ) | ||||||||||||||||
Net Asset Value | ||||||||||||||||||||||||||||
End of period | $ | 18.59 | $ | 17.51 | $ | 14.87 | $ | 18.17 | $ | 13.85 | $ | 13.21 | ||||||||||||||||
Total investment return 3 | 6.99 | % | 21.57 | % | (16.97 | %) | 31.97 | % | 6.47 | % | 8.30 | % | ||||||||||||||||
Net assets at end of period (000’s omitted) | $ | 5,197 | $ | 4,866 | $ | 3,740 | $ | 4,841 | $ | 3,477 | $ | 3,387 | ||||||||||||||||
| Ratios: 4 | ||||||||||||||||||||||||||||
Expenses (without waiver) 5 | 1.25 | % | 1.25 | % | 1.25 | % | 1.25 | % | 1.25 | % | 1.25 | % | ||||||||||||||||
Expenses (with waiver) 5 | 1.00 | % | 1.00 | % | 1.00 | % | 1.00 | % | 1.00 | % | 1.00 | % | ||||||||||||||||
Net investment income (without waiver) | 0.31 | % | 0.65 | % | 0.30 | % | 0.48 | % | 0.63 | % | 1.14 | % | ||||||||||||||||
Net investment income (with waiver) | 0.56 | % | 0.90 | % | 0.55 | % | 0.73 | % | 0.88 | % | 1.38 | % | ||||||||||||||||
Portfolio turnover rate (excluding short-term securities) | 1.80 | %6 | 7.12 | % | 9.23 | % | 7.39 | % | 25.28 | % | 9.26 | % | ||||||||||||||||
| 1 | The net investment income per share is based on average shares outstanding for the period. |
| 2 | Amount represents less than $0.01 per share. |
| 3 | Total investment return is based on the change in net asset value of a share during the period (not annualized) and assumes reinvestment of distributions at net asset value. |
| 4 | Ratios are annualized for periods less than one year. In addition to fees and expenses which the Fund bears directly, the Fund indirectly bears a pro rata share of the fees and expenses of the acquired funds in which it invests. Such indirect expenses are not included in the above reported expense ratios. |
| 5 | Total Fund expenses are limited to 1.25% of average daily net assets. However, during the period above, the investment adviser voluntarily absorbed expenses that were otherwise payable by the Fund. |
| 6 | Not annualized. |
| 64 | SIT MUTUAL FUNDS SEMI-ANNUAL REPORT | |
FINANCIAL HIGHLIGHTS
Per share income and capital changes for a share outstanding throughout the period. See accompanying notes to financial statements.
Sit ESG Growth Fund
| Class S | Six Months Ended | Year Ended June 30, | ||||||||||||||||||||||||||||||||||||||
| December 31, 2023 (Unaudited) | 2023 | 2022 | 2021 | 2020 | 2019 | |||||||||||||||||||||||||||||||||||
Net Asset Value: | ||||||||||||||||||||||||||||||||||||||||
Beginning of period | $17.33 | $14.74 | $18.05 | $13.78 | $13.16 | $12.34 | ||||||||||||||||||||||||||||||||||
Operations: | ||||||||||||||||||||||||||||||||||||||||
Net investment income 1 | 0.03 | 0.10 | 0.05 | 0.08 | 0.08 | 0.14 | ||||||||||||||||||||||||||||||||||
Net realized and unrealized gains (losses) | 1.16 | 2.96 | (3.11 | ) | 4.27 | 0.74 | 0.83 | |||||||||||||||||||||||||||||||||
Total from operations | 1.19 | 3.06 | (3.06 | ) | 4.35 | 0.82 | 0.97 | |||||||||||||||||||||||||||||||||
Distributions to Shareholders: | ||||||||||||||||||||||||||||||||||||||||
From net investment income | (0.10 | ) | (0.08 | ) | (0.06 | ) | (0.08 | ) | (0.15 | ) | (0.15 | ) | ||||||||||||||||||||||||||||
From net realized gains | — | (0.39 | ) | (0.19 | ) | — | (0.05 | ) | — | |||||||||||||||||||||||||||||||
Total distributions | (0.10 | ) | (0.47 | ) | (0.25 | ) | (0.08 | ) | (0.20 | ) | (0.15 | ) | ||||||||||||||||||||||||||||
Net Asset Value | ||||||||||||||||||||||||||||||||||||||||
End of period | $18.42 | $17.33 | $14.74 | $18.05 | $13.78 | $13.16 | ||||||||||||||||||||||||||||||||||
Total investment return 2 | 6.88 | % | 21.27 | % | (17.24 | %) | 31.61 | % | 6.22 | % | 8.01 | % | ||||||||||||||||||||||||||||
Net assets at end of period (000’s omitted) | $4,581 | $4,306 | $3,577 | $4,279 | $3,158 | $2,895 | ||||||||||||||||||||||||||||||||||
| Ratios: 3 | ||||||||||||||||||||||||||||||||||||||||
Expenses (without waiver) 4 | 1.50 | % | 1.50 | % | 1.50 | % | 1.50 | % | 1.50 | % | 1.50 | % | ||||||||||||||||||||||||||||
Expenses (with waiver) 4 | 1.25 | % | 1.25 | % | 1.25 | % | 1.25 | % | 1.25 | % | 1.25 | % | ||||||||||||||||||||||||||||
Net investment income (without waiver) | 0.06 | % | 0.40 | % | 0.05 | % | 0.23 | % | 0.38 | % | 0.89 | % | ||||||||||||||||||||||||||||
Net investment income (with waiver) | 0.31 | % | 0.65 | % | 0.30 | % | 0.48 | % | 0.63 | % | 1.14 | % | ||||||||||||||||||||||||||||
Portfolio turnover rate (excluding short-term securities) | 1.80 | %5 | 7.12 | % | 9.23 | % | 7.39 | % | 25.28 | % | 9.26 | % | ||||||||||||||||||||||||||||
| 1 | The net investment income per share is based on average shares outstanding for the period. |
| 2 | Total investment return is based on the change in net asset value of a share during the period (not annualized) and assumes reinvestment of distributions at net asset value. |
| 3 | Ratios are annualized for periods less than one year. In addition to fees and expenses which the Fund bears directly, the Fund indirectly bears a pro rata share of the fees and expenses of the acquired funds in which it invests. Such indirect expenses are not included in the above reported expense ratios. |
| 4 | Total Fund expenses are limited to 1.50% of average daily net assets. However, during the period above, the investment adviser voluntarily absorbed expenses that were otherwise payable by the Fund. |
| 5 | Not annualized. |
| DECEMBER 31, 2023 | 65 | |
FINANCIAL HIGHLIGHTS
Per share income and capital changes for a share outstanding throughout the period. See accompanying notes to financial statements.
Sit Mid Cap Growth Fund
| Six Months Ended | Year Ended June 30, | |||||||||||||||||||||||||||
| December 31, 2023 (Unaudited) | 2023 | 2022 | 2021 | 2020 | 2019 | |||||||||||||||||||||||
Net Asset Value: | ||||||||||||||||||||||||||||
Beginning of period | $20.07 | $16.96 | $25.41 | $19.05 | $18.84 | $18.96 | ||||||||||||||||||||||
Operations: | ||||||||||||||||||||||||||||
Net investment loss 1 | (0.03 | ) | (0.01 | ) | (0.12 | ) | (0.10 | ) | (0.05 | ) | (0.03 | ) | ||||||||||||||||
Net realized and unrealized gains (losses) | 1.62 | 3.67 | (5.37 | ) | 7.44 | 1.64 | 1.79 | |||||||||||||||||||||
Total from operations | 1.59 | 3.66 | (5.49 | ) | 7.34 | 1.59 | 1.76 | |||||||||||||||||||||
Redemption fee 2 | — | — | — | — | — | — | ||||||||||||||||||||||
Distributions to Shareholders: | ||||||||||||||||||||||||||||
From net realized gains | (0.10 | ) | (0.55 | ) | (2.96 | ) | (0.98 | ) | (1.38 | ) | (1.88 | ) | ||||||||||||||||
Net Asset Value | ||||||||||||||||||||||||||||
End of period | $21.56 | $20.07 | $16.96 | $25.41 | $19.05 | $18.84 | ||||||||||||||||||||||
Total investment return 3 | 7.88 | % | 22.00 | % | (24.70 | %) | 38.99 | % | 8.75 | % | 11.76 | % | ||||||||||||||||
Net assets at end of period (000’s omitted) | $194,073 | $185,220 | $164,430 | $228,171 | $172,744 | $169,099 | ||||||||||||||||||||||
Ratios: 4 | ||||||||||||||||||||||||||||
Expenses | 1.25 | % | 1.25 | % | 1.25 | % | 1.25 | % | 1.25 | % | 1.25 | % | ||||||||||||||||
Net investment loss | (0.26 | %) | (0.03 | %) | (0.52 | %) | (0.46 | %) | (0.27 | %) | (0.16 | %) | ||||||||||||||||
Portfolio turnover rate (excluding short-term securities) | 3.27 | %5 | 7.00 | % | 13.16 | % | 19.54 | % | 25.58 | % | 27.70 | % | ||||||||||||||||
| 1 | The net investment income per share is based on average shares outstanding for the period. |
| 2 | Amount represents less than $0.01 per share. |
| 3 | Total investment return is based on the change in net asset value of a share during the period (not annualized) and assumes reinvestment of distributions at net asset value. |
| 4 | Ratios are annualized for periods less than one year. In addition to fees and expenses which the Fund bears directly, the Fund indirectly bears a pro rata share of the fees and expenses of the acquired funds in which it invests. Such indirect expenses are not included in the above reported expense ratios. |
| 5 | Not annualized. |
| 66 | SIT MUTUAL FUNDS SEMI-ANNUAL REPORT | |
FINANCIAL HIGHLIGHTS
Per share income and capital changes for a share outstanding throughout the period. See accompanying notes to financial statements.
Sit Small Cap Dividend Growth Fund
| Class I | Six Months Ended | Year Ended June 30, | ||||||||||||||||||||||||||||
| December 31, 2023 (Unaudited) | 2023 | 2022 | 2021 | 2020 | 2019 | |||||||||||||||||||||||||
Net Asset Value: | ||||||||||||||||||||||||||||||
Beginning of period | $14.31 | $12.85 | $16.73 | $11.39 | $11.89 | $12.27 | ||||||||||||||||||||||||
Operations: | ||||||||||||||||||||||||||||||
Net investment income 1 | 0.08 | 0.19 | 0.14 | 0.13 | 0.13 | 0.15 | ||||||||||||||||||||||||
Net realized and unrealized gains (losses) | 0.71 | 1.83 | (2.61 | ) | 5.32 | (0.49 | ) | (0.25 | ) | |||||||||||||||||||||
Total from operations | 0.79 | 2.02 | (2.47 | ) | 5.45 | (0.36 | ) | (0.10 | ) | |||||||||||||||||||||
Redemption fee | — | — | — | 2 | — | — | — | |||||||||||||||||||||||
Distributions to Shareholders: | ||||||||||||||||||||||||||||||
From net investment income | (0.13 | ) | (0.19 | ) | (0.14 | ) | (0.11 | ) | (0.14 | ) | (0.15 | ) | ||||||||||||||||||
From net realized gains | — | (0.37 | ) | (1.27 | ) | — | — | (0.13 | ) | |||||||||||||||||||||
Total distributions | (0.13 | ) | (0.56 | ) | (1.41 | ) | (0.11 | ) | (0.14 | ) | (0.28 | ) | ||||||||||||||||||
Net Asset Value | ||||||||||||||||||||||||||||||
End of period | $14.97 | $14.31 | $12.85 | $16.73 | $11.39 | $11.89 | ||||||||||||||||||||||||
Total investment return 3 | 5.54 | % | 16.20 | % | (16.30 | %) | 48.13 | % | (3.05 | %) | (0.54 | %) | ||||||||||||||||||
Net assets at end of period (000’s omitted) | $17,270 | $16,508 | $14,209 | $17,114 | $11,786 | $12,559 | ||||||||||||||||||||||||
Ratios: 4 | ||||||||||||||||||||||||||||||
Expenses (without waiver) 5 | 1.25 | % | 1.25 | % | 1.25 | % | 1.25 | % | 1.25 | % | 1.25 | % | ||||||||||||||||||
Expenses (with waiver) 5 | 0.90 | % | 0.90 | % | 0.95 | % | 1.00 | % | 1.00 | % | 1.00 | % | ||||||||||||||||||
Net investment income (without waiver) | 0.83 | % | 1.06 | % | 0.59 | % | 0.67 | % | 0.90 | % | 1.07 | % | ||||||||||||||||||
Net investment income (with waiver) | 1.18 | % | 1.41 | % | 0.89 | % | 0.92 | % | 1.15 | % | 1.32 | % | ||||||||||||||||||
Portfolio turnover rate (excluding short-term securities) | 6.89 | %6 | 15.05 | % | 18.47 | % | 27.91 | % | 27.58 | % | 24.17 | % | ||||||||||||||||||
| 1 | The net investment income per share is based on average shares outstanding for the period. |
| 2 | Amount represents less than $0.01 per share. |
| 3 | Total investment return is based on the change in net asset value of a share during the period (not annualized) and assumes reinvestment of distributions at net asset value. |
| 4 | Ratios are annualized for periods less than one year. In addition to fees and expenses which the Fund bears directly, the Fund indirectly bears a pro rata share of the fees and expenses of the acquired funds in which it invests. Such indirect expenses are not included in the above reported expense ratios. |
| 5 | Total Fund expenses are limited to 1.25% of average daily net assets. However, during the period above, the investment adviser voluntarily absorbed expenses that were otherwise payable by the Fund. |
| 6 | Not annualized. |
| DECEMBER 31, 2023 | 67 | |
FINANCIAL HIGHLIGHTS
Per share income and capital changes for a share outstanding throughout the period. See accompanying notes to financial statements.
Sit Small Cap Dividend Growth Fund
| Class S | Six Months Ended | Year Ended June 30, | ||||||||||||||||||||||||||||
| December 31, 2023 (Unaudited) | 2023 | 2022 | 2021 | 2020 | 2019 | |||||||||||||||||||||||||
Net Asset Value: | ||||||||||||||||||||||||||||||
Beginning of period | $14.30 | $12.84 | $16.72 | $11.38 | $11.88 | $12.26 | ||||||||||||||||||||||||
Operations: | ||||||||||||||||||||||||||||||
Net investment income 1 | 0.07 | 0.16 | 0.11 | 0.10 | 0.10 | 0.12 | ||||||||||||||||||||||||
Net realized and unrealized gains (losses) | 0.69 | 1.83 | (2.62 | ) | 5.32 | (0.49 | ) | (0.25 | ) | |||||||||||||||||||||
Total from operations | 0.76 | 1.99 | (2.51 | ) | 5.42 | (0.39 | ) | (0.13 | ) | |||||||||||||||||||||
Redemption fee | — | 2 | — | — | 2 | — | — | — | ||||||||||||||||||||||
Distributions to Shareholders: | ||||||||||||||||||||||||||||||
From net investment income | (0.10 | ) | (0.16 | ) | (0.10 | ) | (0.08 | ) | (0.11 | ) | (0.12 | ) | ||||||||||||||||||
From net realized gains | — | (0.37 | ) | (1.27 | ) | — | — | (0.13 | ) | |||||||||||||||||||||
Total distributions | (0.10 | ) | (0.53 | ) | (1.37 | ) | (0.08 | ) | (0.11 | ) | (0.25 | ) | ||||||||||||||||||
Net Asset Value | ||||||||||||||||||||||||||||||
End of period | $14.96 | $14.30 | $12.84 | $16.72 | $11.38 | $11.88 | ||||||||||||||||||||||||
Total investment return 3 | 5.35 | % | 15.91 | % | (16.48 | %) | 47.73 | % | (3.30 | %) | (0.80 | %) | ||||||||||||||||||
Net assets at end of period (000’s omitted) | $5,325 | $4,965 | $4,323 | $5,187 | $3,720 | $3,981 | ||||||||||||||||||||||||
Ratios: 4 | ||||||||||||||||||||||||||||||
Expenses (without waiver) 5 | 1.50 | % | 1.50 | % | 1.50 | % | 1.50 | % | 1.50 | % | 1.50 | % | ||||||||||||||||||
Expenses (with waiver) 5 | 1.15 | % | 1.15 | % | 1.20 | % | 1.25 | % | 1.25 | % | 1.25 | % | ||||||||||||||||||
Net investment income (without waiver) | 0.58 | % | 0.81 | % | 0.42 | % | 0.42 | % | 0.64 | % | 0.82 | % | ||||||||||||||||||
Net investment income (with waiver) | 0.93 | % | 1.16 | % | 0.72 | % | 0.67 | % | 0.89 | % | 1.07 | % | ||||||||||||||||||
Portfolio turnover rate (excluding short-term securities) | 6.89 | %6 | 15.05 | % | 18.47 | % | 27.91 | % | 27.58 | % | 24.17 | % | ||||||||||||||||||
| 1 | The net investment income per share is based on average shares outstanding for the period. |
| 2 | Amount represents less than $0.01 per share. |
| 3 | Total investment return is based on the change in net asset value of a share during the period (not annualized) and assumes reinvestment of distributions at net asset value. |
| 4 | Ratios are annualized for periods less than one year. In addition to fees and expenses which the Fund bears directly, the Fund indirectly bears a pro rata share of the fees and expenses of the acquired funds in which it invests. Such indirect expenses are not included in the above reported expense ratios. |
| 5 | Total Fund expenses are limited to 1.50% of average daily net assets. However, during the period above, the investment adviser voluntarily absorbed expenses that were otherwise payable by the Fund. |
| 6 | Not annualized. |
| 68 | SIT MUTUAL FUNDS SEMI-ANNUAL REPORT | |
FINANCIAL HIGHLIGHTS
Per share income and capital changes for a share outstanding throughout the period. See accompanying notes to financial statements.
Sit Small Cap Growth Fund
| Six Months Ended | Year Ended June 30, | |||||||||||||||||||||||||||
| December 31, 2023 (Unaudited) | 2023 | 2022 | 2021 | 2020 | 2019 | |||||||||||||||||||||||
Net Asset Value: | ||||||||||||||||||||||||||||
Beginning of period | $60.29 | $52.41 | $82.14 | $56.81 | $55.46 | $57.18 | ||||||||||||||||||||||
Operations: | ||||||||||||||||||||||||||||
Net investment loss 1 | (0.09 | ) | (0.13 | ) | (0.48 | ) | (0.44 | ) | (0.28 | ) | (0.25 | ) | ||||||||||||||||
Net realized and unrealized gains (losses) | 2.03 | 8.93 | (17.68 | ) | 28.28 | 3.38 | 2.88 | |||||||||||||||||||||
Total from operations | 1.94 | 8.80 | (18.16 | ) | 27.84 | 3.10 | 2.63 | |||||||||||||||||||||
Redemption fee 2 | — | — | — | — | — | — | ||||||||||||||||||||||
Distributions to Shareholders: | ||||||||||||||||||||||||||||
From net realized gains | (1.89 | ) | (0.92 | ) | (11.57 | ) | (2.51 | ) | (1.75 | ) | (4.35 | ) | ||||||||||||||||
Net Asset Value | ||||||||||||||||||||||||||||
End of period | $60.34 | $60.29 | $52.41 | $82.14 | $56.81 | $55.46 | ||||||||||||||||||||||
Total investment return 3 | 3.26 | % | 17.01 | % | (25.57 | %) | 49.65 | % | 5.68 | % | 6.45 | % | ||||||||||||||||
Net assets at end of period (000’s omitted) | $109,199 | $109,824 | $98,444 | $145,859 | $100,613 | $99,630 | ||||||||||||||||||||||
Ratios: 4 | ||||||||||||||||||||||||||||
Expenses | 1.50 | % | 1.50 | % | 1.50 | % | 1.50 | % | 1.50 | % | 1.50 | % | ||||||||||||||||
Net investment loss | (0.31 | %) | (0.24 | %) | (0.67 | %) | (0.62 | %) | (0.53 | %) | (0.47 | %) | ||||||||||||||||
Portfolio turnover rate (excluding short-term securities) | 6.01 | %5 | 13.76 | % | 15.64 | % | 30.54 | % | 25.74 | % | 26.34 | % | ||||||||||||||||
| 1 | The net investment income per share is based on average shares outstanding for the period. |
| 2 | Amount represents less than $0.01 per share. |
| 3 | Total investment return is based on the change in net asset value of a share during the period (not annualized) and assumes reinvestment of distributions at net asset value. |
| 4 | Ratios are annualized for periods less than one year. In addition to fees and expenses which the Fund bears directly, the Fund indirectly bears a pro rata share of the fees and expenses of the acquired funds in which it invests. Such indirect expenses are not included in the above reported expense ratios. |
| 5 | Not annualized. |
| DECEMBER 31, 2023 | 69 | |
FINANCIAL HIGHLIGHTS
Per share income and capital changes for a share outstanding throughout the period. See accompanying notes to financial statements.
Sit International Growth Fund
| Six Months Ended | Year Ended June 30, | |||||||||||||||||||||||||||||||
| December 31, 2023 (Unaudited) | 2023 | 2022 | 2021 | 2020 | 2019 | |||||||||||||||||||||||||||
Net Asset Value: | ||||||||||||||||||||||||||||||||
Beginning of period | $20.62 | $17.78 | $23.27 | $17.38 | $17.13 | $16.75 | ||||||||||||||||||||||||||
Operations: | ||||||||||||||||||||||||||||||||
Net investment income 1 | 0.07 | 0.28 | 0.20 | 0.05 | 0.06 | 0.16 | ||||||||||||||||||||||||||
Net realized and unrealized gains (losses) | 1.00 | 2.92 | (5.63 | ) | 5.89 | 0.36 | 0.40 | |||||||||||||||||||||||||
Total from operations | 1.07 | 3.20 | (5.43 | ) | 5.94 | 0.42 | 0.56 | |||||||||||||||||||||||||
Redemption fee | — | — | — | — | — | 2 | — | |||||||||||||||||||||||||
Distributions to Shareholders: | ||||||||||||||||||||||||||||||||
From net investment income | (0.29 | ) | (0.27 | ) | (0.06 | ) | (0.05 | ) | (0.17 | ) | (0.18 | ) | ||||||||||||||||||||
From net realized gains | (0.15 | ) | (0.09 | ) | — | — | — | — | ||||||||||||||||||||||||
Total distributions | (0.44 | ) | (0.36 | ) | (0.06 | ) | (0.05 | ) | (0.17 | ) | (0.18 | ) | ||||||||||||||||||||
Net Asset Value | ||||||||||||||||||||||||||||||||
End of period | $21.25 | $20.62 | $17.78 | $23.27 | $17.38 | $17.13 | ||||||||||||||||||||||||||
Total investment return 3 | 5.24 | % | 18.27 | % | (23.41 | %) | 34.18 | % | 2.43 | % | 3.55 | % | ||||||||||||||||||||
Net assets at end of period (000’s omitted) | $27,325 | $26,624 | $22,454 | $31,345 | $23,005 | $23,463 | ||||||||||||||||||||||||||
| Ratios: 4 | ||||||||||||||||||||||||||||||||
Expenses (without waiver) | 1.50 | %5 | 1.50 | %5 | 1.50 | %5 | 1.50 | % | 1.50 | % | 1.50 | % | ||||||||||||||||||||
Expenses (with waiver) | 0.85 | %5 | 0.85 | %5 | 1.20 | %5 | — | — | — | |||||||||||||||||||||||
Net investment income (without waiver) | 0.03 | % | 0.87 | % | 0.59 | % | 0.26 | % | 0.35 | % | 0.97 | % | ||||||||||||||||||||
Net investment income (with waiver) | 0.68 | % | 1.52 | % | 0.88 | % | — | — | — | |||||||||||||||||||||||
Portfolio turnover rate (excluding short-term securities) | 2.80 | %6 | 7.65 | % | 7.76 | % | 12.61 | % | 13.38 | % | 27.38 | % | ||||||||||||||||||||
| 1 | The net investment income per share is based on average shares outstanding for the period. |
| 2 | Amount represents less than $0.01 per share. |
| 3 | Total investment return is based on the change in net asset value of a share during the period (not annualized) and assumes reinvestment of distributions at net asset value. |
| 4 | Ratios are annualized for periods less than one year. In addition to fees and expenses which the Fund bears directly, the Fund indirectly bears a pro rata share of the fees and expenses of the acquired funds in which it invests. Such indirect expenses are not included in the above reported expense ratios. |
| 5 | Total Fund expenses are limited to 1.50% of average daily net assets. However, during the period above, the investment adviser voluntarily absorbed expenses that were otherwise payable by the Fund. |
| 6 | Not annualized. |
| 70 | SIT MUTUAL FUNDS SEMI-ANNUAL REPORT | |
FINANCIAL HIGHLIGHTS
Per share income and capital changes for a share outstanding throughout the period. See accompanying notes to financial statements.
Sit Developing Markets Growth Fund
| Six Months Ended | Year Ended June 30, | |||||||||||||||||||||||||||||||
| December 31, 2023 (Unaudited) | 2023 | 2022 | 2021 | 2020 | 2019 | |||||||||||||||||||||||||||
Net Asset Value: | ||||||||||||||||||||||||||||||||
Beginning of period | $16.06 | $15.46 | $21.40 | $16.28 | $16.21 | $17.25 | ||||||||||||||||||||||||||
Operations: | ||||||||||||||||||||||||||||||||
Net investment income 1 | 0.09 | 0.23 | 0.21 | 0.01 | 0.26 | 0.10 | ||||||||||||||||||||||||||
Net realized and unrealized gains (losses) | (0.04 | ) | 0.74 | (5.76 | ) | 5.17 | 0.11 | (0.90 | ) | |||||||||||||||||||||||
Total from operations | 0.05 | 0.97 | (5.55 | ) | 5.18 | 0.37 | (0.80 | ) | ||||||||||||||||||||||||
Redemption fee | — | — | 2 | — | — | — | 2 | — | ||||||||||||||||||||||||
Distributions to Shareholders: | ||||||||||||||||||||||||||||||||
From net investment income | (0.24 | ) | (0.29 | ) | (0.02 | ) | (0.02 | ) | (0.30 | ) | (0.08 | ) | ||||||||||||||||||||
From net realized gains | (0.08 | ) | (0.08 | ) | (0.37 | ) | (0.04 | ) | — | (0.16 | ) | |||||||||||||||||||||
Total distributions | (0.32 | ) | (0.37 | ) | (0.39 | ) | (0.06 | ) | (0.30 | ) | (0.24 | ) | ||||||||||||||||||||
Net Asset Value | ||||||||||||||||||||||||||||||||
End of period | $15.79 | $16.06 | $15.46 | $21.40 | $16.28 | $16.21 | ||||||||||||||||||||||||||
Total investment return 3 | 0.38 | % | 6.42 | % | (26.19 | %) | 31.79 | % | 2.20 | % | (4.43 | %) | ||||||||||||||||||||
Net assets at end of period (000’s omitted) | $9,631 | $10,098 | $9,400 | $13,883 | $10,260 | $9,996 | ||||||||||||||||||||||||||
| Ratios: 4 | ||||||||||||||||||||||||||||||||
Expenses (without waiver) 5 | 2.00 | % | 2.00 | % | 2.00 | % | 2.00 | % | 2.00 | % | 2.00 | % | ||||||||||||||||||||
Expenses (with waiver) 5 | 0.95 | % | 0.95 | % | 1.20 | % | 1.40 | % | 1.40 | % | 1.40 | % | ||||||||||||||||||||
Net investment income (without waiver) | 0.07 | % | 0.42 | % | 0.35 | % | (0.55 | %) | 1.05 | % | 0.03 | % | ||||||||||||||||||||
Net investment income (with waiver) | 1.12 | % | 1.47 | % | 1.15 | % | 0.05 | % | 1.65 | % | 0.63 | % | ||||||||||||||||||||
Portfolio turnover rate (excluding short-term securities) | 0.26 | %6 | 0.76 | % | 2.49 | % | 7.52 | % | 4.15 | % | 10.28 | % | ||||||||||||||||||||
| 1 | The net investment income per share is based on average shares outstanding for the period. |
| 2 | Amount represents less than $0.01 per share. |
| 3 | Total investment return is based on the change in net asset value of a share during the period (not annualized) and assumes reinvestment of distributions at net asset value. |
| 4 | Ratios are annualized for periods less than one year. In addition to fees and expenses which the Fund bears directly, the Fund indirectly bears a pro rata share of the fees and expenses of the acquired funds in which it invests. Such indirect expenses are not included in the above reported expense ratios. |
| 5 | Total Fund expenses are limited to 2.00% of average daily net assets. However, during the period above, the investment adviser voluntarily absorbed expenses that were otherwise payable by the Fund. |
| 6 | Not annualized. |
| DECEMBER 31, 2023 | 71 | |
NOTES TO FINANCIAL STATEMENTS (Unaudited)
Six Months Ended December 31, 2023
| (1) | Organization |
The Sit Mutual Funds covered by this report are Sit Balanced Fund, Sit Dividend Growth Fund, Sit Global Dividend Growth Fund, Sit Large Cap Growth Fund, Sit ESG Growth Fund, Sit Mid Cap Growth Fund, Sit Small Cap Dividend Growth Fund, Sit Small Cap Growth Fund, Sit International Growth Fund, and Sit Developing Markets Growth Fund (each a “Fund” and collectively, the “Funds”). The Funds are no-load funds, and are registered under the Investment Company Act of 1940 (as amended) as diversified, open-end management investment companies, or series thereof. The Sit Balanced Fund, Sit Dividend Growth Fund, Sit Global Dividend Growth Fund, Sit ESG Growth Fund, Sit Small Cap Dividend Growth Fund, Sit Small Cap Growth Fund, Sit International Growth Fund, and Sit Developing Markets Growth Fund are series funds of Sit Mutual Funds, Inc. Each Fund has 10 billion authorized shares of capital stock with a par value of $0.001. This report covers the equity Funds of the Sit Mutual Funds.
The investment objective for each Fund is as follows:
| Fund | Investment Objective | |||
| Balanced Fund | Seeks long-term growth consistent with the preservation of principal and seeks to provide regular income. | |||
| Dividend Growth Fund | Seeks to provide current income that exceeds the dividend yield of the S&P 500® Index and that grows over a period of years. Secondarily, seeks long-term capital appreciation. | |||
| Global Dividend Growth Fund | Seeks to provide current income that exceeds the dividend yield of the MSCI World Index and that grows over a period of years. Secondarily, seeks long-term capital appreciation. | |||
| Large Cap Growth Fund | Seeks to maximize long-term capital appreciation. | |||
| ESG Growth Fund | Seeks to maximize long-term capital appreciation. | |||
| Mid Cap Growth Fund | Seeks to maximize long-term capital appreciation. | |||
| Small Cap Dividend Growth Fund | Seeks to provide current income that exceeds the yield of the Russell 2000® Index and that grows over a period of years. Secondarily, seeks long-term capital appreciation. | |||
| Small Cap Growth Fund | Seeks to maximize long-term capital appreciation. | |||
| International Growth Fund | Seeks long-term growth. | |||
| Developing Markets Growth Fund | Seeks to maximize long-term capital appreciation. | |||
The Dividend Growth, Global Dividend Growth, ESG Growth and Small Cap Dividend Growth Funds offer Class I and Class S shares. Both classes of shares have identical voting, dividend, and liquidation rights. The distribution fee differs among classes, the Class S shares have a 0.25% distribution fee, whereas Class I has no distribution fee. Income, expenses (other than class specific expenses) and realized and unrealized gains or losses on investments are allocated to each class of shares based upon its relative net assets.
| (2) | Significant Accounting Policies |
The Funds are investment companies and follow accounting and reporting guidance under Financial Accounting Standards Board (“FASB”) Accounting Standards Codification (“ASC”) Topic 946, “Financial Services-Investment Companies”. The following is a summary of significant accounting policies consistently followed by the Funds in the preparation of their financial statements in conformity with U.S. generally accepted accounting principles (“GAAP”).
Investments in Securities
Investments in securities traded on national or international securities exchanges are valued at the last reported sales price prior to the time when assets are valued. Equity securities traded on the over-the-counter market are valued at the last reported sales price or if the last sales price is not available, at the last reported bid price. The sale and bid prices or prices deemed best to reflect fair value quoted by dealers who make markets in these securities are obtained from independent pricing services. Consistent with the Funds’ valuation policies and procedures, debt securities maturing in more than 60 days are priced by an independent pricing service. The pricing service may use models that price securities based on current yields and relative security characteristics, such as coupon rate, maturity date, issuer credit quality, and
| 72 | SIT MUTUAL FUNDS SEMI-ANNUAL REPORT | |
prepayment speeds as applicable. When market quotations are not readily available, or when Sit Investment Associates, Inc. (the “Adviser” or “SIA”) becomes aware that a significant event impacting the value of a security or group of securities has occurred after the closing of the exchange on which the security or securities principally trade, but before the calculation of the daily net asset value, securities are valued at fair value as determined in good faith using procedures established by the Funds’ Board of Directors. The procedures consider, among others, the following factors to determine a security’s fair value: the nature and pricing history (if any) of the security; whether any dealer quotations for the security are available; and possible valuation methodologies that could be used to determine the fair value of the security. Debt securities of sufficient credit quality maturing in less than 60 days when acquired, or which subsequently are within 60 days of maturity, are valued at amortized cost, which approximates fair value.
Security transactions are accounted for on the date the securities are purchased or sold. Securities gains and losses are calculated on the identified-cost basis. Dividend income is recorded on the ex-dividend date or upon the receipt of ex-dividend notification in the case of certain foreign securities. Interest income is recorded on an accrual basis, including level-yield amortization of long-term bond premium and discount using the effective yield method.
Fair Value Measurements
The inputs and valuation techniques used to measure fair value of the Funds’ investments are summarized into three levels as described in the hierarchy below:
• Level 1 – quoted prices in active markets for identical securities. An active market for the security is a market in which transactions occur with sufficient frequency and volume to provide pricing information on an ongoing basis. A quoted price in an active market provides the most reliable evidence of fair value.
• Level 2 – debt securities are valued based on evaluated prices received from independent pricing services or from dealers who make markets in such securities. For corporate bonds, U.S. government and government agency obligations, and municipal securities the pricing services utilize matrix pricing which considers yield or price of bonds of comparable quality, coupon, maturity, and type as well as dealer supplied prices. For asset-backed securities and mortgage-backed securities, the pricing services utilize matrix pricing which considers prepayment speed assumptions, attributes of the collateral, yield or price of bonds of comparable quality, coupon, maturity, and type as well as dealer supplied prices. For foreign equities, the pricing services adjust closing prices by applying a systematic process for events occurring after the close of the foreign exchange by utilizing such inputs as Depositary Receipts, quoted prices for similar securities, exchange rates, and certain indexes. All of these inputs are derived principally from or corroborated by observable market data. An adjustment to any observable input that is significant to the fair value may render the measurement a Level 3 measurement.
• Level 3 – significant unobservable inputs, including the Adviser’s own assumptions in determining the fair value of investments.
The inputs or methodology used for valuing securities are not necessarily an indication of the risk associated with investing in those securities.
A summary of the levels for the Funds’ investments as of December 31, 2023 is included with the Funds’ schedules of investments.
Foreign Currency Translations and Forward Foreign Currency Contracts
The fair value of securities and other assets and liabilities denominated in foreign currencies for Global Dividend Growth, ESG Growth, International Growth and Developing Markets Growth Funds are translated daily into U.S. dollars at the closing rate of exchange (approximately 4:00 p.m. Eastern Time). Purchases and sales of securities, income and expenses are translated at the exchange rate on the transaction date. Dividend and interest income includes currency exchange gains (losses) realized between the accrual and payment dates on such income. Exchange gains (losses) may also be realized between the trade and settlement dates on security and forward contract transactions. For securities denominated in foreign currencies, the effect of changes in foreign exchange rates on realized and unrealized gains or losses is reflected as a component of such gains or losses.
The Global Dividend Growth, ESG Growth, International Growth and Developing Markets Growth Funds may enter into forward foreign currency exchange contracts generally for operational purposes, but the Adviser may occasionally utilize contracts to protect against adverse exchange rate fluctuation. Any gains (losses) generated by these contracts are disclosed separately on the statements of operations.
| DECEMBER 31, 2023 | 73 | |
NOTES TO FINANCIAL STATEMENTS (Unaudited)
Six Months Ended December 31, 2023 (Continued)
The net U.S. dollar value of foreign currency underlying all contractual commitments held by the Funds and the resulting unrealized appreciation or depreciation is determined using foreign currency exchange rates from an independent pricing service. The Funds are subject to the credit risk that the other party will not complete the obligations of the contract.
Federal Taxes
The Funds’ policy is to comply with the requirements of the Internal Revenue Code applicable to regulated investment companies and to distribute all of their taxable income to shareholders. Therefore, no income tax provision is required. In order to avoid the payment of any federal excise taxes, the Funds will distribute substantially all of their net investment income and net realized gains on a calendar year basis. Also, the Funds may utilize equalization accounting for tax purposes, whereby a portion of redemption payments are treated as distributions of income or gain for income tax purposes.
Management has analyzed the Funds’ tax positions taken in federal tax returns for all open tax years and has concluded that as of June 30, 2023, no provision for income tax would be required in the Funds’ financial statements. The Funds’ federal and state income and federal excise tax returns remain subject to examination by the Internal Revenue Service and state departments of revenue until such time as the applicable statute of limitations for audit has expired. For example, U.S. tax returns are generally subject to audit for three years from the date they are filed.
At December 31, 2023, the gross unrealized appreciation (depreciation) on investments and cost of securities on a tax basis for federal income tax purposes were as follows:
| Unrealized Appreciation | Unrealized Depreciation | Net Unrealized Appreciation (Depreciation) | Cost of Securities on a Tax Basis | |||||||||||||
Balanced Fund | $18,729,935 | ($1,289,440 | ) | $17,440,495 | $38,177,053 | |||||||||||
Dividend Growth Fund | 56,601,374 | (1,300,767 | ) | 55,300,607 | 169,796,753 | |||||||||||
Global Dividend Growth Fund | 23,521,851 | (184,213 | ) | 23,337,638 | 24,866,707 | |||||||||||
Large Cap Growth Fund | 119,403,001 | (904,106 | ) | 118,498,895 | 57,957,685 | |||||||||||
ESG Growth Fund | 4,367,239 | (237,368 | ) | 4,129,871 | 5,636,370 | |||||||||||
Mid Cap Growth Fund | 106,662,245 | (4,018,412 | ) | 102,643,833 | 90,809,594 | |||||||||||
Small Cap Dividend Growth Fund | 7,473,140 | (1,282,556 | ) | 6,190,584 | 16,428,542 | |||||||||||
Small Cap Growth Fund | 49,292,627 | (4,983,968 | ) | 44,308,659 | 64,648,194 | |||||||||||
International Growth Fund | 10,146,714 | (1,123,504 | ) | 9,023,210 | 18,206,598 | |||||||||||
Developing Markets Growth Fund | 3,440,932 | (1,297,649 | ) | 2,143,283 | 7,474,014 | |||||||||||
Net investment income and net realized gains differ for financial statement and tax purposes because of corporate actions on shares held and/or losses deferred due to “wash sale” transactions. A “wash sale” occurs when a Fund sells a security that it has acquired within a period beginning thirty days before and ending thirty days after the date of sale (a sixty one day period). The character of distributions made during the year from net investment income or net realized gains may also differ from its ultimate characterization for tax purposes. Also, due to the timing of dividend distributions, the fiscal year in which amounts are distributed may differ from the year that the income or realized gains (losses) were recorded by the Funds. The tax character of distributions paid during the fiscal years ended June 30, 2023 and 2022 was as follows:
| 74 | SIT MUTUAL FUNDS SEMI-ANNUAL REPORT | |
| Year Ended June 30, 2023: | ||||||||||||||||||||
| Ordinary Income | Long Term Capital Gain | Total | ||||||||||||||||||
Balanced Fund | $619,854 | $1,601,210 | $2,221,064 | |||||||||||||||||
Dividend Growth Fund (Class I) | 2,683,114 | 19,091,190 | 21,774,304 | |||||||||||||||||
Dividend Growth Fund (Class S) | 241,918 | 2,130,893 | 2,372,811 | |||||||||||||||||
Global Dividend Growth Fund (Class I) | 446,552 | — | 446,552 | |||||||||||||||||
Global Dividend Growth Fund (Class S) | 31,454 | — | 31,454 | |||||||||||||||||
Large Cap Growth Fund | — | 4,952,920 | 4,952,920 | |||||||||||||||||
ESG Growth Fund (Class I) | 23,820 | 96,959 | 120,779 | |||||||||||||||||
ESG Growth Fund (Class S) | 19,181 | 97,269 | 116,450 | |||||||||||||||||
Mid Cap Growth Fund | — | 5,106,424 | 5,106,424 | |||||||||||||||||
Small Cap Dividend Growth Fund (Class I) | 236,730 | 383,106 | 619,836 | |||||||||||||||||
Small Cap Dividend Growth Fund (Class S) | 61,510 | 121,113 | 182,623 | |||||||||||||||||
Small Cap Growth Fund | — | 1,688,086 | 1,688,086 | |||||||||||||||||
International Growth Fund | 337,000 | 116,404 | 453,404 | |||||||||||||||||
Developing Markets Growth Fund | 176,000 | 46,145 | 222,145 | |||||||||||||||||
Year Ended June 30, 2022: | ||||||||||||||||||||
| Ordinary Income | Long Term Capital Gain | Total | ||||||||||||||||||
Balanced Fund | $682,176 | $2,274,137 | $2,956,313 | |||||||||||||||||
Dividend Growth Fund (Class I) | 3,242,312 | 22,439,549 | 25,681,861 | |||||||||||||||||
Dividend Growth Fund (Class S) | 349,898 | 2,818,447 | 3,168,345 | |||||||||||||||||
Global Dividend Growth Fund (Class I) | 334,135 | — | 334,135 | |||||||||||||||||
Global Dividend Growth Fund (Class S) | 22,870 | — | 22,870 | |||||||||||||||||
Large Cap Growth Fund | 4,575 | 10,817,703 | 10,822,278 | |||||||||||||||||
ESG Growth Fund (Class I) | 23,120 | 48,536 | 71,656 | |||||||||||||||||
ESG Growth Fund (Class S) | 15,486 | 44,262 | 59,748 | |||||||||||||||||
Mid Cap Growth Fund | — | 26,173,363 | 26,173,363 | |||||||||||||||||
Small Cap Dividend Growth Fund (Class I) | 170,582 | 1,267,749 | 1,438,331 | |||||||||||||||||
Small Cap Dividend Growth Fund (Class S) | 38,830 | 390,273 | 429,103 | |||||||||||||||||
Small Cap Growth Fund | 1,227,477 | 18,447,720 | 19,675,197 | |||||||||||||||||
International Growth Fund | 72,739 | — | 72,739 | |||||||||||||||||
Developing Markets Growth Fund | 14,001 | 238,775 | 252,776 | |||||||||||||||||
As of June 30, 2023, the components of distributable earnings on a tax basis were as follows:
| Undistributed Ordinary Income | Undistributed Long-Term Capital Gains | Unrealized Appreciation (Depreciation) | ||||||||||
Balanced Fund | $176,536 | — | $13,518,099 | |||||||||
Dividend Growth Fund | 909,847 | $4,313,255 | 48,408,053 | |||||||||
Global Dividend Growth Fund | 223,446 | — | 20,648,361 | |||||||||
Large Cap Growth Fund | 122,457 | 3,071,010 | 102,817,665 | |||||||||
ESG Growth Fund | 46,347 | — | 3,550,042 | |||||||||
Mid Cap Growth Fund | — | — | 91,155,988 | |||||||||
Small Cap Dividend Growth Fund | 69,342 | — | 5,338,369 | |||||||||
Small Cap Growth Fund | — | 1,826,605 | 44,625,845 | |||||||||
International Growth Fund | 281,702 | 104,016 | 7,908,836 | |||||||||
Developing Markets Growth Fund | 89,176 | 33,582 | 2,246,126 | |||||||||
| DECEMBER 31, 2023 | 75 | |
NOTES TO FINANCIAL STATEMENTS (Unaudited)
Six Months Ended December 31, 2023 (Continued)
Net capital loss carryovers and late year losses, if any, as of June 30, 2023, are available to offset future realized capital gains and thereby reduce future capital gains distributions. The Funds’ are permitted to carry forward capital losses for an unlimited period. Capital losses that are carried forward retain their character as either short-term or long-term capital losses. The net capital loss carryovers and the late year losses deferred as of June 30, 2023, were as follows:
| Unlimited Period of Net | Late Year | |||||||||||||||||||
| Capital Loss Carryover | Losses Deferred | |||||||||||||||||||
| Short-Term | Long-Term | Ordinary | Capital | |||||||||||||||||
Balanced Fund | — | — | — | $333,530 | ||||||||||||||||
Global Dividend Growth Fund | $167,196 | $504,010 | — | — | ||||||||||||||||
ESG Growth Fund | — | 121,879 | — | — | ||||||||||||||||
Mid Cap Growth Fund | — | — | $102,823 | 421,587 | ||||||||||||||||
Small Cap Dividend Growth Fund | — | — | 14,022 | 27,401 | ||||||||||||||||
Small Cap Growth Fund | — | — | 211,955 | 199,211 | ||||||||||||||||
For the year ended June 30, 2023, the Funds’ utilized capital losses and expired capital losses as follows:
| Utilized | Expired | |||
International Growth Fund | $93,954 | — |
Distributions
Distributions to shareholders are recorded as of the close of business on the record date. Such distributions are payable in cash or reinvested in additional shares of the Funds’ capital stock. Distributions from net investment income, if any, are declared and paid quarterly for the Balanced, Dividend Growth, Global Dividend Growth and Small Cap Dividend Growth Funds and declared and paid annually for Developing Markets Growth, Small Cap Growth, International Growth, Mid Cap Growth, Large Cap Growth and ESG Growth Funds. Distributions from net realized gains, if any, will be made annually for each of the Funds.
Concentration of Investments
The Developing Markets Growth Fund may concentrate investments in countries with limited or developing capital markets which may involve greater risks than investments in more developed markets and the prices of such investments may be volatile. The consequences of political, social or economic changes in these markets may have disruptive effects on the market prices of the Fund’s investments and the income it generates, as well as the Fund’s ability to repatriate such amounts.
Use of Estimates
The preparation of financial statements in conformity with U.S. generally accepted accounting principles requires management to make certain estimates and assumptions that affect the reported amounts of assets and liabilities and disclosure of contingent assets and liabilities at the date of the financial statements and the reported results for the respective periods. Actual results could differ from those estimates.
Guarantees and Indemnifications
Under each Fund’s organizational documents, its officers and directors are indemnified against certain liability arising out of the performance of their duties to each Fund. In addition, certain of each Fund’s contracts with its service providers contain general indemnification clauses. Each Fund’s maximum exposure under these arrangements is unknown since the amount of any future claims that may be made against each Fund cannot be determined and each Fund has no historical basis for predicting the likelihood of any such claims.
| 76 | SIT MUTUAL FUNDS SEMI-ANNUAL REPORT | |
| (3) | Investment Security Transactions |
The cost of purchases and proceeds from sales and maturities of investment securities, other than short-term securities, for the six months ended December 31, 2023, were as follows:
| Purchases | Proceeds | |||||||||||||||||||
| U.S. Government | Other | U.S. Government | Other | |||||||||||||||||
Balanced Fund | $ | 3,730,591 | $6,995,236 | $ | 3,973,690 | $4,870,489 | ||||||||||||||
Dividend Growth Fund | — | 47,641,515 | — | 65,141,292 | ||||||||||||||||
Global Dividend Growth Fund | — | 930,957 | — | 3,737,156 | ||||||||||||||||
Large Cap Growth Fund | — | 4,794,782 | — | 6,927,783 | ||||||||||||||||
ESG Growth Fund | — | 366,323 | — | 160,558 | ||||||||||||||||
Mid Cap Growth Fund | — | 5,845,206 | — | 14,540,754 | ||||||||||||||||
Small Cap Dividend Growth Fund | — | 1,719,007 | — | 1,427,908 | ||||||||||||||||
Small Cap Growth Fund | — | 6,228,929 | — | 11,130,654 | ||||||||||||||||
International Growth Fund | — | 710,862 | — | 940,589 | ||||||||||||||||
Developing Markets Growth Fund | — | 24,726 | — | 140,643 | ||||||||||||||||
| (4) | Affiliated Fees and Transactions |
Investment Adviser
The Funds each have entered into an investment management agreement with SIA, under which SIA manages the Funds’ assets and provides research, statistical and advisory services, and pays related office rental, executive expenses and executive salaries. The current fee for investment management and advisory services is based on the average daily net assets of the Funds at the annual rate of:
| Net of Adviser’s | ||||||||||
| Management Fees | Voluntary Fee Waiver | |||||||||
Balanced Fund | 1.00 | % | 0.80% | |||||||
Dividend Growth Fund Class I and Class S | 1.00 | % | 0.70% | |||||||
Global Dividend Growth Fund Class I and Class S | 1.25 | % | 1.00% | |||||||
Large Cap Growth Fund | 1.00 | % | N/A | |||||||
ESG Growth Fund Class I and Class S | 1.25 | % | 1.00% | |||||||
Mid Cap Growth Fund | 1.25 | % | N/A | |||||||
Small Cap Dividend Growth Fund Class I and Class S | 1.25 | % | 0.90% | |||||||
Small Cap Growth Fund | 1.50 | % | N/A | |||||||
International Growth Fund | 1.50 | % | 0.85% | |||||||
Developing Markets Growth Fund | 2.00 | % | 0.95% | |||||||
SIA is obligated to pay all of the Funds’ expenses (excluding extraordinary expenses, stock transfer taxes, interest, brokerage commissions, 12b-1 fees and other transaction charges relating to investing activities).
In addition to the annual management fees, the Class S shares of the Dividend Growth, Global Dividend Growth, ESG Growth and Small Cap Dividend Growth Funds also have a 0.25% annual distribution (12b-1) fee, which is used to pay for distribution fees related to the sale and distribution of such shares.
Effective January 1, 2022, the Adviser has agreed to voluntarily limit the management fee of the Balanced Fund to 0.80%, the Small Cap Dividend Growth Fund to 0.90% (prior to January 1, 2022, the limitation was 1.00%), the International Growth Fund to 0.85% and the Developing Markets Growth Fund to 0.95% (prior to January 1, 2022, the limitation was 1.40%) for the period through June 30, 2025 of the Fund’s daily average net assets, respectively.
| DECEMBER 31, 2023 | 77 | |
NOTES TO FINANCIAL STATEMENTS (Unaudited)
Six Months Ended December 31, 2023 (Continued)
Effective October 1, 2017, the Adviser has agreed to limit the management fee of the Dividend Growth Fund to 0.70%, the Global Dividend Growth Fund to 1.00% and the ESG Growth Fund to 1.00% for the period through June 30, 2025 of the Fund’s daily average net assets, respectively.
Transactions with affiliates
The Adviser, affiliates of the Adviser, directors and officers of the Funds as a whole owned the following shares as of December 31, 2023:
| Shares | % Shares Outstanding | |||||||||
Balanced Fund | 445,741 | 24.6 | ||||||||
Dividend Growth Fund | 1,816,413 | 12.0 | ||||||||
Global Dividend Growth Fund | 520,710 | 26.3 | ||||||||
Large Cap Growth Fund | 839,787 | 30.0 | ||||||||
ESG Growth Fund | 477,485 | 90.4 | ||||||||
Mid Cap Growth Fund | 4,394,263 | 48.8 | ||||||||
Small Cap Dividend Growth Fund | 730,320 | 48.4 | ||||||||
Small Cap Growth Fund | 1,073,417 | 59.3 | ||||||||
International Growth Fund | 726,478 | 56.5 | ||||||||
Developing Markets Growth Fund | 293,128 | 48.1 | ||||||||
| (5) | Credit Facility |
The Funds, together with the 4 bond Sit Mutual Funds managed by SIA, are borrowers in a $20 million credit facility (Credit Facility) maturing November 28, 2024. The Credit Facility provides a source of funds to the Borrowers for temporary and emergency purposes, including the ability to meet future unanticipated or unusually large redemption requests. Under the terms of the Credit Facility, each Fund shall pay interest charged on any borrowings made by the Fund. During the period ended December 31, 2023, the Funds did not use the Credit Facility.
| (6) | Capital Share Activity |
Short-Term Trading (Redemption) Fees
The Funds (except the Balanced Fund) charge a redemption fee equal to 2.00% of the proceeds on shares held for less than 30 calendar days. The fee is retained by the Fund for the benefit of its long-term shareholders and accounted for as an addition to paid in capital. For the six months ended December 31, 2023, the Funds received the following redemption fees:
| Class I | Class S | |||||||||
Dividend Growth Fund | $— | $19 | ||||||||
Global Dividend Growth Fund | 42 | 1 | ||||||||
Large Cap Growth Fund | 2,454 | — | ||||||||
Mid Cap Growth Fund | 2 | — | ||||||||
Small Cap Dividend Growth Fund | — | 1 | ||||||||
Small Cap Growth Fund | 1 | — | ||||||||
| 78 | SIT MUTUAL FUNDS SEMI-ANNUAL REPORT | |
As a shareholder of the Funds, you incur two types of costs: (1) transaction costs, including redemption fees (if applicable) and (2) ongoing costs, including management fees; and other Fund expenses. This Example is intended to help you understand your ongoing costs (in dollars) of investing in the Funds and to compare these costs with the ongoing costs of investing in other mutual funds.
The Example is based on an investment of $1,000 invested at the beginning of the period and held for the entire period July 1, 2023 to December 31, 2023.
Actual Expenses
The first line of the following table provides information about actual account values and actual expenses. You may use the information in this line, together with the amount you invested, to estimate the expenses that you paid over the period. Simply divide your account value by $1,000 (for example, an $8,600 account value divided by $1,000 = 8.6), then multiply the result by the number in the first line under the heading entitled “Expenses Paid During Period” to estimate the expenses you paid on your account during this period.
Hypothetical Example for Comparison Purposes
The second line of the table provides information about hypothetical account values and hypothetical expenses based on the Fund’s actual expense ratio and an assumed rate of return of 5% per year before expenses, which is not the Fund’s actual return. The hypothetical account values and expenses may not be used to estimate the actual ending account balance or expenses you paid for the period. You may use this information to compare the ongoing costs of investing in the Fund and other funds. To do so, compare this 5% hypothetical example with the 5% hypothetical examples that appear in the shareholder reports of the other funds.
Please note that the expenses shown in the table are meant to highlight your ongoing costs only and do not reflect any transactional costs, such as redemption fees. Therefore, the second line of the table is useful in comparing ongoing costs only, and will not help you determine the relative total costs of owning different funds. In addition, if these transactional costs (redemption fees) were included, your costs would have been higher.
| Beginning Account Value (7/1/23) | Ending Account Value (12/31/23) | Expenses Paid During Period * (7/1/23- 12/31/23) | ||||||||||
| Balanced Fund | ||||||||||||
Actual | $1,000 | $1,083.90 | $4.19 | |||||||||
Hypothetical | $1,000 | $1,021.11 | $4.06 | |||||||||
| Dividend Growth Fund | ||||||||||||
Actual | ||||||||||||
Class I | $1,000 | $1,062.70 | $3.63 | |||||||||
Class S | $1,000 | $1,061.20 | $4.92 | |||||||||
Hypothetical |
| |||||||||||
Class I | $1,000 | $1,021.62 | $3.56 | |||||||||
Class S | $1,000 | $1,020.36 | $4.82 | |||||||||
| Global Dividend Growth Fund | ||||||||||||
Actual | ||||||||||||
Class I | $1,000 | $1,082.30 | $5.23 | |||||||||
Class S | $1,000 | $1,081.40 | $6.54 | |||||||||
Hypothetical |
| |||||||||||
Class I | $1,000 | $1,020.11 | $5.08 | |||||||||
Class S | $1,000 | $1,018.85 | $6.34 | |||||||||
| Large Cap Growth Fund | ||||||||||||
Actual | $1,000 | $1,104.60 | $5.29 | |||||||||
Hypothetical | $1,000 | $1,020.11 | $5.08 | |||||||||
| ESG Growth Fund | ||||||||||||
Actual | ||||||||||||
Class I | $1,000 | $1,069.90 | $5.20 | |||||||||
Class S | $1,000 | $1,068.80 | $6.50 | |||||||||
Hypothetical |
| |||||||||||
Class I | $1,000 | $1,020.11 | $5.08 | |||||||||
Class S | $1,000 | $1,018.85 | $6.34 | |||||||||
| Mid Cap Growth Fund | ||||||||||||
Actual | $1,000 | $1,078.80 | $6.53 | |||||||||
Hypothetical | $1,000 | $1,018.85 | $6.34 | |||||||||
| Small Cap Dividend Growth Fund | ||||||||||||
Actual | ||||||||||||
Class I | $1,000 | $1,055.40 | $4.65 | |||||||||
Class S | $1,000 | $1,053.50 | $5.94 | |||||||||
Hypothetical |
| |||||||||||
Class I | $1,000 | $1,020.61 | $4.57 | |||||||||
Class S | $1,000 | $1,019.36 | $5.84 | |||||||||
| DECEMBER 31, 2023 | 79 | |
EXPENSE EXAMPLE (Unaudited) (Continued)
| Beginning Account Value (7/1/23) | Ending Account Value (12/31/23) | Expenses Paid During Period * (7/1/23- 12/31/23) | ||||
| Small Cap Growth Fund | ||||||
Actual | $1,000 | $1,032.60 | $7.66 | |||
Hypothetical | $1,000 | $1,017.60 | $7.61 | |||
| International Growth Fund | ||||||
Actual | $1,000 | $1,052.40 | $4.39 | |||
Hypothetical | $1,000 | $1,020.86 | $4.32 | |||
| Developing Markets Growth Fund | ||||||
Actual | $1,000 | $1,003.80 | $4.79 | |||
Hypothetical | $1,000 | $1,020.36 | $4.82 | |||
| * | Expenses are equal to the Fund’s annualized expense ratio of 0.70% for the Dividend Growth, Class I; 0.95% for the Dividend Growth, Class S, and Developing Markets Growth Funds; 0.80%, for the Balanced Fund; 1.00% for the Global Dividend Growth, Class I, Large Cap Growth, and ESG Growth, Class I Funds; 0.90% for the Small Cap Dividend Growth, Class I Fund; 1.25% for Global Dividend Growth, Class S, ESG Growth, Class S, and Mid Cap Growth Funds; 1.15% for the Small Cap Dividend Growth, Class S Fund; 1.50% for Small Cap Growth Fund; and 0.85% for International Growth Fund, multiplied by the average account value over the period, multiplied by 184/366 (to reflect the one-half year period.) |
| 80 | SIT MUTUAL FUNDS SEMI-ANNUAL REPORT | |
ADDITIONAL INFORMATION (Unaudited)
PROXY VOTING
A description of the policies and procedures that the Adviser uses to vote proxies related to the Funds’ portfolio securities is set forth in the Funds’ Statement of Additional Information, which is available on the Funds’ website at www.sitfunds.com, without charge by calling 800-332-5580 and on the Securities and Exchange Commission’s (SEC) website at www.sec.gov. The Funds’ proxy voting record is available without charge by calling 800-332-5580 and on the SEC’s website at www.sec.gov no later than August 31 for the prior 12 months ending June.
QUARTERLY SCHEDULES OF INVESTMENTS
Each Fund files a complete schedule of investments with the SEC for the first and third quarters of each fiscal year on Form N-PORT. The Funds’ Form N-PORT is available on the SEC’s website at www.sec.gov. Each Fund’s complete schedule of investments, as filed on Form N-PORT, is also available on its website at www.sitfunds.com, or without charge by calling 800-332-5580.
STATEMENT REGARDING LIQUIDITY RISK MANAGEMENT PROGRAM
The Securities and Exchange Commission adopted Rule 22e-4 under the Investment Company Act of 1940, as amended (the “Liquidity Rule”), to promote effective liquidity risk management throughout the open-end investment company industry, thereby reducing the risk that a fund will be unable to meet requests to redeem its shares without significant dilution of remaining investors’ interest in the fund (“Liquidity Risk”).
At their joint meeting held on October 30, 2023, the Boards of Directors (the “Boards”) of the Sit Mutual Funds (each a “Fund and together, the “Funds”) reviewed the Funds’ liquidity risk management program (the “Program”) pursuant to the Liquidity Rule. In connection with this review, Sit Investment Associates, Inc. (“SIA”), the investment adviser to the Funds and administrator of the Program, provided the Boards with a written report that addressed the operation of the Program and assessed its adequacy and effectiveness of implementation during the prior year (the “Report”).
The Report described SIA’s liquidity classification methodology with respect to the Funds and noted SIA’s determination that a Highly Liquid Investment Minimum was not currently necessary for any Fund. The Report also summarized factors considered by SIA in assessing, managing, and periodically reviewing each Fund’s Liquidity Risk and the effectiveness of the Program with respect to each Fund. Such information and factors included, among other things: (i) evaluations of each Fund’s investment strategy and liquidity of investments during both normal and reasonably foreseeable stressed conditions; (ii) SIA’s determination that each Fund’s strategy remained appropriate for an open-end mutual fund; (iii) analyses of the Funds’ short-term and long-term cash flow projections during both normal and reasonably foreseeable stressed conditions, taking into account each Fund’s historical net redemption activity, shareholder ownership concentration, distribution channels and reasonably anticipated trading size; (iv) analyses of each Fund’s holdings of cash and cash equivalents, available borrowing arrangements, if any, and other funding sources; (v) that each Fund held primarily highly liquid investments (investments that the Fund anticipates can be converted to cash within 3 business days or less in current market conditions without significantly changing their market value); (vi) that no Fund held more than 3% of its net assets in illiquid investments (investments that cannot be sold or disposed of in seven days or less in current market conditions without the sale of the investment significantly changing the market value of the investment) during normal market conditions; (vii) confirmation that each Fund had complied with the requirements of the Program; and (viii) that the Program had operated adequately and SIA recommended no changes to the Program at that time.
Based on the review, the Report concluded that the Program was operating as intended and is effective in implementing the requirements of the Liquidity Rule.
There can be no assurance that the Program will achieve its objectives under all circumstances in the future. Please refer to the Funds’ prospectuses for more information regarding a Fund’s exposure to Liquidity Risk and other risks to which it may be subject.
| DECEMBER 31, 2023 | 81 | |
ADDITIONAL INFORMATION (Unaudited) (Continued)
BOARD RE-APPROVAL OF INVESTMENT MANAGEMENT AGREEMENTS
At their joint meeting held on October 30, 2023, the Boards of Directors (the “Boards”) of Sit Mid Cap Growth Fund, Inc., Sit Large Cap Growth Fund, Inc., Sit International Growth Fund, Sit Balanced Fund, Sit Developing Markets Growth Fund, Sit ESG Growth Fund, Sit Small Cap Growth Fund, Sit Dividend Growth Fund, Sit Global Dividend Growth Fund and Sit Small Cap Dividend Growth Fund (each a “Fund” and collectively, the “Funds”) unanimously approved the continuation for another one-year period of the investment management agreements entered into by and between Sit Investment Associates, Inc. (“SIA”) and each of Sit Mid Cap Growth Fund, Inc., dated November 1, 1996; Sit Large Cap Growth Fund, Inc., dated November 1, 1996; and Sit Mutual Funds Inc., dated November 1, 1992 (collectively, the “Agreements”).
In advance of the October 30, 2023, meeting, the Boards requested and received materials from SIA to assist them in considering the reapproval of the Agreements. The Boards, including all of the Directors who are not “interested persons” (as such term is defined in the Investment Company Act of 1940, as amended (the “1940 Act”)) of the Funds (the “non-interested Directors”), approved the Agreements after discussion and consideration of various factors relating to the Boards’ selection of SIA as the Funds’ investment adviser and the Boards’ approval of the fees to be paid under the Agreements. In evaluating the Agreements, the Directors relied upon their knowledge, resulting from their meetings and other interactions throughout the year, of SIA and its services and personnel. The Directors did not consider any single factor as controlling in determining whether to approve the Agreements, and the items described herein are not all-encompassing of the matters considered by the Directors.
Investment Adviser Criteria. The Directors began their analysis by discussing their criteria for determining the quality of an investment adviser. In this regard, the Directors noted that their criteria were similar to those used by institutional investors in evaluating and selecting investment advisers. The Directors discussed several factors in assessing the nature, extent and quality of the services performed by SIA, including the following:
Investment Philosophy and Process. The Directors considered SIA’s philosophy of managing assets. With respect to equity securities, the Directors noted that SIA seeks to identify growth-oriented securities issued by companies with the potential for earnings growth at a faster rate than the general economy and market indices. The Directors considered SIA’s belief that earnings growth is the primary determinant of superior long-term returns for equity securities, and that SIA invests in companies it believes exhibit above-market and consistent growth, as well as conservative and cyclical growth companies. They also considered that SIA’s active management style concentrates on the best growth opportunities at reasonable valuation levels. The Directors determined that the Funds’ investment objectives are consistent with SIA’s investment philosophy and growth style. The Directors reviewed the Funds’ portfolio characteristics and noted that SIA consistently managed the Funds in a growth style. The Directors found no indication in reviewing the Funds’ portfolio characteristics of style drift away from growth stocks over market cycles. The Directors noted that, in periods during which growth stocks have generally under-performed relative to value stocks, Fund performance may not rank favorably in comparisons with other funds investing in value stocks.
The Directors discussed SIA’s consistent and well-defined investment process. With respect to equity securities, the Directors noted that SIA utilizes a team-based, top-down and bottom-up investment decision making process.
Investment Professionals. The Directors discussed the experience, knowledge and organizational stability of SIA and its investment professionals. The Directors noted that SIA’s senior professionals are actively involved in the investment process and have significant investment industry experience.
The Directors discussed the depth of SIA’s investment staff, noting that SIA has over 35 investment professionals. Given the investment products offered by SIA and SIA’s amount of assets under management, the Directors determined that SIA’s investment staff is well positioned to meet the current needs of its clients, including the Funds, and to accommodate growth in its number of clients and assets under management for the near future. The Directors concluded that the depth of SIA’s investment staff, and in particular senior management and investment analysts, is actually greater than the Funds currently require at their present asset size. The Directors noted that SIA has the resources of an investment firm with over $15 billion in assets under management working for the benefit of the Funds’ shareholders. The Directors concluded that SIA has substantial resources to provide services to the Funds and that SIA’s services had been acceptable.
| 82 | SIT MUTUAL FUNDS SEMI-ANNUAL REPORT | |
Investment Performance. The Directors reviewed and discussed the Funds’ investment performance on an absolute and comparable basis for various periods as discussed below. The Directors noted that the investment performance of the Funds has generally been competitive with indices and other funds with similar investment styles as the Funds, such as equity growth funds.
Corporate Culture. The Directors discussed SIA’s corporate values and commitment to operate under the highest ethical and professional standards. They considered that SIA’s culture is set and practiced by senior management of SIA who insist that all SIA professionals exhibit honesty and integrity. The Directors noted that SIA’s values are evident in the services it provides to the Funds.
Review of Specific Factors. The Directors continued their analysis by reviewing specific information on SIA and the Funds, and the specific terms of the Agreements, including the following:
Investment Performance. The Directors reviewed the investment performance of each Fund for the 3-month, 6-month, 1-year, 3-year, 5-year, 10-year (as applicable) and since inception periods ended September 30, 2023, both on an absolute basis and on a comparative basis to indices and mutual funds within the same investment categories. As noted above, the Directors concluded that the investment performance of the Funds has been competitive in relation to funds with similar objectives and strategies.
Fees and Expenses. The Directors noted that the Funds pay SIA a monthly fee and SIA is responsible for all of the Funds’ expenses, except interest, brokerage commissions and transaction charges, certain extraordinary expenses, and fees paid under a distribution plan adopted pursuant to Rule 12b-1 under the 1940 Act for Class S shares of Sit Dividend Growth Fund, Sit Global Dividend Growth Fund, Sit Small Cap Dividend Growth Fund, and Sit ESG Growth Fund. The Directors reviewed fees paid in prior years and the current fees to be paid under the Agreements both before and after fee waivers with respect to Sit Balanced Fund, Sit International Growth Fund, Sit Developing Markets Growth Fund, Sit Dividend Growth Fund, Sit Global Dividend Growth Fund, Sit Small Cap Dividend Growth Fund and Sit ESG Growth Fund.
The Directors compared each Fund’s expense ratio to (i) the average and median expense ratios of no-load mutual funds within the same Morningstar, Inc. (“Morningstar”) investment category, (ii) the average expense ratio for load funds within the Fund’s Morningstar category, and (iii) the average expense ratio for all funds within the Fund’s Morningstar category. The Directors also compared each Fund’s management fees to (i) the average and median actual management fees of no-load mutual funds within the same Morningstar investment category, (ii) the average actual management fees for load funds within the Fund’s Morningstar category, and (iii) the average actual management fees for all funds within the Fund’s Morningstar category. Generally, the Fund’s expense ratios were higher than the averages. The Directors noted that the Morningstar no-load categories include funds of various asset sizes, some of which are significantly larger in assets than the Funds. The Directors also noted that, unlike other funds within each Fund’s Morningstar category, SIA charges a single unified management fee and is responsible for paying all Fund operating expenses. The Directors concluded that the fees paid by the Funds are reasonable and appropriate.
The Directors reviewed the extent to which the fees to be paid under the Agreements by each Fund may be affected by an increase in the Fund’s assets, which included reviewing each Fund’s current and historical assets and the likelihood and magnitude of future increases in the Fund’s assets. The Directors agreed that it is appropriate that the Funds benefit from improved economies of scale as the Funds’ assets increase. However, the Directors concluded that, given the amount of the Funds’ current assets and the likelihood and magnitude of future increases in the Funds’ assets, a graduated fee structure for each Fund was unnecessary at the time because the fees to be paid under the current Agreements were reasonable and appropriate.
The Directors reviewed the expenses paid by SIA relating to the operations of the Funds, and SIA’s income with respect to its management of the Funds for the past two calendar years. The Directors concluded that the expenses paid were appropriate and that SIA’s profit margin with respect to the management of the Funds was acceptable.
The Directors reviewed SIA’s investment advisory fee schedule for investment management services provided to other clients. The Directors compared the services provided to the Funds and other clients of SIA and its affiliates and recognized that the Funds’ expenses are borne by SIA except as noted above. The Directors concluded that the fees paid by the Funds in relation to the fees paid by other clients of SIA and its affiliates were appropriate and reasonable.
| DECEMBER 31, 2023 | 83 | |
ADDITIONAL INFORMATION (Unaudited) (Continued)
The Directors discussed the extent to which SIA receives ancillary benefits from its relationship with the Funds, such as soft dollar arrangements by which brokers provide research services to SIA as a result of brokerage generated by the Funds. The Boards concluded that any benefits SIA receives from its relationship with the Funds are well within industry norms, are reflected in the amount of the fees paid by the Funds to SIA and are appropriate and reasonable.
Non-Advisory Services. The Directors considered the quality of non-advisory services which SIA provides to the Funds (and their shareholders) and the quality and depth of SIA’s non-investment personnel who provide such services. The Directors concluded that the level of such services and the quality and depth of such personnel are acceptable and consistent with industry standards.
Finally, the Directors considered the compliance staff and the regulatory history of SIA and the Funds and concluded that both are acceptable and consistent with industry standards.
Based on these conclusions, without any single conclusion being dispositive, the Directors, including the non-interested Directors by separate vote, determined that renewal of the Agreements was in the interest of each Fund and its shareholders.
| 84 | SIT MUTUAL FUNDS SEMI-ANNUAL REPORT | |
Semi-Annual Report December 31, 2023 | ||||
INVESTMENT ADVISER
Sit Investment Associates, Inc.
80 S. Eighth Street
Suite 3300
Minneapolis, MN 55402 | INDEPENDENT REGISTERED PUBLIC
ACCOUNTING FIRM
KPMG LLP
Minneapolis, MN | |||
CUSTODIAN
The Bank Of New York Mellon
111 Sanders Creek Parkway
Syracuse, NY 13057 | GENERAL COUNSEL
Faegre Drinker Biddle & Reath LLP
Minneapolis, MN | |||
TRANSFER AGENT AND
DISBURSING AGENT
Sit Mutual Funds
Attention: 534459
500 Ross Street, 154-0520
Pittsburgh, PA 15262 | ||||
| ||||
1-800-332-5580 www.sitfunds.com
| ||||
 Sit Mutual Funds
SIT STOCK 12-2023
| Item 2: | Code of Ethics. |
Not applicable to Semi-Annual Report.
| Item 3: | Audit Committee Financial Expert. |
Not applicable to Semi-Annual Report.
| Item 4: | Principal Accountant Fees and Services. |
Not applicable to Semi-Annual Report.
| Item 5: | Audit Committee of Listed Registrants. |
Not applicable to open-end investment companies.
| Item 6: | Schedule of Investments. |
The schedule of investments is included as part of the report to shareholders filed under Item 1 of this Form.
| Item 7: | Disclosure of Proxy Voting Policies and Procedures for Closed-End Management Investment Companies. |
Not applicable to open-end investment companies.
| Item 8: | Portfolio Managers of Closed-End Management Companies. |
Not applicable to open-end investment companies.
| Item 9: | Purchases of Equity Securities by Closed-End Management Investment Company and Affiliated Purchasers. |
Not applicable to open-end investment companies.
| Item 10. | Submission of Matters to a vote of Security Holders. |
There have been no material changes to the procedures by which shareholders may recommend nominees to the registrant’s board of directors.
| Item 11: | Controls and Procedures – |
(a) Based on their evaluation of the Registrant’s Disclosure Controls and Procedures as of a date within 90 days of the Filing Date, the Registrant’s Chairman and Treasurer have determined that the Disclosure Controls and Procedures (as defined in Rule 30a-2(c) under the Act) are designed to ensure that information required to be disclosed by the Registrant is recorded, processed, summarized and reported by the filing Date, and that information required to be disclosed in the report is communicated to the Registrant’s management, as appropriate, to allow timely decisions regarding required disclosure.
b) There were no changes in the Registrant’s internal control over financial reporting as defined in Rule 30a-3(d) under the Act) that occurred during the Registrant’s last fiscal half-year that has materially affected, or is reasonably likely to materially affect, the Registrant’s internal control over financial reporting.
| Item 12: | Exhibits: |
| (a) | The following exhibits are attached to this Form N-CSR: |
SIGNATURES
Pursuant to the requirements of the Securities Exchange Act of 1934 and the Investment Company Act of 1940, the registrant has duly caused this report to be signed on its behalf by the undersigned, thereunto duly authorized.
| Sit Mutual Funds, Inc. | ||
| By (Signature and Title) | /s/ Paul E. Rasmussen | |
| Paul E. Rasmussen | ||
| Vice President, Treasurer | ||
Date: February 16, 2024
Pursuant to the requirements of the Securities Exchange Act of 1934 and the Investment Company Act of 1940, this report has been signed below by the following persons on behalf of the registrant and in the capacities and on the dates indicated.
| By (Signature and Title) | /s/ Paul E. Rasmussen | |
| Paul E. Rasmussen | ||
| Vice President, Treasurer |
Date: February 16, 2024
| By (Signature and Title) | /s/ Roger J. Sit | |
| Roger J. Sit | ||
| Chairman |
Date: February 16, 2024