Exhibit 99.1

2019| Q3 Financials
To Our Stakeholders
Our third quarter 2019 results exceeded expectations for revenue and earnings. In the quarter, demand for Workspace product and subscription was strong. In addition, demand from our Strategic Service Provider customers, or SSPs – our three historically largest networking customers – improved. This rebound is reflected in the subscription bookings mix. Our third quarter highlights include:
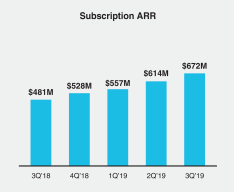
• Subscription ARR1 was $672 million, up 40% year-over-year, while SaaS ARR was $463 million, up 52% year-over-year
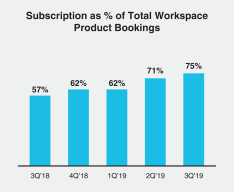
• Workspace subscription bookings as a percentage of Workspace product bookings was 75%, up from 57% in the third quarter of 2018
• Reported revenue of $733 million exceeded guidance of $700 to $720 million. GAAP diluted EPS of $2.04 andnon-GAAP diluted EPS2 of $1.52 exceeded ournon-GAAP diluted EPS guidance of $1.15 to $1.30
• Compared to theyear-ago period, the higher subscription mix created a 700 - 800 basis point headwind to reported revenue
• Future committed revenue increased 13%, or approximately $252 million year-over-year reflecting an increasing mix of subscription product bookings
• Our Board of Directors increased our share repurchase authorization by $600 million, bringing the total authorization to over $1 billion |
1Annualized Recurring Revenue, or ARR, is an operating metric that represents the contracted recurring value of all termed subscriptions normalized to aone-year period.
It is calculated at the end of a reporting period by taking each contract’s recurring total contract value and dividing by the length of the contract. ARR includes only active contractually committed, fixed subscription fees. All contracts are annualized, including 30 day offerings where we take monthly recurring revenue multiplied by 12 to annualize. ARR should be viewed independently of U.S. GAAP revenue, deferred revenue and unbilled revenue and is not intended to be combined with or to replace those items. ARR is not a forecast of future revenue.
2A reconciliation of GAAP tonon-GAAP measures has been provided in the financial statement tables included in this letter. An explanation of these measures is also included below under the heading “Reconciliation ofNon-GAAP Financial Measures to Comparable U.S. GAAP Measures.”
| ||||||
| 2019 | Q3 Financials | 1 | ||||

| Workspace achieved its highest level of subscription bookings mix and reflects the confidence of our customers in Citrix’s vision and ability to execute. The strong performance of Workspace is reflected in the accelerating growth of SaaS ARR with 52% year-over-year growth. The subscription bookings mix within Networking reflects an improvement in SSP demand, which had been cyclically soft in the preceding four quarters. This uptick in demand from our SSP customers impacted the overall and Networking subscription bookings mix.
Citrix Workspace: Enabling a Paradigm Shift
The Workspace market is evolving and its definition shifting. Historically a place where work is simply organized and accessed, the Workspace is now becoming much larger in terms of what it encompasses, including capabilities and strategic importance. We believe that our vision of the Workspace combined with the vast footprint we enjoy across all device types within enterprises of all sizes around the world, helps to position Citrix as not only the standard, but also the preferred way for people to work.
We believe our product strategy is unique because Citrix Workspace is shifting the historical relationship between experience and security. Employees across various functions within an organization use various business applications to improve their productivity. Some of these applications may be SaaS-based from third-party vendors, others may be home-grown and built to serve some specific need.
The proliferation of these business applications decreases the security of the overall enterprise as they increase the surface area upon which an enterprise can be attacked. While the types and origins of these applications will vary widely, the vast majority will continue to live within the corporate network for many years to come.
As a consequence of this and the growing external and internal threats that have emerged, enterprises implement a wide array of security solutions. These often add friction and cumbersome steps into people’s workflows. This decreases employee productivity and degrades employee experience. In other words, historically, there has been an inverse relationship between experience and security — where the increase in one has resulted in the decrease of the other.
Citrix Workspace is becoming a platform that helps organizations avoid making such trade-offs. The more business applications delivered through Citrix Workspace, the more secure the IT environment becomes. Citrix Workspace becomes a layer of seamless security that enables higher levels of productivity and enhances employee experience. |
| ||||||
| 2019 | Q3 Financials | 2 | ||||

Customer Highlight: Supporting Sustainability Initiatives, Reducing Costs and Improving User Experience
The fourth oldest university in the world, Cambridge consists of 31 constituent colleges and over 100 academic departments organized into six schools. The University of Cambridge has chosen Citrix Workspace to help it achieve its aggressive sustainability and reduction in carbon footprint goals, reduce costs and improve its students’ experience in a scalable way while supporting its Desktop as a Service model.
Our Networking business continues to transform. Our focus is on leveraging these assets to optimize Workspace delivery and Workspace security. Customers are increasingly interested in consuming these technologies as software or in the form of pooled capacity, which allows them to consume the technology in many different forms — as hardware, as software, or as a service — all managed by a single control plane — or Citrix Application Delivery Management (ADM).
Product and Engineering: Evolving the Workspace Platform with Citrix Converge
As we build the Workspace platform, in addition to developing the integrations with key enterprise applications in use today, we are in the early stages of creating an ecosystem around Citrix Workspace. Earlier this month, we hosted our first ever software developers conference, Citrix Converge, welcoming software developers from various partners and customers to our Santa Clara campus for two days of training andhands-on labs using our new Citrix Workspace Software Developers Kit (SDK).
Attendees built ad hoc teams and started projects of their choosing for a6-hour build session. Teams then volunteered to demonstrate their integrations live,on-stage. All of these integrations used the Citrix Workspace to guide and automate various common work tasks with the goal of improving security, employee productivity and engagement.
Solutions demonstrated included task automation across areas such as: sales force automation, enterprise resource planning (ERP), human capital management (HCM), corporate travel booking, accounting, software development processes, computer system administration, and IT security.
We believe solutions developed using these new APIs and tools will extend the reach of the Citrix Workspace platform and extend seat penetration beyond traditional virtualization capabilities.
It’s exciting to see the vast potential Citrix Workspace holds for our customers, our partners, and our shareholders.
Financial Analyst Meeting: Reaching Inflection in the Subscription Transition
Later this morning we will host our 2019 Financial Analyst Meeting, providing a detailed update on the transformation of Citrix and our financial goals for the next several years.
We have made significant progress over the last two years evolving the company — from products to solutions,on-premises to cloud, and perpetual license to subscription. Financially, the proof points of this transition are seen in Subscription ARR of $672 million, increasing 40% year-over-year, and future committed revenue of $2.18 billion, up 13% from Q3’18.
As we transitioned new product bookings from perpetual to subscription, we experienced a significant headwind to the P&L as more revenue is recognized ratably over the term of our contracts. As we exit 2019, we expect more than 60% of product mix will come from subscriptions (70%+ of Workspace). Given
| ||||||
| 2019 | Q3 Financials | 3 | ||||

Customer Highlight: Driving Productivity and Experience Improvements for Health Care Services Touching Nearly 1 Million Patients
With 450 physicians and advanced practitioners in an industry where security and compliance are table stakes, Springfield Clinic chose Citrix Workspace to simplify its complex IT environment and dramatically improve the productivity and experience of its physicians.
Financial Analyst Meeting:
October 24, 2019 - 10:30am
Presentation and Webcast can be viewed on our investor relations site at www.investors.citrix.com
this momentum and customer preference, we expect the subscription product bookings mix to be as high as 80% by the end of next year. Accelerating the subscription transition gives us confidence that we will reach an inflection point in the financial model during fiscal year 2020, allowing revenue and free cash flow tore-accelerate.
We continue to believe we will achieve our free cash flow targets in 2020 and 2022. Our other longer-term targets that we will discuss at our analyst meeting later this morning include:***
2022
| 2024
| Post-Transition
| ||||||||
Subscription Revenue as a % of Total Revenue
|
|
50-60%
|
|
|
65-75%
|
|
90%+
| |||
Subscription Bookings as a % of Product Bookings
|
|
85-90%
|
|
|
90-95%
|
|
95%+
| |||
YoY Revenue Growth
|
|
7-8%
|
|
|
8-10%
|
|
10%+
| |||
Non-GAAP Operating Margin**
|
|
31-33%
|
|
|
33-35%
|
|
34%+
| |||
Details for the live webcast and a replay of the event are available on our Investor Relations website - www.investors.citrix.com.

David Henshall
President & CEO
** The company is unable to provide long term GAAP operating margin or a reconciliation of long term GAAP to non-GAAP operating margin without unreasonable effort due to the variability, complexity and limited visibility of the adjusting items that would be excluded from non-GAAP operating margin in future periods.
*** The above statements are based on current targets as of the date of this letter. These statements are forward-looking, and actual results may differ materially.
| ||||||
| 2019 | Q3 Financials | 4 | ||||
| Financial Overview
Bookings
• Third quarter bookings mix includes the sequential and year-over-year growth in SSP, which is reflected in our overall subscription mix
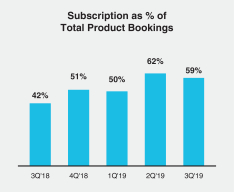
• Subscription bookings as a percentage of total product bookings were 59% in the quarter, up from 42% in the third quarter of 2018
• Workspace subscription bookings as a percentage of Workspace product bookings were 75% in the quarter, up from 57% in the third quarter of 2018
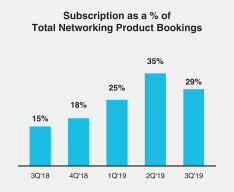
• Networking subscription bookings as a percentage of Networking product bookings were 29% in the quarter, up from 15% in the third quarter of 2018, including the impact from higher SSP product and license demand
• Future committed revenue grew 13% year-over-year to approximately $2.18 billion in the third quarter
• Total average contract duration of deals booked in the quarter was 1.6 years, up year-over-year due to the richer mix of subscription bookings which carry longer duration
Our transition to a subscription model focuses on growing higher value recurring revenue streams that result in more of the business booked in the current period being recognized in future periods. Over the course of time, we expect that average contract duration will increase, as more of our customers transition to a subscription model, which today typically has a3-year duration and is a reflection of deepening and extending relationships with our customers. |
Subscription Bookings
| 3Q18
| 4Q18
| 1Q19
| 2Q19
| 3Q19
| |||||||||||||||
Subscription as % of Total Product
|
|
42%
|
|
|
51%
|
|
|
50%
|
|
|
62%
|
|
|
59%
|
| |||||
Subscription as a % of Workspace Product
|
|
57%
|
|
|
62%
|
|
|
62%
|
|
|
71%
|
|
|
75%
|
| |||||
Subscription as a % of Networking Product
|
|
15%
|
|
|
18%
|
|
|
25%
|
|
|
35%
|
|
|
29%
|
| |||||
Future Committed Revenue (in millions)
| 3Q18
| 4Q18
| 1Q19
| 2Q19
| 3Q19
| |||||||||||||||
Deferred Revenue
|
$
|
1,680
|
|
$
|
1,835
|
|
$
|
1,757
|
|
$
|
1,745
|
|
$
|
1,616
|
| |||||
Unbilled Revenue3
|
|
243
|
|
|
338
|
|
|
380
|
|
|
484
|
|
|
559
|
| |||||
Total Deferred and Unbilled Revenue
|
$
|
1,923
|
|
$
|
2,173
|
|
$
|
2,137
|
|
$
|
2,229
|
|
$
|
2,175
|
| |||||
Y/Y Growth
|
|
n/a
|
|
|
n/a
|
|
|
21%
|
|
|
15%
|
|
|
13%
|
| |||||
Total Average Contract Duration (years)
|
|
1.4
|
|
|
1.3
|
|
|
1.4
|
|
|
1.6
|
|
|
1.6
|
| |||||
Note: Financial summary tables are unaudited. This document should be read in conjunction with the Company’s SEC Filings.
3 Unbilled revenue primarily represents future billings under our subscription agreements that have not been invoiced and, accordingly, are not recorded in accounts receivable or deferred revenue within our condensed consolidated financial statements.
| ||||||
| 2019 | Q3 Financials | 5 | ||||
|
Annualized Recurring Revenue
• Subscription ARR in the third quarter of 2019 was $672 million, up 40% year-over-year
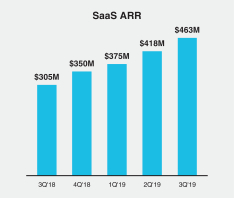
• SaaS ARR in the third quarter of 2019 was $463 million, up 52% year-over-year
As we progress through our subscription model transition, we believe ARR is a key performance indicator of the health and trajectory of our business, representing the pace of our transition and serving as a leading indicator of top line trends. |
Annualized Recurring Revenue(in millions)
3Q18
| 4Q18
| 1Q19
| 2Q19
| 3Q19
| ||||||||||||||||
Subscription ARR
|
|
$481
|
|
|
$528
|
|
|
$557
|
|
|
$614
|
|
|
$672
|
| |||||
SaaS ARR
|
|
$305
|
|
|
$350
|
|
|
$375
|
|
|
$418
|
|
|
$463
|
| |||||
| Revenue
• Total revenue of $733 million in the third quarter was flat year-over-year as strong subscription revenue growth of 43% offset the decline of 23% in perpetual product and license revenue as the majority of new bookings were generated by subscriptions
• Total SSP revenue was $39 million and increased 11% year-over-year
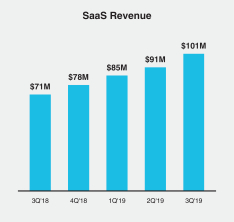
• SaaS revenue grew 43% year-over-year to $101 million and accounted for 63% of subscription revenue and 14% of total revenue in the third quarter
• The subscription model transition created a 700 to 800 basis point headwind to reported revenue growth in the third quarter, relative to theyear-ago period |
Note: Financial summary tables are unaudited. This document should be read in conjunction with the Company’s SEC Filings.
| ||||||
| 2019 | Q3 Financials | 6 | ||||
Revenue Summary(in millions)
3Q18
| 4Q18
| 1Q19
| 2Q19
| 3Q19
| ||||||||||||||||
Subscription
|
|
$112
|
|
|
$130
|
|
|
$142
|
|
|
$156
|
|
|
$160
|
| |||||
SaaS
|
|
71
|
|
|
78
|
|
|
85
|
|
|
91
|
|
|
101
|
| |||||
Other Subscription
|
|
41
|
|
|
52
|
|
|
56
|
|
|
65
|
|
|
59
|
| |||||
Product & License
|
|
171
|
|
|
211
|
|
|
135
|
|
|
141
|
|
|
131
|
| |||||
Support & Services
|
|
450
|
|
|
461
|
|
|
443
|
|
|
452
|
|
|
442
|
| |||||
Total Revenue*
|
|
$733
|
|
|
$802
|
|
|
$719
|
|
|
$749
|
|
|
$733
|
| |||||
Y/Y Growth
| ||||||||||||||||||||
1Q19
|
2Q19
| 3Q19
| ||||||||||||||||||
Subscription
|
|
37%
|
|
|
41%
|
|
|
43%
|
| |||||||||||
SaaS
|
|
43%
|
|
|
41%
|
|
|
43%
|
| |||||||||||
Other Subscription
|
|
30%
|
|
|
41%
|
|
|
45%
|
| |||||||||||
Product & License
|
|
-16%
|
|
|
-27%
|
|
|
-23%
|
| |||||||||||
Support & Services
|
|
2%
|
|
|
3%
|
|
|
-2%
|
| |||||||||||
Total Revenue*
|
|
3%
|
|
|
1%
|
|
|
0%
|
| |||||||||||
% of Total Revenue
| ||||||||||||||||||||
3Q18
| 4Q18
| 1Q19
| 2Q19
| 3Q19
| ||||||||||||||||
Subscription
|
|
15%
|
|
|
16%
|
|
|
20%
|
|
|
21%
|
|
|
22%
|
| |||||
SaaS % of Subscription
|
| 63%
|
|
|
60%
|
|
|
60%
|
|
|
59%
|
|
|
63%
|
| |||||
SaaS % of Total
|
|
10%
|
|
|
10%
|
|
|
12%
|
|
|
12%
|
|
|
14%
|
| |||||
Product & License
|
|
23%
|
|
|
26%
|
|
|
18%
|
|
|
19%
|
|
|
18%
|
| |||||
Support & Services
|
|
62%
|
|
|
58%
|
�� |
|
62%
|
|
|
60%
|
|
|
60%
|
| |||||
* Amounts may not recalculate due to rounding.
Note: Financial summary tables are unaudited. This document should be read in conjunction with the Company’s SEC Filings.
| ||||||
| 2019 | Q3 Financials | 7 | ||||
Revenue by Product Group
Workspace
| • | Workspace revenue of $513 million increased 1% year-over-year due to the sharp increase in subscription mix, particularly SaaS which is recognized over time |
| • | Workspace subscription revenue accounted for 26% of total Workspace revenue, up from 19% a year ago |
| • | Workspace revenue accounted for 70% of total revenue in the quarter |
Networking
| • | Networking revenue of $188 million decreased 4% year-over-year due to cyclical softness in order patterns and secular shifts away from hardware-based appliances towards software-based solutions |
| • | Networking software revenue accounted for 26% of total Networking revenue |
| • | Networking subscription revenue increased 75% year-over-year |
| • | Networking revenue accounted for 26% of total revenue in the quarter |
We expect the mix shift within Networking away from hardware towards software-based solutions will create pressure on reported Networking revenue over time.
Revenue by Product Group(in millions)
3Q18
| 4Q18
| 1Q19
| 2Q19
| 3Q19
| ||||||||||||||||
Workspace
|
|
$509
|
|
|
$557
|
|
|
$515
|
|
|
$535
|
|
|
$513
|
| |||||
Networking
|
|
195
|
|
|
206
|
|
|
171
|
|
|
178
|
|
|
188
|
| |||||
Professional Services
|
|
28
|
|
|
39
|
|
|
33
|
|
|
35
|
|
|
32
|
| |||||
Total Revenue*
|
|
$733
|
|
|
$802
|
|
|
$719
|
|
|
$749
|
|
|
$733
|
| |||||
Y/Y Growth
| ||||||||||||||||||||
1Q19
| 2Q19
|
3Q19
| ||||||||||||||||||
Workspace
|
|
13%
|
|
|
7%
|
|
|
1%
|
| |||||||||||
Networking
|
|
-18%
|
|
|
-14%
|
|
|
-4%
|
| |||||||||||
Professional Services
|
|
6%
|
|
|
5%
|
|
|
12%
|
| |||||||||||
Total Revenue*
|
|
3%
|
|
|
1%
|
|
|
0%
|
| |||||||||||
% of Total Revenue
| ||||||||||||||||||||
3Q18
| 4Q18
| 1Q19
| 2Q19
| 3Q19
| ||||||||||||||||
Workspace
|
|
69%
|
|
|
69%
|
|
|
72%
|
|
|
71%
|
|
|
70%
|
| |||||
Networking
|
|
27%
|
|
|
26%
|
|
|
24%
|
|
|
24%
|
|
|
26%
|
| |||||
Professional Services
|
|
4%
|
|
|
5%
|
|
|
4%
|
|
|
5%
|
|
|
4%
|
| |||||
*Amounts may not recalculate due to rounding.
Note: Financial summary tables are unaudited. This document should be read in conjunction with the Company’s SEC Filings.
| ||||||
| 2019 | Q3 Financials | 8 | ||||
Revenue by Customer Type
| • | Revenue from SSP customers was $39 million, up 11% year-over-year, and represented 5% of total revenue in the quarter |
| • | Revenue from all other customers was $694 million in the quarter, down 1% year-over-year due to the impact of the subscription model shift |
Revenue by Customer Type(in millions)
3Q18
| 4Q18
| 1Q19
| 2Q19
| 3Q19
| ||||||||||||||||
SSP
|
| $35
|
|
| $17
|
|
| $22
|
|
| $24
|
|
| $39
|
| |||||
Non-SSP |
|
698
|
|
| 785
|
|
| 697
|
|
| 725
|
|
| 694
|
| |||||
Total Revenue*
|
| $733
|
|
| $802
|
|
| $719
|
|
| $749
|
|
| $733
|
| |||||
Y/Y Growth
| ||||||||||||||||||||
| 1Q19 |
2Q19
| 3Q19
| ||||||||||||||||||
SSP
| -65% |
| -39%
|
|
| 11%
|
| |||||||||||||
Non-SSP
| 10% |
| 3%
|
|
| -1%
|
| |||||||||||||
Total Revenue*
| 3% |
| 1%
|
|
| 0%
|
| |||||||||||||
% of Total Revenue
| ||||||||||||||||||||
3Q18
| 4Q18
| 1Q19
| 2Q19
|
3Q19
| ||||||||||||||||
SSP
|
| 5%
|
|
| 2%
|
|
| 3%
|
|
| 3%
|
|
| 5%
|
| |||||
Non-SSP
|
| 95%
|
|
| 98%
|
|
| 97%
|
|
| 97%
|
|
| 95%
|
| |||||
Revenue by Geography
| • | Revenue in the Americas was $418 million and down 3% year-over-year which included a richer mix of SaaS bookings |
| • | Revenue in EMEA increased 3% year-over-year, while APJ increased 10% year-over-year, and represented 32% and 11% of revenue, respectively |
Revenue by Geography(in millions)
3Q18
| 4Q18
| 1Q19
| 2Q19
| 3Q19
| ||||||||||||||||
Americas |
| $433
|
|
| $440
|
|
| $401
|
|
| $432
|
|
| $418
|
| |||||
EMEA
|
| 228
|
|
| 279
|
|
| 237
|
|
| 240
|
|
| 236
|
| |||||
APJ
|
| 72
|
|
| 82
|
|
| 81
|
|
| 76
|
|
| 79
|
| |||||
Total Revenue*
|
| $733
|
|
| $802
|
|
| $719
|
|
| $749
|
|
| $733
|
| |||||
*Amounts may not recalculate due to rounding.
Note: Financial summary tables are unaudited. This document should be read in conjunction with the Company’s SEC Filings.
| ||||||
| 2019 | Q3 Financials | 9 | ||||
Y/Y Growth
| 1Q19 |
2Q19
| 3Q19
| ||||||||||||||||||
Americas
|
| -3%
|
|
|
0%
|
|
|
-3%
|
| |||||||||||
EMEA
|
| 10%
|
|
|
3%
|
|
|
3%
|
| |||||||||||
APJ
|
| 18%
|
|
|
-3%
|
|
|
10%
|
| |||||||||||
Total Revenue*
|
| 3%
|
|
|
1%
|
|
|
0%
|
| |||||||||||
% of Total Revenue
| ||||||||||||||||||||
3Q18
| 4Q18
| 1Q19
| 2Q19
| 3Q19
| ||||||||||||||||
Americas
|
|
59%
|
|
|
55%
|
|
|
56%
|
|
|
58%
|
|
|
57%
|
| |||||
EMEA
|
|
31%
|
|
|
35%
|
|
|
33%
|
|
|
32%
|
|
|
32%
|
| |||||
APJ
|
|
10%
|
|
|
10%
|
|
|
11%
|
|
|
10%
|
|
|
11%
|
| |||||
Operating Margin2
| • | GAAP operating margin in the quarter was 15% |
| • | Non-GAAP operating margin in the quarter was 29% |
Operating margin in the third quarter was impacted by the subscription model shift, where less revenue is recognizedup-front and more is recognized ratably over time.
Earnings2
| • | GAAP net income in the quarter was $271 million, or $2.04 per diluted share |
| • | Non-GAAP net income in the quarter was $201 million, or $1.52 per diluted share |
Both GAAP andnon-GAAP tax rates benefited from the geographical mix of income towards lower tax regions and the release of tax accruals related to uncertain tax positions. GAAP net income also included an estimated $158 million tax benefit related to transitional tax relief in accordance with the enactment of federal tax reform in Switzerland.
Cash Flow from Operations
| • | Cash flow from Operations in the quarter was $147 million |
As a result of our subscription model transition, more cash will be collected in future periods as subscription agreements are typically billed annually, as opposed to our perpetual business, which is typically billedup-front.
Balance Sheet and Capital Allocation
| • | The third quarter ended with approximately $571 million in cash and investments |
| • | Paid dividend to shareholders of $0.35 per share totaling $45 million |
| • | Board of Directors declared a quarterly dividend of $0.35 per share to be paid on December 20, 2019 to shareholders of record on December 6, 2019 |
| • | Repurchased approximately 1.2 million shares in the quarter |
| • | Board of Directors increased our share repurchase authorization by $600 million, bringing the total authorization to over $1 billion |
* Amounts may not recalculate due to rounding.
Note: Financial summary tables are unaudited. This document should be read in conjunction with the Company’s SEC Filings.
2 A reconciliation of GAAP tonon-GAAP measures has been provided in the financial statement tables included in this letter. An explanation of these measures is also included below under the heading “Reconciliation ofNon-GAAP Financial Measures to Comparable U.S. GAAP Measures.”
| ||||||
| 2019 | Q3 Financials | 10 | ||||
Guidance
Full Year 2019
Our full year 2019 guidance is now:
Full Year 2019 Guidance2
| ||
Revenue | $2.99 billion to $3.01 billion | |
GAAP Operating Margin | 17.2% to 18.2% | |
Non-GAAP Operating Margin | 29.0% to 30.0% | |
GAAP Diluted EPS | $4.45 to $4.67 | |
Non-GAAP Diluted EPS | $5.60 to $5.70 | |
Guidance reflects our expectation that subscription bookings as a percentage of product bookings will increase from just over 40% last year to approximately60-65% in 2019. The magnitude of the impact to recognized revenue is dependent on the mix of product bookings. If our actual subscription bookings as a percentage of product bookings exceeds expectations, the headwind to our 2019 revenue could be higher. GAAP net income includes an estimated tax benefit related to transitional tax relief in accordance with the enactment of federal tax reform in Switzerland. We are pleased with the progress in our subscription model transition, which serves as a strong endorsement of our multi-year strategy.
Full Year 2020
Preliminary outlook includes:
Full Year 2020 Preliminary Guidance2
| ||
Revenue | 3% to 4% YoY growth | |
GAAP Diluted EPS | $3.34 to $3.54 | |
Non-GAAP Diluted EPS | $5.25 to $5.45 | |
Preliminary guidance assumes thatnon-GAAP operating margin will decline approximately 100 basis points year-over-year driven by a higher mix of cloud subscriptions and investments to continue to scale a growing cloud mix. We expect 2020 to be the trough year for operating margin in our multi-year subscription transition.
The above statements are based on current targets as of the date of this letter. These statements are forward-looking, and actual results may differ materially.
2 A reconciliation of GAAP tonon-GAAP measures has been provided in the financial statement tables included in this letter. An explanation of these measures is also included below under the heading “Reconciliation ofNon-GAAP Financial Measures to Comparable U.S. GAAP Measures.”
| ||||||
| 2019 | Q3 Financials | 11 | ||||
CITRIX SYSTEMS, INC.
CONDENSED CONSOLIDATED STATEMENTS OF INCOME
(In thousands, except per share data – unaudited)
Three Months
|
Three Months
|
Nine Months
|
Nine Months
| |||||||||||||||||
Revenues | ||||||||||||||||||||
Subscription | $ | 159,873 |
| $ | 111,539 |
| $ | 457,312 |
| $ | 325,493 |
| ||||||||
Product and license |
| 131,057 |
|
| 170,952 |
|
| 406,733 |
|
| 523,707 |
| ||||||||
Support and services |
| 441,971 |
|
| 449,985 |
|
| 1,336,696 |
|
| 1,322,833 |
| ||||||||
Total net revenues |
| 732,901 |
|
| 732,476 |
|
| 2,200,741 |
|
| 2,172,033 |
| ||||||||
Cost of net revenues | ||||||||||||||||||||
Cost of subscription, support and services |
| 76,885 |
|
| 64,717 |
|
| 227,130 |
|
| 195,625 |
| ||||||||
Cost of product and license revenues |
| 27,411 |
|
| 27,571 |
|
| 75,033 |
|
| 91,150 |
| ||||||||
Amortization and impairment of product related intangible assets |
| 22,622 |
|
| 11,629 |
|
| 42,707 |
|
| 34,177 |
| ||||||||
Total cost of net revenues |
| 126,918 |
|
| 103,917 |
|
| 344,870 |
|
| 320,952 |
| ||||||||
Gross margin |
| 605,983 |
|
| 628,559 |
|
| 1,855,871 |
|
| 1,851,081 |
| ||||||||
Operating expenses | ||||||||||||||||||||
Research and development |
| 126,420 |
|
| 111,557 |
|
| 390,712 |
|
| 323,050 |
| ||||||||
Sales, marketing and services |
| 274,874 |
|
| 262,562 |
|
| 847,958 |
|
| 800,505 |
| ||||||||
General and administrative |
| 80,042 |
|
| 86,084 |
|
| 238,751 |
|
| 227,151 |
| ||||||||
Amortization of other intangible assets |
| 4,937 |
|
| 4,063 |
|
| 11,671 |
|
| 11,748 |
| ||||||||
Restructuring |
| 8,879 |
|
| (486) |
|
| 16,022 |
|
| 13,138 |
| ||||||||
Total operating expenses |
| 495,152 |
|
| 463,780 |
|
| 1,505,114 |
|
| 1,375,592 |
| ||||||||
Income from operations |
| 110,831 |
|
| 164,779 |
|
| 350,757 |
|
| 475,489 |
| ||||||||
Interest income |
| 2,649 |
|
| 10,896 |
|
| 16,193 |
|
| 29,029 |
| ||||||||
Interest expense |
| (8,822) |
|
| (19,962) |
|
| (37,144) |
|
| (60,840) |
| ||||||||
Other income (expense), net |
| 3,456 |
|
| 3,702 |
|
| 3,735 |
|
| (1,847) |
| ||||||||
Income before income taxes |
| 108,114 |
|
| 159,415 |
|
| 333,541 |
|
| 441,831 |
| ||||||||
Income tax (benefit) expense |
| (162,743) |
|
| 558 |
|
| (141,159) |
|
| 31,882 |
| ||||||||
Net income | $ | 270,857 |
| $ | 158,857 |
| $ | 474,700 |
| $ | 409,949 |
| ||||||||
Earnings per share: | ||||||||||||||||||||
Basic | $ | 2.08 |
| $ | 1.18 |
| $ | 3.62 |
| $ | 3.00 |
| ||||||||
Diluted | $ | 2.04 |
| $ | 1.08 |
| $ | 3.48 |
| $ | 2.80 |
| ||||||||
Weighted average shares outstanding: | ||||||||||||||||||||
Basic |
| 130,277 |
|
| 135,055 |
|
| 131,020 |
|
| 136,752 |
| ||||||||
Diluted |
| 132,655 |
|
| 147,568 |
|
| 136,297 |
|
| 146,554 |
| ||||||||
Note: This document should be read in conjunction with the Company’s SEC Filings.
| ||||||
| 2019 | Q3 Financials | 12 | ||||
CITRIX SYSTEMS, INC.
CONDENSED CONSOLIDATED BALANCE SHEETS
(In thousands – unaudited)
September 30, 2019
| December 31, 2018
| |||||||||
Assets | ||||||||||
Cash and cash equivalents |
| $493,834 |
|
| $618,766 |
| ||||
Short-term investments, available for sale |
| 55,372 |
|
| 583,615 |
| ||||
Accounts receivable, net |
| 426,842 |
|
| 688,420 |
| ||||
Inventories, net |
| 18,518 |
|
| 21,905 |
| ||||
Prepaid expenses and other current assets |
| 199,434 |
|
| 174,195 |
| ||||
Total current assets |
| 1,194,000 |
|
| 2,086,901 |
| ||||
Long-term investments, available for sale |
| 21,374 |
|
| 574,319 |
| ||||
Property and equipment, net |
| 236,788 |
|
| 243,396 |
| ||||
Operating leaseright-of-use assets |
| 218,625 |
|
| - |
| ||||
Goodwill |
| 1,798,408 |
|
| 1,802,670 |
| ||||
Other intangible assets, net |
| 119,055 |
|
| 167,187 |
| ||||
Deferred tax assets, net |
| 301,062 |
|
| 136,998 |
| ||||
Other assets |
| 141,781 |
|
| 124,578 |
| ||||
Total assets |
| $4,031,093 |
|
| $5,136,049 |
| ||||
Liabilities, Temporary Equity, and Stockholders’ Equity | ||||||||||
Accounts payable |
| $72,659 |
|
| $75,551 |
| ||||
Accrued expenses and other current liabilities |
| 294,915 |
|
| 290,492 |
| ||||
Income taxes payable |
| 45,615 |
|
| 44,409 |
| ||||
Current portion of convertible notes |
| - |
|
| 1,155,445 |
| ||||
Current portion of deferred revenues |
| 1,200,496 |
|
| 1,345,243 |
| ||||
Total current liabilities |
| 1,613,685 |
|
| 2,911,140 |
| ||||
Long-term portion of deferred revenues |
| 415,076 |
|
| 489,329 |
| ||||
Long-term debt |
| 742,704 |
|
| 741,825 |
| ||||
Long-term income tax payable |
| 259,391 |
|
| 285,627 |
| ||||
Operating lease liabilities |
| 221,032 |
|
| - |
| ||||
Other liabilities |
| 66,294 |
|
| 148,499 |
| ||||
Temporary equity from convertible notes |
| - |
|
| 8,110 |
| ||||
Stockholders’ equity: | ||||||||||
Common stock |
| 318 |
|
| 310 |
| ||||
Additionalpaid-in capital |
| 6,170,577 |
|
| 5,404,500 |
| ||||
Retained earnings |
| 4,500,876 |
|
| 4,169,019 |
| ||||
Accumulated other comprehensive loss |
| (6,482) |
|
| (8,154) |
| ||||
Less-common stock in treasury, at cost |
| (9,952,378) |
|
| (9,014,156) |
| ||||
Total stockholders’ equity |
| 712,911 |
|
| 551,519 |
| ||||
Total liabilities, temporary equity and stockholders’ equity |
| $4,031,093 |
|
| $5,136,049 |
| ||||
Note: This document should be read in conjunction with the Company’s SEC Filings.
| ||||||
| 2019 | Q3 Financials | 13 | ||||
CITRIX SYSTEMS, INC.
CONDENSED CONSOLIDATED STATEMENT OF CASH FLOWS
(In thousands – unaudited)
Nine Months Ended September 30, 2019
| |||||
Operating Activities
| |||||
Net income |
| $474,700 |
| ||
Adjustments to reconcile net income to net cash provided by operating activities: | |||||
Depreciation, amortization and other |
| 188,443 |
| ||
Stock-based compensation expense |
| 202,523 |
| ||
Deferred income tax benefit |
| (184,573) |
| ||
Effects of other rate changes on monetary assets and liabilities denominated in foreign currencies |
| 2,712 |
| ||
Othernon-cash items |
| 7,888 |
| ||
Total adjustments to reconcile net income to net cash provided by operating activities |
| 216,993 |
| ||
Changes in operating assets and liabilities, net of the effects of acquisitions: | |||||
Accounts receivable |
| 256,628 |
| ||
Inventories |
| 443 |
| ||
Prepaid expenses and other current assets |
| (13,539) |
| ||
Other assets |
| (50,068) |
| ||
Income taxes, net |
| (42,119) |
| ||
Accounts payable |
| (2,645) |
| ||
Accrued expenses and other current liabilities |
| (48,485) |
| ||
Deferred revenues |
| (219,000) |
| ||
Other liabilities |
| 4,111 |
| ||
Total changes in operating assets and liabilities, net of the effects of acquisitions |
| (114,674) |
| ||
Net cash provided by operating activities |
| 577,019 |
| ||
Investing Activities
| |||||
Purchases ofavailable-for-sale investments |
| (19,999) |
| ||
Proceeds from sales ofavailable-for-sale investments |
| 938,031 |
| ||
Proceeds from maturities ofavailable-for-sale investments |
| 165,944 |
| ||
Purchases of property and equipment |
| (50,453) |
| ||
Cash paid for licensing agreements, patents and technology |
| (2,405) |
| ||
Other |
| 919 |
| ||
Net cash provided by investing activities |
| 1,032,037 |
| ||
Financing Activities
| |||||
Proceeds from credit facility |
| 200,000 |
| ||
Repayment on credit facility |
| (200,000) |
| ||
Repayment on convertible notes |
| (1,164,497) |
| ||
Stock repurchases, net |
| (353,904) |
| ||
Cash paid for tax withholding on vested stock awards |
| (74,794) |
| ||
Cash paid for dividends |
| (137,224) |
| ||
Net cash used in financing activities |
| (1,730,419) |
| ||
Effect of exchange rate changes on cash and cash equivalents |
| (3,569) |
| ||
Change in cash and cash equivalents |
| (124,932) |
| ||
Cash and cash equivalents at beginning of period |
| 618,766 |
| ||
Cash and cash equivalents at end of period |
| $493,834 |
| ||
Note: This document should be read in conjunction with the Company’s SEC Filings.
| ||||||
| 2019 | Q3 Financials | 14 | ||||
CITRIX SYSTEMS, INC.
STOCK-BASED COMPENSATION EXPENSE BY INCOME STATEMENT CLASSIFICATION
(In thousands – unaudited)
|
|
3Q18 |
4Q18 |
1Q19 |
2Q19 |
3Q19 | |||||||||||||||
Cost of subscription, support and services |
| $2,106 |
|
| $2,152 |
|
| $2,202 |
|
| $2,956 |
|
| $2,898 |
| |||||
Research and development |
| 17,009 |
|
| 20,637 |
|
| 27,837 |
|
| 25,419 |
|
| 25,505 |
| |||||
Sales, marketing and services |
| 18,910 |
|
| 20,311 |
|
| 19,926 |
|
| 24,424 |
|
| 23,838 |
| |||||
General and administrative |
| 14,714 |
|
| 16,213 |
|
| 15,269 |
|
| 15,521 |
|
| 16,728 |
| |||||
Total stock-based compensation expense |
| $52,739 |
|
| $59,313 |
|
| $65,234 |
|
| $68,320 |
|
| $68,969 |
| |||||
Note: This document should be read in conjunction with the Company’s SEC Filings.
| ||||||
| 2019 | Q3 Financials | 15 | ||||
Safe Harbor
For Citrix Investors
This letter contains forward-looking statements made pursuant to the safe harbor provisions of Section 27A of the Securities Act of 1933 and of Section 21E of the Securities Exchange Act of 1934. The forward-looking statements in this letter do not constitute guarantees of future performance. Investors are cautioned that statements in this letter, which are not strictly historical statements, including, without limitation, statements regarding the evolution of the Workspace market, the potential of Citrix Workspace, and our ability to execute on our vision of the Workspace, statements regarding our ability to build a successful Workspace platform, enterprise application integrations, and a developer ecosystem to enhance the Workspace platform, statements regarding our ability to increase the average duration of customer contracts and longer-term financial targets, including free cash flow, statements contained in the Guidance sections and under theNon-GAAP Financial Measures Reconciliation section concerning results for fiscal quarters and years ended 2019 and 2020, and statements regarding ARR, product introductions and management’s plans, objectives and strategies, constitute forward-looking statements. Such forward-looking statements are subject to a number of risks and uncertainties that could cause actual results to differ materially from those anticipated by the forward-looking statements, including, without limitation, risks associated with our ability to advance our subscription business model transition, including our ability to deepen our subscription customer relationships; our ability to grow the percentage of subscription bookings and paid subscribers; our ability to forecast our future financial performance during our business model transition; our ability to continue to grow the company’s Workspace business, further develop Citrix Workspace and continued demand for Citrix Workspace; the impact of the global economic and political environment on our business, volatility in global stock markets, foreign exchange rate volatility and uncertainty in IT spending and changes in the markets for our products, including the Workspace market; the risks associated with maintaining the security of our products, services, and networks, including securing customer data, and the risks associated with our recent cyber security incident; changes in Citrix’s pricing and licensing models, promotional programs and product mix, all of which may impact Citrix’s revenue recognition; our ability to expand our customer base and attract more users within our customer base; the introduction of new products by competitors or the entry of new competitors into the markets for Citrix’s products and services; the concentration of customers in Citrix’s networking business; the company’s ability to innovate and develop new products and services while growing its established virtualization and networking products and services; changes in our revenue mix towards products and services with lower gross margins; seasonal fluctuations in the company’s business; failure to execute Citrix’s sales and marketing plans; failure to successfully partner with key distributors, resellers, system integrators, service providers and strategic partners, such as Microsoft; transitions in key personnel and succession risk; the company’s ability to maintain and expand its business in large enterprise accounts and reliance on large service provider customers; the size, timing and recognition of revenue from significant orders; the success of investments in its product groups, foreign operations and vertical and geographic markets; the ability of Citrix to make suitable acquisitions on favorable terms in the future; risks associated with Citrix’s acquisitions and divestitures, including failure to further develop and successfully market the technology and products of acquired companies, failure to achieve or maintain anticipated revenues and operating performance contributions from acquisitions, which could dilute earnings; the recruitment and retention of qualified employees; risks in effectively controlling operating expenses, and our ability to improve our operating margin; ability to effectively manage our capital structure and the impact of related changes on our operating results and financial condition; the effect of new accounting pronouncements on revenue and expense recognition; failure to comply with federal, state and international regulations; litigation and disputes, including challenges to our intellectual property rights or allegations of infringement of the intellectual property rights of others; the ability to maintain and protect our collection of brands; charges in the event of awrite-off or impairment of acquired assets, underperforming businesses, investments or licenses; international market readiness, execution and other risks associated with the markets for Citrix’s products and services; risks related to servicing our debt; risks of political uncertainty and social turmoil; and other risks detailed in Citrix’s filings with the Securities and Exchange Commission. Citrix assumes no obligation to update any forward-looking information contained in this letter or with respect to the announcements described herein.
| ||||||
| 2019 | Q3 Financials | 16 | ||||
Reconciliation ofNon-GAAP Financial Measures to Comparable U.S. GAAP Measures (Unaudited)
Pursuant to the requirements of Regulation G, the Company has provided a reconciliation of eachnon-GAAP financial measure used in this letter and related conference call or webcast to the most directly comparable GAAP financial measure. These measures differ from GAAP in that they exclude amortization and impairment primarily related to acquired intangible assets and debt discount, stock-based compensation expenses and charges associated with the Company’s restructuring programs, the related tax effect of those items, and charges and benefits related to tax reform. The Company also reflects the effect of anti-dilutive convertible note hedges in the number of shares used innon-GAAP diluted earnings per share. The income tax effect onnon-GAAP items is calculated based upon the tax laws and statutory income tax rates applicable in the tax jurisdiction(s) of the underlyingnon-GAAP adjustment. The Company’s basis for these adjustments is described below.
Management uses thesenon-GAAP measures for internal reporting and forecasting purposes, when publicly providing its business outlook, to evaluate the Company’s performance and to evaluate and compensate the Company’s executives. The Company has provided thesenon-GAAP financial measures in addition to GAAP financial results because it believes that thesenon-GAAP financial measures provide useful information to certain investors and financial analysts for comparison across accounting periods not influenced by certainnon-cash items or cash charges that are the result of discrete activities that are not used by management when evaluating the Company’s historical and prospective financial performance. In addition, the Company has historically provided this or similar information and understands that some investors and financial analysts find this information helpful in analyzing the Company’s operating margins, operating expenses and net income and comparing the Company’s financial performance to that of its peer companies and competitors. Management typically excludes the amounts described above when evaluating the Company’s operating performance and believes that the resultingnon-GAAP measures are useful to investors and financial analysts in assessing the Company’s operating performance due to the following factors:
| • | The Company does not acquire businesses on a predictable cycle. The Company, therefore, believes that the presentation ofnon-GAAP measures that adjust for the impact of amortization and impairment of intangible assets and stock-based compensation expenses and the related tax effects that are primarily related to acquisitions, provide investors and financial analysts with a consistent basis for comparison across accounting periods and, therefore, are useful to investors and financial analysts in helping them to better understand the Company’s operating results and underlying operational trends. |
| • | Amortization and impairment of intangible assets and the related tax effects are fixed at the time of an acquisition, are then amortized over a period of several years after the acquisition and generally cannot be changed or influenced by management after the acquisition. |
| • | Although stock-based compensation is an important aspect of the compensation of the Company’s employees and executives, stock-based compensation expense is generally fixed at the time of grant, then amortized over a period of several years after the grant of the stock-based instrument, and generally cannot be changed or influenced by management after the grant. |
| • | Under GAAP, certain convertible debt instruments that may be settled in cash on conversion are required to be accounted for as separate liability (debt) and equity (conversion option) components in a manner that reflects the issuer’snon-convertible debt borrowing rate. The difference between the imputed interest expense and the coupon interest expense, net of the interest amount capitalized, is excluded from management’s assessment of the Company’s operating performance because management believes that the exclusion of these charges will better help investors and financial analysts understand the Company’s operating results and underlying operational trends. |
| • | The Company has engaged in various restructuring activities over the past several years that have resulted in costs associated with reductions in headcount, consolidation of leased facilities and related costs. Each restructuring activity has been a discrete event based on a unique set of business objectives or circumstances, and each has differed from the others in terms of its operational implementation, business impact and scope. While the Company’s operations previously benefited from the employees and facilities covered by the various restructuring charges, these employees and facilities have benefited different parts of the Company’s business in different ways, and the amount of these charges has varied significantly from period to period. The Company, therefore, believes that the exclusion of these charges will better help investors and financial analysts understand the Company’s operating results and underlying operational trends. |
| ||||||
| 2019 | Q3 Financials | 17 | ||||
| • | The Company had convertible note hedges in place to offset potential dilution from the embedded conversion feature in its convertible notes. For GAAP diluted earnings per share purposes, the Company cannot reflect the anti-dilutive impact of the convertible note hedges. The Company believes that reflecting the anti-dilutive impact of the convertible note hedges innon-GAAP diluted earnings per share provides investors with useful information in evaluating the financial performance of the Company on a per share basis. |
| • | Tax charges or benefits resulting from the enactment of Swiss tax reform. These benefits are not anticipated to be ongoing; and, thus, are outside of the normal operations of the Company’s business. Therefore, the Company believes that the exclusion of these benefits will better help investors and financial analysts understand the Company’s operating results and underlying operational trends. |
Thesenon-GAAP financial measures are not prepared in accordance with accounting principles generally accepted in the United States (“GAAP”) and may differ from thenon-GAAP information used by other companies. There are significant limitations associated with the use ofnon-GAAP financial measures. The additionalnon-GAAP financial information presented here should be considered in conjunction with, and not as a substitute for or superior to, the financial information presented in accordance with GAAP (such as net income and earnings per share) and should not be considered measures of the Company’s liquidity.
GAAP toNon-GAAP Reconciliation
(In thousands, except per share data and operating margin data – unaudited)
Three Months Ended September 30, 2019 | ||
GAAP operating margin | 15.1% | |
Add: stock-based compensation | 9.4 | |
Add: amortization and impairment of product related intangible assets | 2.8 | |
Add: amortization of other intangible assets | 0.7 | |
Add: restructuring charges | 1.2 | |
Non-GAAP operating margin | 29.2% | |
Three Months Ended September 30, 2019 | |||||
GAAP net income | $270,857 | ||||
Add: stock-based compensation | 68,969 | ||||
Add: amortization and impairment of product related intangible assets | 20,752 | ||||
Add: amortization of other intangible assets | 4,937 | ||||
Add: restructuring charges | 8,879 | ||||
Less: tax effects related to above items | (15,287 | ) | |||
Less: benefit related to Swiss tax reform | (157,651 | ) | |||
Non-GAAP net income | $201,456 | ||||
| ||||||
| 2019 | Q3 Financials | 18 | ||||
Three Months Ended September 30, 2019 | |||||
GAAP earnings per share - diluted |
| $2.04 | |||
Add: stock-based compensation |
| 0.52 | |||
Add: amortization and impairment of product related intangible assets |
| 0.16 | |||
Add: amortization of other intangible assets |
| 0.04 | |||
Add: restructuring charges |
| 0.07 | |||
Less: tax effects related to above items |
| (0.12 | ) | ||
Less: benefit related to Swiss tax reform |
| (1.19 | ) | ||
Non-GAAP earnings per share - diluted |
| $1.52 | |||
Forward Looking Guidance - GAAP toNon-GAAP Reconciliation
For the Twelve Months Ended December 31, 2019 | |||||
GAAP earnings per share - diluted | $4.45 - $4.67 | ||||
Add: adjustments to exclude the effects of expenses related to stock-based compensation | 2.04 | ||||
Add: adjustments to exclude the effects of amortization of intangible assets | 0.44 | ||||
Add: adjustments to exclude the effects of amortization of debt discount | 0.06 | ||||
Add: adjustments to exclude the effects of restructuring charges | 0.16 | ||||
Less: tax effects related to above items | (0.43 - 0.55) | ||||
Add: effect of convertible note hedges | 0.06 | ||||
Less: benefit related to Swiss tax reform | (1.18) | ||||
Non-GAAP earnings per share - diluted | $5.60 - $5.70 | ||||
GAAP andnon-GAAP diluted earnings per share do not include any additional impacts related to Swiss Cantonal tax reform because such impacts are not determinable at this time.
For the Twelve Months Ended December 31, 2019 | ||
GAAP operating margin | 17.2% - 18.2% | |
Add: adjustment to exclude stock-based compensation | 9.1 | |
Add: adjustment to exclude amortization of intangible assets | 2.0 | |
Add: adjustment to exclude restructuring charges | 0.7 | |
Non-GAAP operating margin | 29.0% - 30.0% | |
For the Twelve Months Ended December 31, 2020 | |||||
GAAP earnings per share - diluted | $3.34 - $3.54 | ||||
Add: adjustments to exclude the effects of expenses related to stock-based compensation | 2.11 | ||||
Add: adjustments to exclude the effects of amortization of intangible assets | 0.21 | ||||
Add: adjustments to exclude the effects of restructuring charges | 0.08 | ||||
Less: tax effects related to above items | (0.49) | ||||
Non-GAAP earnings per share - diluted | $5.25 - $5.45 | ||||
GAAP andnon-GAAP diluted earnings per share do not include any additional impacts related to Swiss Cantonal tax reform because such impacts are not determinable at this time.
| ||||||
| 2019 | Q3 Financials | 19 | ||||