Exhibit (c)(ii)
CASH FAIR EVALUATION
OFTHE COMMON STOCKOF
Henderson Citizens
Bancshares, Inc.
Henderson, Texas
DECEMBER 31, 2002
February 12, 2003
C O N F I D E N T I A L
Mr. Milton S. McGee, Jr.
President & Chief Executive Officer
Henderson Citizens Bancshares, Inc.
P.O. Box 1009
Henderson, Texas 75653-1009
| Re: | Cash fair evaluation of shares outstanding common stock of Henderson Citizens Bancshares, Inc., Henderson, Texas, as of December 31, 2002, for use in connection with a proposed corporate reorganization and “going private” transaction |
Dear Mr. McGee:
As part of its line of professional services, The Bank Advisory Group, Inc. specializes in rendering valuation opinions of banks and bank holding companies nationwide. These valuations are required for a multitude of reasons, including tax and estate planning, employee stock ownership plans, private placements, buy/sell agreements, exchange ratio determinations, dissenters’ rights proceedings, reverse stock splits, fairness opinion letters, public offerings, together with mergers and acquisitions. Broad and extensive participation in the field of bank securities appraisal on the part of the firm’s principals, allows The Bank Advisory Group, Inc. to be especially knowledgeable with regard to valuation theory and the rulings and guidelines of the Internal Revenue Service and the Office of the Comptroller of the Currency involving valuation methodology, and judicial decisions regarding bank stock valuation matters.
In our capacity as an expert in this field, you have asked our opinion as to the cash fair value of shares of the outstanding common stock of Henderson Citizens Bancshares, Inc., Henderson, Texas, as of December 31, 2002, for use in connection with a proposed corporate reorganization and “going private” transaction.
In order to accomplish our assignment, you have provided us with the relevant financial statements for Henderson Citizens Bancshares, Inc., as of December 31, 2002. In addition, through communications both oral and written, information was provided pertaining to the immediate past operating history of Henderson Citizens Bancshares, Inc. and its subsidiary bank, the major shareholdings of the common stock of Henderson Citizens Bancshares, Inc., the primary
Mr. Milton S. McGee, Jr.
February 12, 2003
Page 2
competition within the trade area of Henderson Citizens Bancshares, Inc.’s subsidiary bank, and other information deemed pertinent to the evaluation.
In rendering an opinion as to the cash fair value of the stock, we have considered the nature and history of Henderson Citizens Bancshares, Inc., the competitive and economic outlook for the trade area and for the banking industry in general, the book value and financial condition of Henderson Citizens Bancshares, Inc. and its subsidiary bank, their future earnings and dividend paying capacity, and the prevailing market prices of bank stocks. However, we have not independently verified the asset quality and financial condition of Henderson Citizens Bancshares, Inc. Accordingly, we have relied upon the data provided by or on behalf of Henderson Citizens Bancshares, Inc. and its subsidiary bank to be true and accurate in all material respects.
As a result of our examination of the information we deem relevant to this appraisal, as described in the attached report, it is our opinion that as of December 31, 2002, the Cash Fair Value of the common stock of Henderson Citizens Bancshares, Inc., for the purpose defined in this letter, was $32.00 per share excluding the application of a marketability/liquidity discount, and $29.00 per share including a 10% marketability/liquidity discount.
However, before determining a value congruent with either the $32.00 Cash Fair Value per share (excluding a marketability/liquidity discount) or the $29.00 Cash Fair Value per share (including a marketability/liquidity discount),you should consult with competent, experienced legal counsel regarding the propriety of applying a marketability/liquidity discount in setting a value in connection with the proposed transaction.
This opinion, and the related report, are provided to you solely for the confidential, internal use of the Board of Directors of Henderson Citizens Bancshares, Inc.; and, without the prior written consent of The Bank Advisory Group, they may not be quoted in whole or in part, or otherwise referred to in any report or document or furnished or otherwise communicated to any person outside the Board of Directors of Henderson Citizens Bancshares, Inc., other than legal and tax advisors to Henderson Citizens Bancshares, Inc.
Respectfully submitted,
THE BANK ADVISORY GROUP,INC
By /s/ Robert L. Walters
CASH FAIR EVALUATION
OF THE OUTSTANDING COMMON STOCK OF
Henderson Citizens Bancshares, Inc.
Henderson, Texas
ASOF DECEMBER 31, 2002
Section Number | Section Contents | Beginning Page Number | ||
I | Cash Fair Value Discussion & Analysis | i | ||
II | Summary Financial Analyses—HCBI & PEER: | 1 | ||
· Summary Comparative Analysis | ||||
· Historical Comparative Analysis | ||||
· Graphical Analysis | ||||
III | Financial Projections | 12 | ||
IV | Present Value of Earnings in Perpetuity | 16 | ||
V | Comparable Analysis—Selected Publicly-Traded Banking Organizations in the Southern United States | 17 | ||
VI | Market Share & Demographic Analyses | 20 | ||
VII | Historical Data—Henderson Citizens Bancshares, Inc. | 28 | ||
VIII | Historical Data—PEER Group | 42 | ||
IX | Summary of “Control” Pricing Analyses | 48 | ||
X | Profile—The Bank Advisory Group, Inc. | 49 |
SECTION I
CASH FAIR VALUE DISCUSSION & ANALYSIS
DISCUSSION AND ANALYSIS OF THE CASH FAIR VALUE
OF THE COMMON STOCK OF
Henderson Citizens Bancshares, Inc.
Henderson, Texas
ASOF
DECEMBER 31 , 2002
DESCRIPTION OF ASSIGNMENT
In our capacity as bank merger and acquisition analysts and bank stock appraisal experts, you have asked for the opinion of The Bank Advisory Group, Inc. as to the cash fair value of shares of the outstanding common stock of Henderson Citizens Bancshares, Inc., Henderson, Texas (“HCBI”), as of December 31, 2002, for use in connection with a proposed corporate reorganization and “going private” transaction.
In determining the cash fair value of HCBI’s stock, we have considered in varying contexts the nature and history of HCBI, the competitive and economic outlook for the trade area and for the banking industry in general, the book value and financial condition of HCBI, its future earnings and dividend paying capacity, previous sales of the common stock of HCBI, the prevailing market prices of selected publicly-traded banking organizations located in the Southern United States (States of Arkansas, Louisiana, Oklahoma and Texas), the prices paid for acquisition of selected United States commercial banking organizations, and certain other information deemed pertinent to our evaluation as identified herein.
The Bank Advisory Group, Inc., as part of its line of professional services, specializes in rendering valuation opinions of banks and bank holding companies nationwide under various circumstances. The Bank Advisory Group, Inc. and its principals do not hold an ownership position in the stock of HCBI, nor does The Bank Advisory Group, Inc. or its principals make a market in the stock of any company, banking or otherwise. Additionally, prior to our retention for this assignment, The Bank Advisory Group had previously provided financial advisory services to Henderson Citizens Bancshares, Inc.; however, the revenues derived from the delivery of such services are insignificant when compared to The Bank Advisory Group’s total gross revenues.
FINANCIAL PERFORMANCE AND CONDITION OF HENDERSON CITIZENS BANCSHARES, INC.
Henderson Citizens Bancshares, Inc. is essentially a “shell” one-bank holding company for Citizens National Bank, Henderson, Texas (“CNB”), a federally-chartered commercial bank with full-service offices in the following locations: Athens, Chandler, Corsicana(2), Henderson(2), Jefferson, Longview(2), Malakoff, Marshall, Mt. Enterprise, Overton, Tatum, Waskom, and White Oak. HCBI
i
CASH FAIR VALUE DISCUSSION & ANALYSIS
indirectly owns 100% of CNB through its 100% ownership of Henderson Citizens Delaware Bancshares, Inc., a “pass-through” Delaware corporation. HCBI also owns 100% of Waskom Bancshares, Inc., an inactive shell bank holding corporation. Neither HCBI nor the Delaware bank holding company engage in any nonbanking activities. Finally, we note that CNB operates a Community Development Corporation subsidiary which offers affordable housing to lower income persons in the following Texas counties (Rusk, Marion and Henderson).
HCBI reported 1,994,218 shares of common stock issued and outstanding at December 31, 2002 (net of 165,782 shares held as treasury stock). HCBI reported no other issues of common or preferred stock outstanding. Additionally, HCBI reported no stock options, warrants, or securities convertible into common stock. The financial analyses, as subsequently described and set forth in Section II, are based upon financial information contained within Sections VII and VIII.
| · | Summary Comparative Analysis—We have compared the financial performance and condition of HCBI with the average financial condition and performance ratios derived from a selected group of banking organizations (hereinafter referred to as the “PEER”). In this instance, the PEER group is comprised of 27 Arkansas, Louisiana, Oklahoma and Texas bank holding companies with assets ranging between $350 million and $750 million, and organized as C corporations, as of September 30, 2002. Please note that in relation to PEER, all income and expense ratios were annualized for the period ending September 30, 2002. |
Pages 1 & 2 of the adjoining information set forth the Summary Comparative Analysis, which examines key financial components and ratios organized into the following categories:General Data; Asset Quality & Capital Adequacy; Profitability Overview; Income Statement as a Percentage of Average Assets; Efficiency; Yields & Rates; Asset Mix; Loan Mix; and, Deposit Mix. HCBI is compared with PEER utilizing these key criteria, and the appropriate differentials between HCBI and PEER are identified, where applicable. Additionally, we analyzed HCBI’s financial components and ratios as a percentage of PEER’s financial components and ratios, when applicable. Finally, selected key criteria are presented as either strengths or weaknesses, calculated using the HCBI ratio as a percentage of the PEER ratio. Each symbol on the accompanying graph represents a relative weighting of the strength or weakness. The rankings for relative strengths and weaknesses are defined as follows:
RANKING PARAMETERS | ||||||
Strength/Weakness | ||||||
n | Over 85% | or | 100%–115% | |||
n n | 70%–85% | or | 115%–130% | |||
n n n | 55%–70% | or | 130%–145% | |||
n n n n | 40%–55% | or | 145%–160% | |||
n n n n n | Under 40% | or | Over 160% | |||
| · | Historical Comparative Analysis—We have compared the financial performance and condition of HCBI for the prior six fiscal periods ending as of December 31, 1997–2002; and, for the PEER for the nine-month period ending September 30, 2002, and for the prior five fiscal periods ending as of December 31, 1998–2002. Pages 3–5 set forth the Historical Comparative |
ii
CASH FAIR VALUE DISCUSSION & ANALYSIS
Analysis, which examines key financial components and ratios for HCBI and PEER, organized into the following categories:Balance Sheet; Asset Quality & Capital Adequacy; Growth Rates; Income Statement; Income Statement as a Percentage of Average Assets; Yields & Rates; Efficiency; and, Miscellaneous Items.
| · | Graphical Analysis—We have provided a series of charts, set forth on pages 6–11 of the adjoining information, which portray selected financial ratios for the Summary Comparative Analysis of HCBI with PEER, together with a Historical Comparative Analysis of selected balance sheet and income statement items for HCBI. |
PROJECTIONS OF FINANCIAL PERFORMANCE
We have prepared financial projections for Henderson Citizens Bancshares, Inc. set forth in Section III of the adjoining material. The projected financial information is based primarily upon the financial history of HCBI and its bank subsidiary, the competitive and economic outlook for the trade area and for the banking industry in general, and discussions with the management of HCBI. Market share and demographic analyses of the State of Texas, the following Texas counties (Gregg, Harrison, Henderson, Marion, Navarro, and Rusk), and the Longview-Marshall, Texas and Dallas, Texas Metropolitan Statistical Areas are provided in Section VI of the adjoining material. Reflected in the projected financial information are assumptions regarding HCBI’s future asset growth, earnings performance, dividend pay-out level, and credit quality.
We are projecting HCBI’s return on average assets (“ROA”) to initially decline from the 1.01% recorded during 2002 to 0.92% by 2003, reflecting primarily the absence of the $1.1 million in pre-tax nonrecurring gains realized on the sale of securities during 2002, together with a reduction in noninterest income to historically-supported levels in relation to average assets. HCBI’s ROA is forecast to then increase gradually until equaling 1.00% by 2010. The overall rise projected for HCBI’s ROA from 2004 through 2010 reflects a slight increase in operational efficiencies and a reduction in provision expense in relation to average assets from the 0.20% recorded during 2002 until stabilizing at 0.14% by 2004.
HCBI’s rate of annual asset growth is projected to decline from the 5.49% recorded during 2002 to 5.00% by 2003, remain at that level through 2007, then decrease slightly until stabilizing at 4.00% by 2012. Over the twelve-year projection period, the forecast asset growth rate would result in a $395 million increase in HCBI’s asset base or approximately $32.9 million per year. The moderate level of asset growth is anticipated to combine with the relatively constant level of profitability to produce moderate growth rates in net earnings subsequent to 2003. Annual cash dividends per share are forecast to rise from the $0.68 recorded during 2002 until equaling $1.16 by 2014, contributing to a core equity-to-assets ratio which rises to 11.82% by year-end 2014.
We are projecting HCBI’s ratio of net loan losses-to-average loans to fall from 0.34% during 2003 until stabilizing within 0.26%–0.28% by 2004. This level of net loan losses, together with the projected decrease in provision expense in relation to average assets, is forecast to produce a ratio of loan loss reserves-to-total loans which equals a constant 1.50% throughout the projected periods.
iii
CASH FAIR VALUE DISCUSSION & ANALYSIS
DEFINITION OF FAIR VALUE
We have been asked to appraise shares of HCBI for use in connection with a proposed corporate reorganization whereby certain shareholders of Henderson Citizens Bancshares, Inc. would be forced to receive cash in exchange for their HCBI common shares. We note that the structure of the proposed corporate reorganization includes the “involuntary” liquidation of the common ownership positions of certain shareholders of HCBI. Moreover, we note that HCBI’s shareholders possess the legal right to dissent from the proposed transaction as provided for in Texas statutes. Indeed, certain state jurisdictions, including Texas, provide dissenting shareholders with the right to contest the proposed consideration to be exchanged for the dissenting shareholders’ common stock ownership positions.
As a result of performing our appraisal services, we have become aware of the fact that many states statutorily require that dissenting shareholders, in circumstances similar to this appraisal situation, be paid the “fair value” of their shares. We are also aware that the courts of the various states have been somewhat inconsistent in their definition of “fair value.” In this case, we have been advised by counsel for HCBI that Texas courts have not adopted a consistent definition of “fair value” for use in that state. However, from having performed numerous appraisals in situations similar to the circumstances of this particular appraisal, we understand that in the various states that have considered the meaning of the term “fair value,” there is general consensus that in determining “fair value” the appraiser should assume: (i) that the appraised company continues to be owned by the current shareholders (i.e., the company is not liquidated or sold to a hypothetical new owner), and (ii) the appraised shares represent a proportionate interest in the appraised company operating as a going concern without any consideration of the increase or decrease in value that could potentially result from the proposed corporate action itself, or from a hypothetical sale or corporate liquidation. The various state courts sometime disagree whether it is appropriate to further consider (a) the inclusion of a “control premium” and/or (b) the application of a “marketability/liquidity discount.” For purposes of this appraisal report, and with the concurrence of HCBI and its legal counsel, we have not assumed the sale or liquidation of HCBI, and for reasons indicated later in this Discussion & Analysis, we have not applied or otherwise directly included a “control premium” in determining an appropriate “fair value.” Accordingly, we have been asked to set forth two values: a value that reflects consideration of all relevant valuation methodologies and analysis of all relevant criteria, both financial and non-financial, that are properly considered in any valuation situation, but without the consideration of a marketability/liquidity discount; and, a second value in which the application of this discount is included.
Without attempting to define the specific nuances of the various non-legal and legal definitions of “fair value” or “fair market value,” it is our understanding that most legal jurisdictions hold that the value that should attach to the dissenting shareholders’ ownership positions in the appraised company should approximate the value that was in place justprior to the effective date of the transaction or the fundamental corporate change that gave rise to the dissenters’ rights proceeding. In other words, the value of the shareholders’ ownership positions should exclude any subsequent economic value impact resulting directly from the transaction/fundamental corporate change that gave rise to the appraisal, and should further exclude any additional value that hypothetically would be created solely in connection with the potential liquidation or sale of the appraised company.
iv
CASH FAIR VALUE DISCUSSION & ANALYSIS
In cases where a “public” market exists on a national exchange for the shares of a company that is effecting a transaction that is removing certain shareholders, we are aware that a number states have statutorily relied on the established market value/price in place prior to the commencement of the transaction/fundamental corporate change to set an appropriate “fair value.” Indeed, for a publicly-traded company involved in an “involuntary” corporate transaction, some states utilize the so-called “stock market exception” to determine an appropriate value for the shareholders’ stock (by reference to the existing market price), thereby displaying trust in the ability of an adequate, freely-trading, arm’s-length market to fairly compensate shareholders. It is our understanding that such is the case in Texas. However, where no effective “public” market exists for the shares of the appraised company, other valuation methods and criteria must be employed and examined to determine an acceptable value. This situation requires that the appraiser, and ultimately the appropriate legal jurisdiction, adopt and accept other substitute market and financial data and appraisal methods that are most appropriate under the existing circumstances of the appraised company. Furthermore, the appraiser, and appropriate legal jurisdiction, must recognize that one or more valuation techniques may or may not provide reliable values for use in determining an appropriate value for the shareholders involved in any particular involuntary corporate transaction.
We believe that an appropriate value for a block of stock of a closely-held company—a company with a market for its shares that is either nonexistent or extremely “thin” in terms of trading activity—can be derived only through the broad consideration of the net asset value, market value, and investment value approaches (as they are defined later in this Discussion & Analysis), together with the comprehensive consideration of all relevant factors and criteria, both financial and non-financial, that might reasonably impact the value of an ownership position in a corporation operating as an ongoing concern. It is important to recognize that for most companies with thinly-traded stocks, a value derived from the analysis of recent trading activity in those stocks willnot render an acceptable or appropriate value conclusion. Accordingly, recent trading activity for a thinly-traded stock is not a determinative factor in the appraisal process.
Inherent in a comprehensive approach to valuation is the recognition that no single precise valuation technique/methodology is unilaterally compelling when deriving an appropriate value. Likewise, no one financial or non-financial criterion, nor any exact mathematical computation, formula, or weighting can singularly dominate the derivation of the final value conclusion. Furthermore, it must be recognized that the appraiser’s judgment and experience is of paramount importance in the final value conclusion. Subject to a subsequent review by the appropriate legal authority, we believe that all relevant factors and criteria that are commonly reviewed by appraisers should be considered broadly in determining an appropriate value. Specifically, courts have generally indicated that the valuation process should at least encompass a review of: (i) the nature and history of the company; (ii) the current financial condition and recent performance of the company; (iii) the economic outlook for the specific industry; (iv) previous sales of the company’s stock (if available); (v) if the market data in the preceding item is not present in sufficient quantity, the market prices of similar corporations that possess effective markets for their stocks; and, if appropriate under the prevailing market conditions, (vi) the “control” price data for community banking companies recently involved in merger/acquisition transactions. However, issues involving the specific transaction or corporate event giving rise to the appraisal, as well as specific future events that cannot be reasonably anticipated as of the appraisal date, largely should be ignored in the value determination process.
v
CASH FAIR VALUE DISCUSSION & ANALYSIS
As subsequently detailed in this Discussion & Analysis, in performing our appraisal we have neither taken a “minority discount” nor included a “control premium.” A minority discount (discount for lack of control) reflects the lower price/value per share that typically is paid for a small block of stock of aclosely-held company versus the price/value per share that typically is paid for a controlling position in the same company—at presumably the same point in time. In other words, as it relates to an appraisal of shares representing less than a controlling position in the appraised company, a “minority discount” reflects the degree to which a control value per share, that itself is typically derived using data that presupposes the sale of the appraised company, is reduced to determine an appropriate per share value for a noncontrolling stock ownership position. Generally speaking, the magnitude of a “minority discount” varies considerably depending upon: (i) the magnitude of the price levels for controlling positions in similar companies (usually, the higher the value for controlling positions, the greater the minority discount), and (ii) the degree of concentration of the existing ownership in the appraised company (usually, the greater the ownership concentration, the greater the minority discount).
As to the application of a “minority discount”—or as more correctly stated, the inclusion of a “control premium”—we offer the following comments. We believe that a dissenters’ rights appraisal process is not intended to construct thepro formasale of the appraised company, but rather assumes that the dissenting shareholders are willing to maintain their investment in the appraised company as if the transaction/fundamental corporate change giving rise to the dissenters’ rights proceeding had not occurred. Essentially, from our perspective, dissenters’ rights statutes are intended to ensure that dissenting shareholders are paid a value equivalent to the value of what they gave up or was taken from them in the transaction. In our view, this represents the value of their collective interests in the entire appraised company operating as a going concern—not the acquisition/control value for the appraised company that a hypothetical purchaser, involved in a hypothetical transaction to acquire “control” of the appraised company, would be willing to pay.
Moreover, none of the dissenters’ rights statutes of which we are aware refer to either elements of “control” or “control” or “acquisition” value in defining or describing the value that should be paid to the dissenting shareholders. Obviously, had the authors of the various state and Federal dissenters’ rights statutes intended for the value to be paid to dissenting shareholders to include elements of control, it would have been simple to incorporate statutory language to that effect. However, we are aware of no state statutory law that contains such language. Moreover, we note that the Office of the Comptroller of the Currency, when appraising shareholder positions of national banks as required under federal regulations and as described in Banking Circular 259, specifically excludes the usage of control premiums. Therefore, we do not believe that state lawmakers ever intended that dissenters or other shareholders who were involuntarily “cashed out” should receive a value that includes factors tied to “control”—includingboth the direct corporate ownership rights that convey to a party or parties that owns a controlling position, and more importantly, the potential synergistic operational opportunities that, depending on the identity of the assumed buyer of control, typically accrue to the new owner in varying amounts.
Furthermore, a value derived from an assumed sale/acquisition of the appraised company would be incongruent with the “going concern” standard. And most importantly, the magnitude of the control value/price would be wholly dependent upon: (i) the identity of the prospective buyer, (ii) the pre-existence/absence of the acquirer’s operations in the appraised company’s trade area or line of business (the synergistic impact of the acquisition on the particular buyer), (iii) the form of
vi
CASH FAIR VALUE DISCUSSION & ANALYSIS
consideration offered by the prospective buyer (stock, cash, notes, etc.); and, (iv) the number of potential buyers actually interested in acquiring the specific appraised company. In other words, the magnitude of a hypothetical control/acquisition value for the appraised company would be highly speculative, would necessarily include value related to synergistic effects that would accrue to the particular new controlling owner, and would certainly vary depending upon the identity of the acquirer.
However, if one were to estimate the magnitude of the non-synergistic “control premium” contained in a hypothetical “control/acquisition” value for an appraised community bank, such person would need to be aware that: (i) the banking industry has been consolidating significantly over the past two decades; (ii) since the industry is highly regulated, substantial information exists to analyze the community banking merger/acquisition transactions that have occurred; (iii) the vast majority (over 90%) of the community banking companies acquired each year are bought by other banking organizations; (iv) most (well over 70%) of the community banking companies acquired by other banking organizations are merged into the acquiring banking organization, and become a branch of the acquiring banking organization; (v) the consideration paid in many bank acquisition transactions is not cash, but rather the stock of the acquirer—and the various acquirers’ stocks vary considerably, one to the next, in their comparative market price levels—making it very difficult to use the primarily stock-for-stock purchase transactions to determine a cash “control premium;” and (vi) as illustrated in the first set of data set forth in the Summary of “Control” Pricing Analyses (Section IX), publicly-traded community banking companies which were acquired during January 2001 through December 2002, with assets between $200 million and $1.5 billion, possessed an average trailing four-quarter return on assets (“ROA”) that typically ranged between 0.70% and 1.30%, and averaged 1.09%; and, those same acquired banking companies also typically possessed a ratio of noninterest expense-to-average assets that ranged between 2.50% and 4.00%, and averaged 3.21% (the “Publicly-Traded Transactions”).
Having worked extensively with hundreds of acquiring banking companies advising them on deal structure, competitive purchase price levels, negotiating strategies, due diligence issues, operational integration possibilities, and regulatory matters, together with having reviewed publicly-available data (including press releases issued by publicly-traded community bank acquirers announcing their acquisitions of community banking organizations) that indicate the acquirers’ estimates regarding the available overhead cost reduction opportunities that exist in connection with their acquisition of community banking companies, we are aware that numerous opportunities always exist for the purchasing banking organization to reduce the acquired banking company’s operating costs. Our experience, together with the available public data, indicate that this overhead cost reduction opportunity typically ranges between 10% and 35%, and averages more than 20%, but less than 30%, at any given point in time (appraisal date).
As stated previously, the typical recently-acquiredpublicly-traded community banking company possessed a ratio of noninterest expense-to-average assets of 3.21%, on average. Using a conservative 20% assumption as an “average” cost reduction opportunity (“merger savings” or “synergies”) together with the average noninterest expense-to-average assets ratio of approximately 3.21% for the typical acquired publicly-traded community banking company, our experience and the publicly-available data indicate that, on average, approximately 0.64% (3.21% x 20%) of an acquired banking company’s assets can be realistically, if not conservatively realized as increased pre-tax earnings that will ultimately accrue to the acquiring banking organization. Adjusting for taxes at an assumed 36% marginal tax rate, the additional after-tax earnings that would likely be recognized by the potential
vii
CASH FAIR VALUE DISCUSSION & ANALYSIS
acquirer would approximate 0.41% [0.64% x (1 – 0.36)] of the acquired banking company’s average assets (in other words, the acquired bank’s ROA would increase by an absolute 0.41%, on average).
Noting that recently-acquired publicly-traded community banking organizations have a four-quarter trailing average ROA (after-tax) of 1.09%, the additional after-tax earnings derived from the recognition of merger savings/synergies that are associated with a typical community bank merger/acquisition transaction, result in an approximate 38% (0.41%/1.09%) increase in the acquired banking company’s after-tax earnings (with the earnings increase accruing entirely to the acquiring banking organization solely as a product of the merger/acquisition transaction). In short, this amount of additional earnings does not actually exist, and is not owned by any shareholder group in the selling company, absent the merger/acquisition transaction that gives rise to the synergistic opportunities available to the specific purchaser/new owner.
Most importantly, for thosepublicly-traded banking companies that decided to sell during the past several years (over 90% of the time to other banking organizations), the per share market trading price data for the seller that existed prior to the announcement of a sale transaction, together with the “control” transaction per share purchase price data, constitute the only value or price data available for the same banking institution(s) at the same point in time. This comparative price data provide a meaningful indication of the difference, if any, between the publicly-traded market prices per share that had existed for these banking companies as stand-alone operating concerns and the “control” transaction purchase prices per share for those same banking companies, at essentially the same point in time (i.e. the comparison of the per share trading prices for the sellers at a time just prior to the announcement dates of the merger/acquisition transactions versus the actual per share values/prices of the merger/acquisition transactions). In other words, the magnitude of any “control premium” for these banking companies can be both identified and quantified.
For the Publicly-Traded Transactions, the percentage change from the existing per share market price at intervals of one-week, two-weeks, and one-month prior to the transaction announcement date to the per share price of the merger/acquisition (purchase) transaction, including any “control premium,” ranged between 20% and 60% for a clear majority of the transactions, averaged a one-month price increase of 37% for all transactions, and possessed a one-month median market price movement of 35% (as illustrated in the first analysis set forth in Section IX). However, it should be noted that approximately 80% of the 46 announced transactions contained within the Publicly-Traded Transactions involved the acquirers’ stocks as at least a portion of the consideration paid.
In most years, and for most acquirers, part of the “control premium” differential is typically created as a result of the acquirer using its stock as the form of consideration (rather than 100% cash). As illustrated in the second and third sets of data set forth in the Summary of “Control” Pricing Analyses (Section IX), for control transactions announced during January 2001–December 2002, banking companies acquired with a 100% stock form of consideration (the “Stock Transactions”) recorded average price indices which exceeded those for the banking companies acquired with a 100% cash form of consideration (the “Cash Transactions”) by approximately 23%. We note that the trade areas of the acquired banking companies were overall fairly similar for both the Stock Transactions and the Cash Transactions. Additionally, we recognize that the primary weighted-average financial criteria for the Stock Transactions were superior to those for the Cash Transactions. Specifically, we note that the Stock Transactions reported a weighted-average four-quarter trailing return on average assets of 1.19%, exceeding the 1.00% weighted-average of the Cash Transactions; and, that the Stock Transactions reported a weighted-average ratio of core equity-to-average assets of 9.06%, slightly
viii
CASH FAIR VALUE DISCUSSION & ANALYSIS
exceeding the 8.69% weighted-average of the Cash Transactions. Correspondingly, the Stock Transactions reported a weighted-average return on equity of 13.07% as compared with the 11.41% weighted-average for the Cash Transactions. Finally, we note that the Stock Transactions reported weighted-average total assets of $454 million, somewhat below the $472 million weighted-average for the Cash Transactions.
Given the markets and fundamental financial criteria possessed by the banking companies set forth in both the Stock Transactions and the Cash Transactions, it is clear that the additional 23% “control premium” contained in the Stock Transactions in excess of that contained in the Cash Transactions was derived only in part by the superior financial characteristics of the acquired banking companies comprising the Stock Transactions. The remainder of the “control premium” relates to the value of the acquirers’ stocks over and above the value of cash as a form of consideration. We estimate that the portion of the “control premium” which reflects the stock form of consideration to range within 1%–5%, or approximately 4%–22% of the total “control premium” of 23%.
Therefore, we conclude that approximately 3% (1%/37%) to 13% (5%/37%) of the previously noted one-month average price increase (“control” value over publicly-traded value) of 37% for the Publicly-Traded Transactions represents the premium relating to a stock form of consideration. Thus, the exclusion of the “control premium” which relates to the stock form of consideration produces a “control premium,” using cash as the sole form of consideration, that ranges between 24%–34%. It is appropriate to employ this adjustment given that this valuation situation requires the determination of thecash fair value of HCBI’s common shares, not a value in the form of a potential acquirer’s shares.
Moreover, we reiterate that the Publicly-Traded Transactions’ current ongoing after-tax earnings derived from existing, stand-alone operations can be increased by approximately 38% [(3.21% x 20% x 64%)/1.09%] by the acquiring banking organization. Given that the ongoing after-tax earnings increase of 38% exceeds the 24%–34%cash acquisition “control premium” range, it is clear that the “control premiums” paid for those Publicly-Traded Transactions where cash was the form of consideration “paid” were derived (financially supported) entirely by the earnings enhancement opportunities (operational synergies) available to the acquiring banking organizations.
Therefore, since we generally believe that: (i) the valuation process for determining a cash fair value should not presuppose the sale or liquidation of the appraised company, but rather should assume that an appraised company continues to be operated by the existing managers/owners as an on-going concern; and, (ii) any value attached to or otherwise derived from a stock form of consideration and/or a prospective purchaser’s (new owner’s) realization of synergistic effects or merger savings in connection with a hypothetical merger/acquisition transaction involving an appraised company should not be included in fair value, as of the valuation date, we do not believe that it is proper to include the hypothetical “control” value obtained from recent “control” or “acquisition” transactions (specifically the “control premium” that is tied to the potentially achievable synergies) in determining a fair value for dissenting shareholders.However, please note that we calculated a cash fair value for a 100% (“control”) position in HCBI, excluding the “synergistic control premium” as computed above, and determined that the “non-synergistic” control value did not exceed the Final Cash Fair Value conclusion, without the consideration of a marketability/liquidity discount, subsequently set forth in this appraisal report. A summary of the pricing and financial data utilized in determining the “non-synergistic control” value is illustrated in the fifth set of data set forth in the Summary of “Control” Pricing Analyses (Section IX).
ix
CASH FAIR VALUE DISCUSSION & ANALYSIS
And to reiterate, when a publicly-traded company effects a transaction that eliminates certain shareholders, a number of states rely solely upon the “stock market exception” (in accordance with statutory law) to determine an appropriate fair value for the shares owned by those eliminated shareholders. Accordingly, it is entirely appropriate to make use of average or median comparable values, derived from publicly-traded companies, to determine a value conclusion for a non-publicly-traded company. Moreover, it is incongruent to assume that the use of average or median market values, derived from a group of “comparable” publicly-traded companies, to determine a fair value of a nonpublicly-traded company requires the additional consideration of a hypothetical “control premium” that is derived/supported primarily by operational synergisms tied directly to a hypothetical merger/acquisition transaction. Were such the case, shares in a nonpublicly-traded company with an illiquid market for its stock would frequently be appraised at a greater value than the shares of a financially similar publicly-traded company involved in the same type of corporate transaction. Such a result is unquestionably contrary to the “real world” manner in which shareholders value or price equity securities, and would also be patently unfair to the shareholders of publicly-traded companies (who would receive market value) as compared to nonpublicly-traded companies (who would receive market value plus a hypothetical “control value” premium).
In light of the above discussion regarding the inclusion of a “control premium,” it should again be stated that while recent “control” price data regarding community banking companies were reviewed and considered by The Bank Advisory Group in ultimately determining the final cash fair value conclusion set forth herein, The Bank Advisory Group did not directly utilize or otherwise apply a “control premium” in any manner or respect. Of course, in determining a fair value in a litigated valuation situation, the final decision regarding the application of any valuation methodologies or techniques is left ultimately to the discretion of the trial court.
VALUATION VARIABLES
The relative importance of the key valuation methodologies and criteria differs somewhat from one valuation scenario to the next. Most bank appraisal experts tend to agree that the primaryfinancial variables to be considered are earnings, equity, dividends or dividend-paying capacity, asset quality and cash flow. In most, if not all, instances when valuing an on-going concern, value derived strictly from the analysis of these financial variables is further influenced by one or morenonfinancial factors, including marketability/liquidity issues, the economic/competitive/demographic situation within the trade area, trends in the applicable industry, voting rights or block size, history of past sales of the banking company’s stock or other substitute markets’ price levels, the comparative financial and nonfinancial characteristics of the institutions comprising the substitute markets, the nature and relationship of the other shareholdings in the banking organization, and other special ownership or management considerations. In performing this appraisal, we focused on both the relevant financial and nonfinancial variables that we felt were appropriate, as described herein, for consideration in this valuation situation.
x
CASH FAIR VALUE DISCUSSION & ANALYSIS
GENERAL DISCUSSION OF VALUATION METHODOLOGIES
Three types of valuation approaches are commonly recognized and employed, when appropriate, by appraisal experts in valuing an ownership interest in a company operating as a going concern. The three broad valuation types or methods are net asset value, market value, and investment value.
When valuing a banking organization,net asset valuefrequently is defined as the value of the net worth (equity) of a bank, including every kind of property and value. However, this approach normally assumes the liquidation or sale of the assets on the date of the appraisal, with the attendant recognition of any securities gains or losses, real estate appreciation or depreciation, together with any adjustments to the loan loss reserve, or discounts to the loan portfolio, or changes in the net value of any other assets. As such, it typically is not the best approach to use when valuing an interest in a company operating as a going concern. However, it would be applicable when valuing any nonoperating or “held” assets at a banking organization (such as excess real estate, or low- or non-dividend paying equity securities held for long-term investment purposes).
Market valueis generally defined as the price at which knowledgeable buyers and sellers would agree, and is frequently used to determine the price of the appraised stock when both the quantity and the quality of the existing trade data are deemed sufficient. However, the relative “thinness” of the specific market for the stock of the company being appraised may result in the need to review data from other substitute “comparable” markets in determining a comparative value.
When valuing a block of a community banking organization with a very thin market for its stock, initial “hypothetical” values are normally determined by comparison to the average or median price-to-earnings and price-to-equity multiples of statewide or regional publicly-traded banks, and then, most importantly, adjusting for any differences in material financial and/or nonfinancial criteria. Finally, assuming the valuation situation allows, the computed market value typically is adjusted for the lack of marketability or liquidity that almost always exists for a normal small-to-medium size community bank’s stock relative to a publicly-traded bank stock.
Generally speaking, when valuing the stock of a company operating as a going concern, one of the most important valuation types is theinvestment value, sometimes referred to as the income value or earnings value. The investment value of an interest in a company is frequently defined as an estimate of the present value of its future earnings or cash flow. In addition, another popular method in determining a hybrid investment/market value is to determine current annual benefits (earnings, cash flow, dividends, etc.), and then capitalize them using either an appropriate yield/rate of return or a price-earnings multiple.
When the three valuation methodologies (net asset, market, and investment) are subjectively considered, using the appraiser’s experience and judgment, an appropriate value is determined within the parameters of the valuation situation.
NET ASSET VALUE
Net asset value, as a method of valuation of an interest in a company operating as a going concern, generally is deficient because it is usually based on historical costs and varying accounting methods
xi
CASH FAIR VALUE DISCUSSION & ANALYSIS
which typically vary from one organization to the next. Moreover, even if the assets and liabilities can be adjusted to reflect prevailing prices and yields, this value method still results in an assumed liquidation value for the concern. Furthermore, it does not appropriately take into account the value attributable to a going concern—such as the interrelationships among the appraised company’s assets, liabilities, customer base, product lines, operations, market presence, image and reputation, and staff expertise and depth. As a result, we gave little if any consideration to the net asset value method of valuation in arriving at our cash fair value determination. However, we did consider the stated core equity book value as of the valuation date as a general reference point in the process of determining cash fair value.
MARKET VALUE
As previously mentioned, the typical market value is generally defined as the price at which knowledgeable buyers and sellers reach agreement within a freely traded, active market. When valuing a non-controlling block of stock, this value method typically focuses on the price at which the appraised company’s stock was selling at the time of the appraisal. However, as previously mentioned, most small-to-medium-sized banking organizations do not possess an effective market for their shares. Therefore, publicly traded bank stock data is typically substituted in order to derive an appropriate value indication.
When utilizing the market value method to appraise the shares of a company that does not have an adequate trading market for its stock, we believe that the best value approach is to value the appraised company on an “as if publicly-traded basis” utilizing the stock prices of comparable publicly-traded companies to derive a value indication for the shares of the appraised company. Specifically, we believe it is most appropriate to use this data for a number of reasons:
| 1. | This valuation technique is widely accepted throughout the appraisal community. |
| 2. | No control positions exist in these publicly-traded companies, so therefore, from a value perspective, no “minority discount” off of control value can exist (and for such companies, control would only exist when a clear majority of all shareholders typically were to act in concert). |
| 3. | Significant amounts of high-quality data regarding the publicly-traded companies from which to base informed comparative pricing decisions is provided on a quarterly basis, and numerous third-party analysts review and report on the financial condition and performance and stock prices of the publicly-traded companies. Specifically, publicly-traded banking organizations produce a wealth of quality financial information available to the public consisting of, but not limited to, quarterly/annual shareholders reports, press releases, Securities and Exchange Commission filings (10-K and 10-Q filings, etc.), as well as the numerous financial reporting requirements of the bank regulatory authorities. Additionally, considerable market/financial analysis of the publicly-traded banking organizations are conducted by investment banking firms and securities brokerage houses nationwide. Finally, Securities and Exchange Commission filings are available via various Internet services, and the great majority of the publicly-traded banking organizations maintain investor relations departments, which are available via Internet websites. |
xii
CASH FAIR VALUE DISCUSSION & ANALYSIS
Publicly available information for most closely held banking organizations is usually limited to regulatory filings made available by the banking organizations themselves. Accordingly, the comparative absence of quality data for smaller, more closely-held banking organizations produces a quantifiable negative impact on the price potential investors are willing to pay for the shares of those organizations. |
| 4. | As mentioned previously, the aggregate trading activity for each of the publicly-traded companies (and on an average basis, for all of the considered publicly-traded companies taken as a whole) places informed values on these companies—not simply just one value for a particular trade on any given day. Specifically, the publicly-traded banking organizations possess average monthly trading volume approximating 1%–3% of their outstanding shares, equating to approximately 15%–40% per annum. In essence, the publicly-traded banking organizations frequently record yearly trading volume consisting of hundreds, if not thousands, of individual trades (not just one large block or a few mid-sized trades) equaling in excess of 40% of the outstanding shares—in other words, giving consideration to the individual size of the other shareholdings, effective “control” of the banking organization. Moreover, this level of trading volume conveys to an investor in small-to-moderate blocks of stock the potential liquidation capacity equivalent to that of a “control” shareholder; i.e., the ability to liquidate the investment within a relatively short time-frame without incurring the value impact of either a marketability/liquidity discount or a minority discount. |
| 5. | Since the financial services industry is consolidating at a brisk pace, the ability of the investors to jointly consider the cash “control” prices paid for community banks, in conjunction with the market prices for the larger, publicly-traded banking companies, provides an additional perspective in using this data to determine an appropriate value for the shares of a closely held banking organization operating as a going concern. |
| 6. | When required to determine a proper fair value for the stock of a publicly-traded banking organization involved in an involuntary “cash out” transaction, many state statutes refer to the subject organization’s existing market price (the “stock market exception”), thereby recognizing the validity of utilizing publicly-traded bank stock market in determining an acceptable value for dissenting shareholders. |
However, when utilizing the market price data for publicly-traded companies to value the shares of a non-publicly traded company, it is absolutely imperative that adjustments be made to account for the variances,both financial and non-financial, that exist between the appraised company and the publicly-traded companies, particularly when those variances are substantial. Briefly, variances that might possibly exist between the appraised company and the publicly-traded companies include, but are not necessarily restricted to: (i) financial condition, (ii) earning performance, (iii) financial growth prospects, (iv) economic/demographic condition of the trade area(s), (v) competitive situation in the marketplace, (vi) management depth and experience, (vii) shareholder makeup and composition, (viii) differences in product line mix and/or product line limitations, (ix) size/nature/makeup of the franchise, and (x) ability to profitably employ developing technology.
xiii
CASH FAIR VALUE DISCUSSION & ANALYSIS
In this case, we have no record of any “arm’s-length” trades of the outstanding common stock of HCBI during the twelve months prior to the valuation date. We are therefore unable to utilize HCBI’s trading price data in determining a cash fair value for HCBI’s common shares.
Accordingly, the relative “thinness” of an effective market for the stock being appraised necessitates the consideration of substitute “comparable” markets for comparative purposes. Accordingly, our cash fair value analysis considers price-to-equity and price-to-earnings multiples of selected publicly-traded banking organizations sold within the Southern United States as of December 31, 2002. From the perspective of the market approach, we believe that the comparison of publicly-traded banking organizations (fully adjusted for all material differences, both financial and nonfinancial), represents the best determinant of cash fair value given that the prices at which the publicly-traded banking organizations trade do not represent a “control” price for those organizations.
As illustrated in the following table, utilizing the publicly-traded market price data that we mentioned previously and that is detailed in Section V of the adjoining information, we calculate aCore Equity Valueper share for HCBI of $41.12, based on December 31, 2002 core equity per share of $23.63 (equity capital prior to the addition/subtraction of unrealized gains/losses relating to “available-for-sale” securities). TheEarnings Valuesper share (a hybrid type of both market and investment value) were $32.99, based on 2002 earnings per share of $2.74; and, $31.96, based on projected 2003 earnings per share of $2.65 for HCBI. However, at this point, these values areunadjusted for the numerous financial and nonfinancial differences that always exist between the publicly-traded banking organizations and a typical smaller community banking organization such as HCBI.
DERIVATIONOF PRICE VALUESAND COMPARISON
OF RELATED FINANCIAL CHARACTERISTICS
HCBI | Southern U.S. Publicly-Traded Banking Organizations | Values | |||||||||||
Core Equity Capital Per Share | $ | 23.63 | * | 1.74x |
| = | $ | 41.12 | |||||
2002 Net Earnings Per Share | $ | 2.74 | * | 12.06x |
| = | $ | 32.99 | |||||
Est. 2003 Net Earnings Per Share | $ | 2.63 | * | 12.06x |
| = | $ | 31.66 | |||||
Core Equity/Total Assets |
| 8.49% | 7.28% |
|
| ··· | |||||||
2002 ROA |
| 1.01% | 1.12% | (1) |
| ··· | |||||||
2002 ROE |
| 11.84% | 15.19% | (1) |
| ··· | |||||||
| (1) | Represents trailing twelve-month period ending September 30, 2002 |
As we stated earlier, it is not uncommon for the averagefinancial performance characteristics of the selected publicly-traded banking organizations to vary, sometimes substantially, from those of HCBI. When the variances are significant for relevant financial condition and performance factors, adjustment of the values directly computed using the publicly-traded price multiples is appropriate when determining a reasonable cash fair value. Generally, the material financial criteria for HCBI and
xiv
CASH FAIR VALUE DISCUSSION & ANALYSIS
the selected comparable publicly-traded Southern United States banking organizations were as follows:
| · | Profitability—HCBI’s 2002 ROA of 1.01% was below the 1.12% average ROA for the selected publicly-traded Southern United States banking organizations for the twelve months ending September 30, 2002, suggesting aPreliminary Market Value ApproachCash Fair Valuethat equates to a price-to-earnings multiple exceeding than the 12.06x average for the selected publicly-traded banking organizations, assuming a similarity in all other material financial characteristics. |
| · | Capitalization—HCBI’s December 31, 2002 core common equity-to-assets ratio of 8.49% substantially exceeded the 7.28% average for the selected publicly-traded Southern United States banking organizations at September 30, 2002, suggesting aPreliminary Market Value ApproachCash Fair Valuewhich equates to a price-to-equity multiple well below the 1.74x average for the selected publicly-traded banking organizations, assuming a similarity in all other material financial characteristics. |
| · | Investment Return—HCBI’s 2002 ROE of 11.84% (the simultaneous consideration of both equity and earnings) was significantly lower than the 15.19% average ROE for the publicly-traded Southern United States banking organizations for the twelve months ending September 30, 2002, suggesting aPreliminary Market Value ApproachCash Fair Valuethat equates to a price-to-equity multiple considerably lower than the 1.74x average for the selected publicly-traded banking organizations, assuming a similarity in all other material financial characteristics. |
| · | Asset Quality—HCBI reported nonperforming assets equaling 0.09% of total assets as of December 31, 2002, comparing well below the 0.43% averaged by the selected publicly-traded Southern United States banking organizations at September 30, 2002. |
| · | Operational Efficiency—The selected publicly-traded Southern United States banking organizations which comprise our comparable market exhibit a slightly lower level of operational efficiency, as evidenced by the 59.65% efficiency ratio for those banking organizations during the twelve months ending September 30, 2002, as compared with the 56.68% recorded by HCBI for the twelve months ending December 31, 2002. Additionally, the comparable banking organizations reported average deposits per branch of $53.8 million at September 30, 2002, as compared with the $30.9 million for HCBI at December 31, 2002. |
Accordingly, basedsolely upon the initial Price Values derived by comparison with the publicly-traded Southern United States banking organizations (i.e., assuming an effective market in existence for the shares of HCBI), and considering only the financial differences mentioned previously, it is our opinion that thePreliminary Market Value ApproachCash Fair Valueper share for the shares of HCBI,excluding adjustments for the criteria subsequently presented in this discussion, equals $35.00.
PRELIMINARYMARKET VALUE APPROACH | |||
CASH FAIR VALUE PER SHARE | $ | 35.00 |
xv
CASH FAIR VALUE DISCUSSION & ANALYSIS
RELATED PRICE MULTIPLES & PRICE INDICES
Price Multiples: | |||||||||||||
Price-to-Core Equity | $ | 35.00 | / | $ | 23.63 |
| = | 1.48x | |||||
Price-to-Earnings (2002) | $ | 35.00 | / | $ | 2.74 |
| = | 12.80x | |||||
Price-to-Earnings (Est. 2003) | $ | 35.00 | / | $ | 2.63 |
| = | 13.33x | |||||
Price Indices: | |||||||||||||
Core Equity [(price/(equity multiple)) x (equity/assets)] |
| 1.48x | * |
| 8.49 | % | = | 12.57 | |||||
Earnings (2002) [(price/earnings multiple) x ROA] |
| 12.80x | * |
| 1.01 | % | = | 12.92 | |||||
Earnings (Est. 2003) [(price/earnings multiple) x ROA] |
| 13.33x | * |
| 0.92 | % | = | 12.27 | |||||
As previously noted, considerablenon-financial differences normally exist between the publicly-traded banking organizations and typical nonpublicly-traded community banking organizations such as HCBI. Excepting variances in balance sheet condition and income statement performance, these differences “differences in character” include:
| · | Higher sensitivity to economic movements |
| · | Lack of product, industry, and geographic diversification |
| · | Inability to quickly expand into new markets; commensurate lower growth prospects |
| · | Comparative competitive disadvantages with regard to technology and corresponding customer diversification |
| · | Lack of comparable economies of scale/cost disadvantages |
| · | Lack of comparable relationships with suppliers and customers |
| · | Higher key person management risk |
| · | Burdensome regulatory costs |
| · | Significantly less formalized internal controls |
| · | Limited infrastructure (lack of management depth and limited internal controls) |
| · | Potentially inconsistent dividend policy |
Accordingly, since we believe that HCBI possesses some of the characteristics described in the prior listing to a degree materially greater than the selected Southern United States publicly-traded banking organizations set forth in Section V, we conclude that theMarket Value ApproachCash Fair Value per share of HCBI stock is $33.00, assuming an effective and informed market existed for the shares of HCBI.
MARKET VALUE APPROACH
CASH FAIR VALUE PER SHARE | $33.00 |
xvi
CASH FAIR VALUE DISCUSSION & ANALYSIS
RELATED PRICE MULTIPLES & PRICE INDICES
Price Multiples: | |||||||||||||||
Price-to-Core Equity | $ | 33.00 | / | $ | 23.63 |
| = | 1.40x | |||||||
Price-to-Earnings (2002) | $ | 33.00 | / | $ | 2.74 |
| = | 12.06x | |||||||
Price-to-Earnings (Est. 2003) | $ | 33.00 | / | $ | 2.63 |
| = | 12.57x | |||||||
Price Indices: | |||||||||||||||
Core Equity [(price/(equity multiple)) x (equity/assets)] |
| 1.40x | * |
| 8.49 | % | = | 11.86 | |||||||
Earnings (2002) [(price/earnings multiple) x ROA] |
| 12.06x | * |
| 1.01 | % | = | 12.18 | |||||||
Earnings (Est. 2003) [(price/earnings multiple) x ROA] |
| 12.57x | * |
| 0.92 | % | = | 11.57 | |||||||
INVESTMENT VALUE
The investment or earnings value of any banking organization’s stock is, simply stated, an estimate of the present value of the future benefits, usually earnings, cash flow, or dividends, that will accrue to the stock. An earnings value is comprised of two major components: annual future earnings and an appropriate capitalization rate (the present value discount rate), and is defined by the following formula:
Present Value =S [valuesi/(1 + rate)i]
We believe the utilization of net earnings, rather than cash flows, for this investment value methodology is appropriate given the minimal level of long-term, non-earning investments typically held by a community banking organization. Thus, for most community banking organizations, the absence of significant investments in fixed assets, with the related small size of depreciation and/or amortization expense produces little variance between the net earnings and cash flow streams. Additionally, the utilization of net earnings in calculating the present value of benefits is a widely understood and accepted practice in the valuation of financial institutions.
Our twelve-year projections of the future performance of HCBI through 2013 as set forth in Section III, were based on our analysis of the banking industry, market area, and current financial condition of and historical levels of growth and earnings for HCBI, as well as information provided to us by the management of HCBI. In order to create a ninety-year earnings stream for HCBI, we applied the following growth rates to HCBI’s net earnings: 3.00% for the eighteen years following 2013, and 2.00% for the remaining sixty years. In consideration that the assumed investment horizon of likely buyers of HCBI’s shares is undefined, but is presumed to be long-term, the rate of growth applied to HCBI’s earnings must be one that could reasonably be expected to be sustained indefinitely. Over a prolonged period of time, it is practically impossible to sustain growth at a rate that exceeds the sum of the anticipated rate of inflation plus the expected overall population growth for the trade area(s), as further influenced by the presumed degree of competition from both current and future competitors. Accordingly, given the current rate of inflation and the existing interest rate environment, together with HCBI’s likely growth prospects, we believe the earnings growth rates we have assumed are reasonable and defensible. Indeed, the utilization of these growth rates produces annual net earnings that rise from $5.3 million during 2002 to $52.2 million by 2091.
xvii
CASH FAIR VALUE DISCUSSION & ANALYSIS
As set forth in Section IV of the adjoining information, the present value of these earnings projections for HCBI over ninety years, using a present value discount rate of 12.00% applied to the first ten years of the projection period, a 13.00% discount rate applied to the following ten years, and a 14.00% discount rate applied to the last seventy years of the ninety-year projection period, results in anInvestment Value of $30.66 per share. We believe these discount rates are appropriate given HCBI’s current financial condition, together with its recent financial performance. Indeed, our experience in valuing hundreds of community banking organizations and observing the prices paid for small blocks of those organizations over the past fifteen years indicate that a discount rate (financial required rate of return) between 12% to 17% is normally acceptable considering the risk-return relationship most investors have demanded for an investment in a small-to-medium community bank.
We recognize that in determining present values, other bank stock valuation firms sometimes use alternative projection period time horizons rather than our ninety-year Present Value in Perpetuity. We believe the calculation of a Present Value in Perpetuity, utilizing a ninety-year time frame, is reasonable, given the immaterial additional value per share of less than $0.01 produced during 2091. Additionally, the negligible additional value per share created beyond the ninety-year time-frame eliminates the need for a residual or terminal value in calculating a present value when utilizing the Present Value in Perpetuity methodology. While we recognize other bank valuation firms, in their computation of present value, sometimes utilize a residual value usually at the end of a five to ten year projection period, frequently using a price level indicator to derive the residual value, we are uncomfortable, based upon our extensive experience in appraising community bank stocks, in employing a residual value calculated at the end of a specific time frame in conjunction with a price level indicator—such as a price-to-equity multiple, price-to-earnings multiple or other specific price level indicator—given the highly erratic market price levels for bank stocks over the past ten to 15 years, and the corresponding price multiples and price indices, together with the uncertainty of the appraised bank achieving a single financial characteristic (equity or earnings level) at a particular point in time in the future.
However, in order to provide an alternative approach in determining an Investment Value, we utilized a residual or terminal value at the end of our initial twelve-year projection period which utilizes the following formula to derive a residual based upon an assumed long-term growth rate and an assumed fixed discount rate:
Residual Value = [Projected Earnings x (1 + Growth Rate)] / (Discount Rate – Growth Rate)
This alternative approach in calculating the Present Value is computed by adding the calculated Residual Value to the sum of the discounted cash flows for the first twelve periods. Therefore, employing a 13.00% discount rate and a 3.00% growth rate to calculate the Residual Value produces anInvestment Value of $31.07 per share for the shares of HCBI. Again, we note that we are comfortable with the 13.00% discount rate given HCBI’s current financial condition and performance, together with the projected financial performance. Additionally, we believe that the 3.00% growth rate must reflect the level of growth HCBI would likely be able to sustain growth given the anticipated rate of inflation plus the expected overall population growth for the trade area(s), combined with the presumed degree of competition from both current and future competitors.
Accordingly, given theInvestment Values of $30.66 per share calculated utilizing the Present Value in Perpetuity methodology, and $31.07 per share utilizing the Residual Value methodology, we believe anInvestment Value of $31.00 is appropriate.
xviii
CASH FAIR VALUE DISCUSSION & ANALYSIS
INVESTMENT VALUE APPROACH | ||
CASH FAIR VALUE PER SHARE | $31.00 |
CASH FAIR VALUE (EXCLUDING MARKETABILITY/ LIQUIDITY CONSTRAINTS)
When the net asset value, market value, and investment value approaches were appropriately considered and all other relevant valuation variables and factors analyzed, giving consideration to theMarket Value ApproachCash Fair Valueof $33.00 per share and theInvestment Value ApproachCash Fair Value of $31.00 per share, and after employing our substantial experience and judgment derived from having completed well over 1,000 appraisals for community banking organizations during the past fifteen years, and as a result of performing these appraisals, becoming specifically aware of the trading activity and price levels and trends that currently exist in community bank stocks, theCash Fair Value of shares of the outstanding common stock of Henderson Citizens Bancshares, Inc., as of December 31, 2002, was determined to be $32.00 per share,excluding the consideration of a marketability/liquidity discount to reflect the thinly traded market situation that exists for the shares of HCBI.
CASH FAIR VALUE PER SHARE (EXCLUDINGA MARKETABILITY/LIQUIDITY DISCOUNT) | $32.00 |
RELATED PRICE MULTIPLES & PRICE INDICES
Price Multiples: | ||||||||||||
Price-to-Core Equity | $ | 32.00 | / | $ | 23.63 | = | 1.35x | |||||
Price-to-Earnings (2002) | $ | 32.00 | / | $ | 2.74 | = | 11.70x | |||||
Price-to-Earnings (Est. 2003) | $ | 32.00 | / | $ | 2.63 | = | 12.19x | |||||
Price Indices: | ||||||||||||
Core Equity [(price/(equity multiple)) x (equity/assets)] |
| 1.35x | * |
| 8.49% | = | 11.50 | |||||
Earnings (2002) [(price/earnings multiple) x ROA] |
| 11.70x | * |
| 1.01% | = | 11.82 | |||||
Earnings (Est. 2003) [(price/earnings multiple) x ROA] |
| 12.19x | * |
| 0.92% | = | 11.21 |
MARKETABILITY/LIQUIDITY DISCOUNT
As mentioned previously, one of the definitional differences we have observed in reviewing the existing case law regarding “fair value” concerns the propriety of applying a “marketability/liquidity discount.” Accordingly, based on our experience, we have appraised the stock of HCBI using the two definitions of fair value which are the most common. Both of the two definitions consider the following: (i) that the appraised company continues to be owned by the current shareholders (i.e., the company is not liquidated or sold to a hypothetical new owner); and (ii) the appraised shares are to be valued as a proportionate interest in the appraised company operating as a going concern without any consideration of the increase or decrease in value that could potentially result from the proposed corporate action itself. However, the first definition includes the consideration of all relevant valuation methodologies and the analysis of all relevant criteria, both
xix
CASH FAIR VALUE DISCUSSION & ANALYSIS
financial and non-financial, that are properly considered in any valuation situation, recognizing that the appropriateness of these methodologies and criteria will be ultimately determined by the proper legal jurisdiction,but without consideration of a valuation technique commonly termed a marketability/liquidity discount (subsequently discussed in this report). Whereas, the second definition is similar in all respects to the first definition, but this definitionincludes the consideration of the marketability/liquidity constraints normally possessed by shares of stock of closely-held, community banking organizations such as HCBI; i.e.,a marketability/liquidity discount is utilized. More succinctly, the first definition is identical to the second definition with the exception that a marketability/liquidity discount isexcluded.
In our experience, the broad valuation methodologies/approaches used by appraisal experts to derive a fair value under each of these definitions of “fair value” are substantially similar; the primary difference being that the latter analysis incorporates the use of amarketability/liquidity discount. By way of definition, the marketability/liquidity discount simply recognizes the real-world actions of buyers and sellers of smaller blocks of stock in thinly traded companies. Indeed, it is indisputable that the per share prices at which shares of a thinly traded company are bought and sold are nearly always materially below those trading prices for an otherwise similar company that has an effective market for its shares, assuming minimal variance in all other financial and non-financial factors. Therefore, this valuation technique does not directly relate to the small size of the block(s) of stock being appraised, but rather reflects the “real world” market forces that actually exist for a particular company’s shares.
Notwithstanding that the marketability/liquidity discount simply reflects the reality of the market pricing for companies that possess a thin or nonexistent market for their shares, certain legal jurisdictions have held that the marketability/liquidity discount should not be considered in determining a fair and acceptable value for the dissenting shareholders’ stock ininvoluntary “cash out” transactions. We note that this position ignores the basis in fact that the real-world existence of the marketability/liquidity discount would have, in all likelihood, reduced the price the shareholders would have actually paid for the shares they own when the shares were originally acquired (by either themselves or those persons from whom they received said shares), thereby creating a potential financial windfall for the dissenting shareholders. Furthermore, the Office of the Comptroller of the Currency—when appraising shareholder positions of national banks in connection with dissenters’ rights proceedings as required under federal regulations—has included in its recent appraisals a discount to reflect the lack of liquidity/marketability that existed for the stock of the appraised national bank. However, notwithstanding that (i) the application of a liquidity/marketability discount is a widely-accepted valuation methodology in the vast majority of appraisal situations, and (ii) numerous case law decisions have directed that all normal and widely-accepted valuation techniques and methodologies should be utilized in deriving “fair value,” we must note that numerous recent “case-law” decisions, largely originating from various state courts, have not included this discount in ultimately determining a fair value conclusion.
As a result of our valuation of small blocks of stock of over 1,000 closely-held community banking organizations over the past fifteen years, we have observed that investors typically are willing to pay less for small blocks of closely-held, thinly-traded community banking organizations than they would pay for the same block of stock if an active market for the stock was in existence. This situation has resulted in appraisal experts using a marketability/liquidity discount to derive a value for such shares that reflects a relative lack of marketability/liquidity.
xx
CASH FAIR VALUE DISCUSSION & ANALYSIS
The application of a “marketability/liquidity” discount constitutes widely-utilized valuation methodology and practice within the appraisal community, and is clearly set forth and discussed in the three widely-accepted publications regarding the valuation of closely-held companies, and the valuation of financial institutions. The first publication, generally regarded as the “bible” of valuation publications, isVALUING A BUSINESS—The Analysis and Appraisal of Closely Held Companies1. The authors present the necessity for such a “marketability/liquidity” discount with the following statements:
| · | Ready marketability definitely adds value to a security. Conversely, lack of marketability detracts from the security’s value as compared to a security that is identical but marketable. In other words, the market pays a premium for liquidity or exacts a discount for lack of it.—Page 45 |
| · | Since ownership interests in closely held businesses do not, by definition, enjoy the ready market of a publicly traded stock, a share in a privately held company usually is worth less than an otherwise comparable share in a publicly held one.—Page 45 |
The second publication,Valuing Financial Institutions2, further supports the need for “marketability/liquidity” discounts with the following statements:
| · | The marketability discount is applied to a freely tradable valuation base to penalize a subject valuation interest for its comparative lack of marketability or liquidity. Theoretically, the marketability discount is that discount necessary to generate a sufficient increment in return to the holder of a minority interest of an entity’s closely-held shares to induce the purchaser to make this particular investment, rather than an alternative investment identical in all respects save marketability.—Page 202 |
| · | Marketability discounts can range from very small (in the range of 5-10 percent) to quite large (60-70 percent or more). The basic logic for the marketability discount lies in illiquidity and the inherent riskiness this implies; therefore, other things being the same, a marketable interest is worth more than a nonmarketable but otherwise identical interest.—Page 202 |
The third publication,Buying, Selling, & Merging Banks3, provides even further support for the necessity of a “marketability/liquidity” discount with the following statements:
| · | Marketability definitely adds value to a security; conversely, lack of marketability detracts from the value of a security. Since minority interests in closely held banks do not enjoy the ready market of publicly traded bank stock, this is a difference that must be considered when valuing an interest in a closely held business by reference to prices of publicly traded stocks.—Page 2-16 |
| · | There have been many court cases, especially those involving valuations for gift or estate tax purposes, that have taken a single lump discount (15 to 30 percent is the most common discount range) to reflect lack of marketability and other block discount factors. The importance of marketability in the valuation of minority blocks has gained increasing recognition over the years. Considerable evidence suggests that the discount for the lack of marketability for a closely held stock, compared with an otherwise similar publicly traded stock, can be significant.—Page 2-16 |
| 1 | Shannon P. Pratt, Robert F. Reilly, & Robert P. Schweihs,VALUING A BUSINESS—The Analysis & Appraisal of Closely Held Companies, 3rd ed. (McGraw-Hill, New York, New York) |
| 2 | Z. Christopher Mercer,Valuing Financial Institutions (Business One Irwin, Homewood, Illinois) |
| 3 | Various,Buying, Selling & Merging Banks©1990 (Sheshunoff Information Services, Inc., Austin, Texas) |
xxi
CASH FAIR VALUE DISCUSSION & ANALYSIS
Our substantial experience leads us to conclude, after directly observing thousands of arm’s-length purchases/sales of minority blocks of stock of community banking organizations (both with and without our involvement as appraisers), that without question, investors in smaller blocks of stock of thinly-traded, small-to-medium sized community banks consistently apply an effective “marketability/liquidity” discount to the values otherwise indicated through the use of the publicly-traded bank stock market values when pricing their purchases of minority blocks of small community banking organizations. Furthermore, our experience clearly indicates that the effective “marketability/liquidity” discounts applied by purchasers have historically ranged between 5%–30% for typical small-to-medium sized community banking organizations. Consequently, in light of the considerable evidence and support for the existence of marketability/liquidity discounts, under the second definition of fair value set forth on page iv of this discussion, we must quantify an appropriate and relevant marketability/liquidity discount to be applied to the $32.00Cash Fair Value(excluding a marketability/liquidity discount) per share in determining aCash Fair Value(including a marketability/liquidity discount) per share for HCBI.
We note that the average weekly trading volume (as a percentage of outstanding shares) for the selected publicly-traded Southern United States banking organizations corresponds to an annualized trading volume approximating 45% of total outstanding shares. Moreover, we again call attention to the complete absence of trading activity for the shares of HCBI. Accordingly, in recognition of the significant variance in marketability/liquidity for the shares of the subject banking organization as compared to the selected comparable publicly-traded banking organizations, we conclude that a marketability/liquidity discount of 10% is appropriate in this valuation circumstance.
CASH FAIR VALUE (INCLUDINGA MARKETABILITY/LIQUIDITY DISCOUNT)
Accordingly, the application of a 10% marketability/liquidity discount to the previously-determined $32.00Cash Fair Valueper share (excluding a marketability/liquidity discount) results in aCash Fair Valueper share (including a marketability/liquidity discount) for shares of the outstanding common stock of Henderson Citizens Bancshares, Inc., as of December 31, 2002, of $28.80 ($32.00 x 90%), rounded to $29.00 per share.
CASH FAIR VALUE PER SHARE (INCLUDINGA | $32.00 x 90% = $28.80 | |
MARKETABILITY/LIQUIDITY DISCOUNT) |
xxii
CASH FAIR VALUE DISCUSSION & ANALYSIS
RELATED PRICE MULTIPLES & PRICE INDICES
Price Multiples: | |||||||||||||
Price-to-Core Equity | $ | 28.80 | / | $ | 23.63 |
| = | 1.22x | |||||
Price-to-Earnings (2002) | $ | 28.80 | / | $ | 2.74 |
| = | 10.53x | |||||
Price-to-Earnings (Est. 2003) | $ | 28.80 | / | $ | 2.63 |
| = | 10.97x | |||||
Price Indices: | |||||||||||||
Core Equity [(price/(equity multiple)) x (equity/assets)] |
| 1.22x | * |
| 8.49 | % | = | 10.35 | |||||
Earnings (2002) [(price/earnings multiple) x ROA] |
| 10.53x | * |
| 1.01 | % | = | 10.63 | |||||
Earnings (Est. 2003) [(price/earnings multiple) x ROA] |
| 10.97x | * |
| 0.92 | % | = | 10.09 |
However, before determining a value congruent with either the $32.00Fully-Diluted Cash Fair Valueper share (excluding a marketability/liquidity discount) or the $29.00Fully-Diluted Cash Fair Valueper share (including a marketability/liquidity discount),you should consult with competent, experienced legal counsel regarding the propriety of applying a marketability/liquidity discount in setting a value in connection with the proposed transaction.
This analysis report is provided for the confidential, internal use of the Board of Directors of Henderson Citizens Bancshares, Inc.; and, without the prior written consent of The Bank Advisory Group, this report may not be quoted in whole or in part, or otherwise referred to in any report or document or furnished or otherwise communicated to any person, other than legal and tax advisors to Henderson Citizens Bancshares, Inc.
Respectfully submitted,
THE BANK ADVISORY GROUP, INC.
AUSTIN, TEXAS
FEBRUARY 12, 2003
xxiii
SECTION II
SUMMARY FINANCIAL ANALYSES—
HCBI & PEER:
SUMMARY COMPARATIVE ANALYSIS
Henderson Citizens Bncshrs
Henderson, Texas
PEER Comparative Analysis
Henderson Citizens Bncshrs | PEER Average | Differential | BHC Ratio as % of Peer Ratio | BHC versus Peer | |||||||||||
Weakness | Strength | ||||||||||||||
General Data |
| DEC 02 |
| SEP 02 | |||||||||||
Total Assets | $ | 555,062 | $ | 466,242 | |||||||||||
Total Deposits | $ | 494,952 | $ | 385,033 | |||||||||||
Ln&Lse:Net Unearned Income | $ | 230,329 | $ | 273,974 | |||||||||||
Loans/Assets |
| 41.50% |
| 58.76% | -17.27% | 71% |
| nn | |||||||
Loans/Deposits |
| 46.54% |
| 71.16% | -24.62% | 65% |
| nnn | |||||||
Leverage Capital (Tier 1) | $ | 36,338 | $ | 45,566 | |||||||||||
Total Equity Capital | $ | 48,287 | $ | 46,763 | |||||||||||
# of Full-Time Equiv Employees |
| 257 |
| 178 | |||||||||||
Total Number of Locations (most recent) |
| 16 |
| — | |||||||||||
Asset Quality & Capital Adequacy |
| DEC 02 |
| SEP 02 | |||||||||||
Nonperf Assets/Total Assets |
| 0.09% |
| 0.64% | -0.55% | 14% |
| nnnnn | |||||||
Nonperf Assets/EqtyCap&LLR |
| 0.97% |
| 5.94% | -4.98% | 16% |
| nnnnn | |||||||
Net Charge-Offs(YTD)/Average Loans |
| 0.37% |
| 0.30% | 0.07% | 124% |
| nn | |||||||
Loan Loss Reserve/TL |
| 1.50% |
| 1.29% | 0.20% | 116% |
| nn | |||||||
Loan Loss Reserve/Nonperf Loans |
| 798.61% |
| 136.71% | 661.90% | 584% |
| nnnnn | |||||||
Total Equity Capital/Total Assets |
| 8.70% |
| 10.03% | -1.33% | 87% |
| n | |||||||
Core Equity/Total Assets (net AFS Sec’s) |
| 8.49% |
| 9.68% | -1.19% | 88% |
| n | |||||||
| DEC 01 |
| DEC 01 | ||||||||||||
Nonperf Assets/EqtyCap&LLR |
| 0.53% |
| 6.60% | -6.07% | 8 % |
| nnnnn | |||||||
Net Charge-Offs(YTD)/Average Loans |
| 0.22% |
| 0.39% | -0.17% | 56% |
| nnn | |||||||
Profitability Overview |
| DEC 02 |
| SEP 02 | |||||||||||
Net Income (Loss) | $ | 5,455 | $ | 3,878 | |||||||||||
Return on Avg Assets |
| 1.01% |
| 1.17% | -0.16% | 86% |
| n | |||||||
Return on Avg Equity |
| 11.84% |
| 11.70% | 0.15% | 101% |
| n | |||||||
| DEC 01 |
| DEC 01 | ||||||||||||
Net Income (Loss) | $ | 4,366 | $ | 4,061 | |||||||||||
Return on Avg Assets |
| 0.92% |
| 1.03% | -0.11% | 89% |
| n | |||||||
Income Stmt as a % of Average Assets |
| DEC 02 |
| SEP 02 | |||||||||||
Total Interest Income |
| 5.15% |
| 6.00% | -0.84% | 86% |
| n | |||||||
Total Interest Expense |
| 2.05% |
| 2.17% | -0.12% | 94% |
| n | |||||||
Net Interest Income |
| 3.10% |
| 3.82% | -0.72% | 81% |
| nn | |||||||
Prov for Loan & Lease Losses |
| 0.20% |
| 0.28% | -0.09% | 70% |
| nnn | |||||||
Total Noninterest Income |
| 1.67% |
| 1.10% | 0.57% | 152% |
| nnnn | |||||||
Nonint Exp:Sal & Emp Benefits |
| 2.11% |
| 1.62% | 0.49% | 130% |
| nnn | |||||||
Nonint Exp:Fixed Assets |
| 0.45% |
| 0.45% | -0.01% | 98% |
| n | |||||||
Nonint Exp:Other |
| 0.94% |
| 0.88% | 0.06% | 107% |
| n | |||||||
Total Noninterest Expense |
| 3.50% |
| 2.95% | 0.55% | 119% |
| nn | |||||||
Net Noninterest Expense |
| 1.83% |
| 1.85% | -0.02% | 99% |
| n | |||||||
Pre-Tax Operating Income |
| 1.08% |
| 1.69% | -0.61% | 64% |
| nnn | |||||||
Gain(Loss) on Securities |
| 0.21% |
| 0.04% | 0.17% | 512% |
| **** | **** | ||||||
Inc Bef Tax & Other Adj |
| 1.29% |
| 1.73% | -0.44% | 74% |
| nn | |||||||
Applicable Income Taxes |
| 0.28% |
| 0.53% | -0.25% | 52% |
| nnnn | |||||||
Minority Interest |
| 0.00% |
| 0.03% | -0.03% | 0 % |
| **** | **** | ||||||
Extraordinary Items, Net |
| 0.00% |
| 0.00% | 0.00% | N/D |
| **** | **** | ||||||
Net Income (Loss) |
| 1.01% |
| 1.16% | -0.16% | 87 | % | n | |||||||
**** Not Assessed for Strength/Weakness
N/D Strength/Weakness Was Not Determinable
PEER: 27 Arkansas, Louisiana, Oklahoma and Texas C corporation companies with total assets between
$350 million to $750 million
See Next Page for Ranking Parameters
1
Henderson Citizens Bncshrs
Henderson, Texas
PEER Comparative Analysis
Henderson Citizens Bncshrs | PEER Average | Differential | BHC Ratio as % of Peer Ratio | BHC versus Peer | ||||||||||||
Weakness | Strength | |||||||||||||||
Efficiency | DEC02 |
| SEP02 |
| ||||||||||||
Efficiency Ratio | 72.29 | % | 58.76 | % | 13.53 | % | 123 | % | nn | |||||||
Net Noninterest Expense/AA | 1.83 | % | 1.85 | % | -0.02 | % | 99 | % | n | |||||||
Service Charges on Deposit Accts/AA | 0.91 | % | 0.64 | % | 0.26 | % | 141 | % | nnn | |||||||
Noninterest Income/Overhead Exp | 47.71 | % | 37.23 | % | 10.49 | % | 128 | % | nn | |||||||
Operating Income per $ of S&B Expense | $0.60 |
| $1.22 |
| -$0.62 |
| 49 | % | nnnn | |||||||
Operating Income/Avg FTE | $27,502 |
| $50,272 |
| -$22,770 |
| 55 | % | nnnn | |||||||
Salaries & Benefits/Avg Employees$ | $45,619 |
| $41,264 |
| $4,355 |
| 111 | % | n | |||||||
Total Deposits per Employee $(000) | $1,926 |
| $2,161 |
| -$235 |
| 89 | % | n | |||||||
Total Assets per Employee $(000) | $2,160 |
| $2,617 |
| -$457 |
| 83 | % | nn | |||||||
Yields & Rates | DEC02 |
| SEP02 |
| ||||||||||||
Yield on Loans | 7.14 | % | 7.61 | % | -0.46 | % | 94 | % | n | |||||||
Yield on Securities | 4.41 | % | 4.95 | % | -0.54 | % | 89 | % | n | |||||||
Cost of Deposits | 2.27 | % | 2.39 | % | -0.12 | % | 95 | % | n | |||||||
Asset Mix (as % of Assets) | DEC02 |
| SEP02 |
| ||||||||||||
Total Nonearning Assets | 8.15 | % | 8.63 | % | -0.48 | % | 94 | % | n | |||||||
—Premises & Fixed Assets | 2.08 | % | 2.27 | % | -0.19 | % | 92 | % | n | |||||||
—Other Real Estate Owned | 0.01 | % | 0.13 | % | -0.12 | % | 9 | % | nnnnn | |||||||
—Intangible Assets | 1.94 | % | 0.47 | % | 1.48 | % | 416 | % | nnnnn | |||||||
Ln&Lse:Net Unearned Income | 41.50 | % | 58.76 | % | -17.27 | % | 71 | % | nn | |||||||
Securities | 48.58 | % | 30.07 | % | 18.51 | % | 162 | % | **** | **** | ||||||
Interest-Bearing Cash, FFS & Sec Purch | 2.40 | % | 3.30 | % | -0.90 | % | 73 | % | nn | |||||||
Loan Mix (as % of Loans) | DEC02 |
| SEP02 |
| ||||||||||||
Real Estate Loans/GL | 56.68 | % | 64.11 | % | -7.43 | % | 88 | % | **** | **** | ||||||
—Domestic Construction Loans/GL | 2.47 | % | 8.10 | % | -5.63 | % | 31 | % | **** | **** | ||||||
—Domestic Farmland Loans/GL | 3.23 | % | 3.27 | % | -0.04 | % | 99 | % | **** | **** | ||||||
—Domestic Home Mortgage Loans/GL | 34.14 | % | 28.33 | % | 5.81 | % | 121 | % | **** | **** | ||||||
—Domestic Home Equity Loans/GL | 0.00 | % | 0.18 | % | -0.18 | % | 0 | % | **** | **** | ||||||
—Domestic 5+ Family Resdntl Loans/GL | 0.36 | % | 1.33 | % | -0.98 | % | 27 | % | **** | **** | ||||||
—Domestic Commercial RE Loans/GL | 16.49 | % | 22.91 | % | -6.42 | % | 72 | % | **** | **** | ||||||
Domestic Comml & Indust Lns/GL | 13.96 | % | 16.60 | % | -2.64 | % | 84 | % | **** | **** | ||||||
Domestic Agricultural Loans/GL | 3.33 | % | 3.32 | % | 0.01 | % | 100 | % | **** | **** | ||||||
Domestic Consumer Loans/GL | 15.48 | % | 14.14 | % | 1.33 | % | 109 | % | **** | **** | ||||||
—Credit Card Loans/GL | 0.32 | % | 0.77 | % | -0.44 | % | 42 | % | **** | **** | ||||||
Deposit Mix (as % of Deposits) | DEC02 |
| SEP02 |
| ||||||||||||
Demand Deposits/TD | 15.37 | % | 12.29 | % | 3.08 | % | 125 | % | nn | |||||||
MMDA & Other Savings Deposits/TD | 32.65 | % | 28.10 | % | 4.55 | % | 116 | % | **** | **** | ||||||
<$100,000 Time Deposits/TD | 32.33 | % | 28.03 | % | 4.30 | % | 115 | % | **** | **** | ||||||
$100,000+ Time Deposits/TD | 18.83 | % | 21.49 | % | -2.67 | % | 88 | % | n | |||||||
NOW & Other Transaction Accounts/TD | 0.83 | % | 10.08 | % | -9.26 | % | 8 | % | **** | **** | ||||||
**** Not Assessed for Strength/Weakness
N/D Strength/Weakness Was Not Determinable
PEER: 27 Arkansas, Louisiana, Oklahoma and Texas C corporation companies with total assets between
$350 million to $750 million
Ranking Parameters (BHC vs. Peer) | ||
>85% or <115% | n | |
>70% or <130% | nn | |
>55% or <145% | nnn | |
>40% or <160% | nnnn | |
<40% or >160% | nnnnn | |
2
HISTORICAL COMPARATIVE ANALYSIS
Henderson Citizens Bncshrs
Henderson, Texas
Historical Comparative Analysis
Balance Sheet |
| DEC02 |
|
| DEC01 |
|
| DEC00 |
|
| DEC99 |
|
| DEC98 |
|
| DEC97 |
| ||||||
Cash & Due from Depository Inst | $ | 17,994 |
| $ | 26,336 |
| $ | 21,789 |
| $ | 29,397 |
| $ | 26,667 |
| $ | 17,098 |
| ||||||
Secs:Held-to-Maturity |
| 85,361 |
|
| 57,170 |
|
| 51,245 |
|
| 60,579 |
|
| 74,537 |
|
| 69,234 |
| ||||||
Secs:Available-for-Sale |
| 184,274 |
|
| 185,410 |
|
| 155,693 |
|
| 131,675 |
|
| 130,886 |
|
| 148,741 |
| ||||||
Securities |
| 269,635 |
|
| 242,580 |
|
| 206,938 |
|
| 192,254 |
|
| 205,423 |
|
| 217,975 |
| ||||||
Fed Funds Sold & Sec Purchased |
| 11,410 |
|
| 16,860 |
|
| 4,205 |
|
| 9,285 |
|
| 10,230 |
|
| 5,040 |
| ||||||
Ln&Lse:Net Unearned Income |
| 230,329 |
|
| 215,870 |
|
| 172,237 |
|
| 146,397 |
|
| 130,964 |
|
| 107,316 |
| ||||||
Allow for Loan & Lease Loss |
| 3,450 |
|
| 3,205 |
|
| 2,355 |
|
| 2,200 |
|
| 1,701 |
|
| 1,249 |
| ||||||
Trading Assets |
| — |
|
| — |
|
| — |
|
| — |
|
| — |
|
| — |
| ||||||
Premises & Fixed Assets |
| 11,568 |
|
| 11,302 |
|
| 8,431 |
|
| 7,032 |
|
| 6,202 |
|
| 5,209 |
| ||||||
Other Real Estate Owned |
| 68 |
|
| 90 |
|
| 10 |
|
| 150 |
|
| 125 |
|
| 186 |
| ||||||
Investment in Unconsolidated Sub |
| — |
|
| — |
|
| — |
|
| 814 |
|
| 573 |
|
| 503 |
| ||||||
Customers Liability on Accept |
| — |
|
| — |
|
| — |
|
| — |
|
| — |
|
| — |
| ||||||
Intangible Assets |
| 10,787 |
|
| 9,395 |
|
| 4,087 |
|
| 3,709 |
|
| 4,087 |
|
| 1,505 |
| ||||||
All Other Assets |
| 6,721 |
|
| 8,785 |
|
| 8,332 |
|
| 6,608 |
|
| 4,349 |
|
| 4,910 |
| ||||||
Total Assets | $ | 555,062 |
| $ | 528,013 |
| $ | 423,674 |
| $ | 393,446 |
| $ | 386,919 |
| $ | 358,493 |
| ||||||
Total Deposits |
| 494,952 |
|
| 473,730 |
|
| 379,122 |
|
| 355,423 |
|
| 345,720 |
|
| 322,107 |
| ||||||
Fed Funds Purch & Sec Sold |
| — |
|
| — |
|
| — |
|
| — |
|
| — |
|
| — |
| ||||||
Trading Liabilities |
| — |
|
| — |
|
| — |
|
| — |
|
| — |
|
| — |
| ||||||
Commercial Paper |
| — |
|
| — |
|
| — |
|
| — |
|
| — |
|
| — |
| ||||||
Other Liabs for Borrowed Money |
| 4,913 |
|
| 4,097 |
|
| 1,148 |
|
| — |
|
| 2,282 |
|
| 844 |
| ||||||
Subordinated Notes & Debs |
| — |
|
| — |
|
| — |
|
| — |
|
| — |
|
| — |
| ||||||
Banks Liab on Acceptances |
| — |
|
| — |
|
| — |
|
| — |
|
| — |
|
| — |
| ||||||
Other Liabilities |
| 6,910 |
|
| 6,306 |
|
| 4,282 |
|
| 2,252 |
|
| 3,006 |
|
| 2,813 |
| ||||||
Minority Interest & Similar Items |
| — |
|
| — |
|
| — |
|
| — |
|
| — |
|
| — |
| ||||||
Total Liabilities & Minority Int |
| 506,775 |
|
| 484,133 |
|
| 384,552 |
|
| 357,675 |
|
| 351,008 |
|
| 325,764 |
| ||||||
Limited-Life Preferred Stk |
| — |
|
| — |
|
| — |
|
| — |
|
| — |
|
| — |
| ||||||
Perpetual Preferred Stock |
| — |
|
| — |
|
| — |
|
| — |
|
| — |
|
| — |
| ||||||
Common Stock |
| 10,800 |
|
| 10,800 |
|
| 10,800 |
|
| 10,800 |
|
| 10,800 |
|
| 10,800 |
| ||||||
Capital Surplus |
| 5,400 |
|
| 5,400 |
|
| 5,400 |
|
| 5,400 |
|
| 5,400 |
|
| 5,400 |
| ||||||
Retained Earnings |
| 33,342 |
|
| 29,189 |
|
| 25,894 |
|
| 23,628 |
|
| 21,089 |
|
| 18,875 |
| ||||||
Tier1:Net Unrd Gn (Ls) on AVS Secs |
| 1,162 |
|
| 903 |
|
| (575 | ) |
| (1,938 | ) |
| 649 |
|
| (335 | ) | ||||||
Other Equity Capital Components |
| (2,417 | ) |
| (2,412 | ) |
| (2,397 | ) |
| (2,119 | ) |
| (2,027 | ) |
| (2,011 | ) | ||||||
Total Equity Capital |
| 48,287 |
|
| 43,880 |
|
| 39,122 |
|
| 35,771 |
|
| 35,911 |
|
| 32,729 |
| ||||||
Total Liab & Equity Cap | $ | 555,062 |
| $ | 528,013 |
| $ | 423,674 |
| $ | 393,446 |
| $ | 386,919 |
| $ | 358,493 |
| ||||||
Income Statement |
| DEC02 |
|
| DEC01 |
|
| DEC00 |
|
| DEC99 |
|
| DEC98 |
|
| DEC97 |
| ||||||
Total Interest Income | $ | 27,897 |
| $ | 28,861 |
| $ | 25,527 |
| $ | 23,166 |
| $ | 22,234 |
| $ | 22,266 |
| ||||||
Total Interest Expense |
| 11,102 |
|
| 15,062 |
|
| 14,015 |
|
| 11,576 |
|
| 11,377 |
|
| 11,545 |
| ||||||
Net Interest Income |
| 16,795 |
|
| 13,799 |
|
| 11,512 |
|
| 11,590 |
|
| 10,857 |
|
| 10,721 |
| ||||||
Prov for Loan & Lease Losses |
| 1,065 |
|
| 777 |
|
| 290 |
|
| 354 |
|
| 623 |
|
| 330 |
| ||||||
Total Noninterest Income |
| 9,037 |
|
| 7,323 |
|
| 6,268 |
|
| 5,226 |
|
| 4,461 |
|
| 3,099 |
| ||||||
Nonint Exp:Sal & Emp Benefits |
| 11,432 |
|
| 9,179 |
|
| 7,998 |
|
| 6,961 |
|
| 6,296 |
|
| 5,601 |
| ||||||
Nonint Exp:Fixed Assets |
| 2,409 |
|
| 2,151 |
|
| 1,770 |
|
| 1,541 |
|
| 1,264 |
|
| 1,039 |
| ||||||
Nonint Exp:Amortization & Impairment |
| 527 |
|
| 321 |
|
| — |
|
| — |
|
| — |
|
| — |
| ||||||
Nonint Exp:Other |
| 4,572 |
|
| 3,608 |
|
| 3,545 |
|
| 3,509 |
|
| 3,053 |
|
| 2,626 |
| ||||||
Total Noninterest Expense |
| 18,940 |
|
| 15,259 |
|
| 13,313 |
|
| 12,011 |
|
| 10,613 |
|
| 9,266 |
| ||||||
Pre-Tax Operating Income |
| 5,827 |
|
| 5,086 |
|
| 4,177 |
|
| 4,451 |
|
| 4,082 |
|
| 4,224 |
| ||||||
Gain (Loss) on Securities |
| 1,134 |
|
| 65 |
|
| — |
|
| 187 |
|
| 292 |
|
| 191 |
| ||||||
Inc Bef Tax & Other Adj |
| 6,961 |
|
| 5,151 |
|
| 4,177 |
|
| 4,638 |
|
| 4,374 |
|
| 4,415 |
| ||||||
Applicable Income Taxes |
| 1,506 |
|
| 785 |
|
| 552 |
|
| 730 |
|
| 868 |
|
| 1,025 |
| ||||||
Minority Interest |
| — |
|
| — |
|
| — |
|
| — |
|
| — |
|
| — |
| ||||||
Extraordinary Items, Net |
| — |
|
| — |
|
| — |
|
| — |
|
| — |
|
| — |
| ||||||
Net Income (Loss) | $ | 5,455 |
| $ | 4,366 |
| $ | 3,625 |
| $ | 3,908 |
| $ | 3,506 |
| $ | 3,390 |
| ||||||
3
Henderson Citizens Bncshrs
Henderson, Texas
Historical Comparative Analysis
Income Stmt as a % of Average Assets |
| DEC02 |
| DEC01 |
| DEC00 |
| DEC99 |
| DEC98 |
| DEC97 | ||||||
Total Interest Income |
| 5.15% |
| 6.05% |
| 6.34% |
| 6.01% |
| 6.15% |
| 6.30% | ||||||
Total Interest Expense |
| 2.05% |
| 3.16% |
| 3.48% |
| 3.00% |
| 3.15% |
| 3.27% | ||||||
Net Interest Income |
| 3.10% |
| 2.89% |
| 2.86% |
| 3.01% |
| 3.00% |
| 3.04% | ||||||
Prov for Loan & Lease Losses |
| 0.20% |
| 0.16% |
| 0.07% |
| 0.09% |
| 0.17% |
| 0.09% | ||||||
Total Noninterest Income |
| 1.67% |
| 1.54% |
| 1.56% |
| 1.36% |
| 1.23% |
| 0.88% | ||||||
Nonint Exp:Sal & Emp Benefits |
| 2.11% |
| 1.92% |
| 1.99% |
| 1.81% |
| 1.74% |
| 1.59% | ||||||
Nonint Exp:Fixed Assets |
| 0.45% |
| 0.45% |
| 0.44% |
| 0.40% |
| 0.35% |
| 0.29% | ||||||
Nonint Exp:Other |
| 0.94% |
| 0.82% |
| 0.88% |
| 0.91% |
| 0.84% |
| 0.74% | ||||||
Total Noninterest Expense |
| 3.50% |
| 3.20% |
| 3.31% |
| 3.12% |
| 2.94% |
| 2.62% | ||||||
Net Noninterest Expense |
| 1.83% |
| 1.66% |
| 1.75% |
| 1.76% |
| 1.70% |
| 1.75% | ||||||
Pre-Tax Operating Income |
| 1.08% |
| 1.07% |
| 1.04% |
| 1.15% |
| 1.13% |
| 1.20% | ||||||
Gain (Loss) on Securities |
| 0.21% |
| 0.01% |
| 0.00% |
| 0.05% |
| 0.08% |
| 0.05% | ||||||
Inc Bef Tax & Other Adj |
| 1.29% |
| 1.08% |
| 1.04% |
| 1.20% |
| 1.21% |
| 1.25% | ||||||
Applicable Income Taxes |
| 0.28% |
| 0.16% |
| 0.14% |
| 0.19% |
| 0.24% |
| 0.29% | ||||||
Minority Interest |
| 0.00% |
| 0.00% |
| 0.00% |
| 0.00% |
| 0.00% |
| 0.00% | ||||||
Extraordinary Items, Net |
| 0.00% |
| 0.00% |
| 0.00% |
| 0.00% |
| 0.00% |
| 0.00% | ||||||
Net Income (Loss) |
| 1.01% |
| 0.92% |
| 0.90% |
| 1.01% |
| 0.97% |
| 0.96% | ||||||
Return on Avg Equity (ROE) |
| 11.84% |
| 10.44% |
| 9.87% |
| 10.99% |
| 10.19% |
| 10.40% | ||||||
Yields & Rates |
| DEC02 |
| DEC01 |
| DEC00 |
| DEC99 |
| DEC98 |
| DEC97 | ||||||
Yield on Loans |
| 7.14% |
| 8.15% |
| 8.22% |
| 8.03% |
| 8.20% |
| 8.09% | ||||||
Yield on Securities |
| 4.41% |
| 5.37% |
| 5.67% |
| 5.42% |
| 5.66% |
| 5.81% | ||||||
Cost of Deposits |
| 2.27% |
| 3.50% |
| 3.86% |
| 3.33% |
| 3.51% |
| 3.62% | ||||||
Efficiency |
| DEC02 |
| DEC01 |
| DEC00 |
| DEC99 |
| DEC98 |
| DEC97 | ||||||
Efficiency Ratio |
| 72.29% |
| 66.98% |
| 68.59% |
| 65.34% |
| 64.29% |
| 62.66% | ||||||
Net Noninterest Expense/AA |
| 1.83% |
| 1.66% |
| 1.75% |
| 1.76% |
| 1.70% |
| 1.75% | ||||||
Service Charges on Deposit Accts/AA |
| 0.91% |
| 0.80% |
| 0.73% |
| 0.72% |
| 0.62% |
| 0.41% | ||||||
Noninterest Income/Overhead Exp |
| 47.71% |
| 47.99% |
| 47.08% |
| 43.51% |
| 42.03% |
| 33.44% | ||||||
Operating Income per $ of S&B Expense | $ | 0.60 | $ | 0.64 | $ | 0.56 | $ | 0.69 | $ | 0.75 | $ | 0.81 | ||||||
Operating Income/Avg FTE | $ | 27,502 | $ | 27,919 | $ | 24,146 | $ | 28,669 | $ | 30,277 | $ | 31,277 | ||||||
Salaries & Benefits/Avg Employees $ | $ | 45,619 | $ | 43,710 | $ | 43,232 | $ | 41,533 | $ | 40,515 | $ | 38,468 | ||||||
Total Deposits per Employee $(000) | $ | 1,926 | $ | 2,007 | $ | 1,975 | $ | 2,078 | $ | 2,083 | $ | 2,133 | ||||||
Total Assets per Employee $(000) | $ | 2,160 | $ | 2,237 | $ | 2,207 | $ | 2,301 | $ | 2,331 | $ | 2,374 | ||||||
Asset Quality & Capital Adequacy |
| DEC02 |
| DEC01 |
| DEC00 |
| DEC99 |
| DEC98 |
| DEC97 | ||||||
Nonperf Assets/Total Assets |
| 0.09% |
| 0.05% |
| 0.06% |
| 0.05% |
| 0.06% |
| 0.11% | ||||||
Nonperf Assets/Eqty Cap & LLR |
| 0.97% |
| 0.53% |
| 0.65% |
| 0.48% |
| 0.63% |
| 1.11% | ||||||
Nonperforming Loans/GL |
| 0.19% |
| 0.07% |
| 0.15% |
| 0.12% |
| 0.08% |
| 0.18% | ||||||
Restructured:Loans & Leases/GL |
| 0.00% |
| 0.00% |
| 0.71% |
| 0.00% |
| 0.05% |
| 0.00% | ||||||
Net Charge-Offs(YTD)/Average Loans |
| 0.37% |
| 0.22% |
| 0.09% |
| -0.10% |
| 0.29% |
| 0.22% | ||||||
Loan Loss Reserve/TL |
| 1.50% |
| 1.48% |
| 1.37% |
| 1.50% |
| 1.30% |
| 1.16% | ||||||
Loan Loss Reserve/Nonperf Loans |
| 798.61% |
| 2028.48% |
| 905.77% |
| 1202.19% |
| 1532.43% |
| 650.52% | ||||||
Total Equity Capital/Total Assets |
| 8.70% |
| 8.31% |
| 9.23% |
| 9.09% |
| 9.28% |
| 9.13% | ||||||
Core Equity/Total Assets (net AFS Sec’s) |
| 8.49% |
| 8.14% |
| 9.37% |
| 9.58% |
| 9.11% |
| 9.22% | ||||||
Loans/Assets |
| 41.50% |
| 40.88% |
| 40.65% |
| 37.21% |
| 33.85% |
| 29.94% | ||||||
Growth Rates: Trailing Twelve Months |
| DEC02 |
| DEC01 |
| DEC00 |
| DEC99 |
| DEC98 |
| DEC97 | ||||||
%CH:Ln&Lse:Net Unearned Income |
| 6.70% |
| 25.33% |
| 17.65% |
| 11.78% |
| 22.04% |
| 5.24% | ||||||
%CH:Securities |
| 11.15% |
| 17.22% |
| 7.64% |
| -6.41% |
| -5.76% |
| -4.46% | ||||||
%CH:Total Assets |
| 5.12% |
| 24.63% |
| 7.68% |
| 1.69% |
| 7.93% |
| 0.47% | ||||||
%CH:Total Deposits |
| 4.48% |
| 24.95% |
| 6.67% |
| 2.81% |
| 7.33% |
| 0.45% | ||||||
%CH:Total Equity Capital |
| 10.04% |
| 12.16% |
| 9.37% |
| -0.39% |
| 9.72% |
| 2.32% | ||||||
Miscellaneous Items |
| DEC02 |
| DEC01 |
| DEC00 |
| DEC99 |
| DEC98 |
| DEC97 | ||||||
Total Cash Dividends Declared $(000) | $ | 1,357 | $ | 10,917 | $ | 1,359 | $ | 1,370 | $ | 1,291 | $ | 1,341 | ||||||
Dividends Declared/Net Income |
| 24.88% |
| 250.05% |
| 37.49% |
| 35.06% |
| 36.82% |
| 39.56% | ||||||
Effective Tax Rate |
| 21.63% |
| 15.24% |
| 13.22% |
| 15.74% |
| 19.84% |
| 23.22% |
4
Henderson Citizens Bncshrs
Henderson, Texas
PEER Historical Comparative Analysis
Income Stmt as a % of Average Assets |
| SEP02 |
|
| DEC01 |
|
| DEC00 |
|
| DEC99 |
|
| DEC98 |
|
| DEC97 |
| ||||||
Total Interest Income |
| 6.00 | % |
| 7.04 | % |
| 7.55 | % |
| 7.12 | % |
| 7.44 | % |
| 7.82 | % | ||||||
Total Interest Expense |
| 2.17 | % |
| 3.27 | % |
| 3.61 | % |
| 3.19 | % |
| 3.41 | % |
| 3.58 | % | ||||||
Net Interest Income |
| 3.82 | % |
| 3.78 | % |
| 3.94 | % |
| 3.93 | % |
| 4.04 | % |
| 4.23 | % | ||||||
Prov for Loan & Lease Losses |
| 0.28 | % |
| 0.34 | % |
| 0.26 | % |
| 0.21 | % |
| 0.21 | % |
| 0.22 | % | ||||||
Total Noninterest Income |
| 1.10 | % |
| 1.10 | % |
| 1.00 | % |
| 0.98 | % |
| 0.95 | % |
| 0.94 | % | ||||||
Nonint Exp:Sal & Emp Benefits |
| 1.62 | % |
| 1.64 | % |
| 1.64 | % |
| 1.58 | % |
| 1.54 | % |
| 1.54 | % | ||||||
Nonint Exp:Fixed Assets |
| 0.45 | % |
| 0.46 | % |
| 0.46 | % |
| 0.45 | % |
| 0.45 | % |
| 0.44 | % | ||||||
Nonint Exp:Other |
| 0.88 | % |
| 0.94 | % |
| 0.96 | % |
| 1.00 | % |
| 0.97 | % |
| 0.98 | % | ||||||
Total Noninterest Expense |
| 2.95 | % |
| 3.04 | % |
| 3.05 | % |
| 3.02 | % |
| 2.96 | % |
| 2.96 | % | ||||||
Net Noninterest Expense |
| 1.85 | % |
| 1.95 | % |
| 2.05 | % |
| 2.04 | % |
| 2.01 | % |
| 2.03 | % | ||||||
Pre-Tax Operating Income |
| 1.69 | % |
| 1.49 | % |
| 1.63 | % |
| 1.68 | % |
| 1.81 | % |
| 1.98 | % | ||||||
Gain(Loss) on Securities |
| 0.04 | % |
| 0.05 | % |
| 0.00 | % |
| 0.01 | % |
| 0.03 | % |
| 0.02 | % | ||||||
Inc Bef Tax & Other Adj |
| 1.73 | % |
| 1.54 | % |
| 1.63 | % |
| 1.69 | % |
| 1.84 | % |
| 2.00 | % | ||||||
Applicable Income Taxes |
| 0.53 | % |
| 0.47 | % |
| 0.51 | % |
| 0.51 | % |
| 0.57 | % |
| 0.62 | % | ||||||
Minority Interest |
| 0.03 | % |
| 0.03 | % |
| 0.02 | % |
| 0.01 | % |
| 0.01 | % |
| 0.01 | % | ||||||
Extraordinary Items, Net |
| 0.00 | % |
| 0.00 | % |
| 0.00 | % |
| 0.00 | % |
| 0.00 | % |
| 0.00 | % | ||||||
Net Income (Loss) |
| 1.16 | % |
| 1.03 | % |
| 1.10 | % |
| 1.17 | % |
| 1.27 | % |
| 1.38 | % | ||||||
Return on Avg Equity (ROE) |
| 11.70 | % |
| 10.09 | % |
| 10.89 | % |
| 11.72 | % |
| 12.02 | % |
| 12.81 | % | ||||||
Yields & Rates |
| SEP02 |
|
| DEC01 |
|
| DEC00 |
|
| DEC99 |
|
| DEC98 |
|
| DEC97 |
| ||||||
Yield on Loans |
| 7.61 | % |
| 9.02 | % |
| 9.28 | % |
| 9.04 | % |
| 9.52 | % |
| 10.03 | % | ||||||
Yield on Securities |
| 4.95 | % |
| 5.76 | % |
| 6.13 | % |
| 5.78 | % |
| 6.00 | % |
| 6.38 | % | ||||||
Cost of Deposits |
| 2.39 | % |
| 3.64 | % |
| 3.94 | % |
| 3.51 | % |
| 3.79 | % |
| 3.97 | % | ||||||
Efficiency |
| SEP02 |
|
| DEC01 |
|
| DEC00 |
|
| DEC99 |
|
| DEC98 |
|
| DEC97 |
| ||||||
Efficiency Ratio |
| 58.76 | % |
| 61.16 | % |
| 60.33 | % |
| 59.93 | % |
| 57.68 | % |
| 55.47 | % | ||||||
Net Noninterest Expense/AA |
| 1.85 | % |
| 1.95 | % |
| 2.05 | % |
| 2.04 | % |
| 2.01 | % |
| 2.03 | % | ||||||
Service Charges on Deposit Accts/AA |
| 0.64 | % |
| 0.65 | % |
| 0.63 | % |
| 0.61 | % |
| 0.58 | % |
| 0.59 | % | ||||||
Noninterest Income/Overhead Exp |
| 37.23 | % |
| 36.08 | % |
| 32.79 | % |
| 32.50 | % |
| 32.04 | % |
| 31.59 | % | ||||||
Operating Income per $ of S&B Expense | $ | 1.22 |
| $ | 1.11 |
| $ | 1.15 |
| $ | 1.20 |
| $ | 1.32 |
| $ | 1.43 |
| ||||||
Operating Income/Avg FTE | $ | 50,272 |
| $ | 44,034 |
| $ | 43,738 |
| $ | 43,335 |
| $ | 46,310 |
| $ | 48,940 |
| ||||||
Salaries & Benefits/Avg Employees$ | $ | 41,264 |
| $ | 39,539 |
| $ | 37,947 |
| $ | 36,226 |
| $ | 35,148 |
| $ | 34,201 |
| ||||||
Total Deposits per Employee $(000) | $ | 2,161 |
| $ | 2,150 |
| $ | 2,014 |
| $ | 1,981 |
| $ | 2,028 |
| $ | 2,002 |
| ||||||
Total Assets per Employee $(000) | $ | 2,617 |
| $ | 2,539 |
| $ | 2,368 |
| $ | 2,298 |
| $ | 2,333 |
| $ | 2,289 |
| ||||||
Asset Quality & Capital Adequacy |
| SEP02 |
|
| DEC01 |
|
| DEC00 |
|
| DEC99 |
|
| DEC98 |
|
| DEC97 |
| ||||||
Nonperf Assets/Total Assets |
| 0.64 | % |
| 0.70 | % |
| 0.67 | % |
| 0.62 | % |
| 0.57 | % |
| 0.51 | % | ||||||
Nonperf Assets/EqtyCap&LLR |
| 5.94 | % |
| 6.60 | % |
| 6.12 | % |
| 5.99 | % |
| 5.25 | % |
| 4.69 | % | ||||||
Nonperforming Loans/GL |
| 0.95 | % |
| 1.00 | % |
| 0.92 | % |
| 0.93 | % |
| 0.92 | % |
| 0.74 | % | ||||||
Restructured:Loans & Leases/GL |
| 0.06 | % |
| 0.09 | % |
| 0.09 | % |
| 0.02 | % |
| 0.05 | % |
| 0.07 | % | ||||||
Net Charge-Offs(YTD)/Average Loans |
| 0.30 | % |
| 0.39 | % |
| 0.28 | % |
| 0.26 | % |
| 0.26 | % |
| 0.38 | % | ||||||
Loan Loss Reserve/TL |
| 1.29 | % |
| 1.26 | % |
| 1.20 | % |
| 1.23 | % |
| 1.26 | % |
| 1.24 | % | ||||||
Loan Loss Reserve/Nonperf Loans |
| 136.71 | % |
| 125.58 | % |
| 129.66 | % |
| 131.57 | % |
| 136.18 | % |
| 166.78 | % | ||||||
Total Equity Capital/Total Assets |
| 10.03 | % |
| 9.86 | % |
| 10.19 | % |
| 9.73 | % |
| 10.13 | % |
| 10.30 | % | ||||||
Core Equity/Total Assets (net AFS Sec’s) |
| 9.68 | % |
| 9.76 | % |
| 10.21 | % |
| 10.12 | % |
| 10.01 | % |
| 10.22 | % | ||||||
Loans/Assets |
| 58.76 | % |
| 58.39 | % |
| 59.91 | % |
| 56.01 | % |
| 52.11 | % |
| 50.95 | % | ||||||
Growth Rates: Trailing Twelve Months |
| SEP02 |
|
| DEC01 |
|
| DEC00 |
|
| DEC99 |
|
| DEC98 |
|
| DEC97 |
| ||||||
%CH:Ln&Lse:Net Unearned Income |
| 13.26 | % |
| 12.92 | % |
| 23.29 | % |
| 18.30 | % |
| 21.61 | % |
| 32.31 | % | ||||||
%CH:Securities |
| 25.78 | % |
| 22.44 | % |
| 0.91 | % |
| 2.30 | % |
| 10.97 | % |
| 19.42 | % | ||||||
%CH:Total Assets |
| 15.33 | % |
| 15.85 | % |
| 15.28 | % |
| 10.05 | % |
| 18.92 | % |
| 25.94 | % | ||||||
%CH:Total Deposits |
| 12.18 | % |
| 15.34 | % |
| 13.70 | % |
| 9.15 | % |
| 18.21 | % |
| 25.50 | % | ||||||
%CH:Total Equity Capital |
| 11.23 | % |
| 12.07 | % |
| 20.81 | % |
| 5.66 | % |
| 16.97 | % |
| 27.84 | % | ||||||
Miscellaneous Items |
| SEP02 |
|
| DEC01 |
|
| DEC00 |
|
| DEC99 |
|
| DEC98 |
|
| DEC97 |
| ||||||
Total Cash Dividends Declared $(000) | $ | 583 |
| $ | 984 |
| $ | 806 |
| $ | 836 |
| $ | 877 |
| $ | 695 |
| ||||||
Dividends Declared/Net Income |
| 15.03 | % |
| 24.23 | % |
| 21.17 | % |
| 21.62 | % |
| 22.94 | % |
| 18.68 | % | ||||||
Effective Tax Rate |
| 30.70 | % |
| 30.88 | % |
| 30.80 | % |
| 30.07 | % |
| 30.79 | % |
| 30.71 | % |
5
GRAPHICAL ANALYSIS
HCBI and PEER Graphical Analysis
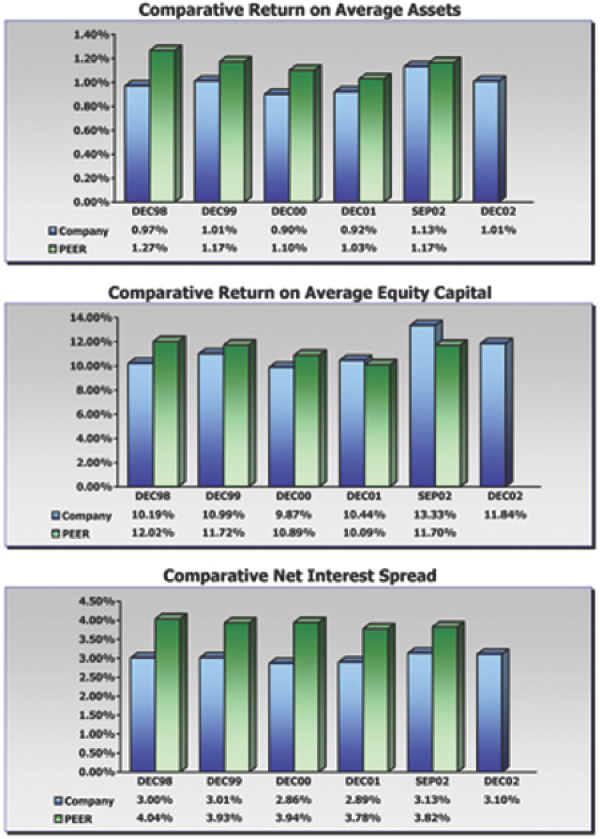
6
HCBI and PEER Graphical Analysis
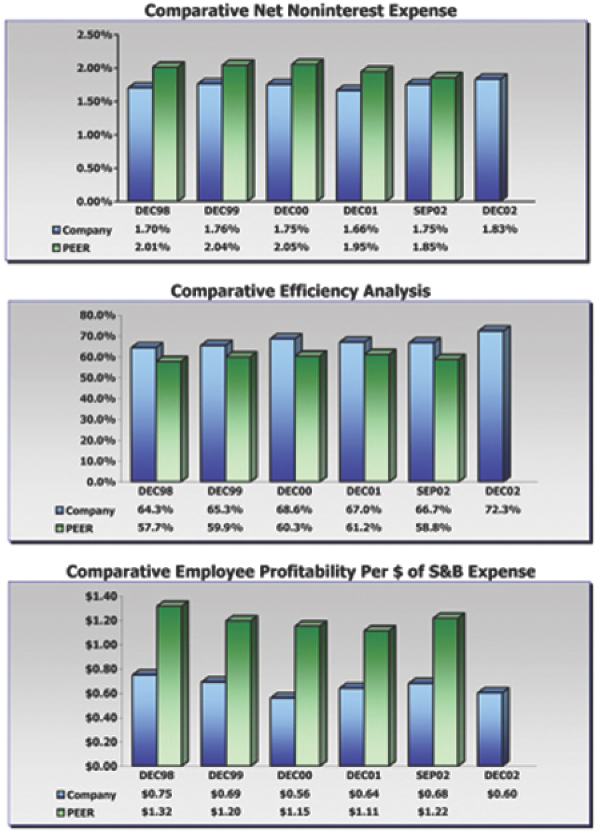
7
HCBI and PEER Graphical Analysis
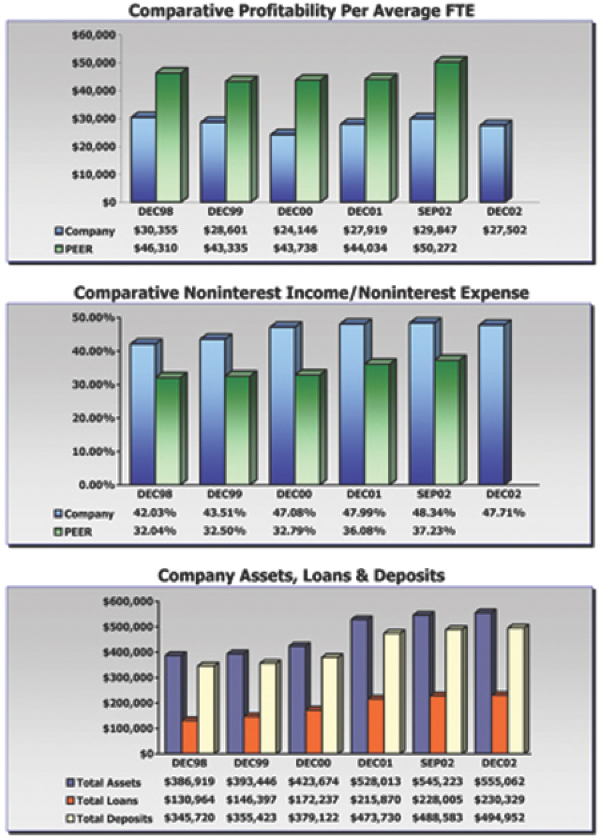
8
HCBI and PEER Graphical Analysis
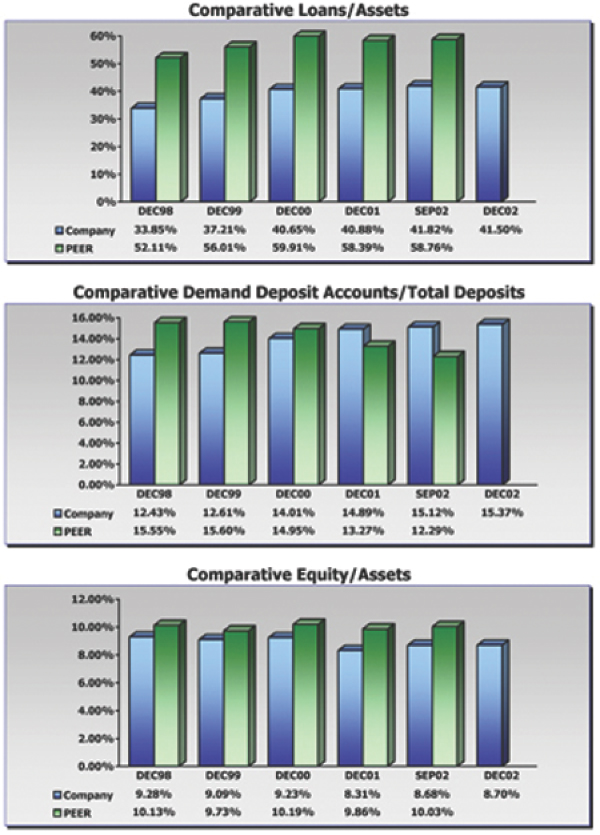
9
HCBI and PEER Graphical Analysis
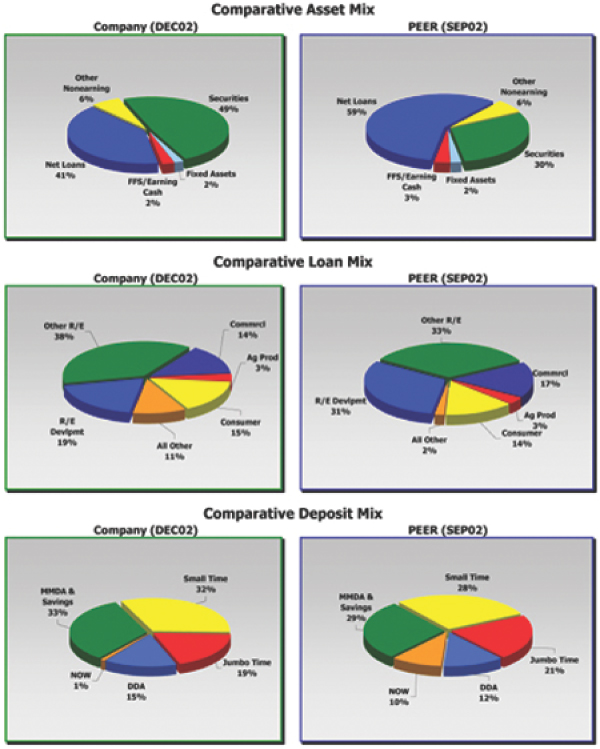
10
HCBI and PEER Graphical Analysis
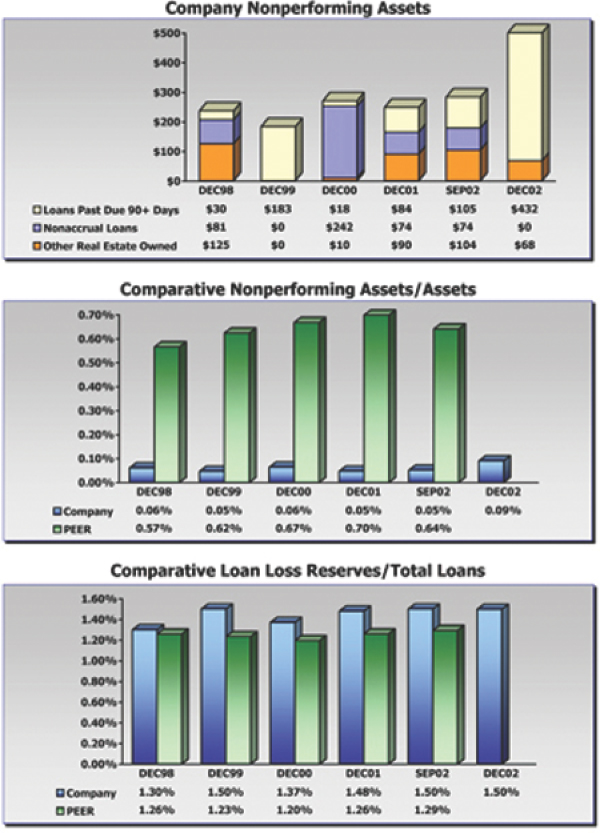
11
SECTION III
FINANCIAL PROJECTIONS
HENDERSON CITIZENS BANCSHARES, INC.
HENDERSON, TEXAS
FINANCIAL PROJECTIONS
(IN THOUSANDSOF DOLLARS)
Historical: | Total Assets | Net Earnings | Total Dividends | Core Equity | Loan Loss Reserve | Intangible Assets | Long Term Debt | ||||||||||||||
2000 | $ | 423,644 | $ | 3,624 | $ | 1,358 | $ | 39,697 | $ | 2,355 | $ | 4,087 | $ | 0 | |||||||
2001 |
| 526,185 |
| 4,366 |
| 1,017 |
| 43,031 |
| 3,205 |
| 9,395 |
| 0 | |||||||
2002 |
| 555,062 |
| 5,455 |
| 1,356 |
| 48,288 |
| 3,431 |
| 10,787 |
| 0 | |||||||
Projected: | |||||||||||||||||||||
2003 |
| 582,815 |
| 5,285 |
| 1,436 |
| 52,137 |
| 3,603 |
| 9,944 |
| 0 | |||||||
2004 |
| 611,956 |
| 5,689 |
| 1,516 |
| 56,310 |
| 3,783 |
| 9,101 |
| 0 | |||||||
2005 |
| 642,554 |
| 6,012 |
| 1,595 |
| 60,727 |
| 3,972 |
| 8,280 |
| 0 | |||||||
2006 |
| 674,681 |
| 6,340 |
| 1,675 |
| 65,392 |
| 4,170 |
| 7,464 |
| 0 | |||||||
2007 |
| 708,415 |
| 6,727 |
| 1,755 |
| 70,363 |
| 4,379 |
| 6,646 |
| 0 | |||||||
2008 |
| 740,294 |
| 7,142 |
| 1,835 |
| 75,671 |
| 4,576 |
| 5,930 |
| 0 | |||||||
2009 |
| 773,607 |
| 7,511 |
| 1,914 |
| 81,267 |
| 4,782 |
| 5,876 |
| 0 | |||||||
2010 |
| 808,420 |
| 7,925 |
| 1,994 |
| 87,198 |
| 4,997 |
| 5,876 |
| 0 | |||||||
2011 |
| 844,799 |
| 8,282 |
| 2,074 |
| 93,406 |
| 5,222 |
| 5,876 |
| 0 | |||||||
2012 |
| 878,590 |
| 8,633 |
| 2,154 |
| 99,885 |
| 5,431 |
| 5,876 |
| 0 | |||||||
2013 |
| 913,734 |
| 8,979 |
| 2,234 |
| 106,630 |
| 5,648 |
| 5,876 |
| 0 | |||||||
2014 |
| 950,283 |
| 9,338 |
| 2,313 |
| 113,655 |
| 5,874 |
| 5,876 |
| 0 | |||||||
FINANCIAL RATIOSAND PER SHARE DATA
Per Share Data | ||||||||||||||||||||||||||||||
Historical: | Asset Growth | Earnings Growth | ROA | ROE | Dividend Payout | Leverage Ratio | Equity-to- | Earnings | Tangible Equity | Dividends | ||||||||||||||||||||
2000 | ***** | % | ***** | % | 0.86 | % | 9.13 | % | 37.47 | % | 8.49 | % | 9.37 | % | $ | 1.812 | $ | 17.848 | $ | 0.680 | ||||||||||
2001 | 24.20 |
| 20.47 |
| 0.92 |
| 10.56 |
| 23.29 |
| 6.51 |
| 8.18 |
|
| 2.188 |
| 16.865 |
| 0.510 | ||||||||||
2002 | 5.49 |
| 24.94 |
| 1.01 |
| 11.95 |
| 24.86 |
| 6.89 |
| 8.70 |
|
| 2.735 |
| 18.805 |
| 0.680 | ||||||||||
Projected: | ||||||||||||||||||||||||||||||
2003 | 5.00 |
| (3.12 | ) | 0.93 |
| 10.52 |
| 27.17 |
| 7.37 |
| 8.95 |
|
| 2.650 |
| 21.158 |
| 0.720 | ||||||||||
2004 | 5.00 |
| 7.64 |
| 0.95 |
| 10.49 |
| 26.64 |
| 7.83 |
| 9.20 |
|
| 2.853 |
| 23.673 |
| 0.760 | ||||||||||
2005 | 5.00 |
| 5.69 |
| 0.96 |
| 10.27 |
| 26.53 |
| 8.27 |
| 9.45 |
|
| 3.015 |
| 26.300 |
| 0.800 | ||||||||||
2006 | 5.00 |
| 5.45 |
| 0.96 |
| 10.05 |
| 26.42 |
| 8.68 |
| 9.69 |
|
| 3.179 |
| 29.048 |
| 0.840 | ||||||||||
2007 | 5.00 |
| 6.10 |
| 0.97 |
| 9.91 |
| 26.09 |
| 9.08 |
| 9.93 |
|
| 3.373 |
| 31.951 |
| 0.880 | ||||||||||
2008 | 4.50 |
| 6.18 |
| 0.99 |
| 9.78 |
| 25.69 |
| 9.50 |
| 10.22 |
|
| 3.581 |
| 34.972 |
| 0.920 | ||||||||||
2009 | 4.50 |
| 5.16 |
| 0.99 |
| 9.57 |
| 25.49 |
| 9.82 |
| 10.50 |
|
| 3.766 |
| 37.805 |
| 0.960 | ||||||||||
2010 | 4.50 |
| 5.51 |
| 1.00 |
| 9.41 |
| 25.16 |
| 10.13 |
| 10.79 |
|
| 3.974 |
| 40.779 |
| 1.000 | ||||||||||
2011 | 4.50 |
| 4.50 |
| 1.00 |
| 9.17 |
| 25.04 |
| 10.43 |
| 11.06 |
|
| 4.153 |
| 43.892 |
| 1.040 | ||||||||||
2012 | 4.00 |
| 4.24 |
| 1.00 |
| 8.93 |
| 24.95 |
| 10.77 |
| 11.37 |
|
| 4.329 |
| 47.141 |
| 1.080 | ||||||||||
2013 | 4.00 |
| 4.00 |
| 1.00 |
| 8.70 |
| 24.88 |
| 11.10 |
| 11.67 |
|
| 4.502 |
| 50.523 |
| 1.120 | ||||||||||
2014 | 4.00 |
| 4.00 |
| 1.00 |
| 8.48 |
| 24.77 |
| 11.41 |
| 11.96 |
|
| 4.682 |
| 54.046 |
| 1.160 | ||||||||||
HENDERSON CITIZENS BANCSHARES, INC.
HENDERSON, TEXAS
HISTORICALAND PROJECTED RETURNON AVERAGE ASSETS
Historical ROA | Projected Return on Average Assets | |||||||||||||||||||||||||||||
As a % of Average Assets | 2000 | 2001 | 2002 | 2003 | 2004 | 2005 | 2006 | 2007 | 2008 | 2009 | 2010 | 2011 | 2012 | 2013 | 2014 | |||||||||||||||
Net Interest Income | 2.86 | 2.89 | 3.09 | 3.03 | 3.01 | 3.00 | 3.00 | 3.01 | 3.04 | 3.05 | 3.06 | 3.06 | 3.06 | 3.06 | 3.06 | |||||||||||||||
Noninterest Income | 1.56 | 1.54 | 1.55 | 1.55 | 1.55 | 1.55 | 1.55 | 1.55 | 1.55 | 1.55 | 1.55 | 1.55 | 1.55 | 1.55 | 1.55 | |||||||||||||||
Noninterest Expense: | ||||||||||||||||||||||||||||||
Salary and Benefits | 1.99 | 1.92 | 2.00 | 1.98 | 1.96 | 1.95 | 1.94 | 1.93 | 1.93 | 1.93 | 1.93 | 1.93 | 1.93 | 1.93 | 1.93 | |||||||||||||||
Occupancy | 0.44 | 0.45 | 0.43 | 0.43 | 0.43 | 0.43 | 0.43 | 0.43 | 0.43 | 0.43 | 0.43 | 0.43 | 0.43 | 0.43 | 0.43 | |||||||||||||||
Other | 0.88 | 0.82 | 0.92 | 0.89 | 0.89 | 0.88 | 0.88 | 0.88 | 0.88 | 0.88 | 0.88 | 0.88 | 0.88 | 0.88 | 0.88 | |||||||||||||||
Total Noninterest Expense | 3.31 | 3.19 | 3.35 | 3.30 | 3.28 | 3.26 | 3.25 | 3.24 | 3.24 | 3.24 | 3.24 | 3.24 | 3.24 | 3.24 | 3.24 | |||||||||||||||
Net Noninterest Expense | 1.75 | 1.65 | 1.80 | 1.75 | 1.73 | 1.71 | 1.70 | 1.69 | 1.69 | 1.69 | 1.69 | 1.69 | 1.69 | 1.69 | 1.69 | |||||||||||||||
Provision Expense | 0.07 | 0.16 | 0.20 | 0.17 | 0.14 | 0.14 | 0.14 | 0.14 | 0.14 | 0.14 | 0.14 | 0.14 | 0.14 | 0.14 | 0.14 | |||||||||||||||
Net Income before | 1.04 | 1.08 | 1.09 | 1.11 | 1.14 | 1.15 | 1.17 | 1.19 | 1.21 | 1.23 | 1.24 | 1.24 | 1.24 | 1.24 | 1.24 | |||||||||||||||
Securities Transactions | 0.00 | 0.01 | 0.21 | 0.00 | 0.00 | 0.00 | 0.00 | 0.00 | 0.00 | 0.00 | 0.00 | 0.00 | 0.00 | 0.00 | 0.00 | |||||||||||||||
Income Taxes | 0.14 | 0.16 | 0.28 | 0.18 | 0.19 | 0.20 | 0.20 | 0.21 | 0.22 | 0.23 | 0.24 | 0.24 | 0.24 | 0.24 | 0.24 | |||||||||||||||
Net Operating Income | 0.90 | 0.93 | 1.02 | 0.93 | 0.95 | 0.96 | 0.96 | 0.97 | 0.99 | 0.99 | 1.00 | 1.00 | 1.00 | 1.00 | 1.00 | |||||||||||||||
Extraordinary Items, Net | 0.00 | 0.00 | 0.00 | 0.00 | 0.00 | 0.00 | 0.00 | 0.00 | 0.00 | 0.00 | 0.00 | 0.00 | 0.00 | 0.00 | 0.00 | |||||||||||||||
Net Income | 0.90 | 0.92 | 1.01 | 0.93 | 0.95 | 0.96 | 0.96 | 0.97 | 0.99 | 0.99 | 1.00 | 1.00 | 1.00 | 1.00 | 1.00 | |||||||||||||||
HENDERSON CITIZENS BANCSHARES, INC.
HENDERSON, TEXAS
PROJECTED INCOME STATEMENT ANALYSIS
Projected Income Statement | ||||||||||||||||||||||||
In Thousands $(000) of Dollars | 2003 | 2004 | 2005 | 2006 | 2007 | 2008 | 2009 | 2010 | 2011 | 2012 | 2013 | 2014 | ||||||||||||
Net Interest Spread | 17,229 | 18,000 | 18,843 | 19,785 | 20,826 | 21,985 | 23,090 | 24,223 | 25,313 | 26,387 | 27,443 | 28,540 | ||||||||||||
Noninterest Income | 8,819 | 9,259 | 9,722 | 10,209 | 10,719 | 11,227 | 11,733 | 12,261 | 12,812 | 13,356 | 13,891 | 14,446 | ||||||||||||
Noninterest Expense: | ||||||||||||||||||||||||
Salary and Benefits | 11,265 | 11,710 | 12,203 | 12,749 | 13,320 | 13,952 | 14,580 | 15,236 | 15,921 | 16,597 | 17,261 | 17,951 | ||||||||||||
Occupancy | 2,446 | 2,569 | 2,697 | 2,832 | 2,974 | 3,115 | 3,255 | 3,401 | 3,554 | 3,705 | 3,853 | 4,008 | ||||||||||||
Other | 5,077 | 5,304 | 5,542 | 5,804 | 6,079 | 6,368 | 6,654 | 6,954 | 7,267 | 7,575 | 7,878 | 8,193 | ||||||||||||
Total Noninterest Expense | 18,789 | 19,583 | 20,442 | 21,386 | 22,373 | 23,434 | 24,489 | 25,591 | 26,742 | 27,877 | 28,992 | 30,152 | ||||||||||||
Net Noninterest Expense | 9,970 | 10,324 | 10,720 | 11,177 | 11,654 | 12,207 | 12,756 | 13,330 | 13,930 | 14,521 | 15,102 | 15,706 | ||||||||||||
Provision Expense | 967 | 863 | 879 | 923 | 969 | 1,015 | 1,061 | 1,109 | 1,159 | 1,208 | 1,256 | 1,306 | ||||||||||||
Net Income before Securities Transactions | 6,291 | 6,813 | 7,244 | 7,685 | 8,203 | 8,763 | 9,273 | 9,784 | 10,224 | 10,658 | 11,085 | 11,528 | ||||||||||||
Securities Transactions | 0 | 0 | 0 | 0 | 0 | 0 | 0 | 0 | 0 | 0 | 0 | 0 | ||||||||||||
Income Taxes | 1,007 | 1,124 | 1,231 | 1,345 | 1,477 | 1,621 | 1,762 | 1,859 | 1,943 | 2,025 | 2,106 | 2,190 | ||||||||||||
Net Operating Income | 5,285 | 5,689 | 6,012 | 6,340 | 6,727 | 7,142 | 7,511 | 7,925 | 8,282 | 8,633 | 8,979 | 9,338 | ||||||||||||
Extraordinary Items, Net | 0 | 0 | 0 | 0 | 0 | 0 | 0 | 0 | 0 | 0 | 0 | 0 | ||||||||||||
Net Income | 5,285 | 5,689 | 6,012 | 6,340 | 6,727 | 7,142 | 7,511 | 7,925 | 8,282 | 8,633 | 8,979 | 9,338 | ||||||||||||
HENDERSON CITIZENS BANCSHARES, INC.
HENDERSON, TEXAS
LOAN QUALITY ANALYSIS
Loan Loss Reserve Reconciliation | Loan Loss Reserve to Projected Loans | Provision Expense to Projected Avg. Loans | Net Loan Losses to Projected Avg. Loans | |||||||||||||||||
Beginning Balance $(000) | Provision Expense $(000) | Net Loan Losses $(000) | Ending Balance $(000) | |||||||||||||||||
2003 | $3,431 | $ | 967 | $ | 796 | $ | 3,603 | 1.49 | % | 0.41 | % | 0.34 | % | |||||||
2004 | 3,603 |
| 863 |
| 683 |
| 3,783 | 1.49 |
| 0.35 |
| 0.28 |
| |||||||
2005 | 3,783 |
| 879 |
| 690 |
| 3,972 | 1.49 |
| 0.34 |
| 0.27 |
| |||||||
2006 | 3,972 |
| 923 |
| 725 |
| 4,170 | 1.49 |
| 0.34 |
| 0.27 |
| |||||||
2007 | 4,170 |
| 969 |
| 761 |
| 4,379 | 1.49 |
| 0.34 |
| 0.27 |
| |||||||
2008 | 4,379 |
| 1,015 |
| 818 |
| 4,576 | 1.49 |
| 0.34 |
| 0.27 |
| |||||||
2009 | 4,576 |
| 1,061 |
| 855 |
| 4,782 | 1.49 |
| 0.34 |
| 0.27 |
| |||||||
2010 | 4,782 |
| 1,109 |
| 894 |
| 4,997 | 1.49 |
| 0.34 |
| 0.27 |
| |||||||
2011 | 4,997 |
| 1,159 |
| 934 |
| 5,222 | 1.49 |
| 0.34 |
| 0.27 |
| |||||||
2012 | 5,222 |
| 1,208 |
| 999 |
| 5,431 | 1.49 |
| 0.34 |
| 0.28 |
| |||||||
2013 | 5,431 |
| 1,256 |
| 1,039 |
| 5,648 | 1.49 |
| 0.34 |
| 0.28 |
| |||||||
2014 | 5,648 |
| 1,306 |
| 1,080 |
| 5,874 | 1.49 |
| 0.34 |
| 0.28 |
| |||||||
SECTION IV
PRESENT VALUEOF EARNINGSIN PERPETUITY
Present Value Analysis
HENDERSON CITIZENS BANCSHARES, INC.
HENDERSON, TEXAS
Periods | PV of 1 @ Stated DR | Annual Net Income (000) | NI x NPV Factor (000) | Aggregate NPV (000) | Aggregate NPV Per Share | |||||||||
1/2003 | 0.892857 | $ | 5,235 | $ | 4,674 | $ | 4,674 | $ | 2.344 | |||||
2/2004 | 0.797194 | $ | 5,681 | $ | 4,529 | $ | 9,203 | $ | 4.615 | |||||
3/2005 | 0.711780 | $ | 6,004 | $ | 4,274 | $ | 13,476 | $ | 6.758 | |||||
4/2006 | 0.635518 | $ | 6,331 | $ | 4,023 | $ | 17,500 | $ | 8.775 | |||||
5/2007 | 0.567427 | $ | 6,718 | $ | 3,812 | $ | 21,312 | $ | 10.687 | |||||
6/2008 | 0.506631 | $ | 7,133 | $ | 3,614 | $ | 24,926 | $ | 12.499 | |||||
7/2009 | 0.452349 | $ | 7,501 | $ | 3,393 | $ | 28,319 | $ | 14.200 | |||||
8/2010 | 0.403883 | $ | 7,915 | $ | 3,197 | $ | 31,516 | $ | 15.803 | |||||
9/2011 | 0.360610 | $ | 8,271 | $ | 2,983 | $ | 34,498 | $ | 17.299 | |||||
10/2012 | 0.321973 | $ | 8,622 | $ | 2,776 | $ | 37,274 | $ | 18.691 | |||||
11/2013 | 0.260698 | $ | 8,967 | $ | 2,338 | $ | 39,612 | $ | 19.863 | |||||
12/2014 | 0.230706 | $ | 9,326 | $ | 2,152 | $ | 41,763 | $ | 20.942 | |||||
13/2015 | 0.204165 | $ | 9,606 | $ | 1,961 | $ | 43,725 | $ | 21.926 | |||||
14/2016 | 0.180677 | $ | 9,894 | $ | 1,788 | $ | 45,512 | $ | 22.822 | |||||
15/2017 | 0.159891 | $ | 10,191 | $ | 1,629 | $ | 47,142 | $ | 23.639 | |||||
16/2018 | 0.141496 | $ | 10,496 | $ | 1,485 | $ | 48,627 | $ | 24.384 | |||||
17/2019 | 0.125218 | $ | 10,811 | $ | 1,354 | $ | 49,981 | $ | 25.063 | |||||
18/2020 | 0.110812 | $ | 11,136 | $ | 1,234 | $ | 51,215 | $ | 25.682 | |||||
19/2021 | 0.098064 | $ | 11,470 | $ | 1,125 | $ | 52,339 | $ | 26.246 | |||||
20/2022 | 0.086782 | $ | 11,814 | $ | 1,025 | $ | 53,365 | $ | 26.760 | |||||
21/2023 | 0.063826 | $ | 12,168 | $ | 777 | $ | 54,141 | �� | $ | 27.149 | ||||
22/2024 | 0.055988 | $ | 12,533 | $ | 702 | $ | 54,843 | $ | 27.501 | |||||
23/2025 | 0.049112 | $ | 12,909 | $ | 634 | $ | 55,477 | $ | 27.819 | |||||
24/2026 | 0.043081 | $ | 13,297 | $ | 573 | $ | 56,050 | $ | 28.106 | |||||
25/2027 | 0.037790 | $ | 13,696 | $ | 518 | $ | 56,567 | $ | 28.366 | |||||
26/2028 | 0.033149 | $ | 14,106 | $ | 468 | $ | 57,035 | $ | 28.600 | |||||
27/2029 | 0.029078 | $ | 14,530 | $ | 422 | $ | 57,457 | $ | 28.812 | |||||
28/2030 | 0.025507 | $ | 14,965 | $ | 382 | $ | 57,839 | $ | 29.003 | |||||
29/2031 | 0.022375 | $ | 15,414 | $ | 345 | $ | 58,184 | $ | 29.176 | |||||
30/2032 | 0.019627 | $ | 15,877 | $ | 312 | $ | 58,496 | $ | 29.333 | |||||
31/2033 | 0.017217 | $ | 16,194 | $ | 279 | $ | 58,775 | $ | 29.472 | |||||
32/2034 | 0.015102 | $ | 16,518 | $ | 249 | $ | 59,024 | $ | 29.598 | |||||
33/2035 | 0.013248 | $ | 16,849 | $ | 223 | $ | 59,247 | $ | 29.709 | |||||
34/2036 | 0.011621 | $ | 17,186 | $ | 200 | $ | 59,447 | $ | 29.810 | |||||
35/2037 | 0.010194 | $ | 17,529 | $ | 179 | $ | 59,626 | $ | 29.899 | |||||
36/2038 | 0.008942 | $ | 17,880 | $ | 160 | $ | 59,785 | $ | 29.979 | |||||
37/2039 | 0.007844 | $ | 18,238 | $ | 143 | $ | 59,929 | $ | 30.051 | |||||
38/2040 | 0.006880 | $ | 18,602 | $ | 128 | $ | 60,057 | $ | 30.115 | |||||
39/2041 | 0.006035 | $ | 18,974 | $ | 115 | $ | 60,171 | $ | 30.173 | |||||
40/2042 | 0.005294 | $ | 19,354 | $ | 102 | $ | 60,274 | $ | 30.224 | |||||
41/2043 | 0.004644 | $ | 19,741 | $ | 92 | $ | 60,365 | $ | 30.270 | |||||
42/2044 | 0.004074 | $ | 20,136 | $ | 82 | $ | 60,447 | $ | 30.311 | |||||
43/2045 | 0.003573 | $ | 20,538 | $ | 73 | $ | 60,521 | $ | 30.348 | |||||
44/2046 | 0.003135 | $ | 20,949 | $ | 66 | $ | 60,586 | $ | 30.381 | |||||
45/2047 | 0.002750 | $ | 21,368 | $ | 59 | $ | 60,645 | $ | 30.410 | |||||
Periods | PV of 1 @ Stated DR | Annual Net Income (000) | NI x NPV Factor (000) | Aggregate NPV (000) | Aggregate NPV Per Share | |||||
46/2048 | 0.002412 | $21,796 | $53 | $60,698 | $30.437 | |||||
47/2049 | 0.002116 | $22,231 | $47 | $60,745 | $30.460 | |||||
48/2050 | 0.001856 | $22,676 | $42 | $60,787 | $30.481 | |||||
49/2051 | 0.001628 | $23,130 | $38 | $60,824 | $30.500 | |||||
50/2052 | 0.001428 | $23,592 | $34 | $60,858 | $30.517 | |||||
51/2053 | 0.001253 | $24,064 | $30 | $60,888 | $30.532 | |||||
52/2054 | 0.001099 | $24,545 | $27 | $60,915 | $30.546 | |||||
53/2055 | 0.000964 | $25,036 | $24 | $60,939 | $30.558 | |||||
54/2056 | 0.000846 | $25,537 | $22 | $60,961 | $30.569 | |||||
55/2057 | 0.000742 | $26,048 | $19 | $60,980 | $30.579 | |||||
56/2058 | 0.000651 | $26,569 | $17 | $60,998 | $30.587 | |||||
57/2059 | 0.000571 | $27,100 | $15 | $61,013 | $30.595 | |||||
58/2060 | 0.000501 | $27,642 | $14 | $61,027 | $30.602 | |||||
59/2061 | 0.000439 | $28,195 | $12 | $61,039 | $30.608 | |||||
60/2062 | 0.000385 | $28,759 | $11 | $61,050 | $30.614 | |||||
61/2063 | 0.000338 | $29,334 | $10 | $61,060 | $30.619 | |||||
62/2064 | 0.000296 | $29,921 | $ 9 | $61,069 | $30.623 | |||||
63/2065 | 0.000260 | $30,519 | $ 8 | $61,077 | $30.627 | |||||
64/2066 | 0.000228 | $31,129 | $ 7 | $61,084 | $30.631 | |||||
65/2067 | 0.000200 | $31,752 | $ 6 | $61,090 | $30.634 | |||||
66/2068 | 0.000176 | $32,387 | $ 6 | $61,096 | $30.637 | |||||
67/2069 | 0.000154 | $33,035 | $ 5 | $61,101 | $30.639 | |||||
68/2070 | 0.000135 | $33,696 | $ 5 | $61,106 | $30.641 | |||||
69/2071 | 0.000118 | $34,369 | $ 4 | $61,110 | $30.644 | |||||
70/2072 | 0.000104 | $35,057 | $ 4 | $61,113 | $30.645 | |||||
71/2073 | 0.000091 | $35,758 | $ 3 | $61,117 | $30.647 | |||||
72/2074 | 0.000080 | $36,473 | $ 3 | $61,120 | $30.648 | |||||
73/2075 | 0.000070 | $37,203 | $ 3 | $61,122 | $30.650 | |||||
74/2076 | 0.000062 | $37,947 | $ 2 | $61,125 | $30.651 | |||||
75/2077 | 0.000054 | $38,706 | $ 2 | $61,127 | $30.652 | |||||
76/2078 | 0.000047 | $39,480 | $ 2 | $61,129 | $30.653 | |||||
77/2079 | 0.000042 | $40,269 | $ 2 | $61,130 | $30.654 | |||||
78/2080 | 0.000036 | $41,075 | $ 1 | $61,132 | $30.654 | |||||
79/2081 | 0.000032 | $41,896 | $ 1 | $61,133 | $30.655 | |||||
80/2082 | 0.000028 | $42,734 | $ 1 | $61,134 | $30.656 | |||||
81/2083 | 0.000025 | $43,589 | $ 1 | $61,135 | $30.656 | |||||
82/2084 | 0.000022 | $44,461 | $ 1 | $61,136 | $30.657 | |||||
83/2085 | 0.000019 | $45,350 | $ 1 | $61,137 | $30.657 | |||||
84/2086 | 0.000017 | $46,257 | $ 1 | $61,138 | $30.658 | |||||
85/2087 | 0.000015 | $47,182 | $ 1 | $61,139 | $30.658 | |||||
86/2088 | 0.000013 | $48,125 | $ 1 | $61,139 | $30.658 | |||||
87/2089 | 0.000011 | $49,088 | $ 1 | $61,140 | $30.659 | |||||
88/2090 | 0.000010 | $50,070 | $ 0 | $61,140 | $30.659 | |||||
89/2091 | 0.000009 | $51,071 | $ 0 | $61,141 | $30.659 | |||||
90/2092 | 0.000008 | $52,093 | $ 0 | $61,141 | $30.659 |
SECTION V
COMPARABLE ANALYSIS—SELECTED PUBLICLY-TRADED
BANKING ORGANIZATIONSINTHE SOUTHERN U.S.
COMPARABLE VALUES FOR SELECTED BANKING ORGANIZATIONS
Southern United States
December 31, 2002
Company | City | ST | Ticker | Closing Price ($) | Total Common Captlztn ($M) | Insider Ownership | Price Benchmarks | ||||||||||||||
Price To: | Price Equity Index | ||||||||||||||||||||
Core Equity Per Share | Equity Per Share | EPS-FD (12-Month Trailing) | |||||||||||||||||||
Bank of the Ozarks, Inc. | Little Rock | AR | OZRK | $23.440 | $176 | 41.30 | % | 2.67x | 2.62x | 13.88x | 18.70 | ||||||||||
Guaranty Bancshares, Inc. | Mount Pleasant | TX | GNTY | $16.090 | $ 44 | 46.55 | % | 1.43x | 1.38x | 10.47x | 9.34 | ||||||||||
IBERIABANK Corporation | New Iberia | LA | IBKC | $40.160 | $222 | 9.88 | % | 1.64x | 1.63x | 13.16x | 15.93 | ||||||||||
MetroCorp Bancshares, Inc. | Houston | TX | MCBI | $11.600 | $ 88 | 28.77 | % | 1.16x | 1.11x | 11.46x | 9.69 | ||||||||||
MidSouth Bancorp, Inc. | Lafayette | LA | MSL | $17.300 | $ 37 | 38.86 | % | 2.01x | 1.91x | 9.35x | 13.13 | ||||||||||
Southside Bancshares, Inc. | Tyler | TX | SBSI | $14.810 | $125 | 17.10 | % | 1.75x | 1.57x | 10.71x | 9.39 | ||||||||||
Southwest Bancorp, Inc. | Stillwater | OK | OKSB | $25.760 | $145 | 10.12 | % | 1.63x | 1.59x | 11.64x | 11.45 | ||||||||||
Summit Bancshares, Inc. | Fort Worth | TX | SBIT | $19.500 | $131 | 16.10 | % | 1.95x | 1.87x | 14.93x | 17.76 | ||||||||||
Texas United Bancshares, Incorporated | La Grange | TX | TXUI | $18.300 | $ 50 | 17.50 | % | 1.46x | 1.40x | 12.97x | 8.65 | ||||||||||
Group Average | $113 | 25.13 | % | 1.74x | 1.67x | 12.06x | 12.67 | ||||||||||||||
Group Median | $125 | 17.50 | % | 1.64x | 1.59x | 11.64x | 11.45 | ||||||||||||||
COMPARABLE VALUES FOR SELECTED BANKING ORGANIZATIONS
Southern United States
December 31, 2002
Company | Most Recent Quarter End Date | As of 09/30/2002 | 12-Month Period Ending 09/30/2002 | As of 09/30/2002 | ||||||||||||||||||||||||||
Total Assets ($M) | Core Equity-to- Assets Ratio | Equity-to- Assets Ratio | ROA | ROE | Efficiency Ratio | Deposit Growth | NPAs/ Assets | Reserves / NPLs | # of Branches | Deposits Per Location | ||||||||||||||||||||
Bank of the Ozarks, Inc. | 9/30/2002 | $ | 965 | 7.01% | 7.15% | 1.45 | % | 21.23% | 45.60% | 21.10 | % | 0.34 | % | 386 | % | 33 | $ | 22,944 | ||||||||||||
Guaranty Bancshares, Inc. | 9/30/2002 | $ | 516 | 6.51% | 6.78% | 0.88 | % | 12.72% | 66.13% | 10.61 | % | 0.79 | % | 114 | % | 11 | $ | 37,807 | ||||||||||||
IBERIABANK Corporation | 9/30/2002 | $ | 1,460 | 9.69% | 9.80% | 1.21 | % | 12.56% | 55.01% | -1.79 | % | 0.44 | % | 580 | % | 39 | $ | 31,089 | ||||||||||||
MetroCorp Bancshares, Inc. | 9/30/2002 | $ | 841 | 8.37% | 8.70% | 1.03 | % | 11.45% | 58.81% | 9.78 | % | NA | % | NA | % | 14 | $ | 49,126 | ||||||||||||
MidSouth Bancorp, Inc. | 9/30/2002 | $ | 382 | 6.52% | 6.89% | 1.11 | % | 16.80% | 67.32% | 10.24 | % | 0.26 | % | 415 | % | 19 | $ | 18,032 | ||||||||||||
Southside Bancshares, Inc. | 9/30/2002 | $ | 1,306 | 5.36% | 5.99% | 1.11 | % | 19.46% | 63.63% | 7.75 | % | 0.23 | % | 259 | % | 21 | $ | 37,418 | ||||||||||||
Southwest Bancorp, Inc. | 9/30/2002 | $ | 1,299 | 7.02% | 7.20% | 1.04 | % | 14.82% | 56.16% | 10.90 | % | 0.50 | % | 213 | % | 7 | $ | 147,193 | ||||||||||||
Summit Bancshares, Inc. | 9/30/2002 | $ | 683 | 9.13% | 9.49% | 1.39 | % | 14.51% | 51.24% | 6.54 | % | 0.72 | % | 137 | % | 5 | $ | 114,182 | ||||||||||||
Texas United Bancshares, Incorporated | 9/30/2002 | $ | 558 | 5.94% | 6.19% | 0.84 | % | 13.14% | 72.93% | 23.79 | % | 0.16 | % | 397 | % | 17 | $ | 25,998 | ||||||||||||
Group Average | $ | 890 | 7.28% | 7.58% | 1.12 | % | 15.19% | 59.65% | 10.99 | % | 0.43 | % | 312 | % | 18 | $ | 53,754 | |||||||||||||
Group Median | $ | 841 | 7.01% | 7.15% | 1.11 | % | 14.51% | 58.81% | 10.24 | % | 0.39 | % | 323 | % | 17 | $ | 37,418 | |||||||||||||
COMPARABLE VALUESFOR SELECTED BANKING ORGANIZATIONS
Southern United States
December 31, 2002
Dividends | Trading Volume: 12-Month Period Ending 01/06/03 | |||||||||||
Company | Dividends Declared MRQ | Dividend Payout MRQ | Annual Dividend Yield % MRQ | Avg. Daily Trading Volume | Avg. Weekly Trading Volume as % Shares O/S | |||||||
Bank of the Ozarks, Inc. | $0.08 | 17.02 | % | 1.37 | % | 26,482 | 1.72% | |||||
Guaranty Bancshares, Inc. | $0.00 | 0.00 | % | 0.00 | % | 1,554 | 0.26% | |||||
IBERIABANK Corporation | $0.20 | 26.32 | % | 1.99 | % | 20,333 | 1.76% | |||||
MetroCorp Bancshares, Inc. | $0.06 | 17.14 | % | 2.07 | % | 4,535 | 0.32% | |||||
MidSouth Bancorp, Inc. | $0.05 | 11.90 | % | 1.16 | % | 6,740 | 1.16% | |||||
Southside Bancshares, Inc. | $0.07 | 16.27 | % | 1.80 | % | 9,333 | 0.56% | |||||
Southwest Bancorp, Inc. | $0.11 | 19.30 | % | 1.71 | % | 17,840 | 1.54% | |||||
Summit Bancshares, Inc. | $0.12 | 32.43 | % | 2.46 | % | 10,290 | 0.83% | |||||
Texas United Bancshares, Incorporated | $0.10 | 45.45 | % | 2.19 | % | 450 | 0.02% | |||||
Group Average | 20.65 | % | 1.64 | % | 10,840 | 0.91% | ||||||
Group Median | 17.14 | % | 1.80 | % | 9,333 | 0.83% | ||||||
SECTION VI
MARKET SHARE & DEMOGRAPHIC ANALYSES
State Snapshot
Market: TX | Deposit Data as of 6/30/2002 | |||||||||||||||||
Deposits Summary (Deposit data in $000) | ||||||||||||||||||
6/1998 | 6/1999 | 6/2000 | 6/2001 | 6/2002 | CAGR(%) | |||||||||||||
Bank Deposits | 171,336,822 |
| 175,804,279 |
| 182,224,623 |
| 208,370,379 |
| 217,922,993 |
| 6.20 |
| ||||||
Thrift Deposits | 28,244,528 |
| 29,360,636 |
| 32,488,298 |
| 31,492,361 |
| 34,967,587 |
| 5.48 |
| ||||||
Savings Bank Deposits | 2,268,115 |
| 2,609,744 |
| 2,714,355 |
| 3,527,642 |
| 3,692,787 |
| 12.96 |
| ||||||
Credit Union Deposits | 24,184,712 |
| 26,448,788 |
| 27,754,158 |
| 30,973,521 |
| 35,107,852 |
| 9.77 |
| ||||||
Total Deposits | 226,034,177 |
| 234,223,447 |
| 245,181,434 |
| 274,363,903 |
| 291,691,219 |
| 6.58 |
| ||||||
Weighted Deposits | 186,593,144 |
| 191,789,469 |
| 199,825,950 |
| 225,880,381 |
| 237,253,180 |
| 6.19 |
| ||||||
Weighted deposits are calculated based on the branch types selected in your filter and deposit weightings set under preferences.
Demographic Data
Base 1990 | Current 2002 | Projected 2007 | % Change 1990-2002 | % Change 2002-2007 | |||||||||||
Total Population: | 16,986,510 |
| 21,607,740 |
| 23,490,188 |
| 27.21 |
| 8.71 |
| |||||
0–14 Age Group (%): | 24 |
| 23 |
| 23 |
| 24.06 |
| 5.57 |
| |||||
15–34 Age Group (%): | 34 |
| 30 |
| 30 |
| 13.75 |
| 9.04 |
| |||||
35–54 Age Group (%): | 25 |
| 28 |
| 28 |
| 47.30 |
| 6.05 |
| |||||
55+ Age Group (%): | 18 |
| 18 |
| 19 |
| 29.28 |
| 16.46 |
| |||||
Total Households: | 6,070,937 |
| 7,664,020 |
| 8,336,645 |
| 26.24 |
| 8.78 |
| |||||
$0–24K Households (%): | 46 |
| 27 |
| 21 |
| -27.64 |
| -13.44 |
| |||||
$25–50K Households (%): | 32 |
| 27 |
| 25 |
| 6.03 |
| 0.04 |
| |||||
$50K+ Households (%): | 21 |
| 46 |
| 54 |
| 172.78 |
| 26.68 |
| |||||
Average Household Income: | 35,668 |
| 64,606 |
| 80,334 |
| 81.13 |
| 24.34 |
| |||||
Median Household Income: | 27,014 |
| 45,923 |
| 54,549 |
| 70.00 |
| 18.78 |
| |||||
Per Capita Income: | 12,882 |
| 23,263 |
| 28,898 |
| 80.59 |
| 24.22 |
| |||||
Source: Claritas |
Source: SNL Financial, Charlottesville, VA Page 1 04/25/2003
Market Share and Demographic Profile
Henderson Citizens Bancshares, Inc.
Bank
By County
Number of Branches | Company Deposits in Market ($000) | Deposit Market Share (%) | Percent of State Franchise (%) | Percent of National Franchise (%) | Total Population 2002 (Actual) | Population Change 1990-2002 (%) | Projected Population Change 2002-2007 (%) | Median HH Income 2002 ($) | HH Income Change 1990-2002 (%) | Projected HH Income Change 2002-2007 (%) | ||||||||||||
Texas (TX) | ||||||||||||||||||||||
Rusk | 5 | 280,328 | 56.33 | 57.91 | 57.91 | 48,456 | 10.79 | 4.75 | 31,867 | 43.47 | 11.22 | |||||||||||
Henderson | 3 | 67,575 | 10.88 | 13.96 | 13.96 | 76,972 | 31.48 | 11.47 | 33,812 | 63.05 | 16.62 | |||||||||||
Harrison | 2 | 49,341 | 9.19 | 10.19 | 10.19 | 63,419 | 10.33 | 4.80 | 34,240 | 51.51 | 11.25 | |||||||||||
Marion | 1 | 45,375 | 65.68 | 9.37 | 9.37 | 11,113 | 11.31 | 3.94 | 21,260 | 38.93 | 12.12 | |||||||||||
Gregg | 3 | 26,568 | 1.65 | 5.49 | 5.49 | 112,021 | 6.74 | 1.66 | 40,253 | 58.02 | 12.43 | |||||||||||
Navarro | 2 | 14,929 | 3.16 | 3.08 | 3.08 | 45,992 | 15.19 | 4.87 | 37,458 | 74.45 | 18.39 | |||||||||||
TX totals: | 16 | 484,116 | 100.00 | 100.00 | 357,973 | |||||||||||||||||
Weighted Average: Texas Franchise | 13.59 | 5.45 | 32,019 | 48.35 | 12.35 | |||||||||||||||||
Aggregate: Entire State of Texas | 21,607,740 | 27.21 | 8.71 | 45,923 | 70.00 | 18.78 | ||||||||||||||||
Aggregate: National | 286,815,104 | 15.32 | 4.78 | 47,065 | 56.60 | 16.31 |
Weighted Average is calculated as the sum of (Percent of State/National Franchise * demographic item) within each market.
Deposit Market Share Analysis
Henderson Citizens Bcshs Inc.
Bank
Pending Ownership, including Bank, Savings Bank, Thrift Branches
Ownership as of: 01/22/2003
Holding Company Level
Markets grouped by County, Top 10 institutions included
COUNTY: Rusk, TX
Rank | Institution | Type | Branch Count | Total Deposits in Market ($000) | Total Market Share (%) | Weighted Deposits in Market ($000) | Weighted Market Share (%) | Deposit HHI | Percent of Parent Deposits (%) | |||||||||
1 | Henderson Citizens Bcshs Inc. (TX) | Bank | 5 | 280,328 | 56.33 | 280,328 | 59.90 | 3,588 | 57.91 | |||||||||
2 | Texas Bank (TX) | Bank | 2 | 73,864 | 14.84 | 73,864 | 15.78 | 249 | 77.03 | |||||||||
3 | Henderson FSA (TX) | Thrift | 1 | 59,287 | 11.91 | 29,644 | 6.33 | 40 | 100.00 | |||||||||
4 | Bank of America Corp. (NC) | Bank | 1 | 42,436 | 8.53 | 42,436 | 9.07 | 82 | 0.01 | |||||||||
5 | Overton Financial Corporation (TX) | Bank | 2 | 41,277 | 8.29 | 41,277 | 8.82 | 78 | 7.10 | |||||||||
6 | Woodforest Financial Group (TX) | Bank | 1 | 443 | 0.09 | 443 | 0.09 | 0 | 0.04 | |||||||||
Totals | 6 | 12 | 497,635 | 467,992 | 4,037 |
COUNTY: Hensderson, TX
Rank | Institution | Type | Branch Count | Total Deposits in Market ($000) | Total Market Share (%) | Weighted Deposits in Market ($000) | Weighted Market Share (%) | Deposit HHI | Percent of Parent Deposits (%) | |||||||||
1 | First National Bank (TX) | Bank | 3 | 179,128 | 28.84 | 179,128 | 29.74 | 885 | 92.69 | |||||||||
2 | Jane Austin Chapman Ltd Prtnsh (TX) | Bank | 3 | 167,200 | 26.92 | 167,200 | 27.76 | 771 | 18.49 | |||||||||
3 | Cedar Creek Bancshares, Inc. (TX) | Bank | 3 | 69,356 | 11.17 | 69,356 | 11.52 | 133 | 77.25 | |||||||||
4 | Henderson Citizens Bcshs Inc. (TX) | Bank | 3 | 67,575 | 10.88 | 67,575 | 11.22 | 126 | 13.96 | |||||||||
5 | Kidd Partners, Ltd. (TX) | Bank | 3 | 40,965 | 6.60 | 40,965 | 6.80 | 46 | 34.89 | |||||||||
6 | First State Bank of Brownsboro (TX) | Bank | 2 | 39,434 | 6.35 | 39,434 | 6.55 | 43 | 100.00 | |||||||||
7 | Jacksonville Bancorp Inc. (TX) | Thrift | 1 | 37,710 | 6.07 | 18,855 | 3.13 | 10 | 11.19 | |||||||||
8 | First National Bank (TX) | Bank | 2 | 12,465 | 2.01 | 12,465 | 2.07 | 4 | 28.67 | |||||||||
9 | Woodforest Financial Group (TX) | Bank | 2 | 7,303 | 1.18 | 7,303 | 1.21 | 1 | 0.65 | |||||||||
Totals | 9 | 24 | 621,136 | 602,281 | 2,019 |
COUNTY: Harrison, TX
Rank | Institution | Type | Branch Count | Total Deposits in Market ($000) | Total Market Share (%) | Weighted Deposits in Market ($000) | Weighted Market Share (%) | Deposit HHI | Percent of Parent Deposits (%) | |||||||||
1 | Hibernia Corp. (LA) | Bank | 2 | 153,834 | 28.64 | 153,834 | 29.80 | 888 | 1.26 | |||||||||
2 | Bank One Corp. (IL) | Bank | 1 | 100,677 | 18.74 | 100,677 | 19.50 | 380 | 0.07 | |||||||||
3 | BancorpSouth Inc. (MS) | Bank | 3 | 88,117 | 16.40 | 88,117 | 17.07 | 291 | 1.06 | |||||||||
4 | Henderson Citizens Bcshs Inc. (TX) | Bank | 2 | 49,341 | 9.19 | 49,341 | 9.56 | 91 | 10.19 | |||||||||
5 | Temple-Inland, Inc. (TX) | Thrift | 1 | 41,832 | 7.79 | 20,916 | 4.05 | 16 | 0.47 | |||||||||
6 | Overton Financial Corporation (TX) | Bank | 1 | 34,167 | 6.36 | 34,167 | 6.62 | 44 | 5.88 | |||||||||
7 | East Texas Bancorp, Inc. (TX) | Bank | 2 | 28,924 | 5.38 | 28,924 | 5.60 | 31 | 67.43 | |||||||||
8 | Ruff Partners, Limited (TX) | Bank | 1 | 20,927 | 3.90 | 20,927 | 4.05 | 16 | 86.59 | |||||||||
9 | Jane Austin Chapman Ltd Prtnsh (TX) | Bank | 1 | 13,481 | 2.51 | 13,481 | 2.61 | 7 | 1.49 | |||||||||
10 | Panola National Bancshares Inc (TX) | Bank | 1 | 5,175 | 0.96 | 5,175 | 1.00 | 1 | 8.58 | |||||||||
Totals | 11 | 17 | 537,141 | 516,225 | 1,767 |
COUNTY: Marrison, TX
Rank | Institution | Type | Branch Count | Total Deposits in Market ($000) | Total Market Share (%) | Weighted Deposits in Market ($000) | Weighted Market Share (%) | Deposit HHI | Percent of Parent Deposits (%) | |||||||||
1 | Henderson Citizens Bcshs Inc. (TX) | Bank | 1 | 45,375 | 65.68 | 45,375 | 65.68 | 4,314 | 9.37 | |||||||||
2 | Chalybeate Springs Corporation (TX) | Bank | 1 | 23,709 | 34.32 | 23,709 | 34.32 | 1,178 | 19.74 | |||||||||
Totals | 2 | 2 | 69,084 | 69,084 | 5,492 |
COUNTY: Gregg, TX
Rank | Institution | Type | Branch Count | Total Deposits in Market ($000) | Total Market Share (%) | Weighted Deposits in Market ($000) | Weighted Market Share (%) | Deposit HHI | Percent of Parent Deposits (%) | |||||||||
1 | Overton Financial Corporation (TX) | Bank | 5 | 371,527 | 23.04 | 371,527 | 24.47 | 599 | 63.90 | |||||||||
2 | Regions Financial Corp. (AL) | Bank | 5 | 260,087 | 16.13 | 260,087 | 17.13 | 293 | 0.91 | |||||||||
3 | Bank One Corp. (IL) | Bank | 2 | 242,933 | 15.06 | 242,933 | 16.00 | 256 | 0.17 | |||||||||
4 | Temple-Inland, Inc. (TX) | Thrift | 2 | 157,757 | 9.78 | 78,879 | 5.19 | 27 | 1.77 | |||||||||
5 | Century Capital Financial, Inc (TX) | Bank | 4 | 106,556 | 6.61 | 106,556 | 7.02 | 49 | 100.00 | |||||||||
6 | East Texas Financial Corp. (TX) | Bank | 2 | 74,530 | 4.62 | 74,530 | 4.91 | 24 | 32.02 | |||||||||
7 | Spring Hill Holdings Corp. (TX) | Bank | 1 | 70,297 | 4.36 | 70,297 | 4.63 | 21 | 100.00 | |||||||||
8 | Southside Bancshares Inc. (TX) | Bank | 4 | 67,799 | 4.20 | 67,799 | 4.47 | 20 | 8.58 | |||||||||
9 | Hibernia Corp. (LA) | Bank | 3 | 62,209 | 3.86 | 62,209 | 4.10 | 17 | 0.51 | |||||||||
10 | Jane Austin Chapman Ltd Prtnsh (TX) | Bank | 2 | 61,693 | 3.83 | 61,693 | 4.06 | 17 | 6.82 |
13 | Henderson Citizens Bcshs Inc. (TX) | Bank | 3 | 26,568 | 1.65 | 26,568 | 1.75 | 3 | 5.49 | |||||||||
Totals | 17 | 45 | 1,612,816 | 1,518,412 | 1,335 | |||||||||||||
COUNTY: Navarro, TX | ||||||||||||||||||
Rank | Institution | Type | Branch Count | Total Deposits in Market ($000) | Total Market Share (%) | Weighted Deposits in Market ($000) | Weighted Market Share (%) | Deposit HHI | Percent of Parent Deposits (%) | |||||||||
1 | Community Bank Holdings of TX (TX) | Bank | 2 | 131,874 | 27.95 | 131,874 | 28.59 | 817 | 59.97 | |||||||||
2 | Bank One Corp. (IL) | Bank | 1 | 89,967 | 19.07 | 89,967 | 19.51 | 380 | 0.06 | |||||||||
3 | Bank of America Corp. (NC) | Bank | 1 | 79,176 | 16.78 | 79,176 | 17.17 | 295 | 0.02 | |||||||||
4 | City National Bank (TX) | Bank | 1 | 40,617 | 8.61 | 40,617 | 8.81 | 78 | 100.00 | |||||||||
5 | First State Bk North TX (TX) | Bank | 3 | 35,373 | 7.50 | 35,373 | 7.67 | 59 | 43.18 | |||||||||
6 | Temple-Inland, Inc. (TX) | Thrift | 1 | 21,126 | 4.48 | 10,563 | 2.29 | 5 | 0.24 | |||||||||
7 | Cedar Creek Bancshares, Inc. (TX) | Bank | 1 | 20,428 | 4.33 | 20,428 | 4.43 | 20 | 22.75 | |||||||||
8 | Powell State Bank (TX) | Bank | 1 | 15,017 | 3.18 | 15,017 | 3.26 | 11 | 100.00 | |||||||||
9 | Henderson Citizens Bcshs Inc. (TX) | Bank | 2 | 14,929 | 3.16 | 14,929 | 3.24 | 10 | 3.08 | |||||||||
10 | Dawson Bancshares Inc. (TX) | Bank | 1 | 13,924 | 2.95 | 13,924 | 3.02 | 9 | 76.51 | |||||||||
Totals | 11 | 16 | 471,812 | 461,249 | 1,688 | |||||||||||||
Deposit Market Share Summary
Henderson Citizens Bcshs Inc.
Bank
By County
County | Market Share Rank | Branch Count | Total Deposits in Market ($000) | Total Market Share (%) | Percent of Parent Deposits (%) | Market Deposit HHI | ||||||
Rusk, TX | 1 | 5 | 280,328 | 56.33 | 57.91 | 4,037 | ||||||
Henderson, TX | 4 | 3 | 67,575 | 10.88 | 13.96 | 2,018 | ||||||
Harrison, TX | 4 | 2 | 49,341 | 9.19 | 10.19 | 1,767 | ||||||
Marion, TX | 1 | 1 | 45,375 | 65.68 | 9.37 | 5,492 | ||||||
Gregg, TX | 13 | 3 | 26,568 | 1.65 | 5.49 | 1,335 | ||||||
Navarro, TX | 9 | 2 | 14,929 | 3.16 | 3.08 | 1,688 |
Herfindahl-Hirschman Index Weightings
Bank Deposits are weighted at 100%
Savings Bank Deposits are weighted at 50%
Thrift Deposits are weighted at 50%
Market Share and Demographic Profile
Henderson Citizens Bancshares, Inc.
Bank
By MSA
Number of Branches | Company Deposits in Market ($000) | Deposit Market Share (%) | Percent of National Franchise (%) | Total Population 2002 (Actual) | Population Change 1990-2002 (%) | Projected Population Change 2002-2007 (%) | Median HH Income 2002 ($) | HH Income Change 1990-2002 (%) | Projected HH Income Change 2002-2007 (%) | |||||||||||
MSA | ||||||||||||||||||||
Longview-Marshall | 5 | 75,909 | 2.99 | 52.90 | 211,830 | 9.30 | 3.55 | 36,536 | 52.54 | 12.41 | ||||||||||
Dallas | 3 | 67,575 | 0.14 | 47.10 | 3,688,372 | 37.82 | 11.42 | 59,153 | 81.07 | 22.73 | ||||||||||
Totals: | 8 | 143,484 | 100.00 | 3,900,202 | ||||||||||||||||
Weighted Average | 22.73 | 7.26 | 47,188 | 65.98 | 17.27 | |||||||||||||||
Aggregate: National | 286,815,104 | 15.32 | 4.78 | 47,065 | 56.60 | 16.31 |
Weighted Average is calculated as the sum of (Percent of State/National Franchise * demographic item) within each market.
Deposit Market Share Analysis
Henderson Citizens Bcshs Inc.
Bank
Pending Ownership, including Bank, Savings Bank, Thrift Branches
Ownership as of: 01/22/2003
Holding Company Level
Markets grouped by MSA, Top 10 institutions included
MSA: 4420: Longview-Marshall, TX
Rank | Institution | Type | Branch Count | Total Deposits in Market ($000) | Total Market Share (%) | Weighted Deposits in Market ($000) | Weighted Market Share (%) | Deposit HHI | Percent of Parent Deposits (%) | |||||||||
1 | Overton Financial Corporation (TX) | Bank | 6 | 405,694 | 16.00 | 405,694 | 16.82 | 283 | 69.78 | |||||||||
2 | Bank One Corp. (IL) | Bank | 3 | 343,610 | 13.55 | 343,610 | 14.24 | 203 | 0.24 | |||||||||
3 | Regions Financial Corp. (AL) | Bank | 5 | 260,087 | 10.26 | 260,087 | 10.78 | 116 | 0.91 | |||||||||
4 | Hibernia Corp. (LA) | Bank | 5 | 216,043 | 8.52 | 216,043 | 8.96 | 80 | 1.77 | |||||||||
5 | First Gilmer Bankshares, Inc. (TX) | Bank | 5 | 201,332 | 7.94 | 201,332 | 8.35 | 70 | 77.37 | |||||||||
6 | Temple-Inland, Inc. (TX) | Thrift | 3 | 199,589 | 7.87 | 99,795 | 4.14 | 17 | 2.24 | |||||||||
7 | Gilmer National Bcshrs, Inc. (TX) | Bank | 1 | 139,712 | 5.51 | 139,712 | 5.79 | 34 | 100.00 | |||||||||
8 | Century Capital Financial, Inc (TX) | Bank | 4 | 106,556 | 4.20 | 106,556 | 4.42 | 20 | 100.00 | |||||||||
9 | Jane Austin Chapman Ltd Prtnsh (TX) | Bank | 5 | 104,222 | 4.11 | 104,222 | 4.32 | 19 | 11.52 | |||||||||
10 | BancorpSouth Inc. (MS) | Bank | 3 | 88,117 | 3.48 | 88,117 | 3.65 | 13 | 1.06 | |||||||||
11 | Henderson Citizens Bcshs Inc. (TX) | Bank | 5 | 75,909 | 2.99 | 75,909 | 3.15 | 10 | 15.68 | |||||||||
Totals | 23 | 72 | 2,535,181 | 2,412,295 | 897 |
MSA: 1920: Dallas, TX
Rank | Institution | Type | Branch Count | Total Deposits in Market ($000) | Total Market Share (%) | Weighted Deposits in Market ($000) | Weighted Market Share (%) | Deposit HHI | Percent of Parent Deposits (%) | |||||||||
1 | Bank of America Corp. (NC) | Bank | 121 | 12,433,975 | 24.93 | 12,433,975 | 26.83 | 720 | 3.81 | |||||||||
2 | Bank One Corp. (IL) | Bank | 55 | 7,791,428 | 15.62 | 7,791,428 | 16.81 | 283 | 5.33 | |||||||||
3 | J.P. Morgan Chase & Co. (NY) | Bank | 28 | 3,674,395 | 7.37 | 3,674,395 | 7.93 | 63 | 2.16 | |||||||||
4 | Washington Mutual Inc. (WA) | Thrift | 72 | 2,280,076 | 4.57 | 1,140,038 | 2.46 | 6 | 1.89 | |||||||||
5 | Compass Bancshares Inc. (AL) | Bank | 29 | 2,082,382 | 4.17 | 2,082,382 | 4.49 | 20 | 14.12 | |||||||||
6 | Comerica Inc. (MI) | Bank | 26 | 1,946,802 | 3.90 | 1,946,802 | 4.20 | 18 | 5.13 | |||||||||
7 | Wells Fargo & Co. (CA) | Bank | 68 | 1,923,201 | 3.86 | 1,923,201 | 4.15 | 17 | 1.02 | |||||||||
8 | Temple-Inland, Inc. (TX) | Thrift | 20 | 1,502,724 | 3.01 | 751,362 | 1.62 | 3 | 16.86 | |||||||||
9 | Beal Financial Corp. (TX) | Thrift | 2 | 1,465,768 | �� | 2.94 | 732,884 | 1.58 | 3 | 77.34 |
10 | BOK Financial Corp. (OK) | Bank | 12 | 953,332 | 1.91 | 953,332 | 2.06 | 4 | 12.83 | |||||||||
63 | Henderson Citizens Bcshs Inc. (TX) | Bank | 3 | 67,575 | 0.14 | 67,575 | 0.15 | 0 | 13.96 | |||||||||
Totals | 123 | 822 | 49,883,916 | 46,340,619 | 1,155 |
Deposit Market Share Summary
Henderson Citizens Bcshs Inc.
Bank
By MSA
MSA | Market Share Rank | Branch Count | Total Deposits in Market ($000) | Total Market Share (%) | Percent of Parent Deposits (%) | Market Deposit HHI | ||||||
4420: Longview-Marshall, TX | 11 | 5 | 75,909 | 2.99 | 15.68 | 897 | ||||||
1920: Dallas, TX | 63 | 3 | 67,575 | 0.14 | 13.96 | 1,156 |
Herfindahl-Hirschman Index Weightings
Bank Deposits are weighted at 100%
Savings Bank Deposits are weighted at 50%
Thrift Deposits are weighted at 50%
SECTION VII
HISTORICAL DATA—HCBI
HENDERSON CITIZENS BNCSHRS
HENDERSON, TX
CLIENT PROFILE
($’SINTHOUSANDS)
Sep 2002 (YTD) | Dec 2001 (YTD) | Dec 2000 (YTD) | Dec 1999 (YTD) | Dec 1998 (YTD) | Dec 1997 (YTD) | |||||||
Assets (as a % of Total Assets): | ||||||||||||
Cash & Due: Noninterest-Bearing/TA | 2.67 | 2.73 | 2.69 | 6.11 | 2.45 | 2.48 | ||||||
Cash & Due: Interest-Bearing/TA | 0.37 | 2.26 | 2.46 | 1.36 | 4.44 | 2.29 | ||||||
Cash & Due from Depository Inst/TA | 3.04 | 4.99 | 5.14 | 7.47 | 6.89 | 4.77 | ||||||
Secs: Held-to-Maturity/TA | 17.41 | 10.83 | 12.10 | 15.40 | 19.26 | 19.31 | ||||||
Secs: Available-for-Sale/TA | 30.46 | 35.11 | 36.75 | 33.47 | 33.83 | 41.49 | ||||||
Securities/TA | 47.87 | 45.94 | 48.84 | 48.86 | 53.09 | 60.80 | ||||||
Fed Funds Sold & Sec Purchased/TA | 2.23 | 3.19 | 0.99 | 2.36 | 2.64 | 1.41 | ||||||
Ln&Lse: Net Unearned Income/TA | 41.82 | 40.88 | 40.65 | 37.21 | 33.85 | 29.94 | ||||||
Allow for Loan & Lease Loss/TA | 0.63 | 0.61 | 0.56 | 0.56 | 0.44 | 0.35 | ||||||
Ln&Lse: Net Unearn & All & ATR/TA | 41.19 | 40.28 | 40.10 | 36.65 | 33.41 | 29.59 | ||||||
Trading Assets/TA | 0.00 | 0.00 | 0.00 | 0.00 | 0.00 | 0.00 | ||||||
Premises & Fixed Assets/TA | 2.05 | 2.14 | 1.99 | 1.79 | 1.60 | 1.45 | ||||||
Other Real Estate Owned/TA | 0.02 | 0.02 | 0.00 | 0.04 | 0.03 | 0.05 | ||||||
Investment in Unconsolidated Sub/TA | 0.00 | 0.00 | 0.00 | 0.21 | 0.15 | 0.14 | ||||||
Customers Liability on Accept/TA | 0.00 | 0.00 | 0.00 | 0.00 | 0.00 | 0.00 | ||||||
Intangible Assets/TA | 2.00 | 1.78 | 0.96 | 0.94 | 1.06 | 0.42 | ||||||
Other Assets/TA | 1.60 | 1.66 | 1.97 | 1.68 | 1.12 | 1.37 | ||||||
Total Assets/TA | 100.00 | 100.00 | 100.00 | 100.00 | 100.00 | 100.00 | ||||||
Liabilities: | ||||||||||||
Deps: Domestic Noninterest-Bear/TA | 13.55 | 13.36 | 12.54 | 11.39 | 11.10 | 9.13 | ||||||
Deps: Domestic Interest-Bearing/TA | 76.06 | 76.36 | 76.95 | 78.95 | 78.25 | 80.72 | ||||||
Deps in Foreign Offices/TA | 0.00 | 0.00 | 0.00 | 0.00 | 0.00 | 0.00 | ||||||
Total Deposits/TA | 89.61 | 89.72 | 89.48 | 90.34 | 89.35 | 89.85 | ||||||
Fed Funds Purch & Sec Sold/TA | 0.00 | 0.00 | 0.00 | 0.00 | 0.00 | 0.00 | ||||||
Trading Liabilities/TA | 0.00 | 0.00 | 0.00 | 0.00 | 0.00 | 0.00 | ||||||
Other Borrowed Money/TA | 0.56 | 0.78 | 0.27 | 0.00 | 0.59 | 0.24 | ||||||
Banks Liab on Acceptances/TA | 0.00 | 0.00 | 0.00 | 0.00 | 0.00 | 0.00 | ||||||
Subordinated Notes & Debs/TA | 0.00 | 0.00 | 0.00 | 0.00 | 0.00 | 0.00 | ||||||
Other Liabilities/TA | 1.15 | 1.19 | 1.01 | 0.57 | 0.78 | 0.78 | ||||||
Minority Interest & Similar Items/TA | 0.00 | 0.00 | 0.00 | 0.00 | 0.00 | 0.00 | ||||||
Total Liabilities & Minority Int/TA | 91.32 | 91.69 | 90.77 | 90.91 | 90.72 | 90.87 | ||||||
Equity Capital: | ||||||||||||
Limited-Life Preferred Stk/TA | N/A | N/A | N/A | N/A | N/A | N/A | ||||||
Perpetual Preferred Stock/TA | 0.00 | 0.00 | 0.00 | 0.00 | 0.00 | 0.00 | ||||||
Common Stock/TA | 1.98 | 2.05 | 2.55 | 2.74 | 2.79 | 3.01 | ||||||
Capital Surplus/TA | 0.99 | 1.02 | 1.27 | 1.37 | 1.40 | 1.51 | ||||||
Retained Earnings/TA | 6.01 | 5.53 | 6.11 | 6.01 | 5.45 | 5.27 | ||||||
Accumulated Oth Comprehensv Inc/TA | 0.14 | 0.17 | -0.14 | -0.49 | 0.17 | -0.09 | ||||||
Frgn Curr Transl Adjust/TA | N/A | N/A | 0.00 | 0.00 | 0.00 | 0.00 | ||||||
Other Equity Capital Components/TA | -0.44 | -0.46 | N/A | N/A | N/A | N/A | ||||||
Treasury Stock/TA | N/A | N/A | 0.57 | 0.54 | 0.52 | 0.56 | ||||||
Total Equity Capital/TA | 8.68 | 8.31 | 9.23 | 9.09 | 9.28 | 9.13 | ||||||
Total Liab & Equity Cap/TA | 100.00 | 100.00 | 100.00 | 100.00 | 100.00 | 100.00 |
(c) 2002 Sheshunoff Information Services, Inc.
HENDERSON CITIZENS BNCSHRS
HENDERSON, TX
CLIENT PROFILE
($’SINTHOUSANDS)
Sep 2002 (YTD) | Dec 2001 (YTD) | Dec 2000 (YTD) | Dec 1999 (YTD) | Dec 1998 (YTD) | Dec 1997 (YTD) | |||||||
BALANCE SHEET: | ||||||||||||
Number of US Branches | 16 | |||||||||||
Total Assets | 545,223 | 528,013 | 423,674 | 393,446 | 386,919 | 358,493 | ||||||
%CH: Total Assets | 5.37 | 24.63 | 7.68 | 1.69 | 7.93 | 0.47 | ||||||
Fed Funds Sold & Sec Purchased | 12,170 | 16,860 | 4,205 | 9,285 | 10,230 | 5,040 | ||||||
Secs: Held-to-Maturity | 94,940 | 57,170 | 51,245 | 60,579 | 74,537 | 69,234 | ||||||
Secs: Available-for-Sale | 166,061 | 185,410 | 155,693 | 131,675 | 130,886 | 148,741 | ||||||
Securities | 261,001 | 242,580 | 206,938 | 192,254 | 205,423 | 217,975 | ||||||
%CH: Securities | 17.65 | 17.22 | 7.64 | -6.41 | -5.76 | -4.46 | ||||||
Ln&Lse: Net Unearned Income | 228,005 | 215,870 | 172,237 | 146,397 | 130,964 | 107,316 | ||||||
%CH: Ln&Lse: Net Unearned Income | 6.35 | 25.33 | 17.65 | 11.78 | 22.04 | 5.24 | ||||||
Total Deposits | 488,583 | 473,730 | 379,122 | 355,423 | 345,720 | 322,107 | ||||||
%CH: Total Deposits | 4.99 | 24.95 | 6.67 | 2.81 | 7.33 | 0.45 | ||||||
Total Loans/Total Deposits | 46.67 | 45.57 | 45.43 | 41.19 | 37.88 | 33.32 | ||||||
Ln&Lse: Net Unearned Income/TA | 41.82 | 40.88 | 40.65 | 37.21 | 33.85 | 29.94 | ||||||
CAPITAL: | ||||||||||||
Total Equity Capital | 47,339 | 43,880 | 39,122 | 35,771 | 35,911 | 32,729 | ||||||
Total Risk-Based Capital | 39,178 | 36,956 | 38,204 | 36,412 | 33,043 | 32,876 | ||||||
Total Equity Capital/TA | 8.68 | 8.31 | 9.23 | 9.09 | 9.28 | 9.13 | ||||||
Risk-Adjusted Capital Ratio | 15.63 | 15.12 | 18.59 | 19.57 | 20.29 | 24.71 | ||||||
Core Capital/Adjusted Total Assets | 6.87 | 6.74 | 8.76 | 8.98 | 8.83 | 9.03 | ||||||
Dividends/Net Income(P) | 22.40 | 250.05 | 37.50 | 35.06 | 36.82 | 39.56 | ||||||
PROFITABILITY: | ||||||||||||
Net Income (Loss) | 4,545 | 4,366 | 3,625 | 3,908 | 3,506 | 3,390 | ||||||
Return on Avg Assets | 1.13 | 0.92 | 0.90 | 1.01 | 0.97 | 0.96 | ||||||
Return on Avg Equity | 13.33 | 10.44 | 9.87 | 10.99 | 10.19 | 10.40 | ||||||
Net Interest Margin (Tax Adj)/AA | 3.44 | 3.24 | 3.26 | 3.41 | 3.33 | 3.31 | ||||||
Net Interest Income/AA | 3.13 | 2.89 | 2.86 | 3.01 | 3.00 | 3.04 | ||||||
Net Overhead Expense/AA | 1.75 | 1.66 | 1.75 | 1.76 | 1.70 | 1.75 | ||||||
Total Noninterest Income/AA | 1.64 | 1.54 | 1.56 | 1.36 | 1.23 | 0.88 | ||||||
Total Noninterest Expense/AA | 3.38 | 3.20 | 3.31 | 3.12 | 2.94 | 2.62 | ||||||
Adjusted Efficiency Ratio | 65.03 | 65.57 | 68.59 | 65.34 | 64.29 | 62.66 | ||||||
ASSET QUALITY: | ||||||||||||
Nonperf Assets/EqtyCap & LLR (H) | 0.56 | 0.53 | 0.65 | 0.48 | 0.63 | 1.11 | ||||||
Nonperf Assets/TA (H) | 0.05 | 0.05 | 0.06 | 0.05 | 0.06 | 0.11 | ||||||
Loan Loss Reserve/TL | 1.50 | 1.48 | 1.37 | 1.50 | 1.30 | 1.16 | ||||||
Loan Loss Reserve/Nonperf Loans | 1,908.38 | 2,028.48 | 905.77 | 1,202.19 | 1,532.43 | 650.52 | ||||||
PastDue 90 Days: Loans & Leases/GL | 0.05 | 0.04 | 0.01 | 0.12 | 0.02 | 0.02 | ||||||
Nonaccruing: Loans & Leases/GL | 0.03 | 0.03 | 0.14 | 0.00 | 0.06 | 0.16 | ||||||
Restructured: Loans & Leases/GL | 0.00 | 0.00 | 0.71 | 0.00 | 0.05 | 0.00 | ||||||
Other Real Estate Owned/TA | 0.02 | 0.02 | 0.00 | 0.04 | 0.03 | 0.05 | ||||||
Net Charge-Offs(YTD)/Average Loans | 0.32 | 0.22 | 0.09 | -0.10 | 0.29 | 0.22 | ||||||
LIQUIDITY: | ||||||||||||
$100,000+ Time Deposits/TD | 17.78 | 12.03 | 12.58 | 12.49 | 12.73 | 16.53 | ||||||
Tot Earning Assets/Int Bear Liabs | 120.46 | 119.63 | 120.36 | 113.74 | 119.26 | 116.65 | ||||||
Pledged Securities/Total Securities | 36.26 | 35.67 | 37.59 | 36.59 | 29.65 | 27.94 | ||||||
Tot Secs: Fair Value to Amtzd Cost | 101.70 | 100.57 | 99.47 | 97.30 | 101.15 | 99.93 |
(c) 2002 Sheshunoff Information Services, Inc.
HENDERSON CITIZENS BNCSHRS
HENDERSON, TX
CLIENT PROFILE
($’SINTHOUSANDS)
Sep 2002 (YTD) | Dec 2001 (YTD) | Dec 2000 (YTD) | Dec 1999 (YTD) | Dec 1998 (YTD) | Dec 1997 (YTD) | |||||||
Assets: | ||||||||||||
Cash & Due: Noninterest-Bearing | 14,536 | 14,390 | 11,386 | 24,040 | 9,493 | 8,886 | ||||||
Cash & Due: Interest-Bearing | 2,012 | 11,946 | 10,403 | 5,357 | 17,174 | 8,212 | ||||||
Cash & Due from Depository Inst | 16,548 | 26,336 | 21,789 | 29,397 | 26,667 | 17,098 | ||||||
Fed Funds Sold & Sec Purchased | 12,170 | 16,860 | 4,205 | 9,285 | 10,230 | 5,040 | ||||||
Secs: Held-to-Maturity | 94,940 | 57,170 | 51,245 | 60,579 | 74,537 | 69,234 | ||||||
Secs: Available-for-Sale | 166,061 | 185,410 | 155,693 | 131,675 | 130,886 | 148,741 | ||||||
Securities | 261,001 | 242,580 | 206,938 | 192,254 | 205,423 | 217,975 | ||||||
Ln&Lse: Net Unearned Income | 228,005 | 215,870 | 172,237 | 146,397 | 130,964 | 107,316 | ||||||
Allow for Loan & Lease Loss | 3,416 | 3,205 | 2,355 | 2,200 | 1,701 | 1,249 | ||||||
Ln&Lse: Net Unearn & All & ATR | 224,589 | 212,665 | 169,882 | 144,197 | 129,263 | 106,067 | ||||||
Trading Assets | 0 | 0 | 0 | 0 | 0 | 0 | ||||||
Premises & Fixed Assets | 11,199 | 11,302 | 8,431 | 7,032 | 6,202 | 5,209 | ||||||
Other Real Estate Owned | 104 | 90 | 10 | 150 | 125 | 186 | ||||||
Investment in Unconsolidated Sub | 0 | 0 | 0 | 814 | 573 | 503 | ||||||
Customers Liability on Accept | 0 | 0 | 0 | 0 | 0 | 0 | ||||||
Intangible Assets | 10,896 | 9,395 | 4,087 | 3,709 | 4,087 | 1,505 | ||||||
Other Assets | 8,716 | 8,785 | 8,332 | 6,608 | 4,349 | 4,910 | ||||||
Total Assets | 545,223 | 528,013 | 423,674 | 393,446 | 386,919 | 358,493 | ||||||
Liabilities: | ||||||||||||
Deps: Domestic Noninterest-Bear | 73,886 | 70,527 | 53,111 | 44,806 | 42,959 | 32,737 | ||||||
Deps: Domestic Interest-Bearing | 414,697 | 403,203 | 326,011 | 310,617 | 302,761 | 289,370 | ||||||
Deps in Foreign Offices | 0 | 0 | 0 | 0 | 0 | 0 | ||||||
Total Deposits | 488,583 | 473,730 | 379,122 | 355,423 | 345,720 | 322,107 | ||||||
Fed Funds Purch & Sec Sold | 0 | 0 | 0 | 0 | 0 | 0 | ||||||
Trading Liabilities | 0 | 0 | 0 | 0 | 0 | 0 | ||||||
Other Borrowed Money | 3,029 | 4,097 | 1,148 | 0 | 2,282 | 844 | ||||||
Banks Liab on Acceptances | 0 | 0 | 0 | 0 | 0 | 0 | ||||||
Subordinated Notes & Debs | 0 | 0 | 0 | 0 | 0 | 0 | ||||||
Other Liabilities | 6,272 | 6,306 | 4,282 | 2,252 | 3,006 | 2,813 | ||||||
Minority Interest&Similar Items | 0 | 0 | 0 | 0 | 0 | 0 | ||||||
Total Liabilities & Minority Int | 497,884 | 484,133 | 384,552 | 357,675 | 351,008 | 325,764 | ||||||
Equity Capital: | ||||||||||||
Limited-Life Preferred Stk | N/A | N/A | N/A | N/A | N/A | N/A | ||||||
Perpetual Preferred Stock | 0 | 0 | 0 | 0 | 0 | 0 | ||||||
Common Stock | 10,800 | 10,800 | 10,800 | 10,800 | 10,800 | 10,800 | ||||||
Capital Surplus | 5,400 | 5,400 | 5,400 | 5,400 | 5,400 | 5,400 | ||||||
Retained Earnings | 32,771 | 29,189 | 25,894 | 23,628 | 21,089 | 18,875 | ||||||
Accumulated Oth Comprehensv Inc | 785 | 903 | -575 | -1,938 | 649 | -335 | ||||||
Frgn Curr Transl Adjust | N/A | N/A | 0 | 0 | 0 | 0 | ||||||
Other Equity Capital Components | -2,417 | -2,412 | N/A | N/A | N/A | N/A | ||||||
Treasury Stock | N/A | N/A | 2,397 | 2,119 | 2,027 | 2,011 | ||||||
Total Equity Capital | 47,339 | 43,880 | 39,122 | 35,771 | 35,911 | 32,729 | ||||||
Total Liab & Equity Cap | 545,223 | 528,013 | 423,674 | 393,446 | 386,919 | 358,493 |
(c) 2002 Sheshunoff Information Services, Inc.
HENDERSON CITIZENS BNCSHRS
HENDERSON, TX
CLIENT PROFILE
($’SINTHOUSANDS)
Sep 2002 (YTD) | Dec 2001 (YTD) | Dec 2000 (YTD) | Dec 1999 (YTD) | Dec 1998 (YTD) | Dec 1997 (YTD) | |||||||
Loans Secured by Real Estate: | ||||||||||||
Construction & Land Loans(D) | 13,224 | 7,437 | 3,704 | 7,479 | 3,281 | 3,295 | ||||||
Farmland Loans(D) | 6,737 | 4,467 | 3,998 | 2,827 | 2,975 | 2,389 | ||||||
1-4 Family Units: | ||||||||||||
Home Equity Loans(D) | 0 | 0 | 0 | 0 | 0 | 0 | ||||||
All Oth:1-4 First Liens(D) | 69,168 | 64,935 | 48,085 | 42,399 | 38,314 | 32,478 | ||||||
All Oth:1-4 Jr Liens(D) | 4,678 | 4,580 | 3,929 | 3,736 | 2,993 | 772 | ||||||
1-4 Family Resdntl Loans(D) | 73,846 | 69,515 | 52,014 | 46,135 | 41,307 | 33,250 | ||||||
5+ Residential Loans(D) | 821 | 1,315 | 895 | 1,397 | 871 | 1,570 | ||||||
Nonfarm Nonresidential Loans(D) | 32,128 | 31,441 | 27,444 | 20,097 | 15,770 | 9,618 | ||||||
Real Estate Loans(D) | 126,756 | 114,175 | 88,055 | 77,935 | 64,204 | 50,122 | ||||||
Depository Institutions: | ||||||||||||
Lns&Accept to Dep Inst(D) | 0 | 500 | 0 | 0 | 0 | 0 | ||||||
Agricultural: | ||||||||||||
Agric Prod & Farm Loans(D) | 8,504 | 8,658 | 5,459 | 4,708 | 5,297 | 4,789 | ||||||
Commercial & Industrial: | ||||||||||||
Comml & Indust Loans(D) | 31,931 | 30,490 | 22,638 | 15,737 | 15,043 | 13,113 | ||||||
Consumer Loans: | ||||||||||||
Other Loans to Individuals(C) | 35,428 | 38,318 | 32,767 | 30,562 | 32,305 | 29,888 | ||||||
Credit Card Lns & Plans(C) | 988 | 775 | 452 | 393 | 194 | 228 | ||||||
Loans to Individuals(D) | 36,416 | 39,093 | 33,219 | 30,955 | 32,499 | 30,116 | ||||||
Loans to Foreign Governments: | ||||||||||||
Loans to Foreign Govts(D) | 0 | 0 | 0 | 0 | 0 | 0 | ||||||
All Other Loans: | ||||||||||||
All Other Loans(D) | 4,299 | 3,081 | 2,262 | 2,887 | 1,814 | 588 | ||||||
Lease Financing Receivables: | ||||||||||||
Lease Financing Recvbl(D) | 20,103 | 19,890 | 20,667 | 14,307 | 12,479 | 9,290 | ||||||
Unearned Income on Loans(D) | 4 | 17 | 63 | 132 | 372 | 702 | ||||||
Total Domestic Loans & Leases | 228,005 | 215,870 | 172,237 | 146,397 | 130,964 | 107,316 |
(c) 2002 Sheshunoff Information Services, Inc.
HENDERSON CITIZENS BNCSHRS
HENDERSON, TX
CLIENT PROFILE
($’SINTHOUSANDS)
Sep 2002 (YTD) | Dec 2001 (YTD) | Dec 2000 (YTD) | Dec 1999 (YTD) | Dec 1998 (YTD) | Dec 1997 (YTD) | |||||||
Loans as a % of Gross Loans | ||||||||||||
Loans Secured by Real Estate: | ||||||||||||
Real Estate Development: | ||||||||||||
Domestic Construction Loans/GL | 5.80 | 3.44 | 2.15 | 5.10 | 2.50 | 3.05 | ||||||
Domestic Commercial RE Loans/GL | 14.09 | 14.56 | 15.93 | 13.72 | 12.01 | 8.90 | ||||||
1-4 Family Units: | ||||||||||||
Domestic Home Equity Loans/GL | 0.00 | 0.00 | 0.00 | 0.00 | 0.00 | 0.00 | ||||||
Domestic Home Mortgage Loans/GL | 32.39 | 32.20 | 30.19 | 31.49 | 31.45 | 30.78 | ||||||
Tot Dom Home Mtg&Equity Loans/GL | 32.39 | 32.20 | 30.19 | 31.49 | 31.45 | 30.78 | ||||||
Domestic 5+ Family Resdntl Loans/GL | 0.36 | 0.61 | 0.52 | 0.95 | 0.66 | 1.45 | ||||||
Domestic Farmland Loans/GL | 2.95 | 2.07 | 2.32 | 1.93 | 2.27 | 2.21 | ||||||
Real Estate Loans/GL | 55.59 | 52.89 | 51.11 | 53.19 | 48.89 | 46.40 | ||||||
Depository Institutions: | ||||||||||||
Domestic Lns to Dep Institutions/GL | 0.00 | 0.23 | 0.00 | 0.00 | 0.00 | 0.00 | ||||||
Agricultural: | ||||||||||||
Domestic Agricultural Loans/GL | 3.73 | 4.01 | 3.17 | 3.21 | 4.03 | 4.43 | ||||||
Commercial & Industrial: | ||||||||||||
Domestic Comml & Indust Lns/GL | 14.00 | 14.12 | 13.14 | 10.74 | 11.45 | 12.14 | ||||||
Consumer Loans: | ||||||||||||
Domestic Consumer Loans/GL | 15.97 | 18.11 | 19.28 | 21.13 | 24.74 | 27.88 | ||||||
Loans to Foreign Governments: | ||||||||||||
Domestic Loans to Foreign Govts/GL | 0.00 | 0.00 | 0.00 | 0.00 | 0.00 | 0.00 | ||||||
All Other Loans: | ||||||||||||
All Other Domestic Loans/GL | 1.89 | 1.43 | 1.31 | 1.97 | 1.38 | 0.54 | ||||||
Lease Financing Receivables: | ||||||||||||
Domestic Lease Receivables/GL | 8.82 | 9.21 | 11.99 | 9.76 | 9.50 | 8.60 |
(c) 2002 Sheshunoff Information Services, Inc.
HENDERSON CITIZENS BNCSHRS
HENDERSON, TX
CLIENT PROFILE
($’SINTHOUSANDS)
Sep 2002 (YTD) | Dec 2001 (YTD) | Dec 2000 (YTD) | Dec 1999 (YTD) | Dec 1998 (YTD) | Dec 1997 (YTD) | |||||||
LOANS PAST DUE 90+ DAYS | ||||||||||||
Real Estate: | ||||||||||||
PD90+:Const&Land(D) | 0 | 0 | 0 | 0 | 0 | 0 | ||||||
PD90+:Farmland(D) | 0 | 0 | 0 | 0 | 0 | 0 | ||||||
PD90+:Home Equity Loans | 0 | 0 | 0 | 0 | 0 | 0 | ||||||
PD90+:Closed-end 1-4 Family | 40 | 0 | 0 | 25 | 21 | 0 | ||||||
PD90+:1-4 Family(D) | 40 | 0 | 0 | 25 | 21 | 0 | ||||||
PD90+:5+ Family(D) | 0 | 0 | 0 | 0 | 0 | 0 | ||||||
PD90+:Nonfarm(D) | 0 | 0 | 0 | 0 | 0 | 0 | ||||||
PD90+:RE Loans | 40 | 0 | 0 | 25 | 21 | 0 | ||||||
Consumer Loans: | ||||||||||||
PD90+:Credit Card Loans | 0 | 0 | N/A | N/A | N/A | N/A | ||||||
PD90+:Other Loans to Indiv | 5 | 14 | N/A | N/A | N/A | N/A | ||||||
PD90+:Loans to Individuals | 5 | 14 | 6 | 15 | 9 | 20 | ||||||
Commercial & All Other: | ||||||||||||
PD90+:Comml&Indust Loans | 60 | 70 | 12 | 10 | 0 | 0 | ||||||
PD90+:Agric Prod Loans | 0 | 0 | 0 | 0 | 0 | 0 | ||||||
PD90+:All Other Loans | 0 | 0 | 0 | 0 | 0 | 0 | ||||||
PD90+:Lease Fin Recvbl | 0 | 0 | 0 | 133 | 0 | 0 | ||||||
Past Due:Comml & Oth Lns&Lse (H) | 60 | 70 | 12 | 143 | 0 | 0 | ||||||
PD90+:Total Loans & Lease | 105 | 84 | 18 | 183 | 30 | 20 | ||||||
PD90+:Debt Sec & Other Assets | 0 | 0 | 0 | 0 | 0 | 0 | ||||||
PD90+:Tot Ln, Lse&Other Assets | 105 | 84 | 18 | 183 | 30 | 20 | ||||||
PD90+:Grntd Portion | 0 | 0 | 0 | 0 | 0 | 0 | ||||||
MEMORANDUM | ||||||||||||
LOANS PAST DUE 30-89 DAYS | ||||||||||||
PD30-89:RE Loans | 874 | 1,931 | N/A | N/A | N/A | N/A | ||||||
PD30-89:Loans to Individual | 565 | 615 | N/A | N/A | N/A | N/A | ||||||
PD30-89:Comml&Indust Loans | 491 | 206 | N/A | N/A | N/A | N/A | ||||||
PD30-89:Debt Sec & Other Assets | 0 | 0 | N/A | N/A | N/A | N/A | ||||||
PD30-89:Tot Ln, Lse&Other Assets | 1,958 | 3,242 | N/A | N/A | N/A | N/A |
(c) 2002 Sheshunoff Information Services, Inc.
HENDERSON CITIZENS BNCSHRS
HENDERSON, TX
CLIENT PROFILE
($’SINTHOUSANDS)
Sep 2002 (YTD) | Dec 2001 (YTD) | Dec 2000 (YTD) | Dec 1999 (YTD) | Dec 1998 (YTD) | Dec 1997 (YTD) | |||||||
NONACCRUAL LOANS | ||||||||||||
Real Estate: | ||||||||||||
Nonaccrual: Const & Land(D) | 0 | 0 | 0 | 0 | 0 | 0 | ||||||
Nonaccrual: Farmland(D) | 0 | 0 | 0 | 0 | 0 | 0 | ||||||
Nonaccrual: Home Equity Loans | 0 | 0 | 0 | 0 | 0 | 0 | ||||||
Nonaccrual: Closed-end 1-4 Family | 0 | 0 | 0 | 0 | 0 | 0 | ||||||
Nonaccrual: 1-4 Family(D) | 0 | 0 | 0 | 0 | 0 | 0 | ||||||
Nonaccrual: 5+ Family(D) | 0 | 0 | 0 | 0 | 0 | 0 | ||||||
Nonaccrual: Nonfarm(D) | 0 | 0 | 113 | 0 | 0 | 0 | ||||||
Nonaccrual: RE Loans | 0 | 0 | 113 | 0 | 0 | 0 | ||||||
Consumer: | ||||||||||||
Nonaccrual: Credit Card Loans | 0 | 0 | N/A | N/A | N/A | N/A | ||||||
Nonaccrual: Other Loans to Indiv | 0 | 0 | N/A | N/A | N/A | N/A | ||||||
Nonaccrual: Loans to Individuals | 0 | 0 | 0 | 0 | 2 | 0 | ||||||
Commercial & All Other: | ||||||||||||
Nonaccrual: Comml & Indust Loans | 0 | 0 | 54 | 0 | 79 | 172 | ||||||
Nonaccrual: Agric Prod Loans | 74 | 74 | 75 | 0 | 0 | 0 | ||||||
Nonaccrual: All Other Loans | 0 | 0 | 0 | 0 | 0 | 0 | ||||||
Nonaccrual: Lease Fin Recvbl | 0 | 0 | 0 | 0 | 0 | 0 | ||||||
Nonaccr: Comml & Oth Lns & Lse (H) | 74 | 74 | 129 | 0 | 79 | 172 | ||||||
Nonaccrual: Total Loans & Lease | 74 | 74 | 242 | 0 | 81 | 172 | ||||||
Nonaccrual: Debt Sec & Other Assets | 0 | 0 | 0 | 0 | 0 | 0 | ||||||
Nonaccrual: Tot Ln, Lse & Oth Assets | 74 | 74 | 242 | 0 | 81 | 172 | ||||||
Nonaccrual: Grntd Portion | 0 | 0 | 0 | 0 | 0 | 0 | ||||||
OTHER REAL ESTATE OWNED | ||||||||||||
Other Real Estate Owned | 104 | 90 | 10 | 150 | 125 | 186 | ||||||
TOTAL NONPERFORMING ASSETS | ||||||||||||
Total Nonperforming Assets (H) | 283 | 248 | 270 | 333 | 236 | 378 |
(c) 2002 Sheshunoff Information Services, Inc.
HENDERSON CITIZENS BNCSHRS
HENDERSON, TX
CLIENT PROFILE
($’SINTHOUSANDS)
Sep 2002 (YTD) | Dec 2001 (YTD) | Dec 2000 (YTD) | Dec 1999 (YTD) | Dec 1998 (YTD) | Dec 1997 (YTD) | |||||||
CHARGE-OFFS | ||||||||||||
Real Estate: | ||||||||||||
ChgOff: Const & Land(D) | 0 | 0 | 0 | 0 | 0 | 0 | ||||||
ChgOff: Farmland(D) | 0 | 0 | 0 | 0 | 0 | 0 | ||||||
ChgOff: Home Equity Loans | 0 | 0 | 0 | 0 | 0 | 0 | ||||||
ChgOff: Closed-end 1-4 Lns | 0 | 31 | 31 | 27 | 26 | 1 | ||||||
ChgOff: 1-4 Family(D) | 0 | 31 | 31 | 27 | 26 | 1 | ||||||
ChgOff: 5+ Family(D) | 0 | 0 | 0 | 0 | 0 | 0 | ||||||
ChgOff: Nonfarm(D) | 27 | 0 | 12 | 0 | 0 | 0 | ||||||
ChgOff: RE Lns in Frgn Offices | 0 | 0 | N/A | N/A | N/A | N/A | ||||||
ChgOff: RE Loans | 27 | 31 | 43 | 27 | 26 | 1 | ||||||
Consumer: | ||||||||||||
ChgOff: Credit Card Loans | 0 | 2 | N/A | N/A | N/A | N/A | ||||||
ChgOff: Other Loans to Indiv | 582 | 511 | N/A | N/A | N/A | N/A | ||||||
ChgOff: Loans to Individuals | 582 | 513 | 502 | 528 | 455 | 289 | ||||||
Commercial & All Other: | ||||||||||||
ChgOff: Lns Dep Inst US | 0 | 0 | 0 | 0 | 0 | 0 | ||||||
ChgOff: Lns Frgn Banks | 0 | 0 | 0 | 0 | 0 | 0 | ||||||
ChgOff: Agric Prod Lns | 9 | 9 | 13 | 9 | 16 | 42 | ||||||
ChgOff: C&I Loans US | 102 | 80 | 27 | 326 | 62 | 15 | ||||||
ChgOff: C&I Loans NonUS | 0 | 0 | 0 | 0 | 0 | 0 | ||||||
ChgOff: Loans to Frgn Govts | 0 | 0 | 0 | 0 | 0 | 0 | ||||||
ChgOff: All Other Loans | 0 | 0 | 0 | 0 | 0 | 0 | ||||||
ChgOff: Lse Financing US | 0 | 0 | 0 | 0 | 0 | 0 | ||||||
ChgOff: Lse Financing NonUS | 0 | 0 | 0 | 0 | 0 | 0 | ||||||
ChgOff: Comml Non-RE Lns | 0 | 0 | 0 | 0 | 0 | 0 | ||||||
Total Charge-Offs | 720 | 633 | 585 | 890 | 559 | 347 |
(c) 2002 Sheshunoff Information Services, Inc.
HENDERSON CITIZENS BNCSHRS
HENDERSON, TX
CLIENT PROFILE
($’SINTHOUSANDS)
Sep 2002 (YTD) | Dec 2001 (YTD) | Dec 2000 (YTD) | Dec 1999 (YTD) | Dec 1998 (YTD) | Dec 1997 (YTD) | |||||||
RECOVERIES | ||||||||||||
Real Estate: | ||||||||||||
Recov: Const & Land(D) | 0 | 0 | 0 | 0 | 0 | 0 | ||||||
Recov: Farmland(D) | 0 | 0 | 0 | 0 | 0 | 0 | ||||||
Recov: Home Equity Loans | 0 | 0 | 0 | 0 | 0 | 0 | ||||||
Recov: Closed-end 1-4 Lns | 0 | 0 | 6 | 11 | 0 | 0 | ||||||
Recov: 1-4 Family(D) | 0 | 0 | 6 | 11 | 0 | 0 | ||||||
Recov: 5+ Family(D) | 0 | 0 | 0 | 0 | 0 | 0 | ||||||
Recov: Nonfarm(D) | 0 | 0 | 0 | 0 | 0 | 0 | ||||||
Recov: RE Lns in Frgn Offices | 0 | 0 | N/A | N/A | N/A | N/A | ||||||
Recov: RE Loans | 0 | 0 | 6 | 11 | 0 | 0 | ||||||
Consumer: | ||||||||||||
Recov: Credit Card Loans | 0 | 0 | N/A | N/A | N/A | N/A | ||||||
Recov: Other Loans to Indiv | 174 | 204 | N/A | N/A | N/A | N/A | ||||||
Recov: Loans to Individuals | 174 | 204 | 234 | 228 | 154 | 70 | ||||||
Commercial & All Other: | ||||||||||||
Recov: Lns Dep Inst US | 0 | 0 | 0 | 0 | 0 | 0 | ||||||
Recov: Lns Frgn Banks | 0 | 0 | 0 | 0 | 0 | 0 | ||||||
Recov: Agric Prod Lns | 7 | 6 | 17 | 6 | 13 | 14 | ||||||
Recov: C & I Loans US | 10 | 10 | 185 | 790 | 56 | 35 | ||||||
Recov: C & I Loans NonUS | 0 | 0 | 0 | 0 | 0 | 0 | ||||||
Recov: Loans to Frgn Govts | 0 | 0 | 0 | 0 | 0 | 0 | ||||||
Recov: All Other Loans | 0 | 0 | 0 | 0 | 0 | 0 | ||||||
Recov: Lse Financing US | 0 | 0 | 0 | 0 | 0 | 0 | ||||||
Recov: Lse Financing NonUS | 0 | 0 | 0 | 0 | 0 | 0 | ||||||
Recov: Comml Non-RE Lns | 0 | 0 | 0 | 0 | 0 | 0 | ||||||
Total Recoveries | 191 | 220 | 442 | 1,035 | 223 | 119 | ||||||
NET CHARGE-OFFS | ||||||||||||
Total Net Charge-Offs | 529 | 413 | 143 | -145 | 336 | 228 |
(c) 2002 Sheshunoff Information Services, Inc.
HENDERSON CITIZENS BNCSHRS
HENDERSON, TX
CLIENT PROFILE
($’SINTHOUSANDS)
Sep 2002 (YTD) | Dec 2001 (YTD) | Dec 2000 (YTD) | Dec 1999 (YTD) | Dec 1998 (YTD) | Dec 1997 (YTD) | |||||||
Total Interest Income | 21,124 | 28,861 | 25,527 | 23,166 | 22,234 | 22,266 | ||||||
Total Interest Expense | 8,503 | 15,062 | 14,015 | 11,576 | 11,377 | 11,545 | ||||||
Net Interest Income | 12,621 | 13,799 | 11,512 | 11,590 | 10,857 | 10,721 | ||||||
Net Int Inc(Tax Adj) | 13,859 | 15,459 | 13,140 | 13,157 | 12,047 | 11,688 | ||||||
Prov for Loan & Lease Losses | 740 | 777 | 290 | 354 | 623 | 330 | ||||||
Total Noninterest Income | 6,593 | 7,323 | 6,268 | 5,226 | 4,461 | 3,099 | ||||||
Total Noninterest Expense | 13,640 | 15,259 | 13,313 | 12,011 | 10,613 | 9,266 | ||||||
Inc Before Gain(Loss) on Sec (H) | 4,834 | 5,086 | 4,177 | 4,451 | 4,082 | 4,224 | ||||||
Gain(Loss) on Securities | 1,065 | 65 | 0 | 187 | 292 | 191 | ||||||
Inc Bef Tax & Other Adj | 5,899 | 5,151 | 4,177 | 4,638 | 4,374 | 4,415 | ||||||
Applicable Income Taxes | 1,354 | 785 | 552 | 730 | 868 | 1,025 | ||||||
Minority Interest | 0 | 0 | 0 | 0 | 0 | 0 | ||||||
Inc Before Extraordinary Items | 4,545 | 4,366 | 3,625 | 3,908 | 3,506 | 3,390 | ||||||
Extraordinary Items, Net | 0 | 0 | 0 | 0 | 0 | 0 | ||||||
Net Income (Loss) | 4,545 | 4,366 | 3,625 | 3,908 | 3,506 | 3,390 | ||||||
Interest & Fee Income on Loans: | ||||||||||||
Inc:Loans in Domestic Offices | 11,095 | 14,471 | 12,036 | 10,453 | 9,116 | 8,433 | ||||||
Inc:Loans in Foreign Offices | 0 | 0 | 0 | 0 | 0 | 0 | ||||||
Inc:Lease Financing Recvbl | 861 | 1,170 | 1,025 | 684 | 590 | 405 | ||||||
Interest & Div Income on Securities: | ||||||||||||
Int&Div:US Treas&US Govt Agency | 1,453 | 3,529 | N/A | N/A | N/A | N/A | ||||||
Int&Div:Mortgage-backed Secs | 5,722 | 6,004 | N/A | N/A | N/A | N/A | ||||||
Int&Div:All Other Securities | 1,462 | 1,978 | N/A | N/A | N/A | N/A | ||||||
Int&Div:Tax-exempt State Secs | 1,459 | 1,965 | 2,046 | 2,220 | 1,670 | 1,479 | ||||||
Interest on Deposits: | ||||||||||||
Int Exp:Time Dep >$100K | 2,274 | 3,066 | 2,507 | 2,217 | 2,497 | 2,650 | ||||||
Int Exp:Time Deposits<$100K | 4,531 | 8,705 | 7,995 | 6,489 | 5,821 | 5,639 | ||||||
Int Exp:All Other Deposits | 1,655 | 3,239 | 3,476 | 2,861 | 3,035 | 3,204 | ||||||
Int Exp:Deps Dom Ofc | 8,460 | 15,010 | 13,978 | 11,567 | 11,353 | 11,493 | ||||||
Int Exp:Deposits Frgn Ofc | 0 | 0 | 0 | 0 | 0 | 0 | ||||||
Interest Expense on Deps | 8,460 | 15,010 | 13,978 | 11,567 | 11,353 | 11,493 | ||||||
Other Interest Expense: | ||||||||||||
Int Exp:Fed Funds Purch | 0 | 0 | 19 | 1 | 0 | 1 | ||||||
Int Exp:Borrowed Funds | N/A | N/A | 18 | 8 | 24 | 51 | ||||||
Int Exp:Trading Liabs&Oth Brwd$ | 43 | 52 | N/A | N/A | N/A | N/A | ||||||
Int Exp:Subord Notes & Debs | 0 | 0 | 0 | 0 | 0 | 0 | ||||||
Int Exp:Other | 0 | 0 | 0 | 0 | 0 | 0 |
(c) 2002 Sheshunoff Information Services, Inc.
HENDERSON CITIZENS BNCSHRS
HENDERSON, TX
CLIENT PROFILE
($’SINTHOUSANDS)
Sep 2002 (YTD) | Dec 2001 (YTD) | Dec 2000 (YTD) | Dec 1999 (YTD) | Dec 1998 (YTD) | Dec 1997 (YTD) | |||||||
Noninterest Income: | ||||||||||||
Nonint Inc:Fiduc Activities | 1,106 | 1,404 | 1,307 | 1,107 | 894 | 753 | ||||||
Nonint Inc:Dom Dep Srvc Charges | 3,573 | 3,796 | 2,945 | 2,785 | 2,253 | 1,440 | ||||||
Nonint Inc:Trading Revenue | 0 | 0 | 0 | 0 | 0 | 0 | ||||||
Other Noninterest Income Components | ||||||||||||
Nonint Inc:InvBkg, Bkrg, Undw Fees | 160 | 149 | N/A | N/A | N/A | N/A | ||||||
Nonint Inc:Venture Cap Revenue | 0 | 0 | N/A | N/A | N/A | N/A | ||||||
Nonint Inc:Net Servicing Fees | 194 | 225 | N/A | N/A | N/A | N/A | ||||||
Nonint Inc:Net Securitzation Inc | 0 | 0 | N/A | N/A | N/A | N/A | ||||||
Nonint Inc:Insurance Commissions | 493 | 526 | N/A | N/A | N/A | N/A | ||||||
Nonint Inc:Net Gn(Ls) on Lns&Ls | 0 | 0 | 0 | 28 | 157 | 0 | ||||||
Nonint Inc:Net Gn(Ls) on OREO | 14 | 15 | 0 | 0 | 0 | 0 | ||||||
Nonint Inc:Net Gn(Ls) Oth Assets | 6 | -32 | N/A | N/A | N/A | N/A | ||||||
Nonint Inc:All Other | 1,047 | 1,240 | N/A | N/A | N/A | N/A | ||||||
Nonint Inc:Other | 1,914 | 2,123 | N/A | N/A | N/A | N/A | ||||||
Noninterest Expense: | ||||||||||||
Nonint Exp:Sal & Emp Benefits | 8,246 | 9,179 | 7,998 | 6,961 | �� | 6,296 | 5,601 | |||||
Nonint Exp:Fixed Assets | 1,855 | 2,151 | 1,770 | 1,541 | 1,264 | 1,039 | ||||||
Nonint Exp:Goodwill Impair Loss | 0 | N/A | N/A | N/A | N/A | N/A | ||||||
Nonint Exp:Amort Exp Oth Intang | 341 | N/A | N/A | N/A | N/A | N/A | ||||||
Nonint Exp:Amort Exp Intang Asst | N/A | 321 | N/A | N/A | N/A | N/A | ||||||
Nonint Exp:Other | 3,198 | 3,608 | 3,545 | 3,509 | 3,053 | 2,626 | ||||||
Securities Gains & Losses: | ||||||||||||
Rlzd Gn(Ls) Held-to-Mat Secs | -2 | 0 | 0 | 0 | 0 | 0 | ||||||
Rlzd Gn(Ls)Avbl-for-Sale Secs | 1,067 | 65 | 0 | 187 | 292 | 191 | ||||||
Gain(Loss) on Securities | 1,065 | 65 | 0 | 187 | 292 | 191 | ||||||
Selected Ratios: | ||||||||||||
Noninterest Income/Overhead Exp | 48.34 | 47.99 | 47.08 | 43.51 | 42.03 | 33.44 | ||||||
Salaries & Benefits/Avg Employees$ | 44,266 | 43,710 | 43,232 | 41,533 | 40,515 | 38,468 | ||||||
Nonint Exp:Sal & Emp Benefits/AA | 2.05 | 1.92 | 1.99 | 1.81 | 1.74 | 1.59 | ||||||
Miscellaneous: | ||||||||||||
# of Full-Time Equiv Employees | 259 | 236 | 192 | 171 | 166 | 151 | ||||||
Subchapter S Election in Effect? | No | No | No | No | No | N/A | ||||||
Effective Tax Rate | 22.95 | 15.24 | 13.22 | 15.74 | 19.84 | 23.22 |
(c) 2002 Sheshunoff Information Services, Inc.
HENDERSON CITIZENS BNCSHRS
HENDERSON, TX
CLIENT PROFILE
($’SINTHOUSANDS)
Sep 2002 (YTD) | Dec 2001 (YTD) | Dec 2000 (YTD) | Dec 1999 (YTD) | Dec 1998 (YTD) | Dec 1997 (YTD) | |||||||
Domestic Deposits: | ||||||||||||
Deps:Domestic Noninterest-Bear | 73,886 | 70,527 | 53,111 | 44,806 | 42,959 | 32,737 | ||||||
Deps:Domestic Interest-Bearing | 414,697 | 403,203 | 326,011 | 310,617 | 302,761 | 289,370 | ||||||
Foreign Deposits: | ||||||||||||
Deps:Foreign Noninterest-Bear | 0 | 0 | 0 | 0 | 0 | 0 | ||||||
Deps:Foreign Interest-Bearing | 0 | 0 | 0 | 0 | 0 | 0 | ||||||
Components of Total Deposits: | ||||||||||||
Demand Deposits | 73,886 | 70,527 | 53,111 | 44,806 | 42,959 | 32,737 | ||||||
Subs:Nonint-Bearing Balances | 0 | 0 | 0 | 0 | 0 | 0 | ||||||
NOW ATS & Other Transaction Acct | 3,140 | 2,272 | 1,764 | 7,823 | 11,379 | 10,563 | ||||||
Subs:NOW ATS & Other | 0 | 0 | 0 | 0 | 0 | 0 | ||||||
MMDA & Oth Savings Accts | 160,689 | 180,352 | 127,449 | 119,425 | 120,974 | 115,451 | ||||||
Subs:MMDA & Other Savings Accts | 0 | 0 | 0 | 0 | 0 | 0 | ||||||
Time Deposits < $100K | 164,004 | 163,592 | 149,104 | 138,976 | 126,405 | 110,124 | ||||||
Subs:Time Dep < $100K | 0 | 0 | 0 | 0 | 0 | 0 | ||||||
Time Deposits > $100K | 86,864 | 56,987 | 47,694 | 44,393 | 44,003 | 53,232 | ||||||
Subs:Time Dep > $100K | 0 | 0 | 0 | 0 | 0 | 0 | ||||||
Other Deposits: | ||||||||||||
Brokered Deps<$100K Rem Mat<=1Yr | 0 | 0 | 0 | 0 | 0 | 0 | ||||||
Brokered Deps<$100K Rem Mat>1Yr | 0 | 0 | 0 | 0 | 0 | 0 | ||||||
Time Deps>$100K Rem Mat<=1Yr | 66,502 | 45,916 | 42,737 | 42,497 | 34,542 | 50,629 | ||||||
Frgn Office Time Dep Rem Mat<1Yr | 0 | 0 | 0 | 0 | 0 | 0 | ||||||
Miscellaneous Deposit Information: | ||||||||||||
Purchased Funds | 89,893 | 61,084 | 48,842 | 44,393 | 46,285 | 54,076 | ||||||
$100,000+ Time Deposits/TD | 17.78 | 12.03 | 12.58 | 12.49 | 12.73 | 16.53 | ||||||
Core Deposits/TDD | 82.22 | 87.97 | 87.42 | 87.51 | 87.27 | 83.47 | ||||||
Deposit Mix as % of Total Deposits: | ||||||||||||
Money Market Deposit Accounts/TD | 32.89 | 38.07 | 33.62 | 33.60 | 34.99 | 35.84 | ||||||
Time Deposits < $100,000/TD | 33.57 | 34.53 | 39.33 | 39.10 | 36.56 | 34.19 | ||||||
$100,000+ Time Deposits/TD | 17.78 | 12.03 | 12.58 | 12.49 | 12.73 | 16.53 | ||||||
NOW & Other Transaction Accounts/TD | 0.64 | 0.48 | 0.47 | 2.20 | 3.29 | 3.28 | ||||||
Demand Deposits/TD | 15.12 | 14.89 | 14.01 | 12.61 | 12.43 | 10.16 | ||||||
Foreign Deposits/TD | 0.00 | 0.00 | 0.00 | 0.00 | 0.00 | 0.00 |
(c) 2002 Sheshunoff Information Services, Inc.
HENDERSON CITIZENS BNCSHRS
HENDERSON, TX
CLIENT PROFILE
($’SINTHOUSANDS)
Sep 2002 (YTD) | Dec 2001 (YTD) | Dec 2000 (YTD) | Dec 1999 (YTD) | Dec 1998 (YTD) | Dec 1997 (YTD) | |||||||
Income Statement as % of Avg Assets | ||||||||||||
Interest Income: | ||||||||||||
Int & Fee Income on Loans/AA | 2.75 | 3.03 | 2.99 | 2.71 | 2.52 | 2.39 | ||||||
Inc:Lease Financing Recvbl/AA | 0.21 | 0.25 | 0.25 | 0.18 | 0.16 | 0.11 | ||||||
Int Inc:Depository Inst/AA | 0.04 | 0.17 | 0.11 | 0.11 | 0.15 | 0.12 | ||||||
Int&Div:Securities/AA | 2.14 | 2.41 | 2.91 | 2.96 | 3.22 | 3.63 | ||||||
Int Inc:Federal Funds Sold/AA | 0.06 | 0.16 | 0.07 | 0.05 | 0.10 | 0.06 | ||||||
Int Inc:Other/AA | 0.03 | 0.03 | 0.00 | 0.00 | 0.00 | 0.00 | ||||||
Total Interest Income/AA | 5.24 | 6.05 | 6.34 | 6.01 | 6.15 | 6.30 | ||||||
Interest Expense: | ||||||||||||
Interest Expense on Deps/AA | 2.10 | 3.15 | 3.47 | 3.00 | 3.14 | 3.25 | ||||||
Int Exp:Fed Funds Purch/AA | 0.00 | 0.00 | 0.00 | 0.00 | 0.00 | 0.00 | ||||||
Int Exp:Trading Liabs&Oth Brwd$/AA | 0.01 | 0.01 | N/A | N/A | N/A | N/A | ||||||
Int Exp:Subord Notes & Debs/AA | 0.00 | 0.00 | 0.00 | 0.00 | 0.00 | 0.00 | ||||||
Total Interest Expense/AA | 2.11 | 3.16 | 3.48 | 3.00 | 3.15 | 3.27 | ||||||
Net Interest Income/AA | 3.13 | 2.89 | 2.86 | 3.01 | 3.00 | 3.04 | ||||||
Prov for Loan & Lease Losses/AA | 0.18 | 0.16 | 0.07 | 0.09 | 0.17 | 0.09 | ||||||
Noninterest Income: | ||||||||||||
Nonint Inc:Fiduc Activities/AA | 0.27 | 0.29 | 0.32 | 0.29 | 0.25 | 0.21 | ||||||
Nonint Inc:Dom Dep Srvc Charges/AA | 0.89 | 0.80 | 0.73 | 0.72 | 0.62 | 0.41 | ||||||
Nonint Inc:Trading Revenue/AA | 0.00 | 0.00 | 0.00 | 0.00 | 0.00 | 0.00 | ||||||
Nonint Inc:InvBkg,Bkrg,Undw Fees/AA | 0.04 | 0.03 | N/A | N/A | N/A | N/A | ||||||
Nonint Inc:Venture Cap Revenue/AA | 0.00 | 0.00 | N/A | N/A | N/A | N/A | ||||||
Nonint Inc:Net Servicing Fees/AA | 0.05 | 0.05 | N/A | N/A | N/A | N/A | ||||||
Nonint Inc:Net Securitzation Inc/AA | 0.00 | 0.00 | N/A | N/A | N/A | N/A | ||||||
Nonint Inc:Insurance Commissions/AA | 0.12 | 0.11 | N/A | N/A | N/A | N/A | ||||||
Nonint Inc:Net Gn(Ls) on Lns&Ls/AA | 0.00 | 0.00 | 0.00 | 0.01 | 0.04 | 0.00 | ||||||
Nonint Inc:Net Gn(Ls) on OREO/AA | 0.00 | 0.00 | 0.00 | 0.00 | 0.00 | 0.00 | ||||||
Nonint Inc:Net Gn(Ls) Oth Assets/AA | 0.00 | -0.01 | N/A | N/A | N/A | N/A | ||||||
Nonint Inc:All Other/AA | 0.26 | 0.26 | N/A | N/A | N/A | N/A | ||||||
Total Noninterest Income/AA | 1.64 | 1.54 | 1.56 | 1.36 | 1.23 | 0.88 | ||||||
Noninterest Expense: | ||||||||||||
Nonint Exp:Sal & Emp Benefits/AA | 2.05 | 1.92 | 1.99 | 1.81 | 1.74 | 1.59 | ||||||
Nonint Exp:Fixed Assets/AA | 0.46 | 0.45 | 0.44 | 0.40 | 0.35 | 0.29 | ||||||
Nonint Exp:Goodwill Impair Loss/AA | 0.00 | N/A | N/A | N/A | N/A | N/A | ||||||
Nonint Exp:Amort Exp Oth Intang/AA | 0.08 | N/A | N/A | N/A | N/A | N/A | ||||||
Nonint Exp:Amort Exp Intang Asst/AA | N/A | 0.07 | N/A | N/A | N/A | N/A | ||||||
Nonint Exp:Other/AA | 0.79 | 0.76 | 0.88 | 0.91 | 0.84 | 0.74 | ||||||
Total Noninterest Expense/AA | 3.38 | 3.20 | 3.31 | 3.12 | 2.94 | 2.62 | ||||||
Inc Before Sec Gain(Loss)/AA (H) | 1.20 | 1.07 | 1.04 | 1.15 | 1.13 | 1.20 | ||||||
Gain(Loss) on Securities/AA | 0.26 | 0.01 | 0.00 | 0.05 | 0.08 | 0.05 | ||||||
Inc Bef Tax & Other Adj/AA | 1.46 | 1.08 | 1.04 | 1.20 | 1.21 | 1.25 | ||||||
Applicable Income Taxes/AA | 0.34 | 0.16 | 0.14 | 0.19 | 0.24 | 0.29 | ||||||
Minority Interest/AA | 0.00 | 0.00 | 0.00 | 0.00 | 0.00 | 0.00 | ||||||
Inc Before Extraordinary Items/AA | 1.13 | 0.92 | 0.90 | 1.01 | 0.97 | 0.96 | ||||||
Extraordinary Items, Net/AA | 0.00 | 0.00 | 0.00 | 0.00 | 0.00 | 0.00 | ||||||
Net Income (Loss)/AA | 1.13 | 0.92 | 0.90 | 1.01 | 0.97 | 0.96 |
(c) 2002 Sheshunoff Information Services, Inc.
HENDERSON CITIZENS BNCSHRS
HENDERSON, TX
CLIENT PROFILE
($’SINTHOUSANDS)
Sep 2002 (YTD) | Dec 2001 (YTD) | Dec 2000 (YTD) | Dec 1999 (YTD) | Dec 1998 (YTD) | Dec 1997 (YTD) | |||||||
Changes in Equity Capital: | ||||||||||||
Equity Capital(LYE) | N/A | N/A | 35,771 | 35,911 | 32,729 | 31,988 | ||||||
Equity Capital Adjust, Net | N/A | N/A | 0 | 0 | 0 | 0 | ||||||
Eqty Cap Amended Bal(LYE) | 43,880 | 39,122 | 35,771 | 35,911 | 32,729 | 31,988 | ||||||
Restatmnts of Corrections&Errors | 54 | 0 | N/A | N/A | N/A | N/A | ||||||
Equity Capital Restated Bal(LYE) | 43,934 | 39,122 | N/A | N/A | N/A | N/A | ||||||
Net Income (Loss) | 4,545 | 4,366 | 3,625 | 3,908 | 3,506 | 3,390 | ||||||
Sale Perp Prefrd Stk Gross | 0 | 0 | 0 | 0 | 0 | 0 | ||||||
Conversion Perp Prefrd Stk | 0 | 0 | 0 | 0 | 0 | 0 | ||||||
Sale of Common Stock Gross | 0 | 0 | 0 | 0 | 0 | 0 | ||||||
Conversion of Common Stock | 0 | 0 | 0 | 0 | 0 | 0 | ||||||
Treasury Stock:Sale | 0 | 0 | 0 | 0 | 0 | 0 | ||||||
Treasury Stock:Purchase | 4 | 16 | 278 | 91 | 16 | 1,677 | ||||||
Chngs Incident to Bus Comb | 0 | 10,422 | 0 | 0 | 0 | 0 | ||||||
Div Declared:Preferred Stk | 0 | 0 | 0 | 0 | 0 | 0 | ||||||
Div Declared:Ltd-Life Stk | N/A | N/A | N/A | N/A | N/A | N/A | ||||||
Div Declared:Common Stock | 1,018 | 10,917 | 1,359 | 1,370 | 1,291 | 1,341 | ||||||
Other Comprehensive Income | -118 | 903 | N/A | N/A | N/A | N/A | ||||||
Chngs in Contra ESOP Debt | 0 | 0 | 0 | 0 | 0 | 0 | ||||||
Oth Adj to Equity Capital | 0 | 0 | 0 | 0 | 0 | 0 | ||||||
Frgn Currency Transl Adj | N/A | N/A | 0 | 0 | 0 | 0 | ||||||
Equity Capital:Current | 47,339 | 43,880 | 39,122 | 35,771 | 35,911 | 32,729 | ||||||
Other Capital Items: | ||||||||||||
Subordinated Notes & Debs | 0 | 0 | 0 | 0 | 0 | 0 | ||||||
Limited-Life Preferred Stk | N/A | N/A | N/A | N/A | N/A | N/A | ||||||
Perpetual Preferred Stock | 0 | 0 | 0 | 0 | 0 | 0 | ||||||
Common Stock | 10,800 | 10,800 | 10,800 | 10,800 | 10,800 | 10,800 | ||||||
Capital Surplus | 5,400 | 5,400 | 5,400 | 5,400 | 5,400 | 5,400 |
(c) 2002 Sheshunoff Information Services, Inc.
SECTION VIII
HISTORICAL DATA—PEER GROUP
MERGED PEER GROUP SUMMARY REPORT
PRIMARY SET: PEER GROUP (HENDERSON CITIZENS)
PEER PROFILE
($’SINTHOUSANDS)
Sep 2002 (YTD) | Sep 2002 (YTD) | Sep 2002 (YTD) | ||||||||||
City | State | Number of US Branches | Lns&Leases Net Unearn Income | Total Deposits | Total Assets | |||||||
Southern Development Bancorp | Arkadelphia | AR | 18 | 192,842 | 296,593 | 366,665 | ||||||
Summit Bancorp, Inc. | Arkadelphia | AR | 10 | 346,736 | 401,970 | 494,204 | ||||||
Citizens Bancshares | Batesville | AR | 8 | 236,882 | 284,562 | 379,200 | ||||||
Home Bancshares, Inc. | Conway | AR | 23 | 393,488 | 438,462 | 560,221 | ||||||
First National Security Co. | De Queen | AR | 15 | 245,975 | 365,638 | 458,430 | ||||||
MNB Bancshares, Inc. | Malvern | AR | 11 | 172,189 | 312,300 | 357,049 | ||||||
First Paragould Bankshares | Paragould | AR | 5 | 300,643 | 323,811 | 408,424 | ||||||
One American Corporation | Vacherie | LA | 21 | 256,345 | 374,354 | 427,332 | ||||||
Concordia Capital Corp | Vidalia | LA | 4 | 200,120 | 292,049 | 366,731 | ||||||
Evangeline Bancshares, Inc. | Ville Platte | LA | 8 | 183,760 | 303,498 | 369,644 | ||||||
Spirit Bankcorp, Inc. | Bristow | OK | 13 | 336,027 | 371,658 | 486,476 | ||||||
RCB Holding Company, Inc. | Claremore | OK | 11 | 280,604 | 535,609 | 659,295 | ||||||
First of McAlester Corp. | Mcalester | OK | 4 | 146,566 | 352,959 | 440,223 | ||||||
American Bancorporation, Inc | Sapulpa | OK | 13 | 185,870 | 344,576 | 420,555 | ||||||
Diboll State Bancshares, Inc | Diboll | TX | 14 | 303,429 | 456,694 | 513,179 | ||||||
Security Holding Company | Fredericksburg | TX | 13 | 321,124 | 361,753 | 464,593 | ||||||
Austin Bancorp, Inc. | Jacksonville | TX | 0 | 428,448 | 510,963 | 579,246 | ||||||
Texas United Bancshares, Inc | La Grange | TX | 17 | 366,932 | 441,972 | 559,514 | ||||||
East Texas Bancshares, Inc. | Livingston | TX | 7 | 152,599 | 335,923 | 384,036 | ||||||
Longview Financial Corp. | Longview | TX | 10 | 418,853 | 482,569 | 568,970 | ||||||
INB Financial Corporation | Mcallen | TX | 9 | 331,718 | 500,901 | 606,316 | ||||||
Guaranty Bancshares, Inc. | Mt Pleasant | TX | 11 | 351,407 | 415,885 | 515,835 | ||||||
Century Bancshares, Inc. | New Boston | TX | 5 | 236,134 | 331,060 | 358,368 | ||||||
Lone Star Natl Bncshs-TX | Pharr | TX | 6 | 324,662 | 509,737 | 569,462 | ||||||
Texas Security First Bncshrs | Sulphur Springs | TX | 8 | 232,052 | 331,760 | 439,761 | ||||||
Central Community Corp | Temple | TX | 16 | 261,782 | 349,336 | 407,369 | ||||||
Texas Independent Bancshares | Texas City | TX | 13 | 190,123 | 369,303 | 427,442 | ||||||
Grand Total | ||||||||||||
Sum | 293 | 7,397,310 | 10,395,895 | 12,588,540 | ||||||||
Mean | 11 | 273,974 | 385,033 | 466,242 |
(c) 2002 Sheshunoff Information Services, Inc.
PRIMARY SET: PEER GROUP (HENDERSON CITIZENS)
PEER PROFILE
($’SINTHOUSANDS)
Sep 2002 (YTD) | Dec 2001 (YTD) | Dec 2000 (YTD) | Dec 1999 (YTD) | Dec 1998 (YTD) | Dec 1997 (YTD) | |||||||
BALANCE SHEET: | ||||||||||||
Total Assets | 12,588,540 | 11,549,832 | 9,969,429 | 8,647,826 | 7,858,419 | 6,608,422 | ||||||
%CH: Total Assets | 15.33 | 15.85 | 15.28 | 10.05 | 18.92 | 25.94 | ||||||
Fed Funds Sold & Sec Purchased | 299,266 | 272,247 | 235,398 | 173,943 | 335,342 | 236,813 | ||||||
Secs: Held-to-Maturity | 370,874 | 424,453 | 458,718 | 609,517 | 633,618 | 821,179 | ||||||
Secs: Available-for-Sale | 3,414,760 | 3,030,241 | 2,362,824 | 2,186,515 | 2,099,572 | 1,641,829 | ||||||
Securities | 3,785,634 | 3,454,694 | 2,821,542 | 2,796,032 | 2,733,190 | 2,463,008 | ||||||
%CH: Securities | 25.78 | 22.44 | 0.91 | 2.30 | 10.97 | 19.42 | ||||||
Ln&Lse: Net Unearned Income | 7,397,310 | 6,743,920 | 5,972,213 | 4,844,019 | 4,094,719 | 3,367,106 | ||||||
%CH: Ln&Lse: Net Unearned Income | 13.26 | 12.92 | 23.29 | 18.30 | 21.61 | 32.31 | ||||||
Total Deposits | 10,395,895 | 9,779,846 | 8,478,796 | 7,457,142 | 6,832,118 | 5,779,586 | ||||||
%CH: Total Deposits | 12.18 | 15.34 | 13.70 | 9.15 | 18.21 | 25.50 | ||||||
Total Loans/Total Deposits | 71.16 | 68.96 | 70.44 | 64.96 | 59.93 | 58.26 | ||||||
Ln&Lse: Net Unearned Income/TA | 58.76 | 58.39 | 59.91 | 56.01 | 52.11 | 50.95 | ||||||
CAPITAL: | ||||||||||||
Total Equity Capital | 1,262,601 | 1,138,644 | 1,016,017 | 841,018 | 795,931 | 680,431 | ||||||
Total Risk-Based Capital | 1,316,097 | 1,180,406 | 1,079,648 | 887,390 | 800,312 | 687,188 | ||||||
Total Equity Capital/TA | 10.03 | 9.86 | 10.19 | 9.73 | 10.13 | 10.30 | ||||||
Risk-Adjusted Capital Ratio | 16.83 | 16.42 | 17.49 | 17.52 | 18.30 | 17.80 | ||||||
Core Capital/Adjusted Total Assets | 10.04 | 9.85 | 10.28 | 9.74 | 9.85 | 9.87 | ||||||
Dividends/Net Income(P) | N/A | N/A | N/A | N/A | N/A | N/A | ||||||
PROFITABILITY: | ||||||||||||
Net Income (Loss) | 104,693 | 109,654 | 102,797 | 96,697 | 91,723 | 81,896 | ||||||
Return on Avg Assets | 1.17 | 1.03 | 1.10 | 1.17 | 1.27 | 1.38 | ||||||
Return on Avg Equity | 11.70 | 10.09 | 10.89 | 11.72 | 12.02 | 12.81 | ||||||
Net Interest Margin (Tax Adj)/AA | 3.93 | 3.88 | 4.06 | 4.06 | 4.18 | 4.41 | ||||||
Net Interest Income/AA | 3.83 | 3.78 | 3.94 | 3.93 | 4.04 | 4.23 | ||||||
Net Overhead Expense/AA | 1.85 | 1.95 | 2.05 | 2.04 | 2.01 | 2.03 | ||||||
Total Noninterest Income/AA | 1.10 | 1.10 | 1.00 | 0.98 | 0.95 | 0.94 | ||||||
Total Noninterest Expense/AA | 2.95 | 3.04 | 3.05 | 3.02 | 2.96 | 2.96 | ||||||
Adjusted Efficiency Ratio | 58.39 | 60.13 | 60.33 | 59.93 | 57.68 | 55.47 | ||||||
ASSET QUALITY: | ||||||||||||
Nonperf Assets/EqtyCap&LLR (H) | 5.94 | 6.60 | 6.12 | 5.99 | 5.25 | 4.69 | ||||||
Nonperf Assets/TA (H) | 0.64 | 0.70 | 0.67 | 0.62 | 0.57 | 0.51 | ||||||
Loan Loss Reserve/TL | 1.29 | 1.26 | 1.20 | 1.23 | 1.26 | 1.24 | ||||||
Loan Loss Reserve/Nonperf Loans | 136.71 | 125.58 | 129.66 | 131.57 | 136.18 | 166.78 | ||||||
Past Due 90 Days: Loans & Leases/GL | 0.26 | 0.37 | 0.33 | 0.33 | 0.38 | 0.32 | ||||||
Nonaccruing: Loans & Leases/GL | 0.69 | 0.63 | 0.59 | 0.61 | 0.54 | 0.42 | ||||||
Restructured: Loans & Leases/GL | 0.06 | 0.09 | 0.09 | 0.02 | 0.05 | 0.07 | ||||||
Other Real Estate Owned/TA | 0.13 | 0.15 | 0.14 | 0.10 | 0.09 | 0.14 | ||||||
Net Charge-Offs(YTD)/Average Loans | 0.30 | 0.39 | 0.28 | 0.26 | 0.26 | 0.38 | ||||||
LIQUIDITY: | ||||||||||||
$100,000+ Time Deposits/TD | 21.49 | 21.00 | 19.94 | 18.28 | 18.00 | 17.38 | ||||||
Tot Earning Assets/Int Bear Liabs | 120.54 | 120.54 | 121.59 | 121.17 | 123.20 | 125.18 | ||||||
Pledged Securities/Total Securities | 52.85 | 49.80 | 56.80 | 49.41 | 42.82 | 39.30 | ||||||
Tot Secs: Fair Value to Amtzd Cost | 102.17 | 100.59 | 100.15 | 97.92 | 100.86 | 100.67 |
(c) 2002 Sheshunoff Information Services, Inc.
PRIMARY SET: PEER GROUP (HENDERSON CITIZENS)
PEER PROFILE
($’SINTHOUSANDS)
Sep 2002 (YTD) | Dec 2001 (YTD) | Dec 2000 (YTD) | Dec 1999 (YTD) | Dec 1998 (YTD) | Dec 1997 (YTD) | |||||||
Assets: | ||||||||||||
Cash & Due: Noninterest-Bearing | 456,850 | 442,251 | 411,731 | 387,853 | 314,875 | 249,915 | ||||||
Cash & Due: Interest-Bearing | 116,221 | 144,219 | 119,328 | 88,961 | 95,883 | 71,464 | ||||||
Cash & Due from Depository Inst | 573,071 | 586,470 | 531,059 | 476,814 | 410,758 | 321,379 | ||||||
Fed Funds Sold & Sec Purchased | 299,266 | 272,247 | 235,398 | 173,943 | 335,342 | 236,813 | ||||||
Secs: Held-to-Maturity | 370,874 | 424,453 | 458,718 | 609,517 | 633,618 | 821,179 | ||||||
Secs: Available-for-Sale | 3,414,760 | 3,030,241 | 2,362,824 | 2,186,515 | 2,099,572 | 1,641,829 | ||||||
Securities | 3,785,634 | 3,454,694 | 2,821,542 | 2,796,032 | 2,733,190 | 2,463,008 | ||||||
Ln&Lse: Net Unearned Income | 7,397,310 | 6,743,920 | 5,972,213 | 4,844,019 | 4,094,719 | 3,367,106 | ||||||
Allow for Loan & Lease Loss | 95,711 | 84,967 | 71,397 | 59,751 | 51,548 | 41,622 | ||||||
Ln&Lse: Net Unearn & All & ATR | 7,301,599 | 6,658,953 | 5,900,816 | 4,784,268 | 4,043,171 | 3,325,484 | ||||||
Trading Assets | 0 | 0 | 0 | 0 | 0 | 0 | ||||||
Premises & Fixed Assets | 286,227 | 258,980 | 221,440 | 187,306 | 159,904 | 125,759 | ||||||
Other Real Estate Owned | 16,303 | 17,716 | 14,193 | 8,606 | 6,724 | 9,031 | ||||||
Investment in Unconsolidated Sub | 17,586 | 17,238 | 10,100 | 9,260 | 7,951 | 7,377 | ||||||
Customers Liability on Accept | 0 | 0 | 0 | 0 | 0 | 0 | ||||||
Intangible Assets | 58,806 | 52,659 | 52,311 | 46,986 | 35,148 | 28,755 | ||||||
Other Assets | 250,048 | 230,875 | 182,570 | 164,611 | 126,231 | 90,816 | ||||||
Total Assets | 12,588,540 | 11,549,832 | 9,969,429 | 8,647,826 | 7,858,419 | 6,608,422 | ||||||
Liabilities: | ||||||||||||
Deps: Domestic Noninterest-Bear | 1,530,996 | 1,460,591 | 1,304,839 | 1,202,301 | 1,105,222 | 966,836 | ||||||
Deps: Domestic Interest-Bearing | 8,864,899 | 8,319,255 | 7,173,957 | 6,254,841 | 5,726,896 | 4,812,750 | ||||||
Deps in Foreign Offices | 0 | 0 | 0 | 0 | 0 | 0 | ||||||
Total Deposits | 10,395,895 | 9,779,846 | 8,478,796 | 7,457,142 | 6,832,118 | 5,779,586 | ||||||
Fed Funds Purch & Sec Sold | 171,198 | 148,626 | 99,607 | 90,517 | 54,907 | 35,866 | ||||||
Trading Liabilities | 0 | 0 | 0 | 0 | 0 | 0 | ||||||
Other Borrowed Money | 574,639 | 330,814 | 241,270 | 167,916 | 106,219 | 49,480 | ||||||
Banks Liab on Acceptances | 0 | 0 | 0 | 0 | 0 | 0 | ||||||
Subordinated Notes & Debs | 11,530 | 7,719 | 9,299 | 9,538 | 4,614 | 6,249 | ||||||
Other Liabilities | 96,530 | 91,580 | 84,656 | 71,898 | 60,667 | 52,864 | ||||||
Minority Interest & Similar Items | 76,147 | 52,603 | 39,784 | 9,797 | 3,963 | 3,946 | ||||||
Total Liabilities & Minority Int | 11,325,939 | 10,411,188 | 8,953,412 | 7,806,808 | 7,062,488 | 5,927,991 | ||||||
Equity Capital: | ||||||||||||
Limited-Life Preferred Stk | 0 | 0 | 0 | 0 | 0 | 0 | ||||||
Perpetual Preferred Stock | 4,646 | 2,646 | 4,272 | 4,272 | 2,688 | 3,515 | ||||||
Common Stock | 36,136 | 35,746 | 35,746 | 31,184 | 30,585 | 26,887 | ||||||
Capital Surplus | 298,696 | 284,206 | 249,088 | 190,952 | 187,295 | 144,870 | ||||||
Retained Earnings | 922,129 | 841,355 | 760,548 | 674,872 | 589,668 | 510,461 | ||||||
Accumulated Oth Comprehensv Inc | 45,086 | 10,350 | -1,883 | -33,959 | 9,059 | 4,895 | ||||||
Frgn Curr Transl Adjust | 0 | 0 | 0 | 0 | 0 | 0 | ||||||
Other Equity Capital Components | -44,092 | -35,659 | 0 | 0 | 0 | 0 | ||||||
Treasury Stock | 0 | 0 | 31,754 | 26,303 | 23,364 | 10,197 | ||||||
Total Equity Capital | 1,262,601 | 1,138,644 | 1,016,017 | 841,018 | 795,931 | 680,431 | ||||||
Total Liab & Equity Cap | 12,588,540 | 11,549,832 | 9,969,429 | 8,647,826 | 7,858,419 | 6,608,422 |
(c) 2002 Sheshunoff Information Services, Inc.
PRIMARY SET: PEER GROUP (HENDERSON CITIZENS)
PEER PROFILE
($’SINTHOUSANDS)
Sep 2002 (YTD) | Dec 2001 (YTD) | Dec 2000 (YTD) | Dec 1999 (YTD) | Dec 1998 (YTD) | Dec 1997 (YTD) | |||||||
Assets (as a % of Total Assets): | ||||||||||||
Cash & Due: Noninterest-Bearing/TA | 3.63 | 3.83 | 4.13 | 4.48 | 4.01 | 3.78 | ||||||
Cash & Due: Interest-Bearing/TA | 0.92 | 1.25 | 1.20 | 1.03 | 1.22 | 1.08 | ||||||
Cash & Due from Depository Inst/TA | 4.55 | 5.08 | 5.33 | 5.51 | 5.23 | 4.86 | ||||||
Secs: Held-to-Maturity/TA | 2.95 | 3.67 | 4.60 | 7.05 | 8.06 | 12.43 | ||||||
Secs: Available-for-Sale/TA | 27.13 | 26.24 | 23.70 | 25.28 | 26.72 | 24.84 | ||||||
Securities/TA | 30.07 | 29.91 | 28.30 | 32.33 | 34.78 | 37.27 | ||||||
Fed Funds Sold & Sec Purchased/TA | 2.38 | 2.36 | 2.36 | 2.01 | 4.27 | 3.58 | ||||||
Ln&Lse: Net Unearned Income/TA | 58.76 | 58.39 | 59.91 | 56.01 | 52.11 | 50.95 | ||||||
Allow for Loan & Lease Loss/TA | 0.76 | 0.74 | 0.72 | 0.69 | 0.66 | 0.63 | ||||||
Ln&Lse: Net Unearn & All & ATR/TA | 58.00 | 57.65 | 59.19 | 55.32 | 51.45 | 50.32 | ||||||
Trading Assets/TA | 0.00 | 0.00 | 0.00 | 0.00 | 0.00 | 0.00 | ||||||
Premises & Fixed Assets/TA | 2.27 | 2.24 | 2.22 | 2.17 | 2.03 | 1.90 | ||||||
Other Real Estate Owned/TA | 0.13 | 0.15 | 0.14 | 0.10 | 0.09 | 0.14 | ||||||
Investment in Unconsolidated Sub/TA | 0.14 | 0.15 | 0.10 | 0.11 | 0.10 | 0.11 | ||||||
Customers Liability on Accept/TA | 0.00 | 0.00 | 0.00 | 0.00 | 0.00 | 0.00 | ||||||
Intangible Assets/TA | 0.47 | 0.46 | 0.52 | 0.54 | 0.45 | 0.44 | ||||||
Other Assets/TA | 1.99 | 2.00 | 1.83 | 1.90 | 1.61 | 1.37 | ||||||
Total Assets/TA | 100.00 | 100.00 | 100.00 | 100.00 | 100.00 | 100.00 | ||||||
Liabilities: | ||||||||||||
Deps: Domestic Noninterest-Bear/TA | 12.16 | 12.65 | 13.09 | 13.90 | 14.06 | 14.63 | ||||||
Deps: Domestic Interest-Bearing/TA | 70.42 | 72.03 | 71.96 | 72.33 | 72.88 | 72.83 | ||||||
Deps in Foreign Offices/TA | 0.00 | 0.00 | 0.00 | 0.00 | 0.00 | 0.00 | ||||||
Total Deposits/TA | 82.58 | 84.68 | 85.05 | 86.23 | 86.94 | 87.46 | ||||||
Fed Funds Purch & Sec Sold/TA | 1.36 | 1.29 | 1.00 | 1.05 | 0.70 | 0.54 | ||||||
Trading Liabilities/TA | 0.00 | 0.00 | 0.00 | 0.00 | 0.00 | 0.00 | ||||||
Other Borrowed Money/TA | 4.56 | 2.86 | 2.42 | 1.94 | 1.35 | 0.75 | ||||||
Banks Liab on Acceptances/TA | 0.00 | 0.00 | 0.00 | 0.00 | 0.00 | 0.00 | ||||||
Subordinated Notes & Debs/TA | 0.09 | 0.07 | 0.09 | 0.11 | 0.06 | 0.09 | ||||||
Other Liabilities/TA | 0.77 | 0.79 | 0.85 | 0.83 | 0.77 | 0.80 | ||||||
Minority Interest & Similar Items/TA | 0.60 | 0.46 | 0.40 | 0.11 | 0.05 | 0.06 | ||||||
Total Liabilities & Minority Int/TA | 89.97 | 90.14 | 89.81 | 90.27 | 89.87 | 89.70 | ||||||
Equity Capital: | ||||||||||||
Limited-Life Preferred Stk/TA | 0.00 | 0.00 | 0.00 | 0.00 | 0.00 | 0.00 | ||||||
Perpetual Preferred Stock/TA | 0.04 | 0.02 | 0.04 | 0.05 | 0.03 | 0.05 | ||||||
Common Stock/TA | 0.29 | 0.31 | 0.36 | 0.36 | 0.39 | 0.41 | ||||||
Capital Surplus/TA | 2.37 | 2.46 | 2.50 | 2.21 | 2.38 | 2.19 | ||||||
Retained Earnings/TA | 7.33 | 7.28 | 7.63 | 7.80 | 7.50 | 7.72 | ||||||
Accumulated Oth Comprehensv Inc/TA | 0.36 | 0.09 | -0.02 | -0.39 | 0.12 | 0.07 | ||||||
Frgn Curr Transl Adjust/TA | 0.00 | 0.00 | 0.00 | 0.00 | 0.00 | 0.00 | ||||||
Other Equity Capital Components/TA | -0.35 | -0.31 | 0.00 | 0.00 | 0.00 | 0.00 | ||||||
Treasury Stock/TA | 0.00 | 0.00 | 0.32 | 0.30 | 0.30 | 0.15 | ||||||
Total Equity Capital/TA | 10.03 | 9.86 | 10.19 | 9.73 | 10.13 | 10.30 | ||||||
Total Liab & Equity Cap/TA | 100.00 | 100.00 | 100.00 | 100.00 | 100.00 | 100.00 |
(c) 2002 Sheshunoff Information Services, Inc.
PRIMARY SET: PEER GROUP (HENDERSON CITIZENS)
PEER PROFILE
($’SINTHOUSANDS)
Sep 2002 (YTD) | Dec 2001 (YTD) | Dec 2000 (YTD) | Dec 1999 (YTD) | Dec 1998 (YTD) | Dec 1997 (YTD) | |||||||
Loans as a % of Gross Loans | ||||||||||||
Loans Secured by Real Estate: | ||||||||||||
Real Estate Development: | ||||||||||||
Domestic Construction Loans/GL | 8.10 | 7.73 | 6.23 | 5.13 | 4.20 | 3.93 | ||||||
Domestic Commercial RE Loans/GL | 22.91 | 21.70 | 21.23 | 20.21 | 19.87 | 19.60 | ||||||
1-4 Family Units: | ||||||||||||
Domestic Home Equity Loans/GL | 0.18 | 0.15 | 0.11 | 0.06 | 0.05 | 0.05 | ||||||
Domestic Home Mortgage Loans/GL | 28.33 | 27.91 | 28.19 | 29.26 | 29.63 | 28.60 | ||||||
Tot Dom Home Mtg&Equity Loans/GL | 28.50 | 28.06 | 28.30 | 29.32 | 29.68 | 28.66 | ||||||
Domestic 5+ Family Resdntl Loans/GL | 1.33 | 1.26 | 1.32 | 1.22 | 0.93 | 0.94 | ||||||
Domestic Farmland Loans/GL | 3.27 | 3.21 | 3.35 | 3.35 | 3.36 | 3.52 | ||||||
Real Estate Loans/GL | 64.11 | 61.97 | 60.43 | 59.24 | 58.04 | 56.66 | ||||||
Depository Institutions: | ||||||||||||
Domestic Lns to Dep Institutions/GL | 0.00 | 0.00 | 0.00 | 0.00 | 0.00 | 0.00 | ||||||
Agricultural: | ||||||||||||
Domestic Agricultural Loans/GL | 3.32 | 3.09 | 3.01 | 3.32 | 3.82 | 4.23 | ||||||
Commercial & Industrial: | ||||||||||||
Domestic Comml & Indust Lns/GL | 16.60 | 17.69 | 18.09 | 18.12 | 17.66 | 17.07 | ||||||
Consumer Loans: | ||||||||||||
Domestic Consumer Loans/GL | 14.14 | 15.68 | 17.11 | 18.00 | 19.08 | 20.31 | ||||||
Loans to Foreign Governments: | ||||||||||||
Domestic Loans to Foreign Govts/GL | 0.01 | 0.01 | 0.00 | 0.00 | 0.00 | 0.00 | ||||||
All Other Loans: | ||||||||||||
All Other Domestic Loans/GL | 1.41 | 1.33 | 1.25 | 1.28 | 1.37 | 1.51 | ||||||
Lease Financing Receivables: | ||||||||||||
Domestic Lease Receivables/GL | 0.41 | 0.24 | 0.10 | 0.05 | 0.03 | 0.08 |
(c) 2002 Sheshunoff Information Services, Inc.
PRIMARY SET: PEER GROUP (HENDERSON CITIZENS)
PEER PROFILE
($’SINTHOUSANDS)
Sep 2002 (YTD) | Dec 2001 (YTD) | Dec 2000 (YTD) | Dec 1999 (YTD) | Dec 1998 (YTD) | Dec 1997 (YTD) | |||||||
Income Statement as % of Avg Assets | ||||||||||||
Interest Income: | ||||||||||||
Int & Fee Income on Loans/AA | 4.43 | 5.23 | 5.45 | 4.88 | 4.96 | 5.05 | ||||||
Inc:Lease Financing Recvbl/AA | 0.01 | 0.01 | 0.00 | 0.00 | 0.00 | 0.01 | ||||||
Int Inc:Depository Inst/AA | 0.04 | 0.07 | 0.07 | 0.07 | 0.07 | 0.07 | ||||||
Int&Div:Securities/AA | 1.47 | 1.56 | 1.88 | 2.02 | 2.19 | 2.48 | ||||||
Int Inc:Federal Funds Sold/AA | 0.04 | 0.14 | 0.13 | 0.15 | 0.22 | 0.21 | ||||||
Int Inc:Other/AA | 0.02 | 0.02 | 0.00 | 0.01 | 0.00 | 0.00 | ||||||
Total Interest Income/AA | 6.00 | 7.04 | 7.55 | 7.12 | 7.44 | 7.82 | ||||||
Interest Expense: | ||||||||||||
Interest Expense on Deps/AA | 2.01 | 3.10 | 3.37 | 3.04 | 3.30 | 3.48 | ||||||
Int Exp:Fed Funds Purch/AA | 0.03 | 0.04 | 0.06 | 0.04 | 0.03 | 0.03 | ||||||
Int Exp:Trading Liabs&Oth Brwd$/AA | 0.12 | 0.12 | 0.00 | 0.00 | 0.00 | 0.00 | ||||||
Int Exp:Subord Notes & Debs/AA | 0.00 | 0.01 | 0.01 | 0.00 | 0.01 | 0.01 | ||||||
Total Interest Expense/AA | 2.17 | 3.27 | 3.61 | 3.19 | 3.41 | 3.58 | ||||||
Net Interest Income/AA | 3.83 | 3.78 | 3.94 | 3.93 | 4.04 | 4.23 | ||||||
Prov for Loan & Lease Losses/AA | 0.28 | 0.34 | 0.26 | 0.21 | 0.21 | 0.22 | ||||||
Noninterest Income: | ||||||||||||
Nonint Inc:Fiduc Activities/AA | 0.04 | 0.05 | 0.06 | 0.06 | 0.05 | 0.06 | ||||||
Nonint Inc:Dom Dep Srvc Charges/AA | 0.64 | 0.65 | 0.63 | 0.61 | 0.58 | 0.59 | ||||||
Nonint Inc:Trading Revenue/AA | 0.00 | 0.00 | 0.00 | 0.00 | 0.00 | 0.00 | ||||||
Nonint Inc:InvBkg, Bkrg, Undw Fees/AA | 0.02 | 0.01 | 0.00 | 0.00 | 0.00 | 0.00 | ||||||
Nonint Inc:Venture Cap Revenue/AA | 0.00 | 0.00 | 0.00 | 0.00 | 0.00 | 0.00 | ||||||
Nonint Inc:Net Servicing Fees/AA | 0.01 | 0.01 | 0.00 | 0.00 | 0.00 | 0.00 | ||||||
Nonint Inc:Net Securitzation Inc/AA | 0.00 | 0.00 | 0.00 | 0.00 | 0.00 | 0.00 | ||||||
Nonint Inc:Insurance Commissions/AA | 0.07 | 0.06 | 0.00 | 0.00 | 0.00 | 0.00 | ||||||
Nonint Inc:Net Gn(Ls) on Lns&Ls/AA | 0.03 | 0.01 | 0.00 | 0.01 | 0.02 | 0.01 | ||||||
Nonint Inc:Net Gn(Ls) on OREO/AA | 0.00 | 0.01 | 0.00 | 0.01 | 0.02 | 0.02 | ||||||
Nonint Inc:Net Gn(Ls) Oth Assets/AA | -0.01 | 0.00 | 0.00 | 0.00 | 0.00 | 0.00 | ||||||
Nonint Inc:All Other/AA | 0.28 | 0.30 | 0.00 | 0.00 | 0.00 | 0.00 | ||||||
Total Noninterest Income/AA | 1.10 | 1.10 | 1.00 | 0.98 | 0.95 | 0.94 | ||||||
Noninterest Expense: | ||||||||||||
Nonint Exp:Sal & Emp Benefits/AA | 1.62 | 1.64 | 1.64 | 1.58 | 1.54 | 1.54 | ||||||
Nonint Exp:Fixed Assets/AA | 0.45 | 0.46 | 0.46 | 0.45 | 0.45 | 0.44 | ||||||
Nonint Exp:Goodwill Impair Loss/AA | 0.00 | 0.00 | 0.00 | 0.00 | 0.00 | 0.00 | ||||||
Nonint Exp:Amort Exp Oth Intang/AA | 0.01 | 0.00 | 0.00 | 0.00 | 0.00 | 0.00 | ||||||
Nonint Exp:Amort Exp Intang Asst/AA | 0.00 | 0.05 | 0.00 | 0.00 | 0.00 | 0.00 | ||||||
Nonint Exp:Other/AA | 0.86 | 0.89 | 0.96 | 1.00 | 0.97 | 0.98 | ||||||
Total Noninterest Expense/AA | 2.95 | 3.04 | 3.05 | 3.02 | 2.96 | 2.96 | ||||||
Inc Before Sec Gain (Loss)/AA (H) | 1.69 | 1.49 | 1.63 | 1.68 | 1.81 | 1.98 | ||||||
Gain (Loss) on Securities/AA | 0.04 | 0.05 | 0.00 | 0.01 | 0.03 | 0.02 | ||||||
Inc Bef Tax & Other Adj/AA | 1.73 | 1.54 | 1.63 | 1.69 | 1.84 | 2.00 | ||||||
Applicable Income Taxes/AA | 0.53 | 0.47 | 0.51 | 0.51 | 0.57 | 0.62 | ||||||
Minority Interest/AA | 0.03 | 0.03 | 0.02 | 0.01 | 0.01 | 0.01 | ||||||
Inc Before Extraordinary Items/AA | 1.17 | 1.03 | 1.10 | 1.17 | 1.27 | 1.38 | ||||||
Extraordinary Items, Net/AA | 0.00 | 0.00 | 0.00 | 0.00 | 0.00 | 0.00 | ||||||
Net Income (Loss)/AA | 1.17 | 1.03 | 1.10 | 1.17 | 1.27 | 1.38 |
(c) 2002 Sheshunoff Information Services, Inc.
SECTION IX
SUMMARYOF ”CONTROL” PRICING ANALYSES
SUMMARYOF “CONTROL” PRICING ANALYSES
Price Multiples: | Price Indices: | % Deal Premium in Relation to Market Price Per Share as of: | |||||||||||||||||||||||||||||||||||
Number of Deals | Total Assets $(000) | ROA | ROE | Equity/ Assets | Nonint Exp/Avg. Assets | Core Equity | L4QNI | Core Equity | L4QNI | Anncd. Cost Svgs% | 1-Wk Prior to Anncmt | 2-Wks Prior to Anncmt | 1-Mo Prior to Anncmt | ||||||||||||||||||||||||
Listing of Selected Acquired U.S. Publicly- Traded Banking Orgs. ($200M-$1.5B); [Deals Announced during Jan01-YTD02] | |||||||||||||||||||||||||||||||||||||
Averages | 46 | $ | 547,886 | 1.09 | % | 12.89 | % | 8.51 | % | 3.21 | % | 2.42x | 20.53x | 20.01 | 21.21 | NA |
| 30.22 | % | 32.75 | % | 36.94 | % | ||||||||||||||
Medians | 46 | $ | 478,957 | 1.10 | % | 12.69 | % | 8.10 | % | 2.89 | % | 2.27x | 19.33x | 19.99 | 21.59 | NA |
| 29.82 | % | 30.71 | % | 34.71 | % | ||||||||||||||
Listing of Selected Acquired U.S. Banking Orgs. ($200M – $1.5B)—100% Stock Consideration; [Deals Announced during Jan01-YTD02] | |||||||||||||||||||||||||||||||||||||
Averages | 23 | $ | 454,293 | 1.19 | % | 13.07 | % | 9.06 | % | 3.12 | % | 2.36x | 19.15x | 21.36 | 22.74 | NA |
| NA |
| NA |
| NA |
| ||||||||||||||
Listing of Selected Acquired U.S. Banking Orgs. ($200M – $1.5B)—100% Cash Consideration; [Deals Announced during Jan01-YTD02] | |||||||||||||||||||||||||||||||||||||
Averages | 21 | $ | 472,340 | 1.00 | % | 11.41 | % | 8.69 | % | 3.28 | % | 2.01x | 18.41x | 17.49 | 18.46 | NA |
| NA |
| NA |
| NA |
| ||||||||||||||
Announced Targeted Cost Savings Relating to the Acquisition of Selected U.S. Banking Orgs. (Below $5.0B); [Deals Announced during Jan01-YTD02] | |||||||||||||||||||||||||||||||||||||
Averages | 37 | $ | 753,126 | 1.05 | % | 12.58 | % | 8.54 | % | 3.01 | % | 2.45x | 24.22x | 20.42 | 21.74 | 23.0 | % | NA |
| NA |
| NA |
| ||||||||||||||
Listing of Selected Acquired U.S. Banking Orgs. ($300M – $750M)—100% Cash Consideration; [Deals Announced during Jan01-YTD02] | |||||||||||||||||||||||||||||||||||||
Averages | 10 | $ | 481,492 | 0.91 | % | 11.17 | % | 7.99 | % | 3.44 | % | 2.12x | 19.72x | 16.98 | 17.89 | NA |
| NA |
| NA |
| NA |
| ||||||||||||||
SECTION X
PROFILE—THE BANK ADVISORY GROUP, INC.
THE BANK ADVISORY GROUP, INC.
COMPANY PROFILE
The Bank Advisory Group, Inc. is a specialized consulting firm focusing on providing stock valuations together with traditional merger & acquisition advisory services exclusively to financial institutions located throughout the United States, or to groups of individuals associated with U.S.based financial institutions. Together, the principals of The Bank Advisory Group have developed special insight and skills as a result of over one thousand stock valuations and merger & acquisition transactions in which they have acted as advisors over the past two decades. The principals of The Bank Advisory Group, Inc. are directly involved with the projects for which the firm has been engaged to render advice, thereby assuring that each client relationship receives advice of the highest quality.
As part of its line of professional services, The Bank Advisory Group, Inc. specializes in rendering valuation opinions of banks and bank holding companies nationwide. These valuations are required for a multitude of reasons, including tax and estate planning, employee stock ownership plans, private placements, buy/sell agreements, exchange ratio determinations, dissenters’ rights proceedings, reverse stock splits, fairness opinion letters, public offerings, mergers and acquisitions. Broad and extensive participation in the field of bank securities appraisal on the part of the firm’s principals, allows The Bank Advisory Group, Inc. to be especially knowledgeable with regard to valuation theory and the rulings and guidelines of the Internal Revenue Service and the Office of the Comptroller of the Currency involving valuation methodology, and judicial decisions regarding bank stock valuation matters.
In connection with providing merger and acquisition services to community banks nationwide, the principals of The Bank Advisory Group have participated in well over 1,000 client relationships involving the fair market evaluation of control and/or minority blocks of stock. Additionally, the principals of The Bank Advisory Group have represented hundreds of clients involved in bank mergers/acquisitions, performing services in the areas of strategic planning, pro forma financial analysis, negotiating support, and pricing and structure analysis. Finally, we frequently identify key regulatory issues and offer assistance in developing appropriate responses; and, we assist bank holding companies in identifying financing options and in obtaining financing. We believe this level of experience qualifies The Bank Advisory Group as one of the preeminent providers of specialized investment advisory services to the community banking industry.
COMPANY MISSION
To provide high-quality and unimpeachable financial advisory services—principally bank stock valuations, bank merger & acquisition advice and analysis, and related services—in a timely and cost-effective manner to our core clients, which consist of U.S. community banks and their owners.
The Bank Advisory Group’s mission determines the priorities of our professional engagements, and the way in which we measure our accomplishments. The Bank Advisory Group’s sole focus is on ownership issues concerning U.S. community banks. Thus, The Bank Advisory Group neither performs work that is unrelated to our mission, nor do we seek to serve clients that have underlying goals in conflict with our mission.
THE BANK ADVISORY GROUP, INC.
BASIC ATTRIBUTES OF PROFESSIONAL EMPLOYEES
The Bank Advisory Group is comprised of professionals possessing three basic characteristics:
| · | Friendly and amicable approach to client services |
| · | Professional attitude, with a focus on meeting client needs |
| · | Impeccable integrity and trustworthiness, both personally and professionally |
The Bank Advisory Group believes that the absence of any one of these three priorities precludes us from effectively implementing our mission. Also, by displaying these three attributes, The Bank Advisory Group is able to attract long-term clients that possess the same basic qualities.
SHARED VALUES OF PROFESSIONAL EMPLOYEES
The Bank Advisory Group’s professionals have shared values that provide a basic framework within which our business is conducted. These shared values are:
| · | We do not measure our progress or success by revenue figures or number of engagements, but rather by our contribution to the successes of our clients |
| · | We do not talk about our clients or their successes and failures, but rather, in communicating with future clients, we will discuss the lessons that we have learned as we have worked with existing and former clients |
| · | We seek to derive conclusions and recommendations drawn from rigorous and objective analysis—not perceptions or unsubstantiated opinions |
| · | While we all have personal lives governed by individual goals and aspirations, we make an overreaching effort to place our clients’ needs and our company mission ahead of our personal needs |
PRINCIPALS
ROBERT L. WALTERS, CHAIRMAN
Bob Walters established The Bank Advisory Group, Inc. in 1989. For over ten years prior to that, Mr. Walters headed the bank merger & acquisitions and stock valuation advisory services of Sheshunoff & Company. As a result of his years of distinctive experience, he is a recognized leader in these fields.
Specifically, Bob Walters has assisted hundreds of banks in developing negotiating strategies, formulating pricing and structure alternatives, and seeking alternative buyers/sellers/merger partners. Additionally, since 1979, Mr. Walters has participated in over 500 client relationships involving the
THE BANK ADVISORY GROUP, INC.
fair market evaluation of control and/or minority blocks of bank stock. As such, Mr. Walters has frequently served as an expert witness on bank stock valuation and bank M&A matters.
Mr. Walters has spoken at numerous national and state bank trade association seminars and conventions on bank M&A and stock valuation issues, and was the principal author of the widely-used Sheshunoff Information Services publication,Buying, Selling, Merging Banks. As founding editor of the Sheshunoff publication,The Prices Paid for U.S. Banks, he is an expert in quantifying the financial determinants of bank value.
Bob Walters is also a principal in The Bank CEO Network, an educational program which provides current information on the banking industry to community bank presidents and chief executive officers. Mr. Walters is a certified public accountant and a graduate of Texas A&M University with a BBA in Accounting.
J. STEPHEN SKAGGS, PRESIDENT
Stephen Skaggs is an organizing partner of The Bank Advisory Group, Inc. Mr. Skaggs has worked extensively with community banks nationwide in developing negotiating strategies, formulating pricing and structure alternatives, evaluating merger & acquisition options, and providing fair market evaluations of control or minority blocks of bank stock.
With 20 years of experience in the areas in which The Bank Advisory Group specializes, Mr. Skaggs has been involved in well over 500 fair market evaluations of bank stock for purposes of merger & acquisition transactions, employee stock ownership plans, federal estate tax returns, and collateral assessments. He has substantial experience in assisting banks and groups of investors in successfully completing bank holding company formations and expansions; and, he has assisted numerous banking organizations, as both buyers and sellers, in formulating strategic M&A plans.
Prior to forming The Bank Advisory Group, Mr. Skaggs was a Vice President in the Investment Banking Division at Alex Sheshunoff & Company, Inc. from 1983 through 1989. During his years at Sheshunoff, he conceived and designed many of the bank and thrift financial ratio analysis products and publications produced by Sheshunoff Information Services, and he co-authored the widely-used publication,Buying, Selling, Merging Banks.
After graduating with a BBA in Finance from Texas A&M University, Mr. Skaggs worked as a credit analyst with InterFirst Bank Dallas, N.A., followed by a position as an analyst in the Bank Holding Company Applications Division of the Federal Reserve Bank of Dallas.
DANIEL R. JACKSON, SENIOR VICE PRESIDENT
Daniel Jackson is a principal of The Bank Advisory Group, Inc., having joined the firm in 1990. Mr. Jackson has worked extensively with community banks nationwide in developing negotiating strategies, formulating pricing and structure alternatives, evaluating merger & acquisition options, and providing fair market evaluations of control or minority blocks of bank stock.
With nine years of experience in the areas in which The Bank Advisory Group specializes, Mr. Jackson has been involved in well over 300 fair market evaluations of bank stock for purposes of merger & acquisition transactions, employee stock ownership plans, federal estate tax returns, and
THE BANK ADVISORY GROUP, INC.
collateral assessments. Mr. Jackson possesses considerable experience in assisting banks and groups of investors in successfully completing bank holding company formations and expansions; and, he has assisted numerous banking organizations, as both buyers and sellers, in formulating strategic M&A plans.
Prior to joining The Bank Advisory Group, Mr. Jackson served as a Commissioned Examiner with the Federal Reserve Bank of Dallas from 1986 through 1990, serving initially as a field examiner, then as an analyst with the Reserve Bank’s Special Monitoring Unit for critically impaired banking organizations. Mr. Jackson previously served as an lending/credit administration officer with a community bank in Austin, Texas, and as a credit analyst with a subsidiary of InterFirst Corporation, Dallas, Texas.
May 7, 2003
Mr. Milton S., McGee, Jr.
President and Chief Executive Officer
Henderson Citizens Bancshares, Inc.
P.O. Box 1009
Henderson, Texas 75653-1009
| Re: | Cash fair evaluation of the common stock of Henderson Citizens Bancshares, Inc., Henderson, Texas (the “Company”) as of December 31, 2002 for use in connection with a proposed corporate reorganization and “going private” transaction (the “Evaluation”) |
Dear Mr. McGee:
You have requested that The Bank Advisory Group, LLC (“BAGI”) give its consent to the inclusion of the Evaluation as an exhibit to the Schedule 13E-3 that the Company will file with the Securities and Exchange Commission in connection with the Company’s corporate reorganization and going private transaction.
By this letter, BAGI gives its consent to the inclusion of the Evaluation in the Schedule 13E-3 and any amendments thereto.
The consent contained in this letter is limited to the inclusion of the Evaluation in the Company’s Schedule 13E-3 and any amendments thereto. Nothing in this letter may be construed as BAGI’s consent to any other unauthorized use of the Evaluation.
Sincerely,
THE BANK ADVISORY GROUP, LLC
/s/ Daniel R. Jackson
Daniel R. Jackson
Executive Vice President