TASEKO MINES LIMITED Management's Discussion and Analysis |
This management's discussion and analysis ("MD&A") is intended to help the reader understand Taseko Mines Limited ("Taseko", "we", "our" or the "Company"), our operations, financial performance, and current and future business environment. This MD&A is intended to supplement and complement the consolidated financial statements and notes thereto, prepared in accordance with IAS 34 of International Financial Reporting Standards ("IFRS") for the three and nine months ended September 30, 2021 (the "Financial Statements"). You are encouraged to review the Financial Statements in conjunction with your review of this MD&A and the Company's other public filings, which are available on the Canadian Securities Administrators' website at www.sedar.com and on the EDGAR section of the United States Securities and Exchange Commission's ("SEC") website at www.sec.gov.
This MD&A is prepared as of November 2, 2021. All dollar figures stated herein are expressed in Canadian dollars, unless otherwise specified. Included throughout this MD&A are references to non-GAAP performance measures which are denoted with an asterisk and further explanation including their calculations are provided on page 21.
Cautionary Statement on Forward-Looking Information
This discussion includes certain statements that may be deemed "forward-looking statements". All statements in this discussion, other than statements of historical facts, that address future production, reserve potential, exploration drilling, exploitation activities, and events or developments that the Company expects are forward-looking statements. Although we believe the expectations expressed in such forward-looking statements are based on reasonable assumptions, such statements are not guarantees of future performance and actual results or developments may differ materially from those in the forward-looking statements. Factors that could cause actual results to differ materially from those in forward-looking statements include market prices, global economic events arising from the coronavirus (COVID-19) pandemic outbreak, exploitation and exploration successes, continued availability of capital and financing and general economic, market or business conditions. Investors are cautioned that any such statements are not guarantees of future performance and actual results or developments may differ materially from those projected in the forward-looking statements. All of the forward-looking statements made in this MD&A are qualified by these cautionary statements. We disclaim any intention or obligation to update or revise any forward-looking statements whether as a result of new information, future events or otherwise, except to the extent required by applicable law. Further information concerning risks and uncertainties associated with these forward-looking statements and our business may be found in the Company's other public filings with the SEC and Canadian provincial securities regulatory authorities.
TASEKO MINES LIMITED Management's Discussion and Analysis |
CONTENTS
TASEKO MINES LIMITED Management's Discussion and Analysis |
OVERVIEW
Taseko is a copper focused mining company that seeks to create long-term shareholder value by acquiring, developing, and operating large tonnage mineral deposits in stable jurisdictions which are capable of supporting a mine for decades. The Company's principal operating asset is the 75% owned Gibraltar mine, which is located in central British Columbia and is one of the largest copper mines in North America. Taseko also owns Florence Copper, which is advancing towards construction with commercial production expected in 2023, as well as the Yellowhead copper, New Prosperity gold-copper, and Aley niobium projects.
HIGHLIGHTS
| Operating Data (Gibraltar - 100% basis) | Three months ended September 30, | Nine months ended September 30, | ||||||||||||||||
| 2021 | 2020 | Change | 2021 | 2020 | Change | |||||||||||||
| Tons mined (millions) | 25.2 | 23.3 | 1.9 | 82.1 | 72.3 | 9.8 | ||||||||||||
| Tons milled (millions) | 7.4 | 7.5 | (0.1 | ) | 21.9 | 22.6 | (0.7 | ) | ||||||||||
| Production (million pounds Cu) | 34.5 | 28.9 | 5.6 | 83.5 | 98.1 | (14.6 | ) | |||||||||||
| Sales (million pounds Cu) | 32.4 | 28.6 | 3.8 | 81.1 | 99.0 | (17.9 | ) | |||||||||||
| Financial Data | Three months ended September 30, | Nine months ended September 30, | ||||||||||||||||
| (Cdn$ in thousands, except for per share amounts) | 2021 | 2020 | Change | 2021 | 2020 | Change | ||||||||||||
| Revenues | 132,563 | 87,780 | 44,783 | 330,306 | 255,869 | 74,437 | ||||||||||||
| Earnings from mining operations before depletion and amortization* | 83,681 | 35,705 | 47,976 | 168,476 | 91,964 | 76,512 | ||||||||||||
| Cash flows provided by operations | 68,319 | 31,021 | 37,298 | 137,538 | 85,771 | 51,767 | ||||||||||||
| Adjusted EBITDA* | 76,291 | 31,545 | 44,746 | 147,745 | 87,751 | 59,994 | ||||||||||||
| Adjusted net income (loss)* | 27,020 | (5,754 | ) | 32,774 | 31,433 | (19,066 | ) | 50,499 | ||||||||||
| Per share - basic ("adjusted EPS")* | 0.10 | (0.02 | ) | 0.12 | 0.11 | (0.08 | ) | 0.19 | ||||||||||
| Net income (loss) (GAAP) | 22,485 | 987 | 21,498 | 24,710 | (29,218 | ) | 53,928 | |||||||||||
| Per share - basic ("EPS") | 0.08 | - | 0.08 | 0.09 | (0.12 | ) | 0.21 | |||||||||||
TASEKO MINES LIMITED Management's Discussion and Analysis |
Third Quarter Review
Third quarter earnings from mining operations before depletion and amortization* was $83.7 million, Adjusted EBITDA* was $76.3 million and cash flows from operations was $68.3 million;
Adjusted net income* was $27.0 million ($0.10 per share), a 171% increase from the second quarter;
Site operating costs, net of by-product credits* were US$1.28 per pound produced, and total operating costs (C1)* were US$1.57 per pound produced;
The Gibraltar mine produced 34.5 million pounds of copper and 571 thousand pounds of molybdenum in the third quarter, increases of 29% and 42% over the second quarter, respectively. Copper recoveries were 84.2% and copper head grades were 0.28%, in line with management expectations;
Gibraltar sold 32.4 million pounds of copper in the quarter (100% basis) which contributed to $132.6 million of revenue for Taseko, an increase of 19% over the second quarter. Average realized copper prices were US$4.26 per pound in the quarter, consistent with the LME average price;
The Company has approximately $300 million of available liquidity, including a cash balance of $239 million at September 30, 2021 and a US$50 million revolving credit facility (the "Facility"). The Facility, which closed in early October, was arranged and fully underwritten by National Bank of Canada, will be available for working capital and general corporate purposes, and provides additional financial flexibility as the Company prepares for the construction at Florence Copper;
Development costs incurred for Florence Copper were $19.1 million in the third quarter and included detailed engineering and design of the commercial facility, and initial deposits for major processing equipment associated with the solvent extraction and electrowinning ("SX/EW") plant. These activities will allow the project team to efficiently advance into construction upon receipt of the Underground Injection Control ("UIC") permit;
The EPA continues to make progress towards finalizing the UIC permit with no significant issues raised to-date, and the Company is expecting to receive the draft permit from the EPA shortly for its review. Once publicly issued by the EPA, there will be a public comment period;
The Company has secured minimum copper price protection for the coming quarters including copper collars for the first half of 2022 which secure a minimum copper price of US$4.00 per pound and a ceiling price of US$5.60 per pound for 43 million pounds of copper; and
In September 2021, the Company completed the sale of the Harmony Gold Project ("Harmony") to JDS Gold Inc. ("JDS Gold"), a newly incorporated company controlled by JDS Energy & Mining Inc. and affiliates. Under the terms of the agreement, JDS Gold became the owner and operator of Harmony, a high-grade development-stage gold project located on Graham Island in Haida Gwaii. The Company retained a 2% net smelter return royalty in Harmony and a 15% carried interest in JDS Gold.
TASEKO MINES LIMITED Management's Discussion and Analysis |
REVIEW OF OPERATIONS
Gibraltar mine (75% Owned)
Operating data (100% basis) | Q3 2021 | Q2 2021 | Q1 2021 | Q4 2020 | Q3 2020 |
Tons mined (millions) | 25.2 | 24.9 | 32.0 | 26.4 | 23.3 |
Tons milled (millions) | 7.4 | 7.2 | 7.2 | 7.5 | 7.5 |
Strip ratio | 1.3 | 2.3 | 6.0 | 1.9 | 1.5 |
Site operating cost per ton milled (Cdn$)* | $8.99 | $9.16 | $8.73 | $11.67 | $9.57 |
Copper concentrate |
|
|
|
|
|
Head grade (%) | 0.28 | 0.22 | 0.19 | 0.20 | 0.23 |
Copper recovery (%) | 84.2 | 83.3 | 81.5 | 83.3 | 85.0 |
Production (million pounds Cu) | 34.5 | 26.8 | 22.2 | 25.0 | 28.9 |
Sales (million pounds Cu) | 32.4 | 26.7 | 22.0 | 25.0 | 28.6 |
Inventory (million pounds Cu) | 4.9 | 3.5 | 3.6 | 3.4 | 3.6 |
Molybdenum concentrate |
|
|
|
|
|
Production (thousand pounds Mo) | 571 | 402 | 530 | 549 | 668 |
Sales (thousand pounds Mo) | 502 | 455 | 552 | 487 | 693 |
Per unit data (US$ per pound produced)* |
|
|
|
|
|
Site operating costs* | $1.53 | $2.02 | $2.23 | $2.67 | $1.85 |
By-product credits* | (0.25) | (0.25) | (0.27) | (0.14) | (0.14) |
Site operating costs, net of by-product credits* | $1.28 | $1.77 | $1.96 | $2.53 | $1.71 |
Off-property costs | 0.29 | 0.25 | 0.27 | 0.29 | 0.29 |
Total operating costs (C1)* | $1.57 | $2.02 | $2.23 | $2.82 | $2.00 |
Third Quarter Review
Copper production in the third quarter was 34.5 million pounds and improved 29% over the second quarter as higher ore grades were mined and processed from the Pollyanna pit. Copper recoveries also improved with the increasing ore grade.
A total of 25.2 million tons were mined in the third quarter in line with the mine plan and the second quarter. The strip ratio decreased as a result of mining in Pollyanna opening higher grade areas with lower stripping rates. There was also an increase of 3.7 million tons added to ore stockpiles. While Pollyanna ore remains the primary mill feed, waste stripping activities also increased in the Gibraltar East pit during the quarter.
Total site spending (including capitalized stripping of $10.9 million on a 75% basis) was 4% lower than the prior quarter due mainly to the timing of routine maintenance. Sustaining capital expenditures at Gibraltar of $8.3 million on a 75% basis in the third quarter was comparable to the second quarter.
Molybdenum production was 571 thousand pounds in the third quarter and increased due to higher grades of molybdenum in the ore. Molybdenum prices also strengthened in the third quarter and reached a high of US$20.10 per pound in late August. The average molybdenum price of US$19.05 per pound was a US$4.73 per pound increase over the second quarter. By-product credits per pound of copper produced remained at US$0.25 in the third quarter despite the increased copper production.
TASEKO MINES LIMITED Management's Discussion and Analysis |
Off-property costs per pound produced* were US$0.29 for the third quarter and higher than the second quarter due to increased trucking of concentrate in July and August in response to wildfires in the BC interior which impacted railcar movements. The Company also realized lower treatment and refining charges ("TCRC") in the second quarter as a spot tender was delivered at one of the lowest TCRC levels ever seen by the Gibraltar mine.
Total operating costs per pound produced (C1)* were US$1.57 for the quarter, 22% lower than the previous quarter. The decrease in C1* costs was primarily due to the significantly increased copper production in the third quarter compared to the second quarter.
GIBRALTAR OUTLOOK
Total copper production in the last quarter of 2021 is expected to be similar to the third quarter, as higher-grade areas in the Pollyanna pit are available for processing. The Company continues to expect approximately 120 million pounds of copper production for the 2021 year.
Copper prices in the third quarter averaged US$4.25 per pound and are currently around US$4.30 per pound and recently tested record levels again due to depleted warehouse inventories and a unique supply squeeze attributed to smelter closures resulting from an Asian and European energy crisis as well as continued supply chain challenges caused by the economic restart. High copper prices, and downside protection from copper hedges in place, are supportive of strong financial performance at the Gibraltar mine over the coming quarters.
The copper price outlook into 2022 remains quite favorable with many governments now focusing on increased infrastructure investment to stimulate economic recovery after the pandemic, including green initiatives, which will require new primary supplies of copper. Although some analysts predict a balanced market by 2023 based on known projects currently under development, most industry analysts are projecting ongoing supply constraints and deficits, which should support higher copper prices in the years to come.
The Company has a long track record of purchasing copper price options to manage copper price volatility. This strategy provides security over the Company's cash flow as it prepares for construction of Florence Copper while providing significant upside should copper prices continue at these levels or increase further. In particular, the Company has copper collars to secure a minimum copper price of US$4.00 per pound for the first half of 2022 for 43 million pounds of copper.
FLORENCE COPPER
The commercial production facility at Florence Copper will be one of the greenest sources of copper for US domestic consumption, with carbon emissions, water and energy consumption all dramatically lower than a conventional mine. It is a low-cost copper project with an annual production capacity of 85 million pounds of copper over a 21-year mine life. With the expected C1* operating cost of US$1.10 per pound, Florence Copper will be in the lowest quartile of the global copper cost curve.
The Company has successfully operated a Production Test Facility ("PTF") since 2018 at Florence to demonstrate that the in-situ copper recovery ("ISCR") process can produce high quality cathode while operating within permit conditions.
The next phase of Florence Copper will be the construction and operation of the commercial ISCR facility with an estimated capital cost of US$230 million (including reclamation bonding and working capital). At a conservative copper price of US$3.00 per pound, Florence Copper is expected to generate an after-tax internal rate of return of 37%, an after-tax net present value of US$680 million at a 7.5% discount rate, and an after-tax payback period of 2.5 years.
TASEKO MINES LIMITED Management's Discussion and Analysis |
In December 2020, the Company received the Aquifer Protection Permit ("APP") from the Arizona Department of Environmental Quality ("ADEQ"). During the APP process, Florence Copper received strong support from local community members, business owners and elected officials. The other required permit is the UIC permit from the U.S. Environmental Protection Agency ("EPA"), which is the final permitting step required prior to construction of the commercial ISCR facility. The EPA continues to make progress towards finalizing the permit with no significant issues raised to-date, and the Company is expecting to receive the draft UIC permit from the EPA shortly. Once the permit is publicly issued, a public comment period will commence.
Detailed engineering and design for the commercial production facility is now approximately 85% complete. The Company has made initial deposits and awarded the key contract for the major processing equipment associated with the SX/EW plant in the third quarter. The Company has made purchase commitments of US$25 million as at September 30, 2021 to assist with protecting the project execution plan and mitigating the impact of supply chain disruptions. Deploying strategic capital and awarding key contracts will ensure a smooth and efficient transition into construction once the final UIC permit is received.
At current copper prices, the Company expects to be able to fund construction of the commercial facility from its existing sources of liquidity and cashflows from Gibraltar.
LONG-TERM GROWTH STRATEGY
Taseko's strategy has been to grow the Company by acquiring and developing a pipeline of complementary projects focused on copper in stable mining jurisdictions. We continue to believe this will generate long-term returns for shareholders. Our other development projects are located in British Columbia.
Yellowhead Copper Project
Yellowhead Mining Inc. ("Yellowhead") has an 817 million tonnes reserve and a 25-year mine life with a pre-tax net present value of $1.3 billion at an 8% discount rate using a US$3.10 per pound copper price. Capital costs of the project are estimated at $1.3 billion over a 2-year construction period. Over the first 5 years of operation, the copper equivalent grade will average 0.35% producing an average of 200 million pounds of copper per year at an average C1* cost, net of by-product credit, of US$1.67 per pound of copper. The Yellowhead copper project contains valuable precious metal by-products with 440,000 ounces of gold and 19 million ounces of silver with a life of mine value of over $1 billion at current prices.
The Company is focusing its current efforts on advancing into the environmental assessment process and is undertaking some additional engineering work in conjunction with ongoing engagement with local communities including First Nations. The Company is also collecting baseline data and modeling which will be used to support the environmental assessment and permitting of the project.
New Prosperity Gold-Copper Project
In late 2019, the Tŝilhqot'in Nation, as represented by Tŝilhqot'in National Government, and Taseko entered into a confidential dialogue, facilitated by the Province of British Columbia, to try to obtain a long-term solution to the conflict regarding Taseko's proposed gold-copper mine currently known as New Prosperity, acknowledging Taseko's commercial interests and the Tŝilhqot'in Nation's opposition to the project. The dialogue was supported by the parties' agreement on December 7, 2019 to a one-year standstill on certain outstanding litigation and regulatory matters that relate to Taseko's tenures and the area in the vicinity of Teẑtan Biny (Fish Lake).
The COVID-19 pandemic delayed the commencement of the dialogue, but the Tŝilhqot'in Nation, the Province of British Columbia and Taseko have made progress in establishing a constructive dialogue. In December 2020, the parties agreed to extend the standstill for a further year to continue this dialogue.
TASEKO MINES LIMITED Management's Discussion and Analysis |
Aley Niobium Project
Environmental monitoring and product marketing initiatives on the Aley niobium project continue. The pilot plant program has successfully completed the niobium flotation process portion of the test, raising confidence in the design and providing feed to the converter portion of the process. Completion of the converter pilot test will provide additional process data to support the design of the commercial process facilities and provide final product samples for marketing purposes.
MARKET REVIEW
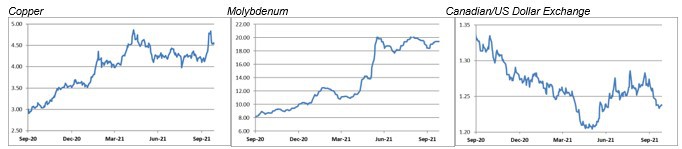
Prices (USD per pound for Commodities)
(Source Data: Bank of Canada, Platts Metals, and London Metals Exchange)
Copper prices are currently around US$4.30 per pound with continued upside amongst a bullish market backdrop and sentiment. Recent exchange warehouse shortages have caused a sharp spike in copper prices back to near record levels seen in May. Copper prices have steadily recovered since the onset of COVID-19 with the initial recovery of the Chinese economy but the energy crises in Europe and Asia as well as supply chain bottlenecks provide near term catalysts for elevated prices to continue. Material changes to taxes and royalty rates in key copper producing countries and threats of strikes and civil unrest also remain a risk to supply in the near term. Focus for the remainder of 2021 and heading into 2022 turns to the expected demand growth and inflation arising from the economic recovery in North America and Europe resulting from unprecedented stimulus measures being implemented by central governments, although some headwinds continue to create volatility in the timing and duration of this recovery. While some analysts predict a copper market balance by 2023 based on known projects in development, the longer-term outlook for copper remains extremely favorable with the focus on government investment in construction and infrastructure including initiatives focused on green sources of power and the electrification of transportation which are inherently copper intensive. This increased demand for copper after years of under investment by the industry in new mine supply is expected to support strong copper prices well into the middle and later part of this decade.
The average molybdenum price was US$19.05 per pound during the third quarter of 2021, compared to US$14.32 per pound in the second quarter of 2021. Recent molybdenum prices have reached decade high levels at over US$20.00 per pound and are currently around US$19.30 per pound, driven by steel demand from the global recovery and a strong recovery in the oil and gas sector. The Company's sales agreements specify molybdenum pricing based on the published Platts Metals reports.
Approximately 80% of the Gibraltar mine's costs are Canadian dollar denominated and therefore, fluctuations in the Canadian/US dollar exchange rate can have a significant effect on the Company's operating results and unit production costs, which are earned and in some cases reported in US dollars. Overall, the Canadian dollar was relatively unchanged during the first nine months of 2021.
TASEKO MINES LIMITED Management's Discussion and Analysis |
FINANCIAL PERFORMANCE
Earnings
| Three months ended September 30, | Nine months ended September 30, | |||||||||||||||||
| (Cdn$ in thousands) | 2021 | 2020 | Change | 2021 | 2020 | Change | ||||||||||||
| Net income (loss) | 22,485 | 987 | 21,498 | 24,710 | (29,218 | ) | 53,928 | |||||||||||
| Net unrealized foreign exchange (gain) loss | 9,511 | (7,512 | ) | 17,023 | 14,545 | 9,250 | 5,295 | |||||||||||
| Realized foreign exchange gain on settlement of long-term debt | - | - | - | (13,000 | ) | - | (13,000 | ) | ||||||||||
| Loss on settlement of long-term debt | - | - | - | 5,798 | - | 5,798 | ||||||||||||
| Call premium on settlement of long-term debt | - | - | - | 6,941 | - | 6,941 | ||||||||||||
| Unrealized (gain) loss on derivative instruments | (6,817 | ) | 1,056 | (7,873 | ) | (5,645 | ) | 1,236 | (6,881 | ) | ||||||||
| Estimated tax effect of adjustments | 1,841 | (285 | ) | 2,126 | (1,916 | ) | (334 | ) | (1,582 | ) | ||||||||
| Adjusted net income (loss) * | 27,020 | (5,754 | ) | 32,774 | 31,433 | (19,066 | ) | 50,499 | ||||||||||
The Company's adjusted net income was $27.0 million ($0.10 per share) for the three months ended September 30, 2021, compared to an adjusted net loss of $5.8 million ($0.02 loss per share) for the same period in 2020. The increased adjusted net income in the current period was primarily due to greater earnings from mining operations before depletion and amortization* which was $83.7 million for the current quarter compared to $35.7 million for the same period in 2020. During the third quarter of 2021, earnings from mining operations was positively impacted by the higher copper sales volumes and a higher average LME copper price of US$4.25 per pound, an increase of 44% over the third quarter of 2020. An increase in waste stripping costs being capitalized and lower depletion and amortization expense also positively impacted earnings. After inclusion of $9.5 million in unrealized foreign exchange losses on the outstanding senior secured notes and unrealized gains on derivative instruments, the Company's net income was $22.5 million ($0.08 per share) for the three months ended September 30, 2021, compared to net income of $1.0 million ($nil per share) for the same period in 2020.
The Company's adjusted net income was $31.4 million ($0.11 per share) for the nine months ended September 30, 2021, compared to an adjusted net loss of $19.1 million ($0.08 loss per share) for the same period in 2020. The increased adjusted net income in the current nine month period was primarily due to the higher average copper price which more than offset the lower copper production and sales volumes in the nine months ended September 30, 2021 compared to the same period in 2020. Net income was also positively impacted by lower depletion and amortization expense in 2021 of $26.2 million, partially offset by a realized loss on copper puts purchased of $8.1 million covering sales for the nine months ended September 30, 2021, compared to a net realized gain on copper puts of $5.4 million in the nine months ended September 30, 2020.
Net loss (GAAP) for the nine months ended September 30, 2020 was impacted by the decrease in the Canadian dollar following the onset of COVID-19 which resulted in an unrealized foreign exchange loss of $9.3 million for the period, compared to $2.3 million net foreign exchange loss in the nine months ended September 30, 2021, of which $13.0 million foreign exchange gain was realized on repayment of the 2022 senior secured notes ("2022 Notes"). The $5.8 million settlement loss and $6.9 million call premium recorded upon repayment of the 2022 Notes from the February 2022 Note refinancing also decreased GAAP net income in the nine months ended September 30, 2021.
No adjustments are made to adjusted net income (loss) for positive or negative provisional price adjustments in the quarter as these adjustments normalize or reverse throughout the year.
TASEKO MINES LIMITED Management's Discussion and Analysis |
Revenues
| Three months ended September 30, | Nine months ended September 30, | |||||||||||||||||
| (Cdn$ in thousands) | 2021 | 2020 | Change | 2021 | 2020 | Change | ||||||||||||
| Copper contained in concentrate | 125,050 | 82,347 | 42,703 | 306,371 | 254,061 | 52,310 | ||||||||||||
| Copper price adjustments on settlement | 1,173 | 4,449 | (3,276 | ) | 7,701 | 981 | 6,720 | |||||||||||
| Molybdenum concentrate | 8,972 | 5,223 | 3,749 | 20,202 | 14,680 | 5,522 | ||||||||||||
| Molybdenum price adjustments on settlement | 900 | 657 | 243 | 4,120 | 1,654 | 2,466 | ||||||||||||
| Silver | 953 | 599 | 354 | 2,418 | 2,563 | (145 | ) | |||||||||||
| Total gross revenue | 137,048 | 93,275 | 43,773 | 340,812 | 273,939 | 66,873 | ||||||||||||
| Less: treatment and refining costs | (4,485 | ) | (5,495 | ) | 1,010 | (10,506 | ) | (18,070 | ) | 7,564 | ||||||||
| Revenue | 132,563 | 87,780 | 44,783 | 330,306 | 255,869 | 74,437 | ||||||||||||
| (thousands of pounds, unless otherwise noted) | ||||||||||||||||||
| Sales of copper in concentrate** | 23,423 | 20,693 | 2,730 | 58,622 | 71,606 | (12,984 | ) | |||||||||||
| Average realized copper price (US$ per pound) | 4.26 | 3.15 | 1.11 | 4.29 | 2.63 | 1.66 | ||||||||||||
| Average LME copper price (US$ per pound) | 4.25 | 2.96 | 1.29 | 4.17 | 2.65 | 1.52 | ||||||||||||
| Average exchange rate (US$/CAD) | 1.26 | 1.33 | (0.07 | ) | 1.25 | 1.35 | (0.10 | ) | ||||||||||
** This amount includes a net smelter payable deduction of approximately 3.5% to derive net payable pounds of copper sold.
Copper revenues for the three months ended September 30, 2021 increased by $42.7 million compared to the same period in 2020, primarily due to higher prevailing LME copper prices by US$1.29 per pound in the current quarter and increases in the volume of payable copper sold by 2.7 million pounds (75% basis). Partially offsetting the higher copper price and volume this quarter was the weakening US dollar, which decreased 5.4% from the prior year quarter.
Copper revenues for the nine months ended September 30, 2021 increased by $52.3 million compared to the same period in 2020, primarily due to higher copper prices by US$1.52 per pound in the current period, partially offset by decreases in the volume of payable copper sold by 13.0 million pounds (75% basis) and a weaker US dollar. The Company also recognized positive net price adjustments of $7.7 million, for provisionally priced copper concentrate due to increasing copper price trends following shipment, compared to positive price adjustments of only $1.0 million in the prior year period.
Molybdenum revenues for the three months ended September 30, 2021 increased by $3.7 million compared to the same period in 2020 due to higher average molybdenum prices of US$19.05 per pound, compared to US$7.71 per pound for the same prior period, partially offset by the lower molybdenum sales volumes by 143 thousand pounds (75% basis).
Molybdenum revenues for the nine months ended September 30, 2021 increased by $5.5 million compared to the same period in 2020, primarily due to higher average molybdenum prices of US$14.95 per pound, compared to US$9.57 per pound for the same prior period, partially offset by lower molybdenum sales volumes by 182 thousand pounds (75% basis).
TASEKO MINES LIMITED Management's Discussion and Analysis |
Cost of sales
| Three months ended September 30, | Nine months ended September 30, | |||||||||||||||||
| (Cdn$ in thousands) | 2021 | 2020 | Change | 2021 | 2020 | Change | ||||||||||||
| Site operating costs | 50,134 | 53,549 | (3,415 | ) | 147,043 | 151,128 | (4,085 | ) | ||||||||||
| Transportation costs | 5,801 | 4,127 | 1,674 | 13,409 | 14,480 | (1,071 | ) | |||||||||||
| Changes in inventories of finished goods | (762 | ) | (1,415 | ) | 653 | 1,702 | 3,026 | (1,324 | ) | |||||||||
| Changes in inventories of ore stockpiles | (6,291 | ) | (4,186 | ) | (2,105 | ) | (324 | ) | (4,729 | ) | 4,405 | |||||||
| Production costs | 48,882 | 52,075 | (3,193 | ) | 161,830 | 163,905 | (2,075 | ) | ||||||||||
| Depletion and amortization | 17,011 | 23,894 | (6,883 | ) | 50,385 | 76,554 | (26,169 | ) | ||||||||||
| Cost of sales | 65,893 | 75,969 | (10,076 | ) | 212,215 | 240,459 | (28,244 | ) | ||||||||||
| Site operating costs per ton milled* | $ | 8.99 | $ | 9.57 | $ | (0.58 | ) | $ | 8.96 | $ | 8.91 | $ | 0.05 | |||||
Site operating costs for the three months ended September 30, 2021 decreased by $3.4 million compared to the same prior period primarily due to greater mining costs being capitalized in 2021 ($10.9 million) compared to 2020 ($3.8 million) partially offset by higher operating costs associated with 9% more tons being mined in the quarter. Fuel and other input cost savings also reduced site costs in the third quarter of 2020. Transportation costs increased from the prior year due to higher copper concentrate shipment volumes and trucking costs.
Cost of sales is also impacted by changes in copper concentrate inventories and ore stockpiles. There was an increase of 3.7 million tons in the ore stockpiles in the current quarter, which resulted in a decrease in production costs of $6.3 million. For the nine months ended September 30, 2021, there was an overall increase of 1.4 million tons in the ore stockpiles during the period, which resulted in a decrease in production costs of $0.3 million. For the nine months ended September 30, 2020, there was an overall increase of 1.5 million tons in the ore stockpiles during the period, which resulted in a decrease in production costs of $4.7 million.
Depletion and amortization for the three and nine months ended September 30, 2021 decreased by $6.9 million and $26.2 million over the same prior periods. Ore tons that were mined from the Granite pit in the first nine months of 2020 had a higher depreciation cost per ton compared to the current ore being mined from the Pollyanna pit.
Other operating (income) expenses
| Three months ended September 30, | Nine months ended September 30, | |||||||||||||||||
| (Cdn$ in thousands) | 2021 | 2020 | Change | 2021 | 2020 | Change | ||||||||||||
| General and administrative | 2,905 | 2,894 | 11 | 13,367 | 9,692 | 3,675 | ||||||||||||
| Share-based compensation expense | 76 | 2,378 | (2,302 | ) | 4,474 | 3,859 | 615 | |||||||||||
| Project evaluation expenditures | (123 | ) | 978 | (1,101 | ) | 325 | 1,288 | (963 | ) | |||||||||
| Realized (gain) loss on derivative instruments | 4,722 | 222 | 4,500 | 7,620 | (4,926 | ) | 12,546 | |||||||||||
| Unrealized (gain) loss on derivative instruments | (6,817 | ) | 1,056 | (7,873 | ) | (5,645 | ) | 1,236 | (6,881 | ) | ||||||||
| Other income, net | (350 | ) | (336 | ) | (14 | ) | (1,146 | ) | (1,143 | ) | (3 | ) | ||||||
| 413 | 7,192 | (6,779 | ) | 18,995 | 10,006 | 8,989 | ||||||||||||
General and administrative expenses have increased in the nine months ended September 30, 2021, compared to the same prior period, primarily due to employment and consulting services provided by retiring executives as part of the Company's succession plan.
TASEKO MINES LIMITED Management's Discussion and Analysis |
Share-based compensation expense is comprised of the amortization of share options and performance share units and the expense on deferred share units. Share-based compensation expense decreased for the three months ended September 30, 2021, compared to the same prior period, primarily due to the revaluation of the liability for deferred share units resulting from a decrease in the Company's share price during the period. In contrast, the share-based compensation expense increased for the nine months ended September 30, 2021, compared to the same prior period, primarily due to the revaluation of the liability for deferred share units resulting from an increase in the Company's share price during the period. More information is set out in Note 14 of the September 30, 2021 Financial Statements.
During the three months ended September 30, 2021, the Company realized a loss of $4.7 million for premiums paid for copper put options covering third quarter production at a strike price of US$3.75 per pound that settled out-of-the-money during the period. The realized loss of $0.2 million in the third quarter of 2020 relates to fuel call options that settled out of-the-money. For the three months ended September 30, 2021, the net unrealized gain of $6.8 million relates to the fair value adjustments on the outstanding copper collars covering the first half of 2022. The net unrealized loss of $1.1 million in the third quarter of 2020 relates substantially to the fair value adjustment for copper put options that matured between October and December 2020.
During the nine months ended September 30, 2021, the Company realized a net loss of $7.6 million for its derivatives instruments, which consists of $8.1 million for premiums paid for copper put options that settled out-of-the-money during the period and a $0.5 million gain on fuel call options. The net realized gain of $4.9 million in the nine months ended September 30, 2020 relates primarily to copper put options that settled in the money during the period. For the nine months ended September 30, 2021, the net unrealized gain of $5.6 million relates substantially to outstanding copper collars covering the first half of 2022.
Project evaluation expenditures represent costs associated with the New Prosperity project.
Finance expenses and income
| Three months ended September 30, | Nine months ended September 30, | |||||||||||||||||
| (Cdn$ in thousands) | 2021 | 2020 | Change | 2021 | 2020 | Change | ||||||||||||
| Interest expense | 10,360 | 9,422 | 938 | 30,257 | 28,141 | 2,116 | ||||||||||||
| Loss on settlement of long-term debt | - | - | - | 5,798 | - | 5,798 | ||||||||||||
| Finance expense - deferred revenue | 1,414 | 1,643 | (229 | ) | 4,176 | 3,881 | 295 | |||||||||||
| Accretion of PER | 101 | 138 | (37 | ) | 310 | 413 | (103 | ) | ||||||||||
| Finance income | (201 | ) | (4 | ) | (197 | ) | (460 | ) | (202 | ) | (258 | ) | ||||||
| 11,674 | 11,199 | 475 | 40,081 | 32,233 | 7,848 | |||||||||||||
| Call premium on settlement of long-term debt | - | - | - | 6,941 | - | 6,941 | ||||||||||||
As part of the senior secured notes refinancing in February, the Company redeemed its US$250 million 2022 Notes which resulted in an accounting loss of $5.8 million, comprised of the write-off of deferred financing costs of $4.0 million and additional interest costs over the call period of $1.8 million.
The Company also paid a redemption call premium of $6.9 million on the settlement of the 2022 Notes.
Finance expense on deferred revenue adjustments represents the implicit financing component of the upfront deposit from the silver sales streaming arrangement with Osisko Gold Royalties Ltd. ("Osisko").
TASEKO MINES LIMITED Management's Discussion and Analysis |
Income tax
| Three months ended September 30, | Nine months ended September 30, | |||||||||||||||||
| (Cdn$ in thousands) | 2021 | 2020 | Change | 2021 | 2020 | Change | ||||||||||||
| Current income tax expense | 1,354 | 635 | 719 | 2,295 | 1,279 | 1,016 | ||||||||||||
| Deferred income tax expense (recovery) | 20,956 | (1,215 | ) | 22,171 | 22,746 | (7,651 | ) | 30,397 | ||||||||||
| Income tax expense (recovery) | 22,310 | (580 | ) | 22,890 | 25,041 | (6,372 | ) | 31,413 | ||||||||||
| Effective tax rate | 49.8% | (142.5)% | 192.3% | 50.3% | 17.9% | 32.4% | ||||||||||||
| Canadian statutory rate | 27.0% | 27.0% | - | 27.0% | 27.0% | - | ||||||||||||
| B.C. Mineral tax rate | 9.5% | 9.5% | - | 9.5% | 9.5% | - | ||||||||||||
The overall income tax expense for the three and nine months ended September 30, 2021 were due to deferred income tax expense recognized on income for accounting purposes. The effective tax rate for the current third quarter is greater than the combined B.C. mineral and income tax rate of 36.5% due to the non-deductibility of unrealized foreign exchange loss on revaluation of the senior secured notes and as certain expenses such as finance charges and general and administration costs are not deductible for BC mineral tax purposes.
As foreign exchange revaluations on the senior secured notes are not recognized for tax purposes until realized, and in the case of capital losses, when they are applied, the effective tax rate may be significantly higher or lower than the statutory rates, as is the case for the three and nine months ended September 30, 2020 and 2021, relative to net income (loss) for those periods.
The current income tax expense represents an estimate of B.C. mineral taxes payable for the current periods.
TASEKO MINES LIMITED Management's Discussion and Analysis |
FINANCIAL CONDITION REVIEW
Balance sheet review
| At September 30, | At December 31, | ||||||||
| (Cdn$ in thousands) | 2021 | 2020 | Change | ||||||
| Cash and equivalents | 239,151 | 85,110 | 154,041 | ||||||
| Other current assets | 94,484 | 72,088 | 22,396 | ||||||
| Property, plant and equipment | 801,420 | 742,619 | 58,801 | ||||||
| Other assets | 10,266 | 10,548 | (282 | ) | |||||
| Total assets | 1,145,321 | 910,365 | 234,956 | ||||||
| Current liabilities | 69,620 | 60,867 | 8,753 | ||||||
| Debt: | |||||||||
| Senior secured notes | 499,410 | 313,965 | 185,445 | ||||||
| Equipment related financings | 40,649 | 49,439 | (8,790 | ) | |||||
| Deferred revenue | 45,149 | 47,154 | (2,005 | ) | |||||
| Other liabilities | 144,673 | 121,568 | 23,105 | ||||||
| Total liabilities | 799,501 | 592,993 | 206,508 | ||||||
| Equity | 345,820 | 317,372 | 28,448 | ||||||
| Net debt (debt minus cash and equivalents) | 300,908 | 278,294 | 22,614 | ||||||
| Total common shares outstanding (millions) | 283.9 | 282.1 | 1.8 |
The Company's asset base is comprised principally of property, plant and equipment, reflecting the capital intensive nature of Gibraltar and the mining business. Other current assets primarily include accounts receivable, inventories (concentrate inventories, ore stockpiles, and supplies), prepaid expenses, and marketable securities. Concentrate inventories, accounts receivable and cash balances can fluctuate due to transportation and cash settlement schedules.
Property, plant and equipment increased by $58.8 million in the nine months ended September 30, 2021, which includes $36.5 million for the development costs incurred for Florence Copper.
Net debt has increased by $22.6 million in the nine months ended September 30, 2021, primarily due to the senior secured notes refinancing in February including related transaction costs and the Company's investment in copper price protection extending out to June 2022.
Deferred revenue relates to the advance payments received from Osisko for the sale of Taseko's share of future silver production from Gibraltar.
Other liabilities increased by $23.1 million primarily due to an increase in deferred tax liabilities and the liability related to the deferred share units outstanding.
As at November 2, 2021, there were 283,956,191 common shares and 9,206,366 stock options outstanding. More information on these instruments and the terms of their exercise is set out in Note 14 of the September 30, 2021 Financial Statements.
TASEKO MINES LIMITED Management's Discussion and Analysis |
Liquidity, cash flow and capital resources
At September 30, 2021, the Company had cash and equivalents of $239.2 million (December 31, 2020 - $85.1 million).
Cash flow provided by operations during the three months ended September 30, 2021 was $68.3 million compared to cash flow provided by operations of $31.0 million for the same prior period. Cash flow provided by operations during the nine months ended September 30, 2021 was $137.5 million compared to cash flow provided by operations of $85.8 million for the same prior period.
Cash used for investing activities during the three months ended September 30, 2021 was $35.8 million compared to cash used for investing activities of $18.0 million for the same prior period. Investing cash flows in the third quarter includes $10.9 million for capitalized stripping costs, $8.3 million for other sustaining capital expenditures at Gibraltar, and $15.4 million of expenditures for Florence Copper.
Cash used for investing activities during the nine months ended September 30, 2021 was $114.8 million compared to cash used for investing activities of $38.8 million for the same prior period. Investing cash flows for the nine months ended September 30, 2021 includes $47.1 million for capitalized stripping costs, $21.4 million for other sustaining capital expenditures at Gibraltar, which includes the Gibraltar pit dewatering system costs, and $28.1 million of expenditures for Florence Copper. Also included in investing activities is the purchase of copper put options covering production for the fourth quarter of 2021 and copper collars covering the first half of 2022 for the Company's share of Gibraltar's production.
Net cash used for financing activities for the three months ended September 30, 2021 was $23.7 million. Net cash provided by financing activities for the nine months ended September 30, 2021 was $131.8 million. The Company received net incremental proceeds of $170.2 million from issuance of the US$400 million 7% senior secured notes ("2026 Notes") due in February 2026 and after redemption of the US$250 million 2022 Notes. There are no principal payments required on the 2026 Notes until the maturity date in February 2026 and the first interest payment of US$14.4 million was paid on August 16, 2021.
Principal repayments for equipment loans and leases were $14.8 million and interest paid was $24.8 million for the nine months ended September 30, 2021. The Company continues to make monthly principal repayments for equipment loans and leases.
Liquidity outlook
Florence Copper has an estimated capital cost (including reclamation bonding and working capital) of approximately US$230 million (based on the Company's 2017 NI 43-101 technical report). Cash flow from operations was $68.3 million in the third quarter of 2021, and strong operating margins are expected over the remainder of this year due to expected copper production and copper price protection in place. The US$50 million revolving credit facility which closed on October 6, 2021, when combined with the Company's cash balance of $239 million at September 30, 2021, provides financial flexibility and liquidity as the Company prepares for the construction of Florence Copper.
To address any remaining project funding requirements for Florence Copper if needed or other capital spend, in addition to cash flow from the Gibraltar mine, the Company may raise additional capital through equity financings or asset sales, including royalties, sales of project interests, or joint ventures or additional credit facilities, including additional notes offerings. The Company evaluates these financing alternatives based on a number of factors including the prevailing metal prices and projected operating cash flow from Gibraltar, relative valuation, liquidity requirements, covenant restrictions and other factors, in order to optimize the Company's cost of capital and maximize shareholder value.
TASEKO MINES LIMITED Management's Discussion and Analysis |
The Company does not have any significant capital plans for its other development projects over the next 12 months. Should plans for these other development projects materially change, the Company may require additional external funding.
Future changes in copper and molybdenum market prices could also impact the timing and amount of cash available for future investment in the Company's development projects, debt obligations, and other uses of capital. To mitigate commodity price risks in the short-term, copper put options are entered into for a substantial portion of Taseko's share of Gibraltar copper production and the Company has a long track record of doing so (see "Hedging Strategy").
Hedging strategy
The Company's hedging strategy is to secure a minimum price for a significant portion of copper production using put options that are either purchased outright or funded by the sale of call options that are significantly out of the money. The amount and duration of the hedge position is based on an assessment of business-specific risk elements combined with the copper pricing outlook. Copper price and quantity exposure are reviewed at least quarterly to ensure that adequate revenue protection is in place. Hedge positions are typically extended adding incremental quarters at established put strike prices to provide the necessary price protection. The Company's hedging strategy is designed to mitigate short-term declines in copper price.
Considerations on the cost of the hedging program include an assessment of Gibraltar's estimated production costs, anticipated copper prices and the Company's capital requirements during the relevant period. In March 2021, the Company purchased 41 million pounds of copper put options at strike price of US$3.75 per pound covering the second half of 2021. In May 2021, the Company acquired copper collars. These contracts secure a minimum copper price of US$4.00 and a ceiling copper price of US$5.60 per pound for 43 million pounds of copper over the first half of 2022.
From time to time, the Company will look at potential hedging opportunities to mitigate the risk of rising input costs, including foreign exchange and fuel prices where such a strategy is cost effective.
| Notional amount | Strike price | Term to maturity | Original cost | |
| At November 2, 2021 | ||||
| Copper put options | 11 million lbs | US$3.75 per lb | November 2021to December 2021 | $4.1 million |
| Copper collars | 43 million lbs | US$4.00 per lb US$5.60 per lb | January 2022 to June 2022 | $4.7 million |
TASEKO MINES LIMITED Management's Discussion and Analysis |
Commitments and contingencies
Commitments
| Payments due | |||||||||||||||||||||
| (Cdn$ in thousands) | Remainder of 2021 | 2022 | 2023 | 2024 | 2025 | Thereafter | Total | ||||||||||||||
| Debt: | |||||||||||||||||||||
| 2026 Notes 1 | - | - | - | - | - | 509,640 | 509,640 | ||||||||||||||
| Interest | - | 35,675 | 35,675 | 35,675 | 35,675 | 17,837 | 160,537 | ||||||||||||||
| Equipment loans: | |||||||||||||||||||||
| Principal | 1,924 | 6,550 | 4,689 | 1,375 | - | - | 14,538 | ||||||||||||||
| Interest | 192 | 511 | 198 | 18 | - | - | 919 | ||||||||||||||
| Lease liabilities: | |||||||||||||||||||||
| Principal | 2,557 | 9,512 | 2,559 | 1,284 | 1,288 | 896 | 18,096 | ||||||||||||||
| Interest | 224 | 584 | 277 | 180 | 100 | 24 | 1,389 | ||||||||||||||
| Lease related obligation: | |||||||||||||||||||||
| Rental payment | 657 | 2,627 | 2,627 | - | - | - | 5,911 | ||||||||||||||
| PER 2 | - | - | - | - | - | 77,343 | 77,343 | ||||||||||||||
| Capital expenditures | 12,903 | 17,583 | 1,529 | - | - | - | 32,015 | ||||||||||||||
| Other expenditures | |||||||||||||||||||||
| Transportation related services 3 | 595 | 860 | - | - | - | - | 1,455 | ||||||||||||||
1 In February 2021, the Company closed its offering of the 2026 Notes and a portion of the proceeds was used to redeem all of the 2022 Notes.
2 Provision for environmental rehabilitation amounts presented in the table represents the present value of estimated costs of legal and constructive obligations required to retire an asset, including decommissioning and other site restoration activities, primarily for the Gibraltar mine and Florence Copper. The Company has provided a surety bond of $37,500 for its 75% share of Gibraltar's reclamation security. For Florence Copper, the Company has provided to the federal and state regulator surety bonds totaling $12.5 million as reclamation security.
3 Transportation related services commitments include ocean freight and port handling services, which are both cancellable upon certain operating circumstances.
The Company has made capital expenditure commitments relating to equipment for the Florence Copper project totaling $31.3 million at September 30, 2021.
The Company has guaranteed 100% of certain equipment loans and leases entered into by Gibraltar in which it holds a 75% interest. As a result, the Company has guaranteed the joint venture partner's 25% share of this debt which amounted to $11.4 million as at September 30, 2021.
TASEKO MINES LIMITED Management's Discussion and Analysis |
SUMMARY OF QUARTERLY RESULTS
| 2021 | 2020 | 2019 | ||||||||||||||||||||||
| (Cdn$ in thousands, except per share amounts) | Q3 | Q2 | Q1 | Q4 | Q3 | Q2 | Q1 | Q4 | ||||||||||||||||
| Revenues | 132,563 | 111,002 | 86,741 | 87,398 | 87,780 | 106,005 | 62,084 | 89,932 | ||||||||||||||||
| Net income (loss) | 22,485 | 13,442 | (11,217 | ) | 5,694 | 987 | 18,745 | (48,950 | ) | (9,931 | ) | |||||||||||||
| Basic EPS | 0.08 | 0.05 | (0.04 | ) | 0.02 | - | 0.08 | (0.20 | ) | (0.04 | ) | |||||||||||||
| Adjusted net income (loss)* | 27,020 | 9,948 | (5,534 | ) | (7,473 | ) | (5,754 | ) | 8,335 | (21,647 | ) | (16,159 | ) | |||||||||||
| Adjusted basic EPS* | 0.10 | 0.04 | (0.02 | ) | (0.03 | ) | (0.02 | ) | 0.03 | (0.09 | ) | (0.07 | ) | |||||||||||
| Adjusted EBITDA* | 76,291 | 47,732 | 23,722 | 20,478 | 31,545 | 50,860 | 5,346 | 18,246 | ||||||||||||||||
| (US$ per pound, except where indicated) | ||||||||||||||||||||||||
| Realized copper price* | 4.26 | 4.48 | 4.09 | 3.69 | 3.15 | 2.70 | 2.06 | 2.82 | ||||||||||||||||
| Total operating costs* | 1.57 | 2.02 | 2.23 | 2.82 | 2.00 | 1.34 | 1.82 | 2.01 | ||||||||||||||||
| Copper sales (million pounds) | 24.3 | 20.0 | 16.5 | 18.8 | 21.4 | 29.5 | 23.3 | 25.0 | ||||||||||||||||
Financial results for the last eight quarters reflect: volatile copper and molybdenum prices and foreign exchange rates that impact realized sale prices; and variability in the quarterly sales volumes due to copper grades and timing of shipments which impacts revenue recognition.
CRITICAL ACCOUNTING POLICIES AND ESTIMATES
The Company's significant accounting policies are presented in Note 2.4 of the 2020 annual consolidated financial statements. The preparation of the financial statements in conformity with IFRS requires management to make judgments, estimates and assumptions that affect the application of accounting policies and the reported amounts of assets, liabilities, income and expenses. Actual results may differ from these estimates. Estimates and underlying assumptions are reviewed on an ongoing basis. Revisions to accounting estimates are recognized in the period in which the estimates are revised and in any future periods affected.
In the process of applying the Company's accounting policies, significant areas where judgment is required include the determination of a joint arrangement, determining the timing of transfer of control of inventory for revenue recognition, provisions for environmental rehabilitation, reserve and resource estimation, functional currency, determination of the accounting treatment of the advance payment under the silver purchase and sale agreement reported as deferred revenue, determination of business or asset acquisition treatment, and recovery of other deferred tax assets.
Significant areas of estimation include reserve and resource estimation; asset valuations and the measurement of impairment charges or reversals; valuation of inventories; plant and equipment lives; tax provisions; provisions for environmental rehabilitation; valuation of financial instruments and derivatives; capitalized stripping costs and share-based compensation. Key estimates and assumptions made by management with respect to these areas have been disclosed in the notes to these consolidated financial statements as appropriate.
The accuracy of reserve and resource estimates is a function of the quantity and quality of available data and the assumptions made and judgment used in the engineering and geological interpretation, and may be subject to revision based on various factors. Changes in reserve and resource estimates may impact the carrying value of property, plant and equipment; the calculation of depreciation expense; the capitalization of stripping costs incurred during production; and the timing of cash flows related to the provision for environmental rehabilitation.
TASEKO MINES LIMITED Management's Discussion and Analysis |
Changes in forecast prices of commodities, exchange rates, production costs and recovery rates may change the economic status of reserves and resources. Forecast prices of commodities, exchange rates, production costs and recovery rates, and discount rates assumptions, either individually or collectively, may impact the carrying value of derivative financial instruments, inventories, property, plant and equipment, and intangibles, as well as the measurement of impairment charges or reversals.
There were no changes in accounting policies during the three and nine months ended September 30, 2021.
INTERNAL AND DISCLOSURE CONTROLS OVER FINANCIAL REPORTING
The Company's management is responsible for establishing and maintaining adequate internal control over financial reporting and disclosure controls and procedures.
The Company's internal control system over financial reporting is designed to provide reasonable assurance to management and the Board of Directors regarding the preparation and fair presentation of published financial statements. Internal control over financial reporting includes those policies and procedures that:
(1) pertain to the maintenance of records that in reasonable detail accurately and fairly reflect the transactions and dispositions of the assets of the Company;
(2) provide reasonable assurance that transactions are recorded as necessary to permit preparation of financial statements in accordance with IFRS, and that receipts and expenditures of the Company are being made only in accordance with authorizations of management and directors of the Company; and
(3) provide reasonable assurance regarding prevention or timely detection of unauthorized acquisition, use or disposition of the Company's assets that could have a material effect on the financial statements.
The Company's internal control system over disclosure controls and procedures is designed to provide reasonable assurance that material information relating to the Company is made known to management and disclosed to others and information required to be disclosed by the Company in its annual filings, interim filings or other reports filed or submitted by us under securities legislation is recorded, processed, summarized and reported within the time periods specified in the securities legislation.
All internal control systems, no matter how well designed, have inherent limitations. Therefore, even those systems determined effective can provide only reasonable assurance with respect to financial reporting and disclosure.
There have been no changes in our internal controls over financial reporting and disclosure controls and procedures during the period ended September 30, 2021 that have materially affected, or are reasonably likely to materially affect, internal control over financial reporting and disclosure.
KEY MANAGEMENT PERSONNEL
Key management personnel include the members of the Board of Directors and executive officers of the Company.
The Company contributes to a post-employment defined contribution pension plan on the behalf of certain key management personnel. This retirement compensation arrangement ("RCA Trust") was established to provide benefits to certain executive officers on or after retirement in recognition of their long service. Upon retirement, the participant is entitled to the distribution of the accumulated value of the contributions under the RCA Trust. Obligations for contributions to the defined contribution pension plan are recognized as compensation expense in the periods during which services are rendered by the executive officers.
TASEKO MINES LIMITED Management's Discussion and Analysis |
Certain executive officers are entitled to termination and change in control benefits. In the event of termination without cause, other than a change in control, these executive officers are entitled to an amount ranging from
9-month to 12-months' salary. In the event of a change in control, if a termination without cause or a resignation occurs within 12 months following the change of control, these executive officers are entitled to receive, among other things, an amount ranging from 12-months' to 24-months' salary and accrued bonus, and all stock options held by these individuals will fully vest.
Executive officers and directors also participate in the Company's share option program (refer to Note 14 of the Financial Statements).
Compensation for key management personnel (including all members of the Board of Directors and executive officers) is as follows:
| Three months ended September 30, | Nine months ended September 30, | |||||||||||
| (Cdn$ in thousands) | 2021 | 2020 | 2021 | 2020 | ||||||||
| Salaries and benefits | 961 | 1,003 | 5,490 | 5,656 | ||||||||
| Post-employment benefits | 258 | 258 | 1,495 | 774 | ||||||||
| Share-based compensation expense | (5 | ) | 2,448 | 4,058 | 3,778 | |||||||
| 1,214 | 3,709 | 11,043 | 10,208 | |||||||||
TASEKO MINES LIMITED Management's Discussion and Analysis |
NON-GAAP PERFORMANCE MEASURES
This document includes certain non-GAAP performance measures that do not have a standardized meaning prescribed by IFRS. These measures may differ from those used by, and may not be comparable to such measures as reported by, other issuers. The Company believes that these measures are commonly used by certain investors, in conjunction with conventional IFRS measures, to enhance their understanding of the Company's performance. These measures have been derived from the Company's financial statements and applied on a consistent basis. The following tables below provide a reconciliation of these non-GAAP measures to the most directly comparable IFRS measure.
Total operating costs and site operating costs, net of by-product credits
Total costs of sales include all costs absorbed into inventory, as well as transportation costs and insurance recoverable. Site operating costs are calculated by removing net changes in inventory, depletion and amortization, insurance recoverable, and transportation costs from cost of sales. Site operating costs, net of by-product credits is calculated by subtracting by-product credits from the site operating costs. Site operating costs, net of by-product credits per pound are calculated by dividing the aggregate of the applicable costs by copper pounds produced. Total operating costs per pound is the sum of site operating costs, net of by-product credits and off-property costs divided by the copper pounds produced. By-product credits are calculated based on actual sales of molybdenum (net of treatment costs) and silver during the period divided by the total pounds of copper produced during the period. These measures are calculated on a consistent basis for the periods presented.
| (Cdn$ in thousands, unless otherwise indicated) - 75% basis | Three months ended September 30, | Nine months ended September 30, | ||||||||||
| 2021 | 2020 | 2021 | 2020 | |||||||||
| Cost of sales | 65,893 | 75,969 | 212,215 | 240,459 | ||||||||
| Less: | ||||||||||||
| Depletion and amortization | (17,011 | ) | (23,894 | ) | (50,385 | ) | (76,554 | ) | ||||
| Net change in inventories of finished goods | 762 | 1,415 | (1,702 | ) | (3,026 | ) | ||||||
| Net change in inventories of ore stockpiles | 6,291 | 4,186 | 324 | 4,729 | ||||||||
| Transportation costs | (5,801 | ) | (4,127 | ) | (13,409 | ) | (14,480 | ) | ||||
| Site operating costs | 50,134 | 53,549 | 147,043 | 151,128 | ||||||||
| Less by-product credits: | ||||||||||||
| Molybdenum, net of treatment costs | (8,574 | ) | (4,109 | ) | (20,315 | ) | (11,592 | ) | ||||
| Silver, excluding amortization of deferred revenue | 300 | (54 | ) | 127 | (436 | ) | ||||||
| Site operating costs, net of by-product credits | 41,860 | 49,386 | 126,855 | 139,100 | ||||||||
| Total copper produced (thousand pounds) | 25,891 | 21,658 | 62,657 | 73,552 | ||||||||
| Total costs per pound produced | 1.62 | 2.28 | 2.02 | 1.89 | ||||||||
| Average exchange rate for the period (CAD/USD) | 1.26 | 1.33 | 1.25 | 1.35 | ||||||||
| Site operating costs, net of by-product credits (US$ per pound) | 1.28 | 1.71 | 1.62 | 1.40 | ||||||||
| Site operating costs, net of by-product credits | 41,860 | 49,386 | 126,855 | 139,100 | ||||||||
| Add off-property costs: | ||||||||||||
| Treatment and refining costs | 3,643 | 4,254 | 7,936 | 18,070 | ||||||||
| Transportation costs | 5,801 | 4,127 | 13,409 | 14,480 | ||||||||
| Total operating costs | 51,304 | 57,767 | 148,200 | 171,650 | ||||||||
| Total operating costs (C1) (US$ per pound) | 1.57 | 2.00 | 1.90 | 1.72 | ||||||||
TASEKO MINES LIMITED Management's Discussion and Analysis |
Adjusted net income (loss)
Adjusted net income (loss) removes the effect of the following transactions from net income as reported under IFRS:
- Unrealized foreign currency gains/losses;
- Unrealized gain/loss on derivatives; and
- Loss on settlement of long-term debt and call premium, including realized foreign exchange gains.
Management believes these transactions do not reflect the underlying operating performance of our core mining business and are not necessarily indicative of future operating results. Furthermore, unrealized gains/losses on derivative instruments, changes in the fair value of financial instruments, and unrealized foreign currency gains/losses are not necessarily reflective of the underlying operating results for the reporting periods presented.
| Three months ended September 30, | Nine months ended September 30, | |||||||||||
| (Cdn$ in thousands, except per share amounts) | 2021 | 2020 | 2021 | 2020 | ||||||||
| Net income (loss) | 22,485 | 987 | 24,710 | (29,218 | ) | |||||||
| Unrealized foreign exchange (gain) loss | 9,511 | (7,512 | ) | 14,545 | 9,250 | |||||||
| Realized foreign exchange gain on settlement of long-term debt | - | - | (13,000 | ) | - | |||||||
| Loss on settlement of long-term debt | - | - | 5,798 | - | ||||||||
| Call premium on settlement of long-term debt | - | - | 6,941 | - | ||||||||
| Unrealized (gain) loss on derivatives | (6,817 | ) | 1,056 | (5,645 | ) | 1,236 | ||||||
| Estimated tax effect of adjustments | 1,841 | (285 | ) | (1,916 | ) | (334 | ) | |||||
| Adjusted net income (loss) | 27,020 | (5,754 | ) | 31,433 | (19,066 | ) | ||||||
| Adjusted EPS | 0.10 | (0.02 | ) | 0.11 | (0.08 | ) | ||||||
Adjusted EBITDA
Adjusted EBITDA is presented as a supplemental measure of the Company's performance and ability to service debt. Adjusted EBITDA is frequently used by securities analysts, investors and other interested parties in the evaluation of companies in the industry, many of which present Adjusted EBITDA when reporting their results. Issuers of "high yield" securities also present Adjusted EBITDA because investors, analysts and rating agencies consider it useful in measuring the ability of those issuers to meet debt service obligations.
Adjusted EBITDA represents net income before interest, income taxes, and depreciation and also eliminates the impact of a number of items that are not considered indicative of ongoing operating performance. Certain items of expense are added and certain items of income are deducted from net income that are not likely to recur or are not indicative of the Company's underlying operating results for the reporting periods presented or for future operating performance and consist of:
- Unrealized foreign exchange gains/losses;
- Unrealized gain/loss on derivatives;
- Loss on settlement of long term debt (included in finance expenses) and call premium;
- Realized foreign exchange gain on settlement of long-term debt; and
- Amortization of share-based compensation expense.
TASEKO MINES LIMITED Management's Discussion and Analysis |
| Three months ended September 30, | Nine months ended September 30, | |||||||||||
| (Cdn$ in thousands) | 2021 | 2020 | 2021 | 2020 | ||||||||
| Net income (loss) | 22,485 | 987 | 24,710 | (29,218 | ) | |||||||
| Add: | ||||||||||||
| Depletion and amortization | 17,011 | 23,894 | 50,385 | 76,554 | ||||||||
| Finance expense (includes loss on settlement of long-term debt and call premium) | 11,875 | 11,203 | 47,482 | 32,435 | ||||||||
| Finance income | (201 | ) | (4 | ) | (460 | ) | (202 | ) | ||||
| Income tax (recovery) expense | 22,310 | (580 | ) | 25,041 | (6,372 | ) | ||||||
| Unrealized foreign exchange (gain) loss | 9,511 | (7,512 | ) | 14,545 | 9,250 | |||||||
| Realized foreign exchange gain on settlement of long-term debt | - | - | (13,000 | ) | - | |||||||
| Unrealized (gain) loss on derivatives | (6,817 | ) | 1,056 | (5,645 | ) | 1,236 | ||||||
| Amortization of share-based compensation expense | 117 | 2,501 | 4,687 | 4,068 | ||||||||
| Adjusted EBITDA | 76,291 | 31,545 | 147,745 | 87,751 | ||||||||
Earnings from mining operations before depletion and amortization
Earnings from mining operations before depletion and amortization is earnings from mining operations with depletion and amortization added back. The Company discloses this measure, which has been derived from our financial statements and applied on a consistent basis, to provide assistance in understanding the results of the Company's operations and financial position and it is meant to provide further information about the financial results to investors.
TASEKO MINES LIMITED Management's Discussion and Analysis |
| Three months ended September 30, | Nine months ended September 30, | |||||||||||
| (Cdn$ in thousands) | 2021 | 2020 | 2021 | 2020 | ||||||||
| Earnings from mining operations | 66,670 | 11,811 | 118,091 | 15,410 | ||||||||
| Add: | ||||||||||||
| Depletion and amortization | 17,011 | 23,894 | 50,385 | 76,554 | ||||||||
| Earnings from mining operations before depletion and amortization | 83,681 | 35,705 | 168,476 | 91,964 | ||||||||
Site operating costs per ton milled
| Three months ended September 30, | Nine months ended September 30, | |||||||||||
| (Cdn$ in thousands, except per ton milled amounts) | 2021 | 2020 | 2021 | 2020 | ||||||||
| Site operating costs (included in cost of sales) | 50,134 | 53,549 | 147,043 | 151,128 | ||||||||
| Tons milled (thousands) (75% basis) | 5,576 | 5,595 | 16,406 | 16,965 | ||||||||
| Site operating costs per ton milled | $ | 8.99 | $ | 9.57 | $ | 8.96 | $ | 8.91 | ||||