This management discussion and analysis ("MD&A") is intended to help the reader understand Taseko Mines Limited ("Taseko", "we", "our" or the "Company"), our operations, financial performance, and current and future business environment. This MD&A is intended to supplement and complement the consolidated financial statements and notes thereto, prepared in accordance with International Financial Reporting Standards ("IFRS") issued by the International Accounting Standards Board for the year ended December 31, 2021 (the "Financial Statements"). You are encouraged to review the Financial Statements in conjunction with your review of this MD&A and the Company's other public filings, which are available on the Canadian Securities Administrators' website at www.sedar.com and on the EDGAR section of the United States Securities and Exchange Commission's ("SEC") website at www.sec.gov.
This MD&A is prepared as of February 22, 2022. All dollar figures stated herein are expressed in Canadian dollars, unless otherwise specified. Included throughout this MD&A are references to non-GAAP performance measures which are denoted with an asterisk and further explanation including their calculations are provided on page 30.
Cautionary Statement on Forward-Looking Information
This discussion includes certain statements that may be deemed "forward-looking statements". All statements in this discussion, other than statements of historical facts, that address future production, reserve potential, exploration drilling, exploitation activities, and events or developments that the Company expects are forward-looking statements. Although we believe the expectations expressed in such forward-looking statements are based on reasonable assumptions, such statements are not guarantees of future performance and actual results or developments may differ materially from those in the forward-looking statements. Factors that could cause actual results to differ materially from those in forward-looking statements include market prices, global economic events arising from the coronavirus (COVID-19) pandemic outbreak, exploitation and exploration successes, continued availability of capital and financing and general economic, market or business conditions. Investors are cautioned that any such statements are not guarantees of future performance and actual results or developments may differ materially from those projected in the forward-looking statements. All of the forward-looking statements made in this MD&A are qualified by these cautionary statements. We disclaim any intention or obligation to update or revise any forward-looking statements whether as a result of new information, future events or otherwise, except to the extent required by applicable law. Further information concerning risks and uncertainties associated with these forward-looking statements and our business may be found in the Company's other public filings with the SEC and Canadian provincial securities regulatory authorities.
CONTENTS
OVERVIEW
Taseko is a copper focused mining company that seeks to create long-term shareholder value by acquiring, developing, and operating large tonnage mineral deposits in stable jurisdictions which are capable of supporting a mine for decades. The Company's principal operating asset is the 75% owned Gibraltar mine, which is located in central British Columbia and is one of the largest copper mines in North America. Taseko also owns Florence Copper, which is advancing towards construction with commercial production expected in 2023, as well as the Yellowhead copper, New Prosperity gold-copper, and Aley niobium projects.
HIGHLIGHTS
| Operating Data (Gibraltar - 100% basis) | | Three months ended
December 31, | | | Year ended
December 31, | |
| | | 2021 | | | 2020 | | | Change | | | 2021 | | | 2020 | | | Change | |
| Tons mined (millions) | | 23.3 | | | 26.4 | | | (3.1 | ) | | 105.4 | | | 98.7 | | | 6.7 | |
| Tons milled (millions) | | 7.4 | | | 7.5 | | | (0.1 | ) | | 29.2 | | | 30.1 | | | (0.9 | ) |
| Production (million pounds Cu) | | 28.8 | | | 25.0 | | | 3.8 | | | 112.3 | | | 123.0 | | | (10.7 | ) |
| Sales (million pounds Cu) | | 23.8 | | | 25.0 | | | (1.2 | ) | | 104.9 | | | 124.0 | | | (19.1 | ) |
| | | | | | | | | | | | | | | | | | | |
| Financial Data | | Three months ended
December 31, | | | Year ended
December 31, | |
| (Cdn$ in thousands, except for per share amounts) | | 2021 | | | 2020 | | | Change | | | 2021 | | | 2020 | | | Change | |
| Revenues | | 102,972 | | | 87,398 | | | 15,574 | | | 433,278 | | | 343,267 | | | 90,011 | |
| Earnings from mining operations before depletion and amortization* | | 61,916 | | | 27,062 | | | 34,854 | | | 230,392 | | | 119,026 | | | 111,366 | |
| Cash flows provided by operations | | 37,231 | | | 20,424 | | | 16,807 | | | 174,769 | | | 106,195 | | | 68,574 | |
| Adjusted EBITDA* | | 52,988 | | | 20,478 | | | 32,510 | | | 200,733 | | | 108,229 | | | 92,504 | |
| Adjusted net income (loss)* | | 13,312 | | | (7,473 | ) | | 20,785 | | | 44,745 | | | (26,539 | ) | | 71,284 | |
| Per share - basic ("Adjusted EPS")* | | 0.05 | | | (0.03 | ) | | 0.08 | | | 0.16 | | | (0.11 | ) | | 0.27 | |
| Net income (loss) (GAAP) | | 11,762 | | | 5,694 | | | 6,068 | | | 36,472 | | | (23,524 | ) | | 59,996 | |
| Per share - basic ("EPS") | | 0.04 | | | 0.02 | | | 0.02 | | | 0.13 | | | (0.09 | ) | | 0.22 | |
2021 Annual Review
Earnings from mining operations before depletion and amortization* was $230.4 million, Adjusted EBITDA* was $200.7 million, and cash flows from operations was $174.8 million;
Adjusted net income* was $44.7 million ($0.16 per share) and GAAP Net income was $36.5 million ($0.13 per share) for the year;
Total operating costs (C1)* for the year were US$1.90 per pound produced;
The Gibraltar mine produced 112.3 million pounds of copper and 2.0 million pounds of molybdenum in 2021. Copper recoveries were 82.4% and copper head grades were 0.23%;
Gibraltar sold 104.9 million pounds of copper for the year (100% basis) which contributed to record revenue for Taseko of $433.3 million and an increase of 26% over 2020. Average realized copper prices were US$4.31 per pound for year, compared to the LME average price of US$4.23 per pound;
The Company has approximately $300 million of available liquidity at December 31, 2021, including a cash balance of $237 million and a new US$50 million revolving credit facility with National Bank of Canada which closed in early October;
Development costs incurred for Florence Copper were $57.9 million in the year and included, detailed engineering and design of the commercial facility, initial deposits for major processing equipment for the SX/EW plant and ongoing site operating costs. These activities will allow the Florence project team to efficiently advance into construction upon receipt of the Underground Injection Control ("UIC") permit; and
In December 2021, the Company completed its review of the draft UIC permit and no significant issues were identified. The EPA continues to advance their review process and the public comment period on the draft UIC permit is expected to commence shortly after the draft UIC permit is publicly issued.
Fourth Quarter Review
Fourth quarter earnings from mining operations before depletion and amortization* was $61.9 million, Adjusted EBITDA* was $53.0 million, Adjusted net income* was $13.3 million ($0.05 per share) and GAAP Net income was $11.8 million ($0.04 per share);
Total operating costs (C1)* for the quarter were US$1.94 per pound produced;
The Gibraltar mine produced 28.8 million pounds of copper and 450 thousand pounds of molybdenum in the fourth quarter. Copper recoveries were 80.4% and copper head grades were 0.24%;
Gibraltar sold 23.8 million pounds of copper in the quarter (100% basis). Due to extreme flooding in southwest British Columbia in November which washed out highways and rail infrastructure, transportation options were impacted which resulted in a build-up of copper concentrate inventory to 9.9 million pounds at year end. Concentrate inventory should return to more normal levels by the end of the first quarter of 2022;
Average realized copper prices were US$4.37 per pound in the quarter, which contributed $103.0 million of revenue for Taseko;
Cashflow from operations was $37.2 million which was impacted by $20.5 million in non-cash working capital attributed to the higher year-end inventory. Capital expenditures of $35.2 million included Florence spend of $14.8 million in the quarter;
The Company has recently extended its copper price protection and now has more than 90% of its attributable production secured for 2022 year at a minimum copper price of US$4.00 per pound. Fourth quarter Adjusted net income and Adjusted EBITDA were impacted by a $6.4 million realized derivative loss ($0.02 per share) related to copper put options that expired in the quarter; and
- In November 2021, Gibraltar's unionized workforce ratified a new, long-term collective bargaining agreement which will be in place until May 31, 2024.
REVIEW OF OPERATIONS
Gibraltar mine (75% Owned)
| Operating data (100% basis) | | Q4
2021 | | | Q3
2021 | | | Q2
2021 | | | Q1
2021 | | | Q4
2020 | | | YE
2021 | | | YE
2020 | |
| Tons mined (millions) | | 23.3 | | | 25.2 | | | 24.9 | | | 32.0 | | | 26.4 | | | 105.4 | | | 98.7 | |
| Tons milled (millions) | | 7.4 | | | 7.4 | | | 7.2 | | | 7.2 | | | 7.5 | | | 29.2 | | | 30.1 | |
| Strip ratio | | 2.2 | | | 1.3 | | | 2.3 | | | 6.0 | | | 1.9 | | | 2.5 | | | 2.0 | |
| Site operating cost per ton milled (Cdn$)* | $ | 9.94 | | $ | 8.99 | | $ | 9.16 | | $ | 8.73 | | $ | 11.67 | | $ | 9.21 | | $ | 9.59 | |
| Copper concentrate | | | | | | | | | | | | | | | | | | | | | |
| Head grade (%) | | 0.24 | | | 0.28 | | | 0.22 | | | 0.19 | | | 0.20 | | | 0.23 | | | 0.24 | |
| Copper recovery (%) | | 80.4 | | | 84.2 | | | 83.3 | | | 81.5 | | | 83.3 | | | 82.4 | | | 84.3 | |
| Production (million pounds Cu) | | 28.8 | | | 34.5 | | | 26.8 | | | 22.2 | | | 25.0 | | | 112.3 | | | 123.0 | |
| Sales (million pounds Cu) | | 23.8 | | | 32.4 | | | 26.7 | | | 22.0 | | | 25.0 | | | 104.9 | | | 124.0 | |
| Inventory (million pounds Cu) | | 9.9 | | | 4.9 | | | 3.5 | | | 3.6 | | | 3.4 | | | 9.9 | | | 3.4 | |
| Molybdenum concentrate | | | | | | | | | | | | | | | | | | | | | |
| Production (thousand pounds Mo) | | 450 | | | 571 | | | 402 | | | 530 | | | 549 | | | 1,954 | | | 2,269 | |
| Sales (thousand pounds Mo) | | 491 | | | 502 | | | 455 | | | 552 | | | 487 | | | 2,000 | | | 2,239 | |
| Per unit data (US$ per pound produced)* | | | | | | | | | | | | | | | | | | | | | |
| Site operating costs* | $ | 2.02 | | $ | 1.53 | | $ | 2.02 | | $ | 2.23 | | $ | 2.67 | | $ | 1.91 | | $ | 1.75 | |
| By-product credits* | | (0.30 | ) | | (0.25 | ) | | (0.25 | ) | | (0.27 | ) | | (0.14 | ) | | (0.27 | ) | | (0.13 | ) |
| Site operating costs, net of by-product credits* | $ | 1.72 | | $ | 1.28 | | $ | 1.77 | | $ | 1.96 | | $ | 2.53 | | $ | 1.64 | | $ | 1.62 | |
| Off-property costs | | 0.22 | | | 0.29 | | | 0.25 | | | 0.27 | | | 0.29 | | | 0.26 | | | 0.30 | |
| Total operating costs (C1)* | $ | 1.94 | | $ | 1.57 | | $ | 2.02 | | $ | 2.23 | | $ | 2.82 | | $ | 1.90 | | $ | 1.92 | |
OPERATIONS ANALYSIS
Full Year Results
Gibraltar produced 112.3 million pounds of copper in 2021 compared to 123.0 million in 2020. Copper grade for the year averaged 0.23% copper, compared to 0.24% in 2020. Copper recoveries for 2021 was 82.4%, compared to 84.3% in 2020.
A total of 105.4 million tons were mined in the year in line with the mine plan and a 7% increase over the prior year period. The strip ratio increased primarily as a result of the waste mining transitioning into the Pollyanna pit in the first quarter of 2021 and lower mining rates in 2020 in response to the onset of COVID-19. Pollyanna ore was the primary mill feed in 2021, and waste stripping activities began in the Gibraltar pit in 2021 with first ore being mined in the fourth quarter.
Total site spending (including capitalized stripping of $59.9 million on a 75% basis) was 9% higher than the prior year due to higher mining rates in 2021. Sustaining capital expenditures at Gibraltar (75% basis) were $27.9 million for the year, compared to $20.3 million for the prior year due to greater scheduled component replacements in 2021 for the mining fleet.
Molybdenum production was 2.0 million pounds in the year compared to 2.3 million pounds in the prior year. Molybdenum prices also strengthened in 2021 with an average molybdenum price of US$15.94 per pound, an increase of 84% compared to the 2020 average price of US$8.68 per pound. By-product credits per pound of copper produced was US$0.27 in the year compared to US$0.13 in the prior year.
Off-property costs per pound produced* were US$0.26 for the year, which is US$0.04 lower than the prior year, as the Company benefited by a 4% reduction in the benchmark treatment and refining charges ("TCRC") in 2021 and realized lower TCRCs for spot tenders that were delivered at some of the lowest levels ever seen by the Gibraltar mine due to tight copper market conditions.
Total operating costs per pound produced (C1)* were US$1.90 for the year, a slight decrease compared to the prior year. The decrease in the C1* costs was primarily due to the higher by-product credits and lower off-property costs, partially offset by the increase in site costs and the impact of decreased copper production.
Fourth Quarter Results
Copper production in the fourth quarter was 28.8 million pounds and was impacted by lower grades and recoveries from ore mined in the upper benches of the Gibraltar pit. Increased oxidization and pyrite content in this ore has resulted in lower recoveries which management believes is a short-term issue that will be resolved. Ore quality is expected to improve as mining progresses deeper into the Gibraltar pit. In December, heavy snowfall and temperatures as low as minus 35 degrees Celsius also impacted mine equipment and mill availabilities, resulting in decreased mill throughput and a need to draw ore from lower grade stockpiles.
The Company realized 23.8 million pounds of copper sales in the fourth quarter which was lower than copper production of 28.8 million pounds. Major disruption to the highway and rail infrastructure in southwest British Columbia from severe rainstorms and flooding in November prevented significant production from being delivered to the port for shipping. Copper concentrate inventories ended the year at 9.9 million pounds.
A total of 23.3 million tons were mined in the fourth quarter. The strip ratio increased over the prior quarter due to mining activities transitioning into the higher strip ratio Gibraltar pit. The mill feed in the fourth quarter came primarily from Pollyanna but also included ore from the Gibraltar pit.
Total site spending (including capitalized stripping of $12.7 million on a 75% basis) was 7% higher than the prior quarter and included retroactive payments from the newly ratified collective bargaining agreement. Sustaining capital expenditures at Gibraltar of $6.5 million on a 75% basis included component replacements for the mining fleet, including scheduled work on the shovels.
Molybdenum production was 450 thousand pounds in the fourth quarter and at an average molybdenum price of US$18.89 per pound, generated a notable by-product credit per pound of copper produced of US$0.30 in the fourth quarter.
Off-property costs per pound produced* were US$0.22 for the fourth quarter which benefitted from lower copper pounds sold. The Company also realized lower TCRC in the fourth quarter as two spot tenders were delivered at much lower TCRC rates than the annual benchmark rate, which reflects the tight physical market for copper concentrate from overseas smelters.
Total operating costs per pound produced (C1)* were US$1.94 for the quarter and increased due to the decreased copper production and higher site costs in the fourth quarter compared to the third quarter.
ENVIRONMENTAL, SOCIAL AND GOVERNANCE
Nothing is more important to Taseko than the safety, health and well-being of our workers and their families. Taseko places a high priority on the continuous improvement of performance in the areas of employee health and safety at the workplace and protection of the environment.
In April 2021, Taseko published its second Environmental, Social, and Governance ("ESG") report, which includes an examination of the Company's sustainability performance for 2020. The report is available on the Company's website at www.tasekomines.com/esg.
In this report, Taseko has reported Scope 1 and 2 greenhouse gas emissions for the Gibraltar mine which show that the mine ranks in the first quartile of all copper mines globally. When commercial operations at Florence Copper commences, the Company's combined greenhouse gas emissions intensity will drop even lower, to an estimated 1.53 tonnes of CO2 per tonne of copper equivalent, based on an independent analysis by Skarn Associates.
Gibraltar's 2021 ESG report will be published in the second quarter of 2022.
GIBRALTAR OUTLOOK
Gibraltar is expected to produce 115 million pounds (+/- 5%) of copper in 2022 on a 100% basis, with production weighted to the back half of the year and the first quarter being the lowest production quarter, similar to 2021. The expected sales of excess copper concentrate inventory carried over from 2021 will bolster earnings in the first quarter of 2022.
Strong metal prices and US dollar combined with our copper hedge protection continues to provide tailwinds for a strong financial performance and operating margins at the Gibraltar mine over the coming year. Copper prices in 2021 averaged US$4.23 per pound and are currently around US$4.50 and molybdenum prices are currently US$18.78 per pound, 18% higher than the average price in 2021.
The copper price outlook for 2022 remains quite favorable with limited exchange inventories and ongoing supply constraints failing to keep up to demand. Many governments are focusing on increased infrastructure investment to stimulate economic recovery after the pandemic, including green initiatives, which will require new primary supplies of copper. Although some analysts predict a balanced copper market by 2023 based on known projects currently under development, most industry analysts are projecting ongoing supply constraints and deficits, which should support higher copper prices in the years to come.
The Company has a long track record of purchasing copper price options to manage copper price volatility. This strategy provides security over the Company's cash flow as it prepares for construction of Florence Copper while providing significant upside should copper prices continue at these levels or increase further. In particular, the Company has secured more than 90% of attributable production with copper collars which protect a minimum copper price of US$4.00 per pound for 2022.
FLORENCE COPPER
The commercial production facility at Florence Copper will be one of the greenest sources of copper for US domestic consumption, with carbon emissions, water and energy consumption all dramatically lower than a conventional mine. It is a low-cost copper project with an annual production capacity of 85 million pounds of copper over a 21-year mine life. With the expected C1* operating cost of US$1.10 per pound, Florence Copper will be in the lowest quartile of the global copper cost curve and will have one of the smallest environmental footprints of any copper mine in the world.
The Company has successfully operated a Production Test Facility ("PTF") since 2018 at Florence to demonstrate that the in-situ copper recovery ("ISCR") process can produce high quality cathode while operating within permit conditions.
The next phase of Florence Copper will be the construction and operation of the commercial ISCR facility with an estimated capital cost of US$230 million (including reclamation bonding and working capital) based on the Company's published 2017 NI 43-101 technical report. At a conservative copper price of US$3.00 per pound, Florence Copper is expected to generate an after-tax internal rate of return of 37%, an after-tax net present value of US$680 million at a 7.5% discount rate, and an after-tax payback period of 2.5 years.
In December 2020, the Company received the Aquifer Protection Permit ("APP") from the Arizona Department of Environmental Quality ("ADEQ"). During the APP process, Florence Copper received strong support from local community members, business owners and elected officials. The other required permit is the UIC permit from the U.S. Environmental Protection Agency ("EPA"), which is the final permitting step required prior to construction of the commercial ISCR facility. On November 22, 2021, the EPA provided the Company with an initial draft of the UIC permit. Taseko's project technical team completed its review of the draft UIC permit in early December 2021 and no significant issues were identified. Based on ongoing dialogue with the EPA, the Company continues to expect the draft UIC permit to be publicly issued very soon, and then a 45-day public comment period will commence.
Detailed engineering and design for the commercial production facility is complete and procurement activities are well advanced with the Company making initial deposits and awarding the key contract for the major processing equipment associated with the SX/EW plant in 2021. The Company incurred $58 million of costs for Florence in 2021 including for the commercial facility activities and also had outstanding purchase commitments of $38 million as at December 31, 2021 to be incurred in 2022. Deploying this strategic capital and awarding key contracts will assist with protecting the project execution plan, mitigating inflation risk and the potential impact of supply chain disruptions and ensure a smooth transition into construction once the final UIC permit is received.
At current copper prices, the Company expects to be able to fund construction of the commercial facility from its existing sources of liquidity and cashflows from Gibraltar.
LONG-TERM GROWTH STRATEGY
Taseko's strategy has been to grow the Company by acquiring and developing a pipeline of complementary projects focused on copper in stable mining jurisdictions. We continue to believe this will generate long-term returns for shareholders. Our other development projects are located in British Columbia.
Yellowhead Copper Project
Yellowhead Mining Inc. ("Yellowhead") has an 817 million tonnes reserve and a 25-year mine life with a pre-tax net present value of $1.3 billion at an 8% discount rate using a US$3.10 per pound copper price based on the Company's 2020 NI 43-101 technical report. Capital costs of the project are estimated at $1.3 billion over a 2-year construction period. Over the first 5 years of operation, the copper equivalent grade will average 0.35% producing an average of 200 million pounds of copper per year at an average C1* cost, net of by-product credit, of US$1.67 per pound of copper. The Yellowhead copper project contains valuable precious metal by-products with 440,000 ounces of gold and 19 million ounces of silver with a life of mine value of over $1 billion at current prices.
The Company is focusing its current efforts on advancing into the environmental assessment process and is undertaking some additional engineering work in conjunction with ongoing engagement with local communities including First Nations. The Company is also collecting baseline data and modeling which will be used to support the environmental assessment and permitting of the project.
New Prosperity Gold-Copper Project
In late 2019, the Tŝilhqot'in Nation, as represented by Tŝilhqot'in National Government, and Taseko entered into a confidential dialogue, with the involvement of the Province of British Columbia, to try to obtain a long-term resolution to the conflict regarding Taseko's proposed gold-copper mine currently known as New Prosperity, acknowledging Taseko's commercial interests and the Tŝilhqot'in Nation's opposition to the project.
The dialogue was supported by the parties' agreement on December 7, 2019 to a one-year standstill on certain outstanding litigation and regulatory matters that relate to Taseko's tenures and the area in the vicinity of Teẑtan Biny (Fish Lake). The standstill was extended on December 4, 2020, to continue what was a constructive dialogue that had been delayed by the COVID-19 pandemic. The dialogue is not complete but it remains constructive, and the parties have therefore agreed to extend the standstill for a further year so that they and the Province of British Columbia can continue to pursue a long-term and mutually acceptable resolution of the conflict.
Aley Niobium Project
Environmental monitoring and product marketing initiatives on the Aley niobium project continue. The converter pilot test is ongoing and is providing additional process data to support the design of the commercial process facilities and will provide final product samples for marketing purposes.
MARKET REVIEW
| Copper | Molybdenum | Canadian/US Dollar Exchange |
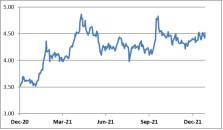 | 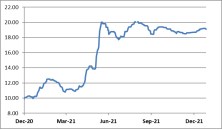 | 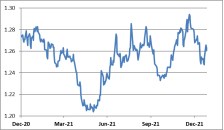 |
Prices (USD per pound for Commodities)
(Source Data: Bank of Canada, Platts Metals, and London Metals Exchange)
Copper prices are currently around US$4.50 per pound with continued upside amongst a bullish market backdrop and sentiment. Record levels of more than US$4.70 per pound were tested in both May and September of 2021 due to tight physical metal availability in the market. Copper prices have steadily recovered since the onset of COVID-19 and supply chain bottlenecks and tight supply conditions provide near term catalysts for elevated prices to continue. Material changes to taxes and royalty rates in key copper producing countries and threats of strikes and civil unrest also remain a risk to supply in the near term. Focus for 2022 turns to the expected demand growth and inflation arising from the economic recovery in North America and Europe resulting from unprecedented stimulus measures being implemented by central governments, although some geopolitical headwinds continue to create volatility in the timing and duration of this recovery. While some analysts predict a potential copper market balance by 2023 based on development projects under construction, the longer-term outlook for copper remains extremely favorable with the focus on government investment in construction and infrastructure including initiatives focused on green sources of power and the electrification of transportation which are inherently copper intensive. This increased demand for copper after years of under investment by the industry in new mine supply is expected to support strong copper prices well into the later part of this decade.
The average molybdenum price was US$15.94 per pound during 2021, compared to US$8.68 per pound in 2020. During 2021, molybdenum prices reached decade high levels at over US$20.00 per pound and are currently around US$18.78 per pound with a strong outlook for 2022, driven by steel demand from the global recovery and a rebound in the oil and gas sector. The Company's sales agreements specify molybdenum pricing based on the published Platts Metals reports.
Approximately 80% of the Gibraltar mine's costs are Canadian dollar denominated and therefore, fluctuations in the Canadian/US dollar exchange rate can have a significant effect on the Company's operating results and unit production costs, which are earned and in some cases reported in US dollars. Overall, the average Canadian dollar strengthened against the US dollar during 2021 compared to the average rate in the prior year.
FINANCIAL PERFORMANCE
Earnings
| | | Year ended
December 31, | |
| (Cdn$ in thousands) | | 2021 | | | 2020 | | | Change | |
| Net income (loss) | | 36,472 | | | (23,524 | ) | | 59,996 | |
| Net unrealized foreign exchange (gain) loss | | 12,728 | | | (4,345 | ) | | 17,073 | |
| Realized foreign exchange gain on settlement of long-term debt | | (13,000 | ) | | - | | | (13,000 | ) |
| Loss on settlement of long-term debt | | 5,798 | | | - | | | 5,798 | |
| Call premium on settlement of long-term debt | | 6,941 | | | - | | | 6,941 | |
| Unrealized (gain) loss on derivative instruments | | (1,033 | ) | | 1,822 | | | (2,855 | ) |
| Estimated tax effect of adjustments | | (3,161 | ) | | (492 | ) | | (2,669 | ) |
| Adjusted net income (loss) * | | 44,745 | | | (26,539 | ) | | 71,284 | |
The Company's adjusted net income was $44.7 million ($0.16 per share) for the year ended December 31, 2021, compared to an adjusted net loss of $26.5 million ($0.11 loss per share) for the prior year. The increased adjusted net income in the current year was primarily due to the impact of higher copper prices and lower capitalized stripping costs. During 2021, earnings from mining operations was positively impacted by a higher average LME copper price of US$4.23 per pound, an increase of 51% over the average price in 2020, partially offset by the lower copper sales volumes. An increase in waste stripping costs being capitalized due to transitions in Pollyanna and mining in the Gibraltar Pit and lower depletion and amortization expense also positively impacted earnings. After inclusion of the foreign exchange gains and losses and unrealized gains on derivative instruments, the Company's net income was $36.5 million ($0.13 per share) for the year ended December 31, 2021, compared to net loss of $23.5 million ($0.09 loss per share) for the prior year.
Net income (GAAP) for the year ended December 31, 2021 was impacted by the $5.8 million settlement loss and $6.9 million call premium paid upon repayment of the 2022 senior secured notes ("2022 Notes") from the February 2022 Note refinancing. Earnings was also impacted by a realized loss on copper puts purchased for $14.5 million in premium paid covering 2021 production, which are not adjusted for.
No adjustments are made to adjusted net income (loss) for positive or negative provisional price adjustments as these adjustments normalize or reverse throughout the year.
Revenues
| | | Year ended
December 31, | |
| (Cdn$ in thousands) | | 2021 | | | 2020 | | | Change | |
| Copper contained in concentrate | | 401,514 | | | 331,584 | | | 69,930 | |
| Copper price adjustments on settlement | | 8,098 | | | 9,394 | | | (1,296 | ) |
| Molybdenum concentrate | | 28,862 | | | 18,842 | | | 10,020 | |
| Molybdenum price adjustments on settlement | | 2,580 | | | 460 | | | 2,120 | |
| Silver | | 5,010 | | | 5,218 | | | (208 | ) |
| Total gross revenue | | 446,064 | | | 365,498 | | | 80,566 | |
| Less: Treatment and refining costs | | (12,786 | ) | | (22,231 | ) | | 9,445 | |
| Revenue | | 433,278 | | | 343,267 | | | 90,011 | |
| | | | | | | | | | |
| (thousands of pounds, unless otherwise noted) | | | | | | | | | |
| Sales of copper in concentrate1 | | 75,830 | | | 89,697 | | | (13,867 | ) |
| Average realized copper price (US$ per pound) | | 4.31 | | | 2.84 | | | 1.47 | |
| Average LME copper price (US$ per pound) | | 4.23 | | | 2.80 | | | 1.43 | |
| Average exchange rate (US$/CAD) | | 1.25 | | | 1.34 | | | (0.09 | ) |
1 This amount includes a net smelter payable deduction of approximately 3.5% to derive net payable pounds of copper sold.
Copper revenues for the year ended December 31, 2021 increased by $69.9 million compared to the prior year, primarily due to higher copper prices in 2021, partially offset by decreases in the volume of payable copper sold by 13.9 million pounds (75% basis) and a stronger Canadian dollar. The Company also recognized positive net price adjustments of $8.1 million, for provisionally priced copper concentrate due to increasing copper price trends following shipment.
Molybdenum revenues for the year ended December 31, 2021 increased by $10.0 million compared to the prior year, primarily due to higher average molybdenum prices of US$15.94 per pound, compared to US$8.68 per pound for the prior year period, partially offset by lower molybdenum sales volumes by 179 thousand pounds (75% basis).
Treatment and refining costs for the year ended December 31, 2021 decreased by $9.4 million compared to the prior year, due to lower copper TCRC benchmarks in 2021, more competitive terms and deep discounts on spot tenders and long-term contracts, and a decrease in the copper sales volume.
Cost of sales
| | | Year ended
December 31, | |
| (Cdn$ in thousands) | | 2021 | | | 2020 | | | Change | |
| Site operating costs | | 201,964 | | | 216,415 | | | (14,451 | ) |
| Transportation costs | | 17,845 | | | 18,248 | | | (403 | ) |
| Changes in inventories of finished goods | | (11,795 | ) | | 939 | | | (12,734 | ) |
| Changes in inventories of ore stockpiles | | (5,128 | ) | | (11,361 | ) | | 6,233 | |
| Production costs | | 202,886 | | | 224,241 | | | (21,355 | ) |
| Depletion and amortization | | 66,587 | | | 95,301 | | | (28,714 | ) |
| Cost of sales | | 269,473 | | | 319,542 | | | (50,069 | ) |
| Site operating costs per ton milled* | $ | 9.21 | | $ | 9.59 | | $ | (0.38 | ) |
Site operating costs for the year ended December 31, 2021 decreased by $14.5 million compared to the prior year primarily due to greater mining costs being capitalized in 2021 ($59.9 million) compared to 2020 ($26.3 million) partially offset by higher operating costs associated with more tons being mined in 2021. Fuel prices and other input cost savings reduced operating costs in 2020 during the onset of the COVID-19 pandemic.
Cost of sales is also impacted by changes in copper concentrate inventories and ore stockpiles. For the year ended December 31, 2021, there was an increase of 6.5 million pounds of copper concentrate inventories during the year, which resulted in a decrease in production costs of $11.8 million. There was also an overall increase of 1.3 million tons in the ore stockpiles during 2021, which resulted in a decrease in production costs of $5.1 million compared to an increase of 3.0 million tons in ore stockpiles and a decrease in production costs of $11.4 million in 2020.
Depletion and amortization for the year ended December 31, 2021 decreased by $28.7 million over the prior year as ore tons that were mined from the Granite pit in 2020 had a higher capitalized stripping depreciation cost per ton compared to the ore being mined from the Pollyanna and Gibraltar pits in 2021.
Other operating (income) expenses
| | | Year ended
December 31, | |
| (Cdn$ in thousands) | | 2021 | | | 2020 | | | Change | |
| General and administrative | | 16,937 | | | 14,636 | | | 2,301 | |
| Share-based compensation expense | | 5,507 | | | 5,075 | | | 432 | |
| Project evaluation (recovery) expenditures | | (408 | ) | | 1,397 | | | (1,805 | ) |
| Realized (gain) loss on derivative instruments | | 14,041 | | | (3,759 | ) | | 17,800 | |
| Unrealized (gain) loss on derivative instruments | | (1,033 | ) | | 1,822 | | | (2,855 | ) |
| Other income, net | | (1,483 | ) | | (1,495 | ) | | 12 | |
| | | 33,561 | | | 17,676 | | | 15,885 | |
General and administrative expenses have increased in the year ended December 31, 2021, compared to prior year, primarily due to employment and consulting services provided by retiring executives as part of the Company's succession plan.
Share-based compensation expense is comprised of the amortization of share options and performance share units and the expense on deferred share units. Share-based compensation expense increased for the year ended December 31, 2021, compared to the prior year, primarily due to the revaluation of the liability for deferred share units resulting from an increase in the Company's share price during the year. More information is set out in Note 21 of the December 31, 2021 Financial Statements.
Project evaluation expenditures (recovery) represent costs associated with the New Prosperity project.
During the year ended December 31, 2021, the Company realized a net loss of $14.0 million for its derivatives instruments, which consists of $14.5 million for premiums paid for copper put options that settled out-of-the-money during the year and a $0.5 million gain on fuel call options. The net realized gain of $3.8 million in the year ended December 31, 2020 relates primarily to copper put options that settled in the money during 2020. For the year ended December 31, 2021, the net unrealized gain of $1.0 million relates substantially to outstanding copper collars covering production for the first half of 2022.
Finance expenses and income
| | | Year ended
December 31, | |
| (Cdn$ in thousands) | | 2021 | | | 2020 | | | Change | |
| Interest expense | | 40,893 | | | 37,288 | | | 3,605 | |
| Finance expense - deferred revenue | | 5,549 | | | 5,172 | | | 377 | |
| Accretion of PER | | 373 | | | 550 | | | (177 | ) |
| Finance income | | (678 | ) | | (249 | ) | | (429 | ) |
| Loss on settlement of long-term debt | | 5,798 | | | - | | | 5,798 | |
| Finance expenses, net | | 51,935 | | | 42,761 | | | 9,174 | |
| | | | | | | | | | |
| Call premium on settlement of long-term debt | | 6,941 | | | - | | | 6,941 | |
Interest expense increased in 2021 due to the increase in long term debt by US$150 million from the issuance of the US$400 million 2026 Notes in February While the coupon on the 2026 Notes have decreased by 1.75%, there is an increase of US$6.1. million in annual interest payable under the 2026 Notes compared to the 2022 Notes. The increase in interest expense in 2021 compared to the prior year was partially offset by the impact of foreign exchange and a stronger Canadian dollar in 2021.
As part of the senior secured notes refinancing in February, the Company redeemed its US$250 million 2022 Notes which resulted in an accounting loss of $5.8 million, comprised of the write-off of deferred financing costs of $4.0 million and additional interest costs over the call period of $1.8 million.
The Company also paid a redemption call premium of $6.9 million on the settlement of the 2022 Notes.
Finance expense on deferred revenue adjustments represents the implicit financing component of the upfront deposit from the silver sales streaming arrangement with Osisko Gold Royalties Ltd. ("Osisko").
Income tax
| | | Year ended
December 31, | |
| (Cdn$ in thousands) | | 2021 | | | 2020 | | | Change | |
| Current income tax expense | | 3,203 | | | 1,769 | | | 1,434 | |
| Deferred income tax expense (recovery) | | 31,138 | | | (10,865 | ) | | 42,003 | |
| Income tax expense (recovery) | | 34,341 | | | (9,096 | ) | | 43,437 | |
| Effective tax rate | | 48.5% | | | 27.9% | | | 20.6% | |
| Canadian statutory rate | | 27.0% | | | 27.0% | | | - | |
| B.C. mineral tax rate | | 9.5% | | | 9.5% | | | - | |
The overall income tax expense for the year ended December 31, 2021 was due to deferred income tax expense recognized on income for accounting purposes. The effective tax rate for the year is greater than the combined B.C. mineral and income tax rate of 36.5% due to the non-deductibility of unrealized foreign exchange loss on revaluation of the senior secured notes and as certain expenses such as finance charges and general and administration costs are not deductible for BC mineral tax purposes.
As foreign exchange revaluations on the senior secured notes are not recognized for tax purposes until realized, and in the case of capital losses, when they are applied, the effective tax rate may be significantly higher or lower than the statutory rates, as is the case for the year ended December 31, 2020 and 2021, relative to net income (loss) for those periods.
The current income tax expense represents an estimate of B.C. mineral taxes payable for the current periods.
FINANCIAL CONDITION REVIEW
Balance sheet review
| | | At December 31, | | | At December 31, | | | | |
| (Cdn$ in thousands) | | 2021 | | | 2020 | | | Change | |
| Cash and equivalents | | 236,767 | | | 85,110 | | | 151,657 | |
| Other current assets | | 100,460 | | | 72,088 | | | 28,372 | |
| Property, plant and equipment | | 837,839 | | | 742,619 | | | 95,220 | |
| Other assets | | 8,129 | | | 10,548 | | | (2,419 | ) |
| Total assets | | 1,183,195 | | | 910,365 | | | 272,830 | |
| Current liabilities | | 85,172 | | | 60,867 | | | 24,305 | |
| Debt: | | | | | | | | | |
| Senior secured notes | | 497,388 | | | 313,965 | | | 183,423 | |
| Equipment related financings | | 34,361 | | | 49,439 | | | (15,078 | ) |
| Deferred revenue | | 45,356 | | | 47,154 | | | (1,798 | ) |
| Other liabilities | | 162,400 | | | 121,568 | | | 40,832 | |
| Total liabilities | | 824,677 | | | 592,993 | | | 231,684 | |
| Equity | | 358,518 | | | 317,372 | | | 41,146 | |
| Net debt (debt minus cash and equivalents) | | 294,982 | | | 278,294 | | | 16,688 | |
| Total common shares outstanding (millions) | | 284.9 | | | 282.1 | | | 2.8 | |
The Company's asset base is comprised principally of property, plant and equipment, reflecting the capital intensive nature of Gibraltar and the mining business. Other current assets primarily include accounts receivable, inventories (concentrate inventories, ore stockpiles, and supplies), prepaid expenses, and marketable securities. Concentrate inventories, accounts receivable and cash balances can fluctuate due to transportation and cash settlement schedules.
Property, plant and equipment increased by $95.2 million in the year ended December 31, 2021, which includes $57.9 million for the development costs incurred for Florence Copper and due to greater capitalized stripping in 2021 in Gibraltar.
Net debt has increased by $16.7 million in the year ended December 31, 2021, primarily due to the senior secured notes refinancing in February 2021 including related transaction costs and the Company's investment in copper price protection extending out to June 2022.
Deferred revenue relates to the advance payments received from Osisko for the sale of Taseko's share of future silver production from Gibraltar.
Other liabilities increased by $40.8 million primarily due to an increase in deferred tax liabilities and the changes in the estimate of the provision for environmental rehabilitation.
As at February 22, 2022, there were 285,980,119 common shares and 9,853,966 stock options outstanding. More information on these instruments and the terms of their exercise is set out in Note 21 of the December 31, 2021 Financial Statements.
Liquidity, cash flow and capital resources
At December 31, 2021, the Company had cash and equivalents of $236.8 million (December 31, 2020 - $85.1 million).
Cash flow provided by operations during the year ended December 31, 2021 was $174.8 million compared to cash flow provided by operations of $106.2 million for the prior year and increased primarily due to higher copper prices in 2021.
Cash used for investing activities during the year ended December 31, 2021 was $147.7 million compared to cash used for investing activities of $59.6 million for the prior year. Investing cash flows for the year ended December 31, 2021 includes $87.8 million for capital expenditures at Gibraltar (including $59.9 million for capitalized stripping costs) and $42.9 million of capital expenditures paid for Florence Copper. Also included in investing activities is $15.8 million for the purchase of copper put options covering production for 2021 and copper collars covering the first half of 2022 for the Company's share of Gibraltar's production.
Net cash provided by financing activities for the year ended December 31, 2021 was $125.8 million. The Company received net incremental proceeds of $170.2 million from issuance of the US$400 million 7% senior secured notes ("2026 Notes") due in February 2026 and after redemption of the US$250 million 2022 Notes. There are no principal payments required on the 2026 Notes until the maturity date in February 2026. The first interest payment of US$14.4 million was paid on August 16, 2021.
Principal repayments for Gibraltar equipment loans and leases were $19.7 million and interest paid was $25.6 million for the year ended December 31, 2021.
Liquidity outlook
The Company has approximately $300 million of available liquidity at December 31, 2021, including a cash balance of $237 million and a new US$50 million revolving credit facility which closed in early October.
With a minimum US$4.00 per pound floor price for more than 90% of its expected copper production in 2022, continued strong operating margins and cash flows are expected from Gibraltar in 2022. Florence Copper has an estimated capital cost (including reclamation bonding and working capital) of approximately US$230 million. The Company does not have any significant capital plans for its other development projects over the next 12 months. At current copper prices, the Company expects to be able to fund construction of the commercial facility at Florence Copper and planned expenditures at other development projects from its existing sources of liquidity and cashflows from Gibraltar.
If copper prices decrease, or Florence construction costs increase or if plans for other development projects materially change, the Company may require additional external funding. The Company could raise additional capital if needed through equity financings or asset sales, including royalties, sales of project interests, or joint ventures or additional credit facilities, including additional notes offerings. The Company evaluates these financing alternatives based on a number of factors including the prevailing metal prices and projected operating cash flow from Gibraltar, relative valuation, liquidity requirements, covenant restrictions and other factors, in order to optimize the Company's cost of capital and maximize shareholder value.
Future changes in copper and molybdenum market prices could also impact the timing and amount of cash available for future investment in the Company's development projects, debt obligations, and other uses of capital. To mitigate commodity price risks in the short-term, copper price options are entered into for a substantial portion of Taseko's share of Gibraltar copper production and the Company has a long track record of doing so (see "Hedging Strategy").
Hedging strategy
The Company's hedging strategy is to secure a minimum price for a significant portion of copper production using put options that are either purchased outright or funded by the sale of call options that are significantly out of the money. The amount and duration of the hedge position is based on an assessment of business-specific risk elements combined with the copper pricing outlook. Copper price and quantity exposure are reviewed regularly to ensure that adequate revenue protection is in place. Hedge positions are typically extended by adding incremental quarters at established put strike prices to provide the necessary price protection. The Company's hedging strategy is designed to mitigate short-term declines in copper price.
Considerations on the cost of the hedging program include an assessment of Gibraltar's estimated production costs, anticipated copper prices and the Company's capital requirements during the relevant period. In May 2021, the Company acquired copper collars securing a minimum copper price of US$4.00 and a ceiling copper price of US$5.60 per pound for 43 million pounds of copper over the first half of 2022. In the first quarter of 2022, the Company acquired additional copper collars securing a minimum copper price of US$4.00 and a ceiling copper price of US$5.40 per pound for 42 million pounds of copper over the second half of 2022.
From time to time, the Company will look at potential hedging opportunities to mitigate the risk of rising input costs, including foreign exchange and fuel prices where such a strategy is cost effective.
| | Notional amount | Strike price | Term to maturity | Original cost |
| At December 31, 2021 | | | | |
| | | | | |
| Copper collars | 42.7 million lbs | US$4.00 per lb
US$5.60 per lb | January 2022 to
June 2022 | $4.7 million |
| | | | | |
| Acquired subsequent to December 31, 2021 | | | | |
| | | | | |
| Copper collars | 42.0 million lbs | US$4.00 per lb
US$5.40 per lb | July 2022 to
December 2022 | $4.2 million |
| | | | | |
Commitments and contingencies
Commitments
| | | Payments due | | | | |
| (Cdn$ in thousands) | | 2022 | | | 2023 | | | 2024 | | | 2025 | | | 2026 | | | Thereafter | | | Total | |
| Debt: | | | | | | | | | | | | | | | | | | | | | |
| 2026 Notes 1 | | - | | | - | | | - | | | - | | | 507,120 | | | - | | | 507,120 | |
| Interest | | 35,498 | | | 35,498 | | | 35,498 | | | 35,498 | | | 17,749 | | | - | | | 159,741 | |
| Equipment loans: | | | | | | | | | | | | | | | | | | | | | |
| Principal | | 6,539 | | | 4,682 | | | 1,375 | | | - | | | - | | | - | | | 12,596 | |
| Interest | | 510 | | | 197 | | | 18 | | | - | | | - | | | - | | | 725 | |
| Lease liabilities: | | | | | | | | | | | | | | | | | | | | | |
| Principal | | 9,529 | | | 2,599 | | | 1,284 | | | 1,288 | | | 896 | | | - | | | 15,596 | |
| Interest | | 589 | | | 279 | | | 180 | | | 100 | | | 24 | | | - | | | 1,172 | |
| Lease related obligation: | | | | | | | | | | | | | | | | | | | | | |
| Rental payment | | 2,620 | | | 2,627 | | | - | | | - | | | - | | | - | | | 5,247 | |
| PER 2 | | - | | | - | | | - | | | - | | | - | | | 87,571 | | | 87,571 | |
| Capital expenditures | | 36,530 | | | 1,885 | | | - | | | - | | | - | | | - | | | 38,415 | |
| Other expenditures | | | | | | | | | | | | | | | | | | | | | |
| Transportation related services 3 | | 4,146 | | | 3,291 | | | 3,291 | | | 3,291 | | | 823 | | | - | | | 14,842 | |
1 In February 2021, the Company closed its offering of the 2026 Notes and a portion of the proceeds was used to redeem all of the 2022 Notes.
2 Provision for environmental rehabilitation amounts presented in the table represents the present value of estimated costs of legal and constructive obligations required to retire an asset, including decommissioning and other site restoration activities, primarily for the Gibraltar mine and Florence Copper. As at December 31, 2021, the Company has provided a surety bond of $37.5 million for its 75% share of Gibraltar's reclamation security. On January 31, 2022, the Company posted additional surety of $21.9 million for its 75% share of Gibraltar reclamation security. For Florence Copper, the Company has provided to the federal and state regulator surety bonds totaling $12.4 million as reclamation security.
3 Transportation related services commitments include ocean freight and port handling services, which are both cancellable upon certain operating circumstances.
The Company has made capital expenditure commitments relating to equipment for the Florence Copper project totaling $37.9 million at December 31, 2021.
The Company has guaranteed 100% of certain equipment loans and leases entered into by Gibraltar in which it holds a 75% interest. As a result, the Company has guaranteed the joint venture partner's 25% share of this debt which amounted to $10.1 million as at December 31, 2021.
SELECTED ANNUAL INFORMATION
| | | For the years ended December 31, | |
| (Cdn$ in thousands, except per share amounts) | | 2021 | | | 2020 | | | 2019 | |
| Revenues | | 433,278 | | | 343,267 | | | 329,163 | |
| Net income (loss) | | 36,472 | | | (23,524 | ) | | (53,382 | ) |
| Per share - basic | | 0.13 | | | (0.09 | ) | | (0.22 | ) |
| Per share - diluted | | 0.13 | | | (0.09 | ) | | (0.22 | ) |
| | | | | | | | | | |
| | | As at December 31, | |
| | | 2021 | | | 2020 | | | 2019 | |
| Total assets | | 1,183,195 | | | 910,365 | | | 883,996 | |
| Total long-term financial liabilities | | 518,087 | | | 349,312 | | | 358,508 | |
FOURTH QUARTER RESULTS
Consolidated Statements of Comprehensive Income (Loss) | | Three months ended
December 31, | |
| (Cdn$ in thousands, except per share amounts) | | 2021 | | | 2020 | |
| | | | | | | |
| Revenues | | 102,972 | | | 87,398 | |
| Cost of sales | | | | | | |
| Production costs | | (41,056 | ) | | (60,336 | ) |
| Depletion and amortization | | (16,202 | ) | | (18,747 | ) |
| Earnings from mining operations | | 45,714 | | | 8,315 | |
| | | | | | | |
| General and administrative | | (3,570 | ) | | (4,944 | ) |
| Share-based compensation expense | | (1,033 | ) | | (1,216 | ) |
| Project evaluation recovery (expenditures) | | 733 | | | (109 | ) |
| Loss on derivatives | | (11,033 | ) | | (1,753 | ) |
| Other income | | 337 | | | 352 | |
| Income before financing costs and income taxes | | 31,148 | | | 645 | |
| | | | | | | |
| Finance expenses, net | | (11,854 | ) | | (10,528 | ) |
| Foreign exchange gain | | 1,768 | | | 12,853 | |
| Income before income taxes | | 21,062 | | | 2,970 | |
| | | | | | | |
| Income tax recovery (expense) | | (9,300 | ) | | 2,724 | |
| Net income for the period | | 11,762 | | | 5,694 | |
| | | | | | | |
| Other comprehensive income (loss): | | | | | | |
| Unrealized gain (loss) on financial assets | | 206 | | | (2,855 | ) |
| Foreign currency translation reserve | | (1,024 | ) | | (9,109 | ) |
| Total other comprehensive loss for the period | | (818 | ) | | (11,964 | ) |
| | | | | | | |
| Total comprehensive income (loss) for the period | | 10,944 | | | (6,270 | ) |
| | | | | | | |
| Earnings per share | | | | | | |
| Basic | | 0.04 | | | 0.02 | |
| Diluted | | 0.04 | | | 0.02 | |
| | | | | | | |
| Weighted-average shares outstanding (in thousands) | | | | | | |
| Basic | | 284,167 | | | 263,227 | |
| Diluted | | 288,511 | | | 266,140 | |
| Consolidated Statements of Cash Flows | | Three months ended
December 31, | |
| (Cdn$ in thousands) | | 2021 | | | 2020 | |
| Operating activities | | | | | | |
| Net income for the period | | 11,762 | | | 5,694 | |
| Adjustments for: | | | | | | |
| Depletion and amortization | | 16,202 | | | 18,747 | |
| Income tax expense (recovery) | | 9,300 | | | (2,724 | ) |
| Finance expenses, net | | 11,854 | | | 10,528 | |
| Share-based compensation expense | | 1,075 | | | 1,242 | |
| Loss on derivatives | | 11,033 | | | 1,753 | |
| Unrealized foreign exchange gain | | (1,817 | ) | | (13,595 | ) |
| Amortization of deferred revenue | | (826 | ) | | (1,229 | ) |
| Other operating activities | | (805 | ) | | - | |
| Net change in working capital: | | | | | | |
| Change in inventory | | (17,761 | ) | | (8,991 | ) |
| Change in other working capital items | | (2,786 | | | 8,999 | |
| Cash provided by operating activities | | 37,231 | | | 20,424 | |
| | | | | | | |
| Investing activities | | | | | | |
| Gibraltar capitalized stripping costs | | (12,737 | ) | | (1,236 | ) |
| Gibraltar capital expenditures | | (6,487 | ) | | (11,303 | ) |
| Florence Copper development costs | | (14,766 | ) | | (3,923 | ) |
| Other project development costs | | (1,187 | ) | | (1,029 | ) |
| Purchase of copper price options | | - | | | (3,367 | ) |
| Other investing activities | | 2,312 | | | 46 | |
| Cash used for investing activities | | (32,865 | ) | | (20,812 | ) |
| | | | | | | |
| Financing activities | | | | | | |
| Proceeds from equity issuance, net of costs | | - | | | 34,299 | |
| Other financing fees | | (1,451 | ) | | - | |
| Repayment of equipment loans and leases | | (4,938 | ) | | (4,655 | ) |
| Interest paid | | (788 | ) | | (14,861 | ) |
| Proceeds from exercise of stock options | | 1,148 | | | 391 | |
| Cash provided by (used for) financing activities | | (6,029 | ) | | 15,174 | |
| Effect of exchange rate changes on cash and equivalents | | (721 | ) | | (2,354 | ) |
| Increase (decrease) in cash and equivalents | | (2,384 | ) | | 12,432 | |
| Cash and equivalents, beginning of period | | 239,151 | | | 72,678 | |
| Cash and equivalents, end of period | | 236,767 | | | 85,110 | |
Earnings
| | | Three months ended
December 31, | |
| (Cdn$ in thousands) | | 2021 | | | 2020 | | | Change | |
| Net income | | 11,762 | | | 5,694 | | | 6,068 | |
| Unrealized foreign exchange gain | | (1,817 | ) | | (13,595 | ) | | 11,778 | |
| Unrealized loss on copper put and fuel call options | | 4,612 | | | 586 | | | 4,026 | |
| Estimated tax effect of adjustments | | (1,245 | ) | | (158 | ) | | (1,087 | ) |
| Adjusted net income (loss)* | | 13,312 | | | (7,473 | ) | | 20,785 | |
The Company's adjusted net income was $13.3 million ($0.05 per share) for the three months ended December 31, 2021, compared to an adjusted net loss of $7.5 million ($0.03 loss per share) in 2020. The increased adjusted net income in the current period was primarily due to greater earnings from mining operations before depletion and amortization* which was $61.9 million for the current quarter compared to $27.1 million for the same period in 2020. During the fourth quarter of 2021, earnings from mining operations was positively impacted by a higher average LME copper price of US$4.40 per pound, an increase of 35% over the fourth quarter of 2020, which more than offset the lower copper sales volumes. An increase in waste stripping costs being capitalized and lower depletion and amortization expense also positively impacted earnings. After inclusion of $1.8 million in unrealized foreign exchange gains on the outstanding senior secured notes and unrealized losses on derivative instruments, the Company's net income was $11.8 million ($0.04 per share) for the three months ended December 31, 2021, compared to $5.7 million ($0.02 per share) in 2020.
Net income (GAAP) for the three months ended December 31, 2020 was impacted by the increase in the Canadian dollar which resulted in an unrealized foreign exchange gain of $13.6 million for the period, compared to $1.8 million in unrealized foreign exchange gain in the three months ended December 31, 2021.
No adjustments are made to adjusted net income (loss) for positive or negative provisional price adjustments in the quarter as these adjustments normalize or reverse throughout the period.
Revenues
| | | Three months ended
December 31, | |
| (Cdn$ in thousands) | | 2021 | | | 2020 | | | Change | |
| Copper contained in concentrate | | 95,143 | | | 77,523 | | | 17,620 | |
| Copper price adjustments on settlement | | 396 | | | 8,413 | | | (8,017 | ) |
| Molybdenum concentrate | | 8,660 | | | 4,162 | | | 4,498 | |
| Molybdenum price adjustments on settlement | | (103 | ) | | 364 | | | (467 | ) |
| Silver | | 1,156 | | | 1,097 | | | 59 | |
| Total gross revenue | | 105,252 | | | 91,559 | | | 13,693 | |
| Less: Treatment and refining costs | | (2,280 | ) | | (4,161 | ) | | 1,881 | |
| Revenue | | 102,972 | | | 87,398 | | | 15,574 | |
| | | | | | | | | | |
| (thousands of pounds, unless otherwise noted) | | | | | | | | | |
| Copper in concentrate1 | | 17,208 | | | 18,091 | | | (883 | ) |
| Average realized copper price (US$ per pound) | | 4.37 | | | 3.69 | | | 0.68 | |
| Average LME copper price (US$ per pound) | | 4.40 | | | 3.25 | | | 1.15 | |
| Average exchange rate (CAD/USD) | | 1.26 | | | 1.30 | | | (0.04 | ) |
1 This amount includes a net smelter payable deduction of approximately 3.5% to derive net payable pounds of copper sold.
Copper revenues for the three months ended December 31, 2021 increased by $17.6 million compared to the same period in 2020, due to higher prevailing LME copper prices by US$1.15 per pound in the current quarter. Provisional price adjustments were less of a factor in the fourth quarter of 2021 compared to 2020 which saw a rising copper price environment. Partially offsetting the higher copper price this quarter is the decrease in the volume of payable copper sold by 0.9 million pounds (75% basis) and the weakening US dollar, which decreased 3.1% from the same prior period.
Molybdenum revenues for the three months ended December 31, 2021 increased by $4.5 million compared to the same period in 2020 due to higher average molybdenum prices of US$18.89 per pound, compared to US$9.01 per pound for the same prior period.
Cost of sales
| | | Three months ended
December 31, | |
| (Cdn$ in thousands) | | 2021 | | | 2020 | | | Change | |
| Site operating costs | | 54,921 | | | 65,287 | | | (10,366 | ) |
| Transportation costs | | 4,436 | | | 3,768 | | | 668 | |
| Changes in inventories of finished goods | | (13,497 | ) | | (2,087 | ) | | (11,410 | ) |
| Changes in inventories of ore stockpiles | | (4,804 | ) | | (6,632 | ) | | 1,828 | |
| Production costs | | 41,056 | | | 60,336 | | | (19,280 | ) |
| Depletion and amortization | | 16,202 | | | 18,747 | | | (2,545 | ) |
| Cost of sales | | 57,258 | | | 79,083 | | | (21,825 | ) |
| Site operating costs per ton milled* | $ | 9.94 | | $ | 11.67 | | $ | (1.73 | ) |
Site operating costs for the three months ended December 31, 2021 decreased by $10.4 million compared to the same prior period primarily due to greater mining costs being capitalized in 2021 ($12.7 million) compared to 2020 ($1.2 million) and lower operating costs associated with 12% fewer tons being mined in the quarter.
Cost of sales is also impacted by changes in copper concentrate inventories and ore stockpiles. Due to extreme flooding in southwest BC in the fourth quarter and its impact on transportation, there was an increase of 5.0 million pounds of copper in finished goods which resulted in a decrease in production costs of $13.5 million.
Depletion and amortization for the three months ended December 31, 2021 decreased by $2.5 million over the same prior period. The decrease was primarily due to lower amortization of capitalized stripping costs due to lower ore tons mined in the current period compared to the same prior period.
Other operating (income) expenses
| | | Three months ended
December 31, | |
| (Cdn$ in thousands) | | 2021 | | | 2020 | | | Change | |
| General and administrative | | 3,570 | | | 4,944 | | | (1,374 | ) |
| Share-based compensation expense | | 1,033 | | | 1,216 | | | (183 | ) |
| Project evaluation (recovery) expenditures | | (733 | ) | | 109 | | | (842 | ) |
| Realized loss on derivative instruments | | 6,421 | | | 1,167 | | | 5,254 | |
| Unrealized loss on derivative instruments | | 4,612 | | | 586 | | | 4,026 | |
| Other income, net | | (337 | ) | | (352 | ) | | 15 | |
| | | 14,566 | | | 7,670 | | | 6,896 | |
General and administrative expenses have decreased in the three months ended December 31, 2021, compared to the same prior period, primarily due to the accrual in 2020 for employment and consulting services related to retiring executives as part of the Company's succession plan.
During the three months ended December 31, 2021, the Company realized a loss of $6.4 million for premiums paid for copper put options covering fourth quarter production at a strike price of US$3.75 per pound that settled out-of-the-money during the period. The realized loss of $1.2 million in the fourth quarter of 2020 relates primarily to copper put options that settled out of-the-money.
For the three months ended December 31, 2021, the net unrealized loss of $4.6 million relates to the fair value adjustments on the outstanding copper collars covering the first half of 2022.
Finance expenses and income
| | | Three months ended
December 31, | |
| (Cdn$ in thousands) | | 2021 | | | 2020 | | | Change | |
| Interest expense | | 10,636 | | | 9,147 | | | 1,489 | |
| Finance expense - deferred revenue | | 1,373 | | | 1,291 | | | 82 | |
| Accretion of PER | | 63 | | | 137 | | | (74 | ) |
| Finance income | | (218 | ) | | (47 | ) | | (171 | ) |
| Finance expense, net | | 11,854 | | | 10,528 | | | 1,326 | |
Interest expense for the three months ended December 31, 2021 increased for the prior year period due to higher overall interest accrued on the new senior secured notes issued in February 2021.
Finance expense on deferred revenue adjustments represents the implicit financing component of the upfront deposit from the silver sales streaming arrangement with Osisko.
Income tax
| | | Three months ended
December 31, | |
| (Cdn$ in thousands) | | 2021 | | | 2020 | | | Change | |
| Current income tax expense | | 908 | | | 490 | | | 418 | |
| Deferred income tax expense (recovery) | | 8,392 | | | (3,214 | ) | | 11,606 | |
| | | 9,300 | | | (2,724 | ) | | 12,024 | |
| Effective tax rate | | 44.2% | | | (91.7)% | | | 135.9% | |
| Canadian statutory rate | | 27.0% | | | 27.0% | | | - | |
| B.C. mineral tax rate | | 9.5% | | | 9.5% | | | - | |
The overall income tax expense for the three months ended December 31, 2021 was due to deferred income tax expense recognized on income for accounting purposes. The effective tax rate for the current fourth quarter is greater than the combined B.C. mineral and income tax rate of 36.5% due to the non-taxability of unrealized foreign exchange gains on revaluation of the senior secured notes and as certain expenses such as finance charges and general and administration costs are not deductible for BC mineral tax purposes.
As foreign exchange revaluations on the senior secured notes are not recognized for tax purposes until realized, and in the case of capital losses, when they are applied, the effective tax rate may be significantly higher or lower than the statutory rates, as is the case for the three months ended December 31, 2020 and 2021, relative to net income (loss) for those periods
Current income taxes represents an estimate of B.C. mineral taxes payable for the fourth quarter.
Liquidity, cash flow and capital resources
Cash flow provided by operations during the three months ended December 31, 2021 was $37.2 million compared to cash flow provided by operations of $20.4 million for the same prior period due primarily to higher copper prices and higher capitalized stripping in 2021. Cash flow provided by operations in the current period was impacted by negative net working capital adjustments of $20.5 million.
Cash used for investing activities during the three months ended December 31, 2021 was $32.9 million compared to cash used for investing activities of $20.8 million for the same prior period. Investing cash flows in the fourth quarter includes $19.2 million for capital expenditures at Gibraltar (including $12.7 million for capitalized stripping costs) and $14.8 million of cash expenditures for Florence Copper.
Net cash used by financing activities for the three months ended December 31, 2021 was $6.0 million comprised of principal repayments for equipment loans and leases of $4.9 million, interest paid of $0.8 million and $1.5 million in fees relating to the new revolving credit facility closed in October 2021. Net cash provided by financing activities for the three months ended December 31, 2020 was $15.2 million and included in financing activities is the net proceeds from the equity offering of $34.3 million.
SUMMARY OF QUARTERLY RESULTS
| | | 2021 | | | 2020 | |
(Cdn$ in thousands,
except per share amounts) | | Q4 | | | Q3 | | | Q2 | | | Q1 | | | Q4 | | | Q3 | | | Q2 | | | Q1 | |
| Revenues | | 102,972 | | | 132,563 | | | 111,002 | | | 86,741 | | | 87,398 | | | 87,780 | | | 106,005 | | | 62,084 | |
| Net income (loss) | | 11,762 | | | 22,485 | | | 13,442 | | | (11,217 | ) | | 5,694 | | | 987 | | | 18,745 | | | (48,950 | ) |
| Basic EPS | | 0.04 | | | 0.08 | | | 0.05 | | | (0.04 | ) | | 0.02 | | | - | | | 0.08 | | | (0.20 | ) |
| Adjusted net income (loss)* | | 13,312 | | | 27,020 | | | 9,948 | | | (5,534 | ) | | (7,473 | ) | | (5,754 | ) | | 8,335 | | | (21,647 | ) |
| Adjusted basic EPS* | | 0.05 | | | 0.10 | | | 0.04 | | | (0.02 | ) | | (0.03 | ) | | (0.02 | ) | | 0.03 | | | (0.09 | ) |
| Adjusted EBITDA* | | 52,988 | | | 76,291 | | | 47,732 | | | 23,722 | | | 20,478 | | | 31,545 | | | 50,860 | | | 5,346 | |
(US$ per pound, except where indicated)
| |
| Realized copper price* | | 4.37 | | | 4.26 | | | 4.48 | | | 4.09 | | | 3.69 | | | 3.15 | | | 2.70 | | | 2.06 | |
| Total operating costs* | | 1.94 | | | 1.57 | | | 2.02 | | | 2.23 | | | 2.82 | | | 2.00 | | | 1.34 | | | 1.82 | |
| Copper sales (million pounds) | | 17.9 | | | 24.3 | | | 20.0 | | | 16.5 | | | 18.8 | | | 21.4 | | | 29.5 | | | 23.3 | |
Financial results for the last eight quarters reflect: volatile copper and molybdenum prices and foreign exchange rates that impact realized sale prices; and variability in the quarterly sales volumes due to copper grades and timing of shipments which impacts revenue recognition.
CRITICAL ACCOUNTING POLICIES AND ESTIMATES
The Company's significant accounting policies are presented in Note 2.4 of the Financial Statements. The preparation of the financial statements in conformity with IFRS requires management to make judgments, estimates and assumptions that affect the application of accounting policies and the reported amounts of assets, liabilities, income and expenses. Actual results may differ from these estimates. Estimates and underlying assumptions are reviewed on an ongoing basis. Revisions to accounting estimates are recognized in the period in which the estimates are revised and in any future periods affected.
In the process of applying the Company's accounting policies, significant areas where judgment is required include the determination of a joint arrangement, determining the timing of transfer of control of inventory for revenue recognition, provisions for environmental rehabilitation, reserve and resource estimation, functional currency, determination of the accounting treatment of the advance payment under the silver purchase and sale agreement reported as deferred revenue, determination of business or asset acquisition treatment, and recovery of other deferred tax assets.
Significant areas of estimation include reserve and resource estimation; asset valuations and the measurement of impairment charges or reversals; valuation of inventories; plant and equipment lives; tax provisions; provisions for environmental rehabilitation; valuation of financial instruments and derivatives; capitalized stripping costs and share-based compensation. Key estimates and assumptions made by management with respect to these areas have been disclosed in the notes to these consolidated financial statements as appropriate.
The accuracy of reserve and resource estimates is a function of the quantity and quality of available data and the assumptions made and judgment used in the engineering and geological interpretation and may be subject to revision based on various factors. Changes in reserve and resource estimates may impact the carrying value of property, plant and equipment; the calculation of depreciation expense; the capitalization of stripping costs incurred during production; and the timing of cash flows related to the provision for environmental rehabilitation.
Changes in forecast prices of commodities, exchange rates, production costs and recovery rates may change the economic status of reserves and resources. Forecast prices of commodities, exchange rates, production costs and recovery rates, and discount rates assumptions, either individually or collectively, may impact the carrying value of derivative financial instruments, inventories, property, plant and equipment, and intangibles, as well as the measurement of impairment charges or reversals.
CHANGE IN ACCOUNTING POLICIES
Several new standards, and amendments to standards and interpretations, are not yet effective for the year ended December 31, 2021, and have not been applied in preparing these consolidated financial statements. None are currently considered by the Company to be significant or likely to have a material impact on future financial statements.
INTERNAL AND DISCLOSURE CONTROLS OVER FINANCIAL REPORTING
The Company's management is responsible for establishing and maintaining adequate internal control over financial reporting (ICFR) and disclosure controls and procedures (DC&P).
The Company's internal control system over financial reporting is designed to provide reasonable assurance to management and the Board of Directors regarding the preparation and fair presentation of published financial statements. Internal control over financial reporting includes those policies and procedures that:
(1) pertain to the maintenance of records that in reasonable detail accurately and fairly reflect the transactions and dispositions of the assets of the Company;
(2) provide reasonable assurance that transactions are recorded as necessary to permit preparation of financial statements in accordance with IFRS, and that receipts and expenditures of the Company are being made only in accordance with authorizations of management and directors of the Company; and
(3) provide reasonable assurance regarding prevention or timely detection of unauthorized acquisition, use or disposition of the Company's assets that could have a material effect on the financial statements.
The Company's internal control system over disclosure controls and procedures is designed to provide reasonable assurance that material information relating to the Company is made known to management and disclosed to others and information required to be disclosed by the Company in its annual filings, interim filings or other reports filed or submitted by us under securities legislation is recorded, processed, summarized and reported within the time periods specified in the securities legislation.
All internal control systems, no matter how well designed, have inherent limitations. Therefore, even those systems determined effective can provide only reasonable assurance with respect to financial reporting and disclosure.
There have been no changes in our internal control over financial reporting and disclosure controls and procedures during the 2021 financial year that have materially affected, or are reasonably likely to materially affect, internal control over financial reporting and disclosure.
The Company's management, under the supervision of the Chief Executive Officer and the Chief Financial Officer, assessed the effectiveness of the Company's internal control over financial reporting as of December 31, 2021. In making this assessment, it used the criteria set forth in the Internal Control-Integrated Framework (2013) issued by the Committee of Sponsoring Organizations of the Treadway Commission (COSO). Based on this assessment, management has concluded that, as of December 31, 2021, the Company's internal control over financial reporting is effective based on those criteria. The Company's certifying officers have evaluated the effectiveness of the ICFR and DC&P at the financial year end and concluded that ICFR and DC&P are effective as at December 31, 2021 based on the evaluation.
FINANCIAL INSTRUMENTS
The Company uses a mixture of cash, long-term debt and shareholders' equity to maintain an efficient capital allocation and ensure adequate liquidity exists to meet the ongoing cash requirements of the business. In the normal course of business, the Company is inherently exposed to financial risks, including market risk, commodity price risk, interest rate risk, currency risk, liquidity risk and credit risk. The Company manages these risks in accordance with its risk management policies. To mitigate some of these inherent business risks, the Company uses commodity derivative instruments that do not qualify for hedge accounting treatment. These non-hedge derivatives are summarized in Note 7 to the Financial Statements. The financial risks and the Company's exposure to these risks, is provided in various tables in Note 25 of the Financial Statements. For a discussion on the methods used to value financial instruments, as well as significant assumptions, refer also to Notes 2 and 25 of the Financial Statements.
| Summary of Financial Instruments | Carrying Amount | Associated Risks |
| Financial assets | | |
| Amortized cost | | |
| Cash and equivalents | 236,767 | Interest rate |
| | | |
| Accounts receivable | 9,604 | Credit Market |
| Fair value through other comprehensive income (FVOCI) | | |
| Marketable securities | 3,110 | Market |
| Investment in private companies | 1,200 | Market |
| Financial liabilities | | |
| | | |
| Accounts payable and accrued liabilities | 55,660 | Currency |
| Senior secured notes | 497,388 | Currency |
| Lease liabilities | 15,692 | Interest rate |
| Lease related obligations | 7,457 | Interest rate |
| Secured equipment loans | 12,564 | Currency Interest rate |
RELATED PARTY TRANSACTIONS
Key management personnel
Key management personnel include the members of the Board of Directors and executive officers of the Company.
The Company contributes to a post-employment defined contribution pension plan on the behalf of certain key management personnel. This retirement compensation arrangement ("RCA Trust") was established to provide benefits to certain executive officers on or after retirement in recognition of their long service. Upon retirement, the participant is entitled to the distribution of the accumulated value of the contributions under the RCA Trust. Obligations for contributions to the defined contribution pension plan are recognized as compensation expense in the periods during which services are rendered by the executive officers.
Certain executive officers are entitled to termination and change in control benefits. In the event of termination without cause, other than a change in control, these executive officers are entitled to an amount ranging from 9-month to 12-months' salary. In the event of a change in control, if a termination without cause or a resignation occurs within 12 months following the change of control, these executive officers are entitled to receive, among other things, an amount ranging from 12-months' to 24-months' salary and accrued bonus, and all stock options held by these individuals will fully vest.
Executive officers and directors also participate in the Company's share option program (refer to Note 21 of the Financial Statements).
Compensation for key management personnel (including all members of the Board of Directors and executive officers) is as follows:
| | | Year ended
December 31, | |
| (Cdn$ in thousands) | | 2021 | | | 2020 | |
| Salaries and benefits | | 6,252 | | | 6,527 | |
| Post-employment benefits | | 1,672 | | | 1,827 | |
| Share-based compensation expense | | 5,011 | | | 4,963 | |
| | | 12,935 | | | 13,317 | |
Other related parties
Gibraltar Joint Venture
Under the terms of the joint venture operating agreement, Gibraltar pays the Company a management fee for services rendered by the Company as operator of the Gibraltar mine. In addition, the Company pays certain expenses on behalf of Gibraltar and invoices the Gibraltar for these expenses. In 2021, net management fee income for $1,227 (2020: $1,291) and net reimbursable compensation expenses and third party costs of $343 (2020: $190) were charged to the joint venture partner.
NON-GAAP PERFORMANCE MEASURES
This document includes certain non-GAAP performance measures that do not have a standardized meaning prescribed by IFRS. These measures may differ from those used by, and may not be comparable to such measures as reported by, other issuers. The Company believes that these measures are commonly used by certain investors, in conjunction with conventional IFRS measures, to enhance their understanding of the Company's performance. These measures have been derived from the Company's financial statements and applied on a consistent basis. The following tables below provide a reconciliation of these non-GAAP measures to the most directly comparable IFRS measure.
Total operating costs and site operating costs, net of by-product credits
Total costs of sales include all costs absorbed into inventory, as well as transportation costs and insurance recoverable. Site operating costs are calculated by removing net changes in inventory, depletion and amortization, insurance recoverable, and transportation costs from cost of sales. Site operating costs, net of by-product credits is calculated by subtracting by-product credits from the site operating costs. Site operating costs, net of by-product credits per pound are calculated by dividing the aggregate of the applicable costs by copper pounds produced. Total operating costs per pound is the sum of site operating costs, net of by-product credits and off-property costs divided by the copper pounds produced. By-product credits are calculated based on actual sales of molybdenum (net of treatment costs) and silver during the period divided by the total pounds of copper produced during the period. These measures are calculated on a consistent basis for the periods presented.
(Cdn$ in thousands, unless otherwise indicated) -
75% basis | | 2021
Q4 | | | 2021
Q3 | | | 2021
Q2 | | | 2021
Q1 | | | 2021
YE | |
| Cost of sales | | 57,258 | | | 65,893 | | | 74,056 | | | 72,266 | | | 269,473 | |
| Less: | | | | | | | | | | | | | | | |
| Depletion and amortization | | (16,202 | ) | | (17,011 | ) | | (17,536 | ) | | (15,838 | ) | | (66,587 | ) |
| Net change in inventories of finished goods | | 13,497 | | | 762 | | | (4,723 | ) | | 2,259 | | | 11,795 | |
| Net change in inventories of ore stockpiles | | 4,804 | | | 6,291 | | | 2,259 | | | (8,226 | ) | | 5,128 | |
| Transportation costs | | (4,436 | ) | | (5,801 | ) | | (4,303 | ) | | (3,305 | ) | | (17,845 | ) |
| Site operating costs | | 54,921 | | | 50,134 | | | 49,753 | | | 47,156 | | | 201,964 | |
| Less by-product credits: | | | | | | | | | | | | | | | |
| Molybdenum, net of treatment costs | | (7,755 | ) | | (8,574 | ) | | (6,138 | ) | | (5,604 | ) | | (28,071 | ) |
| Silver, excluding amortization of deferred revenue | | (330 | ) | | 300 | | | 64 | | | (238 | ) | | (204 | ) |
| Site operating costs, net of by-product credits | | 46,836 | | | 41,860 | | | 43,679 | | | 41,314 | | | 173,689 | |
| Total copper produced (thousand pounds) | | 21,590 | | | 25,891 | | | 20,082 | | | 16,684 | | | 84,247 | |
| Total costs per pound produced | | 2.17 | | | 1.62 | | | 2.18 | | | 2.48 | | | 2.06 | |
| Average exchange rate for the period (CAD/USD) | | 1.26 | | | 1.26 | | | 1.23 | | | 1.27 | | | 1.25 | |
| Site operating costs, net of by-product credits (US$ per pound) | | 1.72 | | | 1.28 | | | 1.77 | | | 1.96 | | | 1.64 | |
| Site operating costs, net of by-product credits | | 46,836 | | | 41,860 | | | 43,679 | | | 41,314 | | | 173,689 | |
| Add off-property costs: | | | | | | | | | | | | | | | |
| Treatment and refining costs | | 1,480 | | | 3,643 | | | 1,879 | | | 2,414 | | | 9,416 | |
| Transportation costs | | 4,436 | | | 5,801 | | | 4,303 | | | 3,305 | | | 17,845 | |
| Total operating costs | | 52,752 | | | 51,304 | | | 49,861 | | | 47,033 | | | 200,950 | |
| Total operating costs (C1) (US$ per pound) | | 1.94 | | | 1.57 | | | 2.02 | | | 2.23 | | | 1.90 | |
(Cdn$ in thousands, unless otherwise indicated) -
75% basis | | 2020
Q4 | | | 2020
Q3 | | | 2020
Q2 | | | 2020
Q1 | | | 2020
YE | |
| Cost of sales | | 79,083 | | | 75,969 | | | 81,181 | | | 83,309 | | | 319,542 | |
| Less: | | | | | | | | | | | | | | | |
| Depletion and amortization | | (18,747 | ) | | (23,894 | ) | | (25,512 | ) | | (27,148 | ) | | (95,301 | ) |
| Net change in inventories of finished goods | | 2,087 | | | 1,415 | | | (5,753 | ) | | 1,302 | | | (949 | ) |
| Net change in inventories of ore stockpiles | | 6,632 | | | 4,186 | | | (50 | ) | | 603 | | | 11,371 | |
| Transportation costs | | (3,768 | ) | | (4,127 | ) | | (5,834 | ) | | (4,519 | ) | | (18,248 | ) |
| Site operating costs | | 65,287 | | | 53,549 | | | 44,032 | | | 53,547 | | | 216,425 | |
| Less by-product credits: | | | | | | | | | | | | | | | |
| Molybdenum, net of treatment costs | | (3,649 | ) | | (4,109 | ) | | (4,252 | ) | | (3,231 | ) | | (15,241 | ) |
| Silver, excluding amortization of deferred revenue | | 133 | | | (54 | ) | | (28 | ) | | (354 | ) | | (303 | ) |
| Site operating costs, net of by-product credits | | 61,771 | | | 49,386 | | | 39,752 | | | 49,962 | | | 200,871 | |
| Total copper produced (thousand pounds) | | 18,725 | | | 21,658 | | | 27,576 | | | 24,318 | | | 92,277 | |
| Total costs per pound produced | | 3.30 | | | 2.28 | | | 1.44 | | | 2.05 | | | 2.18 | |
| Average exchange rate for the period (CAD/USD) | | 1.30 | | | 1.33 | | | 1.39 | | | 1.34 | | | 1.34 | |
| Site operating costs, net of by-product credits (US$ per pound) | | 2.53 | | | 1.71 | | | 1.04 | | | 1.53 | | | 1.62 | |
| Site operating costs, net of by-product credits | | 61,771 | | | 49,386 | | | 39,752 | | | 49,962 | | | 200,871 | |
| Add off-property costs: | | | | | | | | | | | | | | | |
| Treatment and refining costs | | 3,284 | | | 4,254 | | | 5,676 | | | 4,956 | | | 18,170 | |
| Transportation costs | | 3,768 | | | 4,127 | | | 5,834 | | | 4,519 | | | 18,248 | |
| Total operating costs | | 68,823 | | | 57,767 | | | 51,262 | | | 59,437 | | | 237,289 | |
| Total operating costs (C1) (US$ per pound) | | 2.82 | | | 2.00 | | | 1.34 | | | 1.82 | | | 1.92 | |
Adjusted net income (loss)
Adjusted net income (loss) removes the effect of the following transactions from net income as reported under IFRS:
- Unrealized foreign currency gains/losses;
- Unrealized gain/loss on derivatives; and
- Loss on settlement of long-term debt and call premium, including realized foreign exchange gains.
Management believes these transactions do not reflect the underlying operating performance of our core mining business and are not necessarily indicative of future operating results. Furthermore, unrealized gains/losses on derivative instruments, changes in the fair value of financial instruments, and unrealized foreign currency gains/losses are not necessarily reflective of the underlying operating results for the reporting periods presented.
| (Cdn$ in thousands, except per share amounts) | | 2021
Q4 | | | 2021
Q3 | | | 2021
Q2 | | | 2021
Q1 | | | 2021
YE | |
| Net income (loss) | | 11,762 | | | 22,485 | | | 13,442 | | | (11,217 | ) | | 36,472 | |
| Unrealized foreign exchange (gain) loss | | (1,817 | ) | | 9,511 | | | (3,764 | ) | | 8,798 | | | 12,728 | |
| Realized foreign exchange gain on settlement of long-term debt | | - | | | - | | | - | | | (13,000 | ) | | (13,000 | ) |
| Loss on settlement of long-term debt | | - | | | - | | | - | | | 5,798 | | | 5,798 | |
| Call premium on settlement of long-term debt | | - | | | - | | | - | | | 6,941 | | | 6,941 | |
| Unrealized (gain) loss on derivatives | | 4,612 | | | (6,817 | ) | | 370 | | | 802 | | | (1,033 | ) |
| Estimated tax effect of adjustments | | (1,245 | ) | | 1,841 | | | (100 | ) | | (3,657 | ) | | (3,161 | ) |
| Adjusted net income (loss) | | 13,312 | | | 27,020 | | | 9,948 | | | (5,535 | ) | | 44,745 | |
| Adjusted EPS | | 0.05 | | | 0.10 | | | 0.04 | | | (0.02 | ) | | 0.16 | |
| (Cdn$ in thousands, except per share amounts) | | 2020
Q4 | | | 2020
Q3 | | | 2020
Q2 | | | 2020
Q1 | | | 2020
YE | |
| Net income (loss) | | 5,694 | | | 987 | | | 18,745 | | | (48,950 | ) | | (23,524 | ) |
| Unrealized foreign exchange (gain) loss | | (13,595 | ) | | (7,512 | ) | | (12,985 | ) | | 29,747 | | | (4,345 | ) |
| Unrealized (gain) loss on derivatives | | 586 | | | 1,056 | | | 3,528 | | | (3,348 | ) | | 1,822 | |
| Estimated tax effect of adjustments | | (158 | ) | | (285 | ) | | (953 | ) | | 904 | | | (492 | ) |
| Adjusted net income (loss) | | (7,473 | ) | | (5,754 | ) | | 8,335 | | | (21,647 | ) | | (26,539 | ) |
| Adjusted EPS | | (0.03 | ) | | (0.02 | ) | | 0.03 | | | (0.09 | ) | | (0.11 | ) |
Adjusted EBITDA
Adjusted EBITDA is presented as a supplemental measure of the Company's performance and ability to service debt. Adjusted EBITDA is frequently used by securities analysts, investors and other interested parties in the evaluation of companies in the industry, many of which present Adjusted EBITDA when reporting their results. Issuers of "high yield" securities also present Adjusted EBITDA because investors, analysts and rating agencies consider it useful in measuring the ability of those issuers to meet debt service obligations.
Adjusted EBITDA represents net income before interest, income taxes, and depreciation and also eliminates the impact of a number of items that are not considered indicative of ongoing operating performance. Certain items of expense are added and certain items of income are deducted from net income that are not likely to recur or are not indicative of the Company's underlying operating results for the reporting periods presented or for future operating performance and consist of:
- Unrealized foreign exchange gains/losses;
- Unrealized gain/loss on derivatives;
- Loss on settlement of long term debt (included in finance expenses) and call premium;
- Realized foreign exchange gain on settlement of long-term debt; and
- Amortization of share-based compensation expense.
| (Cdn$ in thousands) | | 2021
Q4 | | | 2021
Q3 | | | 2021
Q2 | | | 2021
Q1 | | | 2021
YE | |
| Net income (loss) | | 11,762 | | | 22,485 | | | 13,442 | | | (11,217 | ) | | 36,472 | |
| Add: | | | | | | | | | | | | | | | |
| Depletion and amortization | | 16,202 | | | 17,011 | | | 17,536 | | | 15,838 | | | 66,587 | |
| Finance expense (includes loss on settlement of long-term debt and call premium) | | 12,072 | | | 11,875 | | | 11,649 | | | 23,958 | | | 59,554 | |
| Finance income | | (218 | ) | | (201 | ) | | (184 | ) | | (75 | ) | | (678 | ) |
| Income tax (recovery) expense | | 9,300 | | | 22,310 | | | 7,033 | | | (4,302 | ) | | 34,341 | |
| Unrealized foreign exchange (gain) loss | | (1,817 | ) | | 9,511 | | | (3,764 | ) | | 8,798 | | | 12,728 | |
| Realized foreign exchange gain on settlement of long-term debt | | - | | | - | | | - | | | (13,000 | ) | | (13,000 | ) |
| Unrealized (gain) loss on derivatives | | 4,612 | | | (6,817 | ) | | 370 | | | 802 | | | (1,033 | ) |
| Amortization of share-based compensation expense | | 1,075 | | | 117 | | | 1,650 | | | 2,920 | | | 5,762 | |
| Adjusted EBITDA | | 52,988 | | | 76,291 | | | 47,732 | | | 23,722 | | | 200,733 | |
| (Cdn$ in thousands) | | 2020
Q4 | | | 2020
Q3 | | | 2020
Q2 | | | 2020
Q1 | | | 2020
YE | |
| Net income (loss) | | 5,694 | | | 987 | | | 18,745 | | | (48,950 | ) | | (23,524 | ) |
| Add: | | | | | | | | | | | | | | | |
| Depletion and amortization | | 18,747 | | | 23,894 | | | 25,512 | | | 27,148 | | | 95,301 | |
| Finance expense | | 10,575 | | | 11,203 | | | 10,461 | | | 10,771 | | | 43,010 | |
| Finance income | | (47 | ) | | (4 | ) | | (48 | ) | | (150 | ) | | (249 | ) |
| Income tax (recovery) expense | | (2,724 | ) | | (580 | ) | | 4,326 | | | (10,118 | ) | | (9,096 | ) |
| Unrealized foreign exchange (gain) loss | | (13,595 | ) | | (7,512 | ) | | (12,985 | ) | | 29,747 | | | (4,345 | ) |
| Unrealized (gain) loss on derivatives | | 586 | | | 1,056 | | | 3,528 | | | (3,348 | ) | | 1,822 | |
| Amortization of share-based compensation expense | | 1,242 | | | 2,501 | | | 1,321 | | | 246 | | | 5,310 | |
| Adjusted EBITDA | | 20,478 | | | 31,545 | | | 50,860 | | | 5,346 | | | 108,229 | |
Earnings from mining operations before depletion and amortization
Earnings from mining operations before depletion and amortization is earnings from mining operations with depletion and amortization added back. The Company discloses this measure, which has been derived from our financial statements and applied on a consistent basis, to provide assistance in understanding the results of the Company's operations and financial position and it is meant to provide further information about the financial results to investors.
| (Cdn$ in thousands) | | 2021
Q4 | | | 2021
Q3 | | | 2021
Q2 | | | 2021
Q1 | | | 2021
YE | |
| Earnings from mining operations | | 45,714 | | | 66,670 | | | 36,946 | | | 14,475 | | | 163,805 | |
| Add: | | | | | | | | | | | | | | | |
| Depletion and amortization | | 16,202 | | | 17,011 | | | 17,536 | | | 15,838 | | | 66,587 | |
| Earnings from mining operations before depletion and amortization | | 61,916 | | | 83,681 | | | 54,482 | | | 30,313 | | | 230,392 | |
| (Cdn$ in thousands) | | 2020
Q4 | | | 2020
Q3 | | | 2020
Q2 | | | 2020
Q1 | | | 2020
YE | |
| Earnings (loss) from mining operations | | 8,315 | | | 11,811 | | | 24,824 | | | (21,225 | ) | | 23,725 | |
| Add: | | | | | | | | | | | | | | | |
| Depletion and amortization | | 18,747 | | | 23,894 | | | 25,512 | | | 27,148 | | | 95,301 | |
| Earnings from mining operations before depletion and amortization | | 27,062 | | | 35,705 | | | 50,336 | | | 5,923 | | | 119,026 | |
Site operating costs per ton milled
| (Cdn$ in thousands, except per ton milled amounts) | | 2021
Q4 | | | 2021
Q3 | | | 2021
Q2 | | | 2021
Q1 | | | 2021
YE | |
| Site operating costs (included in cost of sales) | | 54,921 | | | 50,134 | | | 49,753 | | | 47,156 | | | 201,964 | |
| Tons milled (thousands) (75% basis) | | 5,523 | | | 5,576 | | | 5,429 | | | 5,402 | | | 21,930 | |
| Site operating costs per ton milled | $ | 9.94 | | $ | 8.99 | | $ | 9.16 | | $ | 8.73 | | $ | 9.21 | |
| (Cdn$ in thousands, except per ton milled amounts) | | 2020
Q4 | | | 2020
Q3 | | | 2020
Q2 | | | 2020
Q1 | | | 2020
YE | |
| Site operating costs (included in cost of sales) | | 65,287 | | | 53,549 | | | 44,032 | | | 53,547 | | | 216,415 | |
| Tons milled (thousands) (75% basis) | | 5,594 | | | 5,595 | | | 5,748 | | | 5,622 | | | 22,559 | |
| Site operating costs per ton milled | $ | 11.67 | | $ | 9.57 | | $ | 7.66 | | $ | 9.52 | | $ | 9.59 | |