This management discussion and analysis ("MD&A") is intended to help the reader understand Taseko Mines Limited ("Taseko", "we", "our" or the "Company"), our operations, financial performance, and current and future business environment. This MD&A is intended to supplement and complement the consolidated financial statements and notes thereto, prepared in accordance with International Financial Reporting Standards ("IFRS") issued by the International Accounting Standards Board for the year ended December 31, 2022 (the "Financial Statements"). You are encouraged to review the Financial Statements in conjunction with your review of this MD&A and the Company's other public filings, which are available on the Canadian Securities Administrators' website at www.sedar.com and on the EDGAR section of the United States Securities and Exchange Commission's ("SEC") website at www.sec.gov.
This MD&A is prepared as of February 23, 2023. All dollar figures stated herein are expressed in Canadian dollars, unless otherwise specified. Included throughout this MD&A are references to non-GAAP performance measures which are denoted with an asterisk and further explanation including their calculations are provided on page 32.
Cautionary Statement on Forward-Looking Information
This discussion includes certain statements that may be deemed "forward-looking statements". All statements in this discussion, other than statements of historical facts, that address future production, reserve potential, exploration drilling, exploitation activities, and events or developments that the Company expects are forward-looking statements. Although we believe the expectations expressed in such forward-looking statements are based on reasonable assumptions, such statements are not guarantees of future performance and actual results or developments may differ materially from those in the forward-looking statements. Factors that could cause actual results to differ materially from those in forward-looking statements include market prices, global economic events arising from the coronavirus (COVID-19) pandemic outbreak, exploitation and exploration successes, continued availability of capital and financing and general economic, market or business conditions. Investors are cautioned that any such statements are not guarantees of future performance and actual results or developments may differ materially from those projected in the forward-looking statements. All of the forward-looking statements made in this MD&A are qualified by these cautionary statements. We disclaim any intention or obligation to update or revise any forward-looking statements whether as a result of new information, future events or otherwise, except to the extent required by applicable law. Further information concerning risks and uncertainties associated with these forward-looking statements and our business may be found in the Company's other public filings with the SEC and Canadian provincial securities regulatory authorities.
CONTENTS
OVERVIEW
Taseko is a copper focused mining company that seeks to create long-term shareholder value by acquiring, developing, and operating large tonnage mineral deposits in North America which are capable of supporting a mine for decades. The Company's principal operating asset is the 75% owned Gibraltar mine, which is located in central British Columbia and is one of the largest copper mines in North America. Taseko also owns Florence Copper, which will be one of the lowest energy and greenhouse gas-intense sources of mined copper globally and is advancing towards construction, as well as the Yellowhead copper, New Prosperity gold-copper, and Aley niobium projects.
HIGHLIGHTS
| Operating Data (Gibraltar - 100% basis) | | Three months ended
December 31, | | | Year ended
December 31, | |
| | | 2022 | | | 2021 | | | Change | | | 2022 | | | 2021 | | | Change | |
| Tons mined (millions) | | 22.9 | | | 23.3 | | | (0.4 | ) | | 88.7 | | | 105.4 | | | (16.7 | ) |
| Tons milled (millions) | | 7.3 | | | 7.4 | | | (0.1 | ) | | 30.3 | | | 29.2 | | | 1.1 | |
| Production (million pounds Cu) | | 26.7 | | | 28.8 | | | (2.1 | ) | | 97.0 | | | 112.3 | | | (15.3 | ) |
| Sales (million pounds Cu) | | 25.5 | | | 23.8 | | | 1.7 | | | 101.3 | | | 104.9 | | | (3.6 | ) |
| | | | | | | | | | | | | | | | | | | |
| Financial Data | | Three months ended
December 31, | | | Year ended
December 31, | |
| (Cdn$ in thousands, except for per share amounts) | | 2022 | | | 2021 | | | Change | | | 2022 | | | 2021 | | | Change | |
| Revenues | | 100,618 | | | 102,972 | | | (2,354 | ) | | 391,609 | | | 433,278 | | | (41,669 | ) |
| Earnings from mining operations before depletion and amortization* | | 37,653 | | | 61,916 | | | (24,263 | ) | | 106,217 | | | 230,392 | | | (124,175 | ) |
| Cash flows (used for) provided by operations | | (946 | ) | | 37,231 | | | (38,177 | ) | | 81,266 | | | 174,769 | | | (93,503 | ) |
| Adjusted EBITDA* | | 35,181 | | | 52,988 | | | (17,807 | ) | | 109,035 | | | 200,733 | | | (91,698 | ) |
| Adjusted net income * | | 7,146 | | | 13,312 | | | (6,166 | ) | | 1,723 | | | 44,745 | | | (43,022 | ) |
| Per share - basic ("Adjusted EPS")* | | 0.02 | | | 0.05 | | | (0.03 | ) | | 0.01 | | | 0.16 | | | (0.15 | ) |
| Net income (loss) (GAAP) | | (2,275 | ) | | 11,762 | | | (14,037 | ) | | (25,971 | ) | | 36,472 | | | (62,443 | ) |
| Per share - basic ("EPS") | | (0.01 | ) | | 0.04 | | | (0.05 | ) | | (0.09 | ) | | 0.13 | | | (0.22 | ) |
2022 Annual Review
Earnings from mining operations before depletion and amortization* was $106.2 million, Adjusted EBITDA* was $109.0 million, and cash flows from operations was $81.3 million;
Adjusted net income* was $1.7 million ($0.01 per share) and GAAP Net loss was $26.0 million ($0.09 per share) for the year;
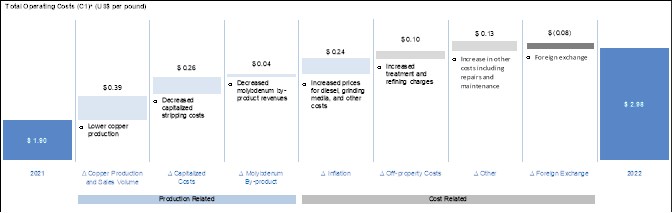
Total operating costs (C1)* for the year were US$2.98 per pound produced;
The Gibraltar mine produced 97.0 million pounds of copper and 1.1 million pounds of molybdenum in 2022. Copper recoveries were 79.5% and copper head grades were 0.20%;
Gibraltar sold 101.3 million pounds of copper for the year (100% basis) which contributed to revenue for Taseko of $391.6 million, Taseko's second highest revenue year after 2021. Average realized copper prices before hedging gains were US$3.96 per pound for year, compared to the LME average price of US$3.99 per pound;
The Company had a cash balance of $121 million and has approximately $190 million of available liquidity at December 31, 2022, including its undrawn US$50 million revolving credit facility;
In September 2022, the EPA concluded its 45-day public comment period for the draft Underground Injection Control ("UIC") permit for Florence Copper. The project received overwhelming support from business organizations, community leaders and state-wide organizations in written submissions and as voiced at the public hearing; and
Development costs incurred for Florence Copper were $101.3 million in the year and included further payments for the major processing equipment being delivered for the solvent extraction and electrowinning ("SX/EW") plant, other pre-construction activities and ongoing site costs.
Fourth Quarter Review
In December 2022, the Company signed agreements with Mitsui & Co. (U.S.A.) Inc. ("Mitsui") to form a strategic partnership to develop Florence Copper. Mitsui has committed to an initial investment of US$50 million which is conditional on receipt of the final UIC permit, with proceeds to be used for construction of the commercial production facility. The initial investment will be in the form of a copper stream agreement on 2.67% of the copper produced at Florence Copper. In addition, Mitsui has the option to invest an additional US$50 million (for a total investment of US$100 million) for a 10% equity interest in Florence Copper;
Fourth quarter earnings from mining operations before depletion and amortization* was $37.7 million, Adjusted EBITDA* was $35.2 million, and Adjusted net income* was $7.1 million ($0.02 per share);
Gibraltar produced 26.7 million pounds of copper for the quarter. Head grades were 0.22% and were similar to the prior quarter. Lower mill throughput and lower than expected grades due to mining dilution, impacted production in the quarter;
Average mill throughput in the fourth quarter was 79,000 tons per day, as production in December was negatively impacted by unplanned mill downtime arising from a sitewide power outage caused by an extreme cold weather event;
Copper recoveries were 83.4% for the quarter in line with expectations and a significant improvement over the prior quarters in 2022;
Total site costs* in the fourth quarter was $5.6 million higher than the average for the last nine months due to higher diesel costs and timing of equipment repairs and maintenance;
Gibraltar sold 25.5 million pounds of copper in the quarter (100% basis) at an average realized copper price of US$3.66 per pound;
GAAP net loss was $2.3 million ($0.01 loss per share) and reflected an unrealized loss on derivatives of $20.1 million due to the recovery in copper prices, and net of a foreign exchange gain of $4.6 million due to a strengthening Canadian dollar;
The Company has copper collar contracts in place to protect a minimum copper price of US$3.75 per pound until the end of December 2023 for the majority of the Company's needs. The Company also has 24 million litres of fuel call options in place to provide a ceiling cost for its share of diesel over the same period;
In December 2022, Gibraltar entered into an equipment loan refinancing with the Company's share of net proceeds being $25.7 million. The Company also secured a commitment for US$25 million from Banc of America Leasing & Capital, LLC to fund costs associated with the SX/EW plant for the Florence Copper commercial production facility;
In February 2023, the Company entered into an agreement to extend the maturity date of the undrawn revolving credit facility by an additional year to July 2026. In addition to the one-year extension, the lender has also agreed to an accordion feature, which will allow the amount of the credit facility to be increased by US$30 million, for a total of US$80 million, subject to credit approval and other conditions; and
The standstill agreement between the Tŝilhqot'in Nation and Taseko was most recently extended for a fourth one-year term in December 2022, with the goal of providing time and opportunity for the Tŝilhqot'in Nation and Taseko to negotiate a final resolution. The dialogue process has made tangible progress in the past 12 months but is not complete. In agreeing to extend the standstill through 2023, the Tŝilhqot'in Nation and Taseko acknowledge the constructive nature of discussions to date, and the future opportunity to conclude a long-term and mutually acceptable resolution of the conflict that also makes an important contribution to the goals of reconciliation in Canada.
REVIEW OF OPERATIONS
Gibraltar mine (75% Owned)
Operating data (100% basis) | Q4
2022 | Q3
2022 | Q2
2022 | Q1
2022 | Q4
2021 | YE
2022 | YE
2021 |
Tons mined (millions) | 22.9 | 23.2 | 22.3 | 20.3 | 23.3 | 88.7 | 105.4 |
Tons milled (millions) | 7.3 | 8.2 | 7.7 | 7.0 | 7.4 | 30.3 | 29.2 |
Strip ratio | 1.1 | 1.5 | 2.8 | 2.6 | 2.2 | 1.8 | 2.5 |
Site operating cost per ton milled (Cdn$)* | $13.88 | $11.33 | $11.13 | $11.33 | $9.94 | $11.89 | $9.21 |
Copper concentrate | | | | | | | |
Head grade (%) | 0.22 | 0.22 | 0.17 | 0.19 | 0.24 | 0.20 | 0.23 |
Copper recovery (%) | 83.4 | 77.1 | 77.3 | 80.2 | 80.4 | 79.5 | 82.4 |
Production (million pounds Cu) | 26.7 | 28.3 | 20.7 | 21.4 | 28.8 | 97.0 | 112.3 |
Sales (million pounds Cu) | 25.5 | 26.7 | 21.7 | 27.4 | 23.8 | 101.3 | 104.9 |
Inventory (million pounds Cu) | 5.4 | 4.2 | 2.7 | 4.0 | 9.9 | 5.4 | 9.9 |
Molybdenum concentrate | | | | | | | |
Production (thousand pounds Mo) | 359 | 324 | 199 | 236 | 450 | 1,118 | 1,954 |
Sales (thousand pounds Mo) | 402 | 289 | 210 | 229 | 491 | 1,131 | 2,000 |
Per unit data (US$ per pound produced)* | | | | | | | |
Site operating costs* | $2.79 | $2.52 | $3.25 | $2.95 | $2.02 | $2.85 | $1.91 |
By-product credits* | (0.40) | (0.15) | (0.15) | (0.18) | (0.30) | (0.23) | (0.27) |
Site operating costs, net of by-product credits* | $2.39 | $2.37 | $3.10 | $2.77 | $1.72 | $2.62 | $1.64 |
Off-property costs | 0.36 | 0.35 | 0.37 | 0.36 | 0.22 | 0.36 | 0.26 |
Total operating costs (C1)* | $2.75 | $2.72 | $3.47 | $3.13 | $1.94 | $2.98 | $1.90 |
OPERATIONS ANALYSIS
Full Year Results
Gibraltar produced 97.0 million pounds of copper for the year compared to 112.3 million pounds in 2021. Head grades for the year averaged 0.20% copper, compared to 0.23% in 2021. The copper head grades were impacted by higher than expected mining dilution. Copper recoveries for 2022 were 79.5%, compared to 82.4% in 2021.
A total of 88.7 million tons were mined in the year compared to 105.4 million tons mined in the prior year period. The strip ratio of 1.8 was lower than the prior year as mining operations were focused in the Gibraltar pit in 2022 which has a lower strip ratio than the Pollyanna pit.
Total site costs* at Gibraltar of $301.8 million (which includes capitalized stripping of $32.0 million) for Taseko's 75% share were $40.0 million higher than 2021, primarily due to higher diesel prices (55% higher than 2021) and increased diesel volume consumed (21% higher than 2021) due to the longer hauls and higher truck hours and with grinding media and other input costs also increasing due to inflationary pressures.
Molybdenum production was 1.1 million pounds in the year compared to 2.0 million pounds in the prior year. Molybdenum prices strengthened in 2022 with an average molybdenum price of US$18.73 per pound, an increase of 18% compared to the 2021 average price of US$15.94 per pound. By-product credits per pound of copper produced was US$0.23 in the year compared to US$0.27 in the prior year. The higher molybdenum price and favorable provisional price adjustments at year end were offset by lower molybdenum sales in 2022 compared to the prior year.
Off-property costs per pound produced* were US$0.36 for the year, which is US$0.10 higher than the prior year. In 2021 the Company benefited from lower benchmark treatment and refining charges ("TCRC") and realized lower TCRCs for spot tenders due to tight copper market conditions last year. Ocean freight costs also increased in 2022 as the Company entered into a new contract at a higher rate earlier in the year. Also contributing to the increased off-property costs per pound produced in 2022 is the fact that sales of copper exceeded production by 4.3 million pounds.
Total operating costs per pound produced (C1)* were US$2.98 for the year, compared to US$1.90 in the prior year as shown in the bridge graph below:
Fourth Quarter Results
Gibraltar produced 26.7 million pounds of copper for the quarter, a 6% decrease over the third quarter. Copper production in December was impacted by unplanned mill downtime, including a sitewide power outage late in the month. Although the power outage was only 24 hours in duration, the severe cold temperatures of -35° Celsius (-31° Fahrenheit) immediately froze a number of essential systems in the mills. This extreme weather delayed the restart of milling operations for several days followed by a gradual return to full capacity by the end of December. Mill throughput in October and November averaged above design capacity at 88,000 tons per day, but mill throughput averaged only 63,000 tons per day in December.
Head grades were in line with the prior quarter and management continues to work on reducing the mining dilution being experienced in the Gibraltar pit. Copper recoveries in the fourth quarter were 83%, an improvement over the prior quarters in 2022 due to improving ore quality as mining advances deeper into the Gibraltar pit.
A total of 22.9 million tons were mined in the fourth quarter. The strip ratio of 1.1 was lower than prior quarter and included some initial stripping activity in the Connector pit. The ore stockpiles increased by 3.8 million tons in the fourth quarter.
Total site costs* at Gibraltar of $79.7 million (which includes capitalized stripping of $3.9 million) for Taseko's 75% share were $5.6 million higher than the average of the first three quarters of 2022 due to higher diesel costs, timing of repairs and maintenance and year-end wage related costs. Site operating cost per ton milled* was $13.88 was higher than the previous quarters in 2022 due to the higher site costs and lower mill throughput.
Molybdenum production was 359 thousand pounds in the fourth quarter. At an average molybdenum price of US$21.39 per pound and the impact of favorable provisional price adjustments of $3.9 million for Taseko's 75% share, molybdenum generated a by-product credit per pound of copper produced of US$0.40 in the fourth quarter.
Off-property costs per pound produced* were US$0.36 for the fourth quarter reflecting higher ocean freight costs (including bunker fuel) and increased treatment and refining charges (TCRC) compared to the same quarter in the prior year.
Total operating costs per pound produced (C1)* were US$2.75 for the quarter and was in line with the previous quarter.
ENVIRONMENTAL, SOCIAL AND GOVERNANCE
Nothing is more important to Taseko than the safety, health and well-being of our workers and their families. Taseko places a high priority on the continuous improvement of performance in the areas of employee health and safety at the workplace and protection of the environment.
In May 2022, Taseko published its annual Environmental, Social, and Governance (“ESG”) report, providing detailed information about the Company’s 2021 performance and outcomes against the most critical ESG topics and metrics for the global mining sector.
For the first time, in the 2021 ESG Report Taseko has established long-term goals in the areas of energy management, water management, reclamation and biodiversity. In addition, the Company is reporting against the Sustainability Accounting Standards Board (SASB) framework, providing consistent and comparable ESG metrics specific to the global mining sector.
The full report is available on the Company’s website at www.tasekomines.com/esg/overview.
Gibraltar’s 2022 ESG report will be published in the second quarter of 2023.
GIBRALTAR OUTLOOK
Gibraltar is expected to produce 115 million pounds of copper (+/-5%) in 2023 on a 100% basis. The Gibraltar pit will be the sole source of mill feed in 2023 and the quarterly production profile is expected to be less variable than 2022 due to improving quality and consistency of ore as mining progresses deeper into the pit. Annual mill throughput is expected to exceed design capacity in 2023 due to the softer ore in Gibraltar pit.
Stripping activities are underway in the new Connector pit. While the strip ratio is expected to be in line with the LOM average, the allocation of costs to capitalized stripping in 2023 will be higher than in 2022. The primary crusher for mill 1 which overlays the Connector zone is scheduled to be moved to its new location in the third quarter of this year.
Strong metal prices combined with our copper hedge protection continues to provide tailwinds for robust financial performance and operating margins at the Gibraltar mine over the coming year. Copper prices in 2022 averaged US$3.99 per pound and have started the current year above these levels. Molybdenum prices are currently US$36.95 per pound, 97% higher than the average price in 2022.
The Company currently has copper price collar contracts in place that secure a minimum copper price of US$3.75 per pound for 72 million pounds of copper until December 31, 2023. The Company has also executed price caps for its share of diesel purchases. Improving production combined with this copper hedge and diesel price protection program should continue to provide the foundation for stable financial performance and operating margins at the Gibraltar mine in 2023.
FLORENCE COPPER
The Company is awaiting the issuance of the final Underground Injection Control permit ("UIC") from the U.S. Environmental Protection Agency ("EPA"), which is the final permitting step required prior to construction commencing on the commercial production facility. The EPA is currently addressing comments that were received during the public comment period, which was held in the fall of 2022. Public comments submitted to the EPA have demonstrated strong support for the Florence Copper project among local residents, business organizations, community leaders and state-wide organizations.
In December 2022, the Company signed agreements with Mitsui to form a strategic partnership to develop Florence Copper. Mitsui has committed to an initial investment of US$50 million which is conditional on receipt of the final UIC permit, with proceeds to be used for construction of the commercial production facility. The initial investment will be in the form of a copper stream agreement on 2.67% of the copper produced at Florence Copper. In addition, Mitsui has the option to invest an additional US$50 million (for a total investment of US$100 million) for a 10% equity interest in Florence Copper.
Detailed engineering and design for the commercial production facility is substantially completed and procurement activities are well advanced. The Company has purchased the major processing equipment associated with the SX/EW plant and the equipment has now been delivered to the Florence site. The Company is well positioned to transition into construction once the final UIC permit is received. The Company incurred $101.3 million of capital expenditures at the Florence project in 2022 funded from available cash.
LONG-TERM GROWTH STRATEGY
Taseko's strategy has been to grow the Company by acquiring and developing a pipeline of complementary projects focused on copper in stable mining jurisdictions. We continue to believe this will generate long-term returns for shareholders. Our other development projects are located in British Columbia.
Yellowhead Copper Project
Yellowhead Mining Inc. ("Yellowhead") has an 817 million tonnes reserve and a 25-year mine life with a pre-tax net present value of $1.3 billion at an 8% discount rate using a US$3.10 per pound copper price based on the Company's 2020 NI 43-101 technical report. Capital costs of the project are estimated at $1.3 billion over a 2-year construction period. Over the first 5 years of operation, the copper equivalent grade will average 0.35% producing an average of 200 million pounds of copper per year at an average C1* cost, net of by-product credit, of US$1.67 per pound of copper. The Yellowhead copper project contains valuable precious metal by-products with 440,000 ounces of gold and 19 million ounces of silver with a life of mine value of over $1 billion at current prices.
The Company is preparing to advance into the environmental assessment process and is undertaking some additional engineering work in conjunction with ongoing engagement with local communities including First Nations. The Company is also collecting baseline data and modeling which will be used to support the environmental assessment and permitting of the project.
New Prosperity Gold-Copper Project
In late 2019, the Tŝilhqot'in Nation, as represented by Tŝilhqot'in National Government, and Taseko entered into a confidential dialogue, with the involvement of the Province of British Columbia, in order to obtain a long-term resolution of the conflict regarding Taseko's proposed copper-gold mine previously known as New Prosperity, acknowledging Taseko's commercial interests and the Tŝilhqot'in Nation's opposition to the project.
This dialogue has been supported by the parties' agreement, beginning December 2019, to a series of one-year standstills on certain outstanding litigation and regulatory matters relating to Taseko's tenures and the area in the vicinity of Teztan Biny (Fish Lake). The standstill agreement was most recently extended for a fourth one-year term in December 2022, with the goal of providing time and opportunity for the Tŝilhqot'in Nation and Taseko to negotiate a final resolution.
The dialogue process has made tangible progress in the past 12 months but is not complete. In agreeing to extend the standstill through 2023, the Tŝilhqot'in Nation and Taseko acknowledge the constructive nature of discussions to date, and the future opportunity to conclude a long-term and mutually acceptable resolution of the conflict that also makes an important contribution to the goals of reconciliation in Canada.
Aley Niobium Project
Environmental monitoring and product marketing initiatives on the Aley niobium project continue. The converter pilot test is ongoing and is providing additional process data to support the design of the commercial process facilities and will provide final product samples for marketing purposes. The Company has also initiated a scoping study to investigate the potential production of niobium oxide at Aley to supply the growing market for Niobium-based batteries.
MARKET REVIEW

Prices (USD per pound for Commodities)
(Source Data: Bank of Canada, Platts Metals, and London Metals Exchange)
Copper prices are currently around US$4.15 per pound, compared to US$3.80 per pound at December 31, 2022. Copper prices saw a dramatic sell off in June of 2022 that was triggered by global recession fears and an expected slowdown in China. In March 2022, copper reached a record high of US$5.09 per pound due to uncertainty arising from the Ukraine conflict, rising inflation rates and low warehouse inventory levels. Copper prices have steadily recovered since the onset of COVID-19 due to tight physical market conditions, ensuing supply chain bottlenecks, inflation pressures caused by economic stimulus measures and other geopolitical challenges. Europe's imminent need to transition away from Russian energy dependence and invest further in alternative energy should also accelerate growth in the demand for copper in the medium term.
Electrification of transportation and the focus on government investment in construction and infrastructure including initiatives focused on the renewable energy, electrification and meeting net zero targets by 2050, are inherently copper intensive. According to S&P Global's copper market outlook report published in July 2022, titled 'The Future of Copper: Will the looming supply gap short-circuit the energy transition?', global demand for copper is projected to double from approximately 25 million metric tons today to roughly 50 million metric tons by 2035, a record high that will be sustained and continue to grow to 53 million metric tons by 2050, in order to achieve net-zero targets. All of these factors continue to provide unprecedented catalysts for higher copper prices to continue in the future. Short-term volatility is expected due to macroeconomic uncertainty and the risk of a US and global recession. While some analysts predict a potential copper market balance by 2023 based on current development projects under construction and the recession caused pullback in demand, the medium to longer-term outlook for copper remains extremely favorable. This increased demand for copper after years of under investment by the copper industry in new primary mine supply, coupled with inherently low recycling rates, is expected to support strong copper prices over the coming decade.
Approximately 6% of the Company's revenue is made up of molybdenum sales. During 2022, the average molybdenum price was US$18.73 per pound and reached above US$31.85 per pound for a period. Molybdenum prices are currently around US$36.95 per pound, with demand and higher prices driven by supply challenges at large South American copper mines that produce molybdenum as a by-product. Strong demand from the energy sector has boosted demand for alloyed steel products, as well as growing demand from the renewables and military sectors. The Company's sales agreements specify molybdenum pricing based on the published Platts Metals reports.
Approximately 80% of the Gibraltar mine's costs are Canadian dollar denominated and therefore, fluctuations in the Canadian/US dollar exchange rate can have a significant effect on the Company's operating results and unit production costs, which are earned and in some cases reported in US dollars. Overall, the Canadian dollar weakened throughout the year due to a strengthening US dollar caused by global recession concerns.
FINANCIAL PERFORMANCE
Earnings
| | | Year ended
December 31, | |
| (Cdn$ in thousands) | | 2022 | | | 2021 | | | Change | |
| Net income (loss) | | (25,971 | ) | | 36,472 | | | (62,443 | ) |
| Net unrealized foreign exchange loss | | 30,027 | | | 12,728 | | | 17,299 | |
| Realized foreign exchange gain on settlement of long-term debt | | - | | | (13,000 | ) | | 13,000 | |
| Loss on settlement of long-term debt | | - | | | 12,739 | | | (12,739 | ) |
| Unrealized gain on derivative instruments | | (3,196 | ) | | (1,033 | ) | | (2,163 | ) |
| Estimated tax effect of adjustments | | 863 | | | (3,161 | ) | | 4,024 | |
| Adjusted net income * | | 1,723 | | | 44,745 | | | (43,022 | ) |
The Company's adjusted net income was $1.7 million ($0.01 per share) for the year ended December 31, 2022, compared to adjusted net income of $44.7 million ($0.16 per share) for the prior year. The lower adjusted net income in the current year was primarily due to lower average LME copper prices and sales volumes, higher site costs due to the rising input costs such as diesel and a decrease in waste stripping costs being capitalized. Partially offsetting these impacts was $13.6 million in net realized gains from copper put options and $14.6 million less in depletion and amortization than the prior year.
The Company's net loss was $26.0 million ($0.09 loss per share) for the year ended December 31, 2022 after deduction of $30.0 million in unrealized foreign exchange losses on the outstanding senior secured notes due to the stronger US dollar, partially offset by unrealized gains on copper put options of $3.2 million (less tax effects) for copper collars that remain outstanding at the end of December 31, 2022.
Net income in the year ended December 31, 2021 was also negatively impacted by settlement of the US$250 million 8.75% Senior Secured Notes ("2022 Notes"). The $12.7 million settlement loss recorded upon repayment of the 2022 Notes decreased GAAP net income in the first half of 2021.
No adjustments are made to adjusted net income (loss) for negative provisional price adjustments in the year.
Revenues
| | | Year ended
December 31, | |
| (Cdn$ in thousands) | | 2022 | | | 2021 | | | Change | |
| Copper contained in concentrate | | 380,700 | | | 401,514 | | | (20,814 | ) |
| Copper price adjustments on settlement | | (5,060 | ) | | 8,098 | | | (13,158 | ) |
| Molybdenum concentrate | | 19,973 | | | 28,862 | | | (8,889 | ) |
| Molybdenum price adjustments on settlement | | 3,752 | | | 2,580 | | | 1,172 | |
| Silver | | 5,456 | | | 5,010 | | | 446 | |
| Total gross revenue | | 404,821 | | | 446,064 | | | (41,243 | ) |
| Less: Treatment and refining costs | | (13,212 | ) | | (12,786 | ) | | (426 | ) |
| Revenue | | 391,609 | | | 433,278 | | | (41,669 | ) |
| | | | | | | | | | |
| (thousands of pounds, unless otherwise noted) | | | | | | | | | |
| Sales of copper in concentrate1 | | 73,120 | | | 75,830 | | | (2,710 | ) |
| Average provisional copper price (US$ per pound) | | 4.01 | | | 4.22 | | | (0.21 | ) |
| Average realized copper price (US$ per pound) | | 3.96 | | | 4.31 | | | (0.35 | ) |
| Average LME copper price (US$ per pound) | | 3.99 | | | 4.23 | | | (0.24 | ) |
| Average exchange rate (CAD/US$) | | 1.30 | | | 1.25 | | | 0.05 | |
1 This amount includes a net smelter payable deduction of approximately 3.5% to derive net payable pounds of copper sold.
The Company reported $391.6 million in total revenue for 2022 year which is the second highest revenue result for the Company to date. Copper revenues for the year ended December 31, 2022 decreased by $20.8 million compared to the prior year, with $14.5 million of the decrease due to lower sales volumes of 2.7 million pounds (75% basis) and $19.8 million of the decrease due to the lower copper price in 2022, partially offset by the $13.5 million favorable impact of a stronger US dollar. Negative provisional price adjustments in 2022 were $5.1 million due to a decreasing copper price environment during the year, compared to a rising copper price trend in the prior year. The majority of the provisional price adjustments during 2022 relate to first half shipments before copper pulled sharply back beginning in mid-June.
Molybdenum revenues for the year ended December 31, 2022 decreased by $8.9 million compared to the prior year, primarily due to lower sales volumes by 652 thousand pounds (75% basis), partially offset by higher average molybdenum prices of US$18.73 per pound, compared to US$15.94 per pound for the same prior period.
Cost of sales
| | | Year ended
December 31, | |
| (Cdn$ in thousands) | | 2022 | | | 2021 | | | Change | |
| Site operating costs | | 269,822 | | | 201,964 | | | 67,858 | |
| Transportation costs | | 22,472 | | | 17,845 | | | 4,627 | |
| Changes in inventories of finished goods | | 7,726 | | | (11,795 | ) | | 19,521 | |
| Changes in inventories of ore stockpiles | | (14,628 | ) | | (5,128 | ) | | (9,500 | ) |
| Production costs | | 285,392 | | | 202,886 | | | 82,506 | |
| Depletion and amortization | | 51,982 | | | 66,587 | | | (14,605 | ) |
| Cost of sales | | 337,374 | | | 269,473 | | | 67,901 | |
| Site operating costs per ton milled* | $ | 11.89 | | $ | 9.21 | | $ | 2.68 | |
Site operating costs for the year ended December 31, 2022 increased by $67.9 million compared to the prior year due to a $27.9 million lower allocation of mining costs to capitalized stripping in the current year. The prior year included waste stripping activity in both the Pollyanna and Gibraltar pits whereas the current year mining was mainly in the Gibraltar pit. There was also a $23.3 million increase in diesel costs and a $16.7 million increase in other costs, such as grinding media and additional repairs and maintenance activities due to timing.
Cost of sales is also impacted by changes in copper concentrate inventories and ore stockpiles. Due to extreme flooding events in southwest BC in the fourth quarter of 2021, there was 6.0 million pounds of additional copper in finished goods at the 2021 year end that was sold in the first quarter of 2022, which contributed to the increase in production costs of $7.7 million for the year ended December 31, 2022. The ore stockpile also increased by 1.6 million tons during the year, which resulted in a decrease in production costs of $14.6 million.
Depletion and amortization for the year ended December 31, 2022 decreased by $14.6 million over the prior year due to increases in the remaining mine life and units of production arising from the Gibraltar reserve update which extended the mine life by an additional 7 years. Furthermore, ore tons that were mined from the Pollyanna pit in the first half of 2021 had a higher depreciation cost per ton compared to the current ore being mined from the Gibraltar pit.
Other operating (income) expenses
| | | Year ended
December 31, | |
| (Cdn$ in thousands) | | 2022 | | | 2021 | | | Change | |
| General and administrative | | 12,056 | | | 16,937 | | | (4,881 | ) |
| Share-based compensation expense | | 3,807 | | | 5,507 | | | (1,700 | ) |
| Realized (gain) loss on derivative instruments | | (13,078 | ) | | 14,041 | | | (27,119 | ) |
| Unrealized gain on derivative instruments | | (3,196 | ) | | (1,033 | ) | | (2,163 | ) |
| Project evaluation (recovery) expenditures | | 543 | | | (408 | ) | | 951 | |
| Other income, net | | (1,758 | ) | | (1,483 | ) | | (275 | ) |
| | | (1,626 | ) | | 33,561 | | | (35,187 | ) |
General and administrative expenses have decreased in the year ended December 31, 2022, compared to the prior year, primarily due to executives that retired in 2021 as part of the Company's executive succession plan.
Share-based compensation expense is comprised of the amortization of share options and performance share units and the expense on deferred share units. Share-based compensation expense decreased for the year ended December 31, 2022, compared to the prior year, primarily due to decreases in the Company's share price during the year and its impact on the valuation of the deferred share units. More information is set out in Note 21 of the December 31, 2022 Financial Statements.
For the year ended December 31, 2022, the Company realized a net gain on derivative instruments of $13.1 million primarily due to the copper collars that settled in-the-money, net of expensing of premiums paid, compared to a net realized loss of $14.0 million for the prior year. The net realized gain for the current year includes $0.5 million of realized loss on fuel call options.
For the year ended December 31, 2022, the net unrealized gain on derivative instruments of $3.2 million relates primarily to the fair value adjustments on the outstanding copper price collars of $4.0 million, partially offset by the unrealized loss on the fuel call options of $0.8 million, compared to a net unrealized gain of $1.0 million in the prior year.
Project evaluation (recovery) expenditures represent costs associated with the New Prosperity project.
Finance expenses and income
| | | Year ended
December 31, | |
| (Cdn$ in thousands) | | 2022 | | | 2021 | | | Change | |
| Interest expense | | 41,825 | | | 38,853 | | | 2,972 | |
| Amortization of financing fees | | 2,523 | | | 2,040 | | | 483 | |
| Finance expense - deferred revenue | | 5,711 | | | 5,549 | | | 162 | |
| Accretion of PER | | 367 | | | 373 | | | (6 | ) |
| Less: interest expense capitalized | | (3,419 | ) | | - | | | (3,419 | ) |
| Finance income | | (1,798 | ) | | (678 | ) | | (1,120 | ) |
| Loss on settlement of long-term debt | | - | | | 5,798 | | | (5,798 | ) |
| Finance expenses, net | | 45,209 | | | 51,935 | | | (6,726 | ) |
Interest expense net for the year ended December 31, 2022 decreased from the prior year period primarily due to the capitalization of certain borrowing costs as Florence project development costs, and partially offset by the impact of foreign exchange on interest accrued on the new senior secured notes. The Canadian dollar weakened against the US dollar by approximately 4% during 2022.
Finance expense on deferred revenue adjustments represents the implicit financing component of the upfront deposit from the silver sales streaming arrangement with Osisko Gold Royalties Ltd. ("Osisko"). Finance income for the year ended December 31, 2022 increased from the prior year period due to the higher interest being earned on the Company's cash balances.
As part of the senior secured notes refinancing completed in February 2021, the Company redeemed its US$250 million senior secured notes on March 3, 2021, which resulted in an accounting loss of $5.8 million, comprised of the write-off of deferred financing costs of $4.0 million and additional interest costs paid over the call period of $1.8 million. The Company also paid a one-time redemption call premium of $6.9 million on the settlement of the 2022 Notes which is disclosed separately from finance expense.
Income tax
| | | Year ended
December 31, | |
| (Cdn$ in thousands) | | 2022 | | | 2021 | | | Change | |
| Current income tax expense | | 892 | | | 3,203 | | | (2,311 | ) |
| Deferred income tax expense | | 5,940 | | | 31,138 | | | (25,198 | ) |
| Income tax expense | | 6,832 | | | 34,341 | | | (27,509 | ) |
| Effective tax rate | | (35.7)% | | | 48.5% | | | (84.2)% | |
| Canadian statutory rate | | 27.0% | | | 27.0% | | | - | |
| B.C. mineral tax rate | | 9.5% | | | 9.5% | | | - | |
Effective tax rate reconciliation
| | | Year ended
December 31, | |
| (Cdn$ in thousands) | | 2022 | | | 2021 | | | Change | |
| Income tax expense (recovery) at | | | | | | | | | |
| Canadian statutory rate of 36.5% | | (6,984 | ) | | 25,840 | | | (32,824 | ) |
| Permanent differences | | 10,136 | | | 13,110 | | | (2,974 | ) |
| Foreign tax rate differential | | 64 | | | 96 | | | (32 | ) |
| Unrecognized tax benefits | | 3,344 | | | (4,714 | ) | | 8,058 | |
| Deferred tax adjustments related to prior periods | | 272 | | | 9 | | | 263 | |
| Income tax expense | | 6,832 | | | 34,341 | | | (27,509 | ) |
The overall income tax expense for the year ended December 31, 2022 was due to deferred income tax expense recognized on income for accounting purposes. The effective tax rate for the year is negative and less than the combined B.C. mineral and income tax rate of 36.5% due to the non-taxability of unrealized foreign exchange losses on revaluation of the senior secured notes and as certain expenses such as finance charges, derivative gains and general and administration costs are not deductible for BC mineral tax purposes.
As foreign exchange revaluations on the senior secured notes are not recognized for tax purposes until realized, and in the case of capital losses, when they are applied, the effective tax rate may be significantly higher or lower than the statutory rates, as is the case for the year ended December 31, 2021 and 2022, relative to net income (loss) for those periods.
The current income tax expense represents an estimate of B.C. mineral taxes payable for the current periods.
FINANCIAL CONDITION REVIEW
Balance sheet review
| | | At December 31, | | | At December 31, | | | | |
| (Cdn$ in thousands) | | 2022 | | | 2021 | | | Change | |
| Cash and equivalents | | 120,858 | | | 236,767 | | | (115,909 | ) |
| Other current assets | | 120,013 | | | 100,460 | | | 19,553 | |
| Property, plant and equipment | | 1,029,240 | | | 837,839 | | | 191,401 | |
| Other assets | | 8,573 | | | 8,129 | | | 444 | |
| Total assets | | 1,278,684 | | | 1,183,195 | | | 95,489 | |
| Current liabilities | | 94,229 | | | 85,172 | | | 9,057 | |
| Debt: | | | | | | | | | |
| Senior secured notes | | 534,118 | | | 497,388 | | | 36,730 | |
| Equipment related financings | | 52,451 | | | 34,361 | | | 18,090 | |
| Deferred revenue | | 47,620 | | | 45,356 | | | 2,264 | |
| Other liabilities | | 193,857 | | | 162,400 | | | 31,457 | |
| Total liabilities | | 922,275 | | | 824,677 | | | 97,598 | |
| Equity | | 356,409 | | | 358,518 | | | (2,109 | ) |
| Net debt (debt minus cash and equivalents) | | 465,711 | | | 294,982 | | | 170,729 | |
| Total common shares outstanding (millions) | | 286.5 | | | 284.9 | | | 1.6 | |
The Company's asset base is comprised principally of property, plant and equipment, reflecting the capital intensive nature of Gibraltar and the mining business. Other current assets primarily include accounts receivable, inventories (concentrate inventories, ore stockpiles, and supplies), prepaid expenses, and marketable securities. Concentrate inventories, accounts receivable and cash balances can fluctuate due to transportation and cash settlement schedules.
Property, plant and equipment increased by $191.4 million in the year ended December 31, 2022, which includes $101.3 million for Florence Copper development costs as well as capital expenditures at Gibraltar (both sustaining and capital projects).
Net debt has increased by $170.7 million in the year ended December 31, 2022, primarily due to investment of cash in the development of Florence Copper and the effect of a weakening Canadian dollar against US dollar net borrowings.
Deferred revenue relates to the advance payments received from Osisko for the sale of Taseko's share of future silver production from Gibraltar.
Other liabilities increased by $31.5 million primarily due to an increase in deferred tax liabilities and the changes in the cost estimates of the provision for environmental rehabilitation for Gibraltar.
As at February 23, 2023, there were 288,345,596 common shares and 10,447,666 stock options outstanding. More information on these instruments and the terms of their exercise is set out in Note 21 of the December 31, 2022 Financial Statements.
Liquidity, cash flow and capital resources
At December 31, 2022, the Company had cash and equivalents of $120.9 million (December 31, 2021 - $236.8 million).
Cash flow provided by operations during year ended December 31, 2022 was $81.3 million compared to $174.8 million for the prior year. The decrease in cash flow provided by operations was due primarily to lower copper sales volumes and copper prices, lower molybdenum sales volume, increased site operating costs and a lower allocation of mining costs to capitalized stripping. Cash flow provided by operations in the current year was also negatively impacted by the timing of working capital items.
Cash used for investing activities during the year ended December 31, 2022 was $166.4 million compared to $147.7 million for prior year. Investing cash flows in the year includes $79.7 million for capital expenditures at Gibraltar (which includes $32.0 million for capitalized stripping costs, $18.1 million for sustaining capital, and $29.6 million for capital projects), $101.3 million of cash expenditures for Florence Copper and $7.3 million for the purchase of copper collars covering production from July 2022 to June 2023. During 2022, the Company received proceeds of $22.5 million from its copper put option contracts that settled in the money.
Net cash used for financing activities for the year ended December 31, 2022 was $35.2 million comprised of interest paid of $39.4 million, principal repayments for equipment loans and leases of $20.2 million, and $1.9 million to settle performance share units that vested in January 2022. Net proceeds from an equipment loan refinancing in December 2022 was $25.6 million. Net cash provided by financing activities for the year ended December 31, 2021 was $125.8 million and included the net proceeds from the issuance of the US$400 million 7% senior secured notes ("2026 Notes") due in February 2026.
Liquidity outlook
The Company has approximately $190 million of available liquidity at December 31, 2022, including a cash balance of $121 million and an undrawn US$50 million revolving credit facility. In February 2023, the Company entered into an agreement to extend the maturity date of the undrawn revolving credit facility by an additional year to July 2026. In addition to the one-year extension, the lender has also agreed to an accordion feature, which will allow the amount of the credit facility to be increased by US$30 million, for a total of US$80 million, subject to credit approval and other conditions.
With a minimum US$3.75 per pound floor price for 72 million pounds of copper production until December 2023, continued stable operating margins and cash flows are expected from Gibraltar in 2023. In addition to ongoing sustaining capital at Gibraltar, the Company has commenced a capital project to relocate the primary crusher for Mill 1 at the Gibraltar mine to a new location which is scheduled to be moved in the third quarter of 2023. The Company intends to develop the commercial facility at Florence Copper once the final UIC permit is received from the EPA which is expected to occur later this year. The Company does not have any significant capital plans for its other development projects over the next 12 months.
In December 2022, the Company signed agreements with Mitsui to form a strategic partnership to develop Florence Copper. Mitsui has committed to an initial investment of US$50 million which is conditional on receipt of the final UIC permit, with proceeds to be used for construction of the commercial production facility. The initial investment will be in the form of a copper stream agreement and Mitsui has the option to invest an additional US$50 million (for a total investment of US$100 million) for a 10% equity interest in Florence Copper.
In January 2023, the Company also secured a commitment for US$25 million from Banc of America Leasing & Capital, LLC to fund costs associated with the SX/EW plant for the Florence Copper commercial production facility.
If needed, the Company could raise additional capital through equity financings or asset sales, including royalties, sales of project interests, or joint ventures or additional credit facilities, including additional notes offerings. The Company evaluates these financing alternatives based on a number of factors including the prevailing metal prices and projected operating cash flow from Gibraltar, relative valuation, liquidity requirements, covenant restrictions and other factors, in order to optimize the Company's cost of capital and maximize shareholder value.
Future changes in copper and molybdenum market prices could also impact the timing and amount of cash available for future investment in the Company's development projects, debt obligations, and other uses of capital. To mitigate commodity price risks in the short-term, copper price options are entered into for a substantial portion of Taseko's share of Gibraltar copper production and the Company has a long track record of doing so (see "Hedging Strategy").
Hedging strategy
The Company generally fixes all or substantially all of the copper prices of its copper concentrate shipments at the time of shipment. Where the customer's offtake contract does not provide a price fixing option, the Company may look to undertake a quotational period hedge directly with a financial institution as the counterparty in order to fix the price of the shipment.
To protect against sudden and unexpected overall copper price volatility in the market, the Company's hedging strategy aims to secure a minimum price for a significant portion of future copper production using copper put options that are either purchased outright or substantially funded by the sale of copper call options that are significantly out of the money. The amount and duration of the copper hedge position is based on an assessment of business-specific risk elements combined with the copper pricing outlook. Copper price and quantity exposure are reviewed regularly to ensure that adequate revenue protection is in place.
Hedge positions are typically extended by adding incremental quarters at established floor prices (i.e. the strike price of the copper put option) to provide the necessary price protection. Considerations for the cost of the hedging program include an assessment of Gibraltar's estimated production costs, copper price trends and the Company's fixed capital requirements during the relevant period. During periods of volatility or step changes in the copper price, the Company may revisit outstanding hedging contracts and determine whether the copper put (floor) or call (ceiling) levels should be adjusted in line with the market while maintaining copper price protection.
From time to time, the Company will look at potential hedging opportunities to mitigate the risk of rising input costs, including foreign exchange and fuel prices where such a strategy is cost effective. Since the onset of the Ukraine war in early 2022, diesel prices have increased dramatically and become more volatile. To protect against a potential operating margin squeeze that could arise from oil and diesel price shocks, the Company purchases diesel call options to provide a price cap for its share of diesel that is used by its mining fleet. Taseko has in place diesel price protection to December 2023 which caps its site landed diesel cost to an estimated $1.75 per litre. The Company will continue to look to extend this protection depending on market conditions.
A summary of the Company's outstanding hedges are shown below:
| Notional amount | Strike price | Term to maturity | Original cost |
At December 31, 2022 | | | | |
Copper collars | 30.0 million lbs | US$3.75 per lb US$4.72 per lb | January to June 2023 | $3.0 million |
Fuel call options | 12.0 million ltrs | US$1.05 per ltr | January to June 2023 | $1.1 million |
| | | | |
Acquired subsequent to December 31, 2022 | | | | |
Copper collars | 42.0 million lbs | US$3.75 per lb US$4.70 per lb | July to December 2023 | No cost collar |
| | | | |
Fuel call options | 12.0 million ltrs | US$1.00 per ltr | July to December 2023 | $0.9 million |
| | | | |
Commitments and contingencies
Commitments
| | | Payments due | | | | |
| (Cdn$ in thousands) | | 2023 | | | 2024 | | | 2025 | | | 2026 | | | 2027 | | | Thereafter | | | Total | |
| Debt: | | | | | | | | | | | | | | | | | | | | | |
| 2026 Notes | | - | | | - | | | - | | | 541,760 | | | - | | | - | | | 541,760 | |
| Interest | | 37,923 | | | 37,923 | | | 37,923 | | | 18,962 | | | - | | | - | | | 132,731 | |
| Equipment loans: | | | | | | | | | | | | | | | | | | | | | |
| Principal | | 8,489 | | | 7,524 | | | 8,220 | | | 8,982 | | | - | | | - | | | 33,215 | |
| Interest | | 2,571 | | | 1,896 | | | 1,200 | | | 438 | | | - | | | - | | | 6,105 | |
| Lease liabilities: | | | | | | | | | | | | | | | | | | | | | |
| Principal | | 7,373 | | | 4,345 | | | 1,544 | | | 1,092 | | | 163 | | | - | | | 14,517 | |
| Interest | | 804 | | | 324 | | | 141 | | | 45 | | | 6 | | | - | | | 1,320 | |
| Lease related obligation: | | | | | | | | | | | | | | | | | | | | | |
| Rental payment | | 5,497 | | | | | | | | | | | | | | | | | | 5,497 | |
| PER 1 | | - | | | - | | | - | | | - | | | - | | | 113,725 | | | 113,725 | |
| Derivative liabilities | | 2,673 | | | - | | | - | | | - | | | - | | | - | | | 2,673 | |
| Capital expenditures | | 12,043 | | | 17 | | | - | | | - | | | - | | | - | | | 12,060 | |
| Other expenditures | | | | | | | | | | | | | | | | | | | | | |
| Transportation related services 2 | | 11,661 | | | 11,661 | | | 4,686 | | | 822 | | | - | | | - | | | 28,830 | |
1 Provision for environmental rehabilitation amounts presented in the table represents the present value of estimated costs of legal and constructive obligations required to retire an asset, including decommissioning and other site restoration activities, primarily for the Gibraltar mine and Florence Copper. As at December 31, 2022, the Company has provided a surety bond of $81.3 million for its 75% share of Gibraltar's reclamation security. For Florence Copper, the Company has provided to the federal and state regulator surety bonds totaling $13.2 million as reclamation security.
2 Transportation related services commitments include ocean freight and port handling services, which are both cancellable upon certain operating circumstances.
The Company has made capital expenditure commitments relating to equipment for the Florence Copper project totaling $9.3 million at December 31, 2022.
The Company has guaranteed 100% of certain equipment loans and leases entered into by Gibraltar in which it holds a 75% interest. As a result, the Company has guaranteed the joint venture partner's 25% share of this debt which amounted to $14.0 million at December 31, 2022.
The Company has also indemnified 100% of the surety bonds issued by the Gibraltar joint venture to the Province of British Columbia. As a result, the Company has indemnified the joint venture partner's 25% share of this obligation, which amounted to $14.6 million at December 31, 2022.
SELECTED ANNUAL INFORMATION
| | | For the years ended December 31, | |
| (Cdn$ in thousands, except per share amounts) | | 2022 | | | 2021 | | | 2020 | |
| Revenues | | 391,609 | | | 433,278 | | | 343,267 | |
| Net income (loss) | | (25,971 | ) | | 36,472 | | | (23,524 | ) |
| Per share - basic | | (0.09 | ) | | 0.13 | | | (0.09 | ) |
| Per share - diluted | | (0.09 | ) | | 0.13 | | | (0.09 | ) |
| | | | | | | | | | |
| | | As at December 31, | |
| | | 2022 | | | 2021 | | | 2020 | |
| Total assets | | 1,278,684 | | | 1,183,195 | | | 910,365 | |
| Total long-term financial liabilities | | 572,037 | | | 518,087 | | | 349,312 | |
FOURTH QUARTER RESULTS
| Consolidated Statements of Comprehensive Income (Loss) | | Three months ended
December 31, | |
| (Cdn$ in thousands, except per share amounts) | | 2022 | | | 2021 | |
| | | | | | | |
| Revenues | | 100,618 | | | 102,972 | |
| Cost of sales | | | | | | |
| Production costs | | (62,965 | ) | | (41,056 | ) |
| Depletion and amortization | | (10,147 | ) | | (16,202 | ) |
| Earnings from mining operations | | 27,506 | | | 45,714 | |
| | | | | | | |
| General and administrative | | (3,795 | ) | | (3,570 | ) |
| Share-based compensation expense | | (1,739 | ) | | (1,033 | ) |
| Project evaluation recovery (expenditures) | | (174 | ) | | 733 | |
| Loss on derivatives | | (18,789 | ) | | (11,033 | ) |
| Other income | | 777 | | | 337 | |
| Income before financing costs and income taxes | | 3,786 | | | 31,148 | |
| | | | | | | |
| Finance expenses, net | | (9,435 | ) | | (11,854 | ) |
| Foreign exchange gain | | 4,596 | | | 1,768 | |
| Income (loss) before income taxes | | (1,053 | ) | | 21,062 | |
| | | | | | | |
| Income tax expense | | (1,222 | ) | | (9,300 | ) |
| Net income (loss) for the period | | (2,275 | ) | | 11,762 | |
| | | | | | | |
| Other comprehensive income (loss): | | | | | | |
| Unrealized gain (loss) on financial assets | | 1,392 | | | 206 | |
| Foreign currency translation reserve | | (3,599 | ) | | (1,024 | ) |
| | | | | | | |
| Total other comprehensive loss for the period | | (2,207 | ) | | (818 | ) |
| | | | | | | |
| Total comprehensive income (loss) for the period | | (4,482 | ) | | 10,944 | |
| | | | | | | |
| Earnings (loss) per share | | | | | | |
| Basic | | (0.01 | ) | | 0.04 | |
| Diluted | | (0.01 | ) | | 0.04 | |
| | | | | | | |
| Weighted-average shares outstanding (in thousands) | | | | | | |
| Basic | | 286,439 | | | 284,167 | |
| Diluted | | 286,439 | | | 288,511 | |
| Consolidated Statements of Cash Flows | | Three months ended
December 31, | |
| (Cdn$ in thousands) | | 2022 | | | 2021 | |
| Operating activities | | | | | | |
| Net income (loss) for the period | | (2,275 | ) | | 11,762 | |
| Adjustments for: | | | | | | |
| Depletion and amortization | | 10,147 | | | 16,202 | |
| Income tax expense | | 1,222 | | | 9,300 | |
| Finance expenses, net | | 9,435 | | | 11,854 | |
| Share-based compensation expense | | 1,794 | | | 1,075 | |
| Loss on derivatives | | 18,789 | | | 11,033 | |
| Unrealized foreign exchange gain | | (5,279 | ) | | (1,817 | ) |
| Amortization of deferred revenue | | (1,597 | ) | | (826 | ) |
| Other operating activities | | (1,060 | ) | | (805 | ) |
| Net change in working capital: | | | | | | |
| Change in inventory | | (20,436 | ) | | (17,761 | ) |
| Change in accounts payable and accrued liabilities | | (10,391 | ) | | (8,876 | ) |
| Change in other working capital items | | (1,295 | ) | | 6,090 | |
| Cash provided by (used for) operating activities | | (946 | ) | | 37,231 | |
| | | | | | | |
| Investing activities | | | | | | |
| Gibraltar capitalized stripping costs | | (3,866 | ) | | (12,737 | ) |
| Gibraltar sustaining capital expenditures | | (669 | ) | | (6,119 | ) |
| Gibraltar capital project expenditures | | (8,346 | ) | | (368 | ) |
| Florence Copper development costs | | (28,857 | ) | | (14,766 | ) |
| Other project development costs | | (321 | ) | | (1,187 | ) |
| Proceeds from copper put options | | 3,941 | | | - | |
| Other investing activities | | 696 | | | 2,312 | |
| Cash used for investing activities | | (37,422 | ) | | (32,865 | ) |
| | | | | | | |
| Financing activities | | | | | | |
| Proceeds from equipment financings | | 31,770 | | | - | |
| Repayment of equipment loans and leases | | (11,848 | ) | | (4,938 | ) |
| Interest paid | | (1,304 | ) | | (788 | ) |
| Other financing fees | | - | | | (1,451 | ) |
| Proceeds from exercise of stock options | | 129 | | | 1,148 | |
| Cash provided by (used for) financing activities | | 18,747 | | | (6,029 | ) |
| Effect of exchange rate changes on cash and equivalents | | (1,569 | ) | | (721 | ) |
| Decrease in cash and equivalents | | (21,190 | ) | | (2,384 | ) |
| Cash and equivalents, beginning of period | | 142,048 | | | 239,151 | |
| Cash and equivalents, end of period | | 120,858 | | | 236,767 | |
Earnings
| | | Three months ended
December 31, | |
| (Cdn$ in thousands) | | 2022 | | | 2021 | | | Change | |
| Net income (loss) | | (2,275 | ) | | 11,762 | | | (14,037 | ) |
| Net unrealized foreign exchange gain | | (5,279 | ) | | (1,817 | ) | | (3,462 | ) |
| Unrealized loss on derivative instruments | | 20,137 | | | 4,612 | | | 15,525 | |
| Estimated tax effect of adjustments | | (5,437 | ) | | (1,245 | ) | | (4,192 | ) |
| Adjusted net income* | | 7,146 | | | 13,312 | | | (6,166 | ) |
The Company's adjusted net income was $7.1 million ($0.02 per share) for the three months ended December 31, 2022, compared to adjusted net income of $13.3 million ($0.05 per share) for the same period in 2021. Earnings in the fourth quarter were impacted by lower copper production, lower average LME copper prices, higher site costs due to the rising input costs such as diesel and a decrease in waste stripping costs being capitalized compared to the same prior period, partially offset by higher copper sales volume. Positively impacting earnings this quarter was net realized gains of $1.3 million from the Company's copper price protection program and $6.1 million less in depletion and amortization compared to the same prior period.
Net loss was $2.3 million ($0.01 loss per share) for the three months ended December 31, 2022 after inclusion of the $4.6 million in unrealized foreign exchange gains on the outstanding senior secured notes due to the weakening US dollar in the quarter and $20.1 million of unrealized loss on derivatives that reversed prior quarter unrealized gains due to the rising copper price in the fourth quarter.
No adjustments are made to adjusted net income (loss) for positive provisional price adjustments in the quarter.
Revenues
| | | Three months ended
December 31, | |
| (Cdn$ in thousands) | | 2022 | | | 2021 | | | Change | |
| Copper contained in concentrate | | 91,075 | | | 95,143 | | | (4,068 | ) |
| Copper price adjustments on settlement | | 290 | | | 396 | | | (106 | ) |
| Molybdenum concentrate | | 7,783 | | | 8,660 | | | (877 | ) |
| Molybdenum price adjustments on settlement | | 3,878 | | | (103 | ) | | 3,981 | |
| Silver | | 1,334 | | | 1,156 | | | 178 | |
| Total gross revenue | | 104,360 | | | 105,252 | | | (892 | ) |
| Less: Treatment and refining costs | | (3,742 | ) | | (2,280 | ) | | (1,462 | ) |
| Revenue | | 100,618 | | | 102,972 | | | (2,354 | ) |
| | | | | | | | | | |
| (thousands of pounds, unless otherwise noted) | | | | | | | | | |
| Sales of copper in concentrate1 | | 18,443 | | | 17,208 | | | 1,235 | |
| Average provisional copper price (US$ per pound) | | 3.66 | | | 4.40 | | | (0.74 | ) |
| Average realized copper price (US$ per pound) | | 3.66 | | | 4.37 | | | (0.71 | ) |
| Average LME copper price (US$ per pound) | | 3.63 | | | 4.40 | | | (0.77 | ) |
| Average exchange rate (CAD/US$) | | 1.36 | | | 1.26 | | | 0.10 | |
1 This amount includes a net smelter payable deduction of approximately 3.5% to derive net payable pounds of copper sold.
Copper revenues for the three months ended December 31, 2022 decreased by $4.1 million compared to the same period in 2021, with $17.4 million due to lower copper prices, partially offset by $6.8 million due to larger sales volumes of 1.3 million pounds (75% basis) and $6.5 million due to the favorable impact of a stronger US dollar in 2022. Positive provisional price adjustments in the current quarter were only $0.3 million attributed to the Company's practice of fixing prices at the time of shipment directly with customers or through quotational period hedges with financial institutions.
Molybdenum revenues for the three months ended December 31, 2022 decreased by $0.9 million compared to the same period in 2021 due primarily to lower sales volumes by 67 thousand pounds (75% basis), partially offset by higher average molybdenum prices of US$21.39 per pound, compared to US$18.89 per pound for the same prior period.
Cost of sales
| | | Three months ended
December 31, | |
| (Cdn$ in thousands) | | 2022 | | | 2021 | | | Change | |
| Site operating costs | | 75,806 | | | 54,921 | | | 20,885 | |
| Transportation costs | | 6,671 | | | 4,436 | | | 2,235 | |
| Changes in inventories of finished goods | | (1,462 | ) | | (13,497 | ) | | 12,035 | |
| Changes in inventories of ore stockpiles | | (18,050 | ) | | (4,804 | ) | | (13,246 | ) |
| Production costs | | 62,965 | | | 41,056 | | | 21,909 | |
| Depletion and amortization | | 10,147 | | | 16,202 | | | (6,055 | ) |
| Cost of sales | | 73,112 | | | 57,258 | | | 15,854 | |
| Site operating costs per ton milled* | $ | 13.88 | | $ | 9.94 | | $ | 3.94 | |
Site operating costs for the three months ended December 31, 2022 increased by $20.9 million compared to the same prior period due to a $8.9 million lower allocation of mining costs to capitalized stripping in the current quarter, a $6.8 million increase in diesel costs and a $5.2 million increase in other costs, some of which was due to timing of repairs and maintenance activities.
Cost of sales is also impacted by changes in copper concentrate inventories and ore stockpiles. During the fourth quarter of 2022, copper in finished goods inventory increased by 1.2 million pounds, which contributed to a decrease in production costs of $1.5 million. Due to extreme flooding events in southwest BC in the fourth quarter of 2021, there was 6.0 million pounds of additional copper in finished goods at the 2021 year end that was sold in the first quarter of 2022. The increase in finished goods last year end contributed to the decrease in production costs of $13.5 million in the fourth quarter of 2021.
In addition, the ore stockpile increasing by 3.8 million tons during the fourth quarter of 2022 coupled with previous write-downs being reversed resulted in a decrease in production costs of $18.1 million. The reversal of previous write-down of ore stockpiles to net realizable value in the second and third quarters of 2022 was due to the increase in copper prices in the fourth quarter.
Depletion and amortization for the three months ended December 31, 2022 decreased by $6.1 million over the same prior period. The decrease was primarily due to increases in the remaining mine life and units of production arising from the Gibraltar reserve update which extended the mine life by an additional 7 years. Furthermore, ore tons that were mined from the Pollyanna pit in the first half of 2021 had a higher depreciation cost per ton compared to the current ore being mined from the Gibraltar pit.
Other operating (income) expenses
| | | Three months ended
December 31, | |
| (Cdn$ in thousands) | | 2022 | | | 2021 | | | Change | |
| General and administrative | | 3,795 | | | 3,570 | | | 225 | |
| Share-based compensation expense | | 1,739 | | | 1,033 | | | 706 | |
| Realized (gain) loss on derivative instruments | | (1,348 | ) | | 6,421 | | | (7,769 | ) |
| Unrealized loss on derivative instruments | | 20,137 | | | 4,612 | | | 15,525 | |
| Project evaluation (recovery) expenditures | | 174 | | | (733 | ) | | 907 | |
| Other income, net | | (777 | ) | | (337 | ) | | (440 | ) |
| | | 23,720 | | | 14,566 | | | 9,154 | |
General and administrative expenses are relatively consistent in the three months ended December 31, 2022, compared to the same prior period.
Share-based compensation expense is comprised of amortization of share options and performance share units and the expense on deferred share units. Share-based compensation expense increased for the three months ended December 31, 2022, compared to the same period in 2021, primarily due to increases in the Company's share price during the period and its impact on the valuation of the deferred share units. More information is set out in Note 21 of the Financial Statements.
For the three months ended December 31, 2022, the Company realized a net gain on derivative instruments of $1.3 million primarily due to the copper collars covering production for the quarter that settled in-the-money, net of expensing of premiums paid, compared to a realized loss of $6.4 million in the fourth quarter of 2021.
For the three months ended December 31, 2022, the net unrealized loss on derivative instruments of $20.1 million relates primarily to the reduction in the fair value of outstanding copper price collars covering the first half of 2023. These hedge positions were significantly in the money in previous quarters as copper prices decreased in June and July. The net unrealized loss on derivatives for the fourth quarter of 2021 was $4.6 million.
Finance expenses and income
| | | Three months ended
December 31, | |
| (Cdn$ in thousands) | | 2022 | | | 2021 | | | Change | |
| Interest expense | | 11,350 | | | 10,137 | | | 1,213 | |
| Amortization of financing fees | | 647 | | | 499 | | | 148 | |
| Finance expense - deferred revenue | | 1,461 | | | 1,373 | | | 88 | |
| Less: interest expense capitalized | | (3,419 | ) | | - | | | (3,419 | ) |
| Accretion of PER | | 92 | | | 63 | | | 29 | |
| Finance income | | (696 | ) | | (218 | ) | | (478 | ) |
| Finance expense, net | | 9,435 | | | 11,854 | | | (2,419 | ) |
Interest expense net for the three months ended December 31, 2022 decreased compared to the prior year period due to the capitalization of certain borrowing costs for Florence Copper development costs, partially offset by the impact of a weaker Canadian dollar on interest accrued on the senior secured notes and the impact of new lease liabilities.
Finance expense on deferred revenue adjustments represents the implicit financing component of the upfront deposit from the silver sales streaming arrangement with Osisko.
Income tax
| | | Three months ended
December 31, | |
| (Cdn$ in thousands) | | 2022 | | | 2021 | | | Change | |
| Current income tax expense | | 680 | | | 908 | | | (228 | ) |
| Deferred income tax expense | | 542 | | | 8,392 | | | (7,850 | ) |
| | | 1,222 | | | 9,300 | | | (8,078 | ) |
| Effective tax rate | | (116.0)% | | | 44.2% | | | (160.2)% | |
| Canadian statutory rate | | 27.0% | | | 27.0% | | | - | |
| B.C. mineral tax rate | | 9.5% | | | 9.5% | | | - | |
Effective tax rate reconciliation
| | | Three months ended
December 31, | |
| (Cdn$ in thousands) | | 2022 | | | 2021 | | | Change | |
| Income tax expense (recovery) at Canadian statutory rate of 36.5% | | (384 | ) | | 7,686 | | | (8,070 | ) |
| Permanent differences | | 1,092 | | | 6,191 | | | (5,099 | ) |
| Foreign tax rate differential | | 20 | | | - | | | 20 | |
| Unrecognized tax benefits | | 72 | | | (4,511 | ) | | 4,583 | |
| Deferred tax adjustments related to prior periods | | 422 | | | (66 | ) | | 488 | |
| Income tax expense | | 1,222 | | | 9,300 | | | (8,078 | ) |
The overall income tax expense for the three months ended December 31, 2022 was due to deferred income tax expense recognized on income for accounting purposes. The effective tax rate for the fourth quarter is negative and less than the combined B.C. mineral and income tax rate of 36.5% as certain expenses such as finance charges, derivative gains and general and administration costs are not deductible for BC mineral tax purposes.
As foreign exchange revaluations on the senior secured notes are not recognized for tax purposes until realized, and in the case of capital losses, when they are applied, the effective tax rate may be significantly higher or lower than the statutory rates, as is the case for the three months ended December 31, 2022 and 2021, relative to net income (loss) for those periods.
Current income taxes represent an estimate of B.C. mineral taxes payable.
Liquidity, cash flow and capital resources
Cash flow used for operations during the three months ended December 31, 2022 was $0.9 million compared to cash flow provided by operations of $37.2 million for the same prior period. The decrease in cash flow provided by operations was due primarily to the change in working capital, which included the increase in finished goods inventory and ore stockpiles and paydown of accounts payable and accrued liabilities in the quarter. Also contributing to the decrease of operating cash flow was the impact of increased site operating costs and lower allocation of mining costs to capitalized stripping in the fourth quarter of 2022.
Cash used for investing activities during the three months ended December 31, 2022 was $37.4 million compared to $32.9 million for the same prior period. Investing cash flows in the fourth quarter includes $12.9 million for capital expenditures at Gibraltar (which includes $3.9 million for capitalized stripping costs, $0.7 million for sustaining capital, and $8.3 million for capital projects), and $28.9 million of cash expenditures for development costs at Florence Copper. During the three month period, the Company received $3.9 million from its copper put option contracts that settled in the money.
Net cash provided by financing activities for the three months ended December 31, 2022 was $18.7 million comprised of net proceeds from the December equipment loan refinancing of $25.6 million, interest paid of $1.3 million and normal principal repayments for equipment loans and leases of $5.6 million.
SUMMARY OF QUARTERLY RESULTS
| 2022 | 2021 |
(Cdn$ in thousands,
except per share amounts) | Q4 | Q3 | Q2 | Q1 | Q4 | Q3 | Q2 | Q1 |
Revenues | 100,618 | 89,714 | 82,944 | 118,333 | 102,972 | 132,563 | 111,002 | 86,741 |
Net income (loss) | (2,275) | (23,517) | (5,274) | 5,095 | 11,762 | 22,485 | 13,442 | (11,217) |
Basic EPS | (0.01) | (0.08) | (0.02) | 0.02 | 0.04 | 0.08 | 0.05 | (0.04) |
Adjusted net income (loss) * | 7,146 | 4,513 | (16,098) | 6,162 | 13,312 | 27,020 | 9,948 | (5,534) |
Adjusted basic EPS * | 0.02 | 0.02 | (0.06) | 0.02 | 0.05 | 0.10 | 0.04 | (0.02) |
Adjusted EBITDA * | 35,181 | 34,031 | 1,684 | 38,139 | 52,988 | 76,291 | 47,732 | 23,722 |
(US$ per pound, except where indicated) |
Provisional copper price | 3.66 | 3.51 | 4.33 | 4.57 | 4.40 | 4.21 | 4.34 | 3.92 |
Realized copper price | 3.66 | 3.48 | 4.08 | 4.59 | 4.37 | 4.26 | 4.48 | 4.09 |
Total operating costs * | 2.75 | 2.72 | 3.47 | 3.13 | 1.94 | 1.57 | 2.02 | 2.23 |
Copper sales (million pounds) | 19.1 | 20.0 | 16.3 | 20.5 | 17.9 | 24.3 | 20.0 | 16.5 |
Financial results for the last eight quarters reflect: volatile copper and molybdenum prices and foreign exchange rates that impact realized sale prices; and variability in the quarterly sales volumes due to copper grades and timing of shipments which impacts revenue recognition.
CRITICAL ACCOUNTING POLICIES AND ESTIMATES
The Company's significant accounting policies are presented in Note 2.4 of the Financial Statements. The preparation of the financial statements in conformity with IFRS requires management to make judgments, estimates and assumptions that affect the application of accounting policies and the reported amounts of assets, liabilities, income and expenses. Actual results may differ from these estimates. Estimates and underlying assumptions are reviewed on an ongoing basis. Revisions to accounting estimates are recognized in the period in which the estimates are revised and in any future periods affected.
In the process of applying the Company's accounting policies, significant areas where judgment is required include the determination of a joint arrangement, determining the timing of transfer of control of inventory for revenue recognition, provisions for environmental rehabilitation, reserve and resource estimation, functional currency, determination of the accounting treatment of the advance payment under the silver purchase and sale agreement reported as deferred revenue, determination of business or asset acquisition treatment, and recovery of other deferred tax assets.
Significant areas of estimation include reserve and resource estimation; asset valuations and the measurement of impairment charges or reversals; valuation of inventories; plant and equipment lives; tax provisions; provisions for environmental rehabilitation; valuation of financial instruments and derivatives; capitalized stripping costs and share-based compensation. Key estimates and assumptions made by management with respect to these areas have been disclosed in the notes to these consolidated financial statements as appropriate.
The accuracy of reserve and resource estimates is a function of the quantity and quality of available data and the assumptions made and judgment used in the engineering and geological interpretation and may be subject to revision based on various factors. Changes in reserve and resource estimates may impact the carrying value of property, plant and equipment; the calculation of depreciation expense; the capitalization of stripping costs incurred during production; and the timing of cash flows related to the provision for environmental rehabilitation.
Changes in forecast prices of commodities, exchange rates, production costs and recovery rates may change the economic status of reserves and resources. Forecast prices of commodities, exchange rates, production costs and recovery rates, and discount rates assumptions, either individually or collectively, may impact the carrying value of derivative financial instruments, inventories, property, plant and equipment, and intangibles, as well as the measurement of impairment charges or reversals.
CHANGE IN ACCOUNTING POLICIES
Several new standards, and amendments to standards and interpretations, are not yet effective for the year ended December 31, 2022, and have not been applied in preparing these consolidated financial statements. None are currently considered by the Company to be significant or likely to have a material impact on future financial statements.
INTERNAL AND DISCLOSURE CONTROLS OVER FINANCIAL REPORTING
The Company's management is responsible for establishing and maintaining adequate internal control over financial reporting (ICFR) and disclosure controls and procedures (DC&P).
The Company's internal control system over financial reporting is designed to provide reasonable assurance to management and the Board of Directors regarding the preparation and fair presentation of published financial statements. Internal control over financial reporting includes those policies and procedures that:
(1) pertain to the maintenance of records that in reasonable detail accurately and fairly reflect the transactions and dispositions of the assets of the Company;
(2) provide reasonable assurance that transactions are recorded as necessary to permit preparation of financial statements in accordance with IFRS, and that receipts and expenditures of the Company are being made only in accordance with authorizations of management and directors of the Company; and
(3) provide reasonable assurance regarding prevention or timely detection of unauthorized acquisition, use or disposition of the Company's assets that could have a material effect on the financial statements.
The Company's internal control system over disclosure controls and procedures is designed to provide reasonable assurance that material information relating to the Company is made known to management and disclosed to others and information required to be disclosed by the Company in its annual filings, interim filings or other reports filed or submitted by us under securities legislation is recorded, processed, summarized and reported within the time periods specified in the securities legislation.
All internal control systems, no matter how well designed, have inherent limitations. Therefore, even those systems determined effective can provide only reasonable assurance with respect to financial reporting and disclosure.
There have been no changes in our internal control over financial reporting and disclosure controls and procedures during the 2022 financial year that have materially affected, or are reasonably likely to materially affect, internal control over financial reporting and disclosure.
The Company's management, under the supervision of the Chief Executive Officer and the Chief Financial Officer, assessed the effectiveness of the Company's internal control over financial reporting as of December 31, 2022. In making this assessment, it used the criteria set forth in the Internal Control-Integrated Framework (2013) issued by the Committee of Sponsoring Organizations of the Treadway Commission (COSO). Based on this assessment, management has concluded that, as of December 31, 2022, the Company's internal control over financial reporting is effective based on those criteria. The Company's certifying officers have evaluated the effectiveness of the ICFR and DC&P at the financial year end and concluded that ICFR and DC&P are effective as at December 31, 2022 based on the evaluation.
FINANCIAL INSTRUMENTS
The Company uses a mixture of cash, long-term debt and shareholders' equity to maintain an efficient capital allocation and ensure adequate liquidity exists to meet the ongoing cash requirements of the business. In the normal course of business, the Company is inherently exposed to financial risks, including market risk, commodity price risk, interest rate risk, currency risk, liquidity risk and credit risk. The Company manages these risks in accordance with its risk management policies. To mitigate some of these inherent business risks, the Company uses commodity derivative instruments that do not qualify for hedge accounting treatment. These non-hedge derivatives are summarized in Note 7 to the Financial Statements. The financial risks and the Company's exposure to these risks, is provided in various tables in Note 25 of the Financial Statements. For a discussion on the methods used to value financial instruments, as well as significant assumptions, refer also to Notes 2 and 25 of the Financial Statements.
Summary of Financial Instruments | Carrying Amount | Associated Risks |
Financial assets | | |
Amortized cost | | |
Cash and equivalents | 120,858 | Interest rate |
Accounts receivable | 13,223 | Credit Market |
Fair value through other comprehensive income (FVOCI) | | |
Marketable securities | 2,568 | Market |
Investment in private companies | 1,200 | Market |
Financial liabilities | | |
Accounts payable and accrued liabilities | 66,716 | Currency |
Senior secured notes | 534,118 | Currency |
Lease liabilities | 15,021 | Interest rate |
Lease related obligations | 5,316 | Interest rate |
Secured equipment loans | 33,039 | Currency Interest rate |
RELATED PARTY TRANSACTIONS
Key management personnel
Key management personnel include the members of the Board of Directors and executive officers of the Company.
The Company contributes to a post-employment defined contribution pension plan on the behalf of certain key management personnel. This retirement compensation arrangement ("RCA Trust") was established to provide benefits to certain executive officers on or after retirement in recognition of their long service. Upon retirement, the participant is entitled to the distribution of the accumulated value of the contributions under the RCA Trust. Obligations for contributions to the defined contribution pension plan are recognized as compensation expense in the periods during which services are rendered by the executive officers.
Certain executive officers are entitled to termination and change in control benefits. In the event of termination without cause, other than a change in control, these executive officers are entitled to an amount ranging from 12-month to 18-months' salary. In the event of a change in control, if a termination without cause or a resignation occurs within 12 months following the change of control, these executive officers are entitled to receive, among other things, an amount ranging from 12-months' to 24-months' salary and accrued bonus, and all stock options held by these individuals will fully vest.
Executive officers and directors also participate in the Company's share option program (refer to Note 21 of the Financial Statements).
Compensation for key management personnel (including all members of the Board of Directors and executive officers) is as follows:
| | | Year ended
December 31, | |
| (Cdn$ in thousands) | | 2022 | | | 2021 | |
| Salaries and benefits | | 7,380 | | | 6,252 | |
| Post-employment benefits | | 730 | | | 1,672 | |
| Share-based compensation expense | | 2,358 | | | 5,011 | |
| | | 10,468 | | | 12,935 | |
Other related parties
Gibraltar Joint Venture
Under the terms of the joint venture operating agreement, Gibraltar pays the Company a management fee for services rendered by the Company as operator of the Gibraltar mine. In addition, the Company pays certain expenses on behalf of Gibraltar and invoices the Gibraltar for these expenses. In 2022, net management fee income for $1,162 (2021: $1,227) and net reimbursable compensation expenses and third party costs of $1,370 (2021: $343) were charged to the joint venture partner.
NON-GAAP PERFORMANCE MEASURES
This document includes certain non-GAAP performance measures that do not have a standardized meaning prescribed by IFRS. These measures may differ from those used by, and may not be comparable to such measures as reported by, other issuers. The Company believes that these measures are commonly used by certain investors, in conjunction with conventional IFRS measures, to enhance their understanding of the Company's performance. These measures have been derived from the Company's financial statements and applied on a consistent basis. The following tables below provide a reconciliation of these non-GAAP measures to the most directly comparable IFRS measure.
Total operating costs and site operating costs, net of by-product credits
Total costs of sales include all costs absorbed into inventory, as well as transportation costs and insurance recoverable. Site operating costs are calculated by removing net changes in inventory, depletion and amortization, insurance recoverable, and transportation costs from cost of sales. Site operating costs, net of by-product credits is calculated by subtracting by-product credits from the site operating costs. Site operating costs, net of by-product credits per pound are calculated by dividing the aggregate of the applicable costs by copper pounds produced. Total operating costs per pound is the sum of site operating costs, net of by-product credits and off-property costs divided by the copper pounds produced. By-product credits are calculated based on actual sales of molybdenum (net of treatment costs) and silver during the period divided by the total pounds of copper produced during the period. These measures are calculated on a consistent basis for the periods presented.
(Cdn$ in thousands, unless otherwise indicated) - 75% basis | 2022 Q4 | 2022 Q3 | 2022 Q2 | 2022 Q1 | 2022 YE |
Cost of sales | 73,112 | 84,204 | 90,992 | 89,066 | 337,374 |
Less: | | | | | |
Depletion and amortization | (10,147) | (13,060) | (15,269) | (13,506) | (51,982) |
Net change in inventories of finished goods | 1,462 | 2,042 | (3,653) | (7,577) | (7,726) |
Net change in inventories of ore stockpiles | 18,050 | 3,050 | (3,463) | (3,009) | 14,628 |
Transportation costs | (6,671) | (6,316) | (4,370) | (5,115) | (22,472) |
Site operating costs | 75,806 | 69,920 | 64,237 | 59,859 | 269,822 |
Less by-product credits: | | | | | |
Molybdenum, net of treatment costs | (11,022) | (4,122) | (3,023) | (3,831) | (21,999) |
Silver, excluding amortization of deferred revenue | 263 | 25 | 36 | 202 | 526 |
Site operating costs, net of by-product credits | 65,047 | 65,823 | 61,250 | 56,230 | 248,349 |
Total copper produced (thousand pounds) | 20,020 | 21,238 | 15,497 | 16,024 | 72,778 |
Total costs per pound produced | 3.25 | 3.10 | 3.95 | 3.51 | 3.41 |
Average exchange rate for the period (CAD/US$) | 1.36 | 1.31 | 1.28 | 1.27 | 1.30 |
Site operating costs, net of by-product credits (US$ per pound) | 2.39 | 2.37 | 3.10 | 2.77 | 2.62 |
Site operating costs, net of by-product credits | 65,047 | 65,823 | 61,250 | 56,230 | 248,349 |
Add off-property costs: | | | | | |
Treatment and refining costs | 3,104 | 3,302 | 2,948 | 2,133 | 11,486 |
Transportation costs | 6,671 | 6,316 | 4,370 | 5,115 | 22,472 |
Total operating costs | 74,822 | 75,441 | 68,568 | 63,478 | 282,307 |
Total operating costs (C1) (US$ per pound) | 2.75 | 2.72 | 3.47 | 3.13 | 2.98 |
(Cdn$ in thousands, unless otherwise indicated) - 75% basis | 2021 Q4 | 2021 Q3 | 2021 Q2 | 2021 Q1 | 2021 YE |
Cost of sales | 57,258 | 65,893 | 74,056 | 72,266 | 269,473 |
Less: | | | | | |
Depletion and amortization | (16,202) | (17,011) | (17,536) | (15,838) | (66,587) |
Net change in inventories of finished goods | 13,497 | 762 | (4,723) | 2,259 | 11,795 |
Net change in inventories of ore stockpiles | 4,804 | 6,291 | 2,259 | (8,226) | 5,128 |
Transportation costs | (4,436) | (5,801) | (4,303) | (3,305) | (17,845) |
Site operating costs | 54,921 | 50,134 | 49,753 | 47,156 | 201,964 |
Less by-product credits: | | | | | |
Molybdenum, net of treatment costs | (7,755) | (8,574) | (6,138) | (5,604) | (28,071) |
Silver, excluding amortization of deferred revenue | (330) | 300 | 64 | (238) | (204) |
Site operating costs, net of by-product credits | 46,836 | 41,860 | 43,679 | 41,314 | 173,689 |
Total copper produced (thousand pounds) | 21,590 | 25,891 | 20,082 | 16,684 | 84,247 |
Total costs per pound produced | 2.17 | 1.62 | 2.18 | 2.48 | 2.06 |
Average exchange rate for the period (CAD/USD) | 1.26 | 1.26 | 1.23 | 1.27 | 1.25 |
Site operating costs, net of by-product credits (US$ per pound) | 1.72 | 1.28 | 1.77 | 1.96 | 1.64 |
Site operating costs, net of by-product credits | 46,836 | 41,860 | 43,679 | 41,314 | 173,689 |
Add off-property costs: | | | | | |
Treatment and refining costs | 1,480 | 3,643 | 1,879 | 2,414 | 9,416 |
Transportation costs | 4,436 | 5,801 | 4,303 | 3,305 | 17,845 |
Total operating costs | 52,752 | 51,304 | 49,861 | 47,033 | 200,950 |
Total operating costs (C1) (US$ per pound) | 1.94 | 1.57 | 2.02 | 2.23 | 1.90 |
Total Site Costs
Total site costs is comprised of the site operating costs charged to cost of sales as well as mining costs capitalized to property, plant and equipment in the period. This measure is intended to capture Taseko's share of the total site operating costs incurred in the quarter at the Gibraltar mine calculated on a consistent basis for the periods presented.
(Cdn$ in thousands, unless otherwise indicated) - 75% basis | 2022 Q4 | 2022 Q3 | 2022 Q2 | 2022 Q1 | 2022 YE |
Site operating costs | 75,806 | 69,920 | 64,237 | 59,859 | 269,822 |
Add: | | | | | |
Capitalized stripping costs | 3,866 | 1,121 | 11,887 | 15,142 | 32,016 |
Total site costs | 79,672 | 71,041 | 76,124 | 75,001 | 301,838 |
(Cdn$ in thousands, unless otherwise indicated) - 75% basis | 2021 Q4 | 2021 Q3 | 2021 Q2 | 2021 Q1 | 2021 YE |
Site operating costs | 54,921 | 50,134 | 49,753 | 47,156 | 201,964 |
Add: | | | | | |
Capitalized stripping costs | 12,737 | 10,882 | 14,794 | 21,452 | 59,865 |
Total site costs | 67,658 | 61,016 | 64,547 | 68,608 | 261,829 |
Adjusted net income (loss)
Adjusted net income (loss) removes the effect of the following transactions from net income as reported under IFRS:
- Unrealized foreign currency gains/losses;
- Unrealized gain/loss on derivatives; and
- Loss on settlement of long-term debt and call premium, including realized foreign exchange gains.
Management believes these transactions do not reflect the underlying operating performance of our core mining business and are not necessarily indicative of future operating results. Furthermore, unrealized gains/losses on derivative instruments, changes in the fair value of financial instruments, and unrealized foreign currency gains/losses are not necessarily reflective of the underlying operating results for the reporting periods presented.
(Cdn$ in thousands, except per share amounts) | 2022 Q4 | 2022 Q3 | 2022 Q2 | 2022 Q1 | 2022 YE |
Net income (loss) | (2,275) | (23,517) | (5,274) | 5,095 | (25,971) |
Unrealized foreign exchange (gain) loss | (5,279) | 28,083 | 11,621 | (4,398) | 30,027 |
Unrealized (gain) loss on derivatives | 20,137 | (72) | (30,747) | 7,486 | (3,196) |
Estimated tax effect of adjustments | (5,437) | 19 | 8,302 | (2,021) | 863 |
Adjusted net income (loss) | 7,146 | 4,513 | (16,098) | 6,162 | 1,723 |
Adjusted EPS | 0.02 | 0.02 | (0.06) | 0.02 | 0.01 |
(Cdn$ in thousands, except per share amounts) | 2021 Q4 | 2021 Q3 | 2021 Q2 | 2021 Q1 | 2021 YE |
Net income (loss) | 11,762 | 22,485 | 13,442 | (11,217) | 36,472 |
Unrealized foreign exchange (gain) loss | (1,817) | 9,511 | (3,764) | 8,798 | 12,728 |
Realized foreign exchange gain on settlement of long-term debt | - | - | - | (13,000) | (13,000) |
Loss on settlement of long-term debt | - | - | - | 5,798 | 5,798 |
Call premium on settlement of long-term debt | - | - | - | 6,941 | 6,941 |
Unrealized (gain) loss on derivatives | 4,612 | (6,817) | 370 | 802 | (1,033) |
Estimated tax effect of adjustments | (1,245) | 1,841 | (100) | (3,657) | (3,161) |
Adjusted net income (loss) | 13,312 | 27,020 | 9,948 | (5,535) | 44,745 |
Adjusted EPS | 0.05 | 0.10 | 0.04 | (0.02) | 0.16 |
Adjusted EBITDA
Adjusted EBITDA is presented as a supplemental measure of the Company's performance and ability to service debt. Adjusted EBITDA is frequently used by securities analysts, investors and other interested parties in the evaluation of companies in the industry, many of which present Adjusted EBITDA when reporting their results. Issuers of "high yield" securities also present Adjusted EBITDA because investors, analysts and rating agencies consider it useful in measuring the ability of those issuers to meet debt service obligations.
Adjusted EBITDA represents net income before interest, income taxes, and depreciation and also eliminates the impact of a number of items that are not considered indicative of ongoing operating performance. Certain items of expense are added and certain items of income are deducted from net income that are not likely to recur or are not indicative of the Company's underlying operating results for the reporting periods presented or for future operating performance and consist of:
- Unrealized foreign exchange gains/losses;
- Unrealized gain/loss on derivatives;
- Loss on settlement of long-term debt (included in finance expenses) and call premium;
- Realized foreign exchange gains on settlement of long-term debt; and
- Amortization of share-based compensation expense.
(Cdn$ in thousands) | 2022 Q4 | 2022 Q3 | 2022 Q2 | 2022 Q1 | 2022 YE |
Net income (loss) | (2,275) | (23,517) | (5,274) | 5,095 | (25,971) |
Add: | | | | | |
Depletion and amortization | 10,147 | 13,060 | 15,269 | 13,506 | 51,982 |
Finance expense | 10,135 | 12,481 | 12,236 | 12,155 | 47,007 |
Finance income | (700) | (650) | (282) | (166) | (1,798) |
Income tax expense | 1,222 | 3,500 | 922 | 1,188 | 6,832 |
Unrealized foreign exchange (gain) loss | (5,279) | 28,083 | 11,621 | (4,398) | 30,027 |
Unrealized (gain) loss on derivatives | 20,137 | (72) | (30,747) | 7,486 | (3,196) |
Amortization of share-based compensation expense | 1,794 | 1,146 | (2,061) | 3,273 | 4,152 |
Adjusted EBITDA | 35,181 | 34,031 | 1,684 | 38,139 | 109,035 |
(Cdn$ in thousands) | 2021 Q4 | 2021 Q3 | 2021 Q2 | 2021 Q1 | 2021 YE |
Net income (loss) | 11,762 | 22,485 | 13,442 | (11,217) | 36,472 |
Add: | | | | | |
Depletion and amortization | 16,202 | 17,011 | 17,536 | 15,838 | 66,587 |
Finance expense (includes loss on settlement of long-term debt
and call premium) | 12,072 | 11,875 | 11,649 | 23,958 | 59,554 |
Finance income | (218) | (201) | (184) | (75) | (678) |
Income tax (recovery) expense | 9,300 | 22,310 | 7,033 | (4,302) | 34,341 |
Unrealized foreign exchange (gain) loss | (1,817) | 9,511 | (3,764) | 8,798 | 12,728 |
Realized foreign exchange gain on settlement of long-term debt | - | - | - | (13,000) | (13,000) |
Unrealized (gain) loss on derivatives | 4,612 | (6,817) | 370 | 802 | (1,033) |
Amortization of share-based compensation expense | 1,075 | 117 | 1,650 | 2,920 | 5,762 |
Adjusted EBITDA | 52,988 | 76,291 | 47,732 | 23,722 | 200,733 |
Earnings from mining operations before depletion and amortization
Earnings from mining operations before depletion and amortization is earnings from mining operations with depletion and amortization added back. The Company discloses this measure, which has been derived from our financial statements and applied on a consistent basis, to provide assistance in understanding the results of the Company's operations and financial position and it is meant to provide further information about the financial results to investors.
(Cdn$ in thousands) | 2022 Q4 | 2022 Q3 | 2022 Q2 | 2022 Q1 | 2022 YE |
Earnings (loss) from mining operations | 27,506 | 5,510 | (8,048) | 29,267 | 54,235 |
Add: | | | | | |
Depletion and amortization | 10,147 | 13,060 | 15,269 | 13,506 | 51,982 |
Earnings from mining operations before depletion and amortization | 37,653 | 18,570 | 7,221 | 42,773 | 106,217 |
(Cdn$ in thousands) | 2021 Q4 | 2021 Q3 | 2021 Q2 | 2021 Q1 | 2021 YE |
Earnings from mining operations | 45,714 | 66,670 | 36,946 | 14,475 | 163,805 |
Add: | | | | | |
Depletion and amortization | 16,202 | 17,011 | 17,536 | 15,838 | 66,587 |
Earnings from mining operations before depletion and amortization | 61,916 | 83,681 | 54,482 | 30,313 | 230,392 |
Site operating costs per ton milled
The Company discloses this measure, which has been derived from our financial statements and applied on a consistent basis, to provide assistance in understanding the Company's site operations on a tons milled basis.
(Cdn$ in thousands, except per ton milled amounts) | 2022 Q4 | 2022 Q3 | 2022 Q2 | 2022 Q1 | 2022 YE |
Site operating costs (included in cost of sales) | 75,806 | 69,920 | 64,237 | 59,859 | 269,822 |
| | | | | |
Tons milled (thousands) (75% basis) | 5,462 | 6,172 | 5,774 | 5,285 | 22,692 |
Site operating costs per ton milled | $13.88 | $11.33 | $11.13 | $11.33 | $11.89 |
(Cdn$ in thousands, except per ton milled amounts) | 2021 Q4 | 2021 Q3 | 2021 Q2 | 2021 Q1 | 2021 YE |
Site operating costs (included in cost of sales) | 54,921 | 50,134 | 49,753 | 47,156 | 201,964 |
| | | | | |
Tons milled (thousands) (75% basis) | 5,523 | 5,576 | 5,429 | 5,402 | 21,930 |
Site operating costs per ton milled | $9.94 | $8.99 | $9.16 | $8.73 | $9.21 |