This management discussion and analysis ("MD&A") is intended to help the reader understand Taseko Mines Limited ("Taseko", "we", "our" or the "Company"), our operations, financial performance, and current and future business environment. This MD&A is intended to supplement and complement the consolidated financial statements and notes thereto, prepared in compliance with International Financial Reporting Standards ("IFRS") as issued by the International Accounting Standards Board ("IASB") for the year ended December 31, 2024 (the "Financial Statements"). You are encouraged to review the Financial Statements in conjunction with your review of this MD&A and the Company's other public filings, which are available on the Canadian Securities Administrators' website at www.sedarplus.com and on the EDGAR section of the United States Securities and Exchange Commission's ("SEC") website at www.sec.gov.
This MD&A is prepared as of February 19, 2025. All dollar figures stated herein are expressed in Canadian dollars, unless otherwise specified. Included throughout this MD&A are references to non-GAAP performance measures which are denoted with an asterisk and further explanation including their calculations are provided on page 41.
Cautionary Statement on Forward-Looking Information
This discussion includes certain statements that may be deemed "forward-looking statements". All statements in this discussion, other than statements of historical facts, that address future production, reserve potential, exploration drilling, exploitation activities, and events or developments that the Company expects are forward-looking statements. Although we believe the expectations expressed in such forward-looking statements are based on reasonable assumptions, such statements are not guarantees of future performance and actual results or developments may differ materially from those in the forward-looking statements. Factors that could cause actual results to differ materially from those in forward-looking statements include market prices, exploitation and exploration successes, continued availability of capital and financing and general economic, market or business conditions. Investors are cautioned that any such statements are not guarantees of future performance and actual results or developments may differ materially from those projected in the forward-looking statements. All of the forward-looking statements made in this MD&A are qualified by these cautionary statements. We disclaim any intention or obligation to update or revise any forward-looking statements whether as a result of new information, future events or otherwise, except to the extent required by applicable law. Further information concerning risks and uncertainties associated with these forward-looking statements and our business may be found in the Company's other public filings with the SEC and Canadian provincial securities regulatory authorities.
Contents
Overview
Taseko is a copper focused mining company that seeks to create long-term shareholder value by acquiring, developing, and operating large tonnage mineral deposits in stable jurisdictions which are capable of supporting a mine for decades. The Company's principal assets are the 100% owned Gibraltar mine ("Gibraltar"), which is located in central British Columbia and one of the largest copper mines in North America, and the Florence Copper project ("Florence Copper") in Arizona, which is currently under construction. Taseko also owns the Yellowhead copper, New Prosperity gold-copper, and Aley niobium projects in British Columbia.
Highlights
| Operating Data (Gibraltar - 100% basis) | | Three months ended
December 31, | | | Year ended
December 31, | |
| | | 2024 | | | 2023 | | | Change | | | 2024 | | | 2023 | Change | |
| Tons mined (millions) | | 24.0 | | | 24.1 | | | (0.1 | ) | | 88.3 | | | 88.1 | | | 0.2 | |
| Tons milled (millions) | | 8.3 | | | 7.6 | | | 0.7 | | | 29.3 | | | 30.0 | | | (0.7 | ) |
| Production (million pounds Cu) | | 28.6 | | | 34.2 | | | (5.6 | ) | | 105.6 | | | 122.6 | | | (17.0 | ) |
| Sales (million pounds Cu) | | 27.4 | | | 35.9 | | | (8.5 | ) | | 108.0 | | | 120.7 | | | (12.7 | ) |
| Financial Data | | Three months ended
December 31, | | | Year ended
December 31, | |
| (Cdn$ thousands, except per share amounts) | | 2024 | | | 2023 | | | Change | | | 2024 | | | 2023 | | | Change | |
| Revenues | | 167,799 | | | 153,694 | | | 14,105 | | | 608,093 | | | 524,972 | | | 83,121 | |
| Cash flows from operations | | 73,292 | | | 62,835 | | | 10,457 | | | 232,615 | | | 151,092 | | | 81,523 | |
| Net (loss) income | | (21,207 | ) | | 38,076 | | | (59,283 | ) | | (13,444 | ) | | 82,726 | | | (96,170 | ) |
| Per share - basic ("EPS") | | (0.07 | ) | | 0.13 | | | (0.20 | ) | | (0.05 | ) | | 0.29 | | | (0.34 | ) |
| Earnings from mining operations beforedepletion, amortization and non-recurring items* | | 59,405 | | | 73,106 | | | (13,701 | ) | | 243,646 | | | 207,354 | | | 36,292 | |
| Adjusted EBITDA* | | 55,602 | | | 69,107 | | | (13,505 | ) | | 223,991 | | | 190,079 | | | 33,912 | |
| Adjusted net income* | | 10,468 | | | 24,061 | | | (13,593 | ) | | 56,927 | | | 44,431 | | | 12,496 | |
| Per share - basic ("Adjusted EPS")* | | 0.03 | | | 0.08 | | | (0.05 | ) | | 0.19 | | | 0.15 | | | 0.04 | |
Effective as of March 25, 2024, the Company increased its ownership in Gibraltar from 87.5% to 100%. As a result, the financial results reported in this MD&A include 100% of Gibraltar's income and expenses for the period March 25, 2024, to December 31, 2024 (87.5% for the period March 16, 2023 to March 24, 2024, and 75% prior to March 15, 2023).
The Company finalized the accounting for the acquisition of the remaining 50% interest in Cariboo from Dowa Metals & Mining Co., Ltd. ("Dowa") and Furukawa Co., Ltd. ("Furukawa") and the related 12.5% interest in Gibraltar in the fourth quarter of 2024. For more information on the Company's acquisition of Cariboo, please refer to the Financial Statements - Note 3.
Highlights (Continued)
2024 Annual Review
Earnings from mining operations before depletion, amortization and non-recurring items* for the year was $243.6 million, Adjusted EBITDA* was $224.0 million, and cash flow from operations was $232.6 million;
GAAP net loss for the year totalled $13.4 million ($0.05 loss per share) and Adjusted net income* was $56.9 million ($0.19 per share);
Total operating costs (C1)* for the year were US$2.66 per pound produced and the average realized copper price was US$4.17 per pound;
The Gibraltar mine produced 105.6 million pounds of copper and 1.4 million pounds of molybdenum in 2024. Copper head grades were 0.23% and mill recoveries averaged 78.5% for the year;
Gibraltar sold 108.0 million pounds of copper for the year (100% basis), resulting in $608.1 million of revenue to Taseko;
In January 2024, the Company commenced construction of the commercial production facility at its wholly-owned Florence Copper project. Construction activities are advancing on schedule and the project is approximately 56% complete at year end. First copper is expected to be produced in the fourth quarter of 2025;
In March 2024, Taseko acquired the remaining 12.5% interest in Gibraltar, increasing its effective interest in the mine from 87.5% to 100%. An initial payment of $5 million was paid on closing with remaining consideration to be paid in annual instalments commencing in March 2026, with payments based on the average LME copper price subject to a cap tied to a percentage of Gibraltar's cashflow; and
In April 2024, the Company completed an offering of US$500 million aggregate principal amount of 8.25% Senior Secured Notes due 2030. A portion of the proceeds was used to redeem the outstanding US$400 million Senior Secured Notes due 2026 and pay related transaction costs with the remaining proceeds available for capital expenditures, working capital, and general corporate purposes.
Highlights (Continued)
Fourth Quarter Review
Fourth quarter earnings from mining operations before depletion, amortization and non-recurring items* was $59.4 million, Adjusted EBITDA* was $55.6 million, and cash flow from operations was $73.3 million;
GAAP net loss for the quarter totalled $21.2 million ($0.07 loss per share) and Adjusted net income* was $10.5 million ($0.03 per share);
Gibraltar produced 28.6 million pounds of copper for the quarter. Average head grades were 0.22% and copper recoveries were 78.2% for the quarter;
Gibraltar sold 27.4 million pounds of copper in the quarter (100% basis) at an average realized copper price of US$4.13 per pound;
Total operating costs (C1)* for the quarter were US$2.42 per pound produced;
At Florence, seventeen production wells were constructed in the quarter, bringing the total completed wells to 51 out of the 90 planned. Development of the main pipe corridor from the wellfield to the processing plant are mostly completed. Electrical, mechanical and piping installations are underway for the solvent extraction and electrowinning ("SX/EW") plant and other site infrastructure;
In November 2024, the Company entered into an amendment to its revolving credit facility, extending the maturity date to November 2027, and increasing the facility amount to US$110 million from US$80 million. No amounts are currently drawn against the revolving credit facility;
In December 2024, the Company closed a transaction with Osisko Gold Royalties, amending the Gibraltar silver stream agreement and increasing the attributable silver percentage from 87.5% to 100% in exchange for an additional cash payment of US$12.7 million; and
The Company had a cash balance of $173 million and approximately $331 million of available liquidity at December 31, 2024 including its undrawn corporate credit facility.
Review of Operations
Gibraltar mine
| Operating data (100% basis) | | Q4
2024 | | | Q3
2024 | | | Q2
2024 | | | Q1
2024 | | | Q4
2023 | | | | YE
2024 | | | YE
2023 | |
| Tons mined (millions) | | 23.9 | | | 23.2 | | | 18.4 | | | 22.8 | | | 24.1 | | | | 88.3 | | | 88.1 | |
| Tons milled (millions) | | 8.3 | | | 7.6 | | | 5.7 | | | 7.7 | | | 7.6 | | | | 29.3 | | | 30.0 | |
| Strip ratio | | 1.9 | | | 1.2 | | | 1.6 | | | 1.7 | | | 1.5 | | | | 1.6 | | | 1.3 | |
| Site operating cost per ton milled (Cdn$)* | $ | 12.18 | | $ | 14.23 | | $ | 13.93 | | $ | 11.73 | | $ | 9.72 | | | $ | 12.93 | | $ | 12.16 | |
| Copper concentrate | | | | | | | | | | | | | | | | | | | | | | |
| Head grade (%) | | 0.22 | | | 0.23 | | | 0.23 | | | 0.24 | | | 0.27 | | | | 0.23 | | | 0.25 | |
| Copper recovery (%) | | 78.2 | | | 78.9 | | | 77.7 | | | 79.0 | | | 82.2 | | | | 78.5 | | | 82.6 | |
| Production (million pounds Cu) | | 28.6 | | | 27.1 | | | 20.2 | | | 29.7 | | | 34.2 | | | | 105.6 | | | 122.6 | |
| Sales (million pounds Cu) | | 27.4 | | | 26.3 | | | 22.6 | | | 31.7 | | | 35.9 | | | | 108.0 | | | 120.7 | |
| Inventory (million pounds Cu) | | 4.1 | | | 2.9 | | | 2.3 | | | 4.9 | | | 6.9 | | | | 4.1 | | | 6.9 | |
| Molybdenum concentrate | | | | | | | | | | | | | | | | | | | | | | |
| Production (thousand pounds Mo) | | 578 | | | 421 | | | 185 | | | 247 | | | 369 | | | | 1,432 | | | 1,202 | |
| Sales (thousand pounds Mo) | | 607 | | | 348 | | | 221 | | | 258 | | | 364 | | | | 1,434 | | | 1,190 | |
| Per unit data (US$ per pound produced)* | | | | | | | | | | | | | | | | | | | | | | |
| Site operating costs* | $ | 2.52 | | $ | 2.91 | | $ | 2.88 | | $ | 2.21 | | $ | 1.59 | | | $ | 2.61 | | $ | 2.19 | |
| By-product credits* | | (0.42 | ) | | (0.25 | ) | | (0.26 | ) | | (0.17 | ) | | (0.13 | ) | | | (0.28 | ) | | (0.20 | ) |
Site operating costs, net of by-product
credits* | $ | 2.10 | | $ | 2.66 | | $ | 2.62 | | $ | 2.04 | | $ | 1.46 | | | $ | 2.33 | | $ | 1.99 | |
| Off-property costs | | 0.32 | | | 0.26 | | | 0.37 | | | 0.42 | | | 0.45 | | | | 0.33 | | | 0.38 | |
| Total operating costs (C1)* | $ | 2.42 | | $ | 2.92 | | $ | 2.99 | | $ | 2.46 | | $ | 1.91 | | | $ | 2.66 | | $ | 2.37 | |
Operations Analysis
Full Year Results
Gibraltar produced 105.6 million pounds of copper for the year compared to 122.6 million pounds of copper in 2023 with lower mill running time being the primary factor for the decreased production.
Both concentrators were down for 18 days in June when the unionized workforce went on strike. The strike overlapped with planned downtime in Concentrator #1 for its primary crusher move as well as major maintenance on its SAG, which extended the downtime to approximately seven weeks. Concentrator #2 was also down in January 2024 for a planned major component replacement on its ball mill. The reduced operating hours in 2024 resulted in approximately 15 million fewer copper pounds being produced compared to normal milling rates at similar grades and recoveries.
A total of 88.3 million tons were mined in the year consistent with the 88.1 million tons mined in 2023. The strip ratio increased to 1.6 from 1.3 as mining operations transitioned into the Connector pit in 2024. The Gibraltar pit, which was the main source of ore in 2023, had a lower strip ratio. Ore stockpiles also increased by 5.0 million tons in 2024, comprised primarily of oxide ore from the upper benches of the Connector pit. The oxide ore stockpiled will allow the restart of the Gibraltar SX/EW plant in the second quarter of 2025.
Total site costs* at Gibraltar of $413.9 million (100% basis) were $16.9 million lower than 2023 due to lower input costs such as diesel and the impact of the 18-day labour strike in June 2024 which reduced site operating costs in the second quarter of 2024.
Transportation costs for the year ended December 31, 2024 increased by $5.4 million over the same prior period, due to higher costs for rail, ocean freight and port handling costs, and trucking related costs.
Molybdenum production was 1.4 million pounds in the year compared to 1.2 million pounds in the prior year. Molybdenum prices weakened in 2024 with an average molybdenum price of US$21.30 per pound, a decrease of 12% compared to the 2023 average price of US$24.19 per pound.
Off-property costs per pound produced* were US$0.33 for the year, which is US$0.05 lower than the prior year primarily due to a decrease in realized treatment and refining charges (TC/RC) rates due to the tightening smelter market.
Operations Analysis (Continued)
Total operating costs per pound produced (C1)* was US$2.66 for the year, compared to US$2.37 in the prior year and the increase was substantially attributed to lower production and less capitalized stripping costs as shown in the bridge graph below:

Fourth Quarter Results
Gibraltar produced 28.6 million pounds of copper in the quarter. Copper head grades were 0.22% and copper recoveries in the fourth quarter were 78%, in line with recent quarters. Mill throughput was 8.3 million tons, consistently above nameplate capacity throughout the quarter and benefitting from the softer characteristics of the ore feed.
A total of 24.0 million tons were mined in the fourth quarter at an average strip ratio of 1.9 and the majority of ore and waste mining occurred in the Connector pit.
Total site costs* at Gibraltar of $102.5 million (100% basis) were lower than the third quarter of 2024, with the prior quarter including repairs and maintenance costs associated with a large maintenance project on one of the shovels.
Molybdenum production was 578 thousand pounds in the fourth quarter. The 57% increase in quarter-over-quarter production is primarily due to higher molybdenum grade in the Connector pit ore. At an average molybdenum price of US$21.71 per pound, molybdenum generated a meaningful by-product credit per pound of copper produced of US$0.42 in the fourth quarter.
Off-property costs per pound produced* were US$0.32 for the fourth quarter, in line with average costs for the year.
Gibraltar Outlook
With the major project and related mill maintenance work completed in 2024, increased mill availability and higher throughput is expected to be the primary driver of improved copper production in 2025. Refurbishment of Gibraltar's SX/EW plant, which has been idle since 2015, is underway and the plant is expected to start producing copper cathode in the second quarter. Total copper production for the year is expected to be in the range of 120 to 130 million pounds.
Mining activities have transitioned to the Connector pit, which will be the main source of mill feed going forward. A new pushback in the Connector pit has been initiated in early 2025 resulting in a higher strip ratio in the first quarter. Lower grade ore stockpiles will be utilized to supplement mined ore during this period, and as a result 2025 copper production will be weighted to the second half of the year.
Molybdenum production is forecast to increase in 2025 as molybdenum head grades are expected to be notably higher in the Connector pit ore compared to the Gibraltar pit ore.
The Company has previously entered into offtake contracts for Gibraltar concentrate production in 2025 and 2026, which will result in significantly lower treatment and refining costs ("TC/RCs"). In 2024, TC/RCs accounted for approximately US$0.09 per pound of off-property costs, and with the new offtake contracts, the Company expects average TC/RCs to reduce to zero in 2025 and 2026.
The Company benefits from a strengthening of the US dollar relative to the Canadian dollar as our sales contracts are priced in US dollars whereas our Gibraltar mine costs are primarily incurred in Canadian dollars.
The Company also has a prudent hedging program in place to protect a minimum copper price during the Florence construction period. Currently, the Company has copper collar contracts that secure a minimum copper price of US$4.00 per pound for 108 million pounds of copper for 2025. The copper collar contracts also have ceiling prices between US$5.00 and US$5.40 per pound (refer to the section "Hedging Strategy" for details).
Florence Copper
The Company has all the key permits in place for the commercial production facility at Florence Copper and construction of the Florence Copper commercial production facility continues to advance on schedule. Nearly 450,000 project hours have been worked with no reportable injuries or environmental incidents. The Company has a fixed-price contract with the general contractor for construction of the SX/EW plant and associated surface infrastructure.
A total of 51 production wells out of a total of 90 new wells had been completed as of December 31, 2024. Process ponds and surface water runoff pond construction are complete, and development of the main pipe corridor is substantially complete with the installation of high density polyethylene piping in the corridor ongoing. Mechanical and piping installations are underway throughout the SX/EW plant, erection of structural steel for solvent extraction pipe rack is nearing completion, and the electrical work has commenced.
Florence Copper (Continued)
Florence Copper Quarterly Capital Spend
| | | Three months ended | | | Year ended | |
| (US$ in thousands) | | December 31, 2024 | | | December 31, 2024 | |
| Site and PTF operations | | 6,007 | | | 19,512 | |
| Commercial facility construction costs | | 57,647 | | | 154,970 | |
| Other capital costs | | - | | | 28,943 | |
| Total Florence project expenditures | | 63,654 | | | 203,425 | |
Construction costs in the fourth quarter were US$57.6 million, and US$155.0 million has been incurred for the year ended December 31, 2024. Other capital costs of US$28.9 million include final payments for delivery of long-lead equipment that was ordered in 2022, and the construction of an evaporation pond to provide additional water management flexibility. Construction of this evaporation pond was completed in the third quarter of 2024.
The Company has closed several Florence project level financings to fund initial commercial facility construction costs. In October the Company received the fourth deposit of US$10 million from the US$50 million copper stream transaction with Mitsui & Co. (U.S.A.) Inc. ("Mitsui"). The final deposit of US$10 million was received in January 2025.
Remaining project construction costs are expected to be funded with the Company's available liquidity and cashflow from its 100% ownership interest in Gibraltar. The Company also has in place an undrawn corporate revolving credit facility for US$110 million.
The Company has a technical report entitled "NI 43-101 Technical Report Florence Copper Project, Pinal County, Arizona" dated March 30, 2023 (the "2023 Technical Report") on SEDAR+. The 2023 Technical Report was prepared in accordance with NI 43-101 and incorporated the results of testwork from the Production Test Facility ("PTF") as well as updated capital and operating costs (Q3 2022 basis) for the commercial production facility.
Project highlights based on the 2023 Technical Report:
• Net present value of US$930 million (at $US 3.75 copper price, 8% after-tax discount rate)
• Internal rate of return of 47% (after-tax)
• Payback period of 2.6 years
• Operating costs (C1) of US$1.11 per pound of copper
• Annual production capacity of 85 million pounds of LME grade A cathode copper
• 22 year mine life
• Total life of mine production of 1.5 billion pounds of copper
• Remaining initial capital cost of US$232 million (Q3 2022 basis)
Based on the 2023 Technical report, the estimated remaining construction costs for the commercial facility were US$232 million (basis Q3 2022), and management expects that total costs will be within 10% to 15% of that estimate. Florence Copper remains on track for first copper production in late 2025.
Long-term Growth Strategy
Taseko's strategy has been to grow the Company by acquiring and developing a pipeline of projects focused on copper in North America. We continue to believe this will generate long-term returns for shareholders. Our other development projects are located in British Columbia, Canada.
Yellowhead Copper Project
The Yellowhead Project ("Yellowhead") is expected to produce 4.4 billion pounds of copper over a 25-year mine life at an average C1* cost, net of by-product credit, of US$1.67 per pound. During the first 5 years of operation, Yellowhead will produce an average of 200 million pounds of copper per year at an average C1* cost, net of by-product credit, of US$1.43 per pound. The Yellowhead project also contains valuable precious metal by-products with 440,000 ounces of gold and 19 million ounces of silver production over the life of mine.
The economic analysis in the 2020 Technical Report was prepared using long-term copper price of US$3.10 per pound, a gold price of US$1,350 per ounce, and silver price of US$18 per ounce. This report entitled "Technical Report on the Mineral Reserve Update at the Yellowhead Copper Project, British Columbia, Canada" was published on January 16, 2020, under the supervision of Richard Weymark, P. Eng., MBA, Vice President, Engineering for Taseko and a Qualified Person as defined by NI 43-101. Taseko plans to publish a new technical report in 2025 using updated long-term metal price assumptions, updated project costing, and incorporating the new Canadian tax credits available for copper mine development.
The Company is ready to enter the environmental assessment process and plans to submit an Initial Project Description to formally commence this process with the regulators in the second quarter this year. The Company is also focusing discussions with the regulators on developing a workplan to streamline the overall permitting process. Taseko opened a project office in 2024 to support ongoing engagement with local communities including First Nations.
New Prosperity Gold-Copper Project
In late 2019, the Tŝilhqot'in Nation, as represented by Tŝilhqot'in National Government, and Taseko Mines Limited entered into a confidential dialogue, with the involvement of the Province of British Columbia, seeking a long-term resolution of the conflict regarding Taseko's proposed copper-gold mine previously known as New Prosperity, acknowledging Taseko's commercial interests and the Tŝilhqot'in Nation's opposition to the project.
This dialogue has been supported by the parties' agreement, beginning December 2019, to a series of standstill agreements on certain outstanding litigation and regulatory matters relating to Taseko's tenures and the area in the vicinity of Teztan Biny (Fish Lake).
The dialogue process has made meaningful progress in recent months and is close to completion. The Tŝilhqot'in Nation and Taseko acknowledge the constructive nature of discussions, and the opportunity to conclude a long-term and mutually acceptable resolution of the conflict that also makes an important contribution to the goals of reconciliation in Canada.
Aley Niobium Project
The converter pilot test is ongoing to provide additional process data to support the design of commercial process facilities and final product samples to support product marketing initiatives. The Company has also initiated a scoping study to investigate the potential production of niobium oxide at Aley to supply the growing market for niobium-based batteries.
Sustainability
The safety, health and well-being of our workers and their families is of key importance to Taseko. Taseko places a high priority on the continuous improvement of performance in the areas of employee health and safety at the workplace and protection of the environment.
Our annual Sustainability report is available on the Company's website at www.tasekomines.com/esg/overview.
Taseko recognizes that responsible environmental management is critical to our success and has committed that it will:
- Consider the environmental impacts of its operations and take appropriate steps to prevent environmental pollution;
- Comply with relevant environmental legislation, regulations and corporate requirements;
- Integrate environmental policies, programs and practices into all activities;
- Ensure that all employees and service providers understand their environmental responsibilities and encourage dialogue on environmental issues;
- Develop, maintain and test emergency preparedness plans to ensure protection of the environment, employees and the public;
- Work with government and the public to develop effective and efficient measures to improve protection of the environment, based on sound science; and
- Maintain an environmental committee to review environmental performance, objectives and targets, and to ensure continued recognition of environmental issues as a high priority.
The same priority on health, safety, and environmental performance, as well as the methods and culture at Gibraltar are being implemented at Florence Copper as it advances commences construction and nears commercial production later this year.
We received a rating of 'BBB' from MSCI.
Taseko's 2024 Sustainability report will be published in the second quarter of 2025.
Market Review
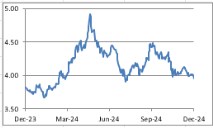
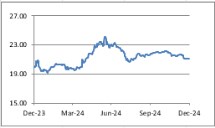
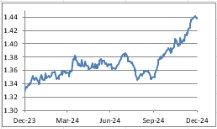
Prices (USD per pound for Commodities)
(Source Data: Bank of Canada, Platts Metals, and London Metals Exchange)
Copper prices are currently around US$4.22 per pound, compared to US$3.95 per pound at December 31, 2024.
Market Review (Continued)
Copper prices have recovered in recent weeks due to tariff threats and the start of potential trade wars including potential tariffs on copper by the US. The US copper market has seen significant stockpiling, with a significant premium on the Comex price compared to the LME price. Tight supply conditions are expected to continue due to few available sources of new primary copper supply capacity and growing demand trends primarily for electrification, energy transition, and overall industrial activity. Smelter treatment and refining charges remain historically low, including spot rates at negative (premium) rates. Such conditions indicate a shortfall of concentrate supply and potential shortages of copper metal could continue which could lead to higher copper prices further into 2025.
Electrification of transportation and the focus on government investment in construction and infrastructure including initiatives focused on the renewable energy and electrification, are inherently copper intensive and supports higher copper prices in the longer term. These factors continue to provide unprecedented catalysts for higher copper prices in the future as new mine supply lags growth in copper demand.
Approximately 7% of the Company's revenue is made up of molybdenum sales and Connector pit ore will provide higher moly grades in the coming years. During the fourth quarter of 2024, the average molybdenum price was US$21.71 per pound. Molybdenum prices are currently around US$20.52 per pound. The Company's sales agreements specify molybdenum pricing based on the published Platts Metals reports.
Approximately 80% of Gibraltar's costs are Canadian dollar denominated and therefore, fluctuations in the Canadian/US dollar exchange rate can have a significant effect on the Company's financial results.
Financial Performance
Earnings
| | | Year ended
December 31, | |
| (Cdn$ in thousands) | | 2024 | | | 2023 | | | Change | |
| Net (loss) income | | (13,444) | | | 82,726 | | | (96,170) | |
| Unrealized foreign exchange loss (gain) | | 52,299 | | | (11,875) | | | 64,174 | |
| Unrealized (gain) loss on derivatives | | (10,141) | | | 1,874 | | | (12,015) | |
| Crusher relocation costs | | 16,141 | | | - | | | 16,141 | |
| Site care and maintenance costs | | 2,524 | | | - | | | 2,524 | |
| Call premium on settlement of debt | | 9,571 | | | - | | | 9,571 | |
| Loss on settlement of long term debt, net of capitalized interest | | 2,904 | | | - | | | 2,904 | |
| Gain on Cariboo acquisition | | (47,426 | ) | | (46,212 | ) | | (1,214 | ) |
| Gain on acquisition of control of Gibraltar1 | | (14,982 | ) | | - | | | (14,982 | ) |
| Realized gain on sale of inventory2 | | 17,122 | | | - | | | 17,122 | |
| Inventory write ups to net realizable value that was sold or processed3 | | 9,227 | | | - | | | 9,227 | |
| Accretion and fair value adjustment on Florence royalty obligation | | 12,933 | | | - | | | 12,933 | |
| Accretion and fair value adjustment on Cariboo consideration payable | | 23,920 | | | - | | | 23,920 | |
| Non-recurring expenses relating to Cariboo acquisition | | 532 | | | 2,042 | | | (1,510 | ) |
| Estimated tax effect of adjustments | | (4,253 | ) | | 15,876 | | | (20,129 | ) |
| Adjusted net income* | | 56,927 | | | 44,431 | | | 12,496 | |
1 The $15.0 million gain on acquisition of control of Gibraltar in Q1 2024 relates to the write-up of finished copper concentrate inventory for Taseko's 87.5% share to its fair value at March 25, 2024.
2 Cost of sales for the year ended December 31, 2024 included $17.1 million in write-ups to net realizable value for concentrate inventory held at the date of acquisition of control of Gibraltar (March 25, 2024) that were subsequently sold. For calculating adjusted earnings, the realized portion of the gains recorded in the first quarter for GAAP purposes have been included in Adjusted net income in the period they were sold.
3 Cost of sales for the year ended December 31, 2024 included $9.2 million in ore stockpile and molybdenum concentrate inventory write-ups to net realizable value for inventory held at March 25, 2024 being the date of the deemed acquisition of control of Gibraltar that were subsequently sold or processed in the remainder of the year.
The Company's net loss was $13.4 million ($0.05 loss per share) for the year ended December 31, 2024 compared to net income of $82.7 million ($0.29 earnings per share) in the prior year. The net loss in the current year was primarily due to the unrealized foreign exchange loss on the Company's US dollar denominated debt, higher net finance and accretion expense due to financings closed in 2024, as well as increased production costs due to less capitalized stripping costs in the current year. Partially offsetting these negative impacts were an insurance recovery of $26.3 million, higher copper prices compared to 2023, and higher attributable sales volumes.
Financial Performance (Continued)
Earnings (continued)
The Company's adjusted net income was $56.9 million ($0.19 per share) for the year ended December 31, 2024, compared to adjusted net income of $44.4 million ($0.15 per share) for the prior year after elimination of the gains recognized on the Company's acquisition of Cariboo and gain on the deemed acquisition of control of Gibraltar in March 2024. These gains were substantially offset by the $52.3 million in unrealized foreign exchange losses in 2024. Other adjustments included adding back $16.1 million of the primary crusher relocation costs that were expensed, and accretion and fair value adjustments on the Florence royalty obligation and deferred consideration payable for Cariboo.
No adjustments are made to adjusted net income for provisional price adjustments in the year.
Financial Performance (Continued)
Revenues
| | | Year ended
December 31, | |
| (Cdn$ in thousands) | | 20241 | | | 20231 | | | Change | |
| Copper contained in concentrate | | 573,479 | | | 512,376 | | | 61,103 | |
| Copper price adjustments on settlement | | 1,533 | | | 818 | | | 715 | |
| Molybdenum concentrate | | 40,445 | | | 31,713 | | | 8,732 | |
| Molybdenum price adjustments on settlement | | 1,267 | | | (1,013 | ) | | 2,280 | |
| Silver | | 6,437 | | | 6,346 | | | 91 | |
| Total gross revenue | | 623,161 | | | 550,240 | | | 72,921 | |
| Less: Treatment and refining costs | | (15,068 | ) | | (25,268 | ) | | 10,200 | |
| Revenue | | 608,093 | | | 524,972 | | | 83,121 | |
| | | | | | | | | | |
| (thousands of pounds, unless otherwise noted) | | | | | | | | | |
| Sales of copper in concentrate2 | | 100,759 | | | 98,289 | | | 2,470 | |
| Average realized copper price (US$ per pound) | | 4.17 | | | 3.84 | | | 0.33 | |
| Average LME copper price (US$ per pound) | | 4.15 | | | 3.85 | | | 0.30 | |
| Average exchange rate (CAD/US$) | | 1.37 | | | 1.35 | | | 0.02 | |
1 The financial results reported include the Company's 87.5% proportionate share of Gibraltar income and expenses for the period March 16, 2023 to March 24, 2024 (prior to March 15, 2023 - 75%) and 100% of Gibraltar income and expenses for the period March 25, 2024 to December 31, 2024.
2 This amount includes a net smelter payable deduction of approximately 3.5% to derive net payable pounds of copper sold, 12.5% of Cariboo's share of copper sales for the period March 16, 2023 to March 24, 2024 and 25% since March 25, 2024.
The Company reported total revenue of $608.1 million for 2024. Copper revenues for the year ended December 31, 2024, increased by $61.1 million compared to the same prior year period, with $42.2 million attributed to higher copper prices, $10.6 million from increased attributable sales volumes of 2.5 million pounds, and $8.3 million from the favorable impact of a stronger US dollar in 2024 compared to 2023. The increase in sales volumes reflects the impact of the Cariboo acquisition in March, partially offset by lower mill availability due to the 18-day union strike at Gibraltar in June, the relocation of the primary crusher and maintenance on Mill 1, and the component replacement in Mill 2 in January.
Molybdenum revenues for the year ended December 31, 2024 increased by $8.7 million compared to the prior year period due primarily to higher molybdenum sales volume and the impact from the additional ownership interest in Gibraltar. The increase was partially offset by lower average molybdenum prices of US$21.30 per pound in 2024, compared to US$24.19 per pound in the prior year period.
Financial Performance (Continued)
Cost of sales
| | | Year ended
December 31, | |
| (Cdn$ in thousands) | | 20241 | | | 20231 | | | Change | |
| Site operating costs | | 367,689 | | | 309,805 | | | 57,884 | |
| Transportation costs | | 35,413 | | | 30,045 | | | 5,368 | |
| Change in inventories: | | | | | | | | | |
| Changes in finished goods | | 23,852 | | | (5,546 | ) | | 29,398 | |
| Changes in sulphide ore stockpiles | | 2 | | | (1,828 | ) | | 1,830 | |
| Changes in oxide ore stockpiles | | (9,870 | ) | | (14,858 | ) | | 4,988 | |
| Production costs | | 417,086 | | | 317,618 | | | 99,468 | |
| Depletion and amortization | | 73,852 | | | 56,940 | | | 16,912 | |
| Cost of sales | | 490,938 | | | 374,558 | | | 116,380 | |
| Site operating costs per ton milled* | $ | 12.93 | | $ | 12.16 | | $ | 0.77 | |
| | | | | | | | | | |
| Other operating costs: | | | | | | | | | |
| Crusher relocation costs | | 16,141 | | | - | | | 16,141 | |
| Site care and maintenance costs | | 2,524 | | | - | | | 2,524 | |
| | | 18,665 | | | - | | | 18,665 | |
| | | | | | | | | | |
| Insurance recovery | | (26,290 | ) | | - | | | (26,290 | ) |
1The financial results reported include the Company's 87.5% proportionate share of Gibraltar income and expenses for the period March 16, 2023 to March 24, 2024 (prior to March 15, 2023 - 75%) and 100% of Gibraltar income and expenses for the period March 25, 2024 to December 31, 2024.
Site operating costs for the year ended December 31, 2024 increased by $57.9 million over the same prior period primarily due to the Company's increased ownership in Gibraltar in the current period and lower capitalized stripping costs, partially offset by lower input costs such as diesel and the impact of the 18-day union strike in June 2024 which reduced site operating costs in the second quarter of 2024.
Costs of sales was for the year ended December 31, 2024 included write-ups of inventory to net realizable value of $17.1 million for concentrate inventory and $9.2 million for ore stockpiles and molybdenum concentrate held at the date of acquisition of control of Gibraltar (March 25, 2024) that were subsequently sold or processed in the current year.
Transportation costs for the year ended December 31, 2024 increased by $5.4 million over the same prior period, primarily due to the impact of proportionately consolidating the additional interest of Gibraltar, and higher costs for rail, ocean freight and port handling costs, partially offset by lower trucking related costs.
During the year ended December 31, 2024, the Company incurred costs of $16.1 million in relation to the in-pit crusher relocation project for Concentrator #1 including relocation related costs for the physical move, demolition costs of the old station's concrete foundation and write-downs of decommissioned conveyor components considered redundant. The Company also incurred costs of $2.5 million in relation to Gibraltar mine being on care and maintenance during the labour strike in June 2024.
The Company received $26.3 million in the second quarter of 2024 for a business interruption insurance claim related to a component replacement in Concentrator #2.
Depletion and amortization for the year ended December 31, 2024 increased by $16.9 million, over the same prior period primarily due to the impact of proportionately consolidating the additional interest of Gibraltar, and amortization of new equipment acquired, including the new primary crusher station that was completed in the year.
Other (income) expenses
| | | Year ended
December 31, | |
| (Cdn$ in thousands) | | 2024 | | | 2023 | | | Change | |
| General and administrative | | 12,942 | | | 13,465 | | | (523 | ) |
| Share-based compensation expense | | 9,002 | | | 5,919 | | | 3,083 | |
| Realized loss on derivative instruments | | 5,342 | | | 3,045 | | | 2,297 | |
| Unrealized (gain) loss on derivative instruments | | (21,020 | ) | | 1,874 | | | (22,894 | ) |
| Unrealized loss on Florence copper stream derivative | | 10,880 | | | - | | | 10,880 | |
| Project evaluation expenses | | 3,623 | | | 1,721 | | | 1,902 | |
| Call premium on settlement of debt | | 9,571 | | | - | | | 9,571 | |
| Gain on Cariboo acquisition | | (47,426 | ) | | (46,212 | ) | | (1,214 | ) |
| Gain on acquisition of control of Gibraltar | | (14,982 | ) | | - | | | (14,982 | ) |
| Other expenses (income), net | | 307 | | | (731 | ) | | 1,038 | |
| | | (31,761 | ) | | (20,919 | ) | | (10,842 | ) |
General and administrative expenses for the year ended December 31, 2024 was comparable to the prior year.
Share-based compensation expense is comprised of the amortization of share options and performance share units and the expense on deferred share units. Share-based compensation expense increased for the year ended December 31, 2024, compared to the prior year, primarily due to the Company's share price performance and its impact on the valuation of the deferred share units. More information is set out in Note 22 of the December 31, 2024 Financial Statements.
For the year ended December 31, 2024, the Company realized a net loss of $5.3 million on derivative instruments, primarily due to the expensing of premiums paid for copper collars and fuel options that settled out-of-the-money, compared to a net loss of $3.0 million in the prior year.
For the year ended December 31, 2024, the net unrealized gain on derivative instruments of $21.0 million, relates primarily to the change in the fair value of outstanding copper price collars covering the full year of 2025. These hedge positions were in-the-money at the end of the year due to lower copper price trends in the last quarter.
For the year ended December 31, 2024, the unrealized loss on the Florence copper stream derivative was $10.9 million. The unrealized loss was primarily due to the impact of higher estimated copper prices over the forecast period.
In April 2024, the Company paid a one-time redemption call premium of $9,571 on the redemption of the US$400 million senior secured notes.
On March 25, 2024, the Company completed the acquisition of the remaining 50% of Cariboo from Dowa and Furukawa. The Company recognized a bargain purchase gain of $47.4 million on the acquisition for the difference between the fair value of the net assets acquired and the estimated fair value of total consideration payable. On March 15, 2023, the Company acquired the first 50% of Cariboo from Sojitz Corporation which gave the Company an additional 12.5% effective interest in Gibraltar and recognized a bargain purchase gain of $46.2 million on that acquisition. More information on these gains is set out in Note 3 of the December 31, 2024 Financial Statements.
The gain of $15.0 million on the acquisition of control of Gibraltar reflects the difference in the fair value of the assets acquired and liabilities assumed and their book value immediately before the acquisition. The gain was attributed to the write-up of finished copper concentrate inventory to fair value at March 25, 2024 which was subsequently sold in the first half of 2024.
Project evaluation expenses represent costs associated with the New Prosperity project and other technical expenditures undertaken by Taseko's engineering and technical teams on various project initiatives.
Finance and accretion expense
| | | Year ended
December 31, | |
| (Cdn$ in thousands) | | 2024 | | | 2023 | | | Change | |
| Interest expense | | 61,886 | | | 48,181 | | | 13,705 | |
| Amortization of deferred financing charges | | 2,515 | | | 2,791 | | | (276 | ) |
| Finance income | | (5,175 | ) | | (2,972 | ) | | (2,203 | ) |
| Loss on settlement of long-term debt | | 4,646 | | | - | | | 4,646 | |
| Less: interest expense capitalized | | (23,060 | ) | | (8,865 | ) | | (14,195 | ) |
| Finance expenses, net | | 40,812 | | | 39,135 | | | 1,677 | |
| | | | | | | | | | |
| Accretion on deferred revenue | | 7,244 | | | 6,652 | | | 592 | |
| Accretion on PER | | 2,780 | | | 2,328 | | | 452 | |
Accretion and fair value adjustment on Cariboo consideration
payable | | 23,920 | | | 1,779 | | | 22,141 | |
| Accretion and fair value adjustment on Florence royalty obligation | | 12,993 | | | - | | | 12,993 | |
| Accretion expenses | | 46,937 | | | 10,759 | | | 36,178 | |
Finance expenses for the year ended December 31, 2024 increased from the prior year primarily due to the impact of higher principal on the new senior secured notes coupled with the higher coupon as well as additional borrowings. Finance expenses are partially offset by the capitalization of a portion of borrowing costs attributed to funding of Florence development costs, which has increased over 2023 due to the increased spend on the project in 2024.
Accretion expenses increased due to the acquisition of the remaining 50% of Cariboo in 2024 as well as changes in estimated timing of payments due to increased copper price expectations over the repayment period, as well as the accretion on the Florence royalty with Taurus entered into in early 2024.
Financial Performance (Continued)
Finance income for the year ended December 31, 2024 increased from the prior year due to more cash held throughout the year and higher interest rates earned on the Company's cash balances.
Income tax
| | | Year ended
December 31, | |
| (Cdn$ in thousands) | | 2024 | | | 2023 | | | Change | |
| Current income tax expense | | 3,482 | | | 3,002 | | | 480 | |
| Deferred income tax expense | | 28,060 | | | 47,141 | | | (19,081 | ) |
| Income tax expense | | 31,542 | | | 50,143 | | | (18,601 | ) |
| Effective tax rate | | 174.3% | | | 37.7% | | | 136.6% | |
| Canadian statutory rate | | 27.0% | | | 27.0% | | | - | |
| B.C. mineral tax rate | | 9.5% | | | 9.5% | | | - | |
Effective tax rate reconciliation
| | | Year ended
December 31, | |
| (Cdn$ in thousands) | | 2024 | | | 2023 | | | Change | |
| Income tax expense at Canadian statutory rate of 36.5% | | 6,603 | | | 48,484 | | | (41,881) | |
| Permanent differences | | 20,684 | | | 2,641 | | | 18,043 | |
| Foreign tax rate differential | | 629 | | | 104 | | | 525 | |
| Unrecognized tax benefits | | 6,627 | | | (1,189 | ) | | 7,816 | |
| Deferred tax adjustments related to prior periods | | (3,001 | ) | | 103 | | | (3,104 | ) |
| Income tax expense | | 31,542 | | | 50,143 | | | (18,601 | ) |
The overall lower income tax expense for the year ended December 31, 2024, was due in part to lower income for accounting purposes. The effective tax rate for the year is higher than the combined B.C. mineral and income tax rate of 36.5% primarily due to the purchase of the residual 12.5% interest of Cariboo resulting in a deferred tax expense of $17 million from the bargain purchase gain. There is also no deduction for unrealized foreign exchange losses. Other expenses that result in a higher effective tax rate are finance charges, derivative gains and general and administrative costs that are not deductible for B.C. mineral tax purposes.
As foreign exchange revaluations on the senior secured notes are not recognized for tax purposes until realized, and in the case of capital losses, when they are applied, the effective tax rate may be significantly higher or lower than the statutory rates, as is the case for the year ended December 31, 2024 and 2023, relative to net income (loss) for those periods.
The current income tax expense represents an estimate of B.C. mineral taxes payable for the current periods.
Financial Condition Review
Balance sheet review
| | | At December 31, | | | At December 31, | | | | |
| (Cdn$ in thousands) | | 2024 | | | 2023 | | | Change | |
| Cash and equivalents | | 172,732 | | | 96,477 | | | 76,255 | |
| Other current assets | | 180,507 | | | 152,978 | | | 27,529 | |
| Property, plant and equipment | | 1,770,102 | | | 1,286,001 | | | 484,101 | |
| Other assets | | 71,702 | | | 48,683 | | | 23,019 | |
| Total assets | | 2,195,043 | | | 1,584,139 | | | 610,904 | |
| Current liabilities1 | | 173,983 | | | 113,531 | | | 60,452 | |
| Debt: | | | | | | | | | |
| Credit facility | | - | | | 25,191 | | | (25,191 | ) |
| Senior secured notes | | 706,741 | | | 524,491 | | | 182,250 | |
| Equipment related financings | | 90,467 | | | 88,209 | | | 2,258 | |
| Deferred revenue | | 77,327 | | | 59,720 | | | 17,607 | |
| Other liabilities | | 643,303 | | | 338,849 | | | 304,454 | |
| Total liabilities | | 1,691,821 | | | 1,149,991 | | | 541,830 | |
| Equity | | 503,222 | | | 434,148 | | | 69,074 | |
| Net debt* (debt minus cash and equivalents) | | 624,476 | | | 541,414 | | | 83,062 | |
| Total common shares outstanding (millions) | | 304.7 | | | 290.0 | | | 14.7 | |
1 Excludes current portion of long-term debt.
The Company's asset base is comprised principally of property, plant and equipment, reflecting the capital intensive nature of its large scale, open pit mining operation at Gibraltar and construction of the commercial facility at Florence. Other current assets primarily include accounts receivable, inventories (concentrate inventories, ore stockpiles, and supplies), prepaid expenses, and marketable securities. Concentrate inventories, accounts receivable and cash balances can fluctuate due to sales and cash settlement schedules.
Property, plant and equipment increased by $484.1 million in the year ended December 31, 2024, which includes the impact from acquiring an additional 12.5% effective interest in the Gibraltar mine from Dowa and Furukawa, $287.3 million for Florence Copper project expenditures, $23.1 million in capitalized interest, $48.2 million in foreign currency translation of Florence Copper assets, as well as capital expenditures at Gibraltar (capitalized stripping, sustaining and capital projects).
Net debt has increased by $83.1 million in the year ended December 31, 2024, primarily due to the new senior secured notes issued and release of restricted cash offset by investment of cash in the development of Florence Copper and the effect of a weakening Canadian dollar against US dollar net borrowings.
Deferred revenue relates to the advance payments received from Osisko for the sale of Taseko's share of future silver production from Gibraltar and customer advance payments on copper concentrate.
Other liabilities increased by $304.5 million primarily due to the $84.3 million of Florence royalty obligation related to the Taurus royalty financing closed in February, $75.5 million for deferred consideration payable to Dowa and Furukawa for the acquisition of 50% of Cariboo and the $23.0 million additional share of Gibraltar's provision for environmental rehabilitation that the Company assumed with the purchase of Cariboo.
As at February 19, 2025, there were 310,546,191 common shares and 11,423,666 stock options outstanding. More information on these instruments and the terms of their exercise is set out in Note 22 of the December 31, 2024 Financial Statements.
Liquidity, cash flow and capital resources
At December 31, 2024, the Company had cash and equivalents of $172.7 million (December 31, 2023 - $96.5 million).
Cash flow provided by operations during year ended December 31, 2024 was $232.6 million compared to $151.1 million for the prior year. The increase in cash flow provided by operations was attributable to higher copper sales volumes and prices, higher molybdenum sales volumes, offset by higher site operating costs due to less stripping costs being capitalized in 2024. Cash flow provided by operations was also reduced due to an increase in inventories, including an increase in ore stockpiles, including oxide ore placed on the heap leach pads.
In December 2024, the Company closed a transaction with Osisko Gold Royalties, amending the Gibraltar silver stream agreement and increasing the attributable silver percentage from 87.5% to 100% in exchange for an additional cash payment of US$12.7 million.
Cash used for investing activities during the year ended December 31, 2024 was $317.9 million compared to $167.6 million for the prior year. Investing cash flows used in the year includes $83.1 million for capital expenditures at Gibraltar (which includes $30.6 million for capitalized stripping costs, $31.7 million for sustaining capital, and $20.8 million for capital projects), $231.0 million of cash expenditures for Florence Copper and $6.8 million for the purchase of copper collars covering production from January 2025 to December 2025. Included in investing activities in the year is the Company's 50% acquisition of Cariboo, which included an initial fixed payment of $5.0 million to Dowa and Furukawa and the pickup of the Company's 50% share of Cariboo's cash balance of $9.8 million offset by a $10 million second instalment and $4.5 million performance payment to Sojitz for 2023.
Cash provided by financing activities for the year ended December 31, 2024, was $157.2 million, compared to $7.1 million of cash used in the prior year. Financing activities primarily consisted of net proceeds from the issuance of the 2030 senior secured notes, after the repayment of the 2026 Notes, totaling $113.9 million, and net proceeds from Florence financings of $114.3 million. These were offset by interest paid of $70.3 million, repayment of the revolving credit facility of $26.5 million, and Gibraltar net equipment financing repayment of $14.3 million.
Liquidity outlook
The Company has approximately $331.0 million of available liquidity at December 31, 2024, including a cash balance of $172.7 million and undrawn amounts under the revolving credit facility of US$110 million. On November 6, 2024, the Company entered into an amendment for its revolving credit facility, extending the maturity date to November 2027 from July 2026, and increasing the facility amount to US$110 million from US$80 million. No amounts are currently drawn against the revolving credit facility.
Financial Condition Review (Continued)
Liquidity outlook (Continued)
Copper production in 2025 is expected to increase to the 120 to 130 million pound range, with molybdenum production also expected to increase due to higher molybdenum grades in the Connector pit ore. Lower-grade ore stockpiles will be used to supplement mined ore in the first half of the year, with annual production weighted to the second half of the year. At current copper prices and with copper price protection in place for 108 million pounds, Gibraltar is expected to deliver stable operating margins and cash flows for 2025. Other than refurbishment of the SX/EW plant, Gibraltar has no other significant capital projects planned for 2025.
With construction underway at Florence Copper, the Company has entered into significant capital commitments for the remaining construction of the commercial facility. The Company intends to finance the remaining costs over the next twelve months from available liquidity, cash flow from Gibraltar and the corporate credit facility.
If needed, the Company could raise further additional capital through equity financings or asset sales, including royalties, sales of project interests, or joint ventures, or additional credit facilities, including additional notes offerings or increasing borrowings from commercial banks or credit funds. The Company evaluates these financing alternatives based on a number of factors including the prevailing metal prices and projected operating cash flow from Gibraltar, relative valuation, liquidity requirements, covenant restrictions and other factors, in order to optimize the Company's cost of capital and maximize shareholder value.
Future changes in copper and molybdenum market prices could also impact the timing and amount of cash available for future investment in the Company's capital commitments and development projects, debt obligations, and other uses of capital. To mitigate commodity price risks in the short-term, copper price options are entered into for a substantial portion of Taseko's share of Gibraltar copper production and the Company has a long track record of doing so.
Hedging strategy
The Company generally fixes all or substantially all of the copper prices of its copper concentrate shipments at the time of shipment. Where the customer's offtake contract does not provide a price fixing option, the Company may look to undertake a quotational period hedge directly with a financial institution as the counterparty in order to fix the price of the shipment.
To protect against sudden and unexpected copper price volatility in the market, the Company's hedging strategy aims to secure a minimum price for a significant portion of future copper production using copper put options that are either purchased outright or substantially funded by the sale of copper call options that are out of the money. The amount and duration of the copper hedge position is based on an assessment of business-specific risk elements combined with the copper pricing outlook. Copper price and quantity exposure are reviewed regularly to ensure that adequate revenue protection is in place.
Hedge positions are typically extended by adding incremental quarters at established floor prices (i.e. the strike price of the copper put option) to provide the necessary price protection. Considerations for the cost of the hedging program include an assessment of Gibraltar's estimated production costs, copper price trends and the Company's fixed capital requirements during the relevant period. During periods of volatility or step changes in the copper price, the Company may revisit outstanding hedging contracts and determine whether the copper put (floor) or call (ceiling) levels should be adjusted in line with the market while maintaining copper price protection.
Financial Condition Review (Continued)
Hedging strategy (Continued)
From time to time, the Company will look at potential hedging opportunities to mitigate the risk of rising input costs, including foreign exchange and fuel prices where such a strategy is cost effective. To protect against a potential operating margin squeeze that could arise from oil and diesel price shocks, the Company purchases fuel call options to provide a price cap for its share of diesel that is used by its mining fleet.
A summary of the Company's outstanding hedges are shown below:
| Notional amount | Strike price | Term to maturity | Original cost |
At December 31, 2024 | | | | |
Copper collars | 54 million lbs | Floor - US$4.00 per lb
Ceiling - US$5.00 per lb | H1 2025 | $2.6 million |
Copper collars | 54 million lbs | Floor - US$4.00 per lb
Ceiling - US$5.40 per lb | H2 2025 | $2.2 million |
Fuel call options | 18 million ltrs | US$0.65 per ltr | H1 2025 | $0.6 million |
Financial Condition Review (Continued)
Commitments and contingencies
| | | Payments due | | | | |
| (Cdn$ in thousands) | | 2025 | | | 2026 | | | 2027 | | | 2028 | | | 2029 | | | Thereafter | | | Total | |
| Debt: | | | | | | | | | | | | | | | | | | | | | |
| 2030 Notes | | - | | | - | | | - | | | - | | | - | | | 719,250 | | | 719,250 | |
| Interest | | 59,338 | | | 59,338 | | | 59,338 | | | 59,338 | | | 59,338 | | | 29,669 | | | 326,359 | |
| Equipment loans: | | | | | | | | | | | | | | | | | | | | | |
| Principal | | 25,267 | | | 27,560 | | | 14,048 | | | 11,281 | | | - | | | - | | | 78,156 | |
| Interest | | 5,754 | | | 3,460 | | | 1,554 | | | 462 | | | - | | | - | | | 11,230 | |
| Lease liabilities: | | | | | | | | | | | | | | | | | | | | | |
| Principal | | 7,619 | | | 3,751 | | | 1,172 | | | 450 | | | 252 | | | 52 | | | 13,296 | |
| Interest | | 944 | | | 395 | | | 97 | | | 27 | | | 7 | | | 1 | | | 1,471 | |
| Cariboo acquisition payments: | | | | | | | | | | | | | | | | | | | | | |
| - Sojitz1 | | 10,000 | | | 10,000 | | | 10,000 | | | 10,000 | | | - | | | - | | | 40,000 | |
| - Dowa and Furukawa2 | | - | | | 9,000 | | | 11,000 | | | 10,000 | | | 8,000 | | | 74,000 | | | 112,000 | |
| PER3 | | - | | | - | | | - | | | - | | | - | | | 169,570 | | | 169,570 | |
| Capital expenditures | | 54,463 | | | - | | | - | | | - | | | - | | | - | | | 54,463 | |
| Other expenditures | | | | | | | | | | | | | | | | | | | | | |
| Transportation related services4 | | 7,826 | | | 1,463 | | | - | | | - | | | - | | | - | | | 9,289 | |
1 On March 15, 2023, the Company completed its acquisition of an additional 12.5% interest in the Gibraltar mine from Sojitz. The acquisition price consists of a minimum amount of $60 million payable over a five-year period and potential contingent payments depending on Gibraltar mine copper revenue and copper prices over the next five years. An initial $10 million has been paid to Sojitz on closing, $10 million in 2024, and the remaining minimum amounts will be paid in $10 million annual instalments over the next four years. There is no interest payable on the minimum amounts. The Company estimates that there is $40 million payable over the next 4 years relating to the contingent consideration payable to Sojitz for its acquisition of the 12.5% interest in the shares of Cariboo which is not included in the table above.
2 On March 25, 2024, the Company completed the acquisition of the remaining 50% of Cariboo from Dowa and Furukawa. The acquisition price payable to Dowa and Furukawa is a minimum of $117 million and a maximum of $142 million payable over a 10-year payment period, with the quantum and timing of payment depending on LME copper prices and the cashflow of Gibraltar. An initial $5 million payment was made to Dowa and Furukawa on closing. The remaining cash consideration will be repayable in annual payments commencing in March 2026.
3 Provision for environmental rehabilitation amounts presented in the table represents the present value of estimated costs of legal and constructive obligations required to retire an asset, including decommissioning and other site restoration activities, primarily for the Gibraltar mine and Florence Copper. As at December 31, 2024, the Company has provided surety bonds of $108.5 million for Gibraltar's reclamation security. For Florence Copper, the Company has provided to the federal and state regulator surety bonds totaling $51.9 million as reclamation security.
4 Transportation related services commitments include ocean freight and port handling services, which are both cancelable upon certain operating circumstances.
Financial Condition Review (Continued)
Commitments and contingencies (Continued)
The Company has made capital expenditure commitments relating to equipment for the Florence Copper project totaling $47.9 million as at December 31, 2024.
In late December 2024, Gibraltar received an amendment to its M-40 permit in which the required closure bonding from the Province of British Columbia was increased from $108.5 million to $139.9 million. Gibraltar is required to post this additional bonding over the next 15 months, with $15.7 million due on March 31, 2025 and a second tranche for the same amount due by March 31, 2026. Taseko intends to place additional surety bonds to meet these increased bonding requirements from the Province of British Columbia from insurance underwriters.
Selected Annual Information
| | | For the years ended December 31, | |
| (Cdn$ in thousands, except per share amounts) | | 2024 | | | 2023 | | | 2022 | |
| Revenues | | 608,093 | | | 524,972 | | | 391,609 | |
| Net (loss) income | | (13,444 | ) | | 82,726 | | | (25,971 | ) |
| Per share - basic | | (0.05 | ) | | 0.29 | | | (0.09 | ) |
| Per share - diluted | | (0.05 | ) | | 0.28 | | | (0.09 | ) |
| | | | | | | | | | |
| | | As at December 31, | |
| | | 2024 | | | 2023 | | | 2022 | |
| Total assets | | 2,195,043 | | | 1,584,139 | | | 1,278,684 | |
| Total long-term financial liabilities1 | | 901,928 | | | 670,802 | | | 572,037 | |
1 Long-term financial liabilities includes long-term debt, long-term Cariboo consideration payable and other financial liabilities.
Fourth Quarter Results
| Consolidated Statements of Comprehensive Income | | Three months ended December 31, | |
| (Cdn$ in thousands, except per share amounts) | | 2024 | | | 2023 | |
| | | | | | | |
| Revenues | | 167,799 | | | 153,694 | |
| Cost of sales | | | | | | |
| Production costs | | (110,299 | ) | | (80,588 | ) |
| Depletion and amortization | | (24,641 | ) | | (13,326 | ) |
| Other operating costs | | (4,132 | ) | | - | |
| Earnings from mining operations | | 28,727 | | | 59,780 | |
| | | | | | | |
| General and administrative | | (2,754 | ) | | (4,069 | ) |
| Share-based compensation recovery (expense) | | 385 | | | (1,515 | ) |
| Project evaluation expenditures | | (191 | ) | | (925 | ) |
| Gain (loss) on derivatives | | 24,511 | | | (274 | ) |
| Other expenses | | (69 | ) | | (1 | ) |
| Income before financing costs and income taxes | | 50,609 | | | 52,996 | |
| | | | | | | |
| Finance expenses, net | | (8,645 | ) | | (10,217 | ) |
| Accretion expenses | | (11,154 | ) | | (1,615 | ) |
| Foreign exchange (loss) gain | | (40,310 | ) | | 14,117 | |
| (Loss) income before income taxes | | (9,500 | ) | | 55,281 | |
| | | | | | | |
| Income tax expense | | (11,707 | ) | | (17,205 | ) |
| Net (loss) income for the period | | (21,207 | ) | | 38,076 | |
| | | | | | | |
| Other comprehensive income (loss): | | | | | | |
| Unrealized loss on financial assets | | (792 | ) | | (115 | ) |
| Foreign currency translation reserve | | 27,478 | | | (10,329 | ) |
| Total other comprehensive income (loss) for the period | | 26,686 | | | (10,444 | ) |
| | | | | | | |
| Total comprehensive income for the period | | 5,479 | | | 27,632 | |
| | | | | | | |
| (Loss) earnings per share | | | | | | |
| Basic | | (0.07 | ) | | 0.13 | |
| Diluted | | (0.07 | ) | | 0.13 | |
| | | | | | | |
| Weighted-average shares outstanding (in thousands) | | | | | | |
| Basic | | 303,794 | | | 289,018 | |
| Diluted | | 303,794 | | | 290,736 | |
Fourth Quarter Results (Continued)
| Consolidated Statements of Cash Flows | | Three months ended December 31, | |
| (Cdn$ in thousands) | | 2024 | | | 2023 | |
| Operating activities | | | | | | |
| Net (loss) income for the period | | (21,207 | ) | | 38,076 | |
| Adjustments for: | | | | | | |
| Depletion and amortization | | 24,641 | | | 13,326 | |
| Income tax expense | | 11,707 | | | 17,205 | |
| Finance expenses, net | | 8,585 | | | 10,217 | |
| Accretion expense | | 11,214 | | | 1,615 | |
| (Gain) loss on derivatives | | (24,511 | ) | | 274 | |
| Unrealized foreign exchange loss (gain) | | 40,462 | | | (14,541 | ) |
| Inventory sold or processed with write-ups to net realizable value | | 1,905 | | | - | |
| Deferred revenue deposit | | 18,244 | | | - | |
| Amortization of deferred revenue | | (1,645 | ) | | (2,029 | ) |
| Share-based compensation (recovery) expense | | (323 | ) | | 1,573 | |
| Other operating activities | | 3,839 | | | (383 | ) |
| Net change in working capital | | 381 | | | (2,498 | ) |
| Cash provided by operating activities | | 73,292 | | | 62,835 | |
| | | | | | | |
| Investing activities | | | | | | |
| Gibraltar capitalized stripping costs | | (2,315 | ) | | (31,882 | ) |
| Gibraltar sustaining capital expenditures | | (17,454 | ) | | (3,221 | ) |
| Gibraltar capital project expenditures | | (9,345 | ) | | (6,587 | ) |
| Florence Copper development costs | | (84,470 | ) | | (15,530 | ) |
| Other project development costs | | (1,213 | ) | | (1,804 | ) |
| Net outflows related to copper price options | | - | | | (1,360 | ) |
| Other investing activities | | 1,708 | | | 1,367 | |
| Cash used for investing activities | | (113,089 | ) | | (59,017 | ) |
| | | | | | | |
| Financing activities | | | | | | |
| Interest paid | | (35,575 | ) | | (3,303 | ) |
| Net proceeds from Florence financings | | 12,516 | | | 33,287 | |
| Proceeds from Gibraltar equipment financings | | 15,673 | | | - | |
| Repayment of Gibraltar equipment financings | | (9,011 | ) | | (6,147 | ) |
| Revolving credit facility repayment | | - | | | (14,243 | ) |
| Net proceeds from share issuance | | 14,208 | | | - | |
| Net share-share based compensation | | 445 | | | 993 | |
| Cash (used for) provided by financing activities | | (1,744 | ) | | 10,587 | |
| Effect of exchange rate changes on cash and equivalents | | 5,522 | | | 58 | |
| (Decrease) increase in cash and equivalents | | (36,019 | ) | | 14,463 | |
| Cash and equivalents, beginning of period | | 208,751 | | | 82,014 | |
| Cash and equivalents, end of period | | 172,732 | | | 96,477 | |
Fourth Quarter Results (Continued)
Earnings
| | | Three months ended
December 31, | |
| (Cdn$ in thousands) | | 2024 | | | 2023 | | | Change | |
| Net (loss) income | | (21,207 | ) | | 38,076 | | | (59,283 | ) |
| Unrealized foreign exchange loss (gain) | | 40,462 | | | (14,541 | ) | | 55,003 | |
| Unrealized (gain) loss on derivative instruments | | (25,514 | ) | | 1,636 | | | (27,150 | ) |
| Other operating costs1 | | 4,132 | | | - | | | 4,132 | |
| Inventory write ups to net realizable value that was sold or processed2 | | 1,905 | | | - | | | 1,905 | |
| Accretion and fair value adjustment on Florence royalty obligation | | 3,682 | | | - | | | 3,682 | |
| Accretion and fair value adjustment on consideration payable to Cariboo | | 4,543 | | | - | | | 4,543 | |
| Non-recurring other income for Cariboo adjustment | | - | | | (916 | ) | | 916 | |
| Estimated tax effect of adjustments | | 2,465 | | | (194 | ) | | 2,659 | |
| Adjusted net income* | | 10,468 | | | 24,061 | | | (13,593 | ) |
1 Other operating costs relate to the write-down of certain equipment as part of the in-pit crusher relocation project.
2 Write-ups to net realizable value for inventory held at the date of acquisition of control of Gibraltar (March 25, 2024) totaled $9.2 million. Cost of sales for the three months ended December 31, 2024 included $1.9 million in inventory write-ups that were subsequently sold or processed in fourth quarter.
The Company's net loss was $21.2 million ($0.07 loss per share) for the three months ended December 31, 2024 compared to $38.1 million in net income ($0.13 per share) in the same prior year quarter. Earnings in the fourth quarter were positively impacted by higher average LME copper prices and unrealized derivative gains from the Company's copper collar contracts, offset by lower copper sales volumes, less capitalized stripping costs, higher finance and accretion expenses due to additional financings undertaken in 2024, and unrealized foreign exchange losses due to the impact of the weakening Canadian dollar on US dollar denominated borrowings.
Adjusted net income was $10.5 million ($0.03 per share) for the three months ended December 31, 2024 after adding back $40.5 million in unrealized foreign exchange losses, deducting $25.5 million of unrealized gains on derivative instruments due to the lower copper price at the end of December, and adjusting for non-cash accretion and adjustments to fair value for the consideration payable to Cariboo and the Florence royalty obligation. Other operating costs in the quarter included the write-down of certain conveyor systems that were made redundant as part of the primary crusher relocation project.
Fourth Quarter Results (Continued)
Revenues
| | | Three months ended
December 31, | |
| (Cdn$ in thousands) | | 20241 | | | 20231 | | | Change | |
| Copper contained in concentrate | | 152,785 | | | 153,310 | | | (525) | |
| Copper price adjustments on settlement | | (842 | ) | | 923 | | | (1,765 | ) |
| Molybdenum concentrate | | 18,083 | | | 7,919 | | | 10,164 | |
| Molybdenum price adjustments on settlement | | (247 | ) | | (1,802 | ) | | 1,555 | |
| Silver | | 1,783 | | | 1,905 | | | (122 | ) |
| Total gross revenue | | 171,562 | | | 162,255 | | | 9,307 | |
| Less: Treatment and refining costs | | (3,763 | ) | | (8,561 | ) | | 4,798 | |
| Revenue | | 167,799 | | | 153,694 | | | 14,105 | |
| | | | | | | | | | |
| (thousands of pounds, unless otherwise noted) | | | | | | | | | |
| Sales of copper in concentrate2 | | 26,282 | | | 30,188 | | | (3,906 | ) |
| Average realized copper price (US$ per pound) | | 4.13 | | | 3.75 | | | 0.38 | |
| Average LME copper price (US$ per pound) | | 4.17 | | | 3.70 | | | 0.47 | |
| Average exchange rate (CAD/US$) | | 1.40 | | | 1.36 | | | 0.04 | |
1 The financial results reported include the Company's 87.5% proportionate share of Gibraltar income and expenses for the period March 16, 2023 to March 24, 2024 (prior to March 15, 2023 - 75%) and 100% of Gibraltar income and expenses for the period March 25, 2024 to December 31, 2024.
2 This amount includes a net smelter payable deduction of approximately 3.5% to derive net payable pounds of copper sold, 12.5% of Cariboo's share of copper sales for the period March 16, 2023 to March 24, 2024 and 25% since March 25, 2024.
Copper revenues for the three months ended December 31, 2024 were comparable overall to same prior year period. Higher copper prices and the favorable impact of a stronger US dollar in fourth quarter of 2024 compared to 2023, mostly offset lower attributable sales volumes of 3.9 million pounds. Negative provisional copper price adjustments in the current year period were $0.8 million due to the decreasing copper price trend in December.
Molybdenum revenues for the three months ended December 31, 2024 increased by $10.2 million compared to the prior year period primarily due to higher sales volume and the impact from the additional ownership interest in Gibraltar, and the higher average molybdenum prices of US$21.71 per pound in the current period, compared to US$18.64 per pound in the prior year period.
Fourth Quarter Results (Continued)
Cost of sales
| | | Three months ended
December 31, | |
| (Cdn$ in thousands) | | 20241 | | | 20231 | | | Change | |
| Site operating costs | | 100,495 | | | 64,845 | | | 35,650 | |
| Transportation costs | | 10,170 | | | 10,294 | | | (124 | ) |
| Change in inventories: | | | | | | | | | |
| Changes in finished goods | | (4,064 | ) | | 1,678 | | | (5,742 | ) |
| Changes in sulphide ore stockpiles | | 4,248 | | | 6,200 | | | (1,952 | ) |
| Changes in oxide ore stockpiles | | (550 | ) | | (2,429 | ) | | 1,879 | |
| Production costs | | 110,299 | | | 80,588 | | | 29,711 | |
| Depletion and amortization | | 24,641 | | | 13,326 | | | 11,315 | |
| Cost of sales | | 134,940 | | | 93,914 | | | 41,026 | |
| Site operating costs per ton milled* | $ | 12.18 | | $ | 9.72 | | $ | 2.46 | |
| | | | | | | | | | |
| Other operating costs: | | | | | | | | | |
| Crusher relocation costs | | 4,132 | | | - | | | 4,132 | |
1The financial results reported include the Company's 87.5% proportionate share of Gibraltar income and expenses for the period March 16, 2023 to March 24, 2024 (prior to March 15, 2023 - 75%) and 100% of Gibraltar income and expenses for the period March 25, 2024 to December 31, 2024.
Site operating costs for the three months ended December 31, 2024 increased by $35.7 million over the same prior period due to a significant decrease in capitalized waste stripping by $30 million compared to the prior year quarter and the Company's increased ownership in Gibraltar in the current period, partially offset by lower input prices on consumables such as diesel.
Finished inventory increased during the quarter which reduced overall production costs by $4.1 million in the quarter. Oxide tons added to the heap leach pads were nominal in the current period.
Transportation costs for the three months ended December 31, 2024 decreased by $0.1 million over the same prior period, primarily due to lower copper sales volume, partially offset by the impact of proportionately consolidating the additional interest of Gibraltar.
Depletion and amortization for the three months ended December 31, 2024 increased by $11.3 million, over the same prior period primarily due to the commencement of depreciation on newly commissioned assets during the current year, as well as the impact of proportionately consolidating the additional interest in Gibraltar.
During the three months ended December 31, 2024, the Company incurred other operating costs of $4.1 million in relation to the in-pit crusher relocation project, specifically related to the non-cash write-down of historical conveyor equipment and mechanical components that were made redundant following completion of the project.
Fourth Quarter Results (Continued)
Other expense (income)
| | | Three months ended
December 31, | |
| (Cdn$ in thousands) | | 2024 | | | 2023 | | | Change | |
| General and administrative | | 2,754 | | | 4,069 | | | (1,315) | |
| Share-based compensation (recovery) expense | | (385) | | | 1,515 | | | (1,900) | |
| Realized loss (gain) on derivative instruments | | 1,002 | | | (1,362 | ) | | 2,364 | |
| Unrealized (gain) loss on derivative instruments | | (29,786 | ) | | 1,636 | | | (31,422 | ) |
| Unrealized loss on Florence copper stream derivative | | 4,272 | | | - | | | 4,272 | |
| Project evaluation expenditures | | 191 | | | 925 | | | (734 | ) |
| Other expense, net | | 69 | | | 1 | | | 68 | |
| | | (21,883 | ) | | 6,784 | | | (28,667 | ) |
General and administrative expenses decreased by $1.3 million in the three months ended December 31, 2024, compared to the same prior period due to timing of expenditures and costs allocations to ongoing capital projects.
Share-based compensation expense is comprised of amortization of share options and performance share units and the expense on deferred and restricted share units. Share-based compensation expense decreased for the three months ended December 31, 2024, compared to the same period in 2023, primarily due to a decrease in the Company's share price during the period and its impact on the valuation of the deferred share units. More information is set out in Note 22 of the Financial Statements.
For the three months ended December 31, 2024, the Company realized a net loss on derivative instruments of $1.0 million primarily due to the expensing of premiums paid for copper collars for the period that settled out-of-the money.
For the three months ended December 31, 2024, the net unrealized gain on derivative instruments of $29.8 million, relates primarily to the change in the fair value of outstanding copper price collars covering 108 million pounds of copper in 2025. These hedge positions were in-the-money due to the decline in copper prices towards the end of the quarter.
For the three months ended December 31, 2024, the unrealized loss on the Florence copper stream derivative was $4.3 million, primarily due to the impact of higher estimated copper prices over the forecast period.
Fourth Quarter Results (Continued)
Finance and accretion expense
| | | Three months ended
December 31, | |
| (Cdn$ in thousands) | | 2024 | | | 2023 | | | Change | |
| Interest expense | | 17,236 | | | 13,109 | | | 4,127 | |
| Amortization of deferred financing charges | | 577 | | | 738 | | | (161) | |
| Finance income | | (1,674 | ) | | (972 | ) | | (702 | ) |
| Less: interest expense capitalized | | (7,554 | ) | | (2,658 | ) | | (4,896 | ) |
| Finance expenses, net | | 8,585 | | | 10,217 | | | (1,632 | ) |
| | | | | | | | | | |
| Accretion on deferred revenue | | 2,239 | | | 1,851 | | | 388 | |
| Accretion on PER | | 690 | | | 680 | | | 10 | |
| Accretion and fair value adjustment on Cariboo consideration payable | | 4,543 | | | (916 | ) | | 5,459 | |
| Accretion and fair value adjustment on Florence royalty obligation | | 3,742 | | | - | | | 3,742 | |
| Accretion expenses | | 11,214 | | | 1,615 | | | 9,599 | |
Interest expense for the three months ended December 31, 2024 increased from the prior year period primarily due to the impact of the higher coupon rate on the new senior secured notes and interest on new equipment loans, which was partially offset by the capitalization of a portion of borrowing costs attributed to the funding of Florence development costs.
Finance expense on deferred revenue adjustments represents the implicit financing component of the upfront deposit from the silver sales streaming arrangement with Osisko.
Accretion and fair value adjustments on consideration payable for Cariboo were $4.5 million for the three months ended December 31, 2024, and were primarily due to the impact of higher estimated future copper prices over the repayment period. Accretion and fair value adjustments on the Florence royalty obligation was $3.7 million for the three months ended December 31, 2024, driven by the increasing forecast copper prices since closing of the transaction in February 2024, combined with the advancement of the Florence Copper Project towards initial production.
Finance income for the three months ended December 31, 2024 increased from the same period in prior year due to the impact of higher interest rates on the Company's cash balances.
Fourth Quarter Results (Continued)
Income tax
| | | Three months ended
December 31, | |
| (Cdn$ in thousands) | | 2024 | | | 2023 | | | Change | |
| Current income tax expense | | 1,129 | | | 999 | | | 130 | |
| Deferred income tax expense | | 10,578 | | | 16,206 | | | (5,628 | ) |
| Income tax expense | | 11,707 | | | 17,205 | | | (5,498 | ) |
| Effective tax rate | | (123.2 | )% | | 31.1 | % | | (154.3 | %) |
| Canadian statutory rate | | 27.0 | % | | 27.0 | % | | - | |
| B.C. mineral tax rate | | 9.5 | % | | 9.5 | % | | - | |
Effective tax rate reconciliation
| | | Three months ended
December 31, | |
| (Cdn$ in thousands) | | 2024 | | | 2023 | | | Change | |
| Income tax (recovery) expense at Canadian statutory rate of 36.5% | | (3,468 | ) | | 13,898 | | | (17,366 | ) |
| Permanent differences | | 16,772 | | | 3,154 | | | 13,618 | |
| Foreign tax rate differential | | 138 | | | 41 | | | 97 | |
| Unrecognized tax benefits | | (832 | ) | | 246 | | | (1,078 | ) |
| Deferred tax adjustments related to prior periods | | (903 | ) | | (134 | ) | | (769 | ) |
| Income tax expense | | 11,707 | | | 17,205 | | | (5,498 | ) |
The overall lower income tax expense for the three months ended December 31, 2024, was due in part to lower income for accounting purposes. The effective tax rate for the three months ended December 31, 2024 is negative, in comparison to the combined B.C. mineral and income tax rate of 36.5% primarily due to the unrealized foreign exchange loss on debt, the benefit of which is not recognized for tax purposes.
As foreign exchange revaluations on the senior secured notes are not recognized for tax purposes until realized, and in the case of capital losses, when they are applied, the effective tax rate may be significantly higher or lower than the statutory rates, as is the case for the three months ended December 31, 2024 and 2023, relative to net income (loss) for those periods.
The current income tax expense represents an estimate of B.C. mineral taxes payable for the current periods.
Fourth Quarter Results (Continued)
Liquidity, cash flow and capital resources
Cash flow provided by operations during the three months ended December 31, 2024 was $73.3 million compared to cash flow provided operations of $62.8 million for the same prior period. The increase in cash flow provided by operations was due primarily to higher copper prices and the closing of the Osisko stream amendment in December, partially offset by lower attributable sale volumes than the comparative period.
Cash used for investing activities during the three months ended December 31, 2024 was $113.1 million compared to $59.0 million for the same prior period. Investing cash flows in the fourth quarter includes $29.1 million for capital expenditures at Gibraltar (which includes $2.3 million for capitalized stripping costs, $17.5 million for sustaining capital, and $9.3 million for capital projects), and $84.5 million of cash expenditures for development costs at Florence Copper.
Net cash from financing activities for the three months ended December 31, 2024 resulted in an outflow of $1.7 million, comprised of interest paid on financings of $35.6 million, offset by net proceeds from new financings of $19.2 million and the net proceeds from equity share issuances of $14.2 million.
Summary of Quarterly Results
| | | 2024 | | | 2023 | |
(Cdn$ in thousands,
except per share amounts) | | Q4 | | | Q3 | | | Q2 | | | Q1 | | | Q4 | | | Q3 | | | Q2 | | | Q1 | |
| Revenues | | 167,799 | | | 155,617 | | | 137,730 | | | 146,947 | | | 153,694 | | | 143,835 | | | 111,924 | | | 115,519 | |
| Net (loss) income | | (21,207 | ) | | (180 | ) | | (10,953 | ) | | 18,896 | | | 38,076 | | | 871 | | | 9,991 | | | 33,788 | |
| Basic EPS | | (0.07 | ) | | - | | | (0.04 | ) | | 0.07 | | | 0.13 | | | - | | | 0.03 | | | 0.12 | |
| Adjusted net income (loss) * | | 10,468 | | | 8,228 | | | 30,503 | | | 7,728 | | | 24,061 | | | 19,659 | | | (4,376 | ) | | 5,087 | |
| Adjusted basic EPS* | | 0.03 | | | 0.03 | | | 0.10 | | | 0.03 | | | 0.08 | | | 0.07 | | | (0.02 | ) | | 0.02 | |
| Adjusted EBITDA * | | 55,602 | | | 47,689 | | | 70,777 | | | 49,923 | | | 69,107 | | | 62,695 | | | 22,218 | | | 36,059 | |
| |
| (US$ per pound, except where indicated) | |
| Average realized copper price | | 4.13 | | | 4.23 | | | 4.49 | | | 3.89 | | | 3.75 | | | 3.83 | | | 3.78 | | | 4.02 | |
| Total operating costs * | | 2.42 | | | 2.92 | | | 2.99 | | | 2.46 | | | 1.91 | | | 2.20 | | | 2.66 | | | 2.94 | |
| Copper sales (million pounds) | | 27.4 | | | 26.3 | | | 22.6 | | | 27.7 | | | 31.4 | | | 28.1 | | | 22.8 | | | 20.8 | |
Financial results for the last eight quarters reflect: volatile copper and molybdenum prices and foreign exchange rates that impact realized sale prices; and variability in the quarterly sales volumes due to copper grades and timing of shipments which impacts revenue recognition. In addition, first quarter of 2024 and 2023 were both impacted by the gain recorded on the purchase price allocation for the Cariboo acquisition.
Critical Accounting Policies and Estimates
The Company's material accounting policies are presented in Note 2.4 of the 2024 annual consolidated financial statements. The preparation of the financial statements in conformity with IFRS Accounting Standards requires management to make judgments, estimates and assumptions that affect the application of accounting policies, including the accounting for the Cariboo acquisition and the reported amounts of assets, liabilities, income and expenses. Actual results may differ from these estimates. Estimates and underlying assumptions are reviewed on an ongoing basis. Revisions to accounting estimates are recognized in the period in which the estimates are revised and in any future periods affected.
In the process of applying the Company's accounting policies, significant areas where judgment is required include the determination of a joint arrangement, determining the timing of transfer of control of inventory for revenue recognition, provisions for environmental rehabilitation, reserve and resource estimation, functional currency, determination of the accounting treatment of the advance payment under the silver purchase and sale agreement reported as deferred revenue, determination of business or asset acquisition treatment, and recovery of other deferred tax assets.
Significant areas of estimation include reserve and resource estimation; fair value of assets and liabilities acquired in a business combination, asset valuations and the measurement of impairment charges or reversals; valuation of inventories; plant and equipment lives; tax provisions; provisions for environmental rehabilitation; valuation of financial instruments and derivatives; capitalized stripping costs and share-based compensation. Key estimates and assumptions made by management with respect to these areas have been disclosed in the notes to these consolidated financial statements as appropriate.
The accuracy of reserve and resource estimates is a function of the quantity and quality of available data and the assumptions made and judgment used in the engineering and geological interpretation, and may be subject to revision based on various factors. Changes in reserve and resource estimates may impact the carrying value of property, plant and equipment; the calculation of depreciation expense; the capitalization of stripping costs incurred during production; and the timing of cash flows related to the provision for environmental rehabilitation.
Changes in forecast prices of commodities, exchange rates, production costs and recovery rates may change the economic status of reserves and resources. Forecast prices of commodities, exchange rates, production costs and recovery rates, and discount rates assumptions, either individually or collectively, may impact the carrying value of derivative financial instruments, inventories, property, plant and equipment, and intangibles, as well as the measurement of impairment charges or reversals. These items also impacted the fair values of assets and liabilities recorded in the acquisition disclosed in the Note 3 of the December 31, 2024 Financial Statements.
Change in Accounting Policies
Several new accounting standards, amendments to existing standards and interpretations have been published by the IASB. Management anticipates that all relevant pronouncements will be adopted for the first period beginning on or after the effective date of the new standard.
New standards, amendments and pronouncements that became effective for the period, but did not have a material impact on the Company's audited consolidated financial statements, have not been disclosed. The Company adopted amendments to IAS 1, Presentation of Financial Statements and IAS 1, Presentation of Financial Statements, effective January 1, 2023 and January 1, 2024 respectively. Amendments to IAS 1, Presentation of Financial Statements required the disclosure of "material" rather than "significant" accounting policies.
Change in Accounting Policies (continued)
Amendments to IAS 1, Presentation of Financial Statements, clarifies that the classification of liabilities as current or non-current depends on the rights existing at the end of the reporting period as opposed to the expectations of exercising the right for settlement of the liability. These amendments did not change any of the amounts previously reported and did not impact any of the amounts in the current year.
In May 2024, the IASB issued 'Amendments to the Classification and Measurement of Financial Instruments (Amendments to IFRS 9 and IFRS 7)'. The amendments clarify the date of recognition and derecognition of some financial assets and financial liabilities, with a new exception that permits companies to elect to derecognize certain financial liabilities settled via electronic payment systems earlier than the settlement date. It also clarifies guidance on assessing whether a financial asset meets the solely payments of principal and interest criterion, it adds new disclosures for certain instruments with contractual terms that can change cash flows and updates the disclosures for equity instruments designated at fair value through other comprehensive income. The amendments apply for annual reporting periods beginning on or after January 1, 2026, and are applied retrospectively. The Company is currently evaluating the impact of the new standard on its consolidated financial statements.
In April 2024, the IASB published its new standard IFRS 18 'Presentation and Disclosures in Financial Statements' that will replace IAS 1 'Presentation of Financial Statements' which sets out presentation and base disclosure requirements for financial statements. The changes, which mostly affect the statement of comprehensive income, include the introduction of categories and defined subtotals to allow better comparison between entities. Along with the introduction of requirements to improve aggregation and disaggregation of line items presented on the primary financial statements, that aim at additional relevant information and ensure that material information is not obscured. Companies will also have to disclose information on Management-defined Performance Measures in the notes to the financial statements. The amendments apply for annual reporting periods beginning on or after January 1, 2027, and are applied retrospectively. The Company is currently evaluating the impact of the new standard on its consolidated financial statements.
Internal and Disclosure Controls Over Financial Reporting
The Company's management is responsible for establishing and maintaining adequate internal control over financial reporting (ICFR) and disclosure controls and procedures (DC&P).
The Company's internal control system over financial reporting is designed to provide reasonable assurance to management and the Board of Directors regarding the preparation and fair presentation of published financial statements. Internal control over financial reporting includes those policies and procedures that:
(1) pertain to the maintenance of records that in reasonable detail accurately and fairly reflect the transactions and dispositions of the assets of the Company;
(2) provide reasonable assurance that transactions are recorded as necessary to permit preparation of financial statements in accordance with IFRS Accounting Standards, and that receipts and expenditures of the Company are being made only in accordance with authorizations of management and directors of the Company; and
(3) provide reasonable assurance regarding prevention or timely detection of unauthorized acquisition, use or disposition of the Company's assets that could have a material effect on the financial statements.
Internal and Disclosure Controls Over Financial Reporting (continued)
The Company's internal control system over disclosure controls and procedures is designed to provide reasonable assurance that material information relating to the Company is made known to management and disclosed to others and information required to be disclosed by the Company in its annual filings, interim filings or other reports filed or submitted by us under securities legislation is recorded, processed, summarized and reported within the time periods specified in the securities legislation.
All internal control systems, no matter how well designed, have inherent limitations. Therefore, even those systems determined effective can provide only reasonable assurance with respect to financial reporting and disclosure.
There have been no changes in our internal control over financial reporting and disclosure controls and procedures during the 2024 financial year that have materially affected, or are reasonably likely to materially affect, internal control over financial reporting and disclosure.
The Company's management, under the supervision of the Chief Executive Officer and the Chief Financial Officer, assessed the effectiveness of the Company's internal control over financial reporting as of December 31, 2024. In making this assessment, it used the criteria set forth in the Internal Control-Integrated Framework (2013) issued by the Committee of Sponsoring Organizations of the Treadway Commission (COSO). Based on this assessment, management has concluded that, as of December 31, 2024, the Company's internal control over financial reporting is effective based on those criteria. The Company's certifying officers have evaluated the effectiveness of the ICFR and DC&P at the financial year end and concluded that ICFR and DC&P are effective as at December 31, 2024 based on the evaluation.
Financial Instruments
The Company uses a mixture of cash, long-term debt and shareholders' equity to maintain an efficient capital allocation and ensure adequate liquidity exists to meet the ongoing cash requirements of the business. In the normal course of business, the Company is inherently exposed to financial risks, including market risk, commodity price risk, interest rate risk, currency risk, liquidity risk and credit risk. The Company manages these risks in accordance with its risk management policies. To mitigate some of these inherent business risks, the Company uses commodity derivative instruments that do not qualify for hedge accounting treatment. These non-hedge derivatives are summarized in Note 7 to the Financial Statements. The financial risks and the Company's exposure to these risks, is provided in various tables in Note 26 of the Financial Statements. For a discussion on the methods used to value financial instruments, as well as significant assumptions, refer also to Notes 2 and 26 of the Financial Statements.
| Summary of Financial Instruments | | Carrying Amount | | | Associated Risks | |
| Financial assets | | | | | | |
| Amortized cost | | | | | | |
| Cash and equivalents | | 172,732 | | | Interest rate | |
| Accounts receivable | | 5,643 | | | Credit, Market | |
| Fair value through other comprehensive income (FVOCI) | | | | | | |
| Marketable securities | | 895 | | | Market | |
| Investment in private companies | | 500 | | | Market | |
| Fair value through profit and loss (FVPL) | | | | | | |
| Derivative asset copper put and call options | | 26,568 | | | Commodity price risk | |
| Financial liabilities | | | | | | |
| Accounts payable and accrued liabilities | | 129,927 | | | Currency | |
| Senior secured notes | | 719,250 | | | Currency | |
| Lease liabilities | | 13,296 | | | Interest rate | |
| Gibraltar equipment loans | | 48,998 | | | Currency, Interest rate | |
| Florence project debt facility | | 29,158 | | | Currency, Interest rate | |
| Cariboo consideration payable | | 145,868 | | | Commodity price risk | |
Related Party Transactions
Key management personnel
Key management personnel include the members of the Board of Directors and executive officers of the Company.
The Company contributes to a post-employment defined contribution pension plan on the behalf of certain key management personnel. This retirement compensation arrangement ("RCA Trust") was established to provide benefits to certain executive officers on or after retirement in recognition of their long service. Upon retirement, the participant is entitled to the distribution of the accumulated value of the contributions under the RCA Trust. Obligations for contributions to the defined contribution pension plan are recognized as compensation expense in the periods during which services are rendered by the executive officers.
Certain executive officers are entitled to termination and change in control benefits. In the event of termination without cause, other than a change in control, these executive officers are entitled to an amount ranging from
12-month to 18-months' salary. In the event of a change in control, if a termination without cause or a resignation occurs within 12 months following the change of control, these executive officers are entitled to receive, among other things, an amount ranging from 12-months' to 24-months' salary and accrued bonus, and all stock options held by these individuals will fully vest.
Executive officers and directors also participate in the Company's share option program (refer to Note 22 of the Financial Statements).
Compensation for key management personnel (including all members of the Board of Directors and executive officers) is as follows:
| | | Three months ended
December 31, | | | Year ended
December 31, | |
| (Cdn$ in thousands) | | 2024 | | | 2023 | | | 2024 | | | 2023 | |
| Salaries and benefits | | 1,085 | | | 943 | | | 5,465 | | | 4,986 | |
| Post-employment benefits | | 220 | | | 220 | | | 880 | | | 922 | |
| Share-based compensation (recovery) expense | | (650 | ) | | 1,268 | | | 7,543 | | | 4,761 | |
| | | 655 | | | 2,431 | | | 13,888 | | | 10,669 | |
Other related parties
Gibraltar Joint Venture
Under the terms of the joint venture operating agreement, Gibraltar pays the Company a management fee for services rendered by the Company as operator of the Gibraltar mine. In addition, the Company pays certain expenses on behalf of Gibraltar and invoices the Gibraltar for these expenses. In 2024, net management fee income of $137 (2023 - $713) and net reimbursable compensation expenses and third party costs of $61 (2023 - $289) were charged to the joint venture partner.
Non-GAAP Performance Measures
This document includes certain non-GAAP performance measures that do not have a standardized meaning prescribed by IFRS. These measures may differ from those used by, and may not be comparable to such measures as reported by, other issuers. The Company believes that these measures are commonly used by certain investors, in conjunction with conventional IFRS measures, to enhance their understanding of the Company's performance. These measures have been derived from the Company's financial statements and applied on a consistent basis. The following tables below provide a reconciliation of these non-GAAP measures to the most directly comparable IFRS Accounting Standards measure.
Total operating costs and site operating costs, net of by-product credits
Total costs of sales include all costs absorbed into inventory, as well as transportation costs and insurance recoverable. Site operating costs are calculated by removing net changes in inventory, depletion and amortization, insurance recoverable, and transportation costs from cost of sales. Site operating costs, net of by-product credits is calculated by subtracting by-product credits from the site operating costs. Site operating costs, net of by-product credits per pound are calculated by dividing the aggregate of the applicable costs by copper pounds produced. Total operating costs per pound is the sum of site operating costs, net of by-product credits and off-property costs divided by the copper pounds produced. By-product credits are calculated based on actual sales of molybdenum (net of treatment costs) and silver during the period divided by the total pounds of copper produced during the period. These measures are calculated on a consistent basis for the periods presented.
Non-GAAP Performance Measures (Continued)
Total operating costs and site operating costs, net of by-product credits (Continued)
| (Cdn$ in thousands, unless otherwise indicated) | | 2024
Q4 | | | 2024
Q3 | | | 2024
Q2 | | | 2024
Q11 | | | 2024
YE1 | |
| Cost of sales | | 134,940 | | | 124,833 | | | 108,637 | | | 122,528 | | | 490,938 | |
| Less: | | | | | | | | | | | | | | | |
| Depletion and amortization | | (24,641 | ) | | (20,466 | ) | | (13,721 | ) | | (15,024 | ) | | (73,852 | ) |
| Net change in inventories of finished goods | | 4,064 | | | 2,938 | | | (10,462 | ) | | (20,392 | ) | | (23,852 | ) |
| Net change in inventories of ore stockpiles | | (3,698 | ) | | 9,089 | | | 1,758 | | | 2,719 | | | 9,868 | |
| Transportation costs | | (10,170 | ) | | (8,682 | ) | | (6,408 | ) | | (10,153 | ) | | (35,413 | ) |
| Site operating costs | | 100,495 | | | 107,712 | | | 79,804 | | | 79,678 | | | 367,689 | |
| Less by-product credits: | | | | | | | | | | | | | | | |
| Molybdenum, net of treatment costs | | (16,507 | ) | | (8,962 | ) | | (7,071 | ) | | (6,112 | ) | | (38,652 | ) |
| Silver, excluding amortization of deferred revenue | | (139 | ) | | (241 | ) | | (144 | ) | | (137 | ) | | (661 | ) |
| Site operating costs, net of by-product credits | | 83,849 | | | 98,509 | | | 72,589 | | | 73,429 | | | 328,376 | |
| Total copper produced (thousand pounds) | | 28,595 | | | 27,101 | | | 20,225 | | | 26,694 | | | 102,615 | |
| Total costs per pound produced | | 2.94 | | | 3.63 | | | 3.59 | | | 2.75 | | | 3.20 | |
| Average exchange rate for the period (CAD/USD) | | 1.40 | | | 1.36 | | | 1.37 | | | 1.35 | | | 1.37 | |
Site operating costs, net of by-product credits
(US$ per pound) | | 2.10 | | | 2.66 | | | 2.62 | | | 2.04 | | | 2.33 | |
| Site operating costs, net of by-product credits | | 83,849 | | | 98,509 | | | 72,589 | | | 73,429 | | | 328,376 | |
| Add off-property costs: | | | | | | | | | | | | | | | |
| Treatment and refining costs | | 2,435 | | | 816 | | | 3,941 | | | 4,816 | | | 12,008 | |
| Transportation costs | | 10,170 | | | 8,682 | | | 6,408 | | | 10,153 | | | 35,413 | |
| Total operating costs | | 96,454 | | | 108,007 | | | 82,938 | | | 88,398 | | | 375,797 | |
| Total operating costs (C1) (US$ per pound) | | 2.42 | | | 2.92 | | | 2.99 | | | 2.46 | | | 2.66 | |
1 Q1 2024 includes the impact from the March 25, 2024 acquisition of Cariboo from Dowa and Furukawa, which increased the Company's Gibraltar mine ownership from 87.5% to 100%.
Non-GAAP Performance Measures (Continued)
Total operating costs and site operating costs, net of by-product credits (Continued)
| (Cdn$ in thousands, unless otherwise indicated) | | 2023
Q4 | | | 2023
Q3 | | | 2023
Q2 | | | 2023
Q11 | | | 2023
YE1 | |
| Cost of sales | | 93,914 | | | 94,383 | | | 99,854 | | | 86,407 | | | 374,558 | |
| Less: | | | | | | | | | | | | | | | |
| Depletion and amortization | | (13,326 | ) | | (15,993 | ) | | (15,594 | ) | | (12,027 | ) | | (56,940 | ) |
| Net change in inventories of finished goods | | (1,678 | ) | | 4,267 | | | 3,356 | | | (399 | ) | | 5,546 | |
| Net change in inventories of ore stockpiles | | (3,771 | ) | | 12,172 | | | 2,724 | | | 5,561 | | | 16,686 | |
| Transportation costs | | (10,294 | ) | | (7,681 | ) | | (6,966 | ) | | (5,104 | ) | | (30,045 | ) |
| Site operating costs | | 64,845 | | | 87,148 | | | 83,374 | | | 74,438 | | | 309,805 | |
| Oxide ore stockpile reclassification from capitalized stripping | | - | | | - | | | (3,183 | ) | | 3,183 | | | - | |
| Less by-product credits: | | | | | | | | | | | | | | | |
| Molybdenum, net of treatment costs | | (5,441 | ) | | (9,900 | ) | | (4,018 | ) | | (9,208 | ) | | (28,567 | ) |
| Silver, excluding amortization of deferred revenue | | 124 | | | 290 | | | (103 | ) | | (160 | ) | | 151 | |
| Site operating costs, net of by-product credits | | 59,528 | | | 77,538 | | | 76,070 | | | 68,253 | | | 281,389 | |
| Total copper produced (thousand pounds) | | 29,883 | | | 30,978 | | | 24,640 | | | 19,491 | | | 104,992 | |
| Total costs per pound produced | | 1.99 | | | 2.50 | | | 3.09 | | | 3.50 | | | 2.68 | |
| Average exchange rate for the period (CAD/USD) | | 1.36 | | | 1.34 | | | 1.34 | | | 1.35 | | | 1.35 | |
Site operating costs, net of by-product credits
(US$ per pound) | | 1.46 | | | 1.87 | | | 2.30 | | | 2.59 | | | 1.99 | |
| Site operating costs, net of by-product credits | | 59,528 | | | 77,538 | | | 76,070 | | | 68,253 | | | 281,389 | |
| Add off-property costs: | | | | | | | | | | | | | | | |
| Treatment and refining costs | | 7,885 | | | 6,123 | | | 4,986 | | | 4,142 | | | 23,136 | |
| Transportation costs | | 10,294 | | | 7,681 | | | 6,966 | | | 5,104 | | | 30,045 | |
| Total operating costs | | 77,707 | | | 91,342 | | | 88,022 | | | 77,499 | | | 334,570 | |
| Total operating costs (C1) (US$ per pound) | | 1.91 | | | 2.20 | | | 2.66 | | | 2.94 | | | 2.37 | |
1 Q1 2023 includes the impact from the March 15, 2023 acquisition of Cariboo from Sojitz, which increased the Company's Gibraltar mine ownership from 75% to 87.5%.
Non-GAAP Performance Measures (Continued)
Total Site Costs
Total site costs are comprised of the site operating costs charged to cost of sales as well as mining costs capitalized to property, plant and equipment in the period. This measure is intended to capture Taseko's share of the total site operating costs incurred in the quarter at Gibraltar calculated on a consistent basis for the periods presented.
(Cdn$ in thousands, unless otherwise indicated) -
100% basis (except for Q1 2024) | | 2024
Q4 | | | 2024
Q3 | | | 2024
Q2 | | | 2024
Q11 | | | 2024
YE1 | |
| Site operating costs | | 100,495 | | | 107,712 | | | 79,804 | | | 79,678 | | | 367,689 | |
| Add: | | | | | | | | | | | | | | | |
| Capitalized stripping costs | | 1,981 | | | 3,631 | | | 10,732 | | | 16,152 | | | 32,496 | |
| Total site costs - Taseko share | | 102,476 | | | 111,343 | | | 90,536 | | | 95,830 | | | 400,185 | |
| Total site costs - 100% basis | | 102,476 | | | 111,343 | | | 90,536 | | | 109,520 | | | 413,875 | |
1 Q1 2024 includes the impact from the March 25, 2024 acquisition of Cariboo from Dowa and Furukawa, which increased the Company's Gibraltar mine ownership from 87.5% to 100%.
(Cdn$ in thousands, unless otherwise indicated) -
87.5% basis (except for Q1 2023) | | 2023
Q4 | | | 2023
Q3 | | | 2023
Q2 | | | 2023
Q11 | | | 2023
YE1 | |
| Site operating costs | | 64,845 | | | 87,148 | | | 83,374 | | | 74,438 | | | 309,805 | |
| Add: | | | | | | | | | | | | | | | |
| Capitalized stripping costs | | 31,916 | | | 2,083 | | | 8,832 | | | 12,721 | | | 55,552 | |
| Total site costs - Taseko share | | 96,761 | | | 89,231 | | | 92,206 | | | 87,159 | | | 365,357 | |
| Total site costs - 100% basis | | 110,584 | | | 101,978 | | | 105,378 | | | 112,799 | | | 430,739 | |
1 Q1 2023 includes the impact from the March 15, 2023 acquisition of Cariboo from Sojitz, which increased the Company's Gibraltar mine ownership from 75% to 87.5%.
Non-GAAP Performance Measures (Continued)
Adjusted net income (loss) and Adjusted EPS
Adjusted net income (loss) removes the effect of the following transactions from net income as reported under IFRS:
- Unrealized foreign currency gains/losses;
- Unrealized gain/loss on derivatives;
- Other operating costs;
- Call premium on settlement of debt;
- Loss on settlement of long-term debt, net of capitalized interest;
- Bargain purchase gains on Cariboo acquisition;
- Gain on acquisition of control of Gibraltar;
- Realized gain on sale of finished goods inventory;
- Inventory write-ups to net realizable value that was sold or processed;
- Accretion and fair value adjustment on Florence royalty obligation; and
- Finance and other non-recurring costs for Cariboo acquisition.
Management believes these transactions do not reflect the underlying operating performance of our core mining business and are not necessarily indicative of future operating results. Furthermore, unrealized gains/losses on derivative instruments, changes in the fair value of financial instruments, and unrealized foreign currency gains/losses are not necessarily reflective of the underlying operating results for the reporting periods presented.
Adjusted EPS is the Adjusted net income (loss) attributable to common shareholders of the Company divided by the weighted average number of common shares outstanding during the period.
Non-GAAP Performance Measures (Continued)
Adjusted net income (loss) and Adjusted EPS (Continued)
| (Cdn$ in thousands, except per share amounts) | | 2024
Q4 | | | 2024
Q3 | | | 2024
Q2 | | | 2024
Q1 | | | 2024
YE | |
| Net (loss) income | | (21,207 | ) | | (180 | ) | | (10,953 | ) | | 18,896 | | | (13,444 | ) |
| Unrealized foreign exchange loss (gain) | | 40,462 | | | (7,259 | ) | | 5,408 | | | 13,688 | | | 52,299 | |
| Unrealized (gain) loss on derivatives | | (25,514 | ) | | 1,821 | | | 10,033 | | | 3,519 | | | (10,141 | ) |
| Other operating costs1 | | 4,132 | | | 4,098 | | | 10,435 | | | - | | | 18,665 | |
| Call premium on settlement of debt | | - | | | - | | | 9,571 | | | - | | | 9,571 | |
Loss on settlement of long term debt, net of
capitalized interest | | - | | | - | | | 2,904 | | | - | | | 2,904 | |
| Gain on Cariboo acquisition | | - | | | - | | | - | | | (47,426 | ) | | (47,426 | ) |
| Gain on acquisition of control of Gibraltar2 | | - | | | - | | | - | | | (14,982 | ) | | (14,982 | ) |
| Realized gain on sale of inventory3 | | - | | | - | | | 3,768 | | | 13,354 | | | 17,122 | |
Inventory write-ups to net realizable value that was
sold or processed4 | | 1,905 | | | 3,266 | | | 4,056 | | | - | | | 9,227 | |
Accretion and fair value adjustment on Florence
royalty obligation | | 3,682 | | | 3,703 | | | 2,132 | | | 3,416 | | | 12,933 | |
Accretion and fair value adjustment on consideration
payable to Cariboo | | 4,543 | | | 9,423 | | | 8,399 | | | 1,555 | | | 23,920 | |
| Non-recurring other expenses for Cariboo adjustment | | - | | | - | | | 394 | | | 138 | | | 532 | |
| Estimated tax effect of adjustments | | 2,465 | | | (6,644 | ) | | (15,644 | ) | | 15,570 | | | (4,253 | ) |
| Adjusted net income | | 10,468 | | | 8,228 | | | 30,503 | | | 7,728 | | | 56,927 | |
| Adjusted EPS | | 0.03 | | | 0.03 | | | 0.10 | | | 0.03 | | | 0.19 | |
1 Other operating costs relates to the in-pit crusher relocation project and care and maintenance costs due to the June 2024 labour strike.
2 The $15.0 million gain on acquisition of control of Gibraltar in Q1 2024 relates to the write-up of finished copper concentrate inventory for Taseko's 87.5% share to its fair value at March 25, 2024.
3 Cost of sales for the year ended December 31, 2024 included $17.1 million in write-ups to net realizable value for concentrate inventory held at the date of acquisition of control of Gibraltar (March 25, 2024) that were subsequently sold. The realized portion of the gains recorded in the first quarter for GAAP purposes was $13.4 million and for the second quarter were $3.8 million and have been included in Adjusted net income in the period they were sold.
4 Write-ups to net realizable value for inventory held at the date of acquisition of control of Gibraltar (March 25, 2024) totaled $9.2 million. The inventory write-ups in the first quarter for GAAP purposes have been included in Adjusted net income in the period they were sold or processed. Cost of sales for the year ended December 31, 2024 included $9.2 million in inventory write-ups that were subsequently sold or processed between the second and fourth quarter.
Non-GAAP Performance Measures (Continued)
Adjusted net income (loss) and Adjusted EPS (Continued)
| (Cdn$ in thousands, except per share amounts) | | 2023
Q4 | | | 2023
Q3 | | | 2023
Q2 | | | 2023
Q1 | | | 2023
YE | |
| Net income | | 38,076 | | | 871 | | | 9,991 | | | 33,788 | | | 82,726 | |
| Unrealized foreign exchange (gain) loss | | (14,541 | ) | | 14,582 | | | (10,966 | ) | | (950 | ) | | (11,875 | ) |
| Unrealized loss (gain) on derivatives | | 1,636 | | | 4,518 | | | (6,470 | ) | | 2,190 | | | 1,874 | |
| Gain on Cariboo acquisition | | - | | | - | | | - | | | (46,212 | ) | | (46,212 | ) |
| Finance and other non-recurring costs | | (916 | ) | | 1,244 | | | 1,714 | | | - | | | 2,042 | |
| Estimated tax effect of adjustments | | (194 | ) | | (1,556 | ) | | 1,355 | | | 16,271 | | | 15,876 | |
| Adjusted net income (loss) | | 24,061 | | | 19,659 | | | (4,376 | ) | | 5,087 | | | 44,431 | |
| Adjusted EPS | | 0.08 | | | 0.07 | | | (0.02 | ) | | 0.02 | | | 0.15 | |
Adjusted EBITDA
Adjusted EBITDA is presented as a supplemental measure of the Company's performance and ability to service debt. Adjusted EBITDA is frequently used by securities analysts, investors and other interested parties in the evaluation of companies in the industry, many of which present Adjusted EBITDA when reporting their results. Issuers of "high yield" securities also present Adjusted EBITDA because investors, analysts and rating agencies consider it useful in measuring the ability of those issuers to meet debt service obligations.
Adjusted EBITDA represents net income before interest, income taxes, and depreciation and also eliminates the impact of a number of items that are not considered indicative of ongoing operating performance. Certain items of expense are added and certain items of income are deducted from net income that are not likely to recur or are not indicative of the Company's underlying operating results for the reporting periods presented or for future operating performance and consist of:
- Unrealized foreign exchange gains/losses;
- Unrealized gain/loss on derivatives;
- Amortization of share-based compensation expense;
- Other operating costs;
- Call premium on settlement of debt;
- Loss on settlement of long-term debt;
- Bargain purchase gains on Cariboo acquisition;
- Gain on acquisition of control of Gibraltar;
- Realized gain on sale of finished goods inventory;
- Inventory write-ups to net realizable value that was sold or processed; and
- Finance and other non-recurring costs for Cariboo acquisition.
Non-GAAP Performance Measures (Continued)
Adjusted EBITDA (Continued)
| (Cdn$ in thousands) | | 2024
Q4 | | | 2024
Q3 | | | 2024
Q2 | | | 2024
Q1 | | | 2024
YE | |
| Net (loss) income | | (21,207 | ) | | (180 | ) | | (10,953 | ) | | 18,896 | | | (13,444 | ) |
| Add: | | | | | | | | | | | | | | | |
| Depletion and amortization | | 24,641 | | | 20,466 | | | 13,721 | | | 15,024 | | | 73,852 | |
| Finance and accretion expense | | 21,473 | | | 25,685 | | | 21,271 | | | 19,849 | | | 88,278 | |
| Finance income | | (1,674 | ) | | (1,504 | ) | | (911 | ) | | (1,086 | ) | | (5,175 | ) |
| Income tax expense (recovery) | | 11,707 | | | (200 | ) | | (3,247 | ) | | 23,282 | | | 31,542 | |
| Unrealized foreign exchange loss (gain) | | 40,462 | | | (7,259 | ) | | 5,408 | | | 13,688 | | | 52,299 | |
| Unrealized (gain) loss on derivatives | | (25,514 | ) | | 1,821 | | | 10,033 | | | 3,519 | | | (10,141 | ) |
Amortization of share-based compensation
(recovery) expense | | (323 | ) | | 1,496 | | | 2,585 | | | 5,667 | | | 9,425 | |
| Other operating costs | | 4,132 | | | 4,098 | | | 10,435 | | | - | | | 18,665 | |
| Call premium on settlement of debt | | - | | | - | | | 9,571 | | | - | | | 9,571 | |
| Loss on settlement of long-term debt | | - | | | - | | | 4,646 | | | - | | | 4,646 | |
| Gain on Cariboo acquisition | | - | | | - | | | - | | | (47,426 | ) | | (47,426 | ) |
| Gain on acquisition of control of Gibraltar1 | | - | | | - | | | - | | | (14,982 | ) | | (14,982 | ) |
| Realized gain on sale of inventory2 | | - | | | - | | | 3,768 | | | 13,354 | | | 17,122 | |
Inventory write-ups to net realizable value that was
sold or processed3 | | 1,905 | | | 3,266 | | | 4,056 | | | - | | | 9,227 | |
Non-recurring other expenses for Cariboo
acquisition | | - | | | - | | | 394 | | | 138 | | | 532 | |
| Adjusted EBITDA | | 55,602 | | | 47,689 | | | 70,777 | | | 49,923 | | | 223,991 | |
1 The $15.0 million gain on acquisition of control of Gibraltar in Q1 2024 relates to the write-up of finished copper concentrate inventory for Taseko's 87.5% share to its fair value at March 25, 2024.
2 Cost of sales for the year ended December 31, 2024 included $17.1 million in write-ups to net realizable value for concentrate inventory held at the date of acquisition of control of Gibraltar (March 25, 2024) that were subsequently sold. The realized portion of the gains recorded in the first quarter for GAAP purposes was $13.4 million and for the second quarter were $3.8 million and have been included in Adjusted net income in the period they were sold.
3 Write-ups to net realizable value for inventory held at the date of acquisition of control of Gibraltar (March 25, 2024) totaled $9.2 million. The inventory write-ups in the first quarter for GAAP purposes have been included in Adjusted net income in the period they were sold or processed. Cost of sales for the year ended December 31, 2024 included $9.2 million in inventory write-ups that were subsequently between the second and fourth quarter.
Non-GAAP Performance Measures (Continued)
Adjusted EBITDA (Continued)
| (Cdn$ in thousands) | | 2023
Q4 | | | 2023
Q3 | | | 2023
Q2 | | | 2023
Q1 | | | 2023
YE | |
| Net income | | 38,076 | | | 871 | | | 9,991 | | | 33,788 | | | 82,726 | |
| Add: | | | | | | | | | | | | | | | |
| Depletion and amortization | | 13,326 | | | 15,993 | | | 15,594 | | | 12,027 | | | 56,940 | |
| Finance and accretion expense | | 12,804 | | | 14,285 | | | 13,468 | | | 12,309 | | | 52,866 | |
| Finance income | | (972 | ) | | (322 | ) | | (757 | ) | | (921 | ) | | (2,972 | ) |
| Income tax expense | | 17,205 | | | 12,041 | | | 678 | | | 20,219 | | | 50,143 | |
| Unrealized foreign exchange (gain) loss | | (14,541 | ) | | 14,582 | | | (10,966 | ) | | (950 | ) | | (11,875 | ) |
| Unrealized loss (gain) on derivatives | | 1,636 | | | 4,518 | | | (6,470 | ) | | 2,190 | | | 1,874 | |
| Amortization of share-based compensation expense | | 1,573 | | | 727 | | | 417 | | | 3,609 | | | 6,326 | |
| Gain on Cariboo acquisition | | - | | | - | | | - | | | (46,212 | ) | | (46,212 | ) |
| Non-recurring other expenses for Cariboo acquisition | | - | | | - | | | 263 | | | - | | | 263 | |
| Adjusted EBITDA | | 69,107 | | | 62,695 | | | 22,218 | | | 36,059 | | | 190,079 | |
Non-GAAP Performance Measures (Continued)
Earnings from mining operations before depletion, amortization, and non-recurring items
Earnings from mining operations before depletion, amortization, and non-recurring items is earnings from mining operations with depletion and amortization, and any items that are not considered indicative of ongoing operating performance added back. The Company discloses this measure, which has been derived from our financial statements and applied on a consistent basis, to assist in understanding the results of the Company's operations and financial position and it is meant to provide further information about the financial results to investors.
| (Cdn$ in thousands) | | 2024
Q4 | | | 2024
Q3 | | | 2024
Q2 | | | 2024
Q1 | | | 2024
YE | |
| Earnings from mining operations | | 28,727 | | | 26,686 | | | 44,948 | | | 24,419 | | | 124,780 | |
| Add: | | | | | | | | | | | | | | | |
| Depletion and amortization | | 24,641 | | | 20,466 | | | 13,721 | | | 15,024 | | | 73,852 | |
| Realized gain on sale of inventory1 | | - | | | - | | | 3,768 | | | 13,354 | | | 17,122 | |
Inventory write-ups to net realizable value that
was sold or processed2 | | 1,905 | | | 3,266 | | | 4,056 | | | - | | | 9,227 | |
| Other operating costs3 | | 4,132 | | | 4,098 | | | 10,435 | | | - | | | 18,665 | |
| Earnings from mining operations before depletion, amortization, and non-recurring items | | 59,405 | | | 54,516 | | | 76,928 | | | 52,797 | | | 243,646 | |
1 Cost of sales for the year ended December 31, 2024 included $17.1 million in write-ups to net realizable value for concentrate inventory held at the date of acquisition of control of Gibraltar (March 25, 2024) that were subsequently sold. The realized portion of the gains recorded in the first quarter for GAAP purposes was $13.4 million and for the second quarter were $3.8 million and have been included in Adjusted net income in the period they were sold.
2 Write-ups to net realizable value for inventory held at the date of acquisition of control of Gibraltar (March 25, 2024) totaled $9.2 million. The inventory write-ups in the first quarter for GAAP purposes have been included in Adjusted net income in the period they were sold or processed. Cost of sales for the year ended December 31, 2024 included $9.2 million in inventory write-ups that were subsequently sold or processed in the second and third quarters.
3 Other operating costs relates to the in-pit crusher relocation project and care and maintenance costs due to the June 2024 labour strike.
During the year ended December 31, 2024, the realized gain on sale of inventory and inventory write-ups to net realizable value that was sold or processed, relates to inventory held at the date of acquisition of control of Gibraltar (March 25, 2024) that was written-up from book value to net realizable value and subsequently sold or processed.
| (Cdn$ in thousands) | | 2023
Q4 | | | 2023
Q3 | | | 2023
Q2 | | | 2023
Q1 | | | 2023
YE | |
| Earnings from mining operations | | 59,780 | | | 49,452 | | | 12,070 | | | 29,112 | | | 150,414 | |
| Add: | | | | | | | | | | | | | | | |
| Depletion and amortization | | 13,326 | | | 15,993 | | | 15,594 | | | 12,027 | | | 56,940 | |
Earnings from mining operations before depletion
and amortization | | 73,106 | | | 65,445 | | | 27,664 | | | 41,139 | | | 207,354 | |
Non-GAAP Performance Measures (Continued)
Site operating costs per ton milled
The Company discloses this measure, which has been derived from our financial statements and applied on a consistent basis, to provide assistance in understanding the Company's site operations on a tons milled basis.
| (Cdn$ in thousands, except per ton milled amounts) | | 2024
Q4 | | | 2024
Q3 | | | 2024
Q2 | | | 2024
Q11 | | | 2024
YE1 | |
| Site operating costs (included in cost of sales) - Taseko share | | 100,495 | | | 107,712 | | | 79,804 | | | 79,678 | | | 367,689 | |
| Site operating costs - 100% basis | | 100,495 | | | 107,712 | | | 79,804 | | | 90,040 | | | 378,050 | |
| Tons milled (thousands) | | 8,250 | | | 7,572 | | | 5,728 | | | 7,677 | | | 29,227 | |
| Site operating costs per ton milled | $ | 12.18 | | $ | 14.23 | | $ | 13.93 | | $ | 11.73 | | $ | 12.93 | |
1 Q1 2024 includes the impact from the March 25, 2024 acquisition of Cariboo from Dowa and Furukawa, which increased the Company's Gibraltar ownership from 87.5% to 100%.
| (Cdn$ in thousands, except per ton milled amounts) | | 2023
Q4 | | | 2023
Q3 | | | 2023
Q2 | | | 2023
Q11 | | | 2023
YE1 | |
| Site operating costs (included in cost of sales) - Taseko share | | 64,845 | | | 87,148 | | | 83,374 | | | 74,438 | | | 309,805 | |
| Site operating costs - 100% basis | | 74,109 | | | 99,598 | | | 95,285 | | | 95,838 | | | 364,830 | |
| Tons milled (thousands) | | 7,626 | | | 8,041 | | | 7,234 | | | 7,093 | | | 29,994 | |
| Site operating costs per ton milled | $ | 9.72 | | $ | 12.39 | | $ | 13.17 | | $ | 13.54 | | $ | 12.16 | |
1 Q1 2023 includes the impact from the March 15, 2023 acquisition of Cariboo from Sojitz, which increased the Company's Gibraltar mine ownership from 75% to 87.5%.
Technical Information
The technical information contained in this MD&A related to the Florence Copper Project is based upon the report entitled: "NI 43-101 Technical Report - Florence Copper Project, Pinal County, Arizona" issued March 30, 2023 with an effective date of March 15, 2023 which is available on SEDAR+. The Florence Copper Project Technical Report was prepared under the supervision of Richard Tremblay, P.Eng., MBA, Richard Weymark, P.Eng., MBA, and Robert Rotzinger, P.Eng. Mr. Tremblay is employed by the Company as Chief Operating Officer, Mr. Weymark is Vice President Engineering, and Robert Rotzinger is Vice President Capital Projects. All three are Qualified Persons as defined by NI 43-101.