Exhibit 99.2
TASEKO MINES LIMITED
Management’s Discussion and Analysis
This management discussion and analysis (“MD&A”) is intended to help the reader understand Taseko Mines Limited (“Taseko”, “we”, “our” or the “Company”), our operations, financial performance, and current and future business environment. This MD&A is intended to supplement and complement the consolidated financial statements and notes thereto, prepared in accordance with IAS 34 of International Financial Reporting Standards (“IFRS”) for the three months ended March 31, 2019 (the “Financial Statements”). You are encouraged to review the Financial Statements in conjunction with your review of this MD&A and the Company’s other public filings, which are available on the Canadian Securities Administrators’ website atwww.sedar.com and on the EDGAR section of the United States Securities and Exchange Commission’s (“SEC”) website atwww.sec.gov.
This MD&A is prepared as of May 7, 2019. All dollar figures stated herein are expressed in Canadian dollars, unless otherwise specified.
Cautionary Statement on Forward-Looking Information
This discussion includes certain statements that may be deemed “forward-looking statements”. All statements in this discussion, other than statements of historical facts, that address future production, reserve potential, exploration drilling, exploitation activities, and events or developments that the Company expects are forward-looking statements. Although we believe the expectations expressed in such forward-looking statements are based on reasonable assumptions, such statements are not guarantees of future performance and actual results or developments may differ materially from those in the forward-looking statements. Factors that could cause actual results to differ materially from those in forward-looking statements include market prices, exploitation and exploration successes, continued availability of capital and financing and general economic, market or business conditions. Investors are cautioned that any such statements are not guarantees of future performance and actual results or developments may differ materially from those projected in the forward-looking statements. All of the forward-looking statements made in this MD&A are qualified by these cautionary statements. We disclaim any intention or obligation to update or revise any forward-looking statements whether as a result of new information, future events or otherwise, except to the extent required by applicable law. Further information concerning risks and uncertainties associated with these forward-looking statements and our business may be found in the Company’s other public filings with the SEC and Canadian provincial securities regulatory authorities.
1
TASEKO MINES LIMITED
Management’s Discussion and Analysis
CONTENTS |
| |||
OVERVIEW | 3 | |||
HIGHLIGHTS | 3 | |||
REVIEW OF OPERATIONS | 5 | |||
GIBRALTAR OUTLOOK | 6 | |||
REVIEW OF PROJECTS | 6 | |||
MARKET REVIEW | 8 | |||
FINANCIAL PERFORMANCE | 8 | |||
FINANCIAL CONDITION REVIEW | 12 | |||
SUMMARY OF QUARTERLY RESULTS | 15 | |||
CRITICAL ACCOUNTING POLICIES AND ESTIMATES | 15 | |||
INTERNAL AND DISCLOSURE CONTROLS OVER FINANCIAL REPORTING | 16 | |||
RELATED PARTY TRANSACTIONS | 17 | |||
NON-GAAP PERFORMANCE MEASURES | 18 | |||
2
TASEKO MINES LIMITED
Management’s Discussion and Analysis
OVERVIEW
Taseko Mines Limited (“Taseko” or “Company”) is a mining company that seeks to create long-term shareholder value by acquiring, developing, and operating large tonnage mineral deposits which, under conservative forward metal price assumptions, are capable of supporting a mine for ten years or longer. The Company’s sole operating asset is the 75% owned Gibraltar Mine, which is located in central British Columbia and is one of the largest copper mines in North America. Taseko also owns the Florence Copper Project, which is advancing towards production, as well as the Aley niobium, Harmony gold, Yellowhead copper, and New Prosperity gold-copper projects.
HIGHLIGHTS
Financial Data
| Three months ended March 31,
| |||||||||||
| (Cdn$ in thousands, except for per share amounts) | 2019 | 2018 | Change | |||||||||
Revenues | 70,274 | 64,179 | 6,095 | |||||||||
Earnings from mining operations before depletion and amortization* | 15,729 | 13,544 | 2,185 | |||||||||
Loss from mining operations | (4,455) | (1,236) | (3,219) | |||||||||
Net loss | (7,931) | (18,481) | 10,550 | |||||||||
Per share - basic (“EPS”) | (0.03) | (0.08) | 0.05 | |||||||||
Adjusted net loss* | (14,419) | (10,999) | (3,420) | |||||||||
Per share - basic (“adjusted EPS”)* | (0.06) | (0.05) | (0.01) | |||||||||
EBITDA* | 16,658 | 370 | 16,288 | |||||||||
Adjusted EBITDA* | 10,245 | 7,537 | 2,708 | |||||||||
Cash flows provided by operations | 7,191 | 11,556 | (4,365) | |||||||||
Operating Data (Gibraltar - 100% basis)
|
Three months ended March 31,
| |||||||||||
| 2019 | 2018 | Change | ||||||||||
Tons mined (millions) | 23.3 | 26.7 | (3.4) | |||||||||
Tons milled (millions) | 6.8 | 7.5 | (0.7) | |||||||||
Production (million pounds Cu) | 24.9 | 22.9 | 2.0 | |||||||||
Sales (million pounds Cu) | 23.3 | 22.8 | 0.5 | |||||||||
*Non-GAAP performance measure. See page 18 of this MD&A.
3
TASEKO MINES LIMITED
Management’s Discussion and Analysis
HIGHLIGHTS - CONTINUED
First Quarter Review
| • | First quarter earnings from mining operations before depletion and amortization* were $15.7 million, and Adjusted EBITDA was $10.2 million; |
| • | Net loss was $7.9 million ($0.03 per share) and includes an unrealized foreign exchange gain of $6.7 million. Adjusted net loss* was $14.4 million ($0.06 per share); |
| • | Cash flow from operations was $7.2 million; |
| • | Copper production in the first quarter was 24.9 million pounds and copper sales were 23.3 million pounds (100% basis); |
| • | Molybdenum production was 738 thousand pounds, a 67% increase over the first quarter of 2018, due to strong operating performance in the molybdenum plant. |
| • | Site operating costs, net ofby-product credits* were US$1.91 per pound produced and Total operating costs (C1)* were US$2.21 per pound produced; |
| • | In April 2019, the Company announced first copper production from the test facility at the Florence Copper project. The first harvest resulted in 3,700 pounds of copper cathode, which was assayed at higher than 99.9% copper; |
| • | The Company closed its acquisition of Yellowhead Mining Inc. (“Yellowhead”) on February 15, 2019. The environmental review process for the Yellowhead Project has been restarted, and Taseko’s technical team is working on a number of engineering initiatives to improve the project economics with the objective of issuing a new43-101 technical report by the end of 2019; and |
| • | The Company’s cash balance at March 31, 2019 was $34.5 million. Subsequent to the first quarter, the Company entered into an equipment loan, secured on existing mine equipment, and received net proceeds of $12.5 million. |
*Non-GAAP performance measure. See page 18 of this MD&A
4
TASEKO MINES LIMITED
Management’s Discussion and Analysis
REVIEW OF OPERATIONS
Gibraltar Mine (75% Owned)
Operating data (100% basis)
| Q1 2019 | Q4 2018 | Q3 2018 | Q2 2018 | Q1 2018 | |||||||||||||||
Tons mined (millions) | 23.3 | 28.4 | 29.0 | 27.4 | 26.7 | |||||||||||||||
Tons milled (millions) | 6.8 | 7.1 | 8.0 | 7.5 | 7.5 | |||||||||||||||
Strip ratio | 3.2 | 5.1 | 1.7 | 1.9 | 4.1 | |||||||||||||||
Site operating cost per ton milled (CAD$)* | $10.88 | $9.16 | $10.60 | $10.31 | $8.68 | |||||||||||||||
Copper concentrate | ||||||||||||||||||||
Head grade (%) | 0.216 | 0.222 | 0.314 | 0.263 | 0.201 | |||||||||||||||
Copper recovery (%) | 84.6 | 81.3 | 85.9 | 85.3 | 75.7 | |||||||||||||||
Production (million pounds Cu) | 24.9 | 25.8 | 43.0 | 33.5 | 22.9 | |||||||||||||||
Sales (million pounds Cu) | 23.3 | 42.7 | 28.8 | 32.2 | 22.8 | |||||||||||||||
Inventory (million pounds Cu) | 3.1 | 1.6 | 18.5 | 4.2 | 2.9 | |||||||||||||||
Molybdenum concentrate | ||||||||||||||||||||
Production (thousand pounds Mo) | 738 | 727 | 690 | 506 | 443 | |||||||||||||||
Sales (thousand pounds Mo) | 770 | 738 | 709 | 424 | 433 | |||||||||||||||
Per unit data (US$ per pound produced)* | ||||||||||||||||||||
Site operating costs* | $2.23 | $1.92 | $1.50 | $1.78 | $2.25 | |||||||||||||||
By-product credits* | (0.32) | (0.30) | (0.16) | (0.12) | (0.23) | |||||||||||||||
Site operating costs, net ofby-product credits* | $1.91 | $1.62 | $1.34 | $1.66 | $2.02 | |||||||||||||||
Off-property costs | 0.30 | 0.49 | 0.24 | 0.32 | 0.31 | |||||||||||||||
Total operating costs (C1)* | $2.21 | $2.11 | $1.58 | $1.98 | $2.33 | |||||||||||||||
*Non-GAAP performance measure. See page 18 of this MD&A.
5
TASEKO MINES LIMITED
Management’s Discussion and Analysis
OPERATIONS ANALYSIS
First Quarter Operating Results
Copper production in the first quarter was 24.9 million pounds. Copper grade for the quarter averaged 0.216%, which was in line with management expectations and the mine plan, and approximately 15% below the life of mine average grade. Production was also affected by lower than planned mill throughput as a result of harder ore.
A total of 23.3 million tons were mined during the period, which was below plan due an extended period of extremely cold weather and unplanned mechanical issues which impacted shovel availability. The strip ratio for the first quarter was 3.2 to 1, and mill feed was supplemented with 1.2 million tons of ore drawn from the stockpile.
Site operating cost per ton milled* was $10.88 in the first quarter of 2019. In addition, capitalized stripping costs totaled $8.0 million (75% basis), or $1.57 per ton milled.
Total site spending (including capitalized stripping costs) was 7% lower than the previous quarter. However, site operating costs per pound produced* increased to US$2.23 from US$1.92 in the previous quarter, as a smaller portion of costs were allocated to capitalized stripping in the current period.
Molybdenum production was 738 thousand pounds in the first quarter, a result of continued strong molybdenum plant operating performance.By-product credits per pound of copper produced* increased to US$0.32 in the first quarter from US$0.30 in the previous quarter.
Off-property costs per pound produced* were US$0.30 for the first quarter of 2019.Off-property costs consist of concentrate treatment, refining and transportation costs, and these costs are in line with recent quarters.
GIBRALTAR OUTLOOK
Gibraltar is expected to produce approximately 130 million pounds(+/-5%) on a 100% basis in 2019, comparable to the production level achieved in 2018. While there will be quarterly fluctuations in both copper and molybdenum production, the Company does not anticipate those fluctuations to be as significant as in 2018. The fundamentals for copper remain strong and most industry analysts are projecting a growing deficit and higher copper prices in the coming years.
REVIEW OF PROJECTS
Taseko’s strategy has been to grow the Company by leveraging cash flow from the Gibraltar Mine to assemble and develop a pipeline of projects. We continue to believe this will generate long-term returns for shareholders. Our development projects are located in British Columbia and Arizona and represent a diverse range of metals, including gold, copper, molybdenum and niobium. Our current focus is on the development of the Florence Copper Project.
*Non-GAAP performance measure. See page 18 of this MD&A
6
TASEKO MINES LIMITED
Management’s Discussion and Analysis
Florence Copper
Wellfield operations at the Production Test Facility (“PTF”) commenced in the fourth quarter of 2018. During the first quarter of 2019, concentrations of copper in the leach solution increased to levels which allowed the SX/EW plant to begin operation, and on April 12th the Company announced that the SX/EW plant was producing first copper.
The initial leaching period has taken approximately three months which was in line with expectations. The proportion of ore contacted underground with leach solution (known as “Sweep Efficiency”) has been encouragingto-date. The Company’s modelling predicted a 55% Sweep Efficiency after the first year of leaching and that level was achieved after the first three months.
The main focus of the PTF phase is to demonstrate to regulators and key stakeholders that hydraulic control of underground leach solutions can be maintained, and provide valuable data to validate the Company’s leach model as well as optimize well designs and performance and hydraulic control parameters. Successful operation of thein-situ leaching process will allow permits to be amended for the full scale commercial operation, which is expected to produce 85 million pounds of copper cathode annually for 20 years. The permit amendment process has started and it is anticipated that construction of the commercial scale operation could be commenced in the first half of 2020.
The estimated capital cost of the commercial scale operation is US$204 million and the Company has begun initial discussions to advance project financing options from a variety of sources including debt providers, royalty companies, and potential joint venture partners. Management is encouraged by the expressions of interest from all potential sources to date, and is targeting to have committed funding in place before the end of the year.
Total expenditures at the Florence Project in the first quarter of 2019 were $3.3 million which includes PTF operation and other project development costs.
Yellowhead Copper
On December 4, 2018, the Company entered into an agreement to acquire all of the outstanding common shares of Yellowhead Mining Inc. (“Yellowhead”) that it did not already own, in exchange for 17.3 million Taseko common shares. The transaction was structured as a plan of arrangement pursuant to the Business Corporations Act (British Columbia) and required the approval of the Supreme Court of British Columbia and Yellowhead shareholders. All approvals were received and the transaction closed on February 15, 2019.
Yellowhead holds a 100% interest in a copper-gold-silver development project located in south-central British Columbia. The project feasibility study dated July 31, 2014, proposed a 70,000 tonne per day concentrator with totalpre-production capital costs of approximately $1 billion and an average operating cost of US$1.46 per pound of copper. Using US$3.00 per pound of copper, a Canadian/US dollar exchange rate of 0.80, an 8% discount rate and other assumptions from the 2014 feasibility study results in apre-tax net present value of $1.1 billion.
Since the closing of the acquisition, Taseko has restarted the environmental review process for the Yellowhead Copper Project, and the Company’s technical team has commenced work on a number of engineering initiatives to improve the project economics with the objective of issuing a new43-101 technical report by the end of 2019.
Aley Niobium
Environmental monitoring on the project continues and product marketing initiatives are underway. A drill program was completed in the third quarter of 2018 to collect samples for further metallurgical testing. Aley project expenditures were $0.1 million in the first quarter of 2019.
7
TASEKO MINES LIMITED
Management’s Discussion and Analysis
MARKET REVIEW
Copper Molybdenum Canadian/US Dollar Exchange
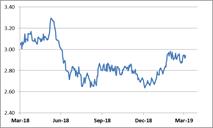
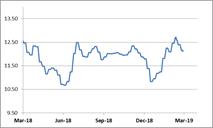
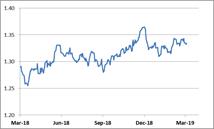
Prices (USD per pound for Commodities)
(Source Data: Bank of Canada, Platts Metals, and London Metals Exchange)
Copper prices have been on an upward trend during the first quarter of 2019, with prices increasing by approximately 9%. The average price of London Metals Exchange (“LME”) copper was US$2.82 per pound in the first quarter of 2019, which was slightly higher than the fourth quarter of 2018 and is approximately 11% lower than the first quarter of 2018. Changes in Chinese economic demand, copper supply disruptions, global trade policies, interest rate expectations and speculative investment activity have all contributed to the recent price volatility. Despite the short-term volatility, management continues to believe that the copper market will benefit from tight mine supply going forward.
The average molybdenum price was US$11.78 per pound in the first quarter of 2019, which was 2% lower than the fourth quarter of 2018. The Company’s sales agreements specify molybdenum pricing based on the published Platts Metals reports.
Approximately 80% of the Gibraltar Mine’s costs are Canadian dollar denominated and therefore, fluctuations in the Canadian/US dollar exchange rate can have a significant effect on the Company’s operating results and unit production costs, which are reported in US dollars. The Canadian dollar strengthened by approximately 2% during the first quarter of 2019.
FINANCIAL PERFORMANCE
Earnings
The Company’s net loss was $7.9 million ($0.03 per share) for the three months ended March 31, 2019, compared to a net loss of $18.5 million ($0.08 per share) for the same period in 2018. The lower loss in the current period was primarily due to $6.7 million unrealized foreign exchange gain as compared to an $8.3 million loss for the same period in 2018, partially offset by higher depletion and amortization expense.
Earnings from mining operations before depletion and amortization* was $15.7 million for the three months ended March 31, 2019, compared to $13.5 million for the same period in 2018. The increase in the current period was a result of higher molybdenum sales and positive price adjustments on settlement receivables.
*Non-GAAP performance measure. See page 18 of this MD&A
8
TASEKO MINES LIMITED
Management’s Discussion and Analysis
Included in net loss are a number of items that management believes require adjustment in order to better measure the underlying performance of the business. The following items have been adjusted as management believes they are not indicative of a realized economic gain/loss or the underlying performance of the business in the period:
| Three months ended March 31, | ||||||||||||
| (Cdn$ in thousands) | 2019 | 2018 | Change | |||||||||
Net loss | (7,931) | (18,481) | 10,550 | |||||||||
Unrealized foreign exchange (gain) loss | (6,689) | 8,332 | (15,021) | |||||||||
Unrealized loss (gain) on copper put options | 276 | (1,165) | 1,441 | |||||||||
Estimated tax effect of adjustments | (75) | 315 | (390) | |||||||||
Adjusted net loss* | (14,419) | (10,999) | (3,420) | |||||||||
*Non-GAAP performance measure. See page 18 of this MD&A
In the three months ended March 31, 2019, the Canadian dollar strengthened resulting in an unrealized foreign exchange gain of $6.7 million. The unrealized foreign exchange gain was primarily driven by the translation of the Company’s US dollar denominated debt.
Revenues
| Three months ended March 31, | ||||||||||||
| (Cdn$ in thousands) | 2019 | 2018 | Change | |||||||||
Copper in concentrate | 64,646 | 66,143 | (1,497) | |||||||||
Molybdenum concentrate | 8,937 | 5,014 | 3,923 | |||||||||
Silver | 1,012 | 940 | 72 | |||||||||
Price adjustments on settlement receivables | 1,207 | (3,305) | 4,512 | |||||||||
Total gross revenue | 75,802 | 68,792 | 7,010 | |||||||||
Less: treatment and refining costs | (5,528) | (4,613) | (915) | |||||||||
Revenue | 70,274 | 64,179 | 6,095 | |||||||||
(thousands of pounds, unless otherwise noted) | ||||||||||||
Copper in concentrate* | 16,850 | 16,484 | 366 | |||||||||
Average realized copper price (US$ per pound) | 2.91 | 2.98 | (0.07) | |||||||||
Average LME copper price (US$ per pound) | 2.82 | 3.16 | (0.34) | |||||||||
Average exchange rate (US$/CAD) | 1.33 | 1.26 | 0.07 | |||||||||
* This amount includes a net smelter payable deduction of approximately 3.5% to derive net payable pounds of copper sold.
Copper revenues for the three months ended March 31, 2019 decreased by $1.5 million, compared to the same period in 2018, primarily due to lower realized copper prices, partially offset by a slight increase in copper sales volumes.
During the three months ended March 31, 2019, positive price adjustments of $0.9 million were recorded for provisionally priced copper concentrate. These adjustments resulted in a US$0.04 per pound increase to the average realized copper price for the three months period.
9
TASEKO MINES LIMITED
Management’s Discussion and Analysis
Molybdenum revenues for the three months ended March 31, 2019 increased by $3.9 million, compared to the same period in 2018. The increase was due to higher molybdenum sales volumes in the current period. Molybdenum sales volumes were 578 thousand pounds (75% basis) in the first quarter, a result of continued strong molybdenum plant operating performance. During the three months ended March 31, 2019, a price adjustment of positive $0.3 million was recorded for provisionally priced molybdenum concentrate.
Cost of sales
| Three months ended March 31, | ||||||||||||
| (Cdn$ in thousands) | 2019 | 2018 | Change | |||||||||
Site operating costs | 55,430 | 48,877 | 6,553 | |||||||||
Transportation costs | 3,288 | 2,829 | 459 | |||||||||
Changes in inventories of finished goods | (4,046) | (967) | (3,079) | |||||||||
Changes in inventories of ore stockpiles | (127) | 3,896 | (4,023) | |||||||||
Insurance recovery | - | (4,000) | 4,000 | |||||||||
Production costs | 54,545 | 50,635 | 3,910 | |||||||||
Depletion and amortization | 20,184 | 14,780 | 5,404 | |||||||||
Cost of sales | 74,729 | 65,415 | 9,314 | |||||||||
Site operating costs per ton milled* | $10.88 | $8.68 | $2.20 | |||||||||
*Non-GAAP performance measure. See page 18 of this MD&A
Site operating costs for the three months ended March 31, 2019 increased by $6.6 million.
Site operating costs exclude costs that are allocated to capitalized stripping as a result of waste stripping in the Granite pit, in accordance with the mine plan. Total site spending at Gibraltar (including capitalized stripping costs) was in line with the first quarter of 2018, however site operating costs increased because a smaller portion of mining costs were allocated to capitalized stripping. For the three months ended March 31, 2019, capitalized stripping costs were $8.0 million, compared to $14.7 million for the same period in 2018.
Cost of sales is also impacted by changes in copper inventories and ore stockpiles. Inventory of copper in concentrate increased by 1.5 million pounds in the period, resulting in an increase in finished goods inventories (decrease in cost of sales) of $4.0 million.
The stockpiled ore tonnage decreased by 1.3 million tons during the period. During the same period, the Company recorded an impairment reversal of $1.6 million to adjust the carrying value of ore stockpile inventories to net realizable value.
Depletion and amortization for three months ended March 31, 2019 increased by $5.4 million over the same period in 2018. These differences are primarily due to increased amortization of capitalized stripping costs which has increased in the current year as ore tons are now being mined from the new section of the Granite pit and amortization on the right of use assets recognized under a new accounting policy in the first quarter of 2019.
For the three months ended March 31, 2018, the Company had recognized an insurance recovery of $4.0 million (75% basis) related to the Cariboo region wildfires in 2017.
10
TASEKO MINES LIMITED
Management’s Discussion and Analysis
Other operating (income) expenses
| Three months ended March 31, | ||||||||||||
| (Cdn$ in thousands) | 2019 | 2018 | Change | |||||||||
General and administrative | 4,473 | 4,751 | (278) | |||||||||
Share-based compensation expense (recovery) | 1,714 | (995) | 2,709 | |||||||||
Exploration and evaluation | 469 | 845 | (376) | |||||||||
Realized loss on copper put options | 567 | 1,308 | (741) | |||||||||
Unrealized loss (gain) on derivative instruments | 276 | (1,165) | 1,441 | |||||||||
Other income, net | (565) | (331) | (234) | |||||||||
| 6,934 | 4,413 | 2,521 | ||||||||||
Share-based compensation expense increased for the three months ended March 31, 2019, primarily due to the revaluation of the liability for deferred share units resulting from an increase in the Company’s share price. Share-based compensation expense is comprised of amortization of share options and performance share units and the expense on the deferred share units. More information is set out in Note 15 of the March 31, 2019 condensed consolidated interim financial statements.
Exploration and evaluation costs for the three months ended March 31, 2019, represent costs associated with the New Prosperity project.
During the three months ended March 31, 2019, the Company incurred a realized loss of $0.6 million from copper put options that settled during the period. The unrealized loss of $0.3 million relates to the fair value adjustment of outstanding copper put options.
Finance expenses
Three months ended March 31, | ||||||||||||
| (Cdn$ in thousands) | 2019 | 2018 | Change | |||||||||
Interest expense | 8,253 | 7,810 | 443 | |||||||||
Finance expense – deferred revenue | 1,039 | 901 | 138 | |||||||||
Accretion of PER | 450 | 600 | (150) | |||||||||
| 9,742 | 9,311 | 431 | ||||||||||
Interest expense increased for the three months ended March 31, 2019, primarily due to $0.4 million in foreign exchange impact on US denominated interest payments and $0.1 million of interest related to lease liabilities recognized upon the transition to the new lease accounting standard. More information is set out in Note 3 of the March 31, 2019 condensed consolidated interim financial statements
Finance expense - deferred revenue represents the financing component of the upfront deposit from the silver streaming arrangement.
11
TASEKO MINES LIMITED
Management’s Discussion and Analysis
Income tax
| Three months ended March 31, | ||||||||||||
| (Cdn$ in thousands) | 2019 | 2018 | Change | |||||||||
Current income tax expense | 110 | - | 110 | |||||||||
Deferred income tax recovery | (6,926) | (4,078) | (2,848) | |||||||||
Income tax recovery | (6,816) | (4,078) | (2,738) | |||||||||
Effective tax rate | 46.2% | 18.1% | 28.1% | |||||||||
Canadian statutory rate | 27.0% | 27.0% | - | |||||||||
B.C. Mineral tax rate | 9.6% | 9.6% | - | |||||||||
The income tax recovery for the first quarter of 2019 increased from the same period in 2018 due to an increase in deferred taxes recognized for higher current operating tax losses at Gibraltar compared to the first quarter of 2018. The current income tax expense represents an estimate of B.C. mineral taxes payable for the quarter. The difference in the effective tax rate is due to the opposite impact from the comparative period relative to foreign exchange revaluations on the senior secured notes. In the first quarter of 2018, the Company incurred an unrealized foreign exchange loss, while in the current quarter, the Company incurred an unrealized foreign exchange gain. Foreign exchange revaluations on the senior secured notes are not recognized for tax purposes and thus result in a permanent rate difference.
FINANCIAL CONDITION REVIEW
Balance sheet review
| As at March 31, |
As at December 31, | |||||||||||
| (Cdn$ in thousands) | 2019 | 2018 | Change | |||||||||
Cash and cash equivalents | 34,529 | 45,665 | (11,136) | |||||||||
Other current assets | 54,201 | 58,766 | (4,565) | |||||||||
Property, plant and equipment | 834,887 | 821,287 | 13,600 | |||||||||
Other assets | 47,634 | 47,005 | 629 | |||||||||
Total assets | 971,251 | 972,723 | (1,472) | |||||||||
Current liabilities | 52,561 | 47,578 | 4,983 | |||||||||
Debt: | ||||||||||||
Senior secured notes | 325,286 | 331,683 | (6,397) | |||||||||
Leases and secured equipment loans | 28,133 | 23,798 | 4,335 | |||||||||
Deferred revenue | 39,403 | 39,367 | 36 | |||||||||
Other liabilities | 175,784 | 183,220 | (7,436) | |||||||||
Total liabilities | 621,167 | 625,646 | (4,479) | |||||||||
Equity | 350,084 | 347,077 | 3,007 | |||||||||
Net debt (debt minus cash and equivalents) | 318,890 | 309,816 | 9,074 | |||||||||
Total common shares outstanding (millions) | 246.0 | 228.4 | 17.6 | |||||||||
The Company’s asset base is comprised principally ofnon-current assets, including property, plant and equipment, reflecting the capital intensive nature of the mining business. Other current assets include accounts
12
TASEKO MINES LIMITED
Management’s Discussion and Analysis
receivable, other financial assets and inventories (concentrate inventories, ore stockpiles, and supplies), along with prepaid expenses and deposits. Concentrate inventories, accounts receivable and cash balances fluctuate in relation to shipping and cash settlement schedules.
Total long-term debt decreased by $2.1 million for the three months ended March 31, 2019, due to unrealized foreign exchange gains on the Company’s US dollar denominated debt and principal payments for capital leases and equipment loans. These factors were partially offset by the recognition of $6.3 million of new lease liabilities as of January 1, 2019 due to adoption of the new IFRS lease accounting standard. Net debt has increased by $9.1 million in the first quarter of 2019 due to the decrease in the cash balance, which reflects capital expenditures at Florence and Gibraltar and an increase in lease liabilities from the adoption of IFRS 16 Leases.
Deferred revenue relates to the advance payment received in March 2017 from Osisko Gold Royalties Ltd. (“Osisko”) for the sale of future silver production from the Gibraltar Mine.
Other liabilities decreased by $7.4 million mainly due to the decrease in deferred tax liabilities. Other liabilities includes the provision for environmental rehabilitation (“PER”) of $96.5 million.
As at May 7, 2019, there were 246,062,219 common shares outstanding. In addition, there were 9,869,900 stock options and 3,000,000 warrants outstanding at May 7, 2019. More information on these instruments and the terms of their exercise is set out in Note 15 of the March 31, 2019 unaudited condensed consolidated interim financial statements.
Liquidity, cash flow and capital resources
Cash flow provided by operations during the three months ended March 31, 2019 was $7.2 million compared to $11.6 million for the same period in 2018. Cash used for investing activities during the three months ended March 31, 2019 was $13.9 million compared to $24.5 million for the same period in 2018.
Investing cash flows in the first quarter of 2019 includes $2.1 million of expenditures at the Florence Project, $8.0 million for capitalized stripping costs and $3.4 million for other capital expenditures at Gibraltar.
Cash used for financing activities in the first quarter of 2019 includes principal payments for leases and equipment loans of $3.8 million.
At March 31, 2019, the Company had cash and equivalents of $34.5 million (December 31, 2018 - $45.7 million). The Company continues to make monthly principal repayments for leases and equipment loans, however, there are no principal payments required on the senior secured notes until the maturity date in June 2022. An interest payment of US$10.9 million is due on June 15, 2019 on the same senior secured notes.
In May 2019, the Company entered into an equipment loan for proceeds of $13.9 million. The loan bears interest at an annual rate of 5.2%, is secured by existing mining equipment at the Gibraltar Mine and is repayable in monthly installments with a final maturity date of May 6, 2024. The proceeds of the loan were used to repay an existing equipment loan of $1.4 million and the remaining funds are available for general working capital purposes.
Liquidity outlook
The Company has a pipeline of development stage projects, including the Florence Copper Project, and additional funding will be required to advance these projects to production. The Florence Copper Project has an estimated capital cost of approximately US$204 million (plus reclamation bonding) and the Company expects to
13
TASEKO MINES LIMITED
Management’s Discussion and Analysis
fund a portion of these costs with debt financing. The senior secured notes (due in June 2022) allow for up to US$100 million of first lien secured debt to be issued as well as up to US$50 million of debt for equipment financing, all subject to the terms of the note indenture. To address project funding requirements for Florence or other projects, the Company may also raise capital through equity financings or asset sales, including royalties, sales of project interests, or joint ventures. The Company may also redeem or repurchase senior secured notes on the market. The Company evaluates these alternatives based on a number of factors including, the prevailing market prices of its common shares and senior secured notes, metal prices, liquidity requirements, covenant restrictions and other factors, in order to determine the optimal mix of capital resources to address capital requirements, minimize the Company’s cost of capital, and maximize shareholder value.
Future changes in copper and molybdenum market prices could also impact the timing and amount of cash available for future investment in development projects, debt obligations, and other uses of capital. To partially mitigate commodity price risks, copper put options are entered into for a portion of Gibraltar copper production (see section below “Hedging Strategy”).
Hedging strategy
The Company’s hedging strategy is to secure a minimum price for a portion of copper production using put options that are either purchased outright or funded by the sale of call options that are significantly out of the money. The amount and duration of the hedge position is based on an assessment of business-specific risk elements combined with the copper pricing outlook. Copper price and quantity exposure are reviewed at least quarterly to ensure that adequate revenue protection is in place. Hedge positions are typically extended adding incremental quarters at established put strike prices to provide the necessary price protection. The Company’s hedging strategy is designed to mitigate short-term declines in copper price.
Considerations on the cost of the hedging program include an assessment of Gibraltar’s estimated production costs, anticipated copper prices and the Company’s capital requirements during the relevant period. In February 2019, the Company spent $0.9 million to purchase copper put options that matured evenly between February and April of 2019. There were no commodity contracts outstanding as at the date of this MD&A.
Commitments and contingencies
Commitments
| Payments due | ||||||||||||||||||||||||||||
| ($ in thousands) | Remainder of 2019 | 2020 | 2021 | 2022 | 2023 | Thereafter | Total | |||||||||||||||||||||
Debt1: | ||||||||||||||||||||||||||||
Repayment of principal | 2,491 | 2,776 | 2,372 | 335,309 | - | - | 342,948 | |||||||||||||||||||||
Interest | 29,551 | 29,503 | 29,370 | 14,636 | - | - | 103,060 | |||||||||||||||||||||
Lease liabilities: | ||||||||||||||||||||||||||||
Repayment of principal | 7,266 | 6,623 | 3,299 | 2,072 | - | - | 19,260 | |||||||||||||||||||||
Interest | 774 | 543 | 219 | 46 | - | - | 1,582 | |||||||||||||||||||||
PER2 | - | - | - | - | - | 96,541 | 96,541 | |||||||||||||||||||||
Capital expenditures3 | 5,045 | - | - | - | - | - | 5,045 | |||||||||||||||||||||
Other expenditures4
|
| 6,271
|
|
| 5,713
|
|
| 5,412
|
|
| 902
|
|
| -
|
|
| -
|
|
| 18,298
|
| |||||||
| 1 | As at March 31, 2019, debt is comprised of senior secured notes and secured equipment loans. |
14
TASEKO MINES LIMITED
Management’s Discussion and Analysis
2 The provision for environmental rehabilitation amounts presented in the table represents the present value of estimated costs of legal and constructive obligations required to retire an asset, including decommissioning and other site restoration activities, primarily for the Gibraltar Mine. The Company has provided total reclamation security of $37.0 million for its 75% share of the Gibraltar Mine, in the form of reclamation deposits and restricted cash.
3 Capital expenditure commitments include only those items where the Company has entered into binding commitments.
4 Other expenditure commitments include the purchase of goods and services and exploration activities.
The Company has guaranteed 100% of certain capital lease and equipment loans entered into by the Gibraltar joint venture in which it holds a 75% interest. As a result, the Company has guaranteed the joint venture partner’s 25% share of this debt which amounted to $6.9 million as at March 31, 2019.
SUMMARY OF QUARTERLY RESULTS
2019
|
2018
|
2017
| ||||||||||||||||||||||||||||||
| (Cdn$ in thousands, except per share amounts) | Q1 | Q4 | Q3 | Q2 | Q1 | Q4 | Q3 | Q2 | ||||||||||||||||||||||||
Revenues | 70,274 | 111,121 | 74,297 | 94,273 | 64,179 | 95,408 | 78,508 | 99,994 | ||||||||||||||||||||||||
Net income (loss) | (7,931) | (19,720) | 7,098 | (4,671) | (18,481) | (7,600) | 20,136 | 5,247 | ||||||||||||||||||||||||
Basic EPS | (0.03) | (0.09) | 0.03 | (0.02) | (0.08) | (0.03) | 0.09 | 0.02 | ||||||||||||||||||||||||
Adjusted net income (loss) * | (14,419) | (1,310) | 1,464 | 2,337 | (10,999) | (1,544) | 13,405 | 14,305 | ||||||||||||||||||||||||
Adjusted basic EPS * | (0.06) | (0.01) | 0.01 | 0.01 | (0.05) | (0.01) | 0.06 | 0.06 | ||||||||||||||||||||||||
EBITDA * | 16,658 | 7,886 | 37,718 | 25,509 | 370 | 22,350 | 48,457 | 43,805 | ||||||||||||||||||||||||
Adjusted EBITDA * | 10,245 | 26,489 | 31,940 | 32,251 | 7,537 | 28,639 | 42,356 | 42,820 | ||||||||||||||||||||||||
(US$ per pound, except where indicated) |
| |||||||||||||||||||||||||||||||
Realized copper price * | 2.91 | 2.72 | 2.63 | 3.13 | 2.98 | 3.30 | 3.00 | 2.61 | ||||||||||||||||||||||||
Total operating costs * | 2.21 | 2.11 | 1.58 | 1.98 | 2.33 | 2.11 | 1.18 | 1.31 | ||||||||||||||||||||||||
Copper sales (million pounds) | 17.5 | 32.0 | 21.6 | 24.2 | 17.1 | 24.0 | 22.6 | 30.5 | ||||||||||||||||||||||||
| *Non-GAAP | performance measure. See page 18 of this MD&A |
Financial results for the last eight quarters reflect: volatile copper and molybdenum prices and foreign exchange rates that impact realized sale prices; and variability in the quarterly sales volumes due to copper grades and timing of shipments which impacts revenue recognition.
CRITICAL ACCOUNTING POLICIES AND ESTIMATES
The Company’s significant accounting policies are presented in Note 2.4 of the 2018 annual consolidated financial statements and Note 2 of the March 31, 2019 unaudited condensed consolidated interim financial statements. The preparation of the financial statements in conformity with IFRS requires management to make judgments, estimates and assumptions that affect the application of accounting policies and the reported amounts of assets, liabilities, income and expenses. Actual results may differ from these estimates. Estimates and underlying assumptions are reviewed on an ongoing basis. Revisions to accounting estimates are recognized in the period in which the estimates are revised and in any future periods affected.
In the process of applying the Company’s accounting policies, significant areas where judgment is required include the determination of a joint arrangement, determining the timing of transfer of control of inventory for revenue recognition, and recovery of other deferred tax assets.
15
TASEKO MINES LIMITED
Management’s Discussion and Analysis
Significant areas of estimation include reserve and resource estimation; asset valuations and the measurement of impairment charges or reversals; valuation of inventories; plant and equipment lives; tax provisions; provisions for environmental rehabilitation; valuation of financial instruments and derivatives; capitalized stripping costs and share-based compensation. Key estimates and assumptions made by management with respect to these areas have been disclosed in the notes to the consolidated financial statements as appropriate.
The accuracy of reserve and resource estimates is a function of the quantity and quality of available data and the assumptions made and judgment used in the engineering and geological interpretation, and may be subject to revision based on various factors. Changes in reserve and resource estimates may impact the carrying value of property, plant and equipment; the calculation of depreciation expense; the capitalization of stripping costs incurred during production; and the timing of cash flows related to the provision for environmental rehabilitation.
Changes in forecast prices of commodities, exchange rates, production costs and recovery rates may change the economic status of reserves and resources. Forecast prices of commodities, exchange rates, production costs and recovery rates, and discount rates assumptions, either individually or collectively, may impact the carrying value of derivative financial instruments, inventories, property, plant and equipment, and intangibles, as well as the measurement of impairment charges or reversals.
Change in Accounting Policies
The Company adopted the new accounting standard IFRS 16, Leases, effective January 1, 2019 using the modified retrospective method. Accordingly, the comparative information presented for 2018 has not been restated and is accounted for under IAS 17 Lease. IFRS 16 sets out the principles for the recognition, measurement, presentation and disclosure of leases for both parties to a lease contract. More information on the transition to IFRS 16 is described in Note 3(a) of the March 31, 2019 unaudited condensed consolidated interim financial statements.
INTERNAL AND DISCLOSURE CONTROLS OVER FINANCIAL REPORTING
The Company’s management is responsible for establishing and maintaining adequate internal control over financial reporting and disclosure controls and procedures.
The Company’s internal control system over financial reporting is designed to provide reasonable assurance to management and the Board of Directors regarding the preparation and fair presentation of published financial statements. Internal control over financial reporting includes those policies and procedures that:
| (1) | pertain to the maintenance of records that in reasonable detail accurately and fairly reflect the transactions and dispositions of the assets of the Company; |
| (2) | provide reasonable assurance that transactions are recorded as necessary to permit preparation of financial statements in accordance with IFRS, and that receipts and expenditures of the Company are being made only in accordance with authorizations of management and directors of the Company; and |
| (3) | provide reasonable assurance regarding prevention or timely detection of unauthorized acquisition, use or disposition of the Company’s assets that could have a material effect on the financial statements. |
The Company’s internal control system over disclosure controls and procedures is designed to provide reasonable assurance that material information relating to the Company is made known to management and disclosed to others and information required to be disclosed by the Company in its annual filings, interim filings or
16
TASEKO MINES LIMITED
Management’s Discussion and Analysis
other reports filed or submitted by us under securities legislation is recorded, processed, summarized and reported within the time periods specified in the securities legislation.
All internal control systems, no matter how well designed, have inherent limitations. Therefore, even those systems determined effective can provide only reasonable assurance with respect to financial reporting and disclosure.
There have been no changes in our internal controls over financial reporting and disclosure controls and procedures during the period ended March 31, 2019 that have materially affected, or are reasonably likely to materially affect, internal control over financial reporting and disclosure.
RELATED PARTY TRANSACTIONS
Key management personnel
Key management personnel include the members of the Board of Directors and executive officers of the Company.
The Company contributes to a post-employment defined contribution pension plan on the behalf of certain key management personnel. This retirement compensation arrangement (“RCA Trust”) was established to provide benefits to certain executive officers on or after retirement in recognition of their long service. Upon retirement, the participant is entitled to the distribution of the accumulated value of the contributions under the RCA Trust. Obligations for contributions to the defined contribution pension plan are recognized as compensation expense in the periods during which services are rendered by the executive officers.
Certain executive officers are entitled to termination and change in control benefits. In the event of termination without cause, other than a change in control, these executive officers are entitled to an amount ranging from9-months’ to18-months’ salary. In the event of a change in control, if a termination without cause or a resignation occurs within 12 months following the change of control, these executive officers are entitled to receive, among other things, an amount ranging from24-months’ to32-months’ salary and accrued bonus, and all stock options held by these individuals will fully vest.
Executive officers and directors also participate in the Company’s share-based option program (refer to Note 15 of the unaudited condensed consolidated interim financial statements).
Compensation for key management personnel (including all members of the Board of Directors and executive officers) is as follows:
| Three months ended March 31, | ||||||||
(Cdn$ in thousands) | 2019 | 2018 | ||||||
Salaries and benefits | 1,681 | 2,987 | ||||||
Post-employment benefits | 389 | 373 | ||||||
Share-based compensation expense (recovery) | 1,611 | (1,157) | ||||||
| 3,681 | 2,203 | |||||||
Other related parties
(a) Termination of Service Agreement with HDSI
On December 31, 2018, the Company terminated the services agreement with Hunter Dickinson Services Inc.
17
TASEKO MINES LIMITED
Management’s Discussion and Analysis
(“HDSI”), which was a related party as three directors of the Company are also principals of HDSI. In 2018 and prior years, HDSI invoiced the Company for their executive services (director fees) and for other services provided by HDSI under a services agreement dated July 2010.
Effective from January 1, 2019 HDSI no longer provides services to the Company, and the Company had no transactions with HDSI, except for a reimbursement of warehouse rental in the amount of $13,392 for the three month period ended March 31, 2019.
For the three month period ended March 31, 2018, the Company incurred total costs of $0.4 million in transactions with HDSI. Of these, $0.1 million related to administrative, legal, exploration and tax services, $0.2 million related to reimbursements of office rent costs, and $0.1 million related to director fees for two Taseko directors who are also principals of HDSI.
(b) Gibraltar Joint Venture
Under the terms of the joint venture operating agreement, the Gibraltar Joint Venture pays the Company a management fee for services rendered by the Company as operator of the Gibraltar Mine. In addition, the Company pays certain expenses on behalf of the Gibraltar Joint Venture and invoices the Joint Venture for these expenses. For the three month period ended March 31, 2019, Management income for $0.3 million (Q1 2018: $0.3 million) and reimbursable compensation expenses and third party costs of $0.1 million (Q1 2018: $0.1 million) were charged to the joint venture partner.
NON-GAAP PERFORMANCE MEASURES
This document includes certainnon-GAAP performance measures that do not have a standardized meaning prescribed by IFRS. These measures may differ from those used by, and may not be comparable to such measures as reported by, other issuers. The Company believes that these measures are commonly used by certain investors, in conjunction with conventional IFRS measures, to enhance their understanding of the Company’s performance. These measures have been derived from the Company’s financial statements and applied on a consistent basis. The following tables below provide a reconciliation of thesenon-GAAP measures to the most directly comparable IFRS measure.
Total operating costs and site operating costs, net ofby-product credits
Total costs of sales include all costs absorbed into inventory, as well as transportation costs and insurance recoverable. Site operating costs is calculated by removing net changes in inventory, depletion and amortization, insurance recoverable, and transportation costs from cost of sales. Site operating costs, net ofby-product credits is calculated by removingby-product credits from the site operating costs. Site operating costs, net ofby-product credits per pound are calculated by dividing the aggregate of the applicable costs by copper pounds produced. Total operating costs per pound is the sum of site operating costs, net ofby-product credits andoff-property costs divided by the copper pounds produced.By-product credits are calculated based on actual sales of molybdenum (net of treatment costs) and silver during the period divided by the total pounds of copper produced during the period. These measures are calculated on a consistent basis for the periods presented.
Three months ended March 31,
| ||||||||
| (Cdn$ in thousands, unless otherwise indicated) – 75% basis | 2019 | 2018 | ||||||
Cost of sales | 74,729 | 65,415 | ||||||
Less: | ||||||||
Depletion and amortization | (20,184 | ) | (14,780) | |||||
18
TASEKO MINES LIMITED
Management’s Discussion and Analysis
Net change in inventories of finished goods | 4,046 | 967 | ||||||
Net change in inventories of ore stockpiles | 127 | (3,896) | ||||||
Transportation costs | (3,288) | (2,829) | ||||||
Insurance recovery | - | 4,000 | ||||||
Site operating costs | 55,430 | 48,877 | ||||||
Lessby-product credits: | ||||||||
Molybdenum, net of treatment costs | (7,819) | (5,009) | ||||||
Silver, excluding amortization of deferred revenue | (186) | (92) | ||||||
Site operating costs, net ofby-product credits | 47,425 | 43,776 | ||||||
Total copper produced (thousand pounds) | 18,641 | 17,145 | ||||||
Total costs per pound produced | 2.54 | 2.55 | ||||||
Average exchange rate for the period (CAD/USD) | 1.33 | 1.26 | ||||||
Site operating costs, net ofby-product credits (US$ per pound) | 1.91 | 2.02 | ||||||
Site operating costs, net ofby-product credits | 47,425 | 43,776 | ||||||
Addoff-property costs: | ||||||||
Treatment and refining costs | 4,266 | 3,954 | ||||||
Transportation costs | 3,288 | 2,829 | ||||||
Total operating costs | 54,979 | 50,559 | ||||||
Total operating costs (C1) (US$ per pound) | 2.21 | 2.33 |
Adjusted net income (loss)
Adjusted net income (loss) remove the effect of the following transactions from net income as reported under IFRS:
| • | Unrealized foreign currency gains/losses; and |
| • | Unrealized gain/loss on copper put options. |
Management believes these transactions do not reflect the underlying operating performance of our core mining business and are not necessarily indicative of future operating results. Furthermore, unrealized gains/losses on derivative instruments, changes in the fair value of financial instruments, and unrealized foreign currency gains/losses are not necessarily reflective of the underlying operating results for the reporting periods presented.
Three months ended March 31,
| ||||||||
($ in thousands, except per share amounts) | 2019 | 2018 | ||||||
Net loss | (7,931) | (18,481) | ||||||
Unrealized foreign exchange (gain) loss | (6,689) | 8,332 | ||||||
Unrealized (gain) loss on copper put options | 276 | (1,165) | ||||||
Estimated tax effect of adjustments | (75) | 315 | ||||||
Adjusted net loss | (14,419) | (10,999) | ||||||
Adjusted EPS | (0.06) | (0.05) | ||||||
19
TASEKO MINES LIMITED
Management’s Discussion and Analysis
EBITDA and Adjusted EBITDA
EBITDA represents net income before interest, income taxes, and depreciation. EBITDA is presented because it is an important supplemental measure of our performance and is frequently used by securities analysts, investors and other interested parties in the evaluation of companies in the industry, many of which present EBITDA when reporting their results. Issuers of “high yield” securities also present EBITDA because investors, analysts and rating agencies consider it useful in measuring the ability of those issuers to meet debt service obligations. The Company believes EBITDA is an appropriate supplemental measure of debt service capacity, because cash expenditures on interest are, by definition, available to pay interest, and tax expense is inversely correlated to interest expense because tax expense goes down as deductible interest expense goes up; depreciation is anon-cash charge.
Adjusted EBITDA is presented as a further supplemental measure of the Company’s performance and ability to service debt. Adjusted EBITDA is prepared by adjusting EBITDA to eliminate the impact of a number of items that are not considered indicative of ongoing operating performance.
Adjusted EBITDA is calculated by adding to EBITDA certain items of expense and deducting from EBITDA certain items of income that are not likely to recur or are not indicative of the Company’s future operating performance consisting of:
| • | Unrealized foreign exchange gains/losses; |
| • | Unrealized gain/loss on copper put options. |
While some of the adjustments are recurring, othernon-recurring expenses do not reflect the underlying performance of the Company’s core mining business and are not necessarily indicative of future results. Furthermore, unrealized gains/losses on derivative instruments, and unrealized foreign currency translation gains/losses are not necessarily reflective of the underlying operating results for the reporting periods presented.
| Three months ended March 31, | ||||||||
| ($ in thousands) | 2019 | 2018 | ||||||
Net loss | (7,931) | (18,481) | ||||||
Add: | ||||||||
Depletion and amortization | 20,184 | 14,780 | ||||||
Amortization of share-based compensation expense (recovery) | 1,787 | (839) | ||||||
Finance expense | 9,742 | 9,311 | ||||||
Finance income | (308) | (323) | ||||||
Income tax recovery | (6,816) | (4,078) | ||||||
EBITDA | 16,658 | 370 | ||||||
Adjustments: | ||||||||
Unrealized foreign exchange (gain) loss | (6,689) | 8,332 | ||||||
Unrealized loss (gain) on copper put options | 276 | (1,165) | ||||||
Adjusted EBITDA | 10,245 | 7,537 | ||||||
Earnings from mining operations before depletion and amortization
Earnings from mining operations before depletion and amortization is earnings from mining operations with depletion and amortization added back. The Company discloses this measure, which has been derived from our
20
TASEKO MINES LIMITED
Management’s Discussion and Analysis
financial statements and applied on a consistent basis, to provide assistance in understanding the results of the Company’s operations and financial position and it is meant to provide further information about the financial results to investors.
| Three months ended March 31, | ||||||||
(Cdn$ in thousands) | 2019 | 2018 | ||||||
Loss from mining operations | (4,455) | (1,236) | ||||||
Add: | ||||||||
Depletion and amortization | 20,184 | 14,780 | ||||||
Earnings from mining operations before depletion and amortization | 15,729 | 13,544 | ||||||
Site operating costs per ton milled
| Three months ended March 31, | ||||||||
(Cdn$ in thousands, except per ton milled amounts) | 2019 | 2018 | ||||||
Site operating costs (included in cost of sales) | 55,430 | 48,877 | ||||||
Tons milled (thousands) (75% basis) | 5,096 | 5,633 | ||||||
Site operating costs per ton milled | $10.88 | $8.68 | ||||||
21