UNITED STATES
SECURITIES AND EXCHANGE COMMISSION
Washington, D.C. 20549
FORM N-CSR
CERTIFIED SHAREHOLDER REPORT OF REGISTERED
MANAGEMENT INVESTMENT COMPANIES
Investment Company Act file number 811-6397
Fidelity California Municipal Trust II
(Exact name of registrant as specified in charter)
82 Devonshire St., Boston, Massachusetts 02109
(Address of principal executive offices) (Zip code)
Eric D. Roiter, Secretary
82 Devonshire St.
Boston, Massachusetts 02109
(Name and address of agent for service)
Registrant's telephone number, including area code: 617-563-7000
Date of fiscal year end: | February 28 |
| |
Date of reporting period: | February 28, 2006 |
Item 1. Reports to Stockholders
Fidelity® California AMT Tax Free
Money Market Fund
(formerly Spartan® California Municipal
Money Market Fund)
and
Fidelity California Municipal
Money Market Fund
|
| | Annual Report
February 28, 2006
|


| Contents | | | | |
| |
| Chairman’s Message | | 4 | | Ned Johnson’s message to shareholders |
| Shareholder Expense | | 5 | | An example of shareholder expenses. |
| Example | | | | |
| Fidelity California AMT Tax Free Money Market Fund |
| | | 7 | | Investment Changes/Performance |
| | | 8 | | Investments |
| | | 22 | | Financial Statements |
| Fidelity California Municipal Money Market Fund |
| | | 26 | | Investment Changes/Performance |
| | | 27 | | Investments |
| | | 45 | | Financial Statements |
| Notes | | 49 | | Notes to the Financial Statements |
| Report of Independent | | 53 | | |
| Registered Public | | | | |
| Accounting Firm | | | | |
| Trustees and Officers | | 54 | | |
| Distributions | | 65 | | |
| Proxy Voting Results | | 66 | | |
| Board Approval of | | 67 | | |
| Investment Advisory | | | | |
| Contracts and | | | | |
| Management Fees | | | | |
To view a fund’s proxy voting guidelines and proxy voting record for the 12 month period
ended June 30, visit www.fidelity.com/proxyvotingresults or visit the Securities and Exchange
Commission’s (SEC) web site at www.sec.gov. You may also call 1-800-544-8544 to request a free
copy of the proxy voting guidelines.
Standard & Poor’s, S&P and S&P 500 are registered service marks of The McGraw Hill Companies, Inc.
and have been licensed for use by Fidelity Distributors Corporation.
Other third party marks appearing herein are the property of their respective owners.
All other marks appearing herein are registered or unregistered trademarks or service marks
of FMR Corp. or an affiliated company.
|
Annual Report 2
2
This report and the financial statements contained herein are submitted for the general
information of the shareholders of the funds. This report is not authorized for distribution to
prospective investors in the funds unless preceded or accompanied by an effective prospectus.
A fund files its complete schedule of portfolio holdings with the SEC for the first and third
quarters of each fiscal year on Form N Q. Forms N Q are available on the SEC’s web site at
http://www.sec.gov. A fund’s Forms N Q may be reviewed and copied at the SEC’s Public Refer
ence Room in Washington, DC. Information regarding the operation of the SEC’s Public Reference
Room may be obtained by calling 1-800-SEC-0330. For a complete list of a fund’s portfolio
holdings, view the most recent quarterly holdings report, semiannual report, or annual report
on Fidelity’s web site at http://www.fidelity.com/holdings.
NOT FDIC INSURED · MAY LOSE VALUE · NO BANK GUARANTEE
Neither the funds nor Fidelity Distributors Corporation is a bank.
|
3 Annual Report
3
Chairman’s Message
(photograph of Edward C. Johnson 3d)
Dear Shareholder:
Although many securities markets made gains in early 2006, there is only one certainty when it comes to investing: There is no sure thing. There are, however, a number of time tested, fundamental investment principles that can put the historical odds in your favor.
One of the basic tenets is to invest for the long term. Over time, riding out the markets’ inevitable ups and downs has proven much more effective than selling into panic or chasing the hottest trend. Even missing only a few of the markets’ best days can significantly diminish investor returns. Patience also affords the benefits of compounding of earning interest on additional income or reinvested dividends and capital gains. There are tax advantages and cost benefits to consider as well. The more you sell, the more taxes you pay, and the more you trade, the higher the costs. While staying the course doesn’t eliminate risk, it can considerably lessen the effect of short term declines.
You can further manage your investing risk through diversification. And today, more than ever, geographic diversification should be taken into account. Studies indicate that asset allocation is the single most important determinant of a portfolio’s long term success. The right mix of stocks, bonds and cash aligned to your particular risk tolerance and investment objective is very important. Age appropriate rebalancing is also an essential aspect of asset allocation. For younger investors, an emphasis on equities which historically have been the best performing asset class over time is encouraged. As investors near their specific goal, such as retirement or sending a child to college, consideration may be given to replacing volatile assets (e.g. common stocks) with more stable fixed investments (bonds or savings plans).
A third investment principle investing regularly can help lower the average cost of your purchases. Investing a certain amount of money each month or quarter helps ensure you won’t pay for all your shares at market highs. This strategy known as dollar cost averaging also reduces unconstructive “emotion” from investing, helping shareholders avoid selling weak per formers just prior to an upswing, or chasing a hot performer just before a correction.
We invite you to contact us via the Internet, through our Investor Centers or over the phone. It is our privilege to provide you the information you need to make the investments that are right for you.
Sincerely,
/s/ Edward C. Johnson 3d
Edward C. Johnson 3d
Annual Report 4
Shareholder Expense Example
As a shareholder of a Fund, you incur two types of costs: (1) transaction costs, and (2) ongoing costs, including management fees and other Fund expenses. This Example is intended to help you understand your ongoing costs (in dollars) of investing in the Funds and to compare these costs with the ongoing costs of investing in other mutual funds. The Example is based on an investment of $1,000 invested at the beginning of the period and held for the entire period (September 1, 2005 to February 28, 2006).
The first line of the table below for each fund provides information about actual account values and actual expenses. You may use the information in this line, together with the amount you invested, to estimate the expenses that you paid over the period. Simply divide your account value by $1,000.00 (for example, an $8,600 account value divided by $1,000.00 = 8.6), then multiply the result by the number in the first line for a fund under the heading entitled “Expenses Paid During Period” to estimate the expenses you paid on your account during this period. A small balance maintenance fee of $12.00 that is charged once a year may apply for certain accounts with a value of less than $2,000. This fee is not included in the table below. If it was, the estimate of expenses you paid during the period would be higher, and your ending account value lower, by this amount.
Hypothetical Example for Comparison Purposes
The second line of the table below for each fund provides information about hypothetical account values and hypothetical expenses based on a fund’s actual expense ratio and an assumed rate of return of 5% per year before expenses, which is not the Fund’s actual return. The hypothetical account values and expenses may not be used to estimate the actual ending account balance or expenses you paid for the period. You may use this information to compare the ongoing costs of investing in the Fund and other funds. To do so, compare this 5% hypothetical example with the 5% hypothetical examples that appear in the shareholder reports of the other funds. A small balance maintenance fee of $12.00 that is charged once a year may apply for certain accounts with a value of less than $2,000. This fee is not included in the table below. If it was, the estimate of expenses you paid during the period would be higher, and your ending account value lower, by this amount. Please note that the expenses shown in the table are meant to highlight your ongoing costs only and do not reflect any transaction costs. Therefore, the second line of the table is useful in comparing ongoing costs only, and will not help you determine the relative total costs of owning different funds.
5 Annual Report
| Shareholder Expense Example continued | | | | |
| |
| |
| | | | | | | | | | | Expenses Paid |
| | | | | | | | | | | During Period* |
| | | Beginning | | Ending | | September 1, 2005 |
| | | Account Value | | Account Value | | to February 28, |
| | | September 1, 2005 | | February 28, 2006 | | 2006 |
| Fidelity California AMT Tax Free | | | | | | | | | | | | |
| Money Market Fund | | | | | | | | | | | | |
| Actual | | $ | | 1,000.00 | | $ | | 1,012.70 | | $ | | 1.75 |
| HypotheticalA | | $ | | 1,000.00 | | $ | | 1,023.06 | | $ | | 1.76 |
| Fidelity California Municipal | | | | | | | | | | | | |
| Money Market Fund | | | | | | | | | | | | |
| Actual | | $ | | 1,000.00 | | $ | | 1,012.00 | | $ | | 2.64 |
| HypotheticalA | | $ | | 1,000.00 | | $ | | 1,022.17 | | $ | | 2.66 |
| |
| A 5% return per year before expenses | | | | | | | | |
* Expenses are equal to each Fund’s annualized expense ratio (shown in the table below); multiplied by the average account value over the period, multiplied by 181/365 (to reflect the one half year period).
| | | Annualized |
| | | Expense Ratio |
| Fidelity California AMT Tax Free Money Market Fund | | 35% |
| Fidelity California Municipal Money Market Fund | | 53% |
| Fidelity California AMT Tax Free Money Market Fund | | |
| Investment Changes/Performance |
| |
| Maturity Diversification | | | | | | |
| Days | | % of fund’s | | % of fund’s | | % of fund’s |
| | | investments | | investments | | investments |
| | | 2/28/06 | | 8/31/05 | | 2/28/05 |
| 0 – 30 | | 88.2 | | 88.7 | | 90.7 |
| 31 – 90 | | 5.5 | | 5.5 | | 1.5 |
| 91 – 180 | | 5.4 | | 0.9 | | 7.8 |
| 181 – 397 | | 0.9 | | 4.9 | | 0.0 |
Weighted Average Maturity | | | | | | |
| | | 2/28/06 | | 8/31/05 | | 2/28/05 |
| Fidelity California AMT Tax Free | | | | | | |
| Money Market Fund | | 18 Days | | 24 Days | | 16 Days |
| California Tax Free Money Market | | | | | | |
| Funds Average* | | 22 Days | | 29 Days | | 28 Days |
| Current and Historical Seven Day Yields | | | | | | |
| | | 2/27/06 | | 11/28/05 | | 8/29/05 | | 5/30/05 | | 2/28/05 |
| Fidelity California AMT Tax | | | | | | | | | | |
| Free Money Market Fund | | 2.81% | | 2.74% | | 2.17% | | 2.55% | | 1.55% |
| If Fidelity had not reimbursed | | | | | | | | | | |
| certain fund expenses | | 2.69% | | 2.65% | | 2.10% | | 2.47% | | 1.43% |
Yield refers to the income paid by the fund over a given period. Yields for money market funds are usually for seven day periods, as they are here, though they are expressed as annual percentage rates. Past performance is no guarantee of future results. Yield will vary and it is possible to lose money by investing in the fund.
*Source: iMoneyNet, Inc.
7 Annual Report
| Fidelity California AMT Tax Free Money Market Fund | | | | |
| Investments February 28, 2006 | | | | |
| Showing Percentage of Net Assets | | | | | | | | | | |
| |
| Municipal Securities 95.4% | | | | | | | | | | |
| | | | | Principal | | Value (Note 1) |
| | | | | Amount (000s) | | (000s) |
| California – 91.1% | | | | | | | | | | |
| Alameda Corridor Trans. Auth. Rev. Participating VRDN: | | | | | | | | |
| Series BS 05 222 Class A, 3.29% (Liquidity Facility Bear | | | | | | | | |
| Stearns Companies, Inc.) (b)(c) | | | | | | $ 4,800 | | | | $ 4,800 |
| Series PZ 51, 3.24% (Liquidity Facility Merrill Lynch & Co., | | | | | | | | |
| Inc.) (b)(c) | | | | | | 6,000 | | | | 6,000 |
| Series PZ 61, 3.24% (Liquidity Facility Merrill Lynch & Co., | | | | | | | | |
| Inc.) (b)(c) | | | | | | 5,680 | | | | 5,680 |
| Alhambra Ctfs. of Prtn. Participating VRDN Series DB 193, | | | | | | | | |
| 3.22% (Liquidity Facility Deutsche Bank AG) (b)(c) | | | | 8,700 | | | | 8,700 |
| Anaheim Pub. Fing. Auth. Lease Rev. Participating VRDN | | | | | | | | |
| Series PT 2067, 3.22% (Liquidity Facility Merrill Lynch & Co., | | | | | | | | |
| Inc.) (b)(c) | | | | | | 5,810 | | | | 5,810 |
| Apple Valley Unified School District Participating VRDN | | | | | | | | |
| Series Putters 544, 3.21% (Liquidity Facility JPMorgan Chase | | | | | | | | |
| Bank) (b)(c) | | | | | | 3,670 | | | | 3,670 |
| Burbank Unified School District Participating VRDN Series PZ | | | | | | | | |
| 54, 3.24% (Liquidity Facility Merrill Lynch & Co., Inc.) (b)(c) . | | | | 6,035 | | | | 6,035 |
| Cabrillo Cmnty. College District Participating VRDN Series | | | | | | | | |
| ROC II R300, 3.21% (Liquidity Facility Citibank NA) (b)(c) | | | | 2,665 | | | | 2,665 |
| California Dept. of Wtr. Resources Central Valley Proj. Wtr. | | | | | | | | |
| Sys. Rev.: | | | | | | | | | | |
| Participating VRDN Series ROC II R1024, 3.21% (Liquidity | | | | | | | | |
| Facility Citigroup Global Markets Hldgs., Inc.) (b)(c) | | | | 13,340 | | | | 13,340 |
| Series 1: | | | | | | | | | | |
| 3% 3/3/06, CP | | | | | | 11,882 | | | | 11,882 |
| 3.08% 3/17/06, CP | | | | | | 1,827 | | | | 1,827 |
| 3.12% 3/17/06, CP | | | | | | 6,495 | | | | 6,495 |
| California Dept. of Wtr. Resources Pwr. Supply Rev.: | | | | | | | | |
| Bonds: | | | | | | | | | | |
| Subseries 2005 G12, 3.17%, tender 3/2/06 | | | | | | | | |
| (FGIC Insured) (b) | | | | | | 7,100 | | | | 7,100 |
| Subseries 2005 G13, 3.17%, tender 3/2/06 | | | | | | | | |
| (FGIC Insured) (b) | | | | | | 35,800 | | | | 35,800 |
| Subseries 2005 G14, 3.17%, tender 3/2/06 | | | | | | | | |
| (FGIC Insured) (b) | | | | | | 17,000 | | | | 17,000 |
| Participating VRDN: | | | | | | | | | | |
| Series EGL 02 6017 Class A, 3.21% (Liquidity Facility | | | | | | | | |
| Citibank NA, New York) (b)(c) | | | | | | 6,200 | | | | 6,200 |
| Series PA 1201R, 3.22% (Liquidity Facility Merrill Lynch & | | | | | | | | |
| Co., Inc.) (b)(c) | | | | | | 10,900 | | | | 10,900 |
| Series PT 759, 3.22% (Liquidity Facility Landesbank | | | | | | | | |
| Hessen-Thuringen) (b)(c) | | | | | | 10,295 | | | | 10,295 |
| Series Putters 310, 3.21% (Liquidity Facility JPMorgan | | | | | | | | |
| Chase Bank) (b)(c) | | | | | | 4,995 | | | | 4,995 |
See accompanying notes which are an integral part of the financial statements. | | | | |
| |
| Annual Report | | 8 | | | | | | | | |
| Municipal Securities continued | | | | | | | | |
| | | Principal | | Value (Note 1) |
| | | Amount (000s) | | (000s) |
| California – continued | | | | | | | | |
| California Dept. of Wtr. Resources Pwr. Supply Rev.: - | | | | | | | | |
| continued | | | | | | | | |
| Participating VRDN: | | | | | | | | |
| Series Putters 322, 3.21% (Liquidity Facility JPMorgan | | | | | | | | |
| Chase & Co.) (b)(c) | | | | $ 6,000 | | | | $ 6,000 |
| Subseries 2005 F3, 2.97%, LOC Bank of New York, New | | | | | | | | |
| York, LOC California Pub. Employees’ Retirement Sys., | | | | | | | | |
| VRDN (b) | | | | 11,000 | | | | 11,000 |
| California Econ. Recovery: | | | | | | | | |
| Participating VRDN: | | | | | | | | |
| Series EGL 04 22, 3.21% (Liquidity Facility Citibank | | | | | | | | |
| NA) (b)(c) | | | | 22,900 | | | | 22,900 |
| Series MS 929, 3.19% (Liquidity Facility Morgan | | | | | | | | |
| Stanley) (b)(c) | | | | 7,995 | | | | 7,995 |
| Series PA 1262, 3.22% (Liquidity Facility Merrill Lynch & | | | | | | | | |
| Co., Inc.) (b)(c) | | | | 7,650 | | | | 7,650 |
| Series PT 2216, 3.22% (Liquidity Facility Merrill Lynch & | | | | | | | | |
| Co., Inc.) (b)(c) | | | | 5,190 | | | | 5,190 |
| Series PT 965, 3.22% (Liquidity Facility Landesbank | | | | | | | | |
| Hessen-Thuringen) (b)(c) | | | | 20,000 | | | | 20,000 |
| Series Putters 882, 3.21% (Liquidity Facility JPMorgan | | | | | | | | |
| Chase Bank) (b)(c) | | | | 6,660 | | | | 6,660 |
| Series ROC II R279, 3.21% (Liquidity Facility Citibank | | | | | | | | |
| NA) (b)(c) | | | | 8,530 | | | | 8,530 |
| Series 2004 C13, 3.19% (XL Cap. Assurance, Inc. Insured), | | | | | | | | |
| VRDN (b) | | | | 12,175 | | | | 12,175 |
| Series 2004 C17, 3.19% (XL Cap. Assurance, Inc. Insured), | | | | | | | | |
| VRDN (b) | | | | 10,000 | | | | 10,000 |
| California Edl. Facilities Auth. Rev. Participating VRDN: | | | | | | | | |
| Series EGL 06 31 Class 2003 A, 3.21% (Liquidity Facility | | | | | | | | |
| Citibank NA) (b)(c) | | | | 15,800 | | | | 15,800 |
| Series MS 1126, 3.19% (Liquidity Facility Morgan | | | | | | | | |
| Stanley) (b)(c) | | | | 20,760 | | | | 20,760 |
| Series ROC II R354, 3.21% (Liquidity Facility Citibank | | | | | | | | |
| NA) (b)(c) | | | | 5,640 | | | | 5,640 |
| Series SGB 45, 3.21% (Liquidity Facility Societe | | | | | | | | |
| Generale) (b)(c) | | | | 5,000 | | | | 5,000 |
| California Gen. Oblig.: | | | | | | | | |
| Bonds: | | | | | | | | |
| Series AAB 00 1, 3.2%, tender 3/7/06 (Liquidity Facility | | | | | | | | |
| ABN AMRO Bank NV) (b)(c) | | | | 9,900 | | | | 9,900 |
| Series MT 171, 3.23%, tender 10/26/06 (Liquidity | | | | | | | | |
| Facility DEPFA BANK PLC) (b)(c)(d) | | | | 9,895 | | | | 9,895 |
See accompanying notes which are an integral part of the financial statements.
| Fidelity California AMT Tax Free Money Market Fund | | | | |
| Investments continued | | | | | | | | |
| |
| Municipal Securities continued | | | | | | | | |
| | | | | Principal | | Value (Note 1) |
| | | | | Amount (000s) | | (000s) |
| California – continued | | | | | | | | |
| California Gen. Oblig.: – continued | | | | | | | | |
| Participating VRDN: | | | | | | | | |
| Series DB 179, 3.22% (Liquidity Facility Deutsche Bank | | | | | | |
| AG) (b)(c) | | | | $ 15,960 | | | | $ 15,960 |
| Series Merlots 02 A17, 3.22% (Liquidity Facility Wachovia | | | | | | |
| Bank NA) (b)(c) | | | | 5,745 | | | | 5,745 |
| Series Merlots 03 A45, 3.22% (Liquidity Facility Wachovia | | | | | | |
| Bank NA) (b)(c) | | | | 5,235 | | | | 5,235 |
| Series Merlots B45, 3.22% (Liquidity Facility Wachovia | | | | | | |
| Bank NA) (b)(c) | | | | 39,525 | | | | 39,525 |
| Series PA 1357, 3.23% (Liquidity Facility Merrill Lynch & | | | | | | |
| Co., Inc.) (b)(c) | | | | 4,165 | | | | 4,165 |
| Series PT 1252, 3.22% (Liquidity Facility Merrill Lynch & | | | | | | |
| Co., Inc.) (b)(c) | | | | 10,100 | | | | 10,100 |
| Series PT 2266, 3.22% (Liquidity Facility Dexia Cr. Local | | | | | | |
| de France) (b)(c) | | | | 7,885 | | | | 7,885 |
| Series PT 2281, 3.22% (Liquidity Facility Merrill Lynch & | | | | | | |
| Co., Inc.) (b)(c) | | | | 5,225 | | | | 5,225 |
| Series PT 3165, 3.22% (Liquidity Facility Merrill Lynch & | | | | | | |
| Co., Inc.) (b)(c) | | | | 15,970 | | | | 15,970 |
| Series PT 902, 3.22% (Liquidity Facility BNP Paribas | | | | | | |
| SA) (b)(c) | | | | 3,700 | | | | 3,700 |
| Series PT 964, 3.22% (Liquidity Facility Landesbank | | | | | | |
| Hessen-Thuringen) (b)(c) | | | | 4,995 | | | | 4,995 |
| Series PT 990, 3.22% (Liquidity Facility BNP Paribas | | | | | | |
| SA) (b)(c) | | | | 6,700 | | | | 6,700 |
| Series Putters 1082, 3.21% (Liquidity Facility JPMorgan | | | | | | |
| Chase & Co.) (b)(c) | | | | 5,325 | | | | 5,325 |
| Series Putters 1174, 3.21% (Liquidity Facility JPMorgan | | | | | | |
| Chase & Co.) (b)(c) | | | | 4,495 | | | | 4,495 |
| Series Putters 1256, 3.22% (Liquidity Facility JPMorgan | | | | | | |
| Chase Bank) (b)(c) | | | | 5,425 | | | | 5,425 |
| Series Putters 482, 3.21% (Liquidity Facility JPMorgan | | | | | | |
| Chase Bank) (b)(c) | | | | 7,495 | | | | 7,495 |
| Series Putters 519, 3.21% (Liquidity Facility JPMorgan | | | | | | |
| Chase Bank) (b)(c) | | | | 4,995 | | | | 4,995 |
| Series Putters 556Z, 3.21% (Liquidity Facility JPMorgan | | | | | | |
| Chase Bank) (b)(c) | | | | 7,450 | | | | 7,450 |
| Series Putters 997, 3.21% (Liquidity Facility JPMorgan | | | | | | |
| Chase Bank) (b)(c) | | | | 4,780 | | | | 4,780 |
| Series ROC II R2185, 3.21% (Liquidity Facility Citigroup | | | | | | |
| Global Markets Hldgs., Inc.) (b)(c) | | | | 5 | | | | 5 |
| Series SG 84, 3.22% (Liquidity Facility Societe | | | | | | |
| Generale) (b)(c) | | | | 1,660 | | | | 1,660 |
See accompanying notes which are an integral part of the financial statements. | | | | |
| |
| Annual Report | | 10 | | | | | | |
| Municipal Securities continued | | | | | | | | | | |
| | | | | Principal | | Value (Note 1) |
| | | | | Amount (000s) | | (000s) |
| California – continued | | | | | | | | | | |
| California Gen. Oblig.: – continued | | | | | | | | | | |
| Participating VRDN: | | | | | | | | | | |
| Series SGA 55, 3.19% (Liquidity Facility Societe | | | | | | | | | | |
| Generale) (b)(c) | | | | | | $ 17,000 | | | | $ 17,000 |
| Series SGB 62, 3.21% (Liquidity Facility Societe | | | | | | | | | | |
| Generale) (b)(c) | | | | | | 30,000 | | | | 30,000 |
| Series SGB 7, 3.21% (Liquidity Facility Societe Generale) (b)(c) | | | | 8,775 | | | | 8,775 |
| RAN 4.5% 6/30/06 | | | | | | 67,800 | | | | 68,130 |
| Series 2003 B1, 3.19%, LOC Bank of New York, New York, | | | | | | | | | | |
| LOC BNP Paribas SA, VRDN (b) | | | | | | 15,100 | | | | 15,100 |
| 3% 3/3/06 (Liquidity Facility Bank of Nova Scotia, New | | | | | | | | | | |
| York Agcy.) (Liquidity Facility Societe Generale), CP | | | | | | 9,050 | | | | 9,050 |
| 3.07% 3/8/06 (Liquidity Facility Bank of Nova Scotia, New | | | | | | | | |
| York Agcy.) (Liquidity Facility Societe Generale), CP | | | | | | 7,300 | | | | 7,300 |
| 3.1% 3/7/06 (Liquidity Facility Bank of Nova Scotia, New | | | | | | | | | | |
| York Agcy.) (Liquidity Facility Societe Generale), CP | | | | | | 13,600 | | | | 13,600 |
| 3.13% 3/9/06 (Liquidity Facility Bank of Nova Scotia, New | | | | | | | | |
| York Agcy.) (Liquidity Facility Societe Generale), CP | | | | | | 20,100 | | | | 20,100 |
| 3.14% 3/6/06 (Liquidity Facility Bank of Nova Scotia, New | | | | | | | | |
| York Agcy.) (Liquidity Facility Societe Generale), CP | | | | | | 20,700 | | | | 20,700 |
| 3.14% 3/13/06 (Liquidity Facility Bank of Nova Scotia, | | | | | | | | | | |
| New York Agcy.) (Liquidity Facility Societe Generale), CP | | . | | | | 21,800 | | | | 21,800 |
| 3.15% 3/6/06 (Liquidity Facility Bank of Nova Scotia, New | | | | | | | | |
| York Agcy.) (Liquidity Facility Societe Generale), CP | | | | | | 5,900 | | | | 5,900 |
| 3.16% 4/10/06 (Liquidity Facility Bank of Nova Scotia, | | | | | | | | | | |
| New York Agcy.) (Liquidity Facility Societe Generale), CP | | . | | | | 25,000 | | | | 25,000 |
| 3.22% 3/22/06 (Liquidity Facility Bank of Nova Scotia, | | | | | | | | | | |
| New York Agcy.) (Liquidity Facility Societe Generale), CP | | . | | | | 25,000 | | | | 25,000 |
| 3.22% 3/24/06 (Liquidity Facility Bank of Nova Scotia, | | | | | | | | | | |
| New York Agcy.) (Liquidity Facility Societe Generale), CP | | . | | | | 22,000 | | | | 22,000 |
| California Health Facilities Fing. Auth. Rev. Participating VRDN | | | | | | | | |
| Series MS 01 592, 3.22% (Liquidity Facility Morgan | | | | | | | | | | |
| Stanley) (b)(c) | | | | | | 11,170 | | | | 11,170 |
| California Hsg. Fin. Agcy. Home Mtg. Rev. Participating VRDN | | | | | | | | |
| Series MT 85, 3.22% (Liquidity Facility Lloyds TSB Bank | | | | | | | | | | |
| PLC) (b)(c) | | | | | | 5,300 | | | | 5,300 |
| California Infrastructure & Econ. Dev. Bank Rev.: | | | | | | | | | | |
| Participating VRDN: | | | | | | | | | | |
| Series EGL 03 42, 3.21% (Liquidity Facility Citibank NA, | | | | | | | | | | |
| New York) (b)(c) | | | | | | 13,500 | | | | 13,500 |
| Series EGL 04 28 Class A, 3.21% (Liquidity Facility | | | | | | | | | | |
| Citibank NA) (b)(c) | | | | | | 9,425 | | | | 9,425 |
| Series PA 1193, 3.22% (Liquidity Facility Merrill Lynch & | | | | | | | | | | |
| Co., Inc.) (b)(c) | | | | | | 6,285 | | | | 6,285 |
| |
| See accompanying notes which are an integral part of the financial statements. | | | | |
| |
| 11 | | | | | | | | Annual Report |
| Fidelity California AMT Tax Free Money Market Fund | | | | |
| Investments continued | | | | | | | | | | |
| |
| Municipal Securities continued | | | | | | | | |
| | | | | Principal | | Value (Note 1) |
| | | | | Amount (000s) | | (000s) |
| California – continued | | | | | | | | | | |
| California Infrastructure & Econ. Dev. Bank Rev.: – continued | | | | | | | | |
| Participating VRDN: | | | | | | | | | | |
| Series SG 172, 3.22% (Liquidity Facility Societe | | | | | | | | |
| Generale) (b)(c) | | | | | | $ 18,900 | | | | $ 18,900 |
| Series 2001, 2.9% 5/3/06, LOC Bank of America NA, CP . | | | | 5,500 | | | | 5,500 |
| California Pub. Works Board Lease Rev. Participating VRDN: | | | | | | | | |
| Series MSTC 9052, 3.19% (Liquidity Facility Bear Stearns | | | | | | | | |
| Companies, Inc.) (b)(c) | | | | | | 8,990 | | | | 8,990 |
| Series Putters 609, 3.21% (Liquidity Facility JPMorgan Chase | | | | | | | | |
| & Co.) (b)(c) | | | | | | 1,100 | | | | 1,100 |
| California State Univ. Rev. & Colleges Participating VRDN | | | | | | | | |
| Series SG 170, 3.22% (Liquidity Facility Societe | | | | | | | | |
| Generale) (b)(c) | | | | | | 13,300 | | | | 13,300 |
| California Statewide Cmntys. Dev. Auth. Iam Commercial | | | | | | | | |
| Paper Bonds (Kaiser Permanente Health Sys. Proj.) | | | | | | | | |
| Series 2004 K, 3.17% tender 4/13/06, CP mode | | | | 14,000 | | | | 14,000 |
| California Statewide Cmntys. Dev. Auth. Rev. (Kaiser | | | | | | | | |
| Permanente Health Sys. Proj.): | | | | | | | | | | |
| Series 2002 B, 3.18%, VRDN (b) | | | | | | 67,350 | | | | 67,350 |
| Series 2003 D, 3.19%, VRDN (b) | | | | | | 28,300 | | | | 28,300 |
| Series 2004 M, 3.18%, VRDN (b) | | | | | | 26,200 | | | | 26,200 |
| California Statewide Cmntys. Dev. Auth. Rev. Ctfs. of Prtn. | | | | | | | | |
| Participating VRDN Series Merlots 99 E, 3.22% (Liquidity | | | | | | | | |
| Facility Wachovia Bank NA) (b)(c) | | | | | | 5,000 | | | | 5,000 |
| Carson Redev. Agcy. Participating VRDN Series PT 2346, | | | | | | | | |
| 3.22% (Liquidity Facility Merrill Lynch & Co., Inc.) (b)(c) | | | | 7,070 | | | | 7,070 |
| Clovis Unified School District Participating VRDN: | | | | | | | | |
| Series PZ 42, 3.26% (Liquidity Facility Merrill Lynch & Co., | | | | | | | | |
| Inc.) (b)(c) | | | | | | 1,500 | | | | 1,500 |
| Series PZ 75, 3.24% (Liquidity Facility Merrill Lynch & Co., | | | | | | | | |
| Inc.) (b)(c) | | | | | | 6,190 | | | | 6,190 |
| Contra Costa Wtr. District Wtr. Rev. Participating VRDN | | | | | | | | |
| Series PT 1666, 3.22% (Liquidity Facility Merrill Lynch & Co., | | | | | | | | |
| Inc.) (b)(c) | | | | | | 5,615 | | | | 5,615 |
| Culver City School Facilities Fing. Auth. Participating VRDN | | | | | | | | |
| Series Merlots 05 A24, 3.22% (Liquidity Facility Wachovia | | | | | | | | |
| Bank NA) (b)(c) | | | | | | 12,010 | | | | 12,010 |
| Desert Cmnty. College District Participating VRDN Series | | | | | | | | |
| Putters 936, 3.21% (Liquidity Facility JPMorgan Chase | | | | | | | | |
| Bank) (b)(c) | | | | | | 3,115 | | | | 3,115 |
| East Bay Muni. Util. District Wtr. Sys. Rev.: | | | | | | | | | | |
| Participating VRDN: | | | | | | | | | | |
| Series EGL 7053015, 3.21% (Liquidity Facility Citibank | | | | | | | | |
| NA) (b)(c) | | | | | | 12,000 | | | | 12,000 |
| |
| See accompanying notes which are an integral part of the financial statements. | | | | |
| |
| Annual Report | | 12 | | | | | | | | |
| Municipal Securities continued | | | | | | | | |
| | | Principal | | Value (Note 1) |
| | | Amount (000s) | | (000s) |
| California – continued | | | | | | | | |
| East Bay Muni. Util. District Wtr. Sys. Rev.: – continued | | | | | | | | |
| Participating VRDN: | | | | | | | | |
| Series EGL 720050045, 3.21% (Liquidity Facility Citibank | | | | | | | | |
| NA) (b)(c) | | | | $ 19,800 | | | | $ 19,800 |
| Series 1988, 3.11% 3/13/06, CP | | | | 6,000 | | | | 6,000 |
| Series 1998, 2.93% 3/9/06, CP | | | | 9,100 | | | | 9,100 |
| El Camino Cmnty. College District Participating VRDN | | | | | | | | |
| Series PT 2058, 3.22% (Liquidity Facility Merrill Lynch & Co., | | | | | | | | |
| Inc.) (b)(c) | | | | 5,380 | | | | 5,380 |
| Foothill-De Anza Cmnty. College District Participating VRDN: | | | | | | | | |
| Series Merlots 00 YY, 3.22% (Liquidity Facility Wachovia | | | | | | | | |
| Bank NA) (b)(c) | | | | 11,700 | | | | 11,700 |
| Series PZ 57, 3.24% (Liquidity Facility Merrill Lynch & Co., | | | | | | | | |
| Inc.) (b)(c) | | | | 6,825 | | | | 6,825 |
| Foothill/Eastern Trans. Corridor Agcy. Toll Road Rev. | | | | | | | | |
| Participating VRDN: | | | | | | | | |
| Series PZ 41, 3.24% (Liquidity Facility Merrill Lynch & Co., | | | | | | | | |
| Inc.) (b)(c) | | | | 3,675 | | | | 3,675 |
| Series PZ 96, 3.24% (Liquidity Facility Merrill Lynch & Co., | | | | | | | | |
| Inc.) (b)(c) | | | | 4,450 | | | | 4,450 |
| Fresno Unified School District Participating VRDN Series DB | | | | | | | | |
| 109, 3.22% (Liquidity Facility Deutsche Bank AG) (b)(c) | | | | 6,175 | | | | 6,175 |
| Gavilan Joint Cmnty. College District Participating VRDN: | | | | | | | | |
| Series Putters 587Z, 3.21% (Liquidity Facility JPMorgan | | | | | | | | |
| Chase Bank) (b)(c) | | | | 5,010 | | | | 5,010 |
| Series ROC II R 2123, 3.21% (Liquidity Facility Citigroup | | | | | | | | |
| Global Markets Hldgs., Inc.) (b)(c) | | | | 6,820 | | | | 6,820 |
| Golden State Tobacco Securitization Corp. Participating | | | | | | | | |
| VRDN: | | | | | | | | |
| Series Best 05 230, 3.29% (Liquidity Facility Bear Stearns | | | | | | | | |
| Companies, Inc.) (b)(c) | | | | 3,500 | | | | 3,500 |
| Series LB 05 FC2, 3.23% (Lehman Brothers Hldgs., Inc. | | | | | | | | |
| Guaranteed) (Liquidity Facility Lehman Brothers Hldgs., | | | | | | | | |
| Inc.) (b)(c) | | | | 6,800 | | | | 6,800 |
| Series MS 1209, 3.19% (Liquidity Facility Morgan | | | | | | | | |
| Stanley) (b)(c) | | | | 29,290 | | | | 29,290 |
| Series MS 1220, 3.19% (Liquidity Facility Morgan | | | | | | | | |
| Stanley) (b)(c) | | | | 16,000 | | | | 16,000 |
| Series MSTC 238, 3.29% (Liquidity Facility Bear Stearns | | | | | | | | |
| Companies, Inc.) (b)(c) | | | | 3,790 | | | | 3,790 |
| Series PA 1237, 3.26% (Liquidity Facility Merrill Lynch & | | | | | | | | |
| Co., Inc.) (b)(c) | | | | 2,740 | | | | 2,740 |
| Series PZ 86, 3.24% (Liquidity Facility Merrill Lynch & Co., | | | | | | | | |
| Inc.) (b)(c) | | | | 4,390 | | | | 4,390 |
| |
| See accompanying notes which are an integral part of the financial statements. | | | | |
| |
| 13 | | | | | | Annual Report |
| Fidelity California AMT Tax Free Money Market Fund | | | | |
| Investments continued | | | | | | | | | | |
| |
| Municipal Securities continued | | | | | | | | |
| | | | | Principal | | Value (Note 1) |
| | | | | Amount (000s) | | (000s) |
| California – continued | | | | | | | | | | |
| Golden State Tobacco Securitization Corp. Participating | | | | | | | | |
| VRDN: – continued | | | | | | | | | | |
| Series ROC II R287X, 3.23% (Liquidity Facility Citibank | | | | | | | | |
| NA) (b)(c) | | | | | | $ 3,535 | | | | $ 3,535 |
| Series ROC II R411CE, 3.23% (Liquidity Facility Citibank | | | | | | | | |
| NA) (b)(c) | | | | | | 5,400 | | | | 5,400 |
| Series ROC II R509, 3.21% (Liquidity Facility Citibank | | | | | | | | |
| NA) (b)(c) | | | | | | 8,000 | | | | 8,000 |
| Series TOC 04 B, 3.21% (Liquidity Facility Goldman Sachs | | | | | | | | |
| Group, Inc.) (b)(c) | | | | | | 7,500 | | | | 7,500 |
| Series TOC 06 Z4, 3.24% (Liquidity Facility Goldman Sachs | | | | | | | | |
| Group, Inc.) (b)(c) | | | | | | 4,900 | | | | 4,900 |
| Series TOC 06 Z5, 3.24% (Liquidity Facility Goldman Sachs | | | | | | | | |
| Group, Inc.) (b)(c) | | | | | | 2,500 | | | | 2,500 |
| Golden West Schools Fing. Auth. Participating VRDN Series PT | | | | | | | | |
| 3016, 3.22% (Liquidity Facility Dexia Cr. Local de | | | | | | | | |
| France) (b)(c) | | | | | | 8,895 | | | | 8,895 |
| Indian Wells Redev. Agcy. Rev. Participating VRDN Series | | | | | | | | |
| ROC II R2029, 3.21% (Liquidity Facility Citigroup Global | | | | | | | | |
| Markets Hldgs., Inc.) (b)(c) | | | | | | 6,090 | | | | 6,090 |
| Los Angeles Cmnty. College District Participating VRDN Series | | | | | | | | |
| Putters 742, 3.21% (Liquidity Facility Dresdner Bank | | | | | | | | |
| AG) (b)(c) | | | | | | 5,365 | | | | 5,365 |
| Los Angeles Cmnty. Redev. Agcy. Lease Rev. Participating | | | | | | | | |
| VRDN Series ROC II R395, 3.21% (Liquidity Facility Citibank | | | | | | | | |
| NA) (b)(c) | | | | | | 14,695 | | | | 14,695 |
| Los Angeles County Metropolitan Trans. Auth. Rev. | | | | | | | | |
| Participating VRDN Series SGB 1, 3.21% (Liquidity Facility | | | | | | | | |
| Societe Generale) (b)(c) | | | | | | 6,400 | | | | 6,400 |
| Los Angeles County Metropolitan Trans. Auth. Sales Tax Rev. | | | | | | | | |
| Participating VRDN Series EGL 04 16, 3.21% (Liquidity | | | | | | | | |
| Facility Citibank NA) (b)(c) | | | | | | 10,900 | | | | 10,900 |
| Los Angeles County Pub. Works Fing. Auth. Lease Rev. | | | | | | | | |
| Participating VRDN Series Merlots 00 JJJ, 3.22% (Liquidity | | | | | | | | |
| Facility Wachovia Bank NA) (b)(c) | | | | | | 13,830 | | | | 13,830 |
| Los Angeles Dept. of Wtr. & Pwr. Elec. Plant Rev. 3.2% 3/9/06 | | | | | | | | |
| (Liquidity Facility Dexia Cr. Local de France), CP | | | | 3,000 | | | | 3,000 |
| Los Angeles Dept. of Wtr. & Pwr. Rev.: | | | | | | | | | | |
| Participating VRDN: | | | | | | | | | | |
| Series PA 1192, 3.22% (Liquidity Facility Merrill Lynch & | | | | | | | | |
| Co., Inc.) (b)(c) | | | | | | 7,980 | | | | 7,980 |
| Series PT 2286, 3.22% (Liquidity Facility Merrill Lynch & | | | | | | | | |
| Co., Inc.) (b)(c) | | | | | | 5,550 | | | | 5,550 |
| Series ROC II R3010, 3.21% (Liquidity Facility Citigroup | | | | | | | | |
| Global Markets Hldgs., Inc.) (b)(c) | | | | | | 5,120 | | | | 5,120 |
See accompanying notes which are an integral part of the financial statements. | | | | |
| |
| Annual Report | | 14 | | | | | | | | |
| Municipal Securities continued | | | | | | | | |
| | | Principal | | Value (Note 1) |
| | | Amount (000s) | | (000s) |
| California – continued | | | | | | | | |
| Los Angeles Dept. of Wtr. & Pwr. Rev.: – continued | | | | | | | | |
| Subseries B5, 3.18% (Liquidity Facility Bank of America NA) | | | | | | | | |
| (Liquidity Facility Bayerische Landesbank Girozentrale), | | | | | | | | |
| VRDN (b) | | | | $ 18,800 | | | | $ 18,800 |
| Subseries B8, 3.18% (Liquidity Facility Bank of America NA) | | | | | | | | |
| (Liquidity Facility Bayerische Landesbank Girozentrale), | | | | | | | | |
| VRDN (b) | | | | 24,000 | | | | 24,000 |
| Los Angeles Dept. of Wtr. & Pwr. Wtrwks. Rev. Participating | | | | | | | | |
| VRDN Series Merlots 99 L, 3.22% (Liquidity Facility | | | | | | | | |
| Wachovia Bank NA) (b)(c) | | | | 8,500 | | | | 8,500 |
| Los Angeles Gen. Oblig. Participating VRDN Series PT 1476, | | | | | | | | |
| 3.22% (Liquidity Facility Merrill Lynch & Co., Inc.) (b)(c) | | | | 5,355 | | | | 5,355 |
| Los Angeles Muni. Impt. Corp. Lease Rev.: | | | | | | | | |
| Participating VRDN Series PT 1405, 3.22% (Liquidity Facility | | | | | | | | |
| Merrill Lynch & Co., Inc.) (b)(c) | | | | 1,130 | | | | 1,130 |
| Series 2004 A1, 3.12% 4/6/06, LOC Bank of America | | | | | | | | |
| NA, CP | | | | 6,300 | | | | 6,300 |
| Los Angeles Unified School District Participating VRDN: | | | | | | | | |
| Series Merlots 03 B37, 3.22% (Liquidity Facility Wachovia | | | | | | | | |
| Bank NA) (b)(c) | | | | 2,700 | | | | 2,700 |
| Series MSTC 01 135, 3.02% (Liquidity Facility Bear Stearns | | | | | | | | |
| Companies, Inc.) (b)(c) | | | | 8,895 | | | | 8,895 |
| Series PT 1737, 3.22% (Liquidity Facility Merrill Lynch & Co., | | | | | | | | |
| Inc.) (b)(c) | | | | 1,265 | | | | 1,265 |
| Series PT 1763, 3.22% (Liquidity Facility Merrill Lynch & Co., | | | | | | | | |
| Inc.) (b)(c) | | | | 16,740 | | | | 16,740 |
| Series PT 2196, 3.22% (Liquidity Facility Merrill Lynch & Co., | | | | | | | | |
| Inc.) (b)(c) | | | | 9,645 | | | | 9,645 |
| Series Putters 488, 3.21% (Liquidity Facility JPMorgan Chase | | | | | | | | |
| Bank) (b)(c) | | | | 17,940 | | | | 17,940 |
| Series SG 162, 3.22% (Liquidity Facility Societe | | | | | | | | |
| Generale) (b)(c) | | | | 20,805 | | | | 20,805 |
| Los Angeles Wastewtr. Sys. Rev. Participating VRDN: | | | | | | | | |
| Series ROC II R4034, 3.21% (Liquidity Facility Citigroup | | | | | | | | |
| Global Markets Hldgs., Inc.) (b)(c) | | | | 4,945 | | | | 4,945 |
| Series TOC 05 TT, 3.21% (Liquidity Facility Goldman Sachs | | | | | | | | |
| Group, Inc.) (b)(c) | | | | 16,100 | | | | 16,100 |
| Merced Irrigation District Elec. Sys. Rev. Participating VRDN | | | | | | | | |
| Series ROC II R512, 3.21% (Liquidity Facility Citibank | | | | | | | | |
| NA) (b)(c) | | | | 3,250 | | | | 3,250 |
| Metropolitan Wtr. District Southern California Wtrwks. Rev. | | | | | | | | |
| Participating VRDN: | | | | | | | | |
| Series FRRI 00 A6, 3.48% (Liquidity Facility Bayerische | | | | | | | | |
| Hypo-und Vereinsbank AG) (b)(c) | | | | 1,700 | | | | 1,700 |
See accompanying notes which are an integral part of the financial statements.
15 Annual Report
| Fidelity California AMT Tax Free Money Market Fund | | | | |
| Investments continued | | | | | | | | | | |
| |
| Municipal Securities continued | | | | | | | | |
| | | | | Principal | | Value (Note 1) |
| | | | | Amount (000s) | | (000s) |
| California – continued | | | | | | | | | | |
| Metropolitan Wtr. District Southern California Wtrwks. Rev. | | | | | | | | |
| Participating VRDN: – continued | | | | | | | | | | |
| Series Merlots 99 O, 3.22% (Liquidity Facility Wachovia | | | | | | | | |
| Bank NA) (b)(c) | | | | | | $ 11,880 | | | | $ 11,880 |
| Series MSTC 01 113A, 3.19% (Liquidity Facility Bear Stearns | | | | | | | | |
| Companies, Inc.) (b)(c) | | | | | | 7,990 | | | | 7,990 |
| Series PA 837, 3.22% (Liquidity Facility Merrill Lynch & Co., | | | | | | | | |
| Inc.) (b)(c) | | | | | | 4,995 | | | | 4,995 |
| Modesto Irrigation District Fing. Auth. Rev. Participating VRDN | | | | | | | | |
| Series SG 66, 3.22% (Liquidity Facility Societe | | | | | | | | |
| Generale) (b)(c) | | | | | | 2,500 | | | | 2,500 |
| North Orange County Cmnty. College District Rev. | | | | | | | | |
| Participating VRDN: | | | | | | | | | | |
| Series MSTC 9042, 3.19% (Liquidity Facility Bear Stearns | | | | | | | | |
| Companies, Inc.) (b)(c) | | | | | | 4,100 | | | | 4,100 |
| Series PT 1434, 3.22% (Liquidity Facility Merrill Lynch & Co., | | | | | | | | |
| Inc.) (b)(c) | | | | | | 7,705 | | | | 7,705 |
| Northern California Transmission Auth. Rev. Series B, 3.22% | | | | | | | | |
| 4/5/06, LOC WestLB AG, CP | | | | | | 9,770 | | | | 9,770 |
| Norwalk– Mirada Unified School District Participating VRDN | | | | | | | | |
| Series SG 169, 3.22% (Liquidity Facility Societe | | | | | | | | |
| Generale) (b)(c) | | | | | | 12,000 | | | | 12,000 |
| Oak Grove School District Participating VRDN Series ROC II | | | | | | | | |
| R7527, 3.21% (Liquidity Facility Citibank NA) (b)(c) | | | | 9,945 | | | | 9,945 |
| Oakland Gen. Oblig. Participating VRDN Series Merlots 00 A, | | | | | | | | |
| 3.22% (Liquidity Facility Wachovia Bank NA) (b)(c) | | | | 3,000 | | | | 3,000 |
| Oakland Joint Powers Fing. Auth. Participating VRDN | | | | | | | | |
| Series Putters 1253, 3.21% (Liquidity Facility JPMorgan | | | | | | | | |
| Chase Bank) (b)(c) | | | | | | 4,225 | | | | 4,225 |
| Orange County Apt. Dev. Rev. (Hidden Hills Apts. Proj.) | | | | | | | | |
| Series 1985 U, 3.06%, LOC Freddie Mac, VRDN (b) | | | | 10,500 | | | | 10,500 |
| Oxnard Fing. Auth. Wtr. Rev. Participating VRDN Series SG | | | | | | | | |
| 174, 3.22% (Liquidity Facility Societe Generale) (b)(c) | | | | 4,960 | | | | 4,960 |
| Pasadena Elec. Rev. Participating VRDN Series PT 2282, | | | | | | | | |
| 3.22% (Liquidity Facility Merrill Lynch & Co., Inc.) (b)(c) | | | | 5,295 | | | | 5,295 |
| Poway Redev. Agcy. Tax Allocation Rev. Participating VRDN: | | | | | | | | |
| Series PT 2474, 3.22% (Liquidity Facility Merrill Lynch & Co., | | | | | | | | |
| Inc.) (b)(c) | | | | | | 7,195 | | | | 7,195 |
| Series Putters 372, 3.21% (Liquidity Facility JPMorgan Chase | | | | | | | | |
| Bank) (b)(c) | | | | | | 11,085 | | | | 11,085 |
| Series ROC II R2046, 3.21% (Liquidity Facility Citigroup | | | | | | | | |
| Global Markets Hldgs., Inc.) (b)(c) | | | | | | 4,265 | | | | 4,265 |
| |
| |
| |
| See accompanying notes which are an integral part of the financial statements. | | | | |
| |
| Annual Report | | 16 | | | | | | | | |
| Municipal Securities continued | | | | | | | | |
| | | Principal | | Value (Note 1) |
| | | Amount (000s) | | (000s) |
| California – continued | | | | | | | | |
| Puttable Floating Option Tax Receipts Participating VRDN: | | | | | | | | |
| Series PZP 2, 3.33% (Liquidity Facility Merrill Lynch & Co., | | | | | | | | |
| Inc.) (b)(c) | | | | $ 7,275 | | | | $ 7,275 |
| Series PZP 9, 3.28% (Liquidity Facility Merrill Lynch & Co., | | | | | | | | |
| Inc.) (b)(c) | | | | 6,545 | | | | 6,545 |
| Rancho Santiago Cmnty. College District Participating VRDN | | | | | | | | |
| Series Floaters 05 23, 3.21% (Liquidity Facility Landesbank | | | | | | | | |
| Hessen-Thuringen) (b)(c) | | | | 5,400 | | | | 5,400 |
| Sacramento City Fing. Auth. Rev. Participating VRDN Series PZ | | | | | | | | |
| 93, 3.24% (Liquidity Facility Merrill Lynch & Co., Inc.) (b)(c) | | | | 5,120 | | | | 5,120 |
| Sacramento County Sanitation District Fing. Auth. Rev. | | | | | | | | |
| Participating VRDN: | | | | | | | | |
| Series EGL 04 47 Class A, 3.21% (Liquidity Facility Citibank | | | | | | | | |
| NA) (b)(c) | | | | 15,200 | | | | 15,200 |
| Series ROC II R2209, 3.21% (Liquidity Facility Citigroup | | | | | | | | |
| Global Markets Hldgs., Inc.) (b)(c) | | | | 2,220 | | | | 2,220 |
| Sacramento Muni. Util. District Elec. Rev.: | | | | | | | | |
| Participating VRDN: | | | | | | | | |
| Series BA 02 M, 3.21% (Liquidity Facility Bank of America | | | | | | | | |
| NA) (b)(c) | | | | 3,975 | | | | 3,975 |
| Series PT 2140, 3.22% (Liquidity Facility Merrill Lynch & | | | | | | | | |
| Co., Inc.) (b)(c) | | | | 7,220 | | | | 7,220 |
| Series PT 2215, 3.22% (Liquidity Facility Merrill Lynch & | | | | | | | | |
| Co., Inc.) (b)(c) | | | | 5,650 | | | | 5,650 |
| Series Putters 591, 3.21% (Liquidity Facility JPMorgan | | | | | | | | |
| Chase & Co.) (b)(c) | | | | 2,185 | | | | 2,185 |
| Series I, 3.08% 4/18/06, LOC Bayerische Landesbank | | | | | | | | |
| Girozentrale, LOC JPMorgan Chase Bank, CP | | | | 9,700 | | | | 9,700 |
| Sacramento Muni. Util. District Fing. Auth. Rev. Participating | | | | | | | | |
| VRDN Series Putters 1237Z, 3.21% (Liquidity Facility | | | | | | | | |
| JPMorgan Chase Bank) (b)(c) | | | | 10,475 | | | | 10,475 |
| San Diego County Gen. Oblig. Series B1, 3.13% 3/9/06, | | | | | | | | |
| LOC Landesbank Hessen-Thuringen, CP | | | | 5,000 | | | | 5,000 |
| San Diego Pub. Facilities Fing. Auth. Wtr. Rev. Participating | | | | | | | | |
| VRDN Series EGL 03 14, 3.21% (Liquidity Facility Citibank | | | | | | | | |
| NA, New York) (b)(c) | | | | 10,000 | | | | 10,000 |
| San Diego Unified School District Participating VRDN: | | | | | | | | |
| Series MS 01 847, 3.19% (Liquidity Facility Morgan | | | | | | | | |
| Stanley) (b)(c) | | | | 8,225 | | | | 8,225 |
| Series PA 1245, 3.22% (Liquidity Facility Merrill Lynch & | | | | | | | | |
| Co., Inc.) (b)(c) | | | | 1,335 | | | | 1,335 |
| Series ROC II R1067, 3.21% (Liquidity Facility Citigroup | | | | | | | | |
| Global Markets Hldgs., Inc.) (b)(c) | | | | 3,475 | | | | 3,475 |
See accompanying notes which are an integral part of the financial statements.
17 Annual Report
| Fidelity California AMT Tax Free Money Market Fund | | | | |
| Investments continued | | | | | | | | | | |
| |
| Municipal Securities continued | | | | | | | | |
| | | | | Principal | | Value (Note 1) |
| | | | | Amount (000s) | | (000s) |
| California – continued | | | | | | | | | | |
| San Francisco County Trans. Auth. Series 2004 A: | | | | | | | | |
| 3.1% 3/8/06 (Liquidity Facility Landesbank Baden-Wuert), | | | | | | | | |
| CP | | | | | | $ 8,200 | | | | $ 8,200 |
| 3.2% 4/3/06 (Liquidity Facility Landesbank Baden-Wuert), | | | | | | | | |
| CP | | | | | | 8,250 | | | | 8,250 |
| San Gabriel Valley Govts. 3.23% 4/5/06, LOC Bayerische | | | | | | | | |
| Landesbank Girozentrale, CP | | | | | | 26,000 | | | | 26,000 |
| San Jose Fin. Auth. Rev. 3.09% 4/4/06, LOC State Street | | | | | | | | |
| Bank & Trust Co., Boston, LOC California Teachers | | | | | | | | |
| Retirement Sys., CP | | | | | | 11,450 | | | | 11,450 |
| San Jose Redev. Agcy. Tax Allocation Participating VRDN | | | | | | | | |
| Series Putters 575, 3.21% (Liquidity Facility JPMorgan Chase | | | | | | | | |
| & Co.) (b)(c) | | | | | | 2,565 | | | | 2,565 |
| San Marcos Pub. Facilities Auth. Tax Allocation Rev. | | | | | | | | |
| Participating VRDN Series ROC II R2027, 3.21% (Liquidity | | | | | | | | |
| Facility Citigroup Global Markets Hldgs., Inc.) (b)(c) | | | | 5,635 | | | | 5,635 |
| San Mateo County Trans. District Sales Tax Rev. Participating | | | | | | | | |
| VRDN: | | | | | | | | | | |
| Series PT 1914, 3.22% (Liquidity Facility Merrill Lynch & Co., | | | | | | | | |
| Inc.) (b)(c) | | | | | | 5,245 | | | | 5,245 |
| Series TOC 05 DD, 3.21% (Liquidity Facility Goldman Sachs | | | | | | | | |
| Group, Inc.) (b)(c) | | | | | | 3,500 | | | | 3,500 |
| Santa Clara Elec. Rev. Participating VRDN Series ROC II R257, | | | | | | | | |
| 3.21% (Liquidity Facility Citibank NA) (b)(c) | | | | 3,635 | | | | 3,635 |
| Santa Clara Valley Wtr. District Ctfs. of Prtn. Participating | | | | | | | | |
| VRDN Series Merlots 00 MM, 3.22% (Liquidity Facility | | | | | | | | |
| Wachovia Bank NA) (b)(c) | | | | | | 8,900 | | | | 8,900 |
| Santa Clara Valley Wtr. District Wtr. Util. Rev. Series A, 3.08% | | | | | | | | |
| 3/6/06, LOC WestLB AG, CP | | | | | | 1,549 | | | | 1,549 |
| Santa Rosa High School District Participating VRDN Series PT | | | | | | | | |
| 2193, 3.22% (Liquidity Facility Merrill Lynch & Co., | | | | | | | | |
| Inc.) (b)(c) | | | | | | 4,120 | | | | 4,120 |
| Santa Rosa Wastewtr. Rev. Participating VRDN Series PZ 43, | | | | | | | | |
| 3.28% (Liquidity Facility Merrill Lynch & Co., Inc.) (b)(c) | | | | 5,700 | | | | 5,700 |
| Sequoia Union High School District Bonds Series AAB 03 2, | | | | | | | | |
| 3.2%, tender 3/7/06 (Liquidity Facility ABN-AMRO Bank | | | | | | | | |
| NV) (b)(c) | | | | | | 5,900 | | | | 5,900 |
| Southern California Pub. Pwr. Auth. Rev. Participating VRDN: | | | | | | | | |
| Series MS 1045, 3.19% (Liquidity Facility Morgan | | | | | | | | |
| Stanley) (b)(c) | | | | | | 5,470 | | | | 5,470 |
| Series ROC II R374, 3.21% (Liquidity Facility Citibank | | | | | | | | |
| NA) (b)(c) | | | | | | 6,250 | | | | 6,250 |
| Sunnyvale School District Participating VRDN Series Putters 800, | | | | | | | | |
| 3.21% (Liquidity Facility JPMorgan Chase & Co.) (b)(c) | | | | 7,685 | | | | 7,685 |
| |
| See accompanying notes which are an integral part of the financial statements. | | | | |
| |
| Annual Report | | 18 | | | | | | | | |
| Municipal Securities continued | | | | | | | | |
| | | Principal | | Value (Note 1) |
| | | Amount (000s) | | (000s) |
| California – continued | | | | | | | | |
| Turlock Irrigation District Rev. Participating VRDN Series ROC II | | | | | | | | |
| R2035, 3.21% (Liquidity Facility Citigroup Global Markets | | | | | | | | |
| Hldgs., Inc.) (b)(c) | | | | $ 4,990 | | | | $ 4,990 |
| Univ. of California Revs.: | | | | | | | | |
| Participating VRDN: | | | | | | | | |
| Series EGL 7050084, 3.21% (Liquidity Facility Citibank | | | | | | | | |
| NA) (b)(c) | | | | 9,000 | | | | 9,000 |
| Series Merlots 97 G, 3.22% (Liquidity Facility Wachovia | | | | | | | | |
| Bank NA) (b)(c) | | | | 20,000 | | | | 20,000 |
| Series MS 1210, 3.19% (Liquidity Facility Morgan | | | | | | | | |
| Stanley) (b)(c) | | | | 34,855 | | | | 34,855 |
| Series PA 1168, 3.22% (Liquidity Facility Merrill Lynch & | | | | | | | | |
| Co., Inc.) (b)(c) | | | | 20,045 | | | | 20,045 |
| Series A: | | | | | | | | |
| 3.1% 3/7/06, CP | | | | 6,000 | | | | 6,000 |
| 3.15% 3/15/06, CP | | | | 12,500 | | | | 12,500 |
| | | | | | | | | 2,009,428 |
| |
| Puerto Rico 4.3% | | | | | | | | |
| JPMorgan Chase Bank NA as Enhancement Custodian Bonds | | | | | | | | |
| 3.25% 7/24/06, LOC Societe Generale (a) | | | | 31,500 | | | | 31,500 |
| Puerto Rico Commonwealth Gen. Oblig.: | | | | | | | | |
| Participating VRDN: | | | | | | | | |
| Series IXIS 05 11, 3.21% (Liquidity Facility CDC Fin.-CDC | | | | | | | | |
| IXIS) (b)(c) | | | | 11,525 | | | | 11,525 |
| Series PA 1225, 3.2% (Liquidity Facility Merrill Lynch & | | | | | | | | |
| Co., Inc.) (b)(c) | | | | 7,060 | | | | 7,060 |
| Series PA 1280, 3.2% (Liquidity Facility Merrill Lynch & | | | | | | | | |
| Co., Inc.) (b)(c) | | | | 5,000 | | | | 5,000 |
| TRAN 4.5% 7/28/06, LOC Bank of Nova Scotia, New York | | | | | | | | |
| Agcy., LOC BNP Paribas SA | | | | 14,600 | | | | 14,675 |
| Puerto Rico Commonwealth Hwy. & Trans. Auth. Trans. Rev. | | | | | | | | |
| Participating VRDN Series MACN 06 M, 3.18% (Liquidity | | | | | | | | |
| Facility Bank of America NA) (b)(c) | | | | 4,915 | | | | 4,915 |
| |
| |
| |
| |
| See accompanying notes which are an integral part of the financial statements. | | | | |
| |
| 19 | | | | | | Annual Report |
| Fidelity California AMT Tax Free Money Market Fund | | | | |
| Investments continued | | | | | | | | |
| |
| Municipal Securities continued | | | | | | |
| | | | | Principal | | Value (Note 1) |
| | | | | Amount (000s) | | (000s) |
| Puerto Rico continued | | | | | | | | |
| Puerto Rico Commonwealth Infrastructure Fing. Auth. Bonds | | | | | | |
| Series MT 165, 3.15%, tender 10/12/06 (Liquidity Facility | | | | | | |
| Merrill Lynch & Co., Inc.) (b)(c)(d) | | | | $ 9,110 | | | | $ 9,110 |
| Puerto Rico Infrastructure Fing. Auth. Bonds Series AAB 00 17, | | | | | | |
| 3.18%, tender 3/7/06 (Liquidity Facility ABN-AMRO Bank | | | | | | |
| NV) (b)(c) | | | | 11,000 | | | | 11,000 |
| | | | | | | | | 94,785 |
| |
| |
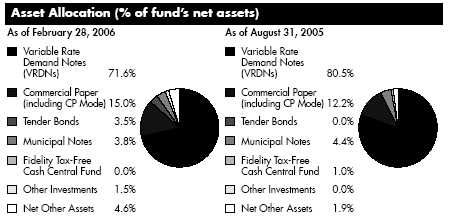
| TOTAL INVESTMENT PORTFOLIO 95.4% | | | | | | |
| (Cost $2,104,213) | | | | | | | | 2,104,213 |
| |
| NET OTHER ASSETS – 4.6% | | | | | | | | 101,334 |
| NET ASSETS 100% | | | | | | | | $ 2,205,547 |
| Security Type Abbreviations |
| CP | | — | | COMMERCIAL PAPER |
| RAN | | — | | REVENUE ANTICIPATION NOTE |
| TRAN | | — | | TAX AND REVENUE |
| | | | ANTICIPATION NOTE |
| VRDN | | — | | VARIABLE RATE DEMAND NOTE |
Legend
(a) Security exempt from registration under
Rule 144A of the Securities Act of 1933.
These securities may be resold in
transactions exempt from registration,
normally to qualified institutional buyers.
At the period end, the value of these
securities amounted to $31,500,000 or
1.4% of net assets.
(b) The coupon rate shown on floating or
adjustable rate securities represents the
rate at period end.
(c) Provides evidence of ownership in one
or more underlying municipal bonds.
|
(d) Restricted securities – Investment in
securities not registered under the
Securities Act of 1933 (excluding 144A
issues). At the end of the period, the
value of restricted securities (excluding
144A issues) amounted to $19,005,000
or 0.9% of net assets.
|
Additional information on each holding is as follows:
| | | Acquisition | | Cost |
| Security | | Date | | (000s) |
| California Gen. | | | | |
| Oblig. Bonds Series | | | | |
| MT 171, 3.23%, | | | | |
| tender 10/26/06 | | | | |
| (Liquidity Facility | | | | |
| DEPFA BANK PLC) | | 10/27/05 | | $ 9,895 |
| Puerto Rico | | | | |
| Commonwealth | | | | |
| Infrastructure Fing. | | | | |
| Auth. Bonds Series | | | | |
| MT 165, 3.15%, | | | | |
| tender 10/12/06 | | | | |
| (Liquidity Facility | | | | |
| Merrill Lynch & Co., | | | | |
| Inc.) | | 10/13/05 | | $ 9,110 |
See accompanying notes which are an integral part of the financial statements.
Annual Report 20
Affiliated Central Funds
Information regarding fiscal year to date income earned by the fund from the affiliated Central funds is as follows:
| Fund | | | | Income earned |
| | | | | (Amounts in thousands) |
| |
| Fidelity Tax Free Cash Central Fund | | | | $ 297 |
See accompanying notes which are an integral part of the financial statements.
21 Annual Report
Fidelity California AMT Tax Free Money Market Fund
Financial Statements
| Statement of Assets and Liabilities | | | | | | | | |
| Amounts in thousands (except per share amount) | | | | | | February 28, 2006 |
| |
| Assets | | | | | | | | |
| Investment in securities, at value | | | | | | | | |
| See accompanying schedule: | | | | | | | | |
| Unaffiliated issuers (cost $2,104,213) | | | | | | | | $ 2,104,213 |
| Cash | | | | | | | | 72,144 |
| Receivable for investments sold | | | | | | | | 15,980 |
| Receivable for fund shares sold | | | | | | | | 8,929 |
| Interest receivable | | | | | | | | 13,116 |
| Receivable from investment adviser for expense | | | | | | | | |
| reductions | | | | | | | | 195 |
| Other receivables | | | | | | | | 305 |
| Total assets | | | | | | | | 2,214,882 |
| |
| Liabilities | | | | | | | | |
| Payable for fund shares redeemed | | | | $ 8,116 | | | | |
| Distributions payable | | | | 440 | | | | |
| Accrued management fee | | | | 776 | | | | |
| Other affiliated payables | | | | 3 | | | | |
| Total liabilities | | | | | | | | 9,335 |
| |
| Net Assets | | | | | | | | $ 2,205,547 |
| Net Assets consist of: | | | | | | | | |
| Paid in capital | | | | | | | | $ 2,205,463 |
| Distributions in excess of net investment income | | | | | | | | (3) |
| Accumulated undistributed net realized gain (loss) on | | | | | | | | |
| investments | | | | | | | | 87 |
| Net Assets, for 2,205,103 shares outstanding | | | | | | | | $ 2,205,547 |
| Net Asset Value, offering price and redemption price per | | | | | | |
| share ($2,205,547 ÷ 2,205,103 shares) | | | | | | | | $ 1.00 |
See accompanying notes which are an integral part of the financial statements.
| Statement of Operations | | | | | | |
| Amounts in thousands | | | | Year ended February 28, 2006 |
| |
| Investment Income | | | | | | |
| Interest | | | | | | $ 47,170 |
| Income from affiliated Central Funds | | | | | | 297 |
| Total income | | | | | | 47,467 |
| |
| Expenses | | | | | | |
| Management fee | | | | $ 7,836 | | |
| Independent trustees’ compensation | | | | 8 | | |
| Total expenses before reductions | | | | 7,844 | | |
| Expense reductions | | | | (2,985) | | 4,859 |
| |
| Net investment income | | | | | | 42,608 |
| Realized and Unrealized Gain (Loss) | | | | | | |
| Net realized gain (loss) on: | | | | | | |
| Investment securities: | | | | | | |
| Unaffiliated issuers | | | | | | 64 |
| Net increase in net assets resulting from operations | | | | | | $ 42,672 |
See accompanying notes which are an integral part of the financial statements.
23 Annual Report
| Fidelity California AMT Tax Free Money Market Fund | | | | |
| Financial Statements continued | | | | | | | | |
| |
| Statement of Changes in Net Assets | | | | | | | | |
| | | | | Year ended | | | | Year ended |
| | | | | February 28, | | | | February 28, |
| Amounts in thousands | | | | 2006 | | | | 2005 |
| Increase (Decrease) in Net Assets | | | | | | | | |
| Operations | | | | | | | | |
| Net investment income | | | | $ 42,608 | | | | $ 14,113 |
| Net realized gain (loss) | | | | 64 | | | | 132 |
| Net increase in net assets resulting | | | | | | | | |
| from operations | | | | 42,672 | | | | 14,245 |
| Distributions to shareholders from net investment income | | . | | (42,654) | | | | (14,068) |
| Share transactions at net asset value of $1.00 per share | | | | | | | | |
| Proceeds from sales of shares | | | | 2,164,617 | | | | 1,208,818 |
| Reinvestment of distributions | | | | 38,823 | | | | 12,991 |
| Cost of shares redeemed | | | | (1,493,188) | | | | (966,357) |
| Net increase (decrease) in net assets and shares | | | | | | | | |
| resulting from share transactions | | | | 710,252 | | | | 255,452 |
| Total increase (decrease) in net assets | | | | 710,270 | | | | 255,629 |
| |
| Net Assets | | | | | | | | |
| Beginning of period | | | | 1,495,277 | | | | 1,239,648 |
| End of period (including distributions in excess of net | | | | | | | | |
| investment income of $3 and undistributed net | | | | | | | | |
| investment income of $24, respectively) | | | | $ 2,205,547 | | | | $ 1,495,277 |
See accompanying notes which are an integral part of the financial statements.
| Financial Highlights | | | | | | | | | | | | | | | | | | | | |
| |
| Years ended February 28, | | | | 2006 | | | | 2005 | | | | 2004C | | | | 2003 | | | | 2002 |
| Selected Per Share Data | | | | | | | | | | | | | | | | | | | | |
| Net asset value, | | | | | | | | | | | | | | | | | | | | |
| beginning of period | | | | $ 1.00 | | | | $ 1.00 | | | | $ 1.00 | | | | $ 1.00 | | | | $ 1.00 |
| Income from Investment | | | | | | | | | | | | | | | | | | | | |
| Operations | | | | | | | | | | | | | | | | | | | | |
| Net investment income | | | | 023 | | | | .010 | | | | .007 | | | | .011 | | | | .020 |
| Net realized and unrealized | | | | | | | | | | | | | | | | | | | | |
| gain (loss)D | | | | — | | | | — | | | | — | | | | — | | | | — |
| Total from investment operations | | | | .023 | | | | .010 | | | | .007 | | | | .011 | | | | .020 |
| Distributions from net investment | | | | | | | | | | | | | | | | | | | | |
| income | | | | (.023) | | | | (.010) | | | | (.007) | | | | (.011) | | | | (.020) |
| Distributions from net realized | | | | | | | | | | | | | | | | | | | | |
| gain | | | | — | | | | — | | | | —D | | | | — | | | | — |
| Total distributions | | | | (.023) | | | | (.010) | | | | (.007) | | | | (.011) | | | | (.020) |
| Net asset value, | | | | | | | | | | | | | | | | | | | | |
| end of period | | | | $ 1.00 | | | | $ 1.00 | | | | $ 1.00 | | | | $ 1.00 | | | | $ 1.00 |
| Total ReturnA | | | | 2.34% | | | | 1.04% | | | | .75% | | | | 1.15% | | | | 1.98% |
| Ratios to Average Net AssetsB | | | | | | | | | | | | | | | | | | | | |
| Expenses before reductions | | | | 43% | | | | .43% | | | | .43% | | | | .43% | | | | .48% |
| Expenses net of fee waivers, | | | | | | | | | | | | | | | | | | | | |
| if any | | | | 35% | | | | .35% | | | | .35% | | | | .35% | | | | .45% |
| Expenses net of all reductions | | | | 27% | | | | .31% | | | | .34% | | | | .32% | | | | .41% |
| Net investment income | | | | 2.34% | | | | 1.05% | | | | .73% | | | | 1.14% | | | | 1.95% |
| Supplemental Data | | | | | | | | | | | | | | | | | | | | |
| Net assets, end of period | | | | | | | | | | | | | | | | | | | | |
| (in millions) | | | | $ 2,206 | | | | $ 1,495 | | | | $ 1,240 | | | | $ 1,327 | | | | $ 1,061 |
A Total returns would have been lower had certain expenses not been reduced during the periods shown.
B Expense ratios reflect operating expenses of the fund. Expenses before reductions do not reflect amounts reimbursed by the investment adviser or
expense offset arrangements and do not represent the amount paid by the fund during periods when reimbursements or reductions occur.
Expenses net of fee waivers reflect expenses after reimbursement by the investment adviser but prior to reductions from expense offset
arrangements. Expenses net of all reductions represent the net expenses paid by the fund.
C For the year ended February 29.
D Amount represents less than $.001 per share.
|
See accompanying notes which are an integral part of the financial statements.
25 Annual Report
| Fidelity California Municipal Money Market Fund | | |
| Investment Changes/Performance |
| |
| Maturity Diversification | | | | | | |
| Days | | % of fund’s | | % of fund’s | | % of fund’s |
| | | investments | | investments | | investments |
| | | 2/28/06 | | 8/31/05 | | 2/28/05 |
| 0 – 30 | | 93.5 | | 91.4 | | 94.8 |
| 31 – 90 | | 3.4 | | 3.0 | | 0.1 |
| 91 – 180 | | 3.1 | | 0.7 | | 5.1 |
| 181 – 397 | | 0.0 | | 4.9 | | 0.0 |
Weighted Average Maturity | | | | | | |
| | | 2/28/06 | | 8/31/05 | | 2/28/05 |
| Fidelity California Municipal Money | | | | | | |
| Market | | 12 Days | | 23 Days | | 13 Days |
| California Tax Free Money Market | | | | | | |
| Funds Average* | | 22 Days | | 29 Days | | 28 Days |
| Current and Historical Seven Day Yields | | | | | | |
| | | 2/27/06 | | 11/28/05 | | 8/29/05 | | 5/30/05 | | 2/28/05 |
| California Municipal | | | | | | | | | | |
| Money Market Fund | | 2.67% | | 2.52% | | 2.05% | | 2.44% | | 1.38% |
| If Fidelity had not reimbursed | | | | | | | | | | |
| certain fund expenses | | — | | — | | — | | — | | 1.33% |
Yield refers to the income paid by the fund over a given period. Yields for money market funds are usually for seven day periods, as they are here, though they are expressed as annual percentage rates. Past performance is no guarantee of future results. Yield will vary and it is possible to lose money by investing in the fund.
*Source: iMoneyNet, Inc.
Annual Report 26
| Fidelity California Municipal Money Market Fund | | | | |
| Investments February 28, 2006 | | | | |
| Showing Percentage of Net Assets | | | | | | | | |
| |
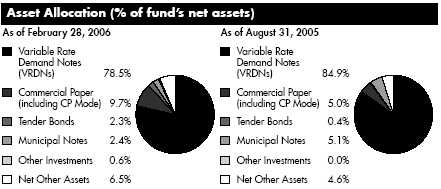
| Municipal Securities 93.5% | | | | | | | | |
| | | Principal | | Value (Note 1) |
| | | Amount (000s) | | (000s) |
| California – 91.9% | | | | | | | | |
| ABAG Fin. Auth. for Nonprofit Corps. Multi family Hsg. Rev. | | | | | | | | |
| (Vintage Chateau Proj.) Series A, 3.31%, LOC Union Bank | | | | | | | | |
| of California, VRDN (b)(c) | | | | $ 12,200 | | | | $ 12,200 |
| Alameda Corridor Trans. Auth. Rev. Participating VRDN: | | | | | | | | |
| Series BS 05 222 Class A, 3.29% (Liquidity Facility Bear | | | | | | | | |
| Stearns Companies, Inc.) (b)(d) | | | | 11,530 | | | | 11,530 |
| Series PZ 51, 3.24% (Liquidity Facility Merrill Lynch & Co., | | | | | | | | |
| Inc.) (b)(d) | | | | 11,685 | | | | 11,685 |
| Series PZ 70, 3.24% (Liquidity Facility Merrill Lynch & Co., | | | | | | | | |
| Inc.) (b)(d) | | | | 14,875 | | | | 14,875 |
| Alhambra Ctfs. of Prtn. Participating VRDN Series DB 193, | | | | | | | | |
| 3.22% (Liquidity Facility Deutsche Bank AG) (b)(d) | | | | 15,975 | | | | 15,975 |
| Bueno Park Multi-family Hsg. Rev. (Walden Glen Apts. Proj.) | | | | | | | | |
| Series 2000 A, 3.24%, LOC Fannie Mae, VRDN (b)(c) | | | | 14,288 | | | | 14,288 |
| Burbank Glendale Pasadena Arpt. Auth. Rev. Participating | | | | | | | | |
| VRDN: | | | | | | | | |
| Series MT 137, 3.26% (Liquidity Facility Merrill Lynch & Co., | | | | | | | | |
| Inc.) (b)(c)(d) | | | | 2,885 | | | | 2,885 |
| Series Putters 904, 3.23% (Liquidity Facility JPMorgan Chase | | | | | | | | |
| & Co.) (b)(c)(d) | | | | 5,725 | | | | 5,725 |
| California Dept. of Wtr. Resources Central Valley Proj. Wtr. | | | | | | | | |
| Sys. Rev. Participating VRDN: | | | | | | | | |
| Series PT 607, 3.22% (Liquidity Facility Bayerische Hypo-und | | | | | | | | |
| Vereinsbank AG) (b)(d) | | | | 6,585 | | | | 6,585 |
| Series ROC II R2068, 3.21% (Liquidity Facility Citigroup | | | | | | | | |
| Global Markets Hldgs., Inc.) (b)(d) | | | | 5,515 | | | | 5,515 |
| California Dept. of Wtr. Resources Pwr. Supply Rev.: | | | | | | | | |
| Bonds: | | | | | | | | |
| Subseries 2005 G11, 3.17%, tender 3/2/06 | | | | | | | | |
| (FSA Insured) (b) | | | | 50,000 | | | | 50,000 |
| Subseries 2005 G12, 3.17%, tender 3/2/06 | | | | | | | | |
| (FGIC Insured) (b) | | | | 13,700 | | | | 13,700 |
| Subseries 2005 G14, 3.17%, tender 3/2/06 | | | | | | | | |
| (FGIC Insured) (b) | | | | 33,000 | | | | 33,000 |
| Participating VRDN: | | | | | | | | |
| Series EGL 02 6017 Class A, 3.21% (Liquidity Facility | | | | | | | | |
| Citibank NA, New York) (b)(d) | | | | 12,100 | | | | 12,100 |
| Series EGL 03 19, 3.21% (Liquidity Facility Citibank NA, | | | | | | | | |
| New York) (b)(d) | | | | 6,930 | | | | 6,930 |
| Series Putters 309, 3.21% (Liquidity Facility JPMorgan | | | | | | | | |
| Chase Bank) (b)(d) | | | | 13,095 | | | | 13,095 |
| Series Putters 322, 3.21% (Liquidity Facility JPMorgan | | | | | | | | |
| Chase & Co.) (b)(d) | | | | 11,620 | | | | 11,620 |
| |
| See accompanying notes which are an integral part of the financial statements. | | | | |
| |
| 27 | | | | | | Annual Report |
| Fidelity California Municipal Money Market Fund | | | | |
| Investments continued | | | | | | | | | | |
| |
| Municipal Securities continued | | | | | | | | |
| | | | | Principal | | Value (Note 1) |
| | | | | Amount (000s) | | (000s) |
| California – continued | | | | | | | | | | |
| California Dept. of Wtr. Resources Pwr. Supply Rev.: - | | | | | | | | |
| continued | | | | | | | | | | |
| Participating VRDN: | | | | | | | | | | |
| Series Putters 532Z, 3.21% (Liquidity Facility JPMorgan | | | | | | | | |
| Chase Bank) (b)(d) | | | | | | $ 2,500 | | | | $ 2,500 |
| California Dept. of Wtr. Resources Wtr. Rev. Participating | | | | | | | | |
| VRDN: | | | | | | | | | | |
| Series Putters 664, 3.21% (Liquidity Facility JPMorgan Chase | | | | | | | | |
| & Co.) (b)(d) | | | | | | 3,400 | | | | 3,400 |
| Series ROC II R2062, 3.21% (Liquidity Facility Citigroup | | | | | | | | |
| Global Markets Hldgs., Inc.) (b)(d) | | | | | | 5,740 | | | | 5,740 |
| California Econ. Recovery Participating VRDN: | | | | | | | | |
| Series EGL 04 22, 3.21% (Liquidity Facility Citibank | | | | | | | | |
| NA) (b)(d) | | | | | | 26,600 | | | | 26,600 |
| Series ROC II R2114, 3.21% (Liquidity Facility Citigroup | | | | | | | | |
| Global Markets Hldgs., Inc.) (b)(d) | | | | | | 5,135 | | | | 5,135 |
| Series ROC II R6013, 3.21% (Liquidity Facility Citibank | | | | | | | | |
| NA) (b)(d) | | | | | | 10,750 | | | | 10,750 |
| California Edl. Facilities Auth. Rev. Participating VRDN: | | | | | | | | |
| Series EGL 03 45, 3.21% (Liquidity Facility Citibank NA, | | | | | | | | |
| New York) (b)(d) | | | | | | 6,775 | | | | 6,775 |
| Series PA 542, 3.22% (Liquidity Facility Merrill Lynch & Co., | | | | | | | | |
| Inc.) (b)(d) | | | | | | 8,105 | | | | 8,105 |
| California Edl. Facilities Rev. Participating VRDN Series AAB | | | | | | | | |
| 05 32, 3.2% (Liquidity Facility ABN-AMRO Bank NV) (b)(d) | | | | 12,000 | | | | 12,000 |
| California Gen. Oblig.: | | | | | | | | | | |
| Bonds Series AAB 00 1, 3.2%, tender 3/7/06 (Liquidity | | | | | | | | |
| Facility ABN AMRO Bank NV) (b)(d) | | | | | | 19,065 | | | | 19,065 |
| Participating VRDN: | | | | | | | | | | |
| Series 01 777X, 3.22% (Liquidity Facility Morgan | | | | | | | | |
| Stanley) (b)(c)(d) | | | | | | 11,670 | | | | 11,670 |
| Series EGL 04 1013 Class A, 3.21% (Liquidity Facility | | | | | | | | |
| Citibank NA) (b)(d) | | | | | | 9,900 | | | | 9,900 |
| Series Merlots 02 A17, 3.22% (Liquidity Facility Wachovia | | | | | | | | |
| Bank NA) (b)(d) | | | | | | 12,225 | | | | 12,225 |
| Series Merlots B45, 3.22% (Liquidity Facility Wachovia | | | | | | | | |
| Bank NA) (b)(d) | | | | | | 32,865 | | | | 32,865 |
| Series PA 1231, 3.22% (Liquidity Facility Merrill Lynch & | | | | | | | | |
| Co., Inc.) (b)(d) | | | | | | 11,370 | | | | 11,370 |
| Series PA 1300, 3.22% (Liquidity Facility Merrill Lynch & | | | | | | | | |
| Co., Inc.) (b)(d) | | | | | | 5,000 | | | | 5,000 |
| Series PA 1311, 3.23% (Liquidity Facility Merrill Lynch & | | | | | | | | |
| Co., Inc.) (b)(d) | | | | | | 9,155 | | | | 9,155 |
| |
| See accompanying notes which are an integral part of the financial statements. | | | | |
| |
| Annual Report | | 28 | | | | | | | | |
| Municipal Securities continued | | | | | | | | |
| | | Principal | | Value (Note 1) |
| | | Amount (000s) | | (000s) |
| California – continued | | | | | | | | |
| California Gen. Oblig.: – continued | | | | | | | | |
| Participating VRDN: | | | | | | | | |
| Series PT 1252, 3.22% (Liquidity Facility Merrill Lynch & | | | | | | | | |
| Co., Inc.) (b)(d) | | | | $ 23,945 | | | | $ 23,945 |
| Series PT 1389, 3.22% (Liquidity Facility Merrill Lynch & | | | | | | | | |
| Co., Inc.) (b)(d) | | | | 5,095 | | | | 5,095 |
| Series PT 2272, 3.22% (Liquidity Facility Dexia Cr. Local | | | | | | | | |
| de France) (b)(d) | | | | 5,375 | | | | 5,375 |
| Series PT 2485, 3.22% (Liquidity Facility Merrill Lynch & | | | | | | | | |
| Co., Inc.) (b)(d) | | | | 3,000 | | | | 3,000 |
| Series PT 964, 3.22% (Liquidity Facility Landesbank | | | | | | | | |
| Hessen-Thuringen) (b)(d) | | | | 11,800 | | | | 11,800 |
| Series Putters 1131, 3.21% (Liquidity Facility JPMorgan | | | | | | | | |
| Chase & Co.) (b)(d) | | | | 7,000 | | | | 7,000 |
| Series Putters 1174, 3.21% (Liquidity Facility JPMorgan | | | | | | | | |
| Chase & Co.) (b)(d) | | | | 8,835 | | | | 8,835 |
| Series Putters 245, 3.21% (Liquidity Facility JPMorgan | | | | | | | | |
| Chase Bank) (b)(d) | | | | 6,660 | | | | 6,660 |
| Series Putters 557Z, 3.21% (Liquidity Facility JPMorgan | | | | | | | | |
| Chase Bank) (b)(d) | | | | 6,445 | | | | 6,445 |
| Series ROC II R438CE, 3.26% (Liquidity Facility Citibank | | | | | | | | |
| NA) (b)(c)(d) | | | | 9,375 | | | | 9,375 |
| Series SG 95, 3.22% (Liquidity Facility Societe Generale) (b)(d) | | | | 9,385 | | | | 9,385 |
| Series SGB 62, 3.21% (Liquidity Facility Societe | | | | | | | | |
| Generale) (b)(d) | | | | 10,000 | | | | 10,000 |
| Series TOC 05 HH, 3.21% (Liquidity Facility Goldman | | | | | | | | |
| Sachs Group, Inc.) (b)(d) | | | | 1,200 | | | | 1,200 |
| RAN 4.5% 6/30/06 | | | | 67,100 | | | | 67,427 |
| Series 2005 B6, 2.95%, LOC KBC Bank NV, VRDN (b) | | | | 10,000 | | | | 10,000 |
| 3.07% 3/8/06 (Liquidity Facility Bank of Nova Scotia, New | | | | | | | | |
| York Agcy.) (Liquidity Facility Societe Generale), CP | | | | 14,200 | | | | 14,200 |
| 3.1% 3/7/06 (Liquidity Facility Bank of Nova Scotia, New | | | | | | | | |
| York Agcy.) (Liquidity Facility Societe Generale), CP | | | | 26,400 | | | | 26,400 |
| 3.13% 3/9/06 (Liquidity Facility Bank of Nova Scotia, New | | | | | | | | |
| York Agcy.) (Liquidity Facility Societe Generale), CP | | | | 38,900 | | | | 38,900 |
| 3.14% 3/6/06 (Liquidity Facility Bank of Nova Scotia, New | | | | | | | | |
| York Agcy.) (Liquidity Facility Societe Generale), CP | | | | 39,300 | | | | 39,300 |
| 3.14% 3/14/06 (Liquidity Facility Bank of Nova Scotia, | | | | | | | | |
| New York Agcy.) (Liquidity Facility Societe Generale), CP . | | | | 41,200 | | | | 41,200 |
| 3.15% 3/6/06 (Liquidity Facility Bank of Nova Scotia, New | | | | | | | | |
| York Agcy.) (Liquidity Facility Societe Generale), CP | | | | 11,100 | | | | 11,100 |
| 3.25% 4/6/06 (Liquidity Facility Bank of Nova Scotia, New | | | | | | | | |
| York Agcy.) (Liquidity Facility Societe Generale), CP | | | | 45,000 | | | | 45,000 |
See accompanying notes which are an integral part of the financial statements.
29 Annual Report
| Fidelity California Municipal Money Market Fund | | | | |
| Investments continued | | | | | | | | | | |
| |
| Municipal Securities continued | | | | | | | | |
| | | | | Principal | | Value (Note 1) |
| | | | | Amount (000s) | | (000s) |
| California – continued | | | | | | | | | | |
| California Health Facilities Fing. Auth. Rev. Participating VRDN | | | | | | | | | | |
| Series PT 953, 3.24% (Liquidity Facility Merrill Lynch & Co., | | | | | | | | | | |
| Inc.) (b)(d) | | | | | | $ 6,495 | | | | $ 6,495 |
| California Hsg. Fin. Agcy. Home Mtg. Rev.: | | | | | | | | |
| Participating VRDN: | | | | | | | | | | |
| Series MT 198, 3.25% (Liquidity Facility Landesbank | | | | | | | | |
| Hessen-Thuringen) (b)(c)(d) | | | | | | 3,995 | | | | 3,995 |
| Series MT 208, 3.25% (Liquidity Facility Lloyds TSB Bank | | | | | | | | |
| PLC) (b)(c)(d) | | | | | | 25,915 | | | | 25,915 |
| Series MT 211, 3.25% (Liquidity Facility Lloyds TSB Bank | | | | | | | | |
| PLC) (b)(c)(d) | | | | | | 13,785 | | | | 13,785 |
| Series MT 22, 3.25% (Liquidity Facility Landesbank | | | | | | | | |
| Hessen-Thuringen) (b)(c)(d) | | | | | | 11,090 | | | | 11,090 |
| Series MT 225, 3.25% (Liquidity Facility Merrill Lynch & | | | | | | | | |
| Co., Inc.) (b)(c)(d) | | | | | | 26,145 | | | | 26,145 |
| Series MT 36, 3.25% (Liquidity Facility Landesbank | | | | | | | | |
| Hessen-Thuringen) (b)(c)(d) | | | | | | 20,000 | | | | 20,000 |
| Series MT 4, 3.25% (Liquidity Facility Merrill Lynch & Co., | | | | | | |
| Inc.) (b)(c)(d) | | | | | | 9,995 | | | | 9,995 |
| Series MT 7, 3.25% (Liquidity Facility Landesbank | | | | | | | | |
| Hessen-Thuringen) (b)(c)(d) | | | | | | 47,495 | | | | 47,495 |
| Series MT 73, 3.25% (Liquidity Facility Merrill Lynch & | | | | | | | | |
| Co., Inc.) (b)(c)(d) | | | | | | 10,000 | | | | 10,000 |
| Series MT 79, 3.25% (Liquidity Facility Landesbank | | | | | | | | |
| Hessen-Thuringen) (b)(c)(d) | | | | | | 5,480 | | | | 5,480 |
| Series MT 85, 3.22% (Liquidity Facility Lloyds TSB Bank | | | | | | | | |
| PLC) (b)(d) | | | | | | 12,230 | | | | 12,230 |
| Series PT 2353, 3.25% (Liquidity Facility Merrill Lynch & | | | | | | | | |
| Co., Inc.) (b)(c)(d) | | | | | | 16,500 | | | | 16,500 |
| Series PT 2399, 3.25% (Liquidity Facility Merrill Lynch & | | | | | | | | |
| Co., Inc.) (b)(c)(d) | | | | | | 8,085 | | | | 8,085 |
| Series PT 997, 3.25% (Liquidity Facility Merrill Lynch & | | | | | | | | |
| Co., Inc.) (b)(c)(d) | | | | | | 2,875 | | | | 2,875 |
| Series PT 998, 3.25% (Liquidity Facility Landesbank | | | | | | | | |
| Hessen-Thuringen) (b)(c)(d) | | | | | | 47,000 | | | | 47,000 |
| Series 2001 E, 3.2%, LOC Fannie Mae, VRDN (b)(c) | | | | 22,500 | | | | 22,500 |
| Series 2005 B, 3.19% (AMBAC Insured), VRDN (b)(c) | | | | 32,295 | | | | 32,295 |
| Series 2005 D, 3.2% (Liquidity Facility Bayerische Landesbank | | | | | | |
| Girozentrale) (Liquidity Facility WestLB AG), VRDN (b)(c) | | | | 47,475 | | | | 47,475 |
| Series 2005 F: | | | | | | | | | | |
| 3.23% (Liquidity Facility Lloyds TSB Bank PLC), VRDN (b)(c) | | | | 20,000 | | | | 20,000 |
| 3.23% (Liquidity Facility Lloyds TSB Bank PLC), VRDN (b)(c) | | | | 56,685 | | | | 56,685 |
| |
| |
| See accompanying notes which are an integral part of the financial statements. | | | | |
| |
| Annual Report | | 30 | | | | | | | | |
| Municipal Securities continued | | | | | | |
| | | Principal | | Value (Note 1) |
| | | Amount (000s) | | (000s) |
| California – continued | | | | | | |
| California Hsg. Fin. Agcy. Home Mtg. Rev.: – continued | | | | | | |
| Series D, 3.2% (Liquidity Facility Bayerische Landesbank | | | | | | |
| Girozentrale) (Liquidity Facility WestLB AG), VRDN (b)(c) . | | $ 43,950 | | | | $ 43,950 |
| Series Q, 3.23% (AMBAC Insured), VRDN (b)(c) | | 19,185 | | | | 19,185 |
| California Infrastructure & Econ. Dev. Bank Rev. Participating | | | | | | |
| VRDN: | | | | | | |
| Series EGL 03 42, 3.21% (Liquidity Facility Citibank NA, | | | | | | |
| New York) (b)(d) | | 7,500 | | | | 7,500 |
| Series EGL 03 46, 3.21% (Liquidity Facility Citibank NA, | | | | | | |
| New York) (b)(d) | | 7,700 | | | | 7,700 |
| Series EGL 04 28 Class A, 3.21% (Liquidity Facility Citibank | | | | | | |
| NA) (b)(d) | | 7,000 | | | | 7,000 |
| Series PA 1202R, 3.22% (Liquidity Facility Merrill Lynch & | | | | | | |
| Co., Inc.) (b)(d) | | 5,000 | | | | 5,000 |
| Series Putters 492, 3.21% (Liquidity Facility JPMorgan Chase | | | | | | |
| Bank) (b)(d) | | 10,595 | | | | 10,595 |
| Series SG 172, 3.22% (Liquidity Facility Societe | | | | | | |
| Generale) (b)(d) | | 27,600 | | | | 27,600 |
| Series SGB 50, 3.21% (Liquidity Facility Societe | | | | | | |
| Generale) (b)(d) | | 12,635 | | | | 12,635 |
| California Poll. Cont. Fing. Auth. Ctfs. of Prtn.: | | | | | | |
| Participating VRDN: | | | | | | |
| Series Putters 475, 3.23% (Liquidity Facility JPMorgan | | | | | | |
| Chase Bank) (b)(c)(d) | | 12,495 | | | | 12,495 |
| Series ROC II R396, 3.25% (Liquidity Facility Citibank | | | | | | |
| NA) (b)(c)(d) | | 12,180 | | | | 12,180 |
| (Pacific Gas & Elec. Co. Proj.): | | | | | | |
| Series 1996 E, 2.97%, LOC JPMorgan Chase Bank, | | | | | | |
| VRDN (b) | | 21,825 | | | | 21,825 |
| Series 1997 B, 3.02%, LOC JPMorgan Chase Bank, | | | | | | |
| VRDN (b)(c) | | 7,400 | | | | 7,400 |
| California Poll. Cont. Fing. Auth. Solid Waste Disp. Rev. | | | | | | |
| (Republic Services, Inc. Proj.) 3.43%, VRDN (b)(c) | | 18,000 | | | | 18,000 |
| California Pub. Works Board Lease Rev. Participating VRDN: | | | | | | |
| Series PT 3262, 3.22% (Liquidity Facility Merrill Lynch & Co., | | | | | | |
| Inc.) (b)(d) | | 22,285 | | | | 22,285 |
| Series Putters 1175, 3.21% (Liquidity Facility JPMorgan | | | | | | |
| Chase & Co.) (b)(d) | | 5,160 | | | | 5,160 |
| Series Putters 610, 3.21% (Liquidity Facility JPMorgan Chase | | | | | | |
| Bank) (b)(d) | | 3,765 | | | | 3,765 |
See accompanying notes which are an integral part of the financial statements.
31 Annual Report
| Fidelity California Municipal Money Market Fund | | | | |
| Investments continued | | | | | | | | |
| |
| Municipal Securities continued | | | | | | | | |
| | | Principal | | Value (Note 1) |
| | | Amount (000s) | | (000s) |
| California – continued | | | | | | | | |
| California State Univ. Rev. & Colleges Participating VRDN: | | | | | | | | |
| Series EGL 7050014, 3.21% (Liquidity Facility Citibank | | | | | | | | |
| NA) (b)(d) | | | | $ 20,000 | | | | $ 20,000 |
| Series SG 170, 3.22% (Liquidity Facility Societe | | | | | | | | |
| Generale) (b)(d) | | | | 11,700 | | | | 11,700 |
| California Statewide Cmnty. Dev. Auth. Multi-family Rev.: | | | | | | | | |
| (Aegis of Aptos Proj.) Series 1998-Y 3.24%, LOC Fannie | | | | | | | | |
| Mae, VRDN (b)(c) | | | | 3,350 | | | | 3,350 |
| (Bristol Apts. Proj.) Series Z, 3.24%, LOC Freddie Mac, | | | | | | | | |
| VRDN (b)(c) | | | | 9,500 | | | | 9,500 |
| (Canyon Creek Apts. Proj.) Series 1995 C, 3.25%, LOC | | | | | | | | |
| Fannie Mae, VRDN (b)(c) | | | | 28,800 | | | | 28,800 |
| (Crocker Oaks Apts. Proj.) Series 2001 H, 3.24%, LOC | | | | | | | | |
| Fannie Mae, VRDN (b)(c) | | | | 6,750 | | | | 6,750 |
| (Crystal View Apt. Proj.) Series A, 3.24%, LOC Fannie Mae, | | | | | | | | |
| VRDN (b)(c) | | | | 20,000 | | | | 20,000 |
| (Grove Apts. Proj.) Series X, 3.24%, LOC Fannie Mae, | | | | | | | | |
| VRDN (b)(c) | | | | 6,150 | | | | 6,150 |
| (Irvine Apt. Communities LP Proj.): | | | | | | | | |
| Series 2001 W1, 3.24%, LOC Wells Fargo Bank NA, San | | | | | | | | |
| Francisco, VRDN (b)(c) | | | | 12,400 | | | | 12,400 |
| Series 2001 W2, 3.24%, LOC Wells Fargo Bank NA, San | | | | | | | | |
| Francisco, VRDN (b)(c) | | | | 22,788 | | | | 22,788 |
| (Maple Square Apt. Proj.) Series AA, 3.27%, LOC Citibank | | | | | | | | |
| NA, VRDN (b)(c) | | | | 7,200 | | | | 7,200 |
| (Marlin Cove Apts. Proj.) Series V, 3.24%, LOC Fannie Mae, | | | | | | | | |
| VRDN (b)(c) | | | | 16,000 | | | | 16,000 |
| (Northwest Gateway Apts. Proj.) Series 2004 C, 3.27%, | | | | | | | | |
| LOC Bank of America NA, VRDN (b)(c) | | | | 33,800 | | | | 33,800 |
| (Northwood Apts. Proj.) Series N, 3.24%, LOC Freddie Mac, | | | | | | | | |
| VRDN (b)(c) | | | | 5,000 | | | | 5,000 |
| (Oakmont Stockton Proj.) Series 1997 C, 3.32% (Gen. Elec. | | | | | | | | |
| Cap. Corp. Guaranteed), VRDN (b)(c) | | | | 5,960 | | | | 5,960 |
| (River Run Sr. Apts. Proj.) Series LL, 3.24%, LOC Fannie | | | | | | | | |
| Mae, VRDN (b)(c) | | | | 13,805 | | | | 13,805 |
| (Terraces at Park Marino Proj.) Series I, 3.3%, LOC | | | | | | | | |
| California Teachers Retirement Sys., VRDN (b)(c) | | | | 7,155 | | | | 7,155 |
| (The Crossings at Elk Grove Apts.) Series H, 3.27%, LOC | | | | | | | | |
| Citibank NA, VRDN (b)(c) | | | | 15,000 | | | | 15,000 |
| (The Crossings Sr. Apts./ Phase II Proj.) Series J, 3.27%, | | | | | | | | |
| LOC Citibank NA, VRDN (b)(c) | | | | 7,425 | | | | 7,425 |
| (Villa Paseo Proj.) 3.24%, LOC Fed. Home Ln. Bank, San | | | | | | | | |
| Francisco, VRDN (b)(c) | | | | 4,000 | | | | 4,000 |
See accompanying notes which are an integral part of the financial statements.
| Municipal Securities continued | | | | | | | | |
| | | Principal | | Value (Note 1) |
| | | Amount (000s) | | (000s) |
| California – continued | | | | | | | | |
| California Statewide Cmnty. Dev. Auth. Multi-family Rev.: - | | | | | | | | |
| continued | | | | | | | | |
| (Vineyard Creek Apts. Proj.) Series 2003 W, 3.24%, LOC | | | | | | | | |
| Fed. Home Ln. Bank, San Francisco, VRDN (b)(c) | | | | $ 16,200 | | | | $ 16,200 |
| (Wilshire Court Proj.) Series M, 3.24%, LOC Fannie Mae, | | | | | | | | |
| VRDN (b)(c) | | | | 17,500 | | | | 17,500 |
| California Statewide Cmnty. Dev. Corp. Rev.: | | | | | | | | |
| (Lansmont Corp. Proj.) Series 1996 G, 3.29%, LOC Wells | | | | | | | | |
| Fargo Bank NA, San Francisco, VRDN (b)(c) | | | | 1,250 | | | | 1,250 |
| (Merrill Packaging Proj.) 3.29%, LOC Wells Fargo Bank NA, | | | | | | | | |
| San Francisco, VRDN (b)(c) | | | | 950 | | | | 950 |
| (Rix Industries Proj.) Series 1996 I, 3.29%, LOC Wells Fargo | | | | | | | | |
| Bank NA, San Francisco, VRDN (b)(c) | | | | 1,280 | | | | 1,280 |
| (Supreme Truck Bodies of California Proj.) 3.29%, LOC | | | | | | | | |
| JPMorgan Chase Bank, VRDN (b)(c) | | | | 1,400 | | | | 1,400 |
| California Statewide Cmntys. Dev. Auth. Iam Commercial | | | | | | | | |
| Paper Bonds (Kaiser Permanente Health Sys. Proj.) Series | | | | | | | | |
| 2004 K, 3.17% tender 4/13/06, CP mode | | | | 14,000 | | | | 14,000 |
| California Statewide Cmntys. Dev. Auth. Rev. (JTF Enterprises | | | | | | | | |
| LLC Proj.) Series 1996 A, 3.29%, LOC Bank of America NA, | | | | | | | | |
| VRDN (b)(c) | | | | 3,000 | | | | 3,000 |
| Carson Redev. Agcy. Participating VRDN Series ROC II R2076, | | | | | | | | |
| 3.21% (Liquidity Facility Citigroup Global Markets Hldgs., | | | | | | | | |
| Inc.) (b)(d) | | | | 3,165 | | | | 3,165 |
| Chico Redev. Agcy. Participating VRDN Series DB 192, 3.22% | | | | | | | | |
| (Liquidity Facility Deutsche Bank AG) (b)(d) | | | | 13,630 | | | | 13,630 |
| Clovis Unified School District Participating VRDN Series PZ 49, | | | | | | | | |
| 3.24% (Liquidity Facility Merrill Lynch & Co., Inc.) (b)(d) | | | | 3,560 | | | | 3,560 |
| Contra Costa County Multi-family Hsg. Rev. (Del Norte Place | | | | | | | | |
| Apt. Proj.) Series 1994, 3.13%, LOC Freddie Mac, | | | | | | | | |
| VRDN (b)(c) | | | | 10,610 | | | | 10,610 |
| Dublin Unified School District Participating VRDN: | | | | | | | | |
| Series PT 2633, 3.22% (Liquidity Facility Merrill Lynch & Co., | | | | �� | | | | |
| Inc.) (b)(d) | | | | 6,015 | | | | 6,015 |
| Series Putters 809, 3.21% (Liquidity Facility JPMorgan Chase | | | | | | | | |
| & Co.) (b)(d) | | | | 5,710 | | | | 5,710 |
| East Bay Muni. Util. District Wtr. Sys. Rev.: | | | | | | | | |
| Participating VRDN: | | | | | | | | |
| Series EGL 7053015, 3.21% (Liquidity Facility Citibank | | | | | | | | |
| NA) (b)(d) | | | | 10,000 | | | | 10,000 |
| Series ROC II R4028, 3.21% (Liquidity Facility Citigroup | | | | | | | | |
| Global Markets Hldgs., Inc.) (b)(d) | | | | 7,535 | | | | 7,535 |
| |
| |
| See accompanying notes which are an integral part of the financial statements. | | | | |
| |
| 33 | | | | | | Annual Report |
| Fidelity California Municipal Money Market Fund | | | | |
| Investments continued | | | | | | | | | | |
| |
| Municipal Securities continued | | | | | | | | |
| | | | | Principal | | Value (Note 1) |
| | | | | Amount (000s) | | (000s) |
| California – continued | | | | | | | | | | |
| East Bay Muni. Util. District Wtr. Sys. Rev.: – continued | | | | | | | | |
| Series 1988: | | | | | | | | | | |
| 3.11% 3/13/06, CP | | | | | | $ 11,700 | | | | $ 11,700 |
| 3.17% 4/7/06, CP | | | | | | 6,000 | | | | 6,000 |
| Series 1998, 2.93% 3/9/06, CP | | | | | | 17,900 | | | | 17,900 |
| Elk Grove Fin. Auth. Spl. Tax Rev. Participating VRDN Series | | | | | | | | |
| DB 190, 3.22% (Liquidity Facility Deutsche Bank AG) (b)(d) . | | | | 5,185 | | | | 5,185 |
| Fairfield Suisun Unified School District Participating VRDN Series | | | | | | | | |
| ROC II R 6019, 3.21% (Liquidity Facility Citibank NA) (b)(d) | | | | 5,940 | | | | 5,940 |
| Fontana Pub. Fing. Authorized Tax Allocation Rev. | | | | | | | | |
| Participating VRDN Series Putters 707, 3.21% (Liquidity | | | | | | | | |
| Facility JPMorgan Chase & Co.) (b)(d) | | | | | | 2,080 | | | | 2,080 |
| Foothill-De Anza Cmnty. College District Participating VRDN: | | | | | | | | |
| Series Merlots 00 YY, 3.22% (Liquidity Facility Wachovia | | | | | | | | |
| Bank NA) (b)(d) | | | | | | 3,650 | | | | 3,650 |
| Series PZ 57, 3.24% (Liquidity Facility Merrill Lynch & Co., | | | | | | | | |
| Inc.) (b)(d) | | | | | | 6,775 | | | | 6,775 |
| Series ROC II R4540, 3.21% (Liquidity Facility Citigroup | | | | | | | | |
| Global Markets Hldgs., Inc.) (b)(d) | | | | | | 7,520 | | | | 7,520 |
| Fresno Arpt. Rev. Participating VRDN Series Merlots 00 B2, | | | | | | | | |
| 3.27% (Liquidity Facility Wachovia Bank NA) (b)(c)(d) | | | | 4,160 | | | | 4,160 |
| Garden Grove Hsg. Auth. Multi-family Hsg. Rev. (Valley View | | | | | | | | |
| Sr. Villas Proj.) Series 1990 A, 3.28%, LOC Comerica Bank, | | | | | | | | |
| Detroit, VRDN (b)(c) | | | | | | 9,100 | | | | 9,100 |
| Golden State Tobacco Securitization Corp. Participating | | | | | | | | |
| VRDN: | | | | | | | | | | |
| Series Best 05 230, 3.29% (Liquidity Facility Bear Stearns | | | | | | | | |
| Companies, Inc.) (b)(d) | | | | | | 7,175 | | | | 7,175 |
| Series DB 195, 3.26% (Liquidity Facility Deutsche Bank | | | | | | | | |
| AG) (b)(d) | | | | | | 2,085 | | | | 2,085 |
| Series EGL 7053007, 3.21% (Liquidity Facility Citibank | | | | | | | | |
| NA) (b)(d) | | | | | | 31,800 | | | | 31,800 |
| Series EGL 7053009, 3.22% (Liquidity Facility Citibank | | | | | | | | |
| NA) (b)(d) | | | | | | 19,800 | | | | 19,800 |
| Series EGL 7053017, 3.21% (Liquidity Facility Citibank | | | | | | | | |
| NA) (b)(d) | | | | | | 105,500 | | | | 105,500 |
| Series LB 05 FC1, 3.23% (Lehman Brothers Hldgs., Inc. | | | | | | | | |
| Guaranteed) (Liquidity Facility Lehman Brothers Hldgs., | | | | | | | | |
| Inc.) (b)(d) | | | | | | 10,000 | | | | 10,000 |
| Series LB 05 FC2, 3.23% (Lehman Brothers Hldgs., Inc. | | | | | | | | |
| Guaranteed) (Liquidity Facility Lehman Brothers Hldgs., | | | | | | | | |
| Inc.) (b)(d) | | | | | | 13,545 | | | | 13,545 |
| Series MSTC 238, 3.29% (Liquidity Facility Bear Stearns | | | | | | | | |
| Companies, Inc.) (b)(d) | | | | | | 7,510 | | | | 7,510 |
See accompanying notes which are an integral part of the financial statements. | | | | |
| |
| Annual Report | | 34 | | | | | | | | |
| Municipal Securities continued | | | | | | | | |
| | | Principal | | Value (Note 1) |
| | | Amount (000s) | | (000s) |
| California – continued | | | | | | | | |
| Golden State Tobacco Securitization Corp. Participating | | | | | | | | |
| VRDN: – continued | | | | | | | | |
| Series PA 1236, 3.26% (Liquidity Facility Merrill Lynch & | | | | | | | | |
| Co., Inc.) (b)(d) | | | | $ 3,535 | | | | $ 3,535 |
| Series PZ 86, 3.24% (Liquidity Facility Merrill Lynch & Co., | | | | | | | | |
| Inc.) (b)(d) | | | | 5,050 | | | | 5,050 |
| Series ROC II R411CE, 3.23% (Liquidity Facility Citibank | | | | | | | | |
| NA) (b)(d) | | | | 13,695 | | | | 13,695 |
| Series ROC II R443CE, 3.23% (Liquidity Facility Citibank | | | | | | | | |
| NA) (b)(d) | | | | 9,185 | | | | 9,185 |
| Series ROC II R448CE, 3.23% (Liquidity Facility Citibank | | | | | | | | |
| NA) (b)(d) | | | | 7,500 | | | | 7,500 |
| Series TOC 04 B, 3.21% (Liquidity Facility Goldman Sachs | | | | | | | | |
| Group, Inc.) (b)(d) | | | | 17,500 | | | | 17,500 |
| Series TOC 06 E, 3.21% (Liquidity Facility Goldman Sachs | | | | | | | | |
| Group, Inc.) (b)(d) | | | | 13,750 | | | | 13,750 |
| Golden West Schools Fing. Auth. Participating VRDN: | | | | | | | | |
| Series CDCM 05 21, 3.22% (Liquidity Facility CDC Fin.-CDC | | | | | | | | |
| IXIS) (b)(d) | | | | 10,085 | | | | 10,085 |
| Series DB 164, 3.22% (Liquidity Facility Deutsche Bank | | | | | | | | |
| AG) (b)(d) | | | | 9,975 | | | | 9,975 |
| Series PT 2985, 3.22% (Liquidity Facility Dexia Cr. Local de | | | | | | | | |
| France) (b)(d) | | | | 5,765 | | | | 5,765 |
| Goleta Wtr. District Rev. Ctfs. of Prtn. Participating VRDN | | | | | | | | |
| Series ROC II R2050, 3.21% (Liquidity Facility Citigroup | | | | | | | | |
| Global Markets Hldgs., Inc.) (b)(d) | | | | 3,480 | | | | 3,480 |
| Hacienda Puente Unified School District Participating VRDN | | | | | | | | |
| Series PT 2877, 3.22% (Liquidity Facility Dexia Cr. Local de | | | | | | | | |
| France) (b)(d) | | | | 8,830 | | | | 8,830 |
| La Quinta Fing. Auth. Local Agcy. Rev. Participating VRDN | | | | | | | | |
| Series ROC II R412, 3.21% (Liquidity Facility Citibank | | | | | | | | |
| NA) (b)(d) | | | | 5,580 | | | | 5,580 |
| Lassen Muni. Util. District Rev. Series 1996 A, 3.23% (FSA | | | | | | | | |
| Insured), VRDN (b)(c) | | | | 3,125 | | | | 3,125 |
| Long Beach Unified School District Participating VRDN ROC II | | | | | | | | |
| ® 4560, 3.21% (Liquidity Facility Citigroup Global Markets | | | | | | | | |
| Hldgs., Inc.) (b)(d) | | | | 7,005 | | | | 7,005 |
| Long Beach Hbr. Rev. Participating VRDN: | | | | | | | | |
| Series MS 00 418, 3.22% (Liquidity Facility Morgan | | | | | | | | |
| Stanley) (b)(c)(d) | | | | 18,190 | | | | 18,190 |
| Series MS 01 786X, 3.22% (Liquidity Facility Morgan | | | | | | | | |
| Stanley) (b)(c)(d) | | | | 5,570 | | | | 5,570 |
| Series MT 140, 3.23% (Liquidity Facility BNP Paribas | | | | | | | | |
| SA) (b)(c)(d) | | | | 3,330 | | | | 3,330 |
| |
| See accompanying notes which are an integral part of the financial statements. | | | | |
| |
| 35 | | | | | | Annual Report |
| Fidelity California Municipal Money Market Fund | | | | |
| Investments continued | | | | | | | | | | |
| |
| Municipal Securities continued | | | | | | | | |
| | | | | Principal | | Value (Note 1) |
| | | | | Amount (000s) | | (000s) |
| California – continued | | | | | | | | | | |
| Long Beach Hbr. Rev. Participating VRDN: – continued | | | | | | | | |
| Series PT 2579, 3.23% (Liquidity Facility Merrill Lynch & Co., | | | | | | |
| Inc.) (b)(c)(d) | | | | | | $ 3,170 | | | | $ 3,170 |
| Series PT 2580, 3.23% (Liquidity Facility Dexia Cr. Local de | | | | | | |
| France) (b)(c)(d) | | | | | | 5,000 | | | | 5,000 |
| Series PT 2708, 3.23% (Liquidity Facility Dexia Cr. Local de | | | | | | |
| France) (b)(c)(d) | | | | | | 5,760 | | | | 5,760 |
| Series PT 2756, 3.23% (Liquidity Facility Merrill Lynch & Co., | | | | | | |
| Inc.) (b)(c)(d) | | | | | | 2,565 | | | | 2,565 |
| Series PT 2936, 3.23% (Liquidity Facility Merrill Lynch & Co., | | | | | | |
| Inc.) (b)(c)(d) | | | | | | 5,255 | | | | 5,255 |
| Series Putters 1106, 3.23% (Liquidity Facility JPMorgan | | | | | | | | |
| Chase & Co.) (b)(c)(d) | | | | | | 2,995 | | | | 2,995 |
| Series Putters 730, 3.23% (Liquidity Facility JPMorgan Chase | | | | | | |
| & Co.) (b)(c)(d) | | | | | | 1,795 | | | | 1,795 |
| Series SG 147, 3.23% (Liquidity Facility Societe | | | | | | | | |
| Generale) (b)(c)(d) | | | | | | 9,890 | | | | 9,890 |
| Series Stars 84, 3.23% (Liquidity Facility BNP Paribas | | | | | | | | |
| SA) (b)(c)(d) | | | | | | 10,190 | | | | 10,190 |
| Los Angeles Cmnty. Redev. Agcy. Multi-family Hsg. Rev. | | | | | | | | |
| (Metropolitan Lofts Apts. Proj.) Series 2002 A, 3.27%, LOC | | | | | | | | |
| Bank of America NA, VRDN (b)(c) | | | | | | 17,500 | | | | 17,500 |
| Los Angeles County Metropolitan Trans. Auth. Rev. | | | | | | | | |
| Participating VRDN Series SGB 1, 3.21% (Liquidity Facility | | | | | | | | |
| Societe Generale) (b)(d) | | | | | | 12,575 | | | | 12,575 |
| Los Angeles County Metropolitan Trans. Auth. Sales Tax Rev. | | | | | | | | |
| Participating VRDN: | | | | | | | | | | |
| Series EGL 04 16, 3.21% (Liquidity Facility Citibank | | | | | | | | |
| NA) (b)(d) | | | | | | 8,900 | | | | 8,900 |
| Series EGL 04 46 Class A, 3.21% (Liquidity Facility Citibank | | | | | | |
| NA) (b)(d) | | | | | | 9,700 | | | | 9,700 |
| Los Angeles County Pub. Works Fing. Auth. Lease Rev. | | | | | | | | |
| Participating VRDN Series Merlots 00 JJJ, 3.22% (Liquidity | | | | | | | | |
| Facility Wachovia Bank NA) (b)(d) | | | | | | 16,000 | | | | 16,000 |
| Los Angeles Dept. Arpts. Rev. Participating VRDN Series SG | | | | | | | | |
| 61, 3.23% (Liquidity Facility Societe Generale) (b)(c)(d) | | | | 13,055 | | | | 13,055 |
| Los Angeles Dept. of Wtr. & Pwr. Rev. Participating VRDN: | | | | | | | | |
| Series EGL 06 10, 3.21% (Liquidity Facility Citibank | | | | | | | | |
| NA) (b)(d) | | | | | | 13,000 | | | | 13,000 |
| Series EGL 7053026, 3.21% (Liquidity Facility Citibank | | | | | | | | |
| NA) (b)(d) | | | | | | 39,000 | | | | 39,000 |
| Series ROC II R4033, 3.21% (Liquidity Facility Citigroup | | | | | | | | |
| Global Markets Hldgs., Inc.) (b)(d) | | | | | | 10,360 | | | | 10,360 |
| |
| See accompanying notes which are an integral part of the financial statements. | | | | |
| |
| Annual Report | | 36 | | | | | | | | |
| Municipal Securities continued | | | | | | | | |
| | | Principal | | Value (Note 1) |
| | | Amount (000s) | | (000s) |
| California – continued | | | | | | | | |
| Los Angeles Dept. of Wtr. & Pwr. Rev. Participating VRDN: - | | | | | | | | |
| continued | | | | | | | | |
| Series ROC II R4510, 3.21% (Liquidity Facility Citigroup | | | | | | | | |
| Global Markets Hldgs., Inc.) (b)(d) | | | | $ 6,815 | | | | $ 6,815 |
| Los Angeles Dept. of Wtr. & Pwr. Wtrwks. Rev. Participating | | | | | | | | |
| VRDN: | | | | | | | | |
| Series EGL 06 34, 3.21% (Liquidity Facility Citibank | | | | | | | | |
| NA) (b)(d) | | | | 17,555 | | | | 17,555 |
| Series Merlots 99 L, 3.22% (Liquidity Facility Wachovia Bank | | | | | | | | |
| NA) (b)(d) | | | | 23,300 | | | | 23,300 |
| Series ROC II R516, 3.21% (Liquidity Facility Citibank | | | | | | | | |
| NA) (b)(d) | | | | 11,600 | | | | 11,600 |
| Los Angeles Gen. Oblig. Participating VRDN Series PT 2324, | | | | | | | | |
| 3.22% (Liquidity Facility Merrill Lynch & Co., Inc.) (b)(d) | | | | 3,000 | | | | 3,000 |
| Los Angeles Hbr. Dept. Rev.: | | | | | | | | |
| Participating VRDN: | | | | | | | | |
| Series MS 00 349, 3.22% (Liquidity Facility Morgan | | | | | | | | |
| Stanley) (b)(c)(d) | | | | 7,360 | | | | 7,360 |
| Series SG 59, 3.23% (Liquidity Facility Societe | | | | | | | | |
| Generale) (b)(c)(d) | | | | 13,675 | | | | 13,675 |
| Series 2002 B: | | | | | | | | |
| 3.15% 3/13/06, CP (c) | | | | 19,943 | | | | 19,943 |
| 3.15% 3/14/06, CP (c) | | | | 20,172 | | | | 20,172 |
| 3.2% 3/15/06, CP (c) | | | | 7,465 | | | | 7,465 |
| Los Angeles Multi-family Hsg. Rev. (Colonia Corona Apts. | | | | | | | | |
| Proj.) Series D, 3.27%, LOC Citibank NA, VRDN (b)(c) | | | | 9,767 | | | | 9,767 |
| Los Angeles Single Family Mortgage Rev. Series 2004 A: | | | | | | | | |
| 3.2% (Liquidity Facility State Street Bank & Trust Co., Boston), | | | | | | | | |
| VRDN (b)(c) | | | | 17,065 | | | | 17,065 |
| 3.2% (Liquidity Facility State Street Bank & Trust Co., Boston), | | | | | | | | |
| VRDN (b)(c) | | | | 12,935 | | | | 12,935 |
| Los Angeles Unified School District Participating VRDN: | | | | | | | | |
| Series EGL 03 43, 3.21% (Liquidity Facility Citibank NA, | | | | | | | | |
| New York) (b)(d) | | | | 4,900 | | | | 4,900 |
| Series EGL 03 49, 3.21% (Liquidity Facility Citibank NA, | | | | | | | | |
| New York) (b)(d) | | | | 4,800 | | | | 4,800 |
| Series Merlots 03 B37, 3.22% (Liquidity Facility Wachovia | | | | | | | | |
| Bank NA) (b)(d) | | | | 5,480 | | | | 5,480 |
| Series PA 1116, 3.22% (Liquidity Facility Merrill Lynch & | | | | | | | | |
| Co., Inc.) (b)(d) | | | | 3,845 | | | | 3,845 |
| Series PA 792R, 3.22% (Liquidity Facility Merrill Lynch & | | | | | | | | |
| Co., Inc.) (b)(d) | | | | 8,945 | | | | 8,945 |
See accompanying notes which are an integral part of the financial statements.
37 Annual Report
| Fidelity California Municipal Money Market Fund | | | | |
| Investments continued | | | | | | | | | | |
| |
| Municipal Securities continued | | | | | | | | |
| | | | | Principal | | Value (Note 1) |
| | | | | Amount (000s) | | (000s) |
| California – continued | | | | | | | | | | |
| Los Angeles Unified School District Participating VRDN: - | | | | | | | | |
| continued | | | | | | | | | | |
| Series Putters 488, 3.21% (Liquidity Facility JPMorgan Chase | | | | | | | | |
| Bank) (b)(d) | | | | | | $ 28,180 | | | | $ 28,180 |
| Series Putters 998, 3.21% (Liquidity Facility JPMorgan Chase | | | | | | | | |
| Bank) (b)(d) | | | | | | 14,565 | | | | 14,565 |
| Series ROC II R24, 3.21% (Liquidity Facility Citibank | | | | | | | | |
| NA) (b)(d) | | | | | | 6,495 | | | | 6,495 |
| Series ROC II R25, 3.21% (Liquidity Facility Citibank | | | | | | | | |
| NA) (b)(d) | | | | | | 6,665 | | | | 6,665 |
| Series SG 162, 3.22% (Liquidity Facility Societe | | | | | | | | |
| Generale) (b)(d) | | | | | | 25,000 | | | | 25,000 |
| Series Solar 06 18, 3.22% (Liquidity Facility U.S. Bank NA, | | | | | | | | |
| Minnesota) (b)(d) | | | | | | 5,270 | | | | 5,270 |
| Los Angeles Wastewtr. Sys. Rev. Participating VRDN: | | | | | | | | |
| Series EGL 7053003 Class A, 3.21% (Liquidity Facility | | | �� | | | | | |
| Citibank NA) (b)(d) | | | | | | 10,000 | | | | 10,000 |
| Series ROC II R4034, 3.21% (Liquidity Facility Citigroup | | | | | | | | |
| Global Markets Hldgs., Inc.) (b)(d) | | | | | | 8,660 | | | | 8,660 |
| Series TOC 05 TT, 3.21% (Liquidity Facility Goldman Sachs | | | | | | | | |
| Group, Inc.) (b)(d) | | | | | | 30,665 | | | | 30,665 |
| M-S-R Pub. Pwr. Agcy. San Juan Proj. Rev. Participating VRDN | | | | | | | | |
| ROC II R335, 3.21% (Liquidity Facility Citibank NA) (b)(d) | | | | 4,145 | | | | 4,145 |
| Manteca Redev. Agcy. Tax Allocation Rev. Participating VRDN | | | | | | | | |
| Series ROC II R508, 3.21% (Liquidity Facility Citibank | | | | | | | | |
| NA) (b)(d) | | | | | | 3,000 | | | | 3,000 |
| Metropolitan Wtr. District Southern California Wtrwks. Rev. | | | | | | | | |
| Participating VRDN: | | | | | | | | | | |
| Series FRRI 00 A6, 3.48% (Liquidity Facility Bayerische | | | | | | | | |
| Hypo-und Vereinsbank AG) (b)(d) | | | | | | 5,300 | | | | 5,300 |
| Series Merlots 99 O, 3.22% (Liquidity Facility Wachovia | | | | | | | | |
| Bank NA) (b)(d) | | | | | | 9,500 | | | | 9,500 |
| Milpitas Redev. Agcy. Participating VRDN: | | | | | | | | |
| Series ROC II R2057, 3.21% (Liquidity Facility Citigroup | | | | | | | | |
| Global Markets Hldgs., Inc.) (b)(d) | | | | | | 9,025 | | | | 9,025 |
| Series ROC II R2145, 3.21% (Liquidity Facility Citigroup | | | | | | | | |
| Global Markets Hldgs., Inc.) (b)(d) | | | | | | 8,615 | | | | 8,615 |
| Series ROC II R4538, 3.21% (Liquidity Facility Citigroup | | | | | | | | |
| Global Markets Hldgs., Inc.) (b)(d) | | | | | | 8,210 | | | | 8,210 |
| Series ROC II R4557, 3.21% (Liquidity Facility Citigroup | | | | | | | | |
| Global Markets Hldgs., Inc.) (b)(d) | | | | | | 6,305 | | | | 6,305 |
| |
| |
| |
| See accompanying notes which are an integral part of the financial statements. | | | | |
| |
| Annual Report | | 38 | | | | | | | | |
| Municipal Securities continued | | | | | | | | |
| | | Principal | | Value (Note 1) |
| | | Amount (000s) | | (000s) |
| California – continued | | | | | | | | |
| Milpitas Unified School District Participating VRDN Series | | | | | | | | |
| Putters 615, 3.21% (Liquidity Facility JPMorgan Chase & | | | | | | | | |
| Co.) (b)(d) | | | | $ 8,735 | | | | $ 8,735 |
| North Orange County Cmnty. College District Rev. | | | | | | | | |
| Participating VRDN Series PZ 68, 3.24% (Liquidity Facility | | | | | | | | |
| Merrill Lynch & Co., Inc.) (b)(d) | | | | 5,220 | | | | 5,220 |
| Northern California Transmission Auth. Rev. Series B, 3.26% | | | | | | | | |
| 4/5/06, LOC WestLB AG, CP | | | | 5,000 | | | | 5,000 |
| Norwalk– Mirada Unified School District Participating VRDN | | | | | | | | |
| Series SG 169, 3.22% (Liquidity Facility Societe | | | | | | | | |
| Generale) (b)(d) | | | | 8,000 | | | | 8,000 |
| Oakland Gen. Oblig. Participating VRDN Series Merlots 00 A, | | | | | | | | |
| 3.22% (Liquidity Facility Wachovia Bank NA) (b)(d) | | | | 3,000 | | | | 3,000 |
| Oakland Swr. Rev. Participating VRDN Series Putters 631, | | | | | | | | |
| 3.21% (Liquidity Facility JPMorgan Chase Bank) (b)(d) | | | | 2,440 | | | | 2,440 |
| Paramount Hsg. Auth. Multi-family Rev. (Century Place Apts. | | | | | | | | |
| Proj.) Series 1999 A, 3.25%, LOC Fannie Mae, VRDN (b)(c) | | | | 21,000 | | | | 21,000 |
| Port of Oakland Gen. Oblig. Participating VRDN: | | | | | | | | |
| Series Merlots 00 JJ, 3.27% (Liquidity Facility Wachovia | | | | | | | | |
| Bank NA) (b)(c)(d) | | | | 29,680 | | | | 29,680 |
| Series MS 1192X, 3.22% (Liquidity Facility Morgan | | | | | | | | |
| Stanley) (b)(c)(d) | | | | 13,000 | | | | 13,000 |
| Series PA 1053, 3.23% (Liquidity Facility Merrill Lynch & | | | | | | | | |
| Co., Inc.) (b)(c)(d) | | | | 15,070 | | | | 15,070 |
| Series PT 2688, 3.23% (Liquidity Facility Merrill Lynch & Co., | | | | | | | | |
| Inc.) (b)(c)(d) | | | | 9,900 | | | | 9,900 |
| Series PT 2755, 3.23% (Liquidity Facility Merrill Lynch & Co., | | | | | | | | |
| Inc.) (b)(c)(d) | | | | 2,660 | | | | 2,660 |
| Series Putters 684, 3.23% (Liquidity Facility JPMorgan Chase | | | | | | | | |
| & Co.) (b)(c)(d) | | | | 2,785 | | | | 2,785 |
| Series Putters 863, 3.23% (Liquidity Facility JPMorgan Chase | | | | | | | | |
| & Co.) (b)(c)(d) | | | | 2,635 | | | | 2,635 |
| Series Putters 889, 3.23% (Liquidity Facility JPMorgan Chase | | | | | | | | |
| Bank) (b)(c)(d) | | | | 4,665 | | | | 4,665 |
| Series RobIns 5, 3.2% (Liquidity Facility Bank of New York, | | | | | | | | |
| New York) (b)(c)(d) | | | | 16,690 | | | | 16,690 |
| Port of Oakland Port Rev. Participating VRDN Series PA 1093, | | | | | | | | |
| 3.23% (Liquidity Facility Merrill Lynch & Co., Inc.) (b)(c)(d) | | | | 7,975 | | | | 7,975 |
| Puttable Floating Option Tax Receipts Participating VRDN: | | | | | | | | |
| Series PZP 2, 3.33% (Liquidity Facility Merrill Lynch & Co., | | | | | | | | |
| Inc.) (b)(d) | | | | 7,475 | | | | 7,475 |
| Series PZP 8, 3.28% (Liquidity Facility Merrill Lynch & Co., | | | | | | | | |
| Inc.) (b)(d) | | | | 4,475 | | | | 4,475 |
See accompanying notes which are an integral part of the financial statements.
39 Annual Report
| Fidelity California Municipal Money Market Fund | | | | |
| Investments continued | | | | | | | | | | |
| |
| Municipal Securities continued | | | | | | | | |
| | | | | Principal | | Value (Note 1) |
| | | | | Amount (000s) | | (000s) |
| California – continued | | | | | | | | | | |
| Puttable Floating Option Tax Receipts Participating VRDN: - | | | | | | | | |
| continued | | | | | | | | | | |
| Series PZP 9, 3.28% (Liquidity Facility Merrill Lynch & Co., | | | | | | | | |
| Inc.) (b)(d) | | | | | | $ 12,100 | | | | $ 12,100 |
| Rancho Santiago Cmnty. College District Participating VRDN: | | | | | | | | |
| Series Floaters 05 23, 3.21% (Liquidity Facility Landesbank | | | | | | | | |
| Hessen-Thuringen) (b)(d) | | | | | | 10,555 | | | | 10,555 |
| Series ROC II R2017, 3.21% (Liquidity Facility Citigroup | | | | | | | | |
| Global Markets Hldgs., Inc.) (b)(d) | | | | | | 5,240 | | | | 5,240 |
| Series ROC II R2181, 3.21% (Liquidity Facility Citigroup | | | | | | | | |
| Global Markets Hldgs., Inc.) (b)(d) | | | | | | 2,810 | | | | 2,810 |
| Riverside County Gen. Oblig. Series 2005 B1, 3.12% 4/6/06, | | | | | | | | |
| LOC WestLB AG, CP | | | | | | 12,700 | | | | 12,700 |
| Riverside County Single Family Rev. Participating VRDN Series | | | | | | | | |
| PT 2351, 3.22% (Liquidity Facility Dexia Cr. Local de | | | | | | | | |
| France) (b)(c)(d) | | | | | | 7,195 | | | | 7,195 |
| Riverside Indl. Dev. Auth. Indl. Dev. Rev. (Sabert Corp. Proj.) | | | | | | | | |
| 3.28%, LOC PNC Bank NA, Pittsburgh, VRDN (b)(c) | | | | 4,830 | | | | 4,830 |
| Sacramento City Fing. Auth. Rev. Participating VRDN: | | | | | | | | |
| Series MSTC 05 246, 3.29% (Liquidity Facility Bear Stearns | | | | | | | | |
| Companies, Inc.) (b)(d) | | | | | | 7,320 | | | | 7,320 |
| Series TOC 06 Z3, 3.24% (Liquidity Facility Goldman Sachs | | | | | | | | |
| Group, Inc.) (b)(d) | | | | | | 5,125 | | | | 5,125 |
| Sacramento County Hsg. Auth. Multi-family Hsg. Rev.: | | | | | | | | |
| (Deer Park Apts. Proj.) Issue A, 3.24%, LOC Fannie Mae, | | | | | | | | |
| VRDN (b)(c) | | | | | | 13,200 | | | | 13,200 |
| (Natomas Park Apts. Proj.) Series Issue B, 3.24%, LOC | | | | | | | | |
| Fannie Mae, VRDN (b)(c) | | | | | | 13,550 | | | | 13,550 |
| Sacramento County Sanitation District Fing. Auth. Rev. | | | | | | | | |
| Participating VRDN Series ROC II R504, 3.21% (Liquidity | | | | | | | | |
| Facility Citibank NA) (b)(d) | | | | | | 3,230 | | | | 3,230 |
| Sacramento County Single Family Mtg. Rev. Participating | | | | | | | | |
| VRDN: | | | | | | | | | | |
| Series PT 2326, 3.22% (Liquidity Facility Dexia Cr. Local de | | | | | | | | |
| France) (b)(c)(d) | | | | | | 16,445 | | | | 16,445 |
| Series PT 2327, 3.22% (Liquidity Facility Dexia Cr. Local de | | | | | | | | |
| France) (b)(c)(d) | | | | | | 8,970 | | | | 8,970 |
| Series PT 2331, 3.22% (Liquidity Facility Dexia Cr. Local de | | | | | | | | |
| France) (b)(c)(d) | | | | | | 6,770 | | | | 6,770 |
| Sacramento Hsg. Auth. Multi-family (Phoenix Park II Apts. | | | | | | | | |
| Proj.) 3.27%, LOC Citibank NA, VRDN (b)(c) | | | | 20,000 | | | | 20,000 |
| Sacramento Muni. Util. District Elec. Rev. Series I, 3.08% | | | | | | | | |
| 4/18/06, LOC Bayerische Landesbank Girozentrale, LOC | | | | | | | | |
| JPMorgan Chase Bank, CP | | | | | | 33,300 | | | | 33,300 |
See accompanying notes which are an integral part of the financial statements. | | | | |
| |
| Annual Report | | 40 | | | | | | | | |
| Municipal Securities continued | | | | | | | | |
| | | Principal | | Value (Note 1) |
| | | Amount (000s) | | (000s) |
| California – continued | | | | | | | | |
| San Bernardino County Ctfs. of Prtn. Participating VRDN | | | | | | | | |
| Series ROC II R 2139, 3.21% (Liquidity Facility Citigroup | | | | | | | | |
| Global Markets Hldgs., Inc.) (b)(d) | | | | $ 8,365 | | | | $ 8,365 |
| San Diego Cmnty. College District Participating VRDN Series | | | | | | | | |
| ROC II R7016, 3.21% (Liquidity Facility Citibank NA) (b)(d) . | | | | 5,430 | | | | 5,430 |
| San Diego County Reg’l. Arpt. Auth. Arpt. Rev. Participating | | | | | | | | |
| VRDN: | | | | | | | | |
| Series DB 181, 3.23% (Liquidity Facility Deutsche Bank | | | | | | | | |
| AG) (b)(c)(d) | | | | 5,950 | | | | 5,950 |
| Series PT 3251, 3.23% (Liquidity Facility Merrill Lynch & Co., | | | | | | | | |
| Inc.) (b)(c)(d) | | | | 5,910 | | | | 5,910 |
| San Diego Unified School District Participating VRDN Series | | | | | | | | |
| ROC II R2112 3.21% (Liquidity Facility Citigroup Global | | | | | | | | |
| Markets Hldgs., Inc.) (b)(d) | | | | 4,915 | | | | 4,915 |
| San Francisco Bldg. Auth. Lease Rev. Participating VRDN | | | | | | | | |
| Series Putters 1200, 3.21% (Liquidity Facility Dresdner Bank | | | | | | | | |
| AG) (b)(d) | | | | 11,780 | | | | 11,780 |
| San Francisco City & County Arpts. Commission Int’l. Arpt. | | | | | | | | |
| Rev.: | | | | | | | | |
| Participating VRDN: | | | | | | | | |
| Series PT 899, 3.26% (Liquidity Facility Merrill Lynch & | | | | | | | | |
| Co., Inc.) (b)(c)(d) | | | | 4,765 | | | | 4,765 |
| Series Stars 125, 3.26% (Liquidity Facility BNP Paribas | | | | | | | | |
| SA) (b)(c)(d) | | | | 5,215 | | | | 5,215 |
| Series 33D, 3.2% (XL Cap. Assurance, Inc. Insured), | | | | | | | | |
| VRDN (b)(c) | | | | 14,100 | | | | 14,100 |
| San Francisco City & County Pub. Util. Commission Wtr. Rev. | | | | | | | | |
| 3.13% 4/13/06, LOC Bank of America NA, CP | | | | 5,000 | | | | 5,000 |
| San Francisco City & County Redev. Agcy. Multi-family Hsg. | | | | | | | | |
| Rev. (Mission Creek Cmnty. Proj.) Series B, 3.3%, LOC | | | | | | | | |
| Citibank NA, New York, VRDN (b)(c) | | | | 21,700 | | | | 21,700 |
| San Francisco City & County Unified School District | | | | | | | | |
| Participating VRDN Series Putters 549, 3.21% (Liquidity | | | | | | | | |
| Facility JPMorgan Chase Bank) (b)(d) | | | | 5,370 | | | | 5,370 |
| San Francisco County Trans. Auth. Series 2004 A, 3.1% | | | | | | | | |
| 3/8/06 (Liquidity Facility Landesbank Baden-Wuert), CP | | | | 15,800 | | | | 15,800 |
| San Jose Arpt. Rev. Participating VRDN Series ROC II R2004, | | | | | | | | |
| 3.21% (Liquidity Facility Citigroup Global Markets Hldgs., | | | | | | | | |
| Inc.) (b)(d) | | | | 2,560 | | | | 2,560 |
| San Jose Fin. Auth. Rev. 3.09% 4/4/06, LOC State Street Bank & | | | | | | | | |
| Trust Co., Boston, LOC California Teachers Retirement Sys., CP | | | | 9,345 | | | | 9,345 |
| San Jose Multi family Hsg. Rev.: | | | | | | | | |
| (Alamaden Family Apts. Proj.) Series D, 3.24%, LOC Fannie | | | | | | | | |
| Mae, VRDN (b)(c) | | | | 26,300 | | | | 26,300 |
See accompanying notes which are an integral part of the financial statements.
41 Annual Report
| Fidelity California Municipal Money Market Fund | | | | |
| Investments continued | | | | | | | | | | |
| |
| Municipal Securities continued | | | | | | | | |
| | | | | Principal | | Value (Note 1) |
| | | | | Amount (000s) | | (000s) |
| California – continued | | | | | | | | | | |
| San Jose Multi-family Hsg. Rev.: – continued | | | | | | | | |
| (Kennedy Apt. Homes Proj.) Series K, 3.24%, LOC Fannie | | | | | | | | |
| Mae, VRDN (b)(c) | | | | | | $ 9,775 | | | | $ 9,775 |
| San Jose Redev. Agcy. Tax Allocation Participating VRDN | | | | | | | | |
| Series Putters 1085, 3.21% (Liquidity Facility JPMorgan | | | | | | | | |
| Chase Bank) (b)(d) | | | | | | 7,095 | | | | 7,095 |
| San Mateo County Trans. District Sales Tax Rev. Participating | | | | | | | | |
| VRDN Series TOC 05 DD, 3.21% (Liquidity Facility Goldman | | | | | | | | |
| Sachs Group, Inc.) (b)(d) | | | | | | 7,000 | | | | 7,000 |
| Santa Clara County Hsg. Auth. Multi-family Hsg. Rev. | | | | | | | | |
| (Timberwood Apts. Proj.) Series B, 3.28%, LOC Union Bank | | | | | | | | |
| of California, VRDN (b)(c) | | | | | | 9,215 | | | | 9,215 |
| Santa Clara Valley Wtr. District Ctfs. of Prtn. Participating | | | | | | | | |
| VRDN Series Merlots 00 MM, 3.22% (Liquidity Facility | | | | | | | | |
| Wachovia Bank NA) (b)(d) | | | | | | 14,530 | | | | 14,530 |
| Santa Cruz Redev. Agcy. Multi-family Rev.: | | | | | | | | |
| (1010 Pacific Ave. Apts. Proj.) Series B, 3.24%, LOC Fannie | | | | | | | | |
| Mae, VRDN (b)(c) | | | | | | 21,650 | | | | 21,650 |
| (Shaffer Road Apts. Proj.) Series A, 3.24%, LOC Fannie | | | | | | | | |
| Mae, VRDN (b)(c) | | | | | | 19,925 | | | | 19,925 |
| Santa Rosa Multi-family Hsg. Rev. (Quail Run Apts./Santa | | | | | | | | |
| Rosa Hsg. Partners Proj.) Series 1997 A, 3.23%, LOC U.S. | | | | | | | | |
| Bank NA, Minnesota, VRDN (b)(c) | | | | | | 1,950 | | | | 1,950 |
| Sequoia Union High School District Bonds Series AAB 03 2, | | | | | | | | |
| 3.2%, tender 3/7/06 (Liquidity Facility ABN-AMRO Bank | | | | | | | | |
| NV) (b)(d) | | | | | | 12,100 | | | | 12,100 |
| Simi Valley Multi-family Hsg. Rev. (Parker Ranch Proj.) | | | | | | | | |
| Series A, 3.24%, LOC Fannie Mae, VRDN (b)(c) | | | | 15,500 | | | | 15,500 |
| South Orange County Pub. Fing. Auth. Spl. Tax Rev. | | | | | | | | |
| Participating VRDN Series Putters 470, 3.21% (Liquidity | | | | | | | | |
| Facility JPMorgan Chase Bank) (b)(d) | | | | | | 5,220 | | | | 5,220 |
| Southern California Home Fing. Auth. Single Family Rev. | | | | | | | | |
| Participating VRDN Series MT 90, 3.25% (Liquidity Facility | | | | | | | | |
| Landesbank Hessen-Thuringen) (b)(c)(d) | | | | | | 116,570 | | | | 116,571 |
| Southern California Pub. Pwr. Auth. Rev. Participating VRDN | | | | | | | | |
| Series Merlots 02 A62, 3.22% (Liquidity Facility Wachovia | | | | | | | | |
| Bank NA) (b)(d) | | | | | | 34,230 | | | | 34,230 |
| Sunnyvale School District Participating VRDN Series PT 2710, | | | | | | | | |
| 3.22% (Liquidity Facility Merrill Lynch & Co., Inc.) (b)(d) | | | | 5,770 | | | | 5,770 |
| Univ. of California Revs. Participating VRDN: | | | | | | | | |
| Series EGL 7050006, 3.21% (Liquidity Facility Citibank | | | | | | | | |
| NA) (b)(d) | | | | | | 2,445 | | | | 2,445 |
| Series EGL 7050084, 3.21% (Liquidity Facility Citibank | | | | | | | | |
| NA) (b)(d) | | | | | | 16,500 | | | | 16,500 |
| |
| See accompanying notes which are an integral part of the financial statements. | | | | |
| |
| Annual Report | | 42 | | | | | | | | |
| Municipal Securities continued | | | | | | | | |
| | | Principal | | Value (Note 1) |
| | | Amount (000s) | | (000s) |
| California – continued | | | | | | | | |
| Univ. of California Revs. Participating VRDN: – continued | | | | | | | | |
| Series Merlots 97 G, 3.22% (Liquidity Facility Wachovia | | | | | | | | |
| Bank NA) (b)(d) | | | | $ 13,430 | | | | $ 13,430 |
| Series PT 872, 3.22% (Liquidity Facility Landesbank | | | | | | | | |
| Hessen-Thuringen) (b)(d) | | | | 8,265 | | | | 8,265 |
| Series Putters 1201, 3.21% (Liquidity Facility JPMorgan | | | | | | | | |
| Chase Bank) (b)(d) | | | | 5,240 | | | | 5,240 |
| Series TOC 05 FF, 3.21% (Liquidity Facility Goldman Sachs | | | | | | | | |
| Group, Inc.) (b)(d) | | | | 12,145 | | | | 12,145 |
| Walnut Energy Ctr. Auth. Rev. Participating VRDN Series | | | | | | | | |
| Putters 583, 3.21% (Liquidity Facility JPMorgan Chase & | | | | | | | | |
| Co.) (b)(d) | | | | 5,195 | | | | 5,195 |
| William S. Hart Union High School District Participating VRDN | | | | | | | | |
| Series SG 171, 3.22% (Liquidity Facility Societe Generale) (b)(d) | | | | 8,600 | | | | 8,600 |
| Yucaipa Valley Wtr. District Wtr. Sys. Rev. Participating VRDN | | | | | | | | |
| Series ROC II R 2130, 3.21% (Liquidity Facility Citigroup | | | | | | | | |
| Global Markets Hldgs., Inc.) (b)(d) | | | | 3,515 | | | | 3,515 |
| | | | | | | | | 3,764,131 |
| Puerto Rico 1.6% | | | | | | | | |
| JPMorgan Chase Bank NA as Enhancement Custodian Bonds | | | | | | | | |
| 3.25% 7/24/06, LOC Societe Generale (a) | | | | 24,400 | | | | 24,400 |
| Puerto Rico Commonwealth Gen. Oblig. TRAN 4.5% | | | | | | | | |
| 7/28/06, LOC Bank of Nova Scotia, New York Agcy., LOC | | | | | | | | |
| BNP Paribas SA | | | | 27,700 | | | | 27,841 |
| Puerto Rico Commonwealth Hwy. & Trans. Auth. Trans. Rev. | | | | | | | | |
| Participating VRDN Series MACN 06 H, 3.18% (Liquidity | | | | | | | | |
| Facility Bank of America NA) (b)(d) | | | | 13,475 | | | | 13,475 |
| | | | | | | | | 65,716 |
| |
| TOTAL INVESTMENT PORTFOLIO – 93.5% | | | | | | | | |
| (Cost $3,829,847) | | | | | | | | 3,829,847 |
| |
| NET OTHER ASSETS – 6.5% | | | | | | | | 265,960 |
| NET ASSETS 100% | | | | | | | | $ 4,095,807 |
| Security Type Abbreviations |
| CP | | — | | COMMERCIAL PAPER |
| RAN | | — | | REVENUE ANTICIPATION NOTE |
| TRAN | | — | | TAX AND REVENUE |
| | | | ANTICIPATION NOTE |
| VRDN | | — | | VARIABLE RATE DEMAND NOTE |
See accompanying notes which are an integral part of the financial statements.
43 Annual Report
Fidelity California Municipal Money Market Fund
Investments continued
|
Legend
(a) Security exempt from registration under
Rule 144A of the Securities Act of 1933.
These securities may be resold in
transactions exempt from registration,
normally to qualified institutional buyers.
At the period end, the value of these
securities amounted to $24,400,000 or
0.6% of net assets.
|
(b) The coupon rate shown on floating or
adjustable rate securities represents the
rate at period end.
(c) Private activity obligations whose
interest is subject to the federal
alternative minimum tax for individuals.
(d) Provides evidence of ownership in one
or more underlying municipal bonds.
|
Affiliated Central Funds
Information regarding fiscal year to date income earned by the fund from the affiliated Central funds is as follows:
| Fund | | | | Income earned |
| | | | | (Amounts in thousands) |
| |
| Fidelity Municipal Cash Central Fund | | | | $ 26 |
Income Tax Information
At February 28, 2006, the fund had a capital loss carryforward of approximately $10,000 all of which will expire on February 28, 2013.
See accompanying notes which are an integral part of the financial statements.
Annual Report 44
| Fidelity California Municipal Money Market Fund | | | | |
| |
| Financial Statements | | | | | | | | |
| |
| Statement of Assets and Liabilities | | | | | | | | |
| Amounts in thousands (except per share amount) | | | | | | February 28, 2006 |
| |
| Assets | | | | | | | | |
| Investment in securities, at value | | | | | | | | |
| See accompanying schedule: | | | | | | | | |
| Unaffiliated issuers (cost $3,829,847) | | | | | | | | $ 3,829,847 |
| Cash | | | | | | | | 199,145 |
| Receivable for investments sold | | | | | | | | 40,982 |
| Receivable for fund shares sold | | | | | | | | 63,997 |
| Interest receivable | | | | | | | | 21,217 |
| Prepaid expenses | | | | | | | | 14 |
| Other receivables | | | | | | | | 977 |
| Total assets | | | | | | | | 4,156,179 |
| |
| Liabilities | | | | | | | | |
| Payable for fund shares redeemed | | | | $ 57,870 | | | | |
| Distributions payable | | | | 87 | | | | |
| Accrued management fee | | | | 1,241 | | | | |
| Other affiliated payables | | | | 942 | | | | |
| Other payables and accrued expenses | | | | 232 | | | | |
| Total liabilities | | | | | | | | 60,372 |
| |
| Net Assets | | | | | | | | $ 4,095,807 |
| Net Assets consist of: | | | | | | | | |
| Paid in capital | | | | | | | | $ 4,095,813 |
| Undistributed net investment income | | | | | | | | 84 |
| Accumulated undistributed net realized gain (loss) on | | | | | | | | |
| investments | | | | | | | | (90) |
| Net Assets, for 4,094,959 shares outstanding | | | | | | | | $ 4,095,807 |
| Net Asset Value, offering price and redemption price per | | | | | | | | |
| share ($4,095,807 ÷ 4,094,959 shares) | | | | | | | | $ 1.00 |
See accompanying notes which are an integral part of the financial statements.
45 Annual Report
| Fidelity California Municipal Money Market Fund | | |
| Financial Statements continued | | | | |
| |
| Statement of Operations | | | | | | |
| Amounts in thousands | | | | Year ended February 28, 2006 |
| |
| Investment Income | | | | | | |
| Interest | | | | | | $ 96,679 |
| Income from affiliated Central Funds | | | | | | 26 |
| Total income | | | | | | 96,705 |
| |
| Expenses | | | | | | |
| Management fee | | | | $ 13,934 | | |
| Transfer agent fees | | | | 4,918 | | |
| Accounting fees and expenses | | | | 318 | | |
| Independent trustees’ compensation | | | | 16 | | |
| Custodian fees and expenses | | | | 60 | | |
| Registration fees | | | | 106 | | |
| Audit | | | | 55 | | |
| Legal | | | | 14 | | |
| Miscellaneous | | | | 147 | | |
| Total expenses before reductions | | | | 19,568 | | |
| Expense reductions | | | | (4,143) | | 15,425 |
| |
| Net investment income | | | | | | 81,280 |
| Realized and Unrealized Gain (Loss) | | | | |
| Net realized gain (loss) on: | | | | | | |
| Investment securities: | | | | | | |
| Unaffiliated issuers | | | | | | 47 |
| Net increase in net assets resulting from operations | | | | $ 81,327 |
See accompanying notes which are an integral part of the financial statements.
| Statement of Changes in Net Assets | | | | | | | | | | |
| | | | | | | Year ended | | | | Year ended |
| | | | | | | February 28, | | | | February 28, |
| Amounts in thousands | | | | | | 2006 | | | | 2005 |
| Increase (Decrease) in Net Assets | | | | | | | | | | |
| Operations | | | | | | | | | | |
| Net investment income | | | | | | $ 81,280 | | | | $ 27,408 |
| Net realized gain (loss) | | | | | | 47 | | | | (125) |
| Net increase in net assets resulting | | | | | | | | | | |
| from operations | | | | | | 81,327 | | | | 27,283 |
| Distributions to shareholders from net investment income | | . | | | | (81,250) | | | | (27,442) |
| Share transactions at net asset value of $1.00 per share | | | | | | | | | | |
| Proceeds from sales of shares | | | | | | 15,764,573 | | | | 10,208,647 |
| Reinvestment of distributions | | | | | | 80,226 | | | | 27,189 |
| Cost of shares redeemed | | | | | | (15,222,801) | | | | (9,660,527) |
| Net increase (decrease) in net assets and shares | | | | | | | | | | |
| resulting from share transactions | | | | | | 621,998 | | | | 575,309 |
| Total increase (decrease) in net assets | | | | | | 622,075 | | | | 575,150 |
| |
| Net Assets | | | | | | | | | | |
| Beginning of period | | | | | | 3,473,732 | | | | 2,898,582 |
| End of period (including undistributed net investment | | | | | | | | | | |
| income of $84 and undistributed net investment | | | | | | | | | | |
| income of $54, respectively) | | | | | | $ 4,095,807 | | | | $ 3,473,732 |
See accompanying notes which are an integral part of the financial statements.
47 Annual Report
| Financial Highlights | | | | | | | | | | | | | | | | | | | | |
| |
| Years ended February 28, | | | | 2006 | | | | 2005 | | | | 2004C | | | | 2003 | | | | 2002 |
| Selected Per Share Data | | | | | | | | | | | | | | | | | | | | |
| Net asset value, | | | | | | | | | | | | | | | | | | | | |
| beginning of period | | | | $ 1.00 | | | | $ 1.00 | | | | $ 1.00 | | | | $ 1.00 | | | | $ 1.00 |
| Income from Investment | | | | | | | | | | | | | | | | | | | | |
| Operations | | | | | | | | | | | | | | | | | | | | |
| Net investment income | | | | 022 | | | | .009 | | | | .006 | | | | .010 | | | | .019 |
| Distributions from net investment | | | | | | | | | | | | | | | | | | | | |
| income | | | | (.022) | | | | (.009) | | | | (.006) | | | | (.010) | | | | (.019) |
| Net asset value, | | | | | | | | | | | | | | | | | | | | |
| end of period | | | | $ 1.00 | | | | $ 1.00 | | | | $ 1.00 | | | | $ 1.00 | | | | $ 1.00 |
| Total ReturnA | | | | 2.19% | | | | .87% | | | | .57% | | | | .99% | | | | 1.89% |
| Ratios to Average Net AssetsB | | | | | | | | | | | | | | | | | | | | |
| Expenses before reductions | | | | 52% | | | | .53% | | | | .52% | | | | .52% | | | | .52% |
| Expenses net of fee waivers, | | | | | | | | | | | | | | | | | | | | |
| if any | | | | 52% | | | | .53% | | | | .52% | | | | .52% | | | | .52% |
| Expenses net of all reductions | | | | 41% | | | | .50% | | | | .50% | | | | .49% | | | | .48% |
| Net investment income | | | | 2.18% | | | | .88% | | | | .56% | | | | .98% | | | | 1.86% |
| Supplemental Data | | | | | | | | | | | | | | | | | | | | |
| Net assets, end of period | | | | | | | | | | | | | | | | | | | | |
| (in millions) | | | | $ 4,096 | | | | $ 3,474 | | | | $ 2,899 | | | | $ 2,626 | | | | $ 2,239 |
A Total returns would have been lower had certain expenses not been reduced during the periods shown.
B Expense ratios reflect operating expenses of the fund. Expenses before reductions do not reflect amounts reimbursed by the investment adviser or
expense offset arrangements and do not represent the amount paid by the fund during periods when reimbursements or reductions occur.
Expenses net of fee waivers reflect expenses after reimbursement by the investment adviser but prior to reductions from expense offset
arrangements. Expenses net of all reductions represent the net expenses paid by the fund.
C For the year ended February 29.
|
See accompanying notes which are an integral part of the financial statements.
Notes to Financial Statements
For the period ended February 28, 2006
(Amounts in thousands except ratios)
|
1. Significant Accounting Policies.
Fidelity California AMT Tax Free Money Market Fund and Fidelity California Municipal Money Market Fund (the funds) are funds of Fidelity California Municipal Trust II (the trust). On July 21, 2005 the Board of Trustees approved a change in the name of Spartan California Municipal Money Market Fund to Fidelity California AMT Tax Free Money Market Fund effective August 15, 2005. The trust is registered under the Invest ment Company Act of 1940, as amended (the 1940 Act), as an open end management investment company organized as a Delaware statutory trust. Each fund is authorized to issue an unlimited number of shares. Each fund may be affected by economic and political developments in the state of California. Certain funds may invest in affiliated money market central funds (Money Market Central Funds) which are open end invest ment companies available to investment companies and other accounts managed by Fidelity Management & Research Company (FMR) and its affiliates. The financial statements have been prepared in conformity with accounting principles generally accepted in the United States of America, which require management to make certain estimates and assumptions at the date of the financial statements. The following summa rizes the significant accounting policies of the funds:
Security Valuation. Net asset value per share is calculated as of the close of business of the New York Stock Exchange, normally 4:00 p.m. Eastern time. As permitted by com pliance with certain conditions under Rule 2a 7 of the 1940 Act, securities are valued at amortized cost, which approximates value. Investments in open end mutual funds are valued at their closing net asset value each business day.
Investment Transactions and Income. Security transactions are accounted for as of trade date. Gains and losses on securities sold are determined on the basis of identified cost. Interest income is accrued as earned. Interest income includes coupon interest and amortization of premium and accretion of discount on debt securities.
Expenses. Most expenses of the trust can be directly attributed to a fund. Expenses which cannot be directly attributed are apportioned among each fund in the trust.
Income Tax Information and Distributions to Shareholders. Each year, each fund intends to qualify as a regulated investment company by distributing all of its taxable income and realized gains under Subchapter M of the Internal Revenue Code. As a result, no provision for income taxes is required in the accompanying financial statements.
Dividends are declared daily and paid monthly from net investment income. Distribu tions from realized gains, if any, are recorded on the ex dividend date. Income and capital gain distributions are determined in accordance with income tax regulations, which may differ from generally accepted accounting principles. In addition, certain funds will claim a portion of the payment made to redeeming shareholders as a distribu tion for income tax purposes.
49 Annual Report
| Notes to Financial Statements continued | | |
|
| (Amounts in thousands except ratios) | | | | |
|
| 1. Significant Accounting Policies continued | | |
| Income Tax Information and Distributions to Shareholders continued |
Capital accounts within the financial statements are adjusted for permanent book tax differences. These adjustments have no impact on net assets or the results of operations. Temporary book tax differences will reverse in a subsequent period.
Book tax differences are primarily due to deferred trustees compensation, and losses deferred due to excise tax regulations.
The funds purchase municipal securities whose interest, in the opinion of the issuer, is free from federal income tax. There is no assurance that the Internal Revenue Service (IRS) will agree with this opinion. In the event the IRS determines that the issuer does not comply with relevant tax requirements, interest payments from a security could become federally taxable, possibly retroactively to the date the security was issued.
The tax basis components of distributable earnings and the federal tax cost as of period end were as follows for each fund:
| | | Cost for Federal | | | | | | | | Net Unrealized |
| | | Income Tax | | | | Unrealized | | Unrealized | | Appreciation/ |
| | | Purposes | | | | Appreciation | | Depreciation | | (Depreciation) |
| Fidelity California AMT Tax Free | | | | | | | | | | | | | | |
| Money Market Fund | | | | $ 2,104,213 | | | | $ — | | $ — | | | | $ — |
| Fidelity California Municipal | | | | | | | | | | | | | | |
| Money Market Fund | | | | 3,829,847 | | | | — | | — | | | | — |
| |
| | | | | | | Undistributed | | Undistributed | | | | |
| | | | | | | Ordinary | | Long-term | | | | Capital Loss |
| | | | | | | Income | | Capital Gain | | | | Carryforward |
| Fidelity California AMT Tax Free Money | | | | | | | | | | |
| Market Fund | | | | | | | | $ 128 | | $ — | | | | $ — |
| Fidelity California Municipal Money | | | | | | | | | | | | |
| Market Fund | | | | | | | | 87 | | — | | | | (10) |
| |
| The tax character of distributions paid was as follows: | | | | | | |
| |
| February 28, 2006 | | | | Tax-exempt | | | | Ordinary | | Long-term | | | | |
| | | | | Income | | | | Income | | Capital Gains | | | | Total |
| Fidelity California AMT Tax Free | | | | | | | | | | | | | | |
| Money Market Fund | | | | $ 42,654 | | | | $ — | | $ — | | | | $ 42,654 |
| Fidelity California Municipal | | | | | | | | | | | | | | |
| Money Market Fund | | | | 81,250 | | | | — | | — | | | | 81,250 |
| |
| February 28, 2005 | | | | Tax-exempt | | | | Ordinary | | Long-term | | | | |
| | | | | Income | | | | Income | | Capital Gains | | | | Total |
| Fidelity California AMT Tax Free | | | | | | | | | | | | | | |
| Money Market Fund | | | | $ 14,068 | | | | $ — | | $ — | | | | $ 14,068 |
| Fidelity California Municipal | | | | | | | | | | | | | | |
| Money Market Fund | | | | 27,442 | | | | — | | — | | | | 27,442 |
| |
| |
| |
| Annual Report | | | | 50 | | | | | | | | |
Restricted Securities. Certain funds may invest in securities that are subject to legal or contractual restrictions on resale. These securities generally may be resold in transac tions exempt from registration or to the public if the securities are registered. Disposal of these securities may involve time consuming negotiations and expense, and prompt sale at an acceptable price may be difficult. Information regarding restricted securities is included at the end of each applicable fund’s Schedule of Investments.
3. Fees and Other Transactions with Affiliates.
Management Fee. FMR and its affiliates provide Fidelity California Municipal Money Market Fund with investment management related services for which the fund pays a monthly management fee. The management fee is the sum of an individual fund fee rate that is based on an annual rate of .25% of the fund’s average net assets and a group fee rate that averaged .12% during the period. The group fee rate is based upon the average net assets of all the mutual funds advised by FMR. The group fee rate decreases as assets under management increase and increases as assets under management decrease. For the period, the total annual management fee rate was .37% of the fund’s average net assets.
FMR and its affiliates provide Fidelity California AMT Tax Free Money Market Fund with investment management related services for which the fund pays a monthly manage ment fee that is based on an annual rate of .43% of the fund’s average net assets. FMR pays all other expenses, except the compensation of the independent Trustees and certain exceptions such as interest expense. The management fee paid to FMR by the fund is reduced by an amount equal to the fees and expenses paid by the fund to the independent Trustees.
Transfer Agent and Accounting Fees. Citibank, N.A. (Citibank) is the custodian, transfer agent and shareholder servicing agent for Fidelity California Municipal Money Market Fund. Citibank has entered into a sub arrangement with Fidelity Service Com pany, Inc. (FSC), an affiliate of FMR, under which FSC performs the activities associated with the fund’s transfer and shareholder servicing agent and accounting functions. The fund pays account fees and asset based fees that vary according to account size and type of account. FSC pays for typesetting, printing and mailing of shareholder reports, except proxy statements. The accounting fee is based on the level of average net assets for the month. For the period, the transfer agent fees were equivalent to an annual rate of .13% of average net assets.
Affiliated Central Funds. Certain funds may invest in Money Market Central Funds which seek preservation of capital and current income and are managed by Fidelity Investments Money Management, Inc. (FIMM) an affiliate of FMR. The Money Market Central Funds do not pay a management fee.
51 Annual Report
| Notes to Financial Statements continued |
| (Amounts in thousands except ratios) | | |
| |
| 4. Expense Reductions. | | |
FMR voluntarily agreed to reimburse funds to the extent annual operating expenses exceeded certain levels of average net assets as noted in the table below. Some expenses, for example interest expense, are excluded from this reimbursement.
The following funds were in reimbursement during the period:
| | | | | | |
| | | Expense | | Reimbursement |
| | | Limitations | | from adviser |
| Fidelity California AMT Tax Free Money Market Fund | | 35% | | | | $ 1,467 |
Through an arrangement with Fidelity California AMT Tax Free Money Market Fund’s custodian and transfer agent, $1,518 of credits realized as a result of uninvested cash balances were used to reduce the fund’s management fee.
In addition, through arrangements with Fidelity California Municipal Money Market Fund’s custodian and transfer agent, credits realized as a result of uninvested cash balances were used to reduce each applicable fund’s expenses. All of the applicable expense reductions are noted in the table below.
| | | | | Custody | | Transfer Agent | | Accounting |
| | | | | expense | | expense | | expense |
| | | | | reduction | | reduction | | reduction |
| Fidelity California Municipal Money | | | | | | | | | | |
| Market Fund | | | | $ 59 | | | | $ 3,973 | | $ 111 |
| |
| 5. Other. | | | | | | | | | | |
The funds’ organizational documents provide former and current trustees and officers with a limited indemnification against liabilities arising in connection with the perfor mance of their duties to the funds. In the normal course of business, the funds may also enter into contracts that provide general indemnifications. The funds’ maximum exposure under these arrangements is unknown as this would be dependent on future claims that may be made against the funds. The risk of material loss from such claims is considered remote.
Report of Independent Registered Public Accounting Firm
To the Trustees of Fidelity California Municipal Trust II and the Shareholders of Fidelity California AMT Tax Free Money Market Fund (formerly Spartan California Municipal Money Market Fund) and Fidelity California Municipal Money Market Fund:
In our opinion, the accompanying statements of assets and liabilities, including the schedules of investments, and the related statements of operations and of changes in net assets and the financial highlights present fairly, in all material respects, the financial position of Fidelity California AMT Tax Free Money Market Fund (formerly Spartan California Municipal Money Market Fund) and Fidelity California Municipal Money Market Fund (funds of Fidelity California Municipal Trust II) at February 28, 2006, and the results of their operations, the changes in their net assets and the financial highlights for the periods indicated, in conformity with accounting principles generally accepted in the United States of America. These financial statements and financial highlights (hereaf ter referred to as “financial statements”) are the responsibility of the Fidelity California Municipal Trust II’s management; our responsibility is to express an opinion on these financial statements based on our audits. We conducted our audits of these financial statements in accordance with the standards of the Public Company Accounting Oversight Board (United States). Those standards require that we plan and perform the audit to obtain reasonable assurance about whether the financial statements are free of material misstatement. An audit includes examining, on a test basis, evidence supporting the amounts and disclosures in the financial statements, assessing the accounting principles used and significant estimates made by management, and evaluating the overall financial statement presentation. We believe that our audits, which included confirmation of securities at February 28, 2006 by correspondence with the custodian and brokers, provide a reasonable basis for our opinion.
/s/ PricewaterhouseCoopers LLP
PricewaterhouseCoopers LLP
Boston, Massachusetts
April 6, 2006
|
53 Annual Report
Trustees and Officers
The Trustees, Members of the Advisory Board, and executive officers of the trust and funds, as applicable, are listed below. The Board of Trustees governs each fund and is responsible for protecting the interests of shareholders. The Trustees are experienced executives who meet periodically throughout the year to oversee each fund’s activities, review contractual arrangements with companies that provide services to each fund, and review each fund’s performance. Except for William O. McCoy and Albert R. Gamper, Jr., each of the Trustees oversees 326 funds advised by FMR or an affiliate. Mr. McCoy oversees 328 funds advised by FMR or an affiliate. Mr. Gamper oversees 251 funds advised by FMR or an affiliate.
The Trustees hold office without limit in time except that (a) any Trustee may resign; (b) any Trustee may be removed by written instrument, signed by at least two thirds of the number of Trustees prior to such removal; (c) any Trustee who requests to be retired or who has become incapacitated by illness or injury may be retired by written instru ment signed by a majority of the other Trustees; and (d) any Trustee may be removed at any special meeting of shareholders by a two thirds vote of the outstanding voting securities of the trust. Each Trustee who is not an interested person (as defined in the 1940 Act) (Independent Trustee), shall retire not later than the last day of the calendar year in which his or her 72nd birthday occurs. The Independent Trustees may waive this mandatory retirement age policy with respect to individual Trustees. The executive officers and Advisory Board Members hold office without limit in time, except that any officer and Advisory Board Member may resign or may be removed by a vote of a majority of the Trustees at any regular meeting or any special meeting of the Trustees. Except as indicated, each individual has held the office shown or other offices in the same company for the past five years.
The funds’ Statement of Additional Information (SAI) includes more information about the Trustees. To request a free copy, call Fidelity at 1-800-544-8544.
Correspondence intended for each Trustee who is an interested person may be sent to Fidelity Investments, 82 Devonshire Street, Boston, Massachusetts 02109.
| | Name, Age; Principal Occupation
Edward C. Johnson 3d (75)
|
Year of Election or Appointment: 1991
Mr. Johnson is Chairman of the Board of Trustees. Mr. Johnson serves as Chief Executive Officer, Chairman, and a Director of FMR Corp.; a Director and Chairman of the Board and of the Executive Committee of FMR; Chairman and a Director of Fidelity Management & Research (Far East) Inc.; Chairman and a Director of Fidelity Investments Money Management, Inc.; and Chairman (2001 present) and a Director (2000 present) of FMR Co., Inc.
| | Name, Age; Principal Occupation
Stephen P. Jonas (53)
|
Year of Election or Appointment: 2005
Mr. Jonas is Senior Vice President of California Municipal Money Market (2005 present) and California AMT Tax Free Money Market (2005 present). He also serves as Senior Vice President of other Fidelity funds (2005 present). Mr. Jonas is Executive Director of FMR (2005 present). Previously, Mr. Jonas served as President of Fidelity Enterprise Operations and Risk Services (2004 2005), Chief Adminis trative Officer (2002 2004), and Chief Financial Officer of FMR Co. (1998 2000). Mr. Jonas has been with Fidelity Investments since 1987 and has held various financial and management positions including Chief Financial Officer of FMR. In addition, he serves on the Boards of Boston Ballet (2003 present) and Simmons College (2003 present).
Year of Election or Appointment: 2003
Mr. Reynolds is a Director (2003 present) and Chief Operating Officer (2002 present) of FMR Corp. He also serves on the Board at Fidelity Investments Canada, Ltd. (2000 present). Previously, Mr. Reynolds served as President of Fidelity Investments Institutional Retirement Group (1996 2000).
* Trustees have been determined to be “Interested Trustees” by virtue of, among other things, their affiliation with the trust or various entities under common control with FMR.
55 Annual Report
Trustees and Officers - continued
Independent Trustees:
Correspondence intended for each Independent Trustee (that is, the Trustees other than the Interested Trustees) may be sent to Fidelity Investments, P.O. Box 55235, Boston, Massachusetts 02205-5235.
| | Name, Age; Principal Occupation
Dennis J. Dirks (57)
|
Year of Election or Appointment: 2005
Prior to his retirement in May 2003, Mr. Dirks was Chief Operating Officer and a member of the Board of The Depository Trust & Clearing Corporation (DTCC) (1999 2003). He also served as President, Chief Operating Officer, and Board member of The Depository Trust Com pany (DTC) (1999 2003) and President and Board member of the National Securities Clearing Corporation (NSCC) (1999 2003). In addi tion, Mr. Dirks served as Chief Executive Officer and Board member of the Government Securities Clearing Corporation (2001 2003) and Chief Executive Officer and Board member of the Mortgage Backed Securities Clearing Corporation (2001 2003). Mr. Dirks also serves as a Trustee and a member of the Finance Committee of Manhattan College (2005 present) and a Trustee and a member of the Finance Committee of AHRC of Nassau County (2006 present).
| | Albert R. Gamper, Jr. (63)
|
Year of Election or Appointment: 2006
Mr. Gamper also serves as a Trustee (2006 present) or Member of the Advisory Board (2005 present) of other investment companies advised by FMR. Prior to his retirement in December 2004, Mr. Gamper served as Chairman of the Board of CIT Group Inc. (commercial finance). During his tenure with CIT Group Inc. Mr. Gamper served in numerous senior management positions, including Chairman (1987 1989; 1999 2001; 2002 2004), Chief Executive Officer (1987 2004), and President (1989 2002). He currently serves as a member of the Board of Directors of Public Service Enterprise Group (utilities, 2001 present), Chairman of the Board of Governors, Rutgers University (2004 present), and Chairman of the Board of Saint Barnabas Health Care System.
Name, Age; Principal Occupation
Robert M. Gates (62)
|
Year of Election or Appointment: 1997
Dr. Gates is Chairman of the Independent Trustees (2006 present). Dr. Gates is President of Texas A&M University (2002 present). He was Director of the Central Intelligence Agency (CIA) from 1991 to 1993. From 1989 to 1991, Dr. Gates served as Assistant to the President of the United States and Deputy National Security Advisor. Dr. Gates is a Director of NACCO Industries, Inc. (mining and manufacturing), Parker Drilling Co., Inc. (drilling and rental tools for the energy industry, 2001 present), and Brinker International (restaurant management, 2003 present). Previously, Dr. Gates served as a Director of LucasVarity PLC (automotive components and diesel engines), a Director of TRW Inc. (automotive, space, defense, and information technology), and Dean of the George Bush School of Government and Public Service at Texas A&M University (1999 2001).
Year of Election or Appointment: 2004
Dr. Heilmeier is Chairman Emeritus of Telcordia Technologies (commu nication software and systems), where prior to his retirement, he served as company Chairman and Chief Executive Officer. He currently serves on the Boards of Directors of The Mitre Corporation (systems engineering and information technology support for the government), and HRL Labo ratories (private research and development, 2004 present). He is Chair man of the General Motors Science & Technology Advisory Board and a Life Fellow of the Institute of Electrical and Electronics Engineers (IEEE). Dr. Heilmeier is a member of the Defense Science Board and the National Security Agency Advisory Board. He is also a member of the National Academy of Engineering, the American Academy of Arts and Sciences, and the Board of Overseers of the School of Engineering and Applied Science of the University of Pennsylvania. Previously, Dr. Heilmeier served as a Director of TRW Inc. (automotive, space, defense, and information technology, 1992 2002), Compaq (1994 2002), Automatic Data Process ing, Inc. (ADP) (technology based business outsourcing, 1995 2002), INET Technologies Inc. (telecommunications network surveillance, 2001 2004), and Teletech Holdings (customer management services). He is the recipient of the 2005 Kyoto Prize in Advanced Technology for his invention of the liquid crystal display.
57 Annual Report
Trustees and Officers - continued
| | Name, Age; Principal Occupation
Marie L. Knowles (59)
|
Year of Election or Appointment: 2001
Prior to Ms. Knowles’ retirement in June 2000, she served as Executive Vice President and Chief Financial Officer of Atlantic Richfield Company (ARCO) (diversified energy, 1996 2000). From 1993 to 1996, she was a Senior Vice President of ARCO and President of ARCO Transportation Company. She served as a Director of ARCO from 1996 to 1998. She currently serves as a Director of Phelps Dodge Corporation (copper mining and manufacturing) and McKesson Corporation (healthcare ser vice, 2002 present). Ms. Knowles is a Trustee of the Brookings Institution and the Catalina Island Conservancy and also serves as a member of the Advisory Board for the School of Engineering of the University of Southern California.
Year of Election or Appointment: 2000
Mr. Lautenbach has been a partner of Clayton, Dubilier & Rice, Inc. (private equity investment firm) since September 1998. Previously, Mr. Lautenbach was with the International Business Machines Corpora tion (IBM) from 1968 until his retirement in 1998. Mr. Lautenbach serves as a Director of Italtel Holding S.p.A. (telecommunications (Milan, Italy), 2004 present) and Eaton Corporation (diversified industrial) as well as the Philharmonic Center for the Arts in Naples, Florida. He also is a member of the Board of Trustees of Fairfield University (2005 present), as well as a member of the Council on Foreign Relations.
Year of Election or Appointment: 1997
Prior to his retirement in December 1994, Mr. McCoy was Vice Chair man of the Board of BellSouth Corporation (telecommunications) and President of BellSouth Enterprises. He is currently a Director of Duke Realty Corporation (real estate), and Progress Energy, Inc. (electric utility). He is also a partner of Franklin Street Partners (private investment management firm) and a member of the Research Triangle Foundation Board. In addition, Mr. McCoy served as the Interim Chancellor (1999 2000) and a member of the Board of Visitors for the University of North Carolina at Chapel Hill and currently serves as Chairman of the Board of Directors of the University of North Carolina Health Care System and the Board of Visitors of the Kenan Flagler Business School (University of North Carolina at Chapel Hill). He also served as Vice President of Finance for the University of North Carolina (16 school system).
Name, Age; Principal Occupation
Cornelia M. Small (61)
|
Year of Election or Appointment: 2005
Ms. Small is a member (2000 present) and Chairperson (2002 present) of the Investment Committee, and a member (2002 present) of the Board of Trustees of Smith College. Previously, she served as Chief Investment Officer (1999 2000), Director of Global Equity Investments (1996 1999), and a member of the Board of Directors of Scudder, Stevens & Clark (1990 1997) and Scudder Kemper Investments (1997 1999). In addition, Ms. Small served as Co Chair (2000 2003) of the Annual Fund for the Fletcher School of Law and Diplomacy.
William S. Stavropoulos (66)
|
Year of Election or Appointment: 2001
Mr. Stavropoulos is Chairman of the Board (2000 present) and a Member of the Board of Directors of The Dow Chemical Company. Since joining The Dow Chemical Company in 1967, Mr. Stavropoulos served in numerous senior management positions, including President (1993 2000; 2002 2003), CEO (1995 2000; 2002 2004), and Chair man of the Executive Committee (2000 2004). Currently, he is a Direc tor of NCR Corporation (data warehousing and technology solutions), BellSouth Corporation (telecommunications), Chemical Financial Corpo ration, Maersk Inc. (industrial conglomerate, 2002 present), and Metal mark Capital (private equity investment firm, 2005 present). He also serves as a member of the Board of Trustees of the American Enterprise Institute for Public Policy Research. In addition, Mr. Stavropoulos is a member of The Business Council, J.P. Morgan International Council and the University of Notre Dame Advisory Council for the College of Science.
Year of Election or Appointment: 2005
Prior to his retirement in 2001, Mr. Wolfe was Chairman and Chief Executive Officer of Hershey Foods Corporation (1993 2001). He currently serves as a member of the boards of Adelphia Communications Corporation (2003 present), Bausch & Lomb, Inc., and Revlon Inc. (2004 present).
59 Annual Report
Trustees and Officers - continued
Advisory Board Members and Executive Officers:
Correspondence intended for Mr. Keyes may be sent to Fidelity Investments, P.O. Box 55235, Boston, Massachusetts 02205-5235. Correspondence intended for each executive officer and Mr. Lynch may be sent to Fidelity Investments, 82 Devonshire Street, Boston, Massachusetts 02109.
Year of Election or Appointment: 2006
Member of the Advisory Board of Fidelity California Municipal Trust II. Prior to his retirement in 2003, Mr. Keyes was Chairman, President, and Chief Executive Officer of Johnson Controls, Inc. (automotive supplier, 1993 2003). He currently serves as a member of the boards of LSI Logic Corporation (semiconductor technologies, 1984 present), Navistar International Corporation (manufacture and sale of trucks, buses, and diesel engines, 2002 present), and Pitney Bowes, Inc. (integrated mail, messaging, and document management solutions, 1998 present.)
Year of Election or Appointment: 2003
Member of the Advisory Board of Fidelity California Municipal Trust II. Vice Chairman and a Director of FMR, and Vice Chairman (2001 present) and a Director (2000 present) of FMR Co., Inc. Previously, Mr. Lynch served as a Trustee of the Fidelity funds (1990 2003). In addition, he serves as a Trustee of Boston College, Massachusetts Eye & Ear Infir mary, Historic Deerfield, John F. Kennedy Library, and the Museum of Fine Arts of Boston.
Year of Election or Appointment: 2005
Vice President of California Municipal Money Market and California AMT Tax Free Money Market. Mr. Donovan also serves as Vice President of Fidelity’s High Income Funds (2005 present), Fidelity’s Fixed Income Funds (2005 present), certain Asset Allocation Funds (2005 present), and cer tain Balanced Funds (2005 present). Mr. Donovan also serves as Execu tive Vice President of FMR (2005 present) and FMRC (2005 present). Previously, Mr. Donovan served as Vice President and Director of Fidelity’s International Equity Trading group (1998 2005).
Year of Election or Appointment: 2005
Vice President of California Municipal Money Market and California AMT Tax Free Money Market. Mr. Morrison also serves as Vice Presi dent of Fidelity’s Money Market Funds (2005 present) and certain Asset Allocation Funds (2002 present). Previously, he served as Vice President of Fidelity’s Bond Funds (2002 2005) and certain Balanced Funds (2002 2005). He served as Vice President (2002 2005) and Bond Group Leader (2002 2005) of Fidelity Investments Fixed Income Divi sion. Mr. Morrison is also Vice President of FIMM (2002 present) and FMR (2002 present). Mr. Morrison joined Fidelity Investments in 1987 as a Corporate Bond Analyst in the Fixed Income Research Division.
Year of Election or Appointment: 2002
Vice President of California Municipal Money Market and California AMT Tax Free Money Market. Mr. Murphy also serves as Vice President of Fidelity’s Money Market Funds (2002 present), certain Asset Alloca tion Funds (2003 present), Fidelity’s Investment Grade Bond Funds (2005 present), and Fidelity’s Balanced Funds (2005 present). He serves as Senior Vice President (2000 present) and Head (2004 present) of the Fidelity Investments Fixed Income Division. Mr. Murphy is also a Senior Vice President of Fidelity Investments Money Management, Inc. (2003 present) and an Executive Vice President of FMR (2005 present). Previously, Mr. Murphy served as Money Market Group Leader (2002 2004), Bond Group Leader (2000 2002), and Vice President of Fidelity’s Taxable Bond Funds (2000 2002) and Fidelity’s Municipal Bond Funds (2001 2002).
Year of Election or Appointment: 2001
Vice President of California Municipal Money Market and California AMT Tax Free Money Market. Mr. Lind also serves as Vice President of other funds advised by FMR. Prior to assuming his current responsibili ties, Mr. Lind worked as a research analyst and portfolio manager.
Year of Election or Appointment: 1998
Secretary of California Municipal Money Market and California AMT Tax Free Money Market. He also serves as Secretary of other Fidelity funds; Vice President, General Counsel, and Secretary of FMR Co., Inc. (2001 present) and FMR; Assistant Secretary of Fidelity Management & Research (U.K.) Inc. (2001 present), Fidelity Research & Analysis Com pany (2001 present), and Fidelity Investments Money Management, Inc. (2001 present). Mr. Roiter is an Adjunct Member, Faculty of Law, at Boston College Law School (2003 present). Previously, Mr. Roiter served as Vice President and Secretary of Fidelity Distributors Corporation (1998 2005).
61 Annual Report
Trustees and Officers - continued
Year of Election or Appointment: 2003
Assistant Secretary of California Municipal Money Market and Califor nia AMT Tax Free Money Market. Mr. Fross also serves as Assistant Secretary of other Fidelity funds (2003 present), Vice President and Secretary of FDC (2005 present), and is an employee of FMR.
Year of Election or Appointment: 2004
President and Treasurer of California Municipal Money Market and Cal ifornia AMT Tax Free Money Market. Ms. Reynolds also serves as President and Treasurer of other Fidelity funds (2004 present) and is a Vice President (2003 present) and an employee (2002 present) of FMR. Before joining Fidelity Investments, Ms. Reynolds worked at Pricewater houseCoopers LLP (PwC) (1980 2002), where she was most recently an audit partner with PwC’s investment management practice.
Year of Election or Appointment: 2006
Anti Money Laundering (AML) officer of California Municipal Money Market and California AMT Tax Free Money Market. Mr. Ganis also serves as AML officer of other Fidelity funds (2006 present) and FMR Corp. (2003 present). Before joining Fidelity Investments, Mr. Ganis practiced law at Goodwin Procter, LLP (2000 2002).
Year of Election or Appointment: 2005
Chief Financial Officer of California Municipal Money Market and California AMT Tax Free Money Market. Mr. Murphy also serves as Chief Financial Officer of other Fidelity funds (2005 present). He also serves as Senior Vice President of Fidelity Pricing and Cash Management Services Group (FPCMS).
| | Kenneth A. Rathgeber (58)
|
Year of Election or Appointment: 2004
Chief Compliance Officer of California Municipal Money Market and California AMT Tax Free Money Market. Mr. Rathgeber also serves as Chief Compliance Officer of other Fidelity funds (2004 present) and Executive Vice President of Risk Oversight for Fidelity Investments (2002 present), Fidelity Management & Research (U.K.) Inc. (2005 present), Fidelity Research & Analysis Company (2005 present), Fidelity Investments Money Management, Inc. (2005 present), and Strategic Advisers, Inc. (2005 present). Previously, Mr. Rathgeber served as Executive Vice President and Chief Operating Officer for Fidelity Investments Institutional Services Company, Inc. (1998 2002).
Year of Election or Appointment: 2005
Deputy Treasurer of California Municipal Money Market and California AMT Tax Free Money Market. Mr. Mehrmann also serves as Deputy Treasurer of other Fidelity funds (2005 present) and is an employee of FMR. Previously, Mr. Mehrmann served as Vice President of Fidelity Investments Institutional Services Group (FIIS)/Fidelity Investments Institutional Operations Corporation, Inc. (FIIOC) Client Services (1998 2004).
Kimberley H. Monasterio (42)
|
Year of Election or Appointment: 2004
Deputy Treasurer of California Municipal Money Market and California AMT Tax Free Money Market. Ms. Monasterio also serves as Deputy Treasurer of other Fidelity funds (2004) and is an employee of FMR (2004). Before joining Fidelity Investments, Ms. Monasterio served as Treasurer (2000 2004) and Chief Financial Officer (2002 2004) of the Franklin Templeton Funds and Senior Vice President of Franklin Templeton Services, LLC (2000 2004).
Year of Election or Appointment: 2005
Deputy Treasurer of California Municipal Money Market and California AMT Tax Free Money Market. Mr. Robins also serves as Deputy Trea surer of other Fidelity funds (2005 present) and is an employee of FMR (2004 present). Before joining Fidelity Investments, Mr. Robins worked at KPMG LLP, where he was a partner in KPMG’s department of profes sional practice (2002 2004) and a Senior Manager (1999 2000). In addition, Mr. Robins served as Assistant Chief Accountant, United States Securities and Exchange Commission (2000 2002).
Year of Election or Appointment: 2005
Assistant Treasurer of California Municipal Money Market and Califor nia AMT Tax Free Money Market. Mr. Byrnes also serves as Assistant Treasurer of other Fidelity funds (2005 present) and is an employee of FMR (2005 present). Previously, Mr. Byrnes served as Vice President of FPCMS (2003 2005). Before joining Fidelity Investments, Mr. Byrnes worked at Deutsche Asset Management where he served as Vice Presi dent of the Investment Operations Group (2000 2003).
Year of Election or Appointment: 1986 or 1989
Assistant Treasurer of California Municipal Money Market (1986) and California AMT Tax Free Money Market (1989). Mr. Costello also serves as Assistant Treasurer of other Fidelity funds and is an employee of FMR.
63 Annual Report
Trustees and Officers - continued
Year of Election or Appointment: 2004
Assistant Treasurer of California Municipal Money Market and Cali fornia AMT Tax Free Money Market. Mr. Lydecker also serves as Assis tant Treasurer of other Fidelity funds (2004) and is an employee of FMR.
Year of Election or Appointment: 2002
Assistant Treasurer of California Municipal Money Market and California AMT Tax Free Money Market. Mr. Osterheld also serves as Assis tant Treasurer of other Fidelity funds (2002) and is an employee of FMR.
Year of Election or Appointment: 2005
Assistant Treasurer of California Municipal Money Market and Cali fornia AMT Tax Free Money Market. Mr. Ryan also serves as Assistant Treasurer of other Fidelity funds (2005 present) and is an employee of FMR (2005 present). Previously, Mr. Ryan served as Vice President of Fund Reporting in FPCMS (1999 2005).
Year of Election or Appointment: 2005
Assistant Treasurer of California Municipal Money Market and Cali fornia AMT Tax Free Money Market. Mr. Schiavone also serves as Assistant Treasurer of other Fidelity funds (2005 present) and is an employee of FMR (2005 present). Before joining Fidelity Investments, Mr. Schiavone worked at Deutsche Asset Management, where he most recently served as Assistant Treasurer (2003 2005) of the Scudder Funds and Vice President and Head of Fund Reporting (1996 2003).
The funds hereby designate as capital gain dividend the amounts noted below for the taxable year ended February 28, 2006, or, if subsequently determined to be different, the net capital gain of such year.
| Fund | | |
| Fidelity California AMT Tax Free Money Market Fund | | $105,392 |
During fiscal year ended 2006, 100% of Fidelity California AMT Tax Free Money Market Fund’s and Fidelity California Municipal Money Market Fund’s income dividends were free from federal income tax, and 46.54% of Fidelity California Municipal Money Market Fund’s income dividends were subject to the federal alternative minimum tax.
The fund will notify shareholders in January 2007 of amounts for use in preparing 2006 income tax returns.
65 Annual Report
Proxy Voting Results
A special meeting of the funds’ shareholders was held on January 18, 2006. The results of votes taken among shareholders on the proposal before them are reported below. Each vote reported represents one dollar of net asset value held on the record date for the meeting.
| PROPOSAL 1 | | | | |
| To elect a Board of Trustees.A | | |
| | | # of | | % of |
| | | Votes | | Votes |
| |
| Dennis J. Dirks | | | | |
| Affirmative | | 1,930,551,155.64 | | 95.654 |
| Withheld | | 87,723,590.30 | | 4.346 |
| TOTAL | | 2,018,274,745.94 | | 100.000 |
| Albert R. Gamper, Jr. | | |
| Affirmative | | 1,929,188,053.82 | | 95.586 |
| Withheld | | 89,086,692.12 | | 4.414 |
| TOTAL | | 2,018,274,745.94 | | 100.000 |
| Robert M. Gates | | |
| Affirmative | | 1,928,271,156.63 | | 95.541 |
| Withheld | | 90,003,589.31 | | 4.459 |
| TOTAL | | 2,018,274,745.94 | | 100.000 |
| George H. Heilmeier | | |
| Affirmative | | 1,929,924,148.99 | | 95.622 |
| Withheld | | 88,350,596.95 | | 4.378 |
| TOTAL | | 2,018,274,745.94 | | 100.000 |
| Abigail P. Johnson | | |
| Affirmative | | 1,921,154,526.16 | | 95.188 |
| Withheld | | 97,120,219.78 | | 4.812 |
| TOTAL | | 2,018,274,745.94 | | 100.000 |
| Edward C. Johnson 3d | | |
| Affirmative | | 1,919,752,941.40 | | 95.119 |
| Withheld | | 98,521,804.54 | | 4.881 |
| TOTAL | | 2,018,274,745.94 | | 100.000 |
| Stephen P. Jonas | | |
| Affirmative | | 1,928,513,087.92 | | 95.553 |
| Withheld | | 89,761,658.02 | | 4.447 |
| TOTAL | | 2,018,274,745.94 | | 100.000 |
| | | # of | | % of |
| | | Votes | | Votes |
| |
| Marie L. Knowles | | |
| Affirmative | | 1,928,842,783.44 | | 95.569 |
| Withheld | | 89,431,962.50 | | 4.431 |
| TOTAL | | 2,018,274,745.94 | | 100.000 |
| |
| Ned C. Lautenbach | | |
| Affirmative | | 1,928,555,572.73 | | 95.555 |
| Withheld | | 89,719,173.21 | | 4.445 |
| TOTAL | | 2,018,274,745.94 | | 100.000 |
| |
| William O. McCoy | | |
| Affirmative | | 1,929,667,179.18 | | 95.610 |
| Withheld | | 88,607,566.76 | | 4.390 |
| TOTAL | | 2,018,274,745.94 | | 100.000 |
| |
| Robert L. Reynolds | | |
| Affirmative | | 1,928,881,156.93 | | 95.571 |
| Withheld | | 89,393,589.01 | | 4.429 |
| TOTAL | | 2,018,274,745.94 | | 100.000 |
| |
| Cornelia M. Small | | |
| Affirmative | | 1,930,293,320.58 | | 95.641 |
| Withheld | | 87,981,425.36 | | 4.359 |
| TOTAL | | 2,018,274,745.94 | | 100.000 |
| |
| William S. Stavropoulos | | |
| Affirmative | | 1,927,399,663.24 | | 95.497 |
| Withheld | | 90,875,082.70 | | 4.503 |
| TOTAL | | 2,018,274,745.94 | | 100.000 |
| |
| Kenneth L. Wolfe | | |
| Affirmative | | 1,929,442,292.10 | | 95.599 |
| Withheld | | 88,832,453.84 | | 4.401 |
| TOTAL | | 2,018,274,745.94 | | 100.000 |
A Denotes trust-wide proposal and voting results.
Annual Report 66
Board Approval of Investment Advisory Contracts and Management Fees
Fidelity California AMT Tax Free Money Market Fund (formerly Spartan California Municipal Money Market Fund) / Fidelity California Municipal Money Market Fund
On January 19, 2006, the Board of Trustees, including the Independent Trustees (together, the Board), voted to approve a general research services agreement (the Agreement) between FMR, FMR Co., Inc. (FMRC), Fidelity Investments Money Manage ment, Inc. (FIMM), and Fidelity Research & Analysis Company (FRAC) (together, the Investment Advisers) for each fund, effective January 20, 2006, pursuant to which FRAC may provide general research and investment advisory support services to FMRC and FIMM. The Board considered that it has approved previously various sub advisory agreements for each fund with affiliates of FMR that allow FMR to obtain research, non discretionary advice, or discretionary portfolio management at no additional expense to each fund. The Board, assisted by the advice of fund counsel and independent Trustees’ counsel, considered a broad range of information and determined that it would be beneficial for each fund to access the research and investment advisory support services supplied by FRAC at no additional expense to each fund.
The Board reached this determination in part because the new arrangement will involve no changes in (i) the contractual terms of and fees payable under each fund’s manage ment contract or sub advisory agreements; (ii) the investment process or strategies employed in the management of each fund’s assets; (iii) the nature or level of services provided under each fund’s management contract or sub advisory agreements; (iv) the day to day management of each fund or the persons primarily responsible for such management; or (v) the ultimate control or beneficial ownership of FMR, FMRC, or FIMM. The Board also considered that the establishment of each Agreement would not necessitate prior shareholder approval of the Agreement or result in an assignment and termination of each fund’s management contract or sub advisory agreements under the Investment Company Act of 1940.
Because the Board was approving an arrangement with FRAC under which each fund will not bear any additional management fees or expenses and under which each fund’s portfolio manager would not change, it did not consider each fund’s investment performance, competitiveness of management fee and total expenses, costs of services and profitability, or economies of scale to be significant factors in its decision.
In connection with its future renewal of each fund’s management contract and sub advisory agreements, the Board will consider: (i) the nature, extent, and quality of services provided to each fund, including shareholder and administrative services and investment performance; (ii) the competitiveness of each fund’s management fee and total expenses; (iii) the costs of the services and profitability, including the revenues earned and the expenses incurred by Fidelity in conducting the business of developing, marketing, distributing, managing, administering, and servicing each fund and its
67 Annual Report
Board Approval of Investment Advisory Contracts and Management Fees continued
shareholders; and (iv) whether there have been economies of scale in respect of the management of the Fidelity funds, whether the Fidelity funds (including each fund) have appropriately benefited from any such economies of scale, and whether there is potential for realization of any further economies.
Based on its evaluation of all of the conclusions noted above, and after considering all material factors, the Board ultimately concluded that each fund’s Agreement is fair and reasonable, and that each fund’s Agreement should be approved.
Managing Your Investments
Fidelity offers several ways to conveniently manage your personal investments via your telephone or PC. You can access your account information, conduct trades and research your investments 24 hours a day.
By Phone
Fidelity Automated Service Telephone provides a single toll free number to access account balances, positions, quotes and trading. It’s easy to navigate the service, and on your first call, the system will help you create a personal identification number (PIN) for security.


By PC
Fidelity’s web site on the Internet provides a wide range of information, including daily financial news, fund performance, interactive planning tools and news about Fidelity products and services.

* When you call the quotes line, please remember that a fund’s yield and return will vary and, except for money market funds, share price will also vary. This means that you may have a gain or loss when you sell your shares. There is no assurance that money market funds will be able to maintain a stable $1 share price; an investment in a money market fund is not insured or guar anteed by the U.S. government. Total returns are historical and include changes in share price, reinvestment of dividends and capital gains, and the effects of any sales charges.
69 Annual Report
To Visit Fidelity
For directions and hours,
please call 1-800-544-9797.
Arizona
7001 West Ray Road
Chandler, AZ
7373 N. Scottsdale Road
Scottsdale, AZ
California
815 East Birch Street
Brea, CA
1411 Chapin Avenue
Burlingame, CA
851 East Hamilton Avenue
Campbell, CA
19200 Von Karman Avenue
Irvine, CA
601 Larkspur Landing Circle
Larkspur, CA
10100 Santa Monica Blvd.
Los Angeles, CA
27101 Puerta Real
Mission Viejo, CA
73 575 El Paseo
Palm Desert, CA
251 University Avenue
Palo Alto, CA
123 South Lake Avenue
Pasadena, CA
16995 Bernardo Ctr. Drive
Rancho Bernardo, CA
1740 Arden Way
Sacramento, CA
7676 Hazard Center Drive
San Diego, CA
8 Montgomery Street
San Francisco, CA
3793 State Street
Santa Barbara, CA
21701 Hawthorne Boulevard
Torrance, CA
2001 North Main Street
Walnut Creek, CA
6300 Canoga Avenue
Woodland Hills, CA
|
Colorado
1625 Broadway
Denver, CO
9185 East Westview Road
Littleton, CO
Connecticut
48 West Putnam Avenue
Greenwich, CT
265 Church Street
New Haven, CT
300 Atlantic Street
Stamford, CT
29 South Main Street
West Hartford, CT
Delaware
222 Delaware Avenue
Wilmington, DE
Florida
4400 N. Federal Highway
Boca Raton, FL
121 Alhambra Plaza
Coral Gables, FL
2948 N. Federal Highway
Ft. Lauderdale, FL
1907 West State Road 434
Longwood, FL
8880 Tamiami Trail, North
Naples, FL
3550 Tamiami Trail, South
Sarasota, FL
1502 N. Westshore Blvd.
Tampa, FL
2465 State Road 7
Wellington, FL
3501 PGA Boulevard
West Palm Beach, FL
Georgia
3445 Peachtree Road, N.E.
Atlanta, GA
1000 Abernathy Road
Atlanta, GA
Illinois
One North LaSalle Street
Chicago, IL
875 North Michigan Ave.
Chicago, IL
1415 West 22nd Street
Oak Brook, IL
|
1700 East Golf Road
Schaumburg, IL
3232 Lake Avenue
Wilmette, IL
Indiana
4729 East 82nd Street
Indianapolis, IN
Kansas
5400 College Boulevard
Overland Park, KS
Maine
Three Canal Plaza
Portland, ME
Maryland
7315 Wisconsin Avenue
Bethesda, MD
One W. Pennsylvania Ave.
Towson, MD
Massachusetts
801 Boylston Street
Boston, MA
155 Congress Street
Boston, MA
300 Granite Street
Braintree, MA
44 Mall Road
Burlington, MA
405 Cochituate Road
Framingham, MA
416 Belmont Street
Worcester, MA
Michigan
500 E. Eisenhower Pkwy.
Ann Arbor, MI
280 Old N. Woodward Ave.
Birmingham, MI
43420 Grand River Avenue
Novi, MI
29155 Northwestern Hwy.
Southfield, MI
Minnesota
7600 France Avenue South
Edina, MN
Missouri
8885 Ladue Road
Ladue, MO
|
Annual Report 70
Nevada
2225 Village Walk Drive
Henderson, NV
New Jersey
150 Essex Street
Millburn, NJ
56 South Street
Morristown, NJ
396 Route 17, North
Paramus, NJ
3518 Route 1 North
Princeton, NJ
530 Highway 35
Shrewsbury, NJ
New York
1055 Franklin Avenue
Garden City, NY
37 West Jericho Turnpike
Huntington Station, NY
1271 Avenue of the Americas
New York, NY
61 Broadway
New York, NY
350 Park Avenue
New York, NY
200 Fifth Avenue
New York, NY
733 Third Avenue
New York, NY
11 Penn Plaza
New York, NY
2070 Broadway
New York, NY
1075 Northern Blvd.
Roslyn, NY
North Carolina
4611 Sharon Road
Charlotte, NC
Ohio
3805 Edwards Road
Cincinnati, OH
1324 Polaris Parkway
Columbus, OH
28699 Chagrin Boulevard
Woodmere Village, OH
Oregon
16850 SW 72nd Avenue
Tigard, OR
|
Pennsylvania
600 West DeKalb Pike
King of Prussia, PA
1735 Market Street
Philadelphia, PA
12001 Perry Highway
Wexford, PA
Rhode Island
47 Providence Place
Providence, RI
Tennessee
6150 Poplar Avenue
Memphis, TN
Texas
10000 Research Boulevard
Austin, TX
4001 Northwest Parkway
Dallas, TX
12532 Memorial Drive
Houston, TX
2701 Drexel Drive
Houston, TX
6500 N. MacArthur Blvd.
Irving, TX
6005 West Park Boulevard
Plano, TX
14100 San Pedro
San Antonio, TX
1576 East Southlake Blvd.
Southlake, TX
19740 IH 45 North
Spring, TX
Utah
215 South State Street
Salt Lake City, UT
Virginia
1861 International Drive
McLean, VA
Washington
411 108th Avenue, N.E.
Bellevue, WA
1518 6th Avenue
Seattle, WA
Washington, DC
1900 K Street, N.W.
Washington, DC
Wisconsin
595 North Barker Road
Brookfield, WI
|
Fidelity Brokerage Services, Inc., 100 Summer St., Boston, MA 02110 Member NYSE/SIPC
71 Annual Report
71
To Write Fidelity
We’ll give your correspondence immediate attention and send you written confirmation upon completion of your request.

| | (such as changing name, address, bank, etc.)
Fidelity Investments
P.O. Box 770001
Cincinnati, OH 45277-0002
|

Buying shares
Fidelity Investments
P.O. Box 770001
Cincinnati, OH 45277-0003
Overnight Express
Fidelity Investments
Attn: Distribution Services
100 Crosby Parkway KC1H
Covington, KY 41015
Selling shares
Fidelity Investments
P.O. Box 770001
Cincinnati, OH 45277-0035
Overnight Express
Fidelity Investments
Attn: Distribution Services
100 Crosby Parkway KC1H
Covington, KY 41015
General Correspondence
Fidelity Investments
P.O. Box 500
Merrimack, NH 03054-0500
|

Buying shares
Fidelity Investments
P.O. Box 770001
Cincinnati, OH 45277-0003
Selling shares
Fidelity Investments
P.O. Box 770001
Cincinnati, OH 45277-0035
Overnight Express
Fidelity Investments
Attn: Distribution Services
100 Crosby Parkway KC1H
Covington, KY 41015
General Correspondence
Fidelity Investments
P.O. Box 500
Merrimack, NH 03054-0500
|
Annual Report 72
73 Annual Report
75 Annual Report
Investment Adviser
Fidelity Management & Research
Company
Boston, MA
Investment Sub Adviser
Fidelity Investments Money
Management, Inc.
Fidelity International Investment Advisors
Fidelity International Investment Advisors
(U.K.) Limited
Fidelity Research & Analysis Company
(formerly Fidelity Management & Research
(Far East) Inc.)
General Distributor
Fidelity Distributors Corporation
Boston, MA
Transfer and Service Agent
Citibank, N.A.
New York, NY
Fidelity Service Company, Inc.
Boston, MA
Custodian
Citibank, N.A.
New York, NY
|
| The Fidelity Telephone Connection |
| Mutual Fund 24-Hour Service |
| Exchanges/Redemptions | | |
| and Account Assistance | | 1-800-544-6666 |
| Product Information | | 1-800-544-6666 |
| Retirement Accounts | | 1-800-544-4774 |
| (8 a.m. - 9 p.m.) | | |
| TDD Service | | 1-800-544-0118 |
| for the deaf and hearing impaired |
| (9 a.m. - 9 p.m. Eastern time) |
| Fidelity Automated Service | | |
| Telephone (FAST® ) (automated phone logo) | | 1-800-544-5555 |
| (automated phone logo) Automated line for quickest service |
CMS-UANN-0406
1.790912.102
|

Item 2. Code of Ethics
As of the end of the period, February 28, 2006, Fidelity California Municipal Trust II (the trust) has adopted a code of ethics, as defined in Item 2 of Form N-CSR, that applies to its President and Treasurer and its Chief Financial Officer. A copy of the code of ethics is filed as an exhibit to this Form N-CSR.
Item 3. Audit Committee Financial Expert
The Board of Trustees of the trust has determined that Marie L. Knowles is an audit committee financial expert, as defined in Item 3 of Form N-CSR. Ms. Knowles is independent for purposes of Item 3 of Form N-CSR.
Item 4. Principal Accountant Fees and Services
(a) Audit Fees.
For the fiscal years ended February 28, 2006 and February 28, 2005, the aggregate Audit Fees billed by PricewaterhouseCoopers LLP (PwC) for professional services rendered for the audits of the financial statements, or services that are normally provided in connection with statutory and regulatory filings or engagements for those fiscal years, for the Fidelity California AMT Tax-Free Money Market Fund, and Fidelity California Municipal Money Market Fund (the funds) and for all funds in the Fidelity Group of Funds are shown in the table below.
Fund | 2006A | 2005A |
Fidelity California AMT Tax-Free Money Market Fund | $38,000 | $37,000 |
Fidelity California Municipal Money Market Fund | $44,000 | $41,000 |
All funds in the Fidelity Group of Funds audited by PwC | $12,500,000 | $11,200,000 |
A | Aggregate amounts may reflect rounding. |
(b) Audit-Related Fees.
In each of the fiscal years ended February 28, 2006 and February 28, 2005, the aggregate Audit-Related Fees billed by PwC for services rendered for assurance and related services to each fund that are reasonably related to the performance of the audit or review of the fund's financial statements, but not reported as Audit Fees, are shown in the table below.
Fund | 2006A | 2005A |
Fidelity California AMT Tax-Free Money Market Fund | $0 | $0 |
Fidelity California Municipal Money Market Fund | $0 | $0 |
A | Aggregate amounts may reflect rounding. |
In each of the fiscal years ended February 28, 2006 and February 28, 2005, the aggregate Audit-Related Fees that were billed by PwC that were required to be approved by the Audit Committee for services rendered on behalf of Fidelity Management & Research Company (FMR) and entities controlling, controlled by, or under common control with FMR (not including any sub-adviser whose role is primarily portfolio management and is subcontracted with or overseen by another investment adviser) that provide ongoing services to the funds ("Fund Service Providers") for assurance and related services that relate directly to the operations and financial reporting of each fund that are reasonably related to the performance of the audit or review of the fund's financial statements, but not reported as Audit Fees, are shown in the table below.
Billed By | 2006A | 2005A |
PwC | $0 | $0 |
A | Aggregate amounts may reflect rounding. |
Fees included in the audit-related category comprise assurance and related services (e.g., due diligence services) that are traditionally performed by the independent registered public accounting firm. These audit-related services include due diligence related to mergers and acquisitions, accounting consultations and audits in connection with acquisitions, internal control reviews, attest services that are not required by statute or regulation and consultation concerning financial accounting and reporting standards.
(c) Tax Fees.
In each of the fiscal years ended February 28, 2006 and February 28, 2005, the aggregate Tax Fees billed by PwC for professional services rendered for tax compliance, tax advice, and tax planning for each fund is shown in the table below.
Fund | 2006A | 2005A |
Fidelity California AMT Tax-Free Money Market Fund | $1,800 | $1,700 |
Fidelity California Municipal Money Market Fund | $1,800 | $1,700 |
A | Aggregate amounts may reflect rounding. |
In each of the fiscal years ended February 28, 2006 and February 28, 2005, the aggregate Tax Fees billed by PwC that were required to be approved by the Audit Committee for professional services rendered on behalf of the Fund Service Providers for tax compliance, tax advice, and tax planning that relate directly to the operations and financial reporting of each fund is shown in the table below.
Billed By | 2006A | 2005A |
PwC | $0 | $0 |
A | Aggregate amounts may reflect rounding. |
Fees included in the Tax Fees category comprise all services performed by professional staff in the independent registered public accounting firm's tax division except those services related to the audit. Typically, this category would include fees for tax compliance, tax planning, and tax advice. Tax compliance, tax advice, and tax planning services include preparation of original and amended tax returns, claims for refund and tax payment-planning services, assistance with tax audits and appeals, tax advice related to mergers and acquisitions and requests for rulings or technical advice from taxing authorities.
(d) All Other Fees.
In each of the fiscal years ended February 28, 2006 and February 28, 2005, the aggregate Other Fees billed by PwC for all other non-audit services rendered to the funds is shown in the table below.
Fund | 2006A | 2005A |
Fidelity California AMT Tax-Free Money Market Fund | $2,200 | $2,100 |
Fidelity California Municipal Money Market Fund | $3,500 | $3,400 |
A | Aggregate amounts may reflect rounding. |
In each of the fiscal years ended February 28, 2006 and February 28, 2005, the aggregate Other Fees billed by PwC that were required to be approved by the Audit Committee for all other non-audit services rendered on behalf of the Fund Service Providers that relate directly to the operations and financial reporting of each fund is shown in the table below.
Billed By | 2006A | 2005A |
PwC | $155,000 | $520,000 |
A | Aggregate amounts may reflect rounding. |
Fees included in the All Other Fees category include services related to internal control reviews, strategy and other consulting, financial information systems design and implementation, consulting on other information systems, and other tax services unrelated to the fund.
(e) (1) | Audit Committee Pre-Approval Policies and Procedures: |
The trust's Audit Committee must pre-approve all audit and non-audit services provided by the independent registered public accounting firm relating to the operations or financial reporting of the funds. Prior to the commencement of any audit or non-audit services to a fund, the Audit Committee reviews the services to determine whether they are appropriate and permissible under applicable law.
The trust's Audit Committee has adopted policies and procedures to, among other purposes, provide a framework for the Committee's consideration of non-audit services by the audit firms that audit the Fidelity funds. The policies and procedures require that any non-audit service provided by a fund audit firm to a Fidelity Fund and any non-audit service provided by a fund auditor to a Fund Service Provider that relates directly to the operations and financial reporting of a Fidelity fund (Covered Service) are subject to approval by the Audit Committee before such service is provided. Non-audit services provided by a fund audit firm for a Fund Service Provider that do not relate directly to the operations and financial reporting of a Fidelity fund (Non-Covered Service) but that are expected to exceed $50,000 are also subject to pre-approval by the Audit Committee.
All Covered Services, as well as Non-Covered Services that are expected to exceed $50,000, must be approved in advance of provision of the service either: (i) by formal resolution of the Audit Committee, or (ii) by oral or written approval of the service by the Chair of the Audit Committee (or if the Chair is unavailable, such other member of the Audit Committee as may be designated by the Chair to act in the Chair's absence). The approval contemplated by (ii) above is permitted where the Treasurer determines that action on such an engagement is necessary before the next meeting of the Audit Committee. Neither pre-approval nor advance notice of Non-Covered Service engagements for which fees are not expected to exceed $50,000 is required; such engagements are to be reported to the Audit Committee monthly.
(e) (2) | Services approved pursuant to paragraph (c)(7)(i)(C) of Rule 2-01 of Regulation S-X: |
Audit-Related Fees:
There were no amounts that were approved by the Audit Committee pursuant to the de minimis exception for the fiscal years ended February 28, 2006 and February 28, 2005 on behalf of each fund.
There were no amounts that were required to be approved by the Audit Committee pursuant to the de minimis exception for the fiscal years ended February 28, 2006 and February 28, 2005 on behalf of the Fund Service Providers that relate directly to the operations and financial reporting of each fund.
Tax Fees:
There were no amounts that were approved by the Audit Committee pursuant to the de minimis exception for the fiscal years ended February 28, 2006 and February 28, 2005 on behalf of each fund.
There were no amounts that were required to be approved by the Audit Committee pursuant to the de minimis exception for the fiscal years ended February 28, 2006 and February 28, 2005 on behalf of the Fund Service Providers that relate directly to the operations and financial reporting of each fund.
All Other Fees:
There were no amounts that were approved by the Audit Committee pursuant to the de minimis exception for the fiscal years ended February 28, 2006 and February 28, 2005 on behalf of each fund.
There were no amounts that were required to be approved by the Audit Committee pursuant to the de minimis exception for the fiscal years ended February 28, 2006 and February 28, 2005 on behalf of the Fund Service Providers that relate directly to the operations and financial reporting of each fund.
(f) Not applicable.
(g) For the fiscal years ended February 28, 2006 and February 28, 2005, the aggregate fees billed by PwC of $1,175,000A and $1,350,000A,B for non-audit services rendered on behalf of the funds, FMR (not including any sub-adviser whose role is primarily portfolio management and is subcontracted with or overseen by another investment adviser) and Fund Service Providers relating to Covered Services and Non-Covered Services are shown in the table below.
| 2006A | 2005A |
Covered Services | $175,000 | $550,000 |
Non-Covered Services | $1,000,000 | $800,000 B |
A | Aggregate amounts may reflect rounding. |
B | Reflects current period presentation. |
(h) The trust's Audit Committee has considered Non-Covered Services that were not pre-approved that were provided by PwC to Fund Service Providers to be compatible with maintaining the independence of PwC in its audit of the funds, taking into account representations from PwC, in accordance with Independence Standards Board Standard No.1, regarding its independence from the funds and their related entities.
Item 5. Audit Committee of Listed Registrants
Not applicable.
Item 6. Schedule of Investments
Not applicable.
Item 7. Disclosure of Proxy Voting Policies and Procedures for Closed-End Management Investment Companies
Not applicable.
Item 8. Portfolio Managers of Closed-End Management Investment Companies
Not applicable.
Item 9. Purchase of Equity Securities by Closed-End Management Investment Company and Affiliated Purchasers
Not applicable.
Item 10. Submission of Matters to a Vote of Security Holders
There were no material changes to the procedures by which shareholders may recommend nominees to the trust's Board of Trustees.
Item 11. Controls and Procedures
(a)(i) The President and Treasurer and the Chief Financial Officer have concluded that the trust's disclosure controls and procedures (as defined in Rule 30a-3(c) under the Investment Company Act) provide reasonable assurances that material information relating to the trust is made known to them by the appropriate persons, based on their evaluation of these controls and procedures as of a date within 90 days of the filing date of this report.
(a)(ii) There was no change in the trust's internal control over financial reporting (as defined in Rule 30a-3(d) under the Investment Company Act) that occurred during the second fiscal quarter of the period covered by this report that has materially affected, or is reasonably likely to materially affect, the trust's internal control over financial reporting.
Item 12. Exhibits
(a) | (1) | Code of Ethics pursuant to Item 2 of Form N-CSR is filed and attached hereto as EX-99.CODE ETH. |
(a) | (2) | Certification pursuant to Rule 30a-2(a) under the Investment Company Act of 1940 (17 CFR 270.30a-2(a)) is filed and attached hereto as Exhibit 99.CERT. |
(a) | (3) | Not applicable. |
(b) | | Certification pursuant to Rule 30a-2(b) under the Investment Company Act of 1940 (17 CFR 270.30a-2(b)) is furnished and attached hereto as Exhibit 99.906CERT. |
SIGNATURES
Pursuant to the requirements of the Securities Exchange Act of 1934 and the Investment Company Act of 1940, the registrant has duly caused this report to be signed on its behalf by the undersigned, thereunto duly authorized.
Fidelity California Municipal Trust II
By: | /s/Christine Reynolds |
| Christine Reynolds |
| President and Treasurer |
| |
Date: | April 17, 2006 |
Pursuant to the requirements of the Securities Exchange Act of 1934 and the Investment Company Act of 1940, this report has been signed below by the following persons on behalf of the registrant and in the capacities and on the dates indicated.
By: | /s/Christine Reynolds |
| Christine Reynolds |
| President and Treasurer |
| |
Date: | April 17, 2006 |
By: | /s/Paul M. Murphy |
| Paul M. Murphy |
| Chief Financial Officer |
| |
Date: | April 17, 2006 |