UNITED STATES
SECURITIES AND EXCHANGE COMMISSION
Washington, D.C. 20549
FORM N-CSR
CERTIFIED SHAREHOLDER REPORT OF REGISTERED
MANAGEMENT INVESTMENT COMPANIES
Investment Company Act file number 811-6397
Fidelity California Municipal Trust II
(Exact name of registrant as specified in charter)
82 Devonshire St., Boston, Massachusetts 02109
(Address of principal executive offices) (Zip code)
Eric D. Roiter, Secretary
82 Devonshire St.
Boston, Massachusetts 02109
(Name and address of agent for service)
Registrant's telephone number, including area code: 617-563-7000
Date of fiscal year end: | February 28 |
| |
Date of reporting period: | August 31, 2006 |
Item 1. Reports to Stockholders
Fidelity California AMT Tax-Free
Money Market Fund
and
Fidelity California Municipal
Money Market Fund
Semiannual Report
August 31, 2006
(2_fidelity_logos) (Registered_Trademark)
Contents
To view a fund's proxy voting guidelines and proxy voting record for the 12-month period ended June 30, visit www.fidelity.com/proxyvotingresults or visit the Securities and Exchange Commission's (SEC) web site at www.sec.gov. You may also call 1-800-544-8544 to request a free copy of the proxy voting guidelines.
Standard & Poor's, S&P and S&P 500 are registered service marks of The McGraw-Hill Companies, Inc. and have been licensed for use by Fidelity Distributors Corporation.
Other third party marks appearing herein are the property of their respective owners.
All other marks appearing herein are registered or unregistered trademarks or service marks of FMR Corp. or an affiliated company.
This report and the financial statements contained herein are submitted for the general information of the shareholders of the funds. This report is not authorized for distribution to prospective investors in the funds unless preceded or accompanied by an effective prospectus.
A fund files its complete schedule of portfolio holdings with the SEC for the first and third quarters of each fiscal year on Form N-Q. Forms N-Q are available on the SEC's web site at http://www.sec.gov. A fund's Forms N-Q may be reviewed and copied at the SEC's Public Reference Room in Washington, DC. Information regarding the operation of the SEC's Public Reference Room may be obtained by calling 1-800-SEC-0330. For a complete list of a fund's portfolio holdings, view the most recent quarterly holdings report, semiannual report, or annual report on Fidelity's web site at http://www.fidelity.com/holdings.
NOT FDIC INSURED · MAY LOSE VALUE · NO BANK GUARANTEE
Neither the funds nor Fidelity Distributors Corporation is a bank.
Semiannual Report
Chairman's Message
(photo_of_Edward_C_Johnson_3d)
Dear Shareholder:
Stock and bond markets around the world have seen largely positive results year to date, although weakness in the technology sector and growth stocks in general have tempered performance. While financial markets are always unpredictable, there are a number of time-tested principles that can put the historical odds in your favor.
One of the basic tenets is to invest for the long term. Over time, riding out the markets' inevitable ups and downs has proven much more effective than selling into panic or chasing the hottest trend. Even missing only a few of the markets' best days can significantly diminish investor returns. Patience also affords the benefits of compounding - of earning interest on additional income or reinvested dividends and capital gains. There are tax advantages and cost benefits to consider as well. The more you sell, the more taxes you pay, and the more you trade, the higher the costs. While staying the course doesn't eliminate risk, it can considerably lessen the effect of short-term declines.
You can further manage your investing risk through diversification. And today, more than ever, geographic diversification should be taken into account. Studies indicate that asset allocation is the single most important determinant of a portfolio's long-term success. The right mix of stocks, bonds and cash - aligned to your particular risk tolerance and investment objective - is very important. Age-appropriate rebalancing is also an essential aspect of asset allocation. For younger investors, an emphasis on equities - which historically have been the best performing asset class over time - is encouraged. As investors near their specific goal, such as retirement or sending a child to college, consideration may be given to replacing volatile assets (e.g. common stocks) with more-stable fixed investments (bonds or savings plans).
A third investment principle - investing regularly - can help lower the average cost of your purchases. Investing a certain amount of money each month or quarter helps ensure you won't pay for all your shares at market highs. This strategy - known as dollar cost averaging - also reduces unconstructive "emotion" from investing, helping shareholders avoid selling weak performers just prior to an upswing, or chasing a hot performer just before a correction.
We invite you to contact us via the Internet, through our Investor Centers or over the phone. It is our privilege to provide you the information you need to make the investments that are right for you.
Sincerely,
/s/Edward C. Johnson 3d
Edward C. Johnson 3d
Semiannual Report
Shareholder Expense Example
As a shareholder of a Fund, you incur two types of costs: (1) transaction costs, and (2) ongoing costs, including management fees and other Fund expenses. This Example is intended to help you understand your ongoing costs (in dollars) of investing in the Funds and to compare these costs with the ongoing costs of investing in other mutual funds.
The Example is based on an investment of $1,000 invested at the beginning of the period and held for the entire period (March 1, 2006 to August 31, 2006).
Actual Expenses
The first line of the accompanying table for each fund provides information about actual account values and actual expenses. You may use the information in this line, together with the amount you invested, to estimate the expenses that you paid over the period. Simply divide your account value by $1,000.00 (for example, an $8,600 account value divided by $1,000.00 = 8.6), then multiply the result by the number in the first line for a fund under the heading entitled "Expenses Paid During Period" to estimate the expenses you paid on your account during this period. A small balance maintenance fee of $12.00 that is charged once a year may apply for certain accounts with a value of less than $2,000. This fee is not included in the table below. If it was, the estimate of expenses you paid during the period would be higher, and your ending account value lower, by this amount.
Hypothetical Example for Comparison Purposes
The second line of the accompanying table for each fund provides information about hypothetical account values and hypothetical expenses based on a fund's actual expense ratio and an assumed rate of return of 5% per year before expenses, which is not the Fund's actual return. The hypothetical account values and expenses may not be used to estimate the actual ending account balance or expenses you paid for the period. You may use this information to compare the ongoing costs of investing in the Fund and other funds. To do so, compare this 5% hypothetical example with the 5% hypothetical examples that appear in the shareholder reports of the other funds. A small balance maintenance fee of $12.00 that is charged once a year may apply for certain accounts with a value of less than $2,000. This fee is not included in the table below. If it was, the estimate of expenses you paid during the period would be higher, and your ending account value lower, by this amount.
Please note that the expenses shown in the table are meant to highlight your ongoing costs only and do not reflect any transaction costs. Therefore, the second line of the table is useful in comparing ongoing costs only, and will not help you determine the relative total costs of owning different funds.
Semiannual Report
| Beginning
Account Value
March 1, 2006 | Ending
Account Value
August 31, 2006 | Expenses Paid
During Period*
March 1, 2006
to August 31, 2006 |
Fidelity California AMT Tax-Free Money Market Fund | | | |
Actual | $ 1,000.00 | $ 1,015.90 | $ 1.78 |
HypotheticalA | $ 1,000.00 | $ 1,023.44 | $ 1.79 |
Fidelity California Municipal Money Market Fund | | | |
Actual | $ 1,000.00 | $ 1,015.20 | $ 2.59 |
HypotheticalA | $ 1,000.00 | $ 1,022.63 | $ 2.60 |
A 5% return per year before expenses
* Expenses are equal to each Fund's annualized expense ratio (shown in the table below); multiplied by the average account value over the period, multiplied by 184/365 (to reflect the one-half year period).
| Annualized
Expense Ratio |
Fidelity California AMT Tax-Free Money Market Fund | .35% |
Fidelity California Municipal Money Market Fund | .51% |
Semiannual Report
Fidelity California AMT Tax-Free Money Market Fund
Investment Changes
Maturity Diversification |
Days | % of fund's investments 8/31/06 | % of fund's investments 2/28/06 | % of fund's investments 8/31/05 |
0 - 30 | 95.5 | 88.2 | 88.7 |
31 - 90 | 0.9 | 5.5 | 5.5 |
91 - 180 | 0.2 | 5.4 | 0.9 |
181 - 397 | 3.4 | 0.9 | 4.9 |
Weighted Average Maturity |
| 8/31/06 | 2/28/06 | 8/31/05 |
Fidelity California AMT Tax-Free Money Market Fund | 17 Days | 18 Days | 24 Days |
California Tax Free Money Market
Funds Average* | 26 Days | 22 Days | 29 Days |
Asset Allocation (% of fund's net assets) |
As of August 31, 2006 | As of February 28, 2006 |
 | Variable Rate
Demand Notes
(VRDNs) 87.9% | | | Variable Rate
Demand Notes
(VRDNs) 71.6% | |
 | Commercial Paper (including
CP Mode) 6.8% | | | Commercial Paper (including
CP Mode) 15.0% | |
 | Tender Bonds 0.6% | | | Tender Bonds 3.5% | |
 | Municipal Notes 3.9% | | | Municipal Notes 3.8% | |
 | Other Investments 0.2% | | | Other Investments 1.5% | |
 | Net Other Assets 0.6% | | | Net Other Assets 4.6% | |

*Source: iMoneyNet, Inc.
Semiannual Report
Fidelity California AMT Tax-Free Money Market Fund
Investments August 31, 2006 (Unaudited)
Showing Percentage of Net Assets
Municipal Securities - 99.4% |
| Principal Amount (000s) | | Value (Note 1) (000s) |
California - 95.4% |
ABAG Fin. Auth. for Nonprofit Corp. Rev. Participating VRDN Series MT 40, 3.47% (Liquidity Facility Merrill Lynch & Co., Inc.) (a)(b) | $ 11,000 | | $ 11,000 |
ABN-AMRO Muni. Tops Ctfs. Trust Participating VRDN Series 06 41, 3.44% (Liquidity Facility ABN-AMRO Bank NV) (a)(b) | 11,475 | | 11,475 |
Alameda Corridor Trans. Auth. Rev. Participating VRDN: | | | |
Series BS 05 222 Class A, 3.52% (Liquidity Facility Bear Stearns Companies, Inc.) (a)(b) | 5,000 | | 5,000 |
Series PZ 51, 3.47% (Liquidity Facility Merrill Lynch & Co., Inc.) (a)(b) | 6,505 | | 6,505 |
Series PZ 61, 3.47% (Liquidity Facility Merrill Lynch & Co., Inc.) (a)(b) | 7,880 | | 7,880 |
Alhambra Ctfs. of Prtn. Participating VRDN Series PT 3457, 3.44% (Liquidity Facility Merrill Lynch & Co., Inc.) (a)(b) | 4,700 | | 4,700 |
Anaheim Pub. Fing. Auth. Lease Rev. Participating VRDN Series PT 2067, 3.44% (Liquidity Facility Merrill Lynch & Co., Inc.) (a)(b) | 5,795 | | 5,795 |
Apple Valley Unified School District Participating VRDN Series Putters 544, 3.44% (Liquidity Facility JPMorgan Chase Bank) (a)(b) | 3,660 | | 3,660 |
Bay Area Toll Auth. Toll Bridge Rev. Participating VRDN: | | | |
Series EGL 06 83 Class A, 3.45% (Liquidity Facility Landesbank Hessen-Thuringen) (a)(b) | 30,000 | | 30,000 |
Series MT 238, 3.68% (Liquidity Facility DEPFA BANK PLC) (a)(b) | 34,130 | | 34,130 |
Series ROC II R 626, 3.44% (Liquidity Facility Citibank NA) (a)(b) | 11,800 | | 11,800 |
Burbank Unified School District Participating VRDN Series PZ 54, 3.47% (Liquidity Facility Merrill Lynch & Co., Inc.) (a)(b) | 6,035 | | 6,035 |
California Dept. of Wtr. Resources Central Valley Proj. Wtr. Sys. Rev.: | | | |
Participating VRDN: | | | |
Series PT 1745, 3.44% (Liquidity Facility Merrill Lynch & Co., Inc.) (a)(b) | 9,505 | | 9,505 |
Series ROC II R1024, 3.44% (Liquidity Facility Citigroup, Inc.) (a)(b) | 13,320 | | 13,320 |
Series 1, 3.45% 9/12/06, CP | 20,937 | | 20,937 |
California Dept. of Wtr. Resources Pwr. Supply Rev.: | | | |
Participating VRDN: | | | |
Series PA 1201R, 3.44% (Liquidity Facility Merrill Lynch & Co., Inc.) (a)(b) | 10,900 | | 10,900 |
Series PT 759, 3.43% (Liquidity Facility Landesbank Hessen-Thuringen) (a)(b) | 10,295 | | 10,295 |
Municipal Securities - continued |
| Principal Amount (000s) | | Value (Note 1) (000s) |
California - continued |
California Dept. of Wtr. Resources Pwr. Supply Rev.: - continued | | | |
Participating VRDN: | | | |
Series Putters 310, 3.44% (Liquidity Facility JPMorgan Chase Bank) (a)(b) | $ 4,995 | | $ 4,995 |
Series Putters 322, 3.44% (Liquidity Facility JPMorgan Chase & Co.) (a)(b) | 5,975 | | 5,975 |
Series 2002 C1, 3.3%, LOC Dexia Cr. Local de France, VRDN (a) | 37,655 | | 37,655 |
Subseries 2005 F3, 3.5%, LOC Bank of New York, New York, LOC California Pub. Employees' Retirement Sys., VRDN (a) | 49,615 | | 49,615 |
Subseries 2005 F4, 3.5%, LOC Bank of America NA, VRDN (a) | 24,525 | | 24,525 |
Subseries 2005 G6, 3.3% (FSA Insured), VRDN (a) | 14,350 | | 14,350 |
Subseries 2005 G8, 3.38% (MBIA Insured), VRDN (a) | 6,060 | | 6,060 |
Subseries F2, 3.52%, LOC JPMorgan Chase Bank, LOC Societe Generale, VRDN (a) | 30,000 | | 30,000 |
California Econ. Recovery: | | | |
Participating VRDN: | | | |
Series MS 929, 3.41% (Liquidity Facility Morgan Stanley) (a)(b) | 7,995 | | 7,995 |
Series PA 1262, 3.44% (Liquidity Facility Merrill Lynch & Co., Inc.) (a)(b) | 7,650 | | 7,650 |
Series PT 2216, 3.44% (Liquidity Facility Merrill Lynch & Co., Inc.) (a)(b) | 5,180 | | 5,180 |
Series PT 965, 3.43% (Liquidity Facility Landesbank Hessen-Thuringen) (a)(b) | 20,000 | | 20,000 |
Series 2004 C10, 3.32%, LOC BNP Paribas SA, VRDN (a) | 7,000 | | 7,000 |
Series 2004 C13, 3.35% (XL Cap. Assurance, Inc. Insured), VRDN (a) | 12,175 | | 12,175 |
California Edl. Facilities Auth. Rev.: | | | |
Participating VRDN: | | | |
MS 1383, 3.41% (Liquidity Facility Morgan Stanley) (a)(b) | 8,630 | | 8,630 |
MS 1384, 3.41% (Liquidity Facility Morgan Stanley) (a)(b) | 8,630 | | 8,630 |
Series EGL 06 31 Class 2003 A, 3.45% (Liquidity Facility Citibank NA) (a)(b) | 15,800 | | 15,800 |
Series MS 1126, 3.41% (Liquidity Facility Morgan Stanley) (a)(b) | 20,690 | | 20,690 |
Series SGB 45, 3.44% (Liquidity Facility Societe Generale) (a)(b) | 5,000 | | 5,000 |
Series Solar 06 65, 3.41% (Liquidity Facility U.S. Bank NA, Minnesota) (a)(b) | 10,360 | | 10,360 |
Series A, 3.29%, VRDN (a) | 20,000 | | 20,000 |
Municipal Securities - continued |
| Principal Amount (000s) | | Value (Note 1) (000s) |
California - continued |
California Gen. Oblig.: | | | |
Bonds: | | | |
Series AAB 00 1, 3.43%, tender 9/7/06 (Liquidity Facility ABN-AMRO Bank NV) (a)(b) | $ 9,900 | | $ 9,900 |
Series MT 171, 3.23%, tender 10/26/06 (Liquidity Facility DEPFA BANK PLC) (a)(b)(c) | 9,895 | | 9,895 |
5% 9/1/06 | 5,425 | | 5,425 |
Participating VRDN: | | | |
MOTC PA 1396, 3.46% (Liquidity Facility Merrill Lynch & Co., Inc.) (a)(b) | 8,400 | | 8,400 |
MS 06 1437, 3.41% (Liquidity Facility Morgan Stanley) (a)(b) | 7,000 | | 7,000 |
Series DB 179, 3.43% (Liquidity Facility Deutsche Bank AG) (a)(b) | 15,920 | | 15,920 |
Series EGL 05 1000 Class A, 3.45% (Liquidity Facility Citibank NA) (a)(b) | 16,090 | | 16,090 |
Series LB 06 FP3, 3.4% (Lehman Brothers Hldgs., Inc. Guaranteed) (Liquidity Facility Lehman Brothers Hldgs., Inc.) (a)(b) | 30,000 | | 30,000 |
Series MACN 06 N, 3.41% (Liquidity Facility Bank of America NA) (a)(b) | 28,865 | | 28,865 |
Series Merlots 02 A17, 3.44% (Liquidity Facility Bank of New York, New York) (a)(b) | 5,725 | | 5,725 |
Series Merlots 03 A45, 3.44% (Liquidity Facility Wachovia Bank NA) (a)(b) | 5,225 | | 5,225 |
Series Merlots B45, 3.44% (Liquidity Facility Wachovia Bank NA) (a)(b) | 37,375 | | 37,375 |
Series MS 1297, 3.41% (Liquidity Facility Morgan Stanley) (a)(b) | 16,275 | | 16,275 |
Series PA 1231, 3.44% (Liquidity Facility Merrill Lynch & Co., Inc.) (a)(b) | 5,940 | | 5,940 |
Series PA 1357, 3.46% (Liquidity Facility Merrill Lynch & Co., Inc.) (a)(b) | 4,165 | | 4,165 |
Series PT 1252, 3.45% (Liquidity Facility Merrill Lynch & Co., Inc.) (a)(b) | 10,100 | | 10,100 |
Series PT 2266, 3.43% (Liquidity Facility Dexia Cr. Local de France) (a)(b) | 7,860 | | 7,860 |
Series PT 2281, 3.44% (Liquidity Facility Merrill Lynch & Co., Inc.) (a)(b) | 5,225 | | 5,225 |
Series PT 2485, 3.44% (Liquidity Facility Merrill Lynch & Co., Inc.) (a)(b) | 2,075 | | 2,075 |
Series PT 964, 3.43% (Liquidity Facility Landesbank Hessen-Thuringen) (a)(b) | 4,995 | | 4,995 |
Municipal Securities - continued |
| Principal Amount (000s) | | Value (Note 1) (000s) |
California - continued |
California Gen. Oblig.: - continued | | | |
Participating VRDN: | | | |
Series PT 990, 3.43% (Liquidity Facility BNP Paribas SA) (a)(b) | $ 6,700 | | $ 6,700 |
Series Putters 1256, 3.44% (Liquidity Facility JPMorgan Chase Bank) (a)(b) | 5,425 | | 5,425 |
Series Putters 1267, 3.44% (Liquidity Facility JPMorgan Chase Bank) (a)(b) | 6,600 | | 6,600 |
Series Putters 482, 3.44% (Liquidity Facility JPMorgan Chase Bank) (a)(b) | 7,495 | | 7,495 |
Series Putters 519, 3.44% (Liquidity Facility JPMorgan Chase Bank) (a)(b) | 4,995 | | 4,995 |
Series Putters 556Z, 3.44% (Liquidity Facility JPMorgan Chase Bank) (a)(b) | 7,450 | | 7,450 |
Series SG 84, 3.43% (Liquidity Facility Societe Generale) (a)(b) | 1,660 | | 1,660 |
Series SGA 55, 3.44% (Liquidity Facility Societe Generale) (a)(b) | 9,050 | | 9,050 |
Series SGB 62, 3.44% (Liquidity Facility Societe Generale) (a)(b) | 30,000 | | 30,000 |
Series SGB 7, 3.44% (Liquidity Facility Societe Generale) (a)(b) | 8,775 | | 8,775 |
Series SGC 06 2 Class A, 3.44% (Liquidity Facility Societe Generale) (a)(b) | 4,700 | | 4,700 |
Series Solar 05 4, 3.4% (Liquidity Facility U.S. Bank NA, Minnesota) (a)(b) | 15,000 | | 15,000 |
3.41% 9/11/06 (Liquidity Facility Bank of Nova Scotia, New York Agcy.) (Liquidity Facility Societe Generale), CP | 30,000 | | 30,000 |
3.46% 9/5/06 (Liquidity Facility Bank of Nova Scotia, New York Agcy.) (Liquidity Facility Societe Generale), CP | 40,000 | | 40,000 |
3.55% 9/12/06 (Liquidity Facility Bank of Nova Scotia, New York Agcy.) (Liquidity Facility Societe Generale), CP | 22,700 | | 22,700 |
California Health Facilities Fing. Auth. Rev.: | | | |
Bonds (Kaiser Permanent Health Sys. Proj.) Series E, 3.48% tender 9/12/06, CP mode | 9,500 | | 9,500 |
Participating VRDN Series MS 01 592, 3.45% (Liquidity Facility Morgan Stanley) (a)(b) | 11,170 | | 11,170 |
California Hsg. Fin. Agcy. Home Mtg. Rev. Participating VRDN Series MT 85, 3.45% (Liquidity Facility Lloyds TSB Bank PLC) (a)(b) | 4,460 | | 4,460 |
California Infrastructure & Econ. Dev. Bank Rev.: | | | |
Participating VRDN: | | | |
PT 3501, 3.43% (Liquidity Facility Dexia Cr. Local de France) (a)(b) | 6,875 | | 6,875 |
Municipal Securities - continued |
| Principal Amount (000s) | | Value (Note 1) (000s) |
California - continued |
California Infrastructure & Econ. Dev. Bank Rev.: - continued | | | |
Participating VRDN: | | | |
Series EGL 04 28 Class A, 3.45% (Liquidity Facility Landesbank Hessen-Thuringen) (a)(b) | $ 9,425 | | $ 9,425 |
Series MS 06 1362, 3.41% (Liquidity Facility Morgan Stanley) (a)(b) | 32,000 | | 32,000 |
Series PA 1193, 3.44% (Liquidity Facility Merrill Lynch & Co., Inc.) (a)(b) | 6,285 | | 6,285 |
Series Putters 492, 3.44% (Liquidity Facility JPMorgan Chase Bank) (a)(b) | 9,825 | | 9,825 |
Series SG 172, 3.43% (Liquidity Facility Societe Generale) (a)(b) | 18,900 | | 18,900 |
3.3%, LOC Bank of America NA, VRDN (a) | 5,000 | | 5,000 |
California Poll. Cont. Fing. Auth. Ctfs. of Prtn. (Pacific Gas & Elec. Co. Proj.) Series 1996 E, 3.51%, LOC JPMorgan Chase Bank, VRDN (a) | 32,000 | | 32,000 |
California Pub. Works Board Lease Rev. Participating VRDN: | | | |
Series MSTC 9052, 3.44% (Liquidity Facility Bear Stearns Companies, Inc.) (a)(b) | 8,990 | | 8,990 |
Series Putters 609, 3.44% (Liquidity Facility JPMorgan Chase & Co.) (a)(b) | 1,095 | | 1,095 |
California School Cash Reserve Prog. TRAN Series A, 4.5% 7/6/07 (AMBAC Insured) | 18,000 | | 18,147 |
California State Univ. Rev. & Colleges: | | | |
Participating VRDN: | | | |
MS 06 1411, 3.41% (Liquidity Facility Morgan Stanley) (a)(b) | 4,000 | | 4,000 |
Series SG 170, 3.43% (Liquidity Facility Societe Generale) (a)(b) | 13,300 | | 13,300 |
Series 2001 A, 3.42% 9/1/06, LOC JPMorgan Chase Bank, LOC State Street Bank & Trust Co., Boston, CP | 6,895 | | 6,895 |
California Statewide Cmntys. Dev. Auth. Rev.: | | | |
Participating VRDN Series Putters 1425, 3.44% (Liquidity Facility JPMorgan Chase Bank) (a)(b) | 4,900 | | 4,900 |
(Kaiser Permanent Health Sys. Proj.) Series C, 3.35%, VRDN (a) | 14,360 | | 14,360 |
(Kaiser Permanente Health Sys. Proj.): | | | |
Series 2002 B, 3.32%, VRDN (a) | 67,350 | | 67,350 |
Series 2003 A, 3.32%, VRDN (a) | 37,000 | | 37,000 |
Series 2004 M, 3.32%, VRDN (a) | 58,650 | | 58,650 |
(Nat'l. Ctr. For Int'l. School Proj.) Series A, 3.36%, LOC Allied Irish Banks PLC, VRDN (a) | 5,000 | | 5,000 |
Municipal Securities - continued |
| Principal Amount (000s) | | Value (Note 1) (000s) |
California - continued |
California Statewide Cmntys. Dev. Auth. Rev. Ctfs. of Prtn. Participating VRDN Series Merlots 99 E, 3.44% (Liquidity Facility Wachovia Bank NA) (a)(b) | $ 5,000 | | $ 5,000 |
Carson Redev. Agcy. Participating VRDN Series PT 2346, 3.44% (Liquidity Facility Merrill Lynch & Co., Inc.) (a)(b) | 7,750 | | 7,750 |
Clovis Unified School District Participating VRDN: | | | |
Series PZ 42, 3.48% (Liquidity Facility Merrill Lynch & Co., Inc.) (a)(b) | 1,500 | | 1,500 |
Series PZ 75, 3.47% (Liquidity Facility Merrill Lynch & Co., Inc.) (a)(b) | 6,190 | | 6,190 |
Contra Costa County Gen. Oblig. TRAN 4.5% 12/7/06 | 6,285 | | 6,297 |
Contra Costa Wtr. District Wtr. Rev. Participating VRDN
Series PT 1666, 3.44% (Liquidity Facility Merrill Lynch & Co., Inc.) (a)(b) | 5,615 | | 5,615 |
Culver City School Facilities Fing. Auth. Participating VRDN Series Merlots 05 A24, 3.44% (Liquidity Facility Wachovia Bank NA) (a)(b) | 11,995 | | 11,995 |
Desert Sands Unified School District Participating VRDN
Series ROCS RR II R 6086, 3.44% (Liquidity Facility Citigroup, Inc.) (a)(b) | 1,900 | | 1,900 |
East Bay Muni. Util. District Wtr. Sys. Rev.: | | | |
Participating VRDN: | | | |
Series EGL 06 80 Class A, 3.45% (Liquidity Facility Citibank NA) (a)(b) | 9,870 | | 9,870 |
Series EGL 7053015 Class A, 3.45% (Liquidity Facility Citibank NA) (a)(b) | 21,430 | | 21,430 |
Series EGL 720050045 Class A, 3.45% (Liquidity Facility Citibank NA) (a)(b) | 19,800 | | 19,800 |
Series 1998, 3.4% 9/6/06, CP | 7,000 | | 7,000 |
Eclipse Fdg. Trust Participating VRDN Series Solar 06 97, 3.4% (Liquidity Facility U.S. Bank NA, Minnesota) (a)(b) | 14,385 | | 14,385 |
El Camino Cmnty. College District Participating VRDN
Series PT 2058, 3.44% (Liquidity Facility Merrill Lynch & Co., Inc.) (a)(b) | 5,365 | | 5,365 |
Foothill-De Anza Cmnty. College District Participating VRDN: | | | |
Series Merlots 00 YY, 3.44% (Liquidity Facility Wachovia Bank NA) (a)(b) | 11,695 | | 11,695 |
Series PZ 57, 3.47% (Liquidity Facility BNP Paribas SA) (a)(b) | 7,115 | | 7,115 |
Foothill/Eastern Trans. Corridor Agcy. Toll Road Rev. Participating VRDN: | | | |
Series PZ 41, 3.47% (Liquidity Facility Merrill Lynch & Co., Inc.) (a)(b) | 3,880 | | 3,880 |
Municipal Securities - continued |
| Principal Amount (000s) | | Value (Note 1) (000s) |
California - continued |
Foothill/Eastern Trans. Corridor Agcy. Toll Road Rev. Participating VRDN: - continued | | | |
Series PZ 96, 3.48% (Liquidity Facility Merrill Lynch & Co., Inc.) (a)(b) | $ 5,875 | | $ 5,875 |
Fresno Unified School District Participating VRDN Series DB 109, 3.43% (Liquidity Facility Deutsche Bank AG) (a)(b) | 6,170 | | 6,170 |
Gavilan Joint Cmnty. College District Participating VRDN: | | | |
Series Putters 587Z, 3.44% (Liquidity Facility JPMorgan Chase Bank) (a)(b) | 5,010 | | 5,010 |
Series ROC II R 2123, 3.44% (Liquidity Facility Citigroup, Inc.) (a)(b) | 6,805 | | 6,805 |
Golden State Tobacco Securitization Corp. Participating VRDN: | | | |
Series Best 05 230, 3.52% (Liquidity Facility Bear Stearns Companies, Inc.) (a)(b) | 3,760 | | 3,760 |
Series LB 05 FC1, 3.4% (Lehman Brothers Hldgs., Inc. Guaranteed) (Liquidity Facility Lehman Brothers Hldgs., Inc.) (a)(b) | 10,000 | | 10,000 |
Series LB 05 FC2, 3.4% (Lehman Brothers Hldgs., Inc. Guaranteed) (Liquidity Facility Lehman Brothers Hldgs., Inc.) (a)(b) | 20,345 | | 20,345 |
Series MS 1220, 3.41% (Liquidity Facility Morgan Stanley) (a)(b) | 16,000 | | 16,000 |
Series MS 1271, 3.41% (Liquidity Facility Morgan Stanley) (a)(b) | 15,410 | | 15,410 |
Series MS 1298, 3.41% (Liquidity Facility Morgan Stanley) (a)(b) | 27,750 | | 27,750 |
Series MSTC 238, 3.52% (Liquidity Facility Bear Stearns Companies, Inc.) (a)(b) | 4,065 | | 4,065 |
Series PA 1237, 3.47% (Liquidity Facility Merrill Lynch & Co., Inc.) (a)(b) | 2,740 | | 2,740 |
Series PT 3572, 3.47% (Liquidity Facility Merrill Lynch & Co., Inc.) (a)(b) | 2,080 | | 2,080 |
Series PZ 86, 3.47% (Liquidity Facility Merrill Lynch & Co., Inc.) (a)(b) | 4,620 | | 4,620 |
Series ROC II R287X, 3.46% (Liquidity Facility Citibank NA) (a)(b) | 3,535 | | 3,535 |
Series ROC II R443CE, 3.46% (Liquidity Facility Citibank NA) (a)(b) | 3,400 | | 3,400 |
Series ROC II R509, 3.44% (Liquidity Facility Citibank NA) (a)(b) | 8,000 | | 8,000 |
Series ROC RR II R 611, 3.44% (Liquidity Facility Citibank NA) (a)(b) | 9,600 | | 9,600 |
Municipal Securities - continued |
| Principal Amount (000s) | | Value (Note 1) (000s) |
California - continued |
Golden State Tobacco Securitization Corp. Participating VRDN: - continued | | | |
Series Stars 06 144, 3.44% (Liquidity Facility BNP Paribas SA) (a)(b) | $ 31,300 | | $ 31,300 |
Series TOC 04 B, 3.44% (Liquidity Facility Goldman Sachs Group, Inc.) (a)(b) | 7,500 | | 7,500 |
Series TOC 06 Z4, 3.47% (Liquidity Facility Goldman Sachs Group, Inc.) (a)(b) | 5,050 | | 5,050 |
Series TOC 06 Z5, 3.47% (Liquidity Facility Goldman Sachs Group, Inc.) (a)(b) | 2,535 | | 2,535 |
Golden West Schools Fing. Auth. Participating VRDN Series PT 3016, 3.43% (Liquidity Facility Dexia Cr. Local de France) (a)(b) | 8,870 | | 8,870 |
Grossmont Union High School District Participating VRDN Series PT 3489, 3.44% (Liquidity Facility Merrill Lynch & Co., Inc.) (a)(b) | 6,800 | | 6,800 |
Grossmont-Cuyamaca Cmnty. College District Participating VRDN Series MS 1130, 3.41% (Liquidity Facility Morgan Stanley) (a)(b) | 7,790 | | 7,790 |
Irvine Impt. Bond Act of 1915 Series A, 3.45%, LOC Bank of New York, New York, LOC California Teachers Retirement Sys., VRDN (a) | 11,490 | | 11,490 |
Los Angeles County Gen. Oblig.: | | | |
TRAN Series A, 4.5% 6/29/07 | 15,000 | | 15,119 |
3.46% 9/5/06, LOC WestLB AG, LOC Bayerische Landesbank Girozentrale, CP | 1,250 | | 1,250 |
Los Angeles County Metropolitan Trans. Auth. Sales Tax Rev. Participating VRDN: | | | |
Series EGL 04 46 Class A, 3.45% (Liquidity Facility Citibank NA) (a)(b) | 9,700 | | 9,700 |
Series PT 3553, 3.44% (Liquidity Facility Merrill Lynch & Co., Inc.) (a)(b) | 4,450 | | 4,450 |
Los Angeles County Pub. Works Fing. Auth. Lease Rev. Participating VRDN Series Merlots 00 JJJ, 3.44% (Liquidity Facility Wachovia Bank NA) (a)(b) | 13,830 | | 13,830 |
Los Angeles County Sanitation District Fin. Auth. Rev. Participating VRDN Series Solar 06 55, 3.4% (Liquidity Facility U.S. Bank NA, Minnesota) (a)(b) | 10,705 | | 10,705 |
Los Angeles Dept. of Wtr. & Pwr. Rev.: | | | |
Participating VRDN: | | | |
Series EGL 7053026 Class A, 3.45% (Liquidity Facility Landesbank Hessen-Thuringen) (a)(b) | 18,000 | | 18,000 |
Series PA 1192, 3.45% (Liquidity Facility Merrill Lynch & Co., Inc.) (a)(b) | 7,980 | | 7,980 |
Municipal Securities - continued |
| Principal Amount (000s) | | Value (Note 1) (000s) |
California - continued |
Los Angeles Dept. of Wtr. & Pwr. Rev.: - continued | | | |
Participating VRDN: | | | |
Series PT 2286, 3.44% (Liquidity Facility Merrill Lynch & Co., Inc.) (a)(b) | $ 5,535 | | $ 5,535 |
Series Putters 1302Z, 3.44% (Liquidity Facility JPMorgan Chase Bank) (a)(b) | 7,495 | | 7,495 |
Series ROC II R3010, 3.44% (Liquidity Facility Citigroup, Inc.) (a)(b) | 5,110 | | 5,110 |
Series Solar 06 37, 3.41% (Liquidity Facility U.S. Bank NA, Minnesota) (a)(b) | 8,500 | | 8,500 |
Series 2001 B2, 3.33% (Liquidity Facility Bank of America NA) (Liquidity Facility Bayerische Landesbank Girozentrale), VRDN (a) | 11,365 | | 11,365 |
Los Angeles Dept. of Wtr. & Pwr. Wtrwks. Rev. Participating VRDN: | | | |
Series EGL 06 0067, 3.45% (Liquidity Facility Citibank NA) (a)(b) | 24,000 | | 24,000 |
Series Merlots 99 L, 3.44% (Liquidity Facility Wachovia Bank NA) (a)(b) | 8,500 | | 8,500 |
Series Solar 06 48, 3.43% (Liquidity Facility U.S. Bank NA, Minnesota) (a)(b) | 15,675 | | 15,675 |
Los Angeles Gen. Oblig.: | | | |
Participating VRDN Series PT 1476, 3.44% (Liquidity Facility Merrill Lynch & Co., Inc.) (a)(b) | 5,355 | | 5,355 |
TRAN 4.5% 6/29/07 | 54,000 | | 54,326 |
Los Angeles Muni. Impt. Corp. Lease Rev.: | | | |
Participating VRDN Series PT 1405, 3.44% (Liquidity Facility Merrill Lynch & Co., Inc.) (a)(b) | 8,125 | | 8,125 |
Series 2004 A1, 3.65% 9/12/06, LOC Bank of America NA, CP | 1,500 | | 1,500 |
Los Angeles Unified School District: | | | |
Participating VRDN: | | | |
Series EGL 06 88 Class A, 3.45% (Liquidity Facility Landesbank Hessen-Thuringen) (a)(b) | 4,515 | | 4,515 |
Series MSTC 01 135, 3.57% (Liquidity Facility Bear Stearns Companies, Inc.) (a)(b) | 9,195 | | 9,195 |
Series PT 1763, 3.44% (Liquidity Facility Merrill Lynch & Co., Inc.) (a)(b) | 16,740 | | 16,740 |
Series PT 2196, 3.44% (Liquidity Facility Merrill Lynch & Co., Inc.) (a)(b) | 9,625 | | 9,625 |
Series PT 3373, 3.43% (Liquidity Facility DEPFA BANK PLC) (a)(b) | 28,410 | | 28,410 |
Municipal Securities - continued |
| Principal Amount (000s) | | Value (Note 1) (000s) |
California - continued |
Los Angeles Unified School District: - continued | | | |
Participating VRDN: | | | |
Series PT 3382, 3.44% (Liquidity Facility Merrill Lynch & Co., Inc.) (a)(b) | $ 5,965 | | $ 5,965 |
Series PT 3409, 3.44% (Liquidity Facility Merrill Lynch & Co., Inc.) (a)(b) | 4,050 | | 4,050 |
Series PT 3553, 3.44% (Liquidity Facility Merrill Lynch & Co., Inc.) (a)(b) | 8,300 | | 8,300 |
Series Putters 488, 3.44% (Liquidity Facility JPMorgan Chase Bank) (a)(b) | 17,915 | | 17,915 |
Series ROC RR II 7029, 3.44% (Liquidity Facility Citigroup, Inc.) (a)(b) | 9,270 | | 9,270 |
Series SG 162, 3.43% (Liquidity Facility Societe Generale) (a)(b) | 28,105 | | 28,105 |
Series SGA 144, 3.44% (Liquidity Facility Societe Generale) (a)(b) | 2,500 | | 2,500 |
Series Solar 06 18, 3.43% (Liquidity Facility U.S. Bank NA, Minnesota) (a)(b) | 5,260 | | 5,260 |
TRAN Series A, 4.25% 10/18/06 | 7,300 | | 7,305 |
Los Angeles Wastewtr. Sys. Rev. Participating VRDN: | | | |
Series EGL 7053003 Class A, 3.45% (Liquidity Facility Citibank NA) (a)(b) | 11,000 | | 11,000 |
Series ROC II R4034, 3.44% (Liquidity Facility Citigroup, Inc.) (a)(b) | 4,935 | | 4,935 |
Madera Irr Fing. Auth. Wtr. Rev. (Madera Irrigation District Proj.) Series A, 3.45% (XL Cap. Assurance, Inc. Insured), VRDN (a) | 12,905 | | 12,905 |
Manteca Redev. Agcy. Tax Allocation Rev. 3.45% (XL Cap. Assurance, Inc. Insured), VRDN (a) | 26,450 | | 26,450 |
Merced Irrigation District Elec. Sys. Rev. Participating VRDN Series ROC II R512, 3.44% (Liquidity Facility Citibank NA) (a)(b) | 3,250 | | 3,250 |
Metropolitan Wtr. District Southern California Wtrwks. Rev. Participating VRDN: | | | |
Series FRRI 00 A6, 3.38% (Liquidity Facility Bayerische Hypo-und Vereinsbank AG) (a)(b) | 1,700 | | 1,700 |
Series Merlots 99 O, 3.44% (Liquidity Facility Wachovia Bank NA) (a)(b) | 11,880 | | 11,880 |
Series MSTC 01 113A, 3.44% (Liquidity Facility Bear Stearns Companies, Inc.) (a)(b) | 7,990 | | 7,990 |
Series PA 837, 3.45% (Liquidity Facility Merrill Lynch & Co., Inc.) (a)(b) | 4,995 | | 4,995 |
Modesto Irrigation District Fing. Auth. Rev. Participating VRDN Series SG 66, 3.43% (Liquidity Facility Societe Generale) (a)(b) | 2,500 | | 2,500 |
Municipal Securities - continued |
| Principal Amount (000s) | | Value (Note 1) (000s) |
California - continued |
Murrieta Valley Unified School District Participating VRDN Series MS 06 1471, 3.41% (Liquidity Facility Morgan Stanley) (a)(b) | $ 8,295 | | $ 8,295 |
North Orange County Cmnty. College District Rev. Participating VRDN: | | | |
Series MSTC 9042, 3.44% (Liquidity Facility Bear Stearns Companies, Inc.) (a)(b) | 4,100 | | 4,100 |
Series PT 1434, 3.44% (Liquidity Facility Merrill Lynch & Co., Inc.) (a)(b) | 7,695 | | 7,695 |
Northern California Pwr. Agcy. Pub. Pwr. Rev. Participating VRDN Series MS 01 836, 3.41% (Liquidity Facility Morgan Stanley) (a)(b) | 5,495 | | 5,495 |
Northern California Transmission Auth. Rev. Series B, 3.59% 9/5/06, LOC WestLB AG, CP | 9,770 | | 9,770 |
Norwalk- Mirada Unified School District Participating VRDN Series SG 169, 3.43% (Liquidity Facility Societe Generale) (a)(b) | 12,000 | | 12,000 |
Oak Grove School District Participating VRDN Series ROC II R7527, 3.44% (Liquidity Facility Citigroup, Inc.) (a)(b) | 9,920 | | 9,920 |
Oakland Gen. Oblig. Participating VRDN: | | | |
Series Merlots 00 A, 3.44% (Liquidity Facility Wachovia Bank NA) (a)(b) | 3,000 | | 3,000 |
Series PT 959, 3.44% (Liquidity Facility Merrill Lynch & Co., Inc.) (a)(b) | 4,300 | | 4,300 |
Oakland Joint Powers Fing. Auth. Participating VRDN Series Putters 1253, 3.44% (Liquidity Facility JPMorgan Chase Bank) (a)(b) | 4,215 | | 4,215 |
Oxnard Fing. Auth. Wtr. Rev. Participating VRDN: | | | |
Series SG 174, 3.45% (Liquidity Facility Societe Generale) (a)(b) | 4,960 | | 4,960 |
Series Solar 06 85, 3.4% (Liquidity Facility U.S. Bank NA, Minnesota) (a)(b) | 12,000 | | 12,000 |
Pasadena Elec. Rev. Participating VRDN Series PT 2282, 3.44% (Liquidity Facility Merrill Lynch & Co., Inc.) (a)(b) | 5,285 | | 5,285 |
Poway Redev. Agcy. Tax Allocation Rev. Participating VRDN: | | | |
Series Putters 372, 3.44% (Liquidity Facility JPMorgan Chase Bank) (a)(b) | 11,085 | | 11,085 |
Series ROC II R2046, 3.44% (Liquidity Facility Citigroup, Inc.) (a)(b) | 4,255 | | 4,255 |
Puttable Floating Option Tax Receipts Participating VRDN: | | | |
Series PZP 13, 3.49% (Liquidity Facility Merrill Lynch & Co., Inc.) (a)(b) | 10,380 | | 10,380 |
Series PZP 14, 3.49% (Liquidity Facility Merrill Lynch & Co., Inc.) (a)(b) | 6,760 | | 6,760 |
Municipal Securities - continued |
| Principal Amount (000s) | | Value (Note 1) (000s) |
California - continued |
Puttable Floating Option Tax Receipts Participating VRDN: - continued | | | |
Series PZP 2, 3.49% (Liquidity Facility Merrill Lynch & Co., Inc.) (a)(b) | $ 7,275 | | $ 7,275 |
Series PZP 9, 3.49% (Liquidity Facility Merrill Lynch & Co., Inc.) (a)(b) | 5,860 | | 5,860 |
Riverside County Gen. Oblig. Series 2005 B1, 3.55% 9/21/06, LOC WestLB AG, CP | 12,200 | | 12,200 |
Sacramento City Fing. Auth. Rev. Participating VRDN Series PZ 93, 3.47% (Liquidity Facility Merrill Lynch & Co., Inc.) (a)(b) | 5,230 | | 5,230 |
Sacramento County Sanitation District Fing. Auth. Rev. Participating VRDN: | | | |
Series EGL 04 47 Class A, 3.45% (Liquidity Facility Citibank NA) (a)(b) | 15,200 | | 15,200 |
Series Putters 1407, 3.44% (Liquidity Facility JPMorgan Chase Bank) (a)(b) | 1,450 | | 1,450 |
Sacramento County Wtr. Fing. Auth. Participating VRDN Series PA 1176, 3.44% (Liquidity Facility Merrill Lynch & Co., Inc.) (a)(b) | 4,000 | | 4,000 |
Sacramento Muni. Util. District Elec. Rev. Participating VRDN: | | | |
Series BA 02 M, 3.41% (Liquidity Facility Bank of America NA) (a)(b) | 3,975 | | 3,975 |
Series PT 2140, 3.44% (Liquidity Facility Merrill Lynch & Co., Inc.) (a)(b) | 7,200 | | 7,200 |
Series PT 2215, 3.44% (Liquidity Facility Merrill Lynch & Co., Inc.) (a)(b) | 5,645 | | 5,645 |
Series Putters 591, 3.44% (Liquidity Facility JPMorgan Chase & Co.) (a)(b) | 2,180 | | 2,180 |
Sacramento Muni. Util. District Fing. Auth. Rev. Participating VRDN Series Putters 1237Z, 3.44% (Liquidity Facility JPMorgan Chase Bank) (a)(b) | 10,475 | | 10,475 |
San Diego Unified School District Participating VRDN: | | | |
Series MS 01 847, 3.41% (Liquidity Facility Morgan Stanley) (a)(b) | 8,220 | | 8,220 |
Series MS 965, 3.41% (Liquidity Facility Morgan Stanley) (a)(b) | 4,015 | | 4,015 |
Series PA 1245, 3.44% (Liquidity Facility Merrill Lynch & Co., Inc.) (a)(b) | 1,335 | | 1,335 |
Series ROC II R1067, 3.44% (Liquidity Facility Citigroup, Inc.) (a)(b) | 3,475 | | 3,475 |
San Francisco Bay Area Rapid Trans. District Sales Tax Rev. Participating VRDN Series MS 06 1318X, 3.41% (Liquidity Facility Morgan Stanley) (a)(b) | 7,965 | | 7,965 |
Municipal Securities - continued |
| Principal Amount (000s) | | Value (Note 1) (000s) |
California - continued |
San Francisco Bldg. Auth. Lease Rev. Participating VRDN Series PT 3461, 3.44% (Liquidity Facility Merrill Lynch & Co., Inc.) (a)(b) | $ 3,900 | | $ 3,900 |
San Francisco City & County Pub. Util. Commission Wtr. Rev. Participating VRDN: | | | |
Series MS 06 1321, 3.41% (Liquidity Facility Morgan Stanley) (a)(b) | 5,000 | | 5,000 |
Series ROC II R 6085, 3.44% (Liquidity Facility Citigroup, Inc.) (a)(b) | 2,080 | | 2,080 |
San Francisco County Trans. Auth.: | | | |
Series 2004A, 3.4% 9/6/06 (Liquidity Facility Landesbank Baden-Wuert), CP | 7,000 | | 7,000 |
Series B, 3.41% 9/6/06 (Liquidity Facility Landesbank Baden-Wuert), CP | 7,500 | | 7,500 |
San Gabriel Valley Govts. 3.59% 9/5/06, LOC Bayerische Landesbank Girozentrale, CP | 26,000 | | 26,000 |
San Joaquin Hills Trans. Corridor Agcy. Toll Road Rev. Participating VRDN: | | | |
Series Putters 1409, 3.48% (Liquidity Facility JPMorgan Chase Bank) (a)(b) | 2,800 | | 2,800 |
Series TOC 06 Z17, 3.47% (Liquidity Facility Goldman Sachs Group, Inc.) (a)(b) | 7,875 | | 7,875 |
San Jose Evergreen Cmnty. College District Participating VRDN Series MS 06 1328, 3.41% (Liquidity Facility Morgan Stanley) (a)(b) | 8,015 | | 8,015 |
San Jose Fing. Auth. Lease Rev. Participating VRDN Series Putters 1280Z, 3.44% (Liquidity Facility JPMorgan Chase Bank) (a)(b) | 3,700 | | 3,700 |
San Jose Redev. Agcy. Tax Allocation Participating VRDN: | | | |
Series MS 02 749, 3.41% (Liquidity Facility Morgan Stanley) (a)(b) | 6,495 | | 6,495 |
Series PT 3410, 3.44% (Liquidity Facility Merrill Lynch & Co., Inc.) (a)(b) | 7,955 | | 7,955 |
Series Putters 575, 3.44% (Liquidity Facility JPMorgan Chase & Co.) (a)(b) | 2,560 | | 2,560 |
San Jose Unified School District, Santa Clara County Participating VRDN: | | | |
Series PT 3497, 3.45% (Liquidity Facility Merrill Lynch & Co., Inc.) (a)(b) | 4,120 | | 4,120 |
Series PZ 115, 3.47% (Liquidity Facility Merrill Lynch & Co., Inc.) (a)(b) | 1,420 | | 1,420 |
Municipal Securities - continued |
| Principal Amount (000s) | | Value (Note 1) (000s) |
California - continued |
San Marcos Pub. Facilities Auth. Tax Allocation Rev. Participating VRDN: | | | |
Series ROC II R2027, 3.44% (Liquidity Facility Citigroup, Inc.) (a)(b) | $ 5,620 | | $ 5,620 |
Series Solar 06 52, 3.41% (Liquidity Facility U.S. Bank NA, Minnesota) (a)(b) | 10,735 | | 10,735 |
San Mateo County Cmnty. College District Participating VRDN Series MSTC 3003, 3.52% (Liquidity Facility Bear Stearns Companies, Inc.) (a)(b) | 5,405 | | 5,405 |
Santa Clara Valley Wtr. District Ctfs. of Prtn. Participating VRDN Series Merlots 00 MM, 3.44% (Liquidity Facility Wachovia Bank NA) (a)(b) | 8,900 | | 8,900 |
Santa Cruz County Redev. Agcy. Participating VRDN Series Solar 06 31, 3.41% (Liquidity Facility U.S. Bank NA, Minnesota) (a)(b) | 14,770 | | 14,770 |
Santa Rosa High School District Participating VRDN Series PT 2193, 3.44% (Liquidity Facility Merrill Lynch & Co., Inc.) (a)(b) | 4,120 | | 4,120 |
Santa Rosa Wastewtr. Rev. Participating VRDN Series PZ 43, 3.47% (Liquidity Facility Merrill Lynch & Co., Inc.) (a)(b) | 5,700 | | 5,700 |
Sequoia Union High School District Bonds Series AAB 03 2, 3.44%, tender 9/7/06 (Liquidity Facility ABN-AMRO Bank NV) (a)(b) | 5,900 | | 5,900 |
South San Francisco Redev. Agcy. Tax Allocation Rev. Participating VRDN Series Solar 06 67, 3.41% (Liquidity Facility U.S. Bank NA, Minnesota) (a)(b) | 13,920 | | 13,920 |
Southern California Pub. Pwr. Auth. Rev. Participating VRDN Series MS 1045, 3.41% (Liquidity Facility Morgan Stanley) (a)(b) | 5,470 | | 5,470 |
Southern California Pub. Pwr. Auth. Transmission Proj. Rev. (Southern California Transmission Proj.) 3.32% (FSA Insured), VRDN (a) | 4,900 | | 4,900 |
Sunnyvale School District Participating VRDN Series Putters 800, 3.44% (Liquidity Facility JPMorgan Chase & Co.) (a)(b) | 7,660 | | 7,660 |
Univ. of California Revs. Participating VRDN: | | | |
Series EGL 7050084 Class A, 3.45% (Liquidity Facility Citibank NA) (a)(b) | 9,000 | | 9,000 |
Series Merlots 97 G, 3.44% (Liquidity Facility Wachovia Bank NA) (a)(b) | 20,000 | | 20,000 |
Series MS 1210, 3.41% (Liquidity Facility Morgan Stanley) (a)(b) | 7,305 | | 7,305 |
Series MS 1274, 3.41% (Liquidity Facility Morgan Stanley) (a)(b) | 15,150 | | 15,150 |
Series MSDW 00 480, 3.41% (Liquidity Facility Morgan Stanley) (a)(b) | 3,580 | | 3,580 |
Municipal Securities - continued |
| Principal Amount (000s) | | Value (Note 1) (000s) |
California - continued |
Univ. of California Revs. Participating VRDN: - continued | | | |
Series PA 1168, 3.44% (Liquidity Facility Merrill Lynch & Co., Inc.) (a)(b) | $ 20,045 | | $ 20,045 |
Series Solar 06 39, 3.4% (Liquidity Facility U.S. Bank NA, Minnesota) (a)(b) | 10,335 | | 10,335 |
Vallejo City Unified School District Participating VRDN Series PT 1664, 3.44% (Liquidity Facility Merrill Lynch & Co., Inc.) (a)(b) | 11,770 | | 11,770 |
Ventura County Gen. Oblig. TRAN 4.5% 7/2/07 | 10,000 | | 10,064 |
| | 2,737,905 |
Puerto Rico - 4.0% |
Puerto Rico Commonwealth Gen. Oblig. Participating VRDN Series Floater 53G, 3.44% (Liquidity Facility Goldman Sachs Group, Inc.) (a)(b) | 11,000 | | 11,000 |
Puerto Rico Commonwealth Hwy. & Trans. Auth. Trans. Rev. Participating VRDN: | | | |
Series MACN 06 M, 3.41% (Liquidity Facility Bank of America NA) (a)(b) | 7,375 | | 7,375 |
Series Macon 06 R, 3.41% (Liquidity Facility Bank of America NA) (a)(b) | 13,200 | | 13,200 |
Series PA 1052, 3.43% (Liquidity Facility Merrill Lynch & Co., Inc.) (a)(b) | 9,195 | | 9,195 |
Series PA 1380R, 3.4% (Liquidity Facility Merrill Lynch & Co., Inc.) (a)(b) | 10,395 | | 10,395 |
Puerto Rico Commonwealth Infrastructure Fing. Auth.: | | | |
Bonds Series MT 165, 3.15%, tender 10/12/06 (Liquidity Facility Merrill Lynch & Co., Inc.) (a)(b)(c) | 9,110 | | 9,110 |
Participating VRDN Series LB 06 K55, 3.42% (Liquidity Facility Lehman Brothers Hldgs., Inc.) (a)(b) | 5,700 | | 5,700 |
Puerto Rico Elec. Pwr. Auth. Pwr. Rev. Participating VRDN Series MS 1276, 3.41% (Liquidity Facility Morgan Stanley) (a)(b) | 15,729 | | 15,729 |
Municipal Securities - continued |
| Principal Amount (000s) | | Value (Note 1) (000s) |
Puerto Rico - continued |
Puerto Rico Govt. Dev. Bank Participating VRDN Series LB 06 F5, 3.42% (Lehman Brothers Hldgs., Inc. Guaranteed) (Liquidity Facility Lehman Brothers Hldgs., Inc.) (a)(b) | $ 20,504 | | $ 20,504 |
Puerto Rico Infrastructure Fing. Auth. Bonds Series AAB 00 17, 3.42%, tender 9/7/06 (Liquidity Facility ABN-AMRO Bank NV) (a)(b) | 11,000 | | 11,000 |
| | 113,208 |
TOTAL INVESTMENT PORTFOLIO - 99.4% (Cost $2,851,113) | | 2,851,113 |
NET OTHER ASSETS - 0.6% | | 18,262 |
NET ASSETS - 100% | $ 2,869,375 |
Security Type Abbreviations |
CP - COMMERCIAL PAPER |
TRAN - TAX AND REVENUE
ANTICIPATION NOTE |
VRDN - VARIABLE RATE DEMAND NOTE |
Legend |
(a) The coupon rate shown on floating or adjustable rate securities represents the rate at period end. |
(b) Provides evidence of ownership in one or more underlying municipal bonds. |
(c) Restricted securities - Investment in securities not registered under the Securities Act of 1933 (excluding 144A issues). At the end of the period, the value of restricted securities (excluding 144A issues) amounted to $19,005,000 or 0.7% of net assets. |
Additional information on each holding is as follows: |
Security | Acquisition
Date | Cost
(000s) |
California Gen. Oblig. Bonds Series MT 171, 3.23%, tender 10/26/06 (Liquidity Facility DEPFA BANK PLC) | 10/27/05 | $ 9,895 |
Puerto Rico Commonwealth Infrastructure Fing. Auth. Bonds Series MT 165, 3.15%, tender 10/12/06 (Liquidity Facility Merrill Lynch & Co., Inc.) | 10/13/05 | $ 9,110 |
See accompanying notes which are an integral part of the financial statements.
Semiannual Report
Fidelity California AMT Tax-Free Money Market Fund
Financial Statements
Statement of Assets and Liabilities
Amounts in thousands (except per-share amount) | August 31, 2006 (Unaudited) |
| | |
Assets | | |
Investment in securities, at value -
See accompanying schedule: Unaffiliated issuers (cost $2,851,113) | | $ 2,851,113 |
Cash | | 9,888 |
Receivable for fund shares sold | | 9,234 |
Interest receivable | | 21,084 |
Receivable from investment adviser for expense reductions | | 174 |
Other receivables | | 394 |
Total assets | | 2,891,887 |
| | |
Liabilities | | |
Payable for investments purchased | $ 9,014 | |
Payable for fund shares redeemed | 11,741 | |
Distributions payable | 737 | |
Accrued management fee | 1,017 | |
Other affiliated payables | 3 | |
Total liabilities | | 22,512 |
| | |
Net Assets | | $ 2,869,375 |
Net Assets consist of: | | |
Paid in capital | | $ 2,869,132 |
Distributions in excess of net investment income | | (3) |
Accumulated undistributed net realized gain (loss) on investments | | 246 |
Net Assets, for 2,868,772 shares outstanding | | $ 2,869,375 |
Net Asset Value, offering price and redemption price per share ($2,869,375 ÷ 2,868,772 shares) | | $ 1.00 |
See accompanying notes which are an integral part of the financial statements.
Semiannual Report
Fidelity California AMT Tax-Free Money Market Fund
Financial Statements - continued
Statement of Operations
Amounts in thousands | Six months ended August 31, 2006 (Unaudited) |
| | |
Investment Income | | |
Interest | | $ 43,312 |
| | |
Expenses | | |
Management fee | $ 5,419 | |
Independent trustees' compensation | 4 | |
Total expenses before reductions | 5,423 | |
Expense reductions | (2,094) | 3,329 |
Net investment income | | 39,983 |
Realized and Unrealized Gain (Loss) Net realized gain (loss) on: | | |
Investment securities: | | |
Unaffiliated issuers | | 159 |
Net increase in net assets resulting from operations | | $ 40,142 |
See accompanying notes which are an integral part of the financial statements.
Semiannual Report
Statement of Changes in Net Assets
Amounts in thousands | Six months ended
August 31, 2006
(Unaudited) | Year ended
February 28,
2006 |
Increase (Decrease) in Net Assets | | |
Operations | | |
Net investment income | $ 39,983 | $ 42,608 |
Net realized gain (loss) | 159 | 64 |
Net increase in net assets resulting
from operations | 40,142 | 42,672 |
Distributions to shareholders from net investment income | (39,983) | (42,654) |
Share transactions at net asset value of $1.00 per share
Proceeds from sales of shares | 1,682,150 | 2,164,617 |
Reinvestment of distributions | 35,948 | 38,823 |
Cost of shares redeemed | (1,054,429) | (1,493,188) |
Net increase (decrease) in net assets and shares resulting from share transactions | 663,669 | 710,252 |
Total increase (decrease) in net assets | 663,828 | 710,270 |
| | |
Net Assets | | |
Beginning of period | 2,205,547 | 1,495,277 |
End of period (including distributions in excess of net investment income of $3 and distributions in excess of net investment income of $3, respectively) | $ 2,869,375 | $ 2,205,547 |
See accompanying notes which are an integral part of the financial statements.
Semiannual Report
Financial Highlights
| Six months ended August 31, 2006 | Years ended February 28, |
| (Unaudited) | 2006 | 2005 | 2004 E | 2003 | 2002 |
Selected Per-Share Data | | | | | |
Net asset value, beginning of period | $ 1.00 | $ 1.00 | $ 1.00 | $ 1.00 | $ 1.00 | $ 1.00 |
Income from Investment Operations | | | | | | |
Net investment income | .016 | .023 | .010 | .007 | .011 | .020 |
Net realized and
unrealized gain (loss) F | - | - | - | - | - | - |
Total from investment operations | .016 | .023 | .010 | .007 | .011 | .020 |
Distributions from net investment income | (.016) | (.023) | (.010) | (.007) | (.011) | (.020) |
Distributions from net realized gain | - | - | - | - F | - | - |
Total distributions | (.016) | (.023) | (.010) | (.007) | (.011) | (.020) |
Net asset value,
end of period | $ 1.00 | $ 1.00 | $ 1.00 | $ 1.00 | $ 1.00 | $ 1.00 |
Total Return B, C | 1.59% | 2.34% | 1.04% | .75% | 1.15% | 1.98% |
Ratios to Average Net Assets D | | | | | |
Expenses before reductions | .43% A | .43% | .43% | .43% | .43% | .48% |
Expenses net of fee waivers, if any | .35% A | .35% | .35% | .35% | .35% | .45% |
Expenses net of all reductions | .26% A | .27% | .31% | .34% | .32% | .41% |
Net investment income | 3.15% A | 2.34% | 1.05% | .73% | 1.14% | 1.95% |
Supplemental Data | | | | | |
Net assets,
end of period
(in millions) | $ 2,869 | $ 2,206 | $ 1,495 | $ 1,240 | $ 1,327 | $ 1,061 |
A Annualized
B Total returns for periods of less than one year are not annualized.
C Total returns would have been lower had certain expenses not been reduced during the periods shown.
D Expense ratios reflect operating expenses of the Fund. Expenses before reductions do not reflect amounts reimbursed by the investment adviser or expense offset arrangements and do not represent the amount paid by the Fund during periods when reimbursements or reductions occur. Expenses net of fee waivers reflect expenses after reimbursement by the investment adviser but prior to reductions from expense offset arrangements. Expenses net of all reductions represent the net expenses paid by the Fund.
E For the year ended February 29.
F Amount represents less than $.001 per share.
See accompanying notes which are an integral part of the financial statements.
Semiannual Report
Fidelity California Municipal Money Market Fund
Investment Changes
Maturity Diversification |
Days | % of fund's
investments
8/31/06 | % of fund's
investments
2/28/06 | % of fund's
investments
8/31/05 |
0 - 30 | 97.4 | 93.5 | 91.4 |
31 - 90 | 0.3 | 3.4 | 3.0 |
91 - 180 | 0.3 | 3.1 | 0.7 |
181 - 397 | 2.0 | 0.0 | 4.9 |
Weighted Average Maturity |
| 8/31/06 | 2/28/06 | 8/31/05 |
Fidelity California Municipal Money Market | 13 Days | 12 Days | 23 Days |
California Tax Free Money Market
Funds Average* | 26 Days | 22 Days | 29 Days |
Asset Allocation (% of fund's net assets) |
As of August 31, 2006 | As of February 28, 2006 |
| Variable Rate
Demand Notes
(VRDNs) 88.2% | | | Variable Rate
Demand Notes
(VRDNs) 78.5% | |
| Commercial Paper (including
CP Mode) 4.8% | | | Commercial Paper (including
CP Mode) 9.7% | |
| Tender Bonds 0.9% | | | Tender Bonds 2.3% | |
| Municipal Notes 2.5% | | | Municipal Notes 2.4% | |
| Other Investments 0.2% | | | Other Investments 0.6% | |
| Net Other Assets 3.4% | | | Net Other Assets 6.5% | |
*Source: iMoneyNet, Inc.
Semiannual Report
Fidelity California Municipal Money Market Fund
Investments August 31, 2006 (Unaudited)
Showing Percentage of Net Assets
Municipal Securities - 96.6% |
| Principal Amount (000s) | | Value (Note 1) (000s) |
California - 96.3% |
ABAG Fin. Auth. for Nonprofit Corp. Rev. Participating VRDN Series MT 40, 3.47% (Liquidity Facility Merrill Lynch & Co., Inc.) (a)(c) | $ 18,995 | | $ 18,995 |
ABAG Fin. Auth. for Nonprofit Corps. Multi-family Hsg. Rev.: | | | |
(Paragon Apt. Proj.) Series A, 3.46%, LOC Comerica Bank, Detroit, VRDN (a)(b) | 8,200 | | 8,200 |
(Vintage Chateau Proj.) Series A, 3.5%, LOC Union Bank of California, VRDN (a)(b) | 12,100 | | 12,100 |
Alameda Corridor Trans. Auth. Rev. Participating VRDN: | | | |
Series BS 05 222 Class A, 3.52% (Liquidity Facility Bear Stearns Companies, Inc.) (a)(c) | 11,755 | | 11,755 |
Series PZ 51, 3.47% (Liquidity Facility Merrill Lynch & Co., Inc.) (a)(c) | 11,685 | | 11,685 |
Series PZ 70, 3.47% (Liquidity Facility Merrill Lynch & Co., Inc.) (a)(c) | 15,245 | | 15,245 |
Alhambra Ctfs. of Prtn. Participating VRDN Series PT 3457, 3.44% (Liquidity Facility Merrill Lynch & Co., Inc.) (a)(c) | 8,060 | | 8,060 |
Bay Area Toll Auth. Toll Bridge Rev. Participating VRDN: | | | |
Series EGL 06 83 Class A, 3.45% (Liquidity Facility Landesbank Hessen-Thuringen) (a)(c) | 25,000 | | 25,000 |
Series MT 238, 3.68% (Liquidity Facility DEPFA BANK PLC) (a)(c) | 21,900 | | 21,900 |
Bueno Park Multi-family Hsg. Rev. (Walden Glen Apts. Proj.) Series 2000 A, 3.43%, LOC Fannie Mae, VRDN (a)(b) | 14,288 | | 14,288 |
Burbank Glendale Pasadena Arpt. Auth. Rev. Participating VRDN: | | | |
Series MT 137, 3.49% (Liquidity Facility Merrill Lynch & Co., Inc.) (a)(b)(c) | 2,885 | | 2,885 |
Series Putters 904, 3.46% (Liquidity Facility JPMorgan Chase & Co.) (a)(b)(c) | 5,715 | | 5,715 |
California Dept. of Wtr. Resources Central Valley Proj. Wtr. Sys. Rev.: | | | |
Participating VRDN Series PT 607, 3.43% (Liquidity Facility Bayerische Hypo-und Vereinsbank AG) (a)(c) | 5,790 | | 5,790 |
Series 1, 3.47% 9/7/06, CP | 7,070 | | 7,070 |
California Dept. of Wtr. Resources Pwr. Supply Rev. Participating VRDN: | | | |
Series Putters 309, 3.44% (Liquidity Facility JPMorgan Chase Bank) (a)(c) | 13,095 | | 13,095 |
Series Putters 322, 3.44% (Liquidity Facility JPMorgan Chase & Co.) (a)(c) | 11,570 | | 11,570 |
Series Putters 395, 3.44% (Liquidity Facility JPMorgan Chase Bank) (a)(c) | 16,655 | | 16,655 |
Municipal Securities - continued |
| Principal Amount (000s) | | Value (Note 1) (000s) |
California - continued |
California Dept. of Wtr. Resources Pwr. Supply Rev. Participating VRDN: - continued | | | |
Series Putters 532Z, 3.44% (Liquidity Facility JPMorgan Chase Bank) (a)(c) | $ 2,500 | | $ 2,500 |
California Dept. of Wtr. Resources Wtr. Rev. Participating VRDN: | | | |
Series Putters 664, 3.44% (Liquidity Facility JPMorgan Chase & Co.) (a)(c) | 3,395 | | 3,395 |
Series ROC II R2062, 3.44% (Liquidity Facility Citigroup, Inc.) (a)(c) | 5,725 | | 5,725 |
California Econ. Recovery Participating VRDN Series ROC II R2114, 3.44% (Liquidity Facility Citigroup, Inc.) (a)(c) | 5,125 | | 5,125 |
California Edl. Facilities Auth. Rev.: | | | |
Bonds (Carnegie Institution of Washington Proj.) Series 1993 B, 3.64% tender 9/5/06 (Liquidity Facility SunTrust Banks, Inc.), CP mode | 7,500 | | 7,500 |
Participating VRDN: | | | |
Series EGL 03 45 Class A, 3.45% (Liquidity Facility Citibank NA) (a)(c) | 6,775 | | 6,775 |
Series PA 542, 3.44% (Liquidity Facility Merrill Lynch & Co., Inc.) (a)(c) | 8,105 | | 8,105 |
California Edl. Facilities Rev. Participating VRDN
Series AAB 05 32, 3.44% (Liquidity Facility ABN-AMRO Bank NV) (a)(c) | 12,000 | | 12,000 |
California Gen. Oblig.: | | | |
Bonds: | | | |
Series AAB 00 1, 3.43%, tender 9/7/06 (Liquidity Facility ABN-AMRO Bank NV) (a)(c) | 19,065 | | 19,065 |
Series EGL 06 76 Class A, 3.45%, tender 9/7/06 (Liquidity Facility Landesbank Hessen-Thuringen) (a)(c)(d) | 20,000 | | 20,000 |
5% 9/1/06 | 10,200 | | 10,200 |
Participating VRDN: | | | |
MOTC PA 1396, 3.46% (Liquidity Facility Merrill Lynch & Co., Inc.) (a)(c) | 12,720 | | 12,720 |
MOTC PT 3574, 3.44% (Liquidity Facility Merrill Lynch & Co., Inc.) (a)(c) | 9,110 | | 9,110 |
MS 06 1437, 3.41% (Liquidity Facility Morgan Stanley) (a)(c) | 13,030 | | 13,030 |
ROC RR II R 624, 3.44% (Liquidity Facility Citibank NA) (a)(c) | 10,000 | | 10,000 |
ROCS RR II R 622 PB, 3.45% (Liquidity Facility Deutsche Postbank Ag) (a)(c) | 2,460 | | 2,460 |
Municipal Securities - continued |
| Principal Amount (000s) | | Value (Note 1) (000s) |
California - continued |
California Gen. Oblig.: - continued | | | |
Participating VRDN: | | | |
Series 01 777X, 3.44% (Liquidity Facility Morgan Stanley) (a)(b)(c) | $ 11,670 | | $ 11,670 |
Series EGL 04 1013 Class A, 3.45% (Liquidity Facility Landesbank Hessen-Thuringen) (a)(c) | 9,900 | | 9,900 |
Series EGL 06 99 Class A, 3.45% (Liquidity Facility Citibank NA) (a)(c) | 17,520 | | 17,520 |
Series Merlots 02 A17, 3.44% (Liquidity Facility Bank of New York, New York) (a)(c) | 12,185 | | 12,185 |
Series Merlots B45, 3.44% (Liquidity Facility Wachovia Bank NA) (a)(c) | 31,060 | | 31,060 |
Series PA 1231, 3.44% (Liquidity Facility Merrill Lynch & Co., Inc.) (a)(c) | 21,690 | | 21,690 |
Series PA 1300, 3.45% (Liquidity Facility Merrill Lynch & Co., Inc.) (a)(c) | 5,000 | | 5,000 |
Series PA 1366, 3.46% (Liquidity Facility Merrill Lynch & Co., Inc.) (a)(c) | 7,500 | | 7,500 |
Series PT 1252, 3.45% (Liquidity Facility Merrill Lynch & Co., Inc.) (a)(c) | 23,945 | | 23,945 |
Series PT 1389, 3.44% (Liquidity Facility Merrill Lynch & Co., Inc.) (a)(c) | 5,085 | | 5,085 |
Series PT 2272, 3.43% (Liquidity Facility Dexia Cr. Local de France) (a)(c) | 5,365 | | 5,365 |
Series PT 902, 3.43% (Liquidity Facility BNP Paribas SA) (a)(c) | 3,700 | | 3,700 |
Series PT 964, 3.43% (Liquidity Facility Landesbank Hessen-Thuringen) (a)(c) | 11,800 | | 11,800 |
Series Putters 1267, 3.44% (Liquidity Facility JPMorgan Chase Bank) (a)(c) | 11,845 | | 11,845 |
Series Putters 245, 3.44% (Liquidity Facility JPMorgan Chase Bank) (a)(c) | 6,660 | | 6,660 |
Series Putters 557Z, 3.44% (Liquidity Facility JPMorgan Chase Bank) (a)(c) | 6,445 | | 6,445 |
Series ROC II R438CE, 3.48% (Liquidity Facility Citibank NA) (a)(b)(c) | 9,375 | | 9,375 |
Series SG 95, 3.43% (Liquidity Facility Societe Generale) (a)(c) | 9,385 | | 9,385 |
Series SGB 62, 3.44% (Liquidity Facility Societe Generale) (a)(c) | 10,000 | | 10,000 |
Series TOC 05 HH, 3.44% (Liquidity Facility Goldman Sachs Group, Inc.) (a)(c) | 1,200 | | 1,200 |
3.55% 9/12/06 (Liquidity Facility Bank of Nova Scotia, New York Agcy.) (Liquidity Facility Societe Generale), CP | 37,300 | | 37,300 |
Municipal Securities - continued |
| Principal Amount (000s) | | Value (Note 1) (000s) |
California - continued |
California Health Facilities Fing. Auth. Rev.: | | | |
Bonds (Kaiser Permanent Health Sys. Proj.) Series E, 3.48% tender 9/12/06, CP mode | $ 15,500 | | $ 15,500 |
Participating VRDN Series PT 953, 3.47% (Liquidity Facility Merrill Lynch & Co., Inc.) (a)(c) | 6,495 | | 6,495 |
California Hsg. Fin. Agcy. Home Mtg. Rev.: | | | |
Participating VRDN: | | | |
Series MT 208, 3.48% (Liquidity Facility Lloyds TSB Bank PLC) (a)(b)(c) | 24,935 | | 24,935 |
Series MT 211, 3.48% (Liquidity Facility Lloyds TSB Bank PLC) (a)(b)(c) | 13,265 | | 13,265 |
Series MT 225, 3.48% (Liquidity Facility Bayerische Landesbank (UNGTD)) (a)(b)(c) | 25,160 | | 25,160 |
Series MT 36, 3.48% (Liquidity Facility Landesbank Hessen-Thuringen) (a)(b)(c) | 14,555 | | 14,555 |
Series MT 4, 3.48% (Liquidity Facility Merrill Lynch & Co., Inc.) (a)(b)(c) | 7,270 | | 7,270 |
Series MT 7, 3.48% (Liquidity Facility Landesbank Hessen-Thuringen) (a)(b)(c) | 34,575 | | 34,575 |
Series MT 73, 3.48% (Liquidity Facility Merrill Lynch & Co., Inc.) (a)(b)(c) | 7,280 | | 7,280 |
Series MT 85, 3.45% (Liquidity Facility Lloyds TSB Bank PLC) (a)(c) | 8,740 | | 8,740 |
Series PT 2353, 3.48% (Liquidity Facility Merrill Lynch & Co., Inc.) (a)(b)(c) | 12,020 | | 12,020 |
Series PT 2399, 3.48% (Liquidity Facility Merrill Lynch & Co., Inc.) (a)(b)(c) | 5,895 | | 5,895 |
Series PT 998, 3.48% (Liquidity Facility Landesbank Hessen-Thuringen) (a)(b)(c) | 34,200 | | 34,200 |
Series 2000 J, 3.45% (FSA Insured), VRDN (a)(b) | 26,585 | | 26,585 |
Series 2000 N, 3.45% (FSA Insured), VRDN (a)(b) | 24,830 | | 24,830 |
Series 2001 J, 3.6% (FSA Insured), VRDN (a)(b) | 16,700 | | 16,700 |
Series 2001 N, 3.57% (FSA Insured), VRDN (a)(b) | 5,500 | | 5,500 |
Series 2002 J, 3.6% (MBIA Insured), VRDN (a)(b) | 27,990 | | 27,990 |
Series 2002 U, 3.61% (FSA Insured), VRDN (a)(b) | 29,240 | | 29,240 |
Series 2003 D: | | | |
3.45% (FSA Insured), VRDN (a)(b) | 11,760 | | 11,760 |
3.45% (FSA Insured), VRDN (a)(b) | 32,050 | | 32,050 |
Series 2003 F, 3.39% (FSA Insured), VRDN (a)(b) | 12,385 | | 12,385 |
Series 2003 H, 3.43% (FSA Insured), VRDN (a)(b) | 46,445 | | 46,445 |
Series 2003 U, 3.61% (FSA Insured), VRDN (a)(b) | 33,370 | | 33,370 |
Series 2005 A, 3.45% (Liquidity Facility Dexia Cr. Local de France), VRDN (a)(b) | 78,140 | | 78,140 |
Municipal Securities - continued |
| Principal Amount (000s) | | Value (Note 1) (000s) |
California - continued |
California Hsg. Fin. Agcy. Home Mtg. Rev.: - continued | | | |
Series 2005 D, 3.45% (Liquidity Facility Bayerische Landesbank Girozentrale) (Liquidity Facility WestLB AG), VRDN (a)(b) | $ 73,825 | | $ 73,825 |
Series 2005 F: | | | |
3.39% (Liquidity Facility Lloyds TSB Bank PLC), VRDN (a)(b) | 20,000 | | 20,000 |
3.39% (Liquidity Facility Lloyds TSB Bank PLC), VRDN (a)(b) | 56,685 | | 56,685 |
Series B, 3.43% (AMBAC Insured), VRDN (a)(b) | 2,470 | | 2,470 |
Series B1, 3.42% (Liquidity Facility BNP Paribas SA), VRDN (a)(b) | 34,505 | | 34,505 |
Series D, 3.45% (Liquidity Facility Bayerische Landesbank Girozentrale) (Liquidity Facility WestLB AG), VRDN (a)(b) | 43,780 | | 43,780 |
Series H, 3.61% (Liquidity Facility Dexia Cr. Local de France), VRDN (a)(b) | 7,980 | | 7,980 |
Series M, 3.45% (Liquidity Facility Bank of America NA), VRDN (a)(b) | 43,865 | | 43,865 |
Series U, 3.45% (MBIA Insured), VRDN (a)(b) | 14,165 | | 14,165 |
Series X2, 3.43% (FSA Insured), VRDN (a)(b) | 11,200 | | 11,200 |
California Infrastructure & Econ. Dev. Bank Rev. Participating VRDN: | | | |
PT 3501, 3.43% (Liquidity Facility Dexia Cr. Local de France) (a)(c) | 10,900 | | 10,900 |
Series EGL 03 46 Class A, 3.45% (Liquidity Facility Citibank NA) (a)(c) | 7,700 | | 7,700 |
Series EGL 04 28 Class A, 3.45% (Liquidity Facility Landesbank Hessen-Thuringen) (a)(c) | 7,000 | | 7,000 |
Series PA 1202R, 3.44% (Liquidity Facility Merrill Lynch & Co., Inc.) (a)(c) | 5,000 | | 5,000 |
Series SG 172, 3.43% (Liquidity Facility Societe Generale) (a)(c) | 27,600 | | 27,600 |
Series SGB 50, 3.43% (Liquidity Facility Societe Generale) (a)(c) | 12,635 | | 12,635 |
California Poll. Cont. Fing. Auth. Ctfs. of Prtn. Participating VRDN MS 06 1429, 3.45% (Liquidity Facility Morgan Stanley) (a)(b)(c) | 8,445 | | 8,445 |
California Poll. Cont. Fing. Auth. Solid Waste Disp. Rev. (Republic Services, Inc. Proj.): | | | |
3.8%, VRDN (a)(b) | 18,000 | | 18,000 |
3.8%, VRDN (a)(b) | 20,000 | | 20,000 |
California Pub. Works Board Lease Rev. Participating VRDN: | | | |
Series PA 814R, 3.44% (Liquidity Facility Merrill Lynch & Co., Inc.) (a)(c) | 6,855 | | 6,855 |
Municipal Securities - continued |
| Principal Amount (000s) | | Value (Note 1) (000s) |
California - continued |
California Pub. Works Board Lease Rev. Participating VRDN: - continued | | | |
Series PT 3262, 3.44% (Liquidity Facility Merrill Lynch & Co., Inc.) (a)(c) | $ 16,980 | | $ 16,980 |
Series PT 3417, 3.44% (Liquidity Facility Merrill Lynch & Co., Inc.) (a)(c) | 7,975 | | 7,975 |
Series Putters 610, 3.44% (Liquidity Facility JPMorgan Chase Bank) (a)(c) | 3,760 | | 3,760 |
Stars 160, 3.43% (Liquidity Facility BNP Paribas SA) (a)(c) | 5,285 | | 5,285 |
California State Univ. Rev. & Colleges: | | | |
Participating VRDN: | | | |
MS 06 1411, 3.41% (Liquidity Facility Morgan Stanley) (a)(c) | 8,585 | | 8,585 |
Putters 1435, 3.44% (Liquidity Facility JPMorgan Chase & Co.) (a)(c) | 3,000 | | 3,000 |
Series EGL 7050014 Class A, 3.45% (Liquidity Facility Citibank NA) (a)(c) | 34,400 | | 34,400 |
Series Putters 1320, 3.44% (Liquidity Facility JPMorgan Chase Bank) (a)(c) | 6,035 | | 6,035 |
Series SG 170, 3.43% (Liquidity Facility Societe Generale) (a)(c) | 11,700 | | 11,700 |
Series 2001 A, 3.42% 9/1/06, LOC JPMorgan Chase Bank, LOC State Street Bank & Trust Co., Boston, CP | 11,400 | | 11,400 |
California Statewide Cmnty. Dev. Auth. Multi-family Rev.: | | | |
(Aegis of Aptos Proj.) Series 1998-Y 3.43%, LOC Fannie Mae, VRDN (a)(b) | 3,350 | | 3,350 |
(Bristol Apts. Proj.) Series Z, 3.43%, LOC Freddie Mac, VRDN (a)(b) | 9,500 | | 9,500 |
(Canyon Creek Apts. Proj.) Series 1995 C, 3.42%, LOC Fannie Mae, VRDN (a)(b) | 28,800 | | 28,800 |
(Crocker Oaks Apts. Proj.) Series 2001 H, 3.43%, LOC Fannie Mae, VRDN (a)(b) | 6,750 | | 6,750 |
(Crystal View Apt. Proj.) Series A, 3.43%, LOC Fannie Mae, VRDN (a)(b) | 20,000 | | 20,000 |
(Grove Apts. Proj.) Series X, 3.43%, LOC Fannie Mae, VRDN (a)(b) | 6,150 | | 6,150 |
(Irvine Apt. Communities LP Proj.): | | | |
Series 2001 W1, 3.38%, LOC Wells Fargo Bank Nat'l. Assoc., VRDN (a)(b) | 14,000 | | 14,000 |
Series 2001 W2, 3.38%, LOC Wells Fargo Bank Nat'l. Assoc., VRDN (a)(b) | 22,788 | | 22,788 |
Series 2001 W3, 3.38%, LOC Wells Fargo Bank Nat'l. Assoc., VRDN (a)(b) | 17,100 | | 17,100 |
Municipal Securities - continued |
| Principal Amount (000s) | | Value (Note 1) (000s) |
California - continued |
California Statewide Cmnty. Dev. Auth. Multi-family Rev.: - continued | | | |
(Maple Square Apt. Proj.) Series AA, 3.46%, LOC Citibank NA, VRDN (a)(b) | $ 7,200 | | $ 7,200 |
(Marlin Cove Apts. Proj.) Series V, 3.43%, LOC Fannie Mae, VRDN (a)(b) | 16,000 | | 16,000 |
(Northwest Gateway Apts. Proj.) Series 2004 C, 3.46%, LOC Bank of America NA, VRDN (a)(b) | 33,800 | | 33,800 |
(Northwood Apts. Proj.) Series N, 3.43%, LOC Freddie Mac, VRDN (a)(b) | 5,000 | | 5,000 |
(Oakmont Stockton Proj.) Series 1997 C, 3.51% (Gen. Elec. Cap. Corp. Guaranteed), VRDN (a)(b) | 5,960 | | 5,960 |
(River Run Sr. Apts. Proj.) Series LL, 3.43%, LOC Fannie Mae, VRDN (a)(b) | 13,805 | | 13,805 |
(Sunrise Fresno Proj.) Series B, 3.43%, LOC Fannie Mae, VRDN (a)(b) | 5,500 | | 5,500 |
(Terraces at Park Marino Proj.) Series I, 3.52%, LOC California Teachers Retirement Sys., VRDN (a)(b) | 6,995 | | 6,995 |
(The Crossings at Elk Grove Apts.) Series H, 3.46%, LOC Citibank NA, VRDN (a)(b) | 15,000 | | 15,000 |
(The Crossings Sr. Apts./ Phase II Proj.) Series J, 3.46%, LOC Citibank NA, VRDN (a)(b) | 7,425 | | 7,425 |
(Varena Assisted Living Apts. Proj.) Series 2006 F, 3.46%, LOC HSH Nordbank Ag, VRDN (a)(b) | 6,586 | | 6,586 |
(Villa Paseo Proj.) 3.43%, LOC Fed. Home Ln. Bank, San Francisco, VRDN (a)(b) | 4,000 | | 4,000 |
(Vineyard Creek Apts. Proj.) Series 2003 W, 3.43%, LOC Fed. Home Ln. Bank, San Francisco, VRDN (a)(b) | 16,200 | | 16,200 |
(Vista Del Monte Proj.) Series QQ, 3.43%, LOC Fannie Mae, VRDN (a)(b) | 19,105 | | 19,105 |
(Wilshire Court Proj.) Series M, 3.43%, LOC Fannie Mae, VRDN (a)(b) | 17,500 | | 17,500 |
California Statewide Cmnty. Dev. Corp. Rev.: | | | |
(Lansmont Corp. Proj.) Series 1996 G, 3.56%, LOC Wells Fargo Bank Nat'l. Assoc., VRDN (a)(b) | 1,250 | | 1,250 |
(Merrill Packaging Proj.) 3.56%, LOC Wells Fargo Bank Nat'l. Assoc., VRDN (a)(b) | 950 | | 950 |
(Rix Industries Proj.) Series 1996 I, 3.56%, LOC Wells Fargo Bank Nat'l. Assoc., VRDN (a)(b) | 1,200 | | 1,200 |
(Supreme Truck Bodies of California Proj.) 3.56%, LOC JPMorgan Chase Bank, VRDN (a)(b) | 1,200 | | 1,200 |
California Statewide Cmntys. Dev. Auth. Iam Commercial Paper Bonds (Kaiser Permanent Health Sys. Proj.) Series 2004, 3.55% tender 9/8/06, CP mode | 7,300 | | 7,300 |
Municipal Securities - continued |
| Principal Amount (000s) | | Value (Note 1) (000s) |
California - continued |
California Statewide Cmntys. Dev. Auth. Rev.: | | | |
Participating VRDN Series ROCS RR II R 571CE, 3.45% (Liquidity Facility Citibank NA) (a)(c) | $ 10,600 | | $ 10,600 |
(JTF Enterprises LLC Proj.) Series 1996 A, 3.56%, LOC Bank of America NA, VRDN (a)(b) | 3,000 | | 3,000 |
Carson Redev. Agcy. Participating VRDN Series ROC II R2076, 3.44% (Liquidity Facility Citigroup, Inc.) (a)(c) | 3,155 | | 3,155 |
Chabot-Las Positas Cmnty. Coliseum Participating VRDN Series MOTC PT 3551, 3.44% (Liquidity Facility Merrill Lynch & Co., Inc.) (a)(c) | 6,135 | | 6,135 |
Chico Redev. Agcy. Participating VRDN Series DB 192, 3.43% (Liquidity Facility Deutsche Bank AG) (a)(c) | 13,620 | | 13,620 |
Chula Vista Ind. Dev. Rev. Participating VRDN Series PA 1362, 3.46% (Liquidity Facility Merrill Lynch & Co., Inc.) (a)(b)(c) | 3,125 | | 3,125 |
Clovis Unified School District Participating VRDN Series PZ 49, 3.47% (Liquidity Facility Merrill Lynch & Co., Inc.) (a)(c) | 3,560 | | 3,560 |
Coast Cmnty. College District Participating VRDN: | | | |
GS 06 36TPZ, 3.47% (Liquidity Facility Wells Fargo & Co.) (a)(c) | 15,165 | | 15,165 |
Series Putters 1417, 3.47% (Liquidity Facility JPMorgan Chase Bank) (a)(c) | 1,675 | | 1,675 |
Series ROCS RR II R 6088, 3.44% (Liquidity Facility Citigroup, Inc.) (a)(c) | 7,500 | | 7,500 |
Contra Costa County Multi-family Hsg. Rev. (Del Norte Place Apt. Proj.) Series 1994, 3.55%, LOC Freddie Mac, VRDN (a)(b) | 10,610 | | 10,610 |
Contra Costa County Gen. Oblig. TRAN 4.5% 12/7/06 | 10,300 | | 10,320 |
Dublin Unified School District Participating VRDN Series Putters 809, 3.44% (Liquidity Facility JPMorgan Chase & Co.) (a)(c) | 5,700 | | 5,700 |
East Bay Muni. Util. District Wtr. Sys. Rev.: | | | |
Participating VRDN Series EGL 7053015 Class A, 3.45% (Liquidity Facility Citibank NA) (a)(c) | 10,000 | | 10,000 |
Series 1988, 3.59% 9/8/06, CP | 6,000 | | 6,000 |
Elk Grove Fin. Auth. Spl. Tax Rev. Participating VRDN Series DB 190, 3.43% (Liquidity Facility Deutsche Bank AG) (a)(c) | 5,185 | | 5,185 |
Fairfield-Suisun Unified School District Participating VRDN Series ROC II R 6019, 3.44% (Liquidity Facility Citigroup, Inc.) (a)(c) | 2,935 | | 2,935 |
Fontana Pub. Fing. Authorized Tax Allocation Rev. Participating VRDN Series Putters 707, 3.44% (Liquidity Facility JPMorgan Chase & Co.) (a)(c) | 2,075 | | 2,075 |
Municipal Securities - continued |
| Principal Amount (000s) | | Value (Note 1) (000s) |
California - continued |
Foothill-De Anza Cmnty. College District Participating VRDN: | | | |
Series Merlots 00 YY, 3.44% (Liquidity Facility Wachovia Bank NA) (a)(c) | $ 3,650 | | $ 3,650 |
Series PZ 57, 3.47% (Liquidity Facility BNP Paribas SA) (a)(c) | 6,775 | | 6,775 |
Series ROC II R4540, 3.44% (Liquidity Facility Citigroup, Inc.) (a)(c) | 7,500 | | 7,500 |
Foothill/Eastern Trans. Corridor Agcy. Toll Road Rev. Participating VRDN Series PZ 96, 3.48% (Liquidity Facility Merrill Lynch & Co., Inc.) (a)(c) | 135 | | 135 |
Fresno Arpt. Rev. Participating VRDN Series Merlots 00 B2, 3.49% (Liquidity Facility Wachovia Bank NA) (a)(b)(c) | 4,155 | | 4,155 |
Garden Grove Hsg. Auth. Multi-family Hsg. Rev. (Valley View Sr. Villas Proj.) Series 1990 A, 3.45%, LOC Comerica Bank, Detroit, VRDN (a)(b) | 9,100 | | 9,100 |
Golden State Tobacco Securitization Corp. Participating VRDN: | | | |
Series Best 05 230, 3.52% (Liquidity Facility Bear Stearns Companies, Inc.) (a)(c) | 7,175 | | 7,175 |
Series DB 195, 3.47% (Liquidity Facility Deutsche Bank AG) (a)(c) | 2,080 | | 2,080 |
Series EGL 7053009 Class A, 3.46% (Liquidity Facility Citibank NA) (a)(c) | 19,800 | | 19,800 |
Series MS 06 1421, 3.41% (Liquidity Facility Morgan Stanley) (a)(c) | 16,110 | | 16,110 |
Series MSTC 238, 3.52% (Liquidity Facility Bear Stearns Companies, Inc.) (a)(c) | 7,510 | | 7,510 |
Series PA 1236, 3.47% (Liquidity Facility Merrill Lynch & Co., Inc.) (a)(c) | 3,535 | | 3,535 |
Series PZ 86, 3.47% (Liquidity Facility Merrill Lynch & Co., Inc.) (a)(c) | 5,050 | | 5,050 |
Series ROC II R443CE, 3.46% (Liquidity Facility Citibank NA) (a)(c) | 4,100 | | 4,100 |
Series ROC II R448CE, 3.46% (Liquidity Facility Citibank NA) (a)(c) | 7,500 | | 7,500 |
Series ROC RR II R 611, 3.44% (Liquidity Facility Citibank NA) (a)(c) | 14,480 | | 14,480 |
Series Stars 06 144, 3.44% (Liquidity Facility BNP Paribas SA) (a)(c) | 53,960 | | 53,960 |
Series TOC 04 B, 3.44% (Liquidity Facility Goldman Sachs Group, Inc.) (a)(c) | 17,500 | | 17,500 |
Golden West Schools Fing. Auth. Participating VRDN: | | | |
Series CDCM 05 21, 3.43% (Liquidity Facility CDC Fin.-CDC IXIS) (a)(c) | 10,065 | | 10,065 |
Municipal Securities - continued |
| Principal Amount (000s) | | Value (Note 1) (000s) |
California - continued |
Golden West Schools Fing. Auth. Participating VRDN: - continued | | | |
Series DB 164, 3.43% (Liquidity Facility Deutsche Bank AG) (a)(c) | $ 9,955 | | $ 9,955 |
Series PT 2985, 3.43% (Liquidity Facility Dexia Cr. Local de France) (a)(c) | 5,745 | | 5,745 |
Goleta Wtr. District Rev. Ctfs. of Prtn. Participating VRDN Series ROC II R2050, 3.44% (Liquidity Facility Citigroup, Inc.) (a)(c) | 3,470 | | 3,470 |
Grossmont Union High School District Participating VRDN Series PT 3489, 3.44% (Liquidity Facility Merrill Lynch & Co., Inc.) (a)(c) | 10,820 | | 10,820 |
Hacienda Puente Unified School District Participating VRDN Series PT 2877, 3.43% (Liquidity Facility Dexia Cr. Local de France) (a)(c) | 8,810 | | 8,810 |
La Quinta Fing. Auth. Local Agcy. Rev. Participating VRDN Series ROC II R412, 3.44% (Liquidity Facility Citibank NA) (a)(c) | 5,580 | | 5,580 |
Lassen Muni. Util. District Rev. Series 1996 A, 3.45%
(FSA Insured), VRDN (a)(b) | 2,155 | | 2,155 |
Long Beach Unified School District Participating VRDN ROC II R 4560, 3.44% (Liquidity Facility Citigroup, Inc.) (a)(c) | 6,995 | | 6,995 |
Long Beach Hbr. Rev.: | | | |
Participating VRDN: | | | |
Series MS 00 418, 3.44% (Liquidity Facility Morgan Stanley) (a)(b)(c) | 18,190 | | 18,190 |
Series MS 01 786X, 3.44% (Liquidity Facility Morgan Stanley) (a)(b)(c) | 5,570 | | 5,570 |
Series MT 140, 3.46% (Liquidity Facility BNP Paribas SA) (a)(b)(c) | 4,995 | | 4,995 |
Series PT 2579, 3.46% (Liquidity Facility Merrill Lynch & Co., Inc.) (a)(b)(c) | 3,145 | | 3,145 |
Series PT 2580, 3.62% (Liquidity Facility Dexia Cr. Local de France) (a)(b)(c) | 4,980 | | 4,980 |
Series PT 2708, 3.46% (Liquidity Facility Dexia Cr. Local de France) (a)(b)(c) | 5,730 | | 5,730 |
Series PT 2756, 3.46% (Liquidity Facility Merrill Lynch & Co., Inc.) (a)(b)(c) | 2,545 | | 2,545 |
Series PT 2936, 3.46% (Liquidity Facility Merrill Lynch & Co., Inc.) (a)(b)(c) | 5,245 | | 5,245 |
Series Putters 730, 3.46% (Liquidity Facility JPMorgan Chase & Co.) (a)(b)(c) | 1,790 | | 1,790 |
Series SG 147, 3.46% (Liquidity Facility Societe Generale) (a)(b)(c) | 9,890 | | 9,890 |
Municipal Securities - continued |
| Principal Amount (000s) | | Value (Note 1) (000s) |
California - continued |
Long Beach Hbr. Rev.: - continued | | | |
Series A: | | | |
3.68% 9/5/06, CP (b) | $ 1,020 | | $ 1,020 |
3.7% 9/5/06, CP (b) | 28,750 | | 28,750 |
Los Angeles Cmnty. Redev. Agcy. Multi-family Hsg. Rev. (Metropolitan Lofts Apts. Proj.) Series 2002 A, 3.46%,
LOC Bank of America NA, VRDN (a)(b) | 17,500 | | 17,500 |
Los Angeles County Pub. Works Fing. Auth. Lease Rev. Participating VRDN Series Merlots 00 JJJ, 3.44% (Liquidity Facility Wachovia Bank NA) (a)(c) | 16,000 | | 16,000 |
Los Angeles Dept. Arpt. Rev. Participating VRDN Series SG 61, 3.46% (Liquidity Facility Societe Generale) (a)(b)(c) | 13,055 | | 13,055 |
Los Angeles Dept. of Wtr. & Pwr. Rev. Participating VRDN: | | | |
Series EGL 06 10 Class A, 3.45% (Liquidity Facility Citibank NA) (a)(c) | 13,000 | | 13,000 |
Series EGL 7053026 Class A, 3.45% (Liquidity Facility Landesbank Hessen-Thuringen) (a)(c) | 52,800 | | 52,800 |
Series Putters 1272, 3.44% (Liquidity Facility JPMorgan Chase Bank) (a)(c) | 5,050 | | 5,050 |
Series ROC II R4033, 3.44% (Liquidity Facility Citigroup, Inc.) (a)(c) | 10,335 | | 10,335 |
Series ROC II R4510, 3.44% (Liquidity Facility Citigroup, Inc.) (a)(c) | 6,795 | | 6,795 |
Los Angeles Dept. of Wtr. & Pwr. Wtrwks. Rev. Participating VRDN: | | | |
Series EGL 06 0044, 3.45% (Liquidity Facility Citibank NA) (a)(c) | 26,250 | | 26,250 |
Series EGL 06 0067, 3.45% (Liquidity Facility Citibank NA) (a)(c) | 27,365 | | 27,365 |
Series EGL 06 34 Class A, 3.45% (Liquidity Facility Citibank NA) (a)(c) | 17,555 | | 17,555 |
Series Merlots 99 L, 3.44% (Liquidity Facility Wachovia Bank NA) (a)(c) | 23,300 | | 23,300 |
Los Angeles Gen. Oblig.: | | | |
Participating VRDN Series PT 1475, 3.44% (Liquidity Facility Merrill Lynch & Co., Inc.) (a)(c) | 13,350 | | 13,350 |
TRAN 4.5% 6/29/07 | 86,000 | | 86,520 |
Los Angeles Hbr. Dept. Rev.: | | | |
Participating VRDN: | | | |
Series Merlots 06 A3, 3.49% (Liquidity Facility Bank of New York, New York) (a)(b)(c) | 9,480 | | 9,480 |
Series MS 06 1473, 3.44% (Liquidity Facility Morgan Stanley) (a)(b)(c) | 12,715 | | 12,715 |
Municipal Securities - continued |
| Principal Amount (000s) | | Value (Note 1) (000s) |
California - continued |
Los Angeles Hbr. Dept. Rev.: - continued | | | |
Participating VRDN: | | | |
Series PA 1397, 3.46% (Liquidity Facility Merrill Lynch & Co., Inc.) (a)(b)(c) | $ 8,445 | | $ 8,445 |
Series ROC II R559, 3.46% (Liquidity Facility Citibank NA) (a)(b)(c) | 25,055 | | 25,055 |
Series 2002 B: | | | |
3.63% 9/15/06, CP (b) | 10,000 | | 10,000 |
3.65% 9/5/06, CP (b) | 10,172 | | 10,172 |
3.65% 9/8/06, CP (b) | 12,465 | | 12,465 |
3.65% 9/8/06, CP (b) | 19,943 | | 19,943 |
3.65% 9/8/06, CP (b) | 15,000 | | 15,000 |
Los Angeles Multi-family Hsg. Rev. (Colonia Corona Apts. Proj.) Series D, 3.6%, LOC Citibank NA, VRDN (a)(b) | 9,767 | | 9,767 |
Los Angeles Muni. Impt. Corp. Lease Rev. Participating VRDN Series PT 1405, 3.44% (Liquidity Facility Merrill Lynch & Co., Inc.) (a)(c) | 12,025 | | 12,025 |
Los Angeles Single Family Mortgage Rev. Series 2004 A: | | | |
3.44% (Liquidity Facility State Street Bank & Trust Co., Boston), VRDN (a)(b) | 17,065 | | 17,065 |
3.44% (Liquidity Facility State Street Bank & Trust Co., Boston), VRDN (a)(b) | 12,935 | | 12,935 |
Los Angeles Unified School District: | | | |
Participating VRDN: | | | |
Series EGL 03 43 Class A, 3.45% (Liquidity Facility Citibank NA) (a)(c) | 4,900 | | 4,900 |
Series EGL 03 49 Class A, 3.45% (Liquidity Facility Citibank NA) (a)(c) | 4,800 | | 4,800 |
Series EGL 06 88 Class A, 3.45% (Liquidity Facility Landesbank Hessen-Thuringen) (a)(c) | 7,800 | | 7,800 |
Series PA 1115, 3.44% (Liquidity Facility Merrill Lynch & Co., Inc.) (a)(c) | 1,000 | | 1,000 |
Series PA 792R, 3.44% (Liquidity Facility Merrill Lynch & Co., Inc.) (a)(c) | 8,945 | | 8,945 |
Series PT 3373, 3.43% (Liquidity Facility DEPFA BANK PLC) (a)(c) | 50,680 | | 50,680 |
Series Putters 1442, 3.44% (Liquidity Facility JPMorgan Chase Bank) (a)(c) | 4,500 | | 4,500 |
Series Putters 488, 3.44% (Liquidity Facility JPMorgan Chase Bank) (a)(c) | 28,140 | | 28,140 |
Series ROC II R24, 3.44% (Liquidity Facility Citibank NA) (a)(c) | 6,495 | | 6,495 |
Municipal Securities - continued |
| Principal Amount (000s) | | Value (Note 1) (000s) |
California - continued |
Los Angeles Unified School District: - continued | | | |
Participating VRDN: | | | |
Series ROC II R25, 3.44% (Liquidity Facility Citibank NA) (a)(c) | $ 6,665 | | $ 6,665 |
Series ROC RR II 543, 3.44% (Liquidity Facility Citibank NA) (a)(c) | 6,520 | | 6,520 |
Series ROC RR II 6089, 3.44% (Liquidity Facility Citigroup, Inc.) (a)(c) | 3,850 | | 3,850 |
Series ROC RR II 7033, 3.44% (Liquidity Facility Citigroup, Inc.) (a)(c) | 2,150 | | 2,150 |
Series SG 162, 3.43% (Liquidity Facility Societe Generale) (a)(c) | 37,700 | | 37,700 |
TRAN Series A, 4.25% 10/18/06 | 12,700 | | 12,709 |
Los Angeles Wastewtr. Sys. Rev. Participating VRDN: | | | |
Series EGL 7053003 Class A, 3.45% (Liquidity Facility Citibank NA) (a)(c) | 52,500 | | 52,500 |
Series ROC II R4034, 3.44% (Liquidity Facility Citigroup, Inc.) (a)(c) | 8,640 | | 8,640 |
M-S-R Pub. Pwr. Agcy. San Juan Proj. Rev. Participating VRDN ROC II R335, 3.44% (Liquidity Facility Citibank NA) (a)(c) | 4,145 | | 4,145 |
Metropolitan Wtr. District Southern California Wtrwks. Rev. Participating VRDN: | | | |
Series FRRI 00 A6, 3.38% (Liquidity Facility Bayerische Hypo-und Vereinsbank AG) (a)(c) | 5,300 | | 5,300 |
Series Merlots 99 O, 3.44% (Liquidity Facility Wachovia Bank NA) (a)(c) | 9,500 | | 9,500 |
Series PT 3601, 3.44% (Liquidity Facility Merrill Lynch & Co., Inc.) (a)(c) | 8,005 | | 8,005 |
Milpitas Redev. Agcy. Participating VRDN: | | | |
Series ROC II R2057, 3.44% (Liquidity Facility Citigroup, Inc.) (a)(c) | 9,005 | | 9,005 |
Series ROC II R2145, 3.44% (Liquidity Facility Citigroup, Inc.) (a)(c) | 8,590 | | 8,590 |
Series ROC II R4538, 3.44% (Liquidity Facility Citigroup, Inc.) (a)(c) | 8,190 | | 8,190 |
Series ROC II R4557, 3.44% (Liquidity Facility Citigroup, Inc.) (a)(c) | 6,290 | | 6,290 |
Milpitas Unified School District Participating VRDN Series Putters 615, 3.44% (Liquidity Facility JPMorgan Chase & Co.) (a)(c) | 8,720 | | 8,720 |
Modesto Irrigation District Ctfs. of Prtn. Participating VRDN Series PT 3539, 3.44% (Liquidity Facility Merrill Lynch & Co., Inc.) (a)(c) | 2,265 | | 2,265 |
Municipal Securities - continued |
| Principal Amount (000s) | | Value (Note 1) (000s) |
California - continued |
North Orange County Cmnty. College District Rev. Participating VRDN Series PZ 68, 3.47% (Liquidity Facility Merrill Lynch & Co., Inc.) (a)(c) | $ 5,220 | | $ 5,220 |
Northern California Transmission Auth. Rev. Series B, 3.59% 9/5/06, LOC WestLB AG, CP | 5,000 | | 5,000 |
Norwalk- Mirada Unified School District Participating VRDN Series SG 169, 3.43% (Liquidity Facility Societe Generale) (a)(c) | 8,000 | | 8,000 |
Oakland Gen. Oblig. Participating VRDN Series Merlots 00 A, 3.44% (Liquidity Facility Wachovia Bank NA) (a)(c) | 3,000 | | 3,000 |
Oakland Redev. Agcy. Sub Tax Allocation Participating VRDN Series PT 2035, 3.44% (Liquidity Facility Merrill Lynch & Co., Inc.) (a)(c) | 11,700 | | 11,700 |
Oakland Swr. Rev. Participating VRDN Series Putters 631, 3.44% (Liquidity Facility JPMorgan Chase Bank) (a)(c) | 2,435 | | 2,435 |
Olcese Wtr. District Bonds (Rio Bravo Wtr. Delivery Sys. Proj.) Series 1986A, 3.65% tender 9/12/06, LOC Sumitomo Mitsui Banking Corp., CP mode (b) | 8,100 | | 8,100 |
Paramount Hsg. Auth. Multi-family Rev. (Century Place Apts. Proj.) Series 1999 A, 3.42%, LOC Fannie Mae, VRDN (a)(b) | 21,000 | | 21,000 |
Port of Oakland Gen. Oblig. Participating VRDN: | | | |
Series Merlots 00 JJ, 3.49% (Liquidity Facility Wachovia Bank NA) (a)(b)(c) | 29,680 | | 29,680 |
Series MS 1192X, 3.44% (Liquidity Facility Morgan Stanley) (a)(b)(c) | 13,000 | | 13,000 |
Series PA 1053, 3.46% (Liquidity Facility Merrill Lynch & Co., Inc.) (a)(b)(c) | 15,070 | | 15,070 |
Series PT 2688, 3.46% (Liquidity Facility Merrill Lynch & Co., Inc.) (a)(b)(c) | 9,840 | | 9,840 |
Series PT 2755, 3.46% (Liquidity Facility Merrill Lynch & Co., Inc.) (a)(b)(c) | 2,640 | | 2,640 |
Series Putters 684, 3.46% (Liquidity Facility JPMorgan Chase & Co.) (a)(b)(c) | 2,770 | | 2,770 |
Series Putters 863, 3.46% (Liquidity Facility JPMorgan Chase & Co.) (a)(b)(c) | 2,620 | | 2,620 |
Series Putters 889, 3.46% (Liquidity Facility JPMorgan Chase Bank) (a)(b)(c) | 6,950 | | 6,950 |
Series RobIns 5, 3.43% (Liquidity Facility Bank of New York, New York) (a)(b)(c) | 16,690 | | 16,690 |
Port of Oakland Port Rev. Participating VRDN Series PA 1093, 3.46% (Liquidity Facility Merrill Lynch & Co., Inc.) (a)(b)(c) | 7,975 | | 7,975 |
Municipal Securities - continued |
| Principal Amount (000s) | | Value (Note 1) (000s) |
California - continued |
Puttable Floating Option Tax Receipts Participating VRDN: | | | |
Series PZP 13, 3.49% (Liquidity Facility Merrill Lynch & Co., Inc.) (a)(c) | $ 17,940 | | $ 17,940 |
Series PZP 14, 3.49% (Liquidity Facility Merrill Lynch & Co., Inc.) (a)(c) | 11,540 | | 11,540 |
Series PZP 2, 3.49% (Liquidity Facility Merrill Lynch & Co., Inc.) (a)(c) | 7,475 | | 7,475 |
Series PZP 8, 3.49% (Liquidity Facility Merrill Lynch & Co., Inc.) (a)(c) | 4,475 | | 4,475 |
Series PZP 9, 3.49% (Liquidity Facility Merrill Lynch & Co., Inc.) (a)(c) | 10,900 | | 10,900 |
Rancho Santiago Cmnty. College District Participating VRDN: | | | |
Series ROC II R2017, 3.44% (Liquidity Facility Citigroup, Inc.) (a)(c) | 5,230 | | 5,230 |
Series ROC II R2181, 3.44% (Liquidity Facility Citigroup, Inc.) (a)(c) | 5,595 | | 5,595 |
Riverside County Single Family Rev. Participating VRDN Series PT 2351, 3.45% (Liquidity Facility Dexia Cr. Local de France) (a)(b)(c) | 7,150 | | 7,150 |
Riverside Indl. Dev. Auth. Indl. Dev. Rev. (Sabert Corp. Proj.) 3.49%, LOC PNC Bank NA, Pittsburgh, VRDN (a)(b) | 4,305 | | 4,305 |
Sacramento City Fing. Auth. Rev.: | | | |
Participating VRDN Series TOC 06 Z3, 3.47% (Liquidity Facility Goldman Sachs Group, Inc.) (a)(c) | 5,195 | | 5,195 |
Participating VRDN Series MSTC 05 246, 3.52% (Liquidity Facility Bear Stearns Companies, Inc.) (a)(c) | 7,490 | | 7,490 |
Sacramento County Hsg. Auth. Multi-family Hsg. Rev.: | | | |
(Deer Park Apts. Proj.) Issue A, 3.43%, LOC Fannie Mae, VRDN (a)(b) | 13,200 | | 13,200 |
(Natomas Park Apts. Proj.) Series Issue B, 3.43%, LOC Fannie Mae, VRDN (a)(b) | 13,550 | | 13,550 |
Sacramento County Sanitation District Fing. Auth. Rev. Participating VRDN Series ROC II R504, 3.44% (Liquidity Facility Citibank NA) (a)(c) | 3,230 | | 3,230 |
Sacramento County Single Family Mtg. Rev. Participating VRDN: | | | |
Series PT 2326, 3.45% (Liquidity Facility Dexia Cr. Local de France) (a)(b)(c) | 16,310 | | 16,310 |
Series PT 2327, 3.45% (Liquidity Facility Dexia Cr. Local de France) (a)(b)(c) | 8,940 | | 8,940 |
Series PT 2331, 3.45% (Liquidity Facility Dexia Cr. Local de France) (a)(b)(c) | 6,730 | | 6,730 |
Municipal Securities - continued |
| Principal Amount (000s) | | Value (Note 1) (000s) |
California - continued |
Sacramento Hsg. Auth. Multi-family: | | | |
(Countrywood Village Apts. Proj.) Series F, 3.43%, LOC Fannie Mae, VRDN (a)(b) | $ 8,225 | | $ 8,225 |
(Phoenix Park II Apts. Proj.) 3.46%, LOC Citibank NA, VRDN (a)(b) | 20,570 | | 20,570 |
San Bernardino County Ctfs. of Prtn. Participating VRDN Series ROC II R 2139, 3.44% (Liquidity Facility Citigroup, Inc.) (a)(c) | 8,335 | | 8,335 |
San Diego County Reg'l. Arpt. Auth. Arpt. Rev. Participating VRDN: | | | |
Series DB 181, 3.46% (Liquidity Facility Deutsche Bank AG) (a)(b)(c) | 5,940 | | 5,940 |
Series PT 3251, 3.46% (Liquidity Facility Merrill Lynch & Co., Inc.) (a)(b)(c) | 5,895 | | 5,895 |
San Diego Unified School District Participating VRDN Series ROC II R2112 3.44% (Liquidity Facility Citigroup, Inc.) (a)(c) | 4,900 | | 4,900 |
San Francisco Arpt. Commission Int'l. Arpt. Rev. Participating VRDN Series MSTC 01 136, 3.57% (Liquidity Facility Bear Stearns Companies, Inc.) (a)(b)(c) | 9,470 | | 9,470 |
San Francisco Bldg. Auth. Lease Rev. Participating VRDN Series PT 3461, 3.44% (Liquidity Facility Merrill Lynch & Co., Inc.) (a)(c) | 6,605 | | 6,605 |
San Francisco City & County Arpts. Commission Int'l. Arpt. Rev.: | | | |
Participating VRDN Series PT 899, 3.49% (Liquidity Facility Merrill Lynch & Co., Inc.) (a)(b)(c) | 4,765 | | 4,765 |
Second Series 33B, 3.42% (XL Cap. Assurance, Inc. Insured), VRDN (a)(b) | 25,000 | | 25,000 |
Series 33C, 3.38% (XL Cap. Assurance, Inc. Insured), VRDN (a)(b) | 20,000 | | 20,000 |
San Francisco City & County Redev. Agcy. Multi-family Hsg. Rev. (Mission Creek Cmnty. Proj.) Series B, 3.46%, LOC Citibank NA, VRDN (a)(b) | 21,700 | | 21,700 |
San Francisco City & County Unified School District Participating VRDN Series Putters 549, 3.44% (Liquidity Facility JPMorgan Chase Bank) (a)(c) | 5,355 | | 5,355 |
San Joaquin Hills Trans. Corridor Agcy. Toll Road Rev. Participating VRDN Series TOC 06 Z17, 3.47% (Liquidity Facility Goldman Sachs Group, Inc.) (a)(c) | 13,325 | | 13,325 |
San Jose Arpt. Rev. Participating VRDN Series ROC II R2004, 3.44% (Liquidity Facility Citigroup, Inc.) (a)(c) | 2,555 | | 2,555 |
San Jose Evergreen Cmnty. College District Participating VRDN Series MS 06 1328, 3.41% (Liquidity Facility Morgan Stanley) (a)(c) | 6 | | 6 |
Municipal Securities - continued |
| Principal Amount (000s) | | Value (Note 1) (000s) |
California - continued |
San Jose Fing. Auth. Lease Rev. Participating VRDN Series Putters 1280Z, 3.44% (Liquidity Facility JPMorgan Chase Bank) (a)(c) | $ 6,300 | | $ 6,300 |
San Jose Int'l. Arpt. Rev. Series 2003 B, 3.65% 9/8/06, LOC JPMorgan Chase Bank, CP (b) | 1,005 | | 1,005 |
San Jose Multi-family Hsg. Rev.: | | | |
(Alamaden Family Apts. Proj.) Series D, 3.43%, LOC Fannie Mae, VRDN (a)(b) | 26,300 | | 26,300 |
(Kennedy Apt. Homes Proj.) Series K, 3.43%, LOC Fannie Mae, VRDN (a)(b) | 9,775 | | 9,775 |
San Mateo County Cmnty. College District Participating VRDN Series MSTC 3003, 3.52% (Liquidity Facility Bear Stearns Companies, Inc.) (a)(c) | 8,830 | | 8,830 |
San Mateo County Trans. District Sales Tax Rev.: | | | |
Bonds Series EGL 06 79 Class A, 3.45%, tender 9/7/06 (Liquidity Facility Landesbank Hessen-Thuringen) (a)(c)(d) | 17,335 | | 17,335 |
Participating VRDN Series AAB 06 19, 3.44% (Liquidity Facility ABN-AMRO Bank NV) (a)(c) | 13,660 | | 13,660 |
Santa Clara County Hsg. Auth. Multi-family Hsg. Rev. (Timberwood Apts. Proj.) Series B, 3.45%, LOC Union Bank of California, VRDN (a)(b) | 9,215 | | 9,215 |
Santa Clara Valley Wtr. District Ctfs. of Prtn. Participating VRDN Series Merlots 00 MM, 3.44% (Liquidity Facility Wachovia Bank NA) (a)(c) | 14,530 | | 14,530 |
Santa Cruz Redev. Agcy. Multi-family Rev.: | | | |
(1010 Pacific Ave. Apts. Proj.) Series B, 3.43%, LOC Fannie Mae, VRDN (a)(b) | 21,650 | | 21,650 |
(Shaffer Road Apts. Proj.) Series A, 3.43%, LOC Fannie Mae, VRDN (a)(b) | 19,925 | | 19,925 |
Santa Rosa Multi-family Hsg. Rev. (Quail Run Apts./Santa Rosa Hsg. Partners Proj.) Series 1997 A, 3.45%, LOC U.S. Bank NA, Minnesota, VRDN (a)(b) | 1,950 | | 1,950 |
Sequoia Union High School District Bonds Series AAB 03 2, 3.44%, tender 9/7/06 (Liquidity Facility ABN-AMRO Bank NV) (a)(c) | 12,100 | | 12,100 |
Simi Valley Multi-family Hsg. Rev. (Parker Ranch Proj.) Series A, 3.43%, LOC Fannie Mae, VRDN (a)(b) | 15,500 | | 15,500 |
Sonoma County Jr. College District Rev. Participating VRDN Series MA 06 1466, 3.41% (Liquidity Facility Morgan Stanley) (a)(c) | 3,510 | | 3,510 |
South Orange County Pub. Fing. Auth. Spl. Tax Rev. Participating VRDN Series Putters 470, 3.44% (Liquidity Facility JPMorgan Chase Bank) (a)(c) | 5,210 | | 5,210 |
Municipal Securities - continued |
| Principal Amount (000s) | | Value (Note 1) (000s) |
California - continued |
Southern California Home Fing. Auth. Single Family Rev.: | | | |
Participating VRDN Series MT 90, 3.48% (Liquidity Facility Landesbank Hessen-Thuringen) (a)(b)(c) | $ 99,530 | | $ 99,529 |
Series A: | | | |
3.44% (Liquidity Facility Fannie Mae), VRDN (a)(b) | 1,205 | | 1,205 |
3.44% (Liquidity Facility Fannie Mae), VRDN (a)(b) | 38,175 | | 38,175 |
Sweetwater Union High School District Participating VRDN Series MS 1456, 3.41% (Liquidity Facility Morgan Stanley) (a)(c) | 9,470 | | 9,470 |
Univ. of California Revs. Participating VRDN: | | | |
Series EGL 7050006 Class A, 3.45% (Liquidity Facility Citibank NA) (a)(c) | 2,445 | | 2,445 |
Series EGL 7050084 Class A, 3.45% (Liquidity Facility Citibank NA) (a)(c) | 16,500 | | 16,500 |
Series Merlots 97 G, 3.44% (Liquidity Facility Wachovia Bank NA) (a)(c) | 13,430 | | 13,430 |
Series PA 529, 3.44% (Liquidity Facility Merrill Lynch & Co., Inc.) (a)(c) | 3,100 | | 3,100 |
Series PT 872, 3.43% (Liquidity Facility Landesbank Hessen-Thuringen) (a)(c) | 8,265 | | 8,265 |
Series Putters 1201, 3.44% (Liquidity Facility JPMorgan Chase Bank) (a)(c) | 5,230 | | 5,230 |
Walnut Energy Ctr. Auth. Rev. Participating VRDN Series Putters 583, 3.44% (Liquidity Facility JPMorgan Chase & Co.) (a)(c) | 5,180 | | 5,180 |
William S. Hart Union High School District Participating VRDN Series SG 171, 3.43% (Liquidity Facility Societe Generale) (a)(c) | 8,600 | | 8,600 |
Yucaipa Valley Wtr. District Wtr. Sys. Rev. Participating VRDN Series ROC II R 2130, 3.44% (Liquidity Facility Citigroup, Inc.) (a)(c) | 3,510 | | 3,510 |
| | 4,206,268 |
Puerto Rico - 0.3% |
Puerto Rico Commonwealth Gen. Oblig. Participating VRDN Series Floater 53G, 3.44% (Liquidity Facility Goldman Sachs Group, Inc.) (a)(c) | 11,000 | | 11,000 |
TOTAL INVESTMENT PORTFOLIO - 96.6% (Cost $4,217,268) | | 4,217,268 |
NET OTHER ASSETS - 3.4% | | 149,536 |
NET ASSETS - 100% | $ 4,366,804 |
Security Type Abbreviations |
CP - COMMERCIAL PAPER |
TRAN - TAX AND REVENUE
ANTICIPATION NOTE |
VRDN - VARIABLE RATE DEMAND NOTE |
Legend |
(a) The coupon rate shown on floating or adjustable rate securities represents the rate at period end. |
(b) Private activity obligations whose interest is subject to the federal alternative minimum tax for individuals. |
(c) Provides evidence of ownership in one or more underlying municipal bonds. |
(d) Restricted securities - Investment in securities not registered under the Securities Act of 1933 (excluding 144A issues). At the end of the period, the value of restricted securities (excluding 144A issues) amounted to $37,335,000 or 0.9% of net assets. |
Additional information on each holding is as follows: |
Security | Acquisition
Date | Cost
(000s) |
California Gen. Oblig. Bonds Series EGL 06 76 Class A, 3.45%, tender 9/7/06 (Liquidity Facility Landesbank Hessen-Thuringen) | 6/1/06 | $ 20,000 |
San Mateo County Trans. District Sales Tax Rev. Bonds Series EGL 06 79 Class A, 3.45%, tender 9/7/06 (Liquidity Facility Landesbank Hessen-Thuringen) | 6/1/06 | $ 17,335 |
Income Tax Information |
At February 28, 2006, the fund had a capital loss carryforward of approximately $10,000 all of which will expire on February 28, 2013. |
See accompanying notes which are an integral part of the financial statements.
Semiannual Report
Fidelity California Municipal Money Market Fund
Financial Statements
Statement of Assets and Liabilities
Amounts in thousands (except per-share amount) | August 31, 2006 (Unaudited) |
| | |
Assets | | |
Investment in securities, at value -
See accompanying schedule: Unaffiliated issuers (cost $4,217,268) | | $ 4,217,268 |
Cash | | 90,738 |
Receivable for investments sold | | 4,461 |
Receivable for fund shares sold | | 106,979 |
Interest receivable | | 26,764 |
Prepaid expenses | | 4 |
Other receivables | | 1,006 |
Total assets | | 4,447,220 |
| | |
Liabilities | | |
Payable for investments purchased | $ 18,322 | |
Payable for fund shares redeemed | 59,473 | |
Distributions payable | 193 | |
Accrued management fee | 1,324 | |
Other affiliated payables | 987 | |
Other payables and accrued expenses | 117 | |
Total liabilities | | 80,416 |
| | |
Net Assets | | $ 4,366,804 |
Net Assets consist of: | | |
Paid in capital | | $ 4,366,602 |
Undistributed net investment income | | 83 |
Accumulated undistributed net realized gain (loss) on investments | | 119 |
Net Assets, for 4,365,748 shares outstanding | | $ 4,366,804 |
Net Asset Value, offering price and redemption price per share ($4,366,804 ÷ 4,365,748 shares) | | $ 1.00 |
See accompanying notes which are an integral part of the financial statements.
Semiannual Report
Fidelity California Municipal Money Market Fund
Financial Statements - continued
Statement of Operations
Amounts in thousands | Six months ended August 31, 2006 (Unaudited) |
| | |
Investment Income | | |
Interest | | $ 70,279 |
| | |
Expenses | | |
Management fee | $ 7,666 | |
Transfer agent fees | 2,719 | |
Accounting fees and expenses | 174 | |
Independent trustees' compensation | 8 | |
Custodian fees and expenses | 33 | |
Registration fees | 70 | |
Audit | 29 | |
Legal | 6 | |
Miscellaneous | 16 | |
Total expenses before reductions | 10,721 | |
Expense reductions | (2,904) | 7,817 |
Net investment income | | 62,462 |
Realized and Unrealized Gain (Loss) Net realized gain (loss) on: | | |
Investment securities: | | |
Unaffiliated issuers | | 209 |
Net increase in net assets resulting from operations | | $ 62,671 |
See accompanying notes which are an integral part of the financial statements.
Semiannual Report
Statement of Changes in Net Assets
Amounts in thousands | Six months ended
August 31, 2006
(Unaudited) | Year ended
February 28,
2006 |
Increase (Decrease) in Net Assets | | |
Operations | | |
Net investment income | $ 62,462 | $ 81,280 |
Net realized gain (loss) | 209 | 47 |
Net increase in net assets resulting
from operations | 62,671 | 81,327 |
Distributions to shareholders from net investment income | (62,463) | (81,250) |
Share transactions at net asset value of $1.00 per share
Proceeds from sales of shares | 10,072,558 | 15,764,573 |
Reinvestment of distributions | 61,490 | 80,226 |
Cost of shares redeemed | (9,863,259) | (15,222,801) |
Net increase (decrease) in net assets and shares resulting from share transactions | 270,789 | 621,998 |
Total increase (decrease) in net assets | 270,997 | 622,075 |
| | |
Net Assets | | |
Beginning of period | 4,095,807 | 3,473,732 |
End of period (including undistributed net investment income of $83 and undistributed net investment income of $84, respectively) | $ 4,366,804 | $ 4,095,807 |
See accompanying notes which are an integral part of the financial statements.
Semiannual Report
Financial Highlights
| Six months ended
August 31, 2006 | Years ended February 28, |
| (Unaudited) | 2006 | 2005 | 2004 E | 2003 | 2002 |
Selected Per-Share Data | | | | | |
Net asset value, beginning of period | $ 1.00 | $ 1.00 | $ 1.00 | $ 1.00 | $ 1.00 | $ 1.00 |
Income from Investment Operations | | | | | | |
Net investment income | .015 | .022 | .009 | .006 | .010 | .019 |
Distributions from net investment income | (.015) | (.022) | (.009) | (.006) | (.010) | (.019) |
Net asset value,
end of period | $ 1.00 | $ 1.00 | $ 1.00 | $ 1.00 | $ 1.00 | $ 1.00 |
Total Return B, C | 1.52% | 2.19% | .87% | .57% | .99% | 1.89% |
Ratios to Average Net Assets D | | | | | |
Expenses before reductions | .51% A | .52% | .53% | .52% | .52% | .52% |
Expenses net of fee waivers, if any | .51% A | .52% | .53% | .52% | .52% | .52% |
Expenses net of all reductions | .37% A | .41% | .50% | .50% | .49% | .48% |
Net investment income | 2.99% A | 2.18% | .88% | .56% | .98% | 1.86% |
Supplemental Data | | | | | |
Net assets,
end of period
(in millions) | $ 4,367 | $ 4,096 | $ 3,474 | $ 2,899 | $ 2,626 | $ 2,239 |
A Annualized
B Total returns for periods of less than one year are not annualized.
C Total returns would have been lower had certain expenses not been reduced during the periods shown.
D Expense ratios reflect operating expenses of the Fund. Expenses before reductions do not reflect amounts reimbursed by the investment adviser or expense offset arrangements and do not represent the amount paid by the Fund during periods when reimbursements or reductions occur. Expenses net of fee waivers reflect expenses after reimbursement by the investment adviser but prior to reductions from expense offset arrangements. Expenses net of all reductions represent the net expenses paid by the Fund.
E For the year ended February 29.
See accompanying notes which are an integral part of the financial statements.
Semiannual Report
Notes to Financial Statements
For the period ended August 31, 2006 (Unaudited)
(Amounts in thousands except ratios)
1. Significant Accounting Policies.
Fidelity California AMT Tax-Free Money Market Fund and Fidelity California Municipal Money Market Fund (the Funds) are funds of Fidelity California Municipal Trust II (the trust). The trust is registered under the Investment Company Act of 1940, as amended (the 1940 Act), as an open-end management investment company organized as a Delaware statutory trust. Each Fund is authorized to issue an unlimited number of shares. Each Fund may be affected by economic and political developments in the state of California. The financial statements have been prepared in conformity with accounting principles generally accepted in the United States of America, which require management to make certain estimates and assumptions at the date of the financial statements. The following summarizes the significant accounting policies of the Funds:
Security Valuation. Net asset value per share is calculated as of the close of business of the New York Stock Exchange, normally 4:00 p.m. Eastern time. As permitted by compliance with certain conditions under Rule 2a-7 of the 1940 Act, securities are valued at amortized cost, which approximates value. Investments in open-end mutual funds are valued at their closing net asset value each business day.
Investment Transactions and Income. Security transactions are accounted for as of trade date. Gains and losses on securities sold are determined on the basis of identified cost. Interest income is accrued as earned. Interest income includes coupon interest and amortization of premium and accretion of discount on debt securities.
Expenses. Most expenses of the trust can be directly attributed to a fund. Expenses which cannot be directly attributed are apportioned among each Fund in the trust. Expense estimates are accrued in the period to which they relate and adjustments are made when actual amounts are known.
Income Tax Information and Distributions to Shareholders. Each year, each Fund intends to qualify as a regulated investment company by distributing all of its taxable income and realized gains under Subchapter M of the Internal Revenue Code. As a result, no provision for income taxes is required in the accompanying financial statements.
Dividends are declared daily and paid monthly from net investment income. Distributions from realized gains, if any, are recorded on the ex-dividend date. Income and capital gain distributions are determined in accordance with income tax regulations, which may differ from generally accepted accounting principles.
Capital accounts within the financial statements are adjusted for permanent book-tax differences. These adjustments have no impact on net assets or the results of operations. Temporary book-tax differences will reverse in a subsequent period.
Semiannual Report
Notes to Financial Statements (Unaudited) - continued
(Amounts in thousands except ratios)
1. Significant Accounting Policies - continued
Income Tax Information and Distributions to Shareholders - continued
Book-tax differences are primarily due to deferred trustees compensation and losses deferred due to excise tax regulations.
The Funds purchase municipal securities whose interest, in the opinion of the issuer, is free from federal income tax. There is no assurance that the Internal Revenue Service (IRS) will agree with this opinion. In the event the IRS determines that the issuer does not comply with relevant tax requirements, interest payments from a security could become federally taxable, possibly retroactively to the date the security was issued.
The federal tax cost of investments and unrealized appreciation (depreciation) as of period end were as follows for each Fund:
| Cost for Federal
Income Tax Purposes | Unrealized
Appreciation | Unrealized
Depreciation | Net Unrealized
Appreciation/
(Depreciation) |
Fidelity California AMT Tax-Free Money Market Fund | $ 2,851,113 | $ - | $ - | $ - |
Fidelity California Municipal Money Market Fund | 4,217,268 | - | - | - |
New Accounting Pronouncements. In July 2006, Financial Accounting Standards Board Interpretation No. 48, Accounting for Uncertainty in Income Taxes - an interpretation of FASB Statement 109 (FIN 48), was issued and is effective for fiscal years beginning after December 15, 2006. FIN 48 sets forth a threshold for financial statement recognition, measurement and disclosure of a tax position taken or expected to be taken on a tax return. Management is currently evaluating the impact, if any, the adoption of FIN 48 will have on the Funds' net assets, results of operations and financial statement disclosures.
In addition, in September 2006, Statement of Financial Accounting Standards No. 157, Fair Value Measurements (SFAS 157), was issued and is effective for fiscal years beginning after November 15, 2007. SFAS 157 defines fair value, establishes a framework for measuring fair value and expands disclosures about fair value measurements. Management is currently evaluating the impact the adoption of SFAS 157 will have on the Funds' financial statement disclosures.
2. Operating Policies.
Restricted Securities. Certain Funds may invest in securities that are subject to legal or contractual restrictions on resale. These securities generally may be resold in transactions exempt from registration or to the public if the securities are registered. Disposal of these securities may involve time-consuming negotiations and expense, and prompt sale at an acceptable price may be difficult. Information regarding restricted securities is included at the end of each applicable Fund's Schedule of Investments.
Semiannual Report
3. Fees and Other Transactions with Affiliates.
Management Fee. Fidelity Management & Research Company (FMR) and its affiliates provide Fidelity California Municipal Money Market Fund with investment management related services for which the Fund pays a monthly management fee. The management fee is the sum of an individual fund fee rate that is based on an annual rate of .25% of the Fund's average net assets and a group fee rate that averaged .12% during the period. The group fee rate is based upon the average net assets of all the mutual funds advised by FMR. The group fee rate decreases as assets under management increase and increases as assets under management decrease. For the period, the total annualized management fee rate was .37% of the Fund's average net assets.
FMR and its affiliates provide Fidelity California AMT Tax-Free Money Market Fund with investment management related services for which the Fund pays a monthly management fee that is based on an annual rate of .43% of the Fund's average net assets. FMR pays all other expenses, except the compensation of the independent Trustees and certain exceptions such as interest expense, including commitment fees. The management fee paid to FMR by the Fund is reduced by an amount equal to the fees and expenses paid by the Fund to the independent Trustees.
Transfer Agent and Accounting Fees. Citibank, N.A. (Citibank) is the custodian, transfer agent and shareholder servicing agent for the Funds. Citibank has entered into a sub-arrangement with Fidelity Service Company, Inc. (FSC), an affiliate of FMR, under which FSC performs the activities associated with the Funds' transfer and shareholder servicing agent and accounting functions. Under the terms of the management fee contract, FMR pays transfer agent fees on behalf of Fidelity California AMT Tax-Free Money Market Fund. Fidelity California Municipal Money Market Fund pays account fees and asset-based fees that vary according to account size and type of account. FSC pays for typesetting, printing and mailing of shareholder reports, except proxy statements. The accounting fee is based on the level of average net assets for the month. For the period, Fidelity California Municipal Money Market Fund's transfer agent fees were equivalent to the following annualized rate expressed as a percentage average net assets.
Fidelity California Municipal Money Market Fund | .13% | |
Semiannual Report
Notes to Financial Statements (Unaudited) - continued
(Amounts in thousands except ratios)
4. Expense Reductions.
FMR voluntarily agreed to reimburse funds to the extent annual operating expenses exceeded certain levels of average net assets as noted in the table below. Some expenses, for example interest expense, are excluded from this reimbursement.
The following funds were in reimbursement during the period:
| Expense
Limitations | Reimbursement
from adviser |
Fidelity California AMT Tax-Free Money Market Fund | .35% | $ 975 |
In addition, through an arrangement with Fidelity California AMT Tax-Free Money Market Fund's custodian and transfer agent, $1,119 of credits realized as a result of uninvested cash balances were used to reduce the Fund's management fee.
Through arrangements with Fidelity California Municipal Money Market Fund's custodian and transfer agent, credits realized as a result of uninvested cash balances were used to reduce fund expenses. These expense reductions are noted in the table below.
| Custody
expense
reduction | Transfer
Agent
expense
reduction | Accounting
expense
reduction |
Fidelity California Municipal Money Market Fund | $ 33 | $ 2,719 | $ 152 |
5. Other.
The Funds' organizational documents provide former and current trustees and officers with a limited indemnification against liabilities arising in connection with the performance of their duties to the Funds. In the normal course of business, the Funds may also enter into contracts that provide general indemnifications. The Funds' maximum exposure under these arrangements is unknown as this would be dependent on future claims that may be made against the Funds. The risk of material loss from such claims is considered remote.
Semiannual Report
Board Approval of Investment Advisory Contracts and Management Fees
Fidelity California AMT Tax-Free Money Market Fund / Fidelity California Municipal Money Market Fund
Each year, typically in June, the Board of Trustees, including the Independent Trustees (together, the Board), votes on the renewal of the management contract and sub-advisory agreements (together, the Advisory Contracts) for each fund. The Board, assisted by the advice of fund counsel and Independent Trustees' counsel, requests and considers a broad range of information throughout the year.
The Board meets regularly each month except August and takes into account throughout the year matters bearing on Advisory Contracts. The Board, acting directly and through its separate committees, considers at each of its meetings factors that are relevant to the annual renewal of each fund's Advisory Contracts, including the services and support provided to each fund and its shareholders. At the time of the renewal, the Board had 12 standing committees, each composed of Independent Trustees with varying backgrounds, to which the Board has assigned specific subject matter responsibilities in order to enhance effective decision-making by the Board. Each committee has adopted a written charter outlining the structure and purposes of the committee. One such committee, the Fixed-Income Contract Committee, meets periodically as needed throughout the year to consider matters specifically related to the annual renewal of Advisory Contracts. The committee requests and receives information on, and makes recommendations to the Independent Trustees concerning, the approval and annual review of the Advisory Contracts.
At its June 2006 meeting, the Board of Trustees, including the Independent Trustees, unanimously determined to renew the Advisory Contracts for each fund. In reaching its determination, the Board considered all factors it believed relevant, including (i) the nature, extent, and quality of the services to be provided to each fund and its shareholders (including the investment performance of each fund); (ii) the competitiveness of the management fee and total expenses of each fund; (iii) the total costs of the services to be provided by and the profits to be realized by the investment adviser and its affiliates from the relationship with each fund; (iv) the extent to which economies of scale would be realized as each fund grows; and (v) whether fee levels reflect these economies of scale, if any, for the benefit of fund shareholders.
In determining whether to renew the Advisory Contracts for each fund, the Board ultimately reached a determination, with the assistance of fund counsel and Independent Trustees' counsel, that the renewal of the Advisory Contracts and the compensation to be received by Fidelity under the management contracts is consistent with Fidelity's fiduciary duty under applicable law. In addition to evaluating the specific factors noted above, the Board, in reaching its determination, is aware that shareholders in each fund have a broad range of investment choices available to them, including a wide choice among mutual funds offered by competitors to Fidelity, and that each fund's shareholders, with the opportunity to review and weigh the disclosure provided by the fund in its prospectus and other public disclosures, have chosen to invest in that fund, managed by Fidelity.
Semiannual Report
Board Approval of Investment Advisory Contracts and
Management Fees - continued
Nature, Extent, and Quality of Services Provided. The Board considered staffing within the investment adviser, FMR, and the sub-advisers (together, the Investment Advisers), including the backgrounds of the funds' portfolio managers and the funds' investment objectives and disciplines. The Independent Trustees also had discussions with senior management of Fidelity's investment operations and investment groups. The Board considered the structure of the portfolio manager compensation program and whether this structure provides appropriate incentives.
Resources Dedicated to Investment Management and Support Services. The Board reviewed the size, education, and experience of the Investment Advisers' investment staff, their use of technology, and the Investment Advisers' approach to recruiting, training, and retaining portfolio managers and other research, advisory, and management personnel. The Board considered Fidelity's extensive global research capabilities that enable the Investment Advisers to aggregate data from various sources in an effort to produce positive investment results. The Board noted that Fidelity's analysts have access to a variety of technological tools that enable them to perform both fundamental and quantitative analysis and to specialize in various disciplines. The Board also considered that Fidelity's portfolio managers and analysts have access to daily portfolio attribution that allows for monitoring of a fund's portfolio, as well as an electronic communication system that provides immediate real-time access to research concerning issuers and credit enhancers. In addition, the Board considered the trading resources that are an integrated part of the fixed-income portfolio management investment process.
Shareholder and Administrative Services. The Board considered (i) the nature, extent, quality, and cost of administrative, distribution, and shareholder services performed by the Investment Advisers and their affiliates under the Advisory Contracts and under separate agreements covering transfer agency and pricing and bookkeeping services for each fund; (ii) the nature and extent of the Investment Advisers' supervision of third party service providers, principally custodians and subcustodians; and (iii) the resources devoted to, and the record of compliance with,each fund's compliance policies and procedures.
The Board noted that the growth of fund assets across the complex allows Fidelity to reinvest in the development of services designed to enhance the value or convenience of the Fidelity funds as investment vehicles. These services include 24-hour access to account information and market information through phone representatives and over the Internet, and investor education materials and asset allocation tools.
Semiannual Report
Investment in a Large Fund Family. The Board considered the benefits to shareholders of investing in a Fidelity fund, including the benefits of investing in a fund that is part of a large family of funds offering a variety of investment disciplines and providing for a large variety of mutual fund investor services. For example, fund shareholders are offered the privilege of exchanging shares of a fund for shares of other Fidelity funds, as set forth in the fund's prospectus, without paying a sales charge. The Board noted that, since the last Advisory Contract renewals in June 2005, Fidelity has taken a number of actions that benefited particular funds, including (i) dedicating additional resources to investment research and to restructure the investment research teams; (ii) voluntarily entering into contractual arrangements with certain brokers pursuant to which Fidelity pays for research products and services separately out of its own resources, rather than bundling with fund commissions; (iii) launching the Fidelity Advantage Class of its five Spartan stock index funds and three Spartan bond index funds, which is a lower-fee class available to shareholders with higher account balances; (iv) contractually agreeing to impose expense limitations on Fidelity U.S. Bond Index Fund and reducing the fund's initial investment minimum; and (v) offering shareholders of each of the Fidelity Institutional Money Market Funds the privilege of exchanging shares of the fund for shares of other Fidelity funds.
Investment Performance. The Board considered whether each fund has operated within its investment objective, as well as its record of compliance with its investment restrictions. It also reviewed each fund's absolute investment performance, as well as each fund's relative investment performance measured against a peer group of mutual funds deemed appropriate by the Board over multiple periods. For each fund, the following charts considered by the Board show, over the one-, three-, and five-year periods ended December 31, 2005, the fund's cumulative total returns and a range of cumulative total returns of a peer group of mutual funds identified by Lipper Inc. as having an investment objective similar to that of the fund. The box within each chart shows the 25th percentile return (bottom of box) and the 75th percentile return (top of box) of the Lipper peer group. Returns shown above the box are in the first quartile and returns shown below the box are in the fourth quartile. The percentage beaten number noted below each chart corresponds to the percentile box and represents the percentage of funds in the Lipper peer group whose performance was equal to or lower than that of the fund.
Semiannual Report
Board Approval of Investment Advisory Contracts and
Management Fees - continued
Fidelity California AMT Tax-Free Money Market Fund
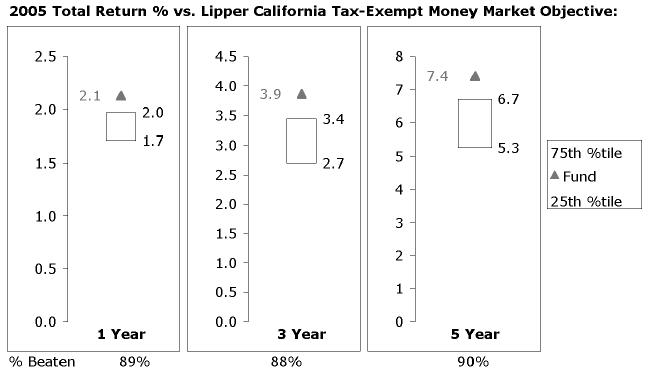
The Board reviewed the fund's relative investment performance against its Lipper peer group and stated that the performance of the fund was in the first quartile for all the periods shown.
Fidelity California Municipal Money Market Fund
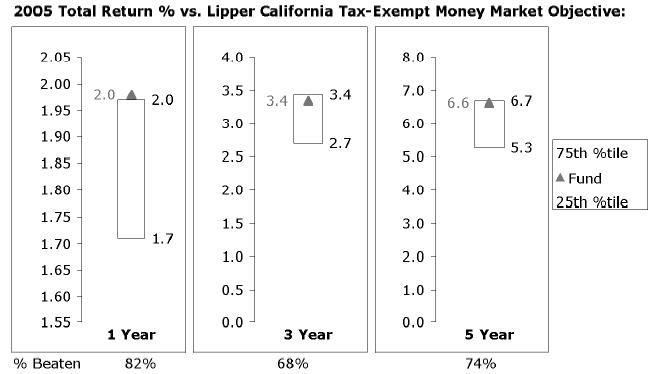
Semiannual Report
The Board reviewed the fund's relative investment performance against its Lipper peer group and stated that the performance of the fund was in the first quartile for the one-year period and the second quartile for the three- and five-year periods.
Based on its review, and giving particular weight to the nature and quality of the resources dedicated by the Investment Advisers to maintain and improve relative performance, the Board concluded that the nature, extent, and quality of the services provided to each fund will benefit each fund's shareholders, particularly in light of the Board's view that each fund's shareholders benefit from investing in a fund that is part of a large family of funds offering a variety of investment disciplines and services.
Competitiveness of Management Fee and Total Fund Expenses. The Board considered each fund's management fee and total expenses compared to "mapped groups" of competitive funds and classes. Fidelity creates "mapped groups" by combining similar Lipper investment objective categories that have comparable management fee characteristics. Combining Lipper investment objective categories aids the Board's management fee and total expense comparisons by broadening the competitive group used for comparison and by reducing the number of universes to which various Fidelity funds are compared.
The Board considered two proprietary management fee comparisons for the 12-month periods shown in the charts below. The group of Lipper funds used by the Board for management fee comparisons is referred to below as the "Total Mapped Group" and, for the reasons explained above, is broader than the Lipper peer group used by the Board for performance comparisons. The Total Mapped Group comparison focuses on a fund's standing relative to the total universe of comparable funds available to investors, in terms of gross management fees before expense reimbursements or caps. "TMG %" represents the percentage of funds in the Total Mapped Group that had management fees that were lower than a fund's. For example, a TMG % of 25% would mean that 75% of the funds in the Total Mapped Group had higher management fees than a fund. The "Asset-Size Peer Group" (ASPG) comparison focuses on a fund's standing relative to non-Fidelity funds similar in size to the fund within the Total Mapped Group. The ASPG represents at least 15% of the funds in the Total Mapped Group with comparable asset size and management fee characteristics, subject to a minimum of 50 funds (or all funds in the Total Mapped Group if fewer than 50). Additional information, such as the ASPG quartile in which a fund's management fee ranked, is also included in the charts and considered by the Board. For a more meaningful comparison of management fees, Fidelity California AMT Tax-Free Money Market Fund is compared on the basis of a hypothetical "net management fee," which is derived by subtracting payments made by FMR for non-management expenses (including transfer agent fees, pricing and bookkeeping fees, and custody fees) from the fund's all-inclusive fee. In this regard, the Board realizes that net management fees can vary from year to year because of differences in non-management expenses.
Semiannual Report
Board Approval of Investment Advisory Contracts and
Management Fees - continued
Fidelity California AMT Tax-Free Money Market Fund
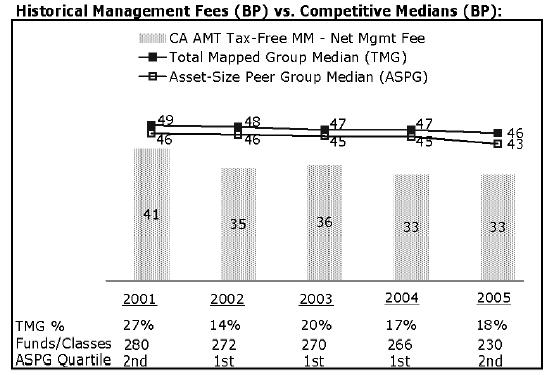
Fidelity California Municipal Money Market Fund

The Board noted that each fund's management fee ranked below the median of its Total Mapped Group and below the median of its ASPG for 2005. Based on its review, the Board concluded that each fund's management fee was fair and reasonable in light of the services that the fund receives and the other factors considered.
Semiannual Report
In its review of Fidelity California AMT Tax-Free Money Market Fund's total expenses, the Board considered the fund's hypothetical net management fee as well as the fund's all-inclusive fee. The Board also considered other expenses, such as transfer agent fees, pricing and bookkeeping fees, and custodial, legal, and audit fees, paid by FMR under the all-inclusive arrangement. The Board also noted the effects of any waivers and reimbursements on fees and expenses.
In its review of Fidelity California Municipal Money Market Fund's total expenses, the Board considered the fund's management fee as well as other fund expenses, such as transfer agent fees, pricing and bookkeeping fees, and custodial, legal, and audit fees. The Board also noted the effects of any waivers and reimbursements on fees and expenses.
As part of its review, the Board also considered current and historical total expenses of each fund compared to competitive fund median expenses. Each fund is compared to those funds and classes in the Total Mapped Group (used by the Board for management fee comparisons) that have a similar sales load structure.
The Board noted that each fund's total expenses ranked below its competitive median for 2005.
In its review of total expenses, the Board also considered Fidelity fee structures and other information on clients that FMR and its affiliates service in other competitive markets, such as other mutual funds advised or subadvised by FMR or its affiliates, pension plan clients, and other institutional clients.
Based on its review, the Board concluded that each fund's total expenses were reasonable in light of the services that the fund and its shareholders receive and the other factors considered.
Costs of the Services and Profitability. The Board considered the revenues earned and the expenses incurred by Fidelity in conducting the business of developing, marketing, distributing, managing, administering and servicing each fund and its shareholders. The Board also considered the level of Fidelity's profits in respect of all the Fidelity funds.
On an annual basis, FMR presents to the Board Fidelity's profitability for each fund. Fidelity calculates the profitability for each fund, as well as aggregate profitability for groups of Fidelity funds and all Fidelity funds, using a series of detailed revenue and cost allocation methodologies which originate with the audited books and records of Fidelity. The Audit Committee of the Board reviews any significant changes from the prior year's methodologies.
PricewaterhouseCoopers LLP (PwC), independent registered accounting firm and auditor to Fidelity and certain Fidelity funds, has been engaged annually by the Board as part of the Board's assessment of the results of Fidelity's profitability analysis. PwC's engagement includes the review and assessment of Fidelity's methodologies used in determining the revenues and expenses attributable to Fidelity's mutual fund business, and completion of agreed-upon procedures surrounding the mathematical accuracy of fund profitability and its conformity to allocation methodologies. After considering PwC's reports issued under the engagement and information provided by Fidelity, the Board believes that while other allocation methods may also be reasonable, Fidelity's profitability methodologies are reasonable in all material respects.
Semiannual Report
Board Approval of Investment Advisory Contracts and
Management Fees - continued
The Board has also reviewed Fidelity's non-fund businesses and any fall-out benefits related to the mutual fund business as well as cases where Fidelity's affiliates may benefit from or be related to the funds' business.
The Board considered the costs of the services provided by and the profits realized by Fidelity in connection with the operation of each fund and determined that the amount of profit is a fair entrepreneurial profit for the management of each fund.
Economies of Scale. The Board considered whether there have been economies of scale in respect of the management of the Fidelity funds, whether the Fidelity funds (including each fund) have appropriately benefited from any such economies of scale, and whether there is potential for realization of any further economies of scale. The Board considered the extent to which each fund will benefit from economies of scale through increased services to the fund, through waivers or reimbursements, or through fee or expense reductions, including (Fidelity California Municipal Money Market Fund only) reductions that occur through operation of the transfer agent agreement. The transfer agent fee varies in part based on the number of accounts in the fund. If the number of accounts decreases or the average account size increases, the overall transfer agent fee rate decreases.
The Board recognized that Fidelity California Municipal Money Market Fund's management contract incorporates a "group fee" structure, which provides for lower fee rates as total fund assets under FMR's management increase, and for higher fee rates as total fund assets under FMR's management decrease. The Board considered that the group fee is designed to deliver the benefits of economies of scale to fund shareholders when total fund assets increase, even if assets of any particular fund are unchanged or have declined, because some portion of Fidelity's costs are attributable to services provided to all Fidelity funds, and all funds benefit if those costs can be allocated among more assets. The Board concluded that, given the group fee structure, fund shareholders will achieve a certain level of economies of scale as assets under FMR's management increase at the fund complex level, regardless of whether Fidelity achieves any such economies of scale.
The Board further concluded that any potential economies of scale are being shared between fund shareholders and Fidelity in an appropriate manner.
Semiannual Report
Additional Information Requested by the Board. In order to develop fully the factual basis for consideration of the Advisory Contracts, the Board requested additional information on several topics, including (i) Fidelity's fund profitability methodology and profitability trends within certain funds; (ii) funds and accounts managed by Fidelity other than the Fidelity funds, including fee arrangements; (iii) the total expenses of certain funds and classes relative to competitors; (iv) fund performance trends; and (v) Fidelity's fee structures.
Based on its evaluation of all of the conclusions noted above, and after considering all material factors, the Board ultimately concluded that the advisory fee structures are fair and reasonable, and that each fund's Advisory Contracts should be renewed.
Semiannual Report
Managing Your Investments
Fidelity offers several ways to conveniently manage your personal investments via your telephone or PC. You can access your account information, conduct trades and research your investments 24 hours a day.
By Phone
Fidelity Automated Service Telephone provides a single toll-free number to access account balances, positions, quotes and trading. It's easy to navigate the service, and on your first call, the system will help you create a personal identification number (PIN) for security.
(phone_graphic)
Fidelity Automated
Service Telephone (FAST®)
1-800-544-5555
Press
1 For mutual fund and brokerage trading.
2 For quotes.*
3 For account balances and holdings.
4 To review orders and mutual
fund activity.
5 To change your PIN.
*0 To speak to a Fidelity representative.
By PC
Fidelity's web site on the Internet provides a wide range of information, including daily financial news, fund performance, interactive planning tools and news about Fidelity products and services.
(computer_graphic)
Fidelity's Web Site
www.fidelity.com
* When you call the quotes line, please remember that a fund's yield and return will vary and, except for money market funds, share price will also vary. This means that you may have a gain or loss when you sell your shares. There is no assurance that money market funds will be able to maintain a stable $1 share price; an investment in a money market fund is not insured or guaranteed by the U.S. government. Total returns are historical and include changes in share price, reinvestment of dividends and capital gains, and the effects of any sales charges.
Semiannual Report
To Write Fidelity
We'll give your correspondence immediate attention and send you written confirmation upon completion of your request.
(letter_graphic)
Making Changes
To Your Account
(such as changing name, address, bank, etc.)
Fidelity Investments
P.O. Box 770001
Cincinnati, OH 45277-0002
(letter_graphic)
For Non-Retirement
Accounts
Buying shares
Fidelity Investments
P.O. Box 770001
Cincinnati, OH 45277-0003
Overnight Express
Fidelity Investments
Attn: Distribution Services
100 Crosby Parkway - KC1H
Covington, KY 41015
Selling shares
Fidelity Investments
P.O. Box 770001
Cincinnati, OH 45277-0035
Overnight Express
Fidelity Investments
Attn: Distribution Services
100 Crosby Parkway - KC1H
Covington, KY 41015
General Correspondence
Fidelity Investments
P.O. Box 500
Merrimack, NH 03054-0500
(letter_graphic)
For Retirement
Accounts
Buying shares
Fidelity Investments
P.O. Box 770001
Cincinnati, OH 45277-0003
Selling shares
Fidelity Investments
P.O. Box 770001
Cincinnati, OH 45277-0035
Overnight Express
Fidelity Investments
Attn: Distribution Services
100 Crosby Parkway - KC1H
Covington, KY 41015
General Correspondence
Fidelity Investments
P.O. Box 500
Merrimack, NH 03054-0500
Semiannual Report
To Visit Fidelity
For directions and hours,
please call 1-800-544-9797.
Arizona
7001 West Ray Road
Chandler, AZ
15445 N. Scottsdale Road
Scottsdale, AZ
California
815 East Birch Street
Brea, CA
1411 Chapin Avenue
Burlingame, CA
851 East Hamilton Avenue
Campbell, CA
19200 Von Karman Avenue
Irvine, CA
601 Larkspur Landing Circle
Larkspur, CA
10100 Santa Monica Blvd.
Los Angeles, CA
27101 Puerta Real
Mission Viejo, CA
73-575 El Paseo
Palm Desert, CA
251 University Avenue
Palo Alto, CA
123 South Lake Avenue
Pasadena, CA
16995 Bernardo Ctr. Drive
Rancho Bernardo, CA
1220 Roseville Parkway
Roseville, CA
1740 Arden Way
Sacramento, CA
7676 Hazard Center Drive
San Diego, CA
11943 El Camino Real
San Diego, CA
8 Montgomery Street
San Francisco, CA
3793 State Street
Santa Barbara, CA
1200 Wilshire Boulevard
Santa Monica, CA
21701 Hawthorne Boulevard
Torrance, CA
2001 North Main Street
Walnut Creek, CA
6300 Canoga Avenue
Woodland Hills, CA
Colorado
1625 Broadway
Denver, CO
9185 Westview Road
Lone Tree, CO
Connecticut
48 West Putnam Avenue
Greenwich, CT
265 Church Street
New Haven, CT
300 Atlantic Street
Stamford, CT
29 South Main Street
West Hartford, CT
Delaware
400 Delaware Avenue
Wilmington, DE
Florida
4400 N. Federal Highway
Boca Raton, FL
121 Alhambra Plaza
Coral Gables, FL
2948 N. Federal Highway
Ft. Lauderdale, FL
4671 Town Center Parkway
Jacksonville, FL
1907 West State Road 434
Longwood, FL
8880 Tamiami Trail, North
Naples, FL
3501 PGA Boulevard
Palm Beach Gardens, FL
3550 Tamiami Trail, South
Sarasota, FL
1502 N. Westshore Blvd.
Tampa, FL
2465 State Road 7
Wellington, FL
Georgia
3445 Peachtree Road, N.E.
Atlanta, GA
1000 Abernathy Road
Atlanta, GA
Illinois
One North LaSalle Street
Chicago, IL
875 North Michigan Ave.
Chicago, IL
1415 West 22nd Street
Oak Brook, IL
1572 East Golf Road
Schaumburg, IL
3232 Lake Avenue
Wilmette, IL
Indiana
4729 East 82nd Street
Indianapolis, IN
Kansas
5400 College Boulevard
Overland Park, KS
Maine
Three Canal Plaza
Portland, ME
Maryland
7315 Wisconsin Avenue
Bethesda, MD
One W. Pennsylvania Ave.
Towson, MD
Massachusetts
801 Boylston Street
Boston, MA
155 Congress Street
Boston, MA
300 Granite Street
Braintree, MA
44 Mall Road
Burlington, MA
238 Main Street
Cambridge, MA
405 Cochituate Road
Framingham, MA
416 Belmont Street
Worcester, MA
Semiannual Report
Michigan
500 E. Eisenhower Pkwy.
Ann Arbor, MI
280 Old N. Woodward Ave.
Birmingham, MI
43420 Grand River Avenue
Novi, MI
29155 Northwestern Hwy.
Southfield, MI
Minnesota
7600 France Avenue South
Edina, MN
Missouri
1524 South Lindbergh Blvd.
St. Louis, MO
Nevada
2225 Village Walk Drive
Henderson, NV
New Jersey
150 Essex Street
Millburn, NJ
56 South Street
Morristown, NJ
396 Route 17, North
Paramus, NJ
3518 Route 1 North
Princeton, NJ
530 Broad Street
Shrewsbury, NJ
New York
1055 Franklin Avenue
Garden City, NY
37 West Jericho Turnpike
Huntington Station, NY
1271 Avenue of the Americas
New York, NY
980 Madison Avenue
New York, NY
61 Broadway
New York, NY
350 Park Avenue
New York, NY
200 Fifth Avenue
New York, NY
733 Third Avenue
New York, NY
11 Penn Plaza
New York, NY
2070 Broadway
New York, NY
1075 Northern Blvd.
Roslyn, NY
799 Central Park Avenue
Scarsdale, NY
North Carolina
4611 Sharon Road
Charlotte, NC
7011 Fayetteville Road
Durham, NC
Ohio
3805 Edwards Road
Cincinnati, OH
1324 Polaris Parkway
Columbus, OH
28699 Chagrin Boulevard
Woodmere Village, OH
Oregon
7493 SW Bridgeport Road
Tigard, OR
Pennsylvania
600 West DeKalb Pike
King of Prussia, PA
1735 Market Street
Philadelphia, PA
12001 Perry Highway
Wexford, PA
Rhode Island
47 Providence Place
Providence, RI
Tennessee
6150 Poplar Avenue
Memphis, TN
Texas
10000 Research Boulevard
Austin, TX
4001 Northwest Parkway
Dallas, TX
12532 Memorial Drive
Houston, TX
2701 Drexel Drive
Houston, TX
6560 Fannin Street
Houston, TX
6500 N. MacArthur Blvd.
Irving, TX
6005 West Park Boulevard
Plano, TX
14100 San Pedro
San Antonio, TX
1576 East Southlake Blvd.
Southlake, TX
19740 IH 45 North
Spring, TX
Utah
279 West South Temple
Salt Lake City, UT
Virginia
1861 International Drive
McLean, VA
Washington
411 108th Avenue, N.E.
Bellevue, WA
1518 6th Avenue
Seattle, WA
Washington, DC
1900 K Street, N.W.
Washington, DC
Wisconsin
595 North Barker Road
Brookfield, WI
Fidelity Brokerage Services, Inc., 100 Summer St., Boston, MA 02110 Member NYSE/SIPC
Semiannual Report
Investment Adviser
Fidelity Management & Research
Company
Boston, MA
Investment Sub-Adviser
Fidelity Investments Money
Management, Inc.
Fidelity International Investment Advisors
Fidelity International Investment Advisors
(U.K.) Limited
Fidelity Research & Analysis Company
(formerly Fidelity Management & Research (Far East) Inc.)
General Distributor
Fidelity Distributors Corporation
Boston, MA
Transfer and Service Agent
Citibank, N.A.
New York, NY
Fidelity Service Company, Inc.
Boston, MA
Custodian
Citibank, N.A.
New York, NY
The Fidelity Telephone Connection
Mutual Fund 24-Hour Service
Exchanges/Redemptions
and Account Assistance 1-800-544-6666
Product Information 1-800-544-6666
Retirement Accounts 1-800-544-4774 (8 a.m. - 9 p.m.)
TDD Service 1-800-544-0118
for the deaf and hearing impaired
(9 a.m. - 9 p.m. Eastern time)
Fidelity Automated Service
Telephone (FAST®) (automated graphic) 1-800-544-5555
(automated graphic) Automated line for quickest service
CMS-USAN-1006
1.790943.103
(Fidelity Investment logo)(registered trademark)
Corporate Headquarters
82 Devonshire St., Boston, MA 02109
www.fidelity.com
Item 2. Code of Ethics
Not applicable.
Item 3. Audit Committee Financial Expert
Not applicable.
Item 4. Principal Accountant Fees and Services
Not applicable.
Item 5. Audit Committee of Listed Registrants
Not applicable.
Item 6. Schedule of Investments
Not applicable.
Item 7. Disclosure of Proxy Voting Policies and Procedures for Closed-End Management Investment Companies
Not applicable.
Item 8. Portfolio Managers of Closed-End Management Investment Companies
Not applicable.
Item 9. Purchase of Equity Securities by Closed-End Management Investment Company and Affiliated Purchasers
Not applicable.
Item 10. Submission of Matters to a Vote of Security Holders
There were no material changes to the procedures by which shareholders may recommend nominees to the Fidelity California Municipal Trust II's Board of Trustees.
Item 11. Controls and Procedures
(a)(i) The President and Treasurer and the Chief Financial Officer have concluded that the Fidelity California Municipal Trust II's (the "Trust") disclosure controls and procedures (as defined in Rule 30a-3(c) under the Investment Company Act) provide reasonable assurances that material information relating to the Trust is made known to them by the appropriate persons, based on their evaluation of these controls and procedures as of a date within 90 days of the filing date of this report.
(a)(ii) There was no change in the Trust's internal control over financial reporting (as defined in Rule 30a-3(d) under the Investment Company Act) that occurred during the second fiscal quarter of the period covered by this report that has materially affected, or is reasonably likely to materially affect, the Trust's internal control over financial reporting.
Item 12. Exhibits
(a) | (1) | Not applicable. |
(a) | (2) | Certification pursuant to Rule 30a-2(a) under the Investment Company Act of 1940 (17 CFR 270.30a-2(a)) is filed and attached hereto as Exhibit 99.CERT. |
(a) | (3) | Not applicable. |
(b) | | Certification pursuant to Rule 30a-2(b) under the Investment Company Act of 1940 (17 CFR 270.30a-2(b)) is furnished and attached hereto as Exhibit 99.906CERT. |
SIGNATURES
Pursuant to the requirements of the Securities Exchange Act of 1934 and the Investment Company Act of 1940, the registrant has duly caused this report to be signed on its behalf by the undersigned, thereunto duly authorized.
Fidelity California Municipal Trust II
By: | /s/Christine Reynolds |
| Christine Reynolds |
| President and Treasurer |
| |
Date: | October 20, 2006 |
Pursuant to the requirements of the Securities Exchange Act of 1934 and the Investment Company Act of 1940, this report has been signed below by the following persons on behalf of the registrant and in the capacities and on the dates indicated.
By: | /s/Christine Reynolds |
| Christine Reynolds |
| President and Treasurer |
| |
Date: | October 20, 2006 |
By: | /s/Joseph B. Hollis |
| Joseph B. Hollis |
| Chief Financial Officer |
| |
Date: | October 20, 2006 |