UNITED STATES
SECURITIES AND EXCHANGE COMMISSION
Washington, D.C. 20549
FORM N-CSR
CERTIFIED SHAREHOLDER REPORT OF REGISTERED
MANAGEMENT INVESTMENT COMPANIES
Investment Company Act file number 811-06397
Fidelity California Municipal Trust II
(Exact name of registrant as specified in charter)
245 Summer St., Boston, Massachusetts 02210
(Address of principal executive offices) (Zip code)
Margaret Carey, Secretary
245 Summer St.
Boston, Massachusetts 02210
(Name and address of agent for service)
Registrant's telephone number, including area code:
617-563-7000
| |
Date of fiscal year end: | February 29 |
|
|
Date of reporting period: | February 29, 2024 |
Item 1.
Reports to Stockholders
Fidelity® California Municipal Money Market Fund
Annual Report
February 29, 2024
Contents
To view a fund's proxy voting guidelines and proxy voting record for the 12-month period ended June 30, visit http://www.fidelity.com/proxyvotingresults or visit the Securities and Exchange Commission's (SEC) web site at http://www.sec.gov.
You may also call 1-800-544-8544, or for Institutional, call 1-877-208-0098, to request a free copy of the proxy voting guidelines.
Standard & Poor's, S&P and S&P 500 are registered service marks of The McGraw-Hill Companies, Inc. and have been licensed for use by Fidelity Distributors Corporation.
Other third-party marks appearing herein are the property of their respective owners.
All other marks appearing herein are registered or unregistered trademarks or service marks of FMR LLC or an affiliated company. © 2024 FMR LLC. All rights reserved.
This report and the financial statements contained herein are submitted for the general information of the shareholders of the Fund. This report is not authorized for distribution to prospective investors in the Fund unless preceded or accompanied by an effective prospectus.
A fund files its complete schedule of portfolio holdings with the SEC for the first and third quarters of each fiscal year on Form N-PORT. Forms N-PORT are available on the SEC's web site at http://www.sec.gov. A fund's Forms N-PORT may be reviewed and copied at the SEC's Public Reference Room in Washington, DC. Information regarding the operation of the SEC's Public Reference Room may be obtained by calling 1-800-SEC-0330.
For a complete list of a fund's portfolio holdings, view the most recent holdings listing, semiannual report, or annual report on Fidelity's web site at http://www.fidelity.com, http://www.institutional.fidelity.com, or http://www.401k.com, as applicable.
NOT FDIC INSURED •MAY LOSE VALUE •NO BANK GUARANTEE
Neither the Fund nor Fidelity Distributors Corporation is a bank.
| Current 7-Day Yields |
| | | |
| Fidelity® California Municipal Money Market Fund | 2.60% | |
| Institutional Class | 2.83% | |
| Premium Class | 2.72% | |
| | | |
Yield refers to the income paid by the Fund over a given period. Yield for money market funds is usually for seven-day periods, as it is here, though it is expressed as an annual percentage rate. Past performance is no guarantee of future results. Yield will vary and it's possible to lose money investing in the Fund. A portion of the Fund's expenses was reimbursed and/or waived. Absent such reimbursements and/or waivers the yield for the period ending February 29, 2024, the most recent period shown in the table, would have been 2.59% for Fidelity® California Municipal Money Market Fund, 2.77% for Institutional Class, and 2.71% for Premium Class. | |
| Effective Maturity Diversification (% of Fund's Investments) |
| Days |
| 1 - 7 | 63.5 | |
| 8 - 30 | 3.6 | |
| 31 - 60 | 9.4 | |
| 61 - 90 | 9.2 | |
| 91 - 180 | 9.0 | |
| > 180 | 5.3 | |
| Effective maturity is determined in accordance with the requirements of Rule 2a-7 under the Investment Company Act of 1940. |
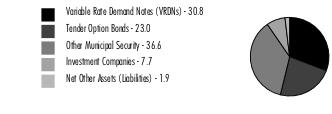
Asset Allocation (% of Fund's net assets) |
|
|
Showing Percentage of Net Assets
| Variable Rate Demand Note - 30.8% |
| | | Principal Amount (a) (000s) | Value ($) (000s) |
| Alabama - 0.5% | | | |
| Decatur Indl. Dev. Board Exempt Facilities Rev. (Nucor Steel Decatur LLC Proj.) Series 2003 A, 3.89% 3/7/24, VRDN (b)(c) | | 7,161 | 7,161 |
| West Jefferson Indl. Dev. Board Solid Waste Disp. Rev. (Alabama Pwr. Co. Plant Miller Proj.) Series 2023, 3.6% 3/7/24, VRDN (b)(c) | | 14,600 | 14,600 |
TOTAL ALABAMA | | | 21,761 |
| Arizona - 0.2% | | | |
| Maricopa County Poll. Cont. Rev.: | | | |
| (Arizona Pub. Svc. Co. Palo Verde Proj.) Series 2009 A, 3.48% 3/7/24, VRDN (b) | | 1,150 | 1,150 |
| Series 2009 B, 3.48% 3/7/24, VRDN (b) | | 6,400 | 6,400 |
| Series 2009 C, 3.3% 3/7/24, VRDN (b) | | 2,600 | 2,600 |
TOTAL ARIZONA | | | 10,150 |
| Arkansas - 0.1% | | | |
| Blytheville Indl. Dev. Rev. (Nucor Corp. Proj.) Series 1998, 3.89% 3/7/24, VRDN (b)(c) | | 3,000 | 3,000 |
| California - 26.6% | | | |
| Alameda County Indl. Dev. Auth. Rev. (Edward L. Shimmon, Inc. Proj.) Series 1996 A, 3.21% 3/7/24, LOC BNP Paribas SA, VRDN (b)(c) | | 3,200 | 3,200 |
| Bay Area Toll Auth. San Francisco Bay Toll Bridge Rev.: | | | |
| Series 2008 C1, 2.5% 3/7/24, LOC Sumitomo Mitsui Banking Corp., VRDN (b) | | 16,410 | 16,410 |
| Series 2008 E1, 2.3% 3/7/24, LOC MUFG Bank Ltd., VRDN (b) | | 11,350 | 11,350 |
| Series 2008 F1, 2.5% 3/7/24, LOC Sumitomo Mitsui Banking Corp., VRDN (b) | | 4,125 | 4,125 |
| Series 2024 A, 0% 3/7/24, LOC Sumitomo Mitsui Banking Corp., VRDN (b) | | 20,000 | 20,000 |
| Series 2024 B, 0% 3/7/24, LOC Sumitomo Mitsui Banking Corp., VRDN (b) | | 20,000 | 20,000 |
| Series 2024, 2.6% 3/7/24, LOC Sumitomo Mitsui Banking Corp., VRDN (b) | | 20,000 | 20,000 |
| California Gen. Oblig.: | | | |
| Series 2005 A2-1, 2.4% 3/7/24, LOC Sumitomo Mitsui Banking Corp., VRDN (b) | | 21,150 | 21,150 |
| Series 2005 B1, 2.36% 3/7/24, LOC Wells Fargo Bank NA, VRDN (b) | | 46,600 | 46,600 |
| Series 2005 B3, 2.47% 3/7/24, LOC Sumitomo Mitsui Banking Corp., VRDN (b) | | 31,700 | 31,700 |
| California Health Facilities Fing. Auth. Rev.: | | | |
| (Dignity Health Proj.) Series 2011 C, 2.41% 3/7/24, LOC Bank of Montreal, VRDN (b) | | 28,700 | 28,700 |
| Series 2008 B1, 2.4% 3/7/24, VRDN (b) | | 3,900 | 3,900 |
| California Poll. Cont. Fing. Auth. Solid Waste Disp. Rev. (Recology, Inc. Proj.) Series 2018 A, 2.93% 3/7/24, LOC Wells Fargo Bank NA, VRDN (b)(c)(d) | | 36,715 | 36,709 |
| California Pub. Fin. Auth. Rev.: | | | |
| Series 2024 B, 2.35% 3/7/24, LOC Royal Bank of Canada, VRDN (b) | | 22,000 | 22,000 |
| Series 2024 D, 2.4% 3/7/24, LOC TD Banknorth, NA, VRDN (b) | | 13,000 | 13,000 |
| California Statewide Cmntys. Dev. Auth. Multi-family Hsg. Rev.: | | | |
| (Irvine Apt. Cmntys. LP Proj.): | | | |
Series 2001 W1, 3.2% 3/1/24, LOC Wells Fargo Bank NA, VRDN (b)(c) | | 18,600 | 18,600 |
Series 2001 W2, 3.2% 3/1/24, LOC Wells Fargo Bank NA, VRDN (b)(c) | | 1,900 | 1,900 |
| (Maple Square Apt. Proj.) Series AA, 3.32% 3/7/24, LOC Citibank NA, VRDN (b)(c) | | 4,155 | 4,155 |
| (Terraces at Park Marino Proj.) Series I, 3.33% 3/7/24, LOC BMO Harris Bank NA, VRDN (b)(c) | | 4,470 | 4,470 |
| (The Crossings at Elk Grove Apts.) Series H, 2.54% 3/7/24, LOC Citibank NA, VRDN (b)(c) | | 5,530 | 5,530 |
| Calleguas-Las Virgenes Pub. Fing. Auth. Rev. (Calleguas Muni. Wtr. District Proj.) Series 2008 A, 2.68% 3/7/24, LOC Wells Fargo Bank NA, VRDN (b) | | 4,865 | 4,865 |
| Irvine Impt. Bond Act of 1915 (Assessment District #87-88 Proj.) Series 1999, 3.21% 3/1/24, LOC State Street Bank & Trust Co., Boston, VRDN (b) | | 4,900 | 4,900 |
| Irvine Ranch Wtr. District Rev.: | | | |
| (District #105, 113, 135, 161, 182, 213, 235, 250, 261 Impt. Proj.) Series 2008 A, 2.21% 3/7/24, LOC Sumitomo Mitsui Banking Corp., VRDN (b) | | 18,245 | 18,245 |
| Series 2009 B, 3.45% 3/1/24, LOC Bank of America NA, VRDN (b) | | 4,570 | 4,570 |
| Los Angeles Dept. of Wtr. & Pwr. Rev.: | | | |
| Series 2001 B3, 3.3% 3/1/24 (Liquidity Facility Barclays Bank PLC), VRDN (b) | | 2,800 | 2,800 |
| Series 2002 A2, 3.26% 3/1/24 (Liquidity Facility Bank of America NA), VRDN (b) | | 6,140 | 6,140 |
| Series 2023 C1, 3.4% 3/1/24 (Liquidity Facility TD Banknorth, NA), VRDN (b) | | 40,000 | 40,000 |
| Series 2023 F2, 3.3% 3/1/24 (Liquidity Facility JPMorgan Chase Bank), VRDN (b) | | 4,455 | 4,455 |
| Los Angeles Dept. of Wtr. & Pwr. Wtrwks. Rev.: | | | |
| Series 2001 B1, 2.25% 3/7/24 (Liquidity Facility PNC Bank NA), VRDN (b) | | 19,100 | 19,100 |
| Series 2001 B3, 2.2% 3/7/24 (Liquidity Facility PNC Bank NA), VRDN (b) | | 6,000 | 6,000 |
| Series 2001 B4, 3.4% 3/1/24 (Liquidity Facility Barclays Bank PLC), VRDN (b) | | 5,500 | 5,500 |
| Series 2019 A1, 3.3% 3/1/24 (Liquidity Facility Barclays Bank PLC), VRDN (b) | | 5,000 | 5,000 |
| Los Angeles Multi-family Hsg. Rev. (Colonia Corona Apts. Proj.) Series 2004 D, 2.54% 3/7/24, LOC Citibank NA, VRDN (b)(c) | | 2,100 | 2,100 |
| Orange County Wtr. District Rev. Ctfs. of Prtn. Series 2003 A, 2.4% 3/7/24, LOC Bank of America NA, VRDN (b) | | 86,875 | 86,875 |
| Riverside Ctfs. of Prtn. (Riverside Renaissance Proj.) Series 2008, 2.31% 3/7/24, LOC Bank of America NA, VRDN (b) | | 72,385 | 72,385 |
| San Bernardino County Flood Cont. District Judgment Oblig. Series 2008, 2.5% 3/7/24, LOC Bank of America NA, VRDN (b) | | 24,625 | 24,625 |
| San Diego Hsg. Auth. Multi-family Hsg. Rev.: | | | |
| Series 2017 A, 2.75% 3/7/24, LOC Bank of America NA, VRDN (b) | | 125,135 | 125,135 |
| Series 2020 F, 2.75% 3/7/24, LOC Mizuho Corporate Bank Ltd., VRDN (b) | | 1,500 | 1,500 |
| San Francisco City & County Arpts. Commission Int'l. Arpt. Rev. Series 2018 C, 2.5% 3/7/24, LOC Sumitomo Mitsui Banking Corp., VRDN (b) | | 13,830 | 13,830 |
| San Francisco City & County Redev. Agcy. Multi-family Hsg. Rev.: | | | |
| (Antonia Manor Apts. Proj.) Series 2000 E, 2.64% 3/7/24, LOC Citibank NA, VRDN (b)(c) | | 650 | 650 |
| (Mission Creek Cmnty. Proj.) Series B, 2.54% 3/7/24, LOC Citibank NA, VRDN (b)(c) | | 2,510 | 2,510 |
| (Ocean Beach Apts. Proj.) Series B, 2.6% 3/7/24, LOC Citibank NA, VRDN (b)(c) | | 3,330 | 3,330 |
| Series 2000 G, 2.59% 3/7/24, LOC Citibank NA, VRDN (b)(c) | | 5,940 | 5,940 |
| Santa Clara County Fing. Auth. Lease Rev. (Multiple Facilities Proj.) Series 2008 M, 2.34% 3/7/24, LOC Bank of America NA, VRDN (b) | | 55,265 | 55,265 |
| Santa Clara County Fing. Auth. Rev. (El Camino Hosp. Proj.) Series 2009 A, 2.4% 3/7/24, LOC Wells Fargo Bank NA, VRDN (b) | | 20,010 | 20,010 |
| Univ. of California Revs.: | | | |
| Series 2013 AL 2, 3.3% 3/1/24, VRDN (b) | | 16,500 | 16,500 |
| Series 2023 BP, 3.4% 3/1/24, VRDN (b) | | 65,800 | 65,800 |
| Series AL1, 3.4% 3/1/24, VRDN (b) | | 6,700 | 6,700 |
| Western Muni. Wtr. District Facilities Auth. Wtr. Rev. Series 2012 A, 2.25% 3/7/24, LOC TD Banknorth, NA, VRDN (b) | | 7,600 | 7,600 |
| FHLMC: | | | |
| ABAG Fin. Auth. for Nonprofit Corps. Multi-family Hsg. Rev. Series 2011 A, 2.35% 3/7/24, LOC Freddie Mac, VRDN (b) | | 1,100 | 1,100 |
| California Statewide Cmntys. Dev. Auth. Multi-family Hsg. Rev. (Heritage Park Apts. Proj.) Series 2008 C, 2.45% 3/7/24, LOC Freddie Mac, VRDN (b)(c) | | 20,000 | 20,000 |
| FNMA: | | | |
| ABAG Fin. Auth. for Nonprofit Corps. Multi-family Hsg. Rev. ( Terrazza Apts. Proj.) Series 2002 A, 2.2% 3/7/24, LOC Fannie Mae, VRDN (b)(c) | | 15,000 | 15,000 |
| California Statewide Cmntys. Dev. Auth. Multi-family Hsg. Rev.: | | | |
(Salvation Army S.F. Proj.) Series 2003 EEE, 2.44% 3/7/24, LOC Fannie Mae, VRDN (b)(c) | | 11,705 | 11,705 |
(The Crossings Sr. Apts./Phase II Proj.) Series J, 2.47% 3/7/24, LOC Fannie Mae, VRDN (b)(c) | | 5,000 | 5,000 |
(Wilshire Court Proj.) Series AAA, 2.47% 3/7/24, LOC Fannie Mae, VRDN (b)(c) | | 5,000 | 5,000 |
| Emeryville Redev. Agcy. Multi-family Hsg. Rev. Series 2002 A, 3.32% 3/7/24, LOC Fannie Mae, VRDN (b)(c) | | 30,000 | 30,000 |
| Orange County Apt. Dev. Rev.: | | | |
(Ladera Apts. Proj.) Series 2001 II B, 2.47% 3/7/24, LOC Fannie Mae, VRDN (b)(c) | | 18,800 | 18,800 |
(Wood Canyon Villas Proj.) Series 2001 E, 2.47% 3/7/24, LOC Fannie Mae, VRDN (b)(c) | | 12,275 | 12,275 |
| San Jose Multi-family Hsg. Rev.: | | | |
(Almaden Lake Village Apt. Assoc. Proj.) Series 1997 A, 3.32% 3/7/24, LOC Fannie Mae, VRDN (b)(c) | | 16,500 | 16,500 |
(Kennedy Apt. Homes Proj.) Series 2002 K, 2.47% 3/7/24, LOC Fannie Mae, VRDN (b)(c) | | 6,175 | 6,175 |
| Santa Cruz Redev. Agcy. Multi-family Rev.: | | | |
(1010 Pacific Ave. Apts. Proj.) Series B, 3.3% 3/7/24, LOC Fannie Mae, VRDN (b)(c) | | 16,795 | 16,795 |
(Shaffer Road Apts. Proj.) Series A, 3.3% 3/7/24, LOC Fannie Mae, VRDN (b)(c) | | 4,000 | 4,000 |
TOTAL CALIFORNIA | | | 1,128,179 |
| Delaware - 0.0% | | | |
| Delaware Econ. Dev. Auth. Rev. (Delmarva Pwr. & Lt. Co. Proj.) Series 1993 C, 3.5% 3/7/24, VRDN (b) | | 600 | 600 |
| Florida - 1.2% | | | |
| Bay County Indl. Rev. Dev. (Gulf Pwr. Co. Proj.) Series 2020, 3.45% 3/7/24, VRDN (b)(c) | | 600 | 600 |
| Broward County Indl. Dev. Rev. (Florida Pwr. & Lt. Co. Proj.): | | | |
| Series 2015, 3.5% 3/7/24, VRDN (b)(c) | | 33,100 | 33,100 |
| Series 2018 B, 3.5% 3/7/24, VRDN (b)(c) | | 5,300 | 5,300 |
| Lee County Indl. Dev. Auth. Rev. (Florida Pwr. & Lt. Co. Proj.) Series 2016 A, 3.5% 3/7/24, VRDN (b)(c) | | 4,600 | 4,600 |
| Miami-Dade County Indl. Dev. Auth. Rev. (Florida Pwr. & Lt. Co. Proj.) Series 2021, 3.4% 3/7/24, VRDN (b)(c) | | 6,300 | 6,300 |
TOTAL FLORIDA | | | 49,900 |
| Georgia - 0.6% | | | |
| Bartow County Dev. Auth. (Georgia Pwr. Co. Plant Bowen Proj.) Series 2022, 3.9% 3/1/24, VRDN (b)(c) | | 11,900 | 11,900 |
| Burke County Indl. Dev. Auth. Poll. Cont. Rev. (Georgia Pwr. Co. Plant Vogtle Proj.) Series 2012, 3.9% 3/1/24, VRDN (b)(c) | | 2,445 | 2,445 |
| Monroe County Dev. Auth. Rev. (Florida Pwr. & Lt. Co. Proj.) Series 2017, 3.45% 3/7/24, VRDN (b)(c) | | 9,200 | 9,200 |
TOTAL GEORGIA | | | 23,545 |
| Indiana - 0.0% | | | |
| Indiana Dev. Fin. Auth. Envir. Rev. (PSI Energy Proj.) Series 2003 A, 3.55% 3/7/24, VRDN (b)(c) | | 900 | 900 |
| Iowa - 0.5% | | | |
| Iowa Fin. Auth. Solid Waste Facilities (MidAmerican Energy Co. Proj.) Series 2017, 3.85% 3/7/24, VRDN (b)(c) | | 22,245 | 22,245 |
| Kansas - 0.0% | | | |
| Burlington Envir. Impt. Rev. (Kansas City Pwr. and Lt. Co. Proj.): | | | |
| Series 2007 A, 3.5% 3/7/24, VRDN (b) | | 200 | 200 |
| Series 2007 B, 3.5% 3/7/24, VRDN (b) | | 900 | 900 |
TOTAL KANSAS | | | 1,100 |
| Louisiana - 0.1% | | | |
| Saint James Parish Gen. Oblig. (Nucor Steel Louisiana LLC Proj.) Series 2010 A1, 3.79% 3/7/24, VRDN (b) | | 2,375 | 2,375 |
| Nebraska - 0.0% | | | |
| Stanton County Indl. Dev. Rev.: | | | |
| (Nucor Corp. Proj.) Series 1996, 3.89% 3/7/24, VRDN (b)(c) | | 700 | 700 |
| Series 1998, 3.89% 3/7/24, VRDN (b)(c) | | 300 | 300 |
TOTAL NEBRASKA | | | 1,000 |
| North Carolina - 0.2% | | | |
| Hertford County Indl. Facilities Poll. Cont. Fing. Auth. (Nucor Corp. Proj.) Series 2000 A, 4.2% 3/7/24, VRDN (b)(c) | | 6,800 | 6,800 |
| South Carolina - 0.1% | | | |
| Berkeley County Indl. Dev. Rev.: | | | |
| Series 1998, 4.35% 3/7/24, VRDN (b)(c) | | 3,275 | 3,275 |
| Series A, 4.35% 3/7/24, VRDN (b)(c) | | 2,350 | 2,350 |
TOTAL SOUTH CAROLINA | | | 5,625 |
| Tennessee - 0.0% | | | |
| Loudon County Indl. Dev. Board Exempt Facilities Rev. (Kimberly-Clark Corp. Proj.) Series 1999, 3.45% 3/7/24, VRDN (b)(c) | | 1,300 | 1,300 |
| Texas - 0.1% | | | |
| Jewett Econ. Dev. Corp. Indl. Dev. Rev. (Nucor Corp. Proj.) Series 2003, 3.89% 3/7/24, VRDN (b)(c) | | 3,450 | 3,450 |
| Utah - 0.4% | | | |
| Emery County Poll. Cont. Rev. (PacifiCorp Proj.) Series 1994, 3.85% 3/7/24, VRDN (b) | | 14,900 | 14,900 |
| West Virginia - 0.0% | | | |
| West Virginia Econ. Dev. Auth. Solid Waste Disp. Facilities Rev. (Appalachian Pwr. Co.- Mountaineer Proj.) Series 2008 A, 3.28% 3/7/24, VRDN (b)(c) | | 800 | 800 |
| Wyoming - 0.2% | | | |
| Converse County Envir. Impt. Rev. Series 1995, 3.65% 3/7/24, VRDN (b)(c) | | 2,000 | 2,000 |
| Sweetwater County Env Imp Rev. (Pacificorp Proj.) Series 1995, 4.1% 3/1/24, VRDN (b)(c) | | 6,000 | 6,000 |
TOTAL WYOMING | | | 8,000 |
| TOTAL VARIABLE RATE DEMAND NOTE (Cost $1,305,630) | | | 1,305,630 |
| | | | |
| Tender Option Bond - 23.0% |
| | | Principal Amount (a) (000s) | Value ($) (000s) |
| Arizona - 0.0% | | | |
| Arizona Indl. Dev. Auth. Hosp. Rev. Participating VRDN Series XM 10 13, 3.36% 3/7/24 (Liquidity Facility JPMorgan Chase Bank) (b)(e)(f) | | 375 | 375 |
| California - 22.5% | | | |
| Bay Area Toll Auth. San Francisco Bay Toll Bridge Rev. Participating VRDN Series XM 11 19, 3.35% 3/1/24 (Liquidity Facility JPMorgan Chase Bank) (b)(e)(f) | | 8,890 | 8,890 |
| California Cmnty. Choice Fing. Auth. Clean Energy Proj. Rev. Participating VRDN: | | | |
| Series XF 16 35, 3.27% 3/7/24 (Liquidity Facility Royal Bank of Canada) (b)(e)(f) | | 6,750 | 6,750 |
| Series XF 16 81, 3.45% 3/1/24 (Liquidity Facility JPMorgan Chase Bank) (b)(e)(f) | | 13,000 | 13,000 |
| Series XF 16 90, 3.26% 3/7/24 (Liquidity Facility Royal Bank of Canada) (b)(e)(f) | | 22,375 | 22,375 |
| Series XM 11 11, 3.45% 3/1/24 (Liquidity Facility JPMorgan Chase Bank) (b)(e)(f) | | 7,500 | 7,500 |
| Series XM 11 38, 3.27% 3/7/24 (Liquidity Facility Royal Bank of Canada) (b)(e)(f) | | 2,000 | 2,000 |
| California Edl. Facilities Auth. Rev. Participating VRDN Series 2022 XF 30 46, 3.25% 3/7/24 (Liquidity Facility Morgan Stanley Bank, West Valley City Utah) (b)(e)(f) | | 8,000 | 8,000 |
| California Gen. Oblig. Participating VRDN: | | | |
| Series 2022 XF 14 15, 3.27% 3/7/24 (Liquidity Facility Toronto-Dominion Bank) (b)(e)(f) | | 1,705 | 1,705 |
| Series 2022 ZF 30 55, 3.24% 3/7/24 (Liquidity Facility Morgan Stanley Bank, West Valley City Utah) (b)(e)(f) | | 2,625 | 2,625 |
| Series Floaters XF 10 38, 3.27% 3/7/24 (Liquidity Facility Toronto-Dominion Bank) (b)(e)(f) | | 10,480 | 10,480 |
| Series Floaters YX 10 84, 3.27% 3/7/24 (Liquidity Facility Barclays Bank PLC) (b)(e)(f) | | 3,500 | 3,500 |
| Series XF 13 87, 3.27% 3/7/24 (Liquidity Facility Toronto-Dominion Bank) (b)(e)(f) | | 2,665 | 2,665 |
| Series XF 16 27, 3.35% 3/1/24 (Liquidity Facility JPMorgan Chase Bank) (b)(e)(f) | | 2,800 | 2,800 |
| Series XF 16 32, 3.35% 3/1/24 (Liquidity Facility JPMorgan Chase Bank) (b)(e)(f) | | 5,825 | 5,825 |
| Series XF 30 20, 3.26% 3/7/24 (Liquidity Facility Barclays Bank PLC) (b)(e)(f) | | 1,000 | 1,000 |
| Series XF 31 49, 3.25% 3/7/24 (Liquidity Facility JPMorgan Chase Bank) (b)(e)(f) | | 6,140 | 6,140 |
| Series XL 05 01, 3.27% 3/7/24 (Liquidity Facility Wells Fargo Bank NA) (b)(e)(f) | | 2,375 | 2,375 |
| California Health Facilities Fing. Auth. Rev. Participating VRDN: | | | |
| Series 15 XF2119, 3.25% 3/7/24 (Liquidity Facility Morgan Stanley Bank, West Valley City Utah) (b)(e)(f) | | 2,665 | 2,665 |
| Series BC 22 015, 3.49% 4/4/24 (Liquidity Facility Barclays Bank PLC) (b)(e)(f) | | 8,830 | 8,830 |
| Series Floater BC 23 007, 3.49% 4/4/24 (Liquidity Facility Barclays Bank PLC) (b)(e)(f) | | 117,390 | 117,390 |
| Series Floater BC 23 015, 3.27% 4/4/24 (Liquidity Facility Barclays Bank PLC) (b)(e)(f) | | 5,670 | 5,670 |
| Series Floaters 013, 3.49% 4/4/24 (Liquidity Facility Barclays Bank PLC) (b)(e)(f) | | 42,800 | 42,800 |
| Series Floaters XF 07 62, 3.32% 3/7/24 (Liquidity Facility JPMorgan Chase Bank) (b)(e)(f) | | 7,365 | 7,365 |
| Series Floaters XF 24 67, 3.27% 3/7/24 (Liquidity Facility Morgan Stanley Bank, West Valley City Utah) (b)(e)(f) | | 8,800 | 8,800 |
| Series Floaters XF 26 98, 3.26% 3/7/24 (Liquidity Facility Barclays Bank PLC) (b)(e)(f) | | 4,800 | 4,800 |
| Series Floaters XL 00 45, 3.25% 3/7/24 (Liquidity Facility JPMorgan Chase Bank) (b)(e)(f) | | 5,270 | 5,270 |
| Series MIZ 91 02, 3.44% 3/7/24 (Liquidity Facility Mizuho Cap. Markets LLC) (b)(e)(f) | | 24,105 | 24,105 |
| Series XF 14 32, 3.27% 3/7/24 (Liquidity Facility Toronto-Dominion Bank) (b)(e)(f) | | 1,000 | 1,000 |
| Series XF 15 18, 3.35% 3/1/24 (Liquidity Facility JPMorgan Chase Bank) (b)(e)(f) | | 3,930 | 3,930 |
| Series XF 15 24, 3.27% 3/7/24 (Liquidity Facility Royal Bank of Canada) (b)(e)(f) | | 1,000 | 1,000 |
| Series XF 15 27, 3.28% 3/7/24 (Liquidity Facility Bank of America NA) (b)(e)(f) | | 2,670 | 2,670 |
| Series XF 30 92, 3.26% 3/7/24 (Liquidity Facility Barclays Bank PLC) (b)(e)(f) | | 5,325 | 5,325 |
| Series YX 13 12, 3.26% 3/7/24 (Liquidity Facility Barclays Bank PLC) (b)(e)(f) | | 10,695 | 10,695 |
| California Muni. Fin. Auth. Participating VRDN Series ZL 04 77, 3.25% 3/7/24 (Liquidity Facility Morgan Stanley Bank, West Valley City Utah) (b)(e)(f) | | 7,500 | 7,500 |
| California Pub. Works Board Lease Rev. Participating VRDN: | | | |
| Series XF 16 50, 3.29% 3/7/24 (Liquidity Facility JPMorgan Chase Bank) (b)(e)(f) | | 4,130 | 4,130 |
| Series YX 11 91, 3.27% 3/7/24 (Liquidity Facility Barclays Bank PLC) (b)(e)(f) | | 14,260 | 14,260 |
| California State Univ. Rev. Participating VRDN: | | | |
| Series Floaters XF 24 41, 3.31% 3/7/24 (Liquidity Facility JPMorgan Chase Bank) (b)(e)(f) | | 17,020 | 17,020 |
| Series XM 10 00, 3.35% 3/1/24 (Liquidity Facility JPMorgan Chase Bank) (b)(e)(f) | | 9,525 | 9,525 |
| Series ZL 02 88, 3.26% 3/7/24 (Liquidity Facility Barclays Bank PLC) (b)(e)(f) | | 13,490 | 13,490 |
| Chaffey Unified High School District Participating VRDN Series XF 13 44, 3.27% 3/7/24 (Liquidity Facility Bank of America NA) (b)(e)(f) | | 4,760 | 4,760 |
| Chino Valley Unified School District Participating VRDN Series XF 16 61, 3.25% 3/7/24 (Liquidity Facility JPMorgan Chase Bank) (b)(e)(f) | | 3,075 | 3,075 |
| Foothill/Eastern Trans. Corridor Agcy. Toll Road Rev. Participating VRDN Series Floaters XG 02 43, 3.29% 3/7/24 (Liquidity Facility Bank of America NA) (b)(e)(f) | | 5,285 | 5,285 |
| Long Beach Unified School District Participating VRDN: | | | |
| Series XG 04 78, 3.3% 3/7/24 (Liquidity Facility Wells Fargo Bank NA) (b)(e)(f) | | 6,465 | 6,465 |
| Series XG 05 01, 3.27% 3/7/24 (Liquidity Facility Wells Fargo Bank NA) (b)(e)(f) | | 1,920 | 1,920 |
| Los Angeles County Facilities, Inc. Participating VRDN: | | | |
| Series 2022 XF 13 76, 3.29% 3/7/24 (Liquidity Facility Bank of America NA) (b)(e)(f) | | 5,000 | 5,000 |
| Series ZF 31 62, 3.27% 3/7/24 (Liquidity Facility Wells Fargo Bank NA) (b)(e)(f) | | 1,670 | 1,670 |
| Los Angeles County Gen. Oblig. Participating VRDN Series XF 30 05, 3.27% 3/7/24 (Liquidity Facility Morgan Stanley Bank, West Valley City Utah) (b)(e)(f) | | 7,500 | 7,500 |
| Los Angeles County Metropolitan Trans. Auth. Sales Tax Rev. Participating VRDN Series ZL 03 27, 3.25% 3/7/24 (Liquidity Facility JPMorgan Chase Bank) (b)(e)(f) | | 1,400 | 1,400 |
| Los Angeles County Pub. Works Fing. Auth. Lease Rev. Participating VRDN: | | | |
| Series XM 10 94, 3.25% 3/7/24 (Liquidity Facility Morgan Stanley Bank, West Valley City Utah) (b)(e)(f) | | 3,970 | 3,970 |
| Series YX 12 93, 3.27% 3/7/24 (Liquidity Facility Barclays Bank PLC) (b)(e)(f) | | 5,250 | 5,250 |
| Los Angeles Dept. Arpt. Rev. Participating VRDN: | | | |
| Series 2018 XF 06 75, 3.29% 3/7/24 (Liquidity Facility JPMorgan Chase Bank) (b)(c)(e)(f) | | 5,405 | 5,405 |
| Series 2021 XF 12 49, 3.29% 3/7/24 (Liquidity Facility JPMorgan Chase Bank) (b)(c)(e)(f) | | 3,195 | 3,195 |
| Series 2022 XF 13 84, 3.3% 3/7/24 (Liquidity Facility Toronto-Dominion Bank) (b)(c)(e)(f) | | 1,500 | 1,500 |
| Series 2022 XG 04 15, 3.27% 3/7/24 (Liquidity Facility Morgan Stanley Bank, West Valley City Utah) (b)(c)(e)(f) | | 4,800 | 4,800 |
| Series 2022 XM 10 37, 3.3% 3/7/24 (Liquidity Facility Royal Bank of Canada) (b)(c)(e)(f) | | 4,000 | 4,000 |
| Series 2022: | | | |
3.29% 3/7/24 (Liquidity Facility Bank of America NA) (b)(c)(e)(f) | | 5,510 | 5,510 |
3.32% 3/7/24 (Liquidity Facility Toronto-Dominion Bank) (b)(c)(e)(f) | | 5,600 | 5,600 |
| Series Floaters XG 02 32, 3.28% 3/7/24 (Liquidity Facility Morgan Stanley Bank, West Valley City Utah) (b)(c)(e)(f) | | 17,700 | 17,700 |
| Series Floaters XX 10 28, 3.27% 3/7/24 (Liquidity Facility Barclays Bank PLC) (b)(c)(e)(f) | | 100 | 100 |
| Series XF 13 68, 3.29% 3/7/24 (Liquidity Facility JPMorgan Chase Bank) (b)(c)(e)(f) | | 2,250 | 2,250 |
| Series XF 13 73, 3.29% 3/7/24 (Liquidity Facility JPMorgan Chase Bank) (b)(c)(e)(f) | | 865 | 865 |
| Series XF 15 84, 3.29% 3/7/24 (Liquidity Facility JPMorgan Chase Bank) (b)(c)(e)(f) | | 4,000 | 4,000 |
| Series XF 30 11, 3.29% 3/7/24 (Liquidity Facility Morgan Stanley Bank, West Valley City Utah) (b)(c)(e)(f) | | 2,800 | 2,800 |
| Series XF 30 39, 3.29% 3/7/24 (Liquidity Facility Morgan Stanley Bank, West Valley City Utah) (b)(c)(e)(f) | | 15,000 | 15,000 |
| Series XG 04 76, 3.45% 3/1/24 (Liquidity Facility JPMorgan Chase Bank) (b)(c)(e)(f) | | 9,440 | 9,440 |
| Series XL 04 61, 3.26% 3/7/24 (Liquidity Facility Morgan Stanley Bank, West Valley City Utah) (b)(c)(e)(f) | | 6,380 | 6,380 |
| Series XL 04 99, 3.25% 3/7/24 (Liquidity Facility Morgan Stanley Bank, West Valley City Utah) (b)(e)(f) | | 3,000 | 3,000 |
| Series XX 13 08, 3.27% 3/7/24 (Liquidity Facility Barclays Bank PLC) (b)(c)(e)(f) | | 7,500 | 7,500 |
| Series YX 12 29, 3.27% 3/7/24 (Liquidity Facility Barclays Bank PLC) (b)(c)(e)(f) | | 8,980 | 8,980 |
| Series ZF 16 73, 3.29% 3/7/24 (Liquidity Facility JPMorgan Chase Bank) (b)(c)(e)(f) | | 2,200 | 2,200 |
| Series ZL 05 19, 3.27% 3/7/24 (Liquidity Facility Morgan Stanley Bank, West Valley City Utah) (b)(c)(e)(f) | | 2,850 | 2,850 |
| Los Angeles Dept. of Wtr. & Pwr. Rev. Participating VRDN: | | | |
| Series XF 14 41, 3.25% 3/7/24 (Liquidity Facility JPMorgan Chase Bank) (b)(e)(f) | | 3,500 | 3,500 |
| Series XF 14 49, 3.25% 3/7/24 (Liquidity Facility JPMorgan Chase Bank) (b)(e)(f) | | 1,835 | 1,835 |
| Series XF 16 28, 3.35% 3/1/24 (Liquidity Facility JPMorgan Chase Bank) (b)(e)(f) | | 4,365 | 4,365 |
| Series XF 30 25, 3.27% 3/7/24 (Liquidity Facility Morgan Stanley Bank, West Valley City Utah) (b)(e)(f) | | 8,000 | 8,000 |
| Series XL 04 04, 3.26% 3/7/24 (Liquidity Facility Morgan Stanley Bank, West Valley City Utah) (b)(e)(f) | | 4,665 | 4,665 |
| Series XX 12 40, 3.27% 3/7/24 (Liquidity Facility Barclays Bank PLC) (b)(e)(f) | | 4,125 | 4,125 |
| Series ZL 02 85, 3.26% 3/7/24 (Liquidity Facility Barclays Bank PLC) (b)(e)(f) | | 11,775 | 11,775 |
| Series ZL 03 26, 3.25% 3/7/24 (Liquidity Facility JPMorgan Chase Bank) (b)(e)(f) | | 1,335 | 1,335 |
| Los Angeles Dept. of Wtr. & Pwr. Wtrwks. Rev. Participating VRDN: | | | |
| Series XL 03 99, 3.26% 3/7/24 (Liquidity Facility Wells Fargo Bank NA) (b)(e)(f) | | 6,250 | 6,250 |
| Series XM 11 53, 3.26% 3/7/24 (Liquidity Facility UBS AG) (b)(e)(f) | | 5,965 | 5,965 |
| Los Angeles Hbr. Dept. Rev. Participating VRDN Series Floaters XF 07 61, 3.25% 3/7/24 (Liquidity Facility JPMorgan Chase Bank) (b)(e)(f) | | 1,500 | 1,500 |
| Los Angeles Unified School District Participating VRDN: | | | |
| Series 2022 ZL 03 61, 3.24% 3/7/24 (Liquidity Facility Morgan Stanley Bank, West Valley City Utah) (b)(e)(f) | | 4,950 | 4,950 |
| Series 2023, 3.25% 3/7/24 (Liquidity Facility Citibank NA) (b)(e)(f) | | 19,250 | 19,250 |
| Series Floaters YX 10 87, 3.27% 3/7/24 (Liquidity Facility Barclays Bank PLC) (b)(e)(f) | | 3,750 | 3,750 |
| Series ZF 31 87, 3.25% 3/7/24 (Liquidity Facility Morgan Stanley Bank, West Valley City Utah) (b)(e)(f) | | 4,150 | 4,150 |
| Los Angeles Wastewtr. Sys. Rev. Participating VRDN Series ROC II R 14059, 3.26% 3/7/24 (Liquidity Facility JPMorgan Chase Bank) (b)(e)(f) | | 6,000 | 6,000 |
| Lucile Salter Packard Children's Hosp. Participating VRDN Series Floaters XG 01 48, 3.27% 3/7/24 (Liquidity Facility Morgan Stanley Bank, West Valley City Utah) (b)(e)(f) | | 4,240 | 4,240 |
| North Orange County Cmnty. College District Rev. Participating VRDN Series XX 12 39, 3.26% 3/7/24 (Liquidity Facility Barclays Bank PLC) (b)(e)(f) | | 10,000 | 10,000 |
| Palmdale School District Participating VRDN Series 2022 045, 3.52% 3/1/24 (Liquidity Facility Barclays Bank PLC) (b)(e)(f) | | 3,925 | 3,925 |
| Pub. Utils. Commission San Francisco City & County Wastewtr. Rev. Participating VRDN Series ZF 14 35, 3.25% 3/7/24 (Liquidity Facility JPMorgan Chase Bank) (b)(e)(f) | | 2,130 | 2,130 |
| RBC Muni. Products, Inc. Trust Participating VRDN Series 2023, 3.24% 3/7/24 (Liquidity Facility Royal Bank of Canada) (b)(e)(f) | | 30,000 | 30,000 |
| Riverside County Trans. Commission Toll Rev. Participating VRDN Series 2021 XG 03 41, 3.29% 3/7/24 (Liquidity Facility Bank of America NA) (b)(e)(f) | | 15,000 | 15,000 |
| Sacramento City Unified School District Participating VRDN Series XG 03 93, 3.27% 3/7/24 (Liquidity Facility Barclays Bank PLC) (b)(e)(f) | | 4,800 | 4,800 |
| San Diego County Reg'l. Arpt. Auth. Arpt. Rev. Participating VRDN: | | | |
| Series XF 15 15, 3.3% 3/7/24 (Liquidity Facility Toronto-Dominion Bank) (b)(c)(e)(f) | | 11,800 | 11,800 |
| Series XF 15 22, 3.3% 3/7/24 (Liquidity Facility Toronto-Dominion Bank) (b)(c)(e)(f) | | 7,235 | 7,235 |
| Series XF 16 20, 3.29% 3/7/24 (Liquidity Facility Royal Bank of Canada) (b)(c)(e)(f) | | 3,160 | 3,160 |
| Series XF 31 80, 3.27% 3/7/24 (Liquidity Facility Barclays Bank PLC) (b)(c)(e)(f) | | 8,000 | 8,000 |
| Series XX 12 15, 3.27% 3/7/24 (Liquidity Facility Barclays Bank PLC) (b)(c)(e)(f) | | 5,500 | 5,500 |
| Series ZF 16 72, 3.34% 3/7/24 (Liquidity Facility JPMorgan Chase Bank) (b)(c)(e)(f) | | 7,250 | 7,250 |
| Series ZL 05 10, 3.29% 3/7/24 (Liquidity Facility Morgan Stanley Bank, West Valley City Utah) (b)(c)(e)(f) | | 10,400 | 10,400 |
| San Diego Unified School District Participating VRDN: | | | |
| Series XF 13 86, 3.27% 3/7/24 (Liquidity Facility Bank of America NA) (b)(e)(f) | | 2,915 | 2,915 |
| Series XF 14 27, 3.25% 3/7/24 (Liquidity Facility JPMorgan Chase Bank) (b)(e)(f) | | 2,000 | 2,000 |
| Series XF 31 50, 3.25% 3/7/24 (Liquidity Facility JPMorgan Chase Bank) (b)(e)(f) | | 2,725 | 2,725 |
| San Francisco Bay Area Rapid Transit Fing. Auth. Participating VRDN: | | | |
| Series XF 13 31, 3.27% 3/7/24 (Liquidity Facility Toronto-Dominion Bank) (b)(e)(f) | | 1,875 | 1,875 |
| Series XF 15 01, 3.35% 3/1/24 (Liquidity Facility JPMorgan Chase Bank) (b)(e)(f) | | 2,475 | 2,475 |
| Series XG 03 81, 3.25% 3/7/24 (Liquidity Facility JPMorgan Chase Bank) (b)(e)(f) | | 2,750 | 2,750 |
| San Francisco City & County Arpts. Commission Int'l. Arpt. Rev. Participating VRDN: | | | |
| Series 2023, 3.27% 3/7/24 (Liquidity Facility Barclays Bank PLC) (b)(e)(f) | | 1,975 | 1,975 |
| Series Floaters XL 01 01, 3.29% 3/7/24 (Liquidity Facility JPMorgan Chase Bank) (b)(c)(e)(f) | | 4,185 | 4,185 |
| Series XG 03 63, 3.32% 3/7/24 (Liquidity Facility Bank of America NA) (b)(c)(e)(f) | | 4,160 | 4,160 |
| San Francisco City & County Ctfs. of Prtn. Participating VRDN Series XG 03 72, 3.27% 3/7/24 (Liquidity Facility Wells Fargo Bank NA) (b)(e)(f) | | 3,135 | 3,135 |
| Univ. of California Regents Med. Ctr. Pool Rev. Participating VRDN: | | | |
| Series 2022 XX 12 62, 3.26% 3/7/24 (Liquidity Facility Barclays Bank PLC) (b)(e)(f) | | 3,750 | 3,750 |
| Series Floaters YX 10 97, 3.27% 3/7/24 (Liquidity Facility Barclays Bank PLC) (b)(e)(f) | | 6,030 | 6,030 |
| Series XF 16 24, 3.35% 3/1/24 (Liquidity Facility JPMorgan Chase Bank) (b)(e)(f) | | 7,570 | 7,570 |
| Series XG 03 66, 3.27% 3/7/24 (Liquidity Facility Wells Fargo Bank NA) (b)(e)(f) | | 8,765 | 8,765 |
| Series XX 12 01, 3.26% 3/7/24 (Liquidity Facility Barclays Bank PLC) (b)(e)(f) | | 7,500 | 7,500 |
| Series XX 12 06, 3.26% 3/7/24 (Liquidity Facility Barclays Bank PLC) (b)(e)(f) | | 21,670 | 21,670 |
| Series XX 12 75, 3.26% 3/7/24 (Liquidity Facility Barclays Bank PLC) (b)(e)(f) | | 2,685 | 2,685 |
| Series YX 12 00, 3.26% 3/7/24 (Liquidity Facility Barclays Bank PLC) (b)(e)(f) | | 19,870 | 19,870 |
| Series YX 12 05, 3.27% 3/7/24 (Liquidity Facility Barclays Bank PLC) (b)(e)(f) | | 7,020 | 7,020 |
| Series YX 12 94, 3.27% 3/7/24 (Liquidity Facility Barclays Bank PLC) (b)(e)(f) | | 1,875 | 1,875 |
| Univ. of California Revs. Participating VRDN: | | | |
| Series 2022 XF 14 12, 3.27% 3/7/24 (Liquidity Facility Toronto-Dominion Bank) (b)(e)(f) | | 5,000 | 5,000 |
| Series 2022 XF 30 48, 3.25% 3/7/24 (Liquidity Facility Morgan Stanley Bank, West Valley City Utah) (b)(e)(f) | | 5,625 | 5,625 |
| Series 2022 ZL 03 48, 3.25% 3/7/24 (Liquidity Facility JPMorgan Chase Bank) (b)(e)(f) | | 2,000 | 2,000 |
| Series XF 27 45, 3.25% 3/7/24 (Liquidity Facility JPMorgan Chase Bank) (b)(e)(f) | | 9,900 | 9,900 |
| Series XM 11 06, 3.24% 3/7/24 (Liquidity Facility Morgan Stanley Bank, West Valley City Utah) (b)(e)(f) | | 5,685 | 5,685 |
| Series XX 13 25, 3.26% 3/7/24 (Liquidity Facility Barclays Bank PLC) (b)(e)(f) | | 7,500 | 7,500 |
| Warren County Ctfs. Prtn. Participating VRDN Series XL 05 30, 3.35% 3/1/24 (Liquidity Facility JPMorgan Chase Bank) (b)(e)(f) | | 5,000 | 5,000 |
TOTAL CALIFORNIA | | | 955,735 |
| Colorado - 0.2% | | | |
| Colorado Health Facilities Auth. Rev. Bonds Participating VRDN Series 2023, 3.54% 4/4/24 (Liquidity Facility Barclays Bank PLC) (b)(e)(f) | | 7,200 | 7,200 |
| Kentucky - 0.1% | | | |
| CommonSpirit Health Participating VRDN Series MIZ 90 21, 3.34% 3/7/24 (Liquidity Facility Mizuho Cap. Markets LLC) (b)(e)(f) | | 1,900 | 1,900 |
| Missouri - 0.0% | | | |
| Missouri Health & Edl. Facilities Rev. Bonds Series 2023 G 121, 3.44%, tender 6/3/24 (Liquidity Facility Royal Bank of Canada) (b)(e)(f) | | 1,520 | 1,520 |
| Nevada - 0.0% | | | |
| Clark County School District Participating VRDN Series XF 14 73, 3.36% 3/7/24 (Liquidity Facility JPMorgan Chase Bank) (b)(e)(f) | | 1,495 | 1,495 |
| Texas - 0.1% | | | |
| El Paso Wtr. & Swr. Rev. Bonds Series G 124, 3.44%, tender 9/1/24 (Liquidity Facility Royal Bank of Canada) (b)(e)(f)(g)(h) | | 1,600 | 1,600 |
| Texas Wtr. Dev. Board Rev. Bonds Series MS 00 17, 3.39%, tender 4/25/24 (Liquidity Facility Morgan Stanley Bank, West Valley City Utah) (b)(e)(f)(g) | | 2,300 | 2,300 |
TOTAL TEXAS | | | 3,900 |
| Virginia - 0.0% | | | |
| Suffolk Econ. Dev. Auth. Hosp. Facilities Rev. Participating VRDN Series MIZ 90 25, 3.34% 3/7/24 (Liquidity Facility Mizuho Cap. Markets LLC) (b)(e)(f) | | 1,600 | 1,600 |
| Washington - 0.1% | | | |
| Central Puget Sound Reg'l. Trans. Auth. Sales & Use Tax Rev. Bonds Series G 123, 3.44%, tender 5/1/24 (Liquidity Facility Royal Bank of Canada) (b)(e)(f)(g) | | 1,100 | 1,100 |
| Port of Seattle Rev. Participating VRDN Series XM 10 27, 3.38% 3/7/24 (Liquidity Facility JPMorgan Chase Bank) (b)(c)(e)(f) | | 3,000 | 3,000 |
TOTAL WASHINGTON | | | 4,100 |
| TOTAL TENDER OPTION BOND (Cost $977,825) | | | 977,825 |
| | | | |
| Other Municipal Security - 36.6% |
| | | Principal Amount (a) (000s) | Value ($) (000s) |
| California - 36.5% | | | |
| Anaheim Pub. Fing. Auth. Lease Rev. Bonds: | | | |
| (Anaheim Convention Ctr. Expansion Proj.) Series 2014 A: | | | |
5% 5/1/24 (Escrowed to Maturity) | | 150 | 150 |
5% 5/1/24 (Pre-Refunded to 5/1/24 @ 100) | | 100 | 100 |
5% 5/1/24 (Pre-Refunded to 5/1/24 @ 100) | | 2,000 | 2,006 |
5% 5/1/24 (Pre-Refunded to 5/1/24 @ 100) | | 200 | 201 |
5% 5/1/24 (Pre-Refunded to 5/1/24 @ 100) | | 900 | 903 |
| Series 2014 A: | | | |
5% 5/1/24 (Pre-Refunded to 5/1/24 @ 100) | | 200 | 201 |
5% 5/1/24 (Pre-Refunded to 5/1/24 @ 100) | | 2,280 | 2,286 |
| Antelope Valley Cmnty. College District Bonds Series 2014 A: | | | |
| 5% 8/1/24 (Pre-Refunded to 8/1/24 @ 100) | | 100 | 101 |
| 5% 8/1/24 (Pre-Refunded to 8/1/24 @ 100) | | 210 | 212 |
| Bay Area Toll Auth. San Francisco Bay Toll Bridge Rev. Bonds: | | | |
| Series 2014 S6, 5% 10/1/24 (Pre-Refunded to 10/1/24 @ 100) | | 22,175 | 22,360 |
| Series 2023 F1, 5% 4/1/24 | | 450 | 451 |
| Series F1, 5% 4/1/24 (Pre-Refunded to 4/1/24 @ 100) | | 4,170 | 4,176 |
| Series S7, 5% 4/1/24 | | 1,185 | 1,187 |
| Bonita Unified School District Bonds: | | | |
| Series 2014 C, 5% 8/1/24 (Pre-Refunded to 8/1/24 @ 100) | | 250 | 252 |
| Series 2014, 5% 8/1/24 (Pre-Refunded to 8/1/24 @ 100) | | 540 | 544 |
| California Edl. Facilities Auth. Rev. Bonds: | | | |
| Series 2009 C, 5.25% 10/1/24 (Escrowed to Maturity) | | 120 | 121 |
| Series 2023, 3.4% tender 4/5/24, CP mode | | 12,000 | 12,000 |
| California Gen. Oblig.: | | | |
| Bonds: | | | |
Series 2013, 5% 9/1/24 | | 910 | 911 |
Series 2014: | | | |
5% 5/1/24 | | 225 | 226 |
5% 10/1/24 | | 765 | 772 |
5% 10/1/24 | | 690 | 696 |
5% 11/1/24 | | 200 | 202 |
Series 2015 B, 5% 9/1/24 | | 625 | 631 |
Series 2015: | | | |
4% 3/1/24 | | 310 | 310 |
5% 3/1/24 | | 2,800 | 2,800 |
5% 3/1/24 | | 5,275 | 5,275 |
5% 8/1/24 | | 2,175 | 2,192 |
5% 8/1/24 | | 300 | 302 |
5% 8/1/24 | | 1,015 | 1,022 |
Series 2016: | | | |
5% 8/1/24 | | 4,325 | 4,358 |
5% 9/1/24 | | 505 | 509 |
5% 9/1/24 | | 950 | 957 |
Series 2017 B, 5% 8/1/24 | | 1,280 | 1,290 |
Series 2017: | | | |
5% 8/1/24 | | 425 | 428 |
5% 8/1/24 | | 3,560 | 3,588 |
5% 8/1/24 | | 3,330 | 3,357 |
5% 11/1/24 | | 285 | 287 |
Series 2018: | | | |
5% 8/1/24 | | 530 | 534 |
5% 10/1/24 | | 1,725 | 1,742 |
5% 10/1/24 | | 350 | 354 |
Series 2019: | | | |
4% 4/1/24 | | 775 | 776 |
4% 4/1/24 | | 1,430 | 1,430 |
4% 10/1/24 | | 975 | 979 |
5% 4/1/24 | | 595 | 596 |
5% 4/1/24 | | 12,315 | 12,333 |
Series 2020: | | | |
3% 3/1/24 | | 555 | 555 |
4% 3/1/24 | | 5,765 | 5,765 |
4% 3/1/24 | | 1,075 | 1,075 |
4% 11/1/24 | | 290 | 291 |
5% 3/1/24 | | 625 | 625 |
5% 11/1/24 | | 1,125 | 1,136 |
Series 2021: | | | |
5% 9/1/24 | | 270 | 272 |
5% 10/1/24 | | 640 | 646 |
5% 10/1/24 | | 10,245 | 10,349 |
Series 2022: | | | |
5% 4/1/24 | | 400 | 401 |
5% 4/1/24 | | 9,485 | 9,500 |
5% 9/1/24 | | 10,100 | 10,185 |
5% 9/1/24 | | 300 | 303 |
Series 2023: | | | |
5% 9/1/24 | | 79,425 | 80,115 |
5% 9/1/24 | | 40,420 | 40,731 |
5% 10/1/24 | | 115 | 116 |
| Series 2024 A1: | | | |
3.2% 3/26/24, LOC Wells Fargo Bank NA, CP | | 25,000 | 25,000 |
3.22% 5/2/24, LOC Wells Fargo Bank NA, CP | | 21,250 | 21,250 |
3.25% 5/7/24, LOC Wells Fargo Bank NA, CP | | 30,935 | 30,935 |
3.35% 4/25/24, LOC Wells Fargo Bank NA, CP | | 28,255 | 28,255 |
| Series 2024 A2: | | | |
3.2% 3/6/24, LOC Royal Bank of Canada, CP | | 22,585 | 22,585 |
3.27% 5/1/24, LOC Royal Bank of Canada, CP | | 20,765 | 20,765 |
3.3% 5/6/24, LOC Royal Bank of Canada, CP | | 32,050 | 32,050 |
3.47% 5/8/24, LOC Royal Bank of Canada, CP | | 30,140 | 30,140 |
| Series 2024 A3, 3.13% 4/3/24, LOC UBS AG, CP | | 36,275 | 36,275 |
| Series 2024 A4, 3.5% 5/9/24, LOC Toronto-Dominion Bank, CP | | 38,900 | 38,900 |
| Series 2024 A7, 3.52% 5/16/24, LOC State Street Bank & Trust Co., Boston, CP | | 20,260 | 20,260 |
| Series 2024 A8, 3% 3/6/24, LOC Bank of Montreal, CP | | 1,755 | 1,755 |
| California Health Facilities Fing. Auth. Rev. Bonds: | | | |
| Series 2014 A, 5% 10/1/24 (Pre-Refunded to 10/1/24 @ 100) | | 105 | 106 |
| Series 2015, 5% 11/15/24 | | 100 | 101 |
| Series 2016 A, 5% 11/15/24 (Escrowed to Maturity) | | 300 | 304 |
| Series 2018 A, 5% 11/15/24 | | 4,240 | 4,298 |
| Series 2022 A, 5% 5/15/24 | | 3,740 | 3,752 |
| California Infrastructure & Econ. Dev. Bank Rev. Bonds Series 2003, 5% 7/1/24 (Escrowed to Maturity) | | 900 | 904 |
| California Muni. Fin. Auth. Bonds (Orange County Civic Ctr. Infrastructure Impt. Proj. - Phase I) Series 2017 A, 5% 6/1/24 | | 175 | 176 |
| California Pub. Works Board Lease Rev. Bonds: | | | |
| (Riverside Campus Projs.) Series 2017 H, 5% 4/1/24 | | 100 | 100 |
| (Various Cap. Projs.): | | | |
Series 2014 H, 5% 12/1/24 | | 160 | 162 |
Series 2016 C, 5% 11/1/24 | | 735 | 742 |
Series 2016 D: | | | |
3% 4/1/24 | | 100 | 100 |
5% 4/1/24 | | 190 | 190 |
Series 2017 C, 5% 3/1/24 | | 695 | 695 |
Series 2017 G, 4% 10/1/24 | | 400 | 402 |
Series 2020 D, 5% 11/1/24 | | 615 | 622 |
Series 2021 B, 5% 5/1/24 | | 670 | 671 |
Series 2022 C, 5% 8/1/24 | | 3,770 | 3,799 |
Series 2023 C, 5% 9/1/24 | | 14,500 | 14,593 |
| Series 2014 A, 5% 9/1/24 | | 360 | 362 |
| Series 2014 B, 5% 10/1/24 | | 350 | 353 |
| Series 2014 C, 5% 10/1/24 | | 2,080 | 2,102 |
| Series 2014 E, 5% 9/1/24 | | 500 | 505 |
| Series 2015 A, 5% 6/1/24 | | 255 | 256 |
| Series 2015 F, 5% 5/1/24 | | 2,360 | 2,366 |
| Series 2015 G, 5% 5/1/24 | | 325 | 326 |
| Series 2015 H, 5% 12/1/24 | | 125 | 126 |
| Series 2017 A, 5% 3/1/24 | | 110 | 110 |
| Series 2017 D, 5% 9/1/24 | | 375 | 378 |
| Series 2017 E, 5% 9/1/24 | | 400 | 404 |
| Series 2017, 5% 10/1/24 | | 335 | 338 |
| Series 2018 A, 5% 5/1/24 | | 300 | 301 |
| Series 2018 C, 5% 11/1/24 | | 255 | 258 |
| Series 2019 B, 5% 5/1/24 | | 150 | 150 |
| Series 2022 A, 5% 8/1/24 | | 7,575 | 7,627 |
| Series 2022 B, 5% 6/1/24 | | 2,085 | 2,095 |
| Series 2023 B, 5% 12/1/24 | | 275 | 279 |
| California State Univ. Rev.: | | | |
| Bonds: | | | |
Series 2015 A: | | | |
4% 11/1/24 | | 200 | 201 |
5% 11/1/24 | | 175 | 177 |
Series 2017 A, 5% 11/1/24 | | 325 | 329 |
Series 2021 A, 5% 11/1/24 | | 375 | 380 |
| Series 2023 A: | | | |
3.17% 3/6/24, LOC State Street Bank & Trust Co., Boston, LOC Wells Fargo Bank NA, CP | | 13,000 | 13,000 |
3.18% 3/6/24, LOC State Street Bank & Trust Co., Boston, LOC Wells Fargo Bank NA, CP | | 4,650 | 4,650 |
3.2% 3/5/24, LOC State Street Bank & Trust Co., Boston, LOC Wells Fargo Bank NA, CP | | 7,063 | 7,063 |
| Series 2024 A, 3.15% 6/5/24, LOC State Street Bank & Trust Co., Boston, LOC Wells Fargo Bank NA, CP | | 6,500 | 6,500 |
| California Statewide Cmntys. Dev. Auth. Rev. Bonds: | | | |
| Series 2014 B: | | | |
4% 7/1/24 (Pre-Refunded to 7/1/24 @ 100) | | 635 | 636 |
5% 7/1/24 (Pre-Refunded to 7/1/24 @ 100) | | 100 | 101 |
5% 7/1/24 (Pre-Refunded to 7/1/24 @ 100) | | 195 | 196 |
5% 7/1/24 (Pre-Refunded to 7/1/24 @ 100) | | 1,070 | 1,075 |
| Series 2014: | | | |
5% 7/1/24 (Pre-Refunded to 7/1/24 @ 100) | | 4,860 | 4,888 |
5% 11/15/24 (Pre-Refunded to 11/15/24 @ 100) | | 160 | 162 |
5% 11/15/24 (Pre-Refunded to 11/15/24 @ 100) | | 2,200 | 2,221 |
5.25% 10/1/24 (Pre-Refunded to 10/1/24 @ 100) | | 330 | 334 |
| Cupertino California Union School District Bonds Series 2014 B: | | | |
| 5% 8/1/24 (Pre-Refunded to 8/1/24 @ 100) | | 100 | 101 |
| 5% 8/1/24 (Pre-Refunded to 8/1/24 @ 100) | | 615 | 620 |
| 5% 8/1/24 (Pre-Refunded to 8/1/24 @ 100) | | 200 | 201 |
| 5% 8/1/24 (Pre-Refunded to 8/1/24 @ 100) | | 360 | 363 |
| East Bay Muni. Util. District Wastewtr. Sys. Rev.: | | | |
| Bonds Series 2015 A, 4% 6/1/24 | | 200 | 200 |
| Series 2023 A1: | | | |
3.18% 3/6/24 (Liquidity Facility Sumitomo Mitsui Banking Corp.), CP | | 17,400 | 17,400 |
3.25% 3/5/24 (Liquidity Facility Sumitomo Mitsui Banking Corp.), CP | | 39,210 | 39,210 |
3.3% 3/4/24 (Liquidity Facility Sumitomo Mitsui Banking Corp.), CP | | 12,240 | 12,240 |
| Series 2024 A2, 3.55% 6/11/24 (Liquidity Facility Bank of America NA), CP | | 15,250 | 15,250 |
| Series A2, 3.4% 3/26/24 (Liquidity Facility Bank of America NA), CP | | 15,800 | 15,800 |
| El Dorado Irr. Distr. Rev. Bonds Series 2014 A: | | | |
| 5% 3/1/24 (Pre-Refunded to 3/1/24 @ 100) | | 140 | 140 |
| 5% 3/1/24 (Pre-Refunded to 3/1/24 @ 100) | | 250 | 250 |
| 5% 3/1/24 (Pre-Refunded to 3/1/24 @ 100) | | 1,515 | 1,515 |
| 5.25% 3/1/24 (Pre-Refunded to 3/1/24 @ 100) | | 2,975 | 2,975 |
| Elk Grove Unified School District Bonds Series 2023, 5% 8/1/24 | | 125 | 126 |
| Foothill-De Anza Cmnty. College District Bonds Series 2014: | | | |
| 5% 8/1/24 (Pre-Refunded to 8/1/24 @ 100) | | 185 | 186 |
| 5% 8/1/24 (Pre-Refunded to 8/1/24 @ 100) | | 225 | 226 |
| 5% 8/1/24 (Pre-Refunded to 8/1/24 @ 100) | | 180 | 181 |
| Foothill-De Anza Commission Clctfs Bonds Series 2016, 4% 10/1/24 (Pre-Refunded to 10/1/24 @ 100) | | 240 | 241 |
| Fremont Unified School District, Alameda County Bonds Series 2014 A, 4% 8/1/24 (Pre-Refunded to 8/1/24 @ 100) | | 605 | 607 |
| Fresno Unified School District Bonds Series 2014 D, 5% 8/1/24 (Pre-Refunded to 8/1/24 @ 100) | | 100 | 101 |
| Gilroy Calif Unified School District Bonds Series 2015, 5% 8/1/24 (Pre-Refunded to 8/1/24 @ 100) | | 205 | 206 |
| Golden Gate Bridge & Hwy. District: | | | |
| Series 2023 B, 3.34% 3/4/24, CP | | 5,000 | 5,000 |
| Series 2024 B, 3.55% 6/20/24, CP | | 16,800 | 16,800 |
| Golden State Tobacco Securitization Corp. Tobacco Settlement Rev. Bonds: | | | |
| Series 2017 A1, 5% 6/1/24 (Escrowed to Maturity) | | 5,045 | 5,067 |
| Series A, 0% 6/1/24 (Escrowed to Maturity) | | 13,480 | 13,370 |
| Grossmont-Cuyamaca Cmnty. College District Bonds Series 2018, 5% 8/1/24 | | 550 | 554 |
| Long Beach Hbr. Rev. Bonds: | | | |
| Series 2020 A, 4% 5/15/24 | | 775 | 776 |
| Series 2020 B, 5% 5/15/24 (c) | | 725 | 727 |
| Long Beach Unified School District Bonds: | | | |
| Series 2016 C, 5% 8/1/24 | | 510 | 514 |
| Series 2023 A, 5% 8/1/24 | | 1,090 | 1,097 |
| Los Angeles Cmnty. College District Bonds: | | | |
| Series 2015 A: | �� | | |
4% 8/1/24 (Pre-Refunded to 8/1/24 @ 100) | | 2,130 | 2,138 |
4% 8/1/24 (Pre-Refunded to 8/1/24 @ 100) | | 12,430 | 12,480 |
5% 8/1/24 | | 1,790 | 1,803 |
5% 8/1/24 (Pre-Refunded to 8/1/24 @ 100) | | 2,990 | 3,012 |
5% 8/1/24 (Pre-Refunded to 8/1/24 @ 100) | | 935 | 943 |
5% 8/1/24 (Pre-Refunded to 8/1/24 @ 100) | | 2,565 | 2,584 |
5% 8/1/24 (Pre-Refunded to 8/1/24 @ 100) | | 2,840 | 2,859 |
5% 8/1/24 (Pre-Refunded to 8/1/24 @ 100) | | 4,660 | 4,693 |
5% 8/1/24 (Pre-Refunded to 8/1/24 @ 100) | | 4,685 | 4,721 |
| Series 2015 C, 5% 8/1/24 | | 360 | 363 |
| Series 2015 G: | | | |
4% 8/1/24 | | 150 | 150 |
4% 8/1/24 (Pre-Refunded to 8/1/24 @ 100) | | 550 | 552 |
5% 8/1/24 (Pre-Refunded to 8/1/24 @ 100) | | 200 | 202 |
| Series 2016 I, 4% 8/1/24 | | 575 | 577 |
| Series 2017 J, 4% 8/1/24 | | 1,085 | 1,088 |
| Series 2022 C1, 5% 8/1/24 | | 1,220 | 1,229 |
| Series 2023 A1, 5% 8/1/24 | | 310 | 312 |
| Series 2023 M, 5% 8/1/24 | | 795 | 801 |
| Series A, 5% 8/1/24 (Pre-Refunded to 8/1/24 @ 100) | | 3,960 | 3,990 |
| Los Angeles County Gen. Oblig.: | | | |
| Series 2024 C: | | | |
3.1% 3/7/24, LOC Wells Fargo Bank NA, CP | | 9,500 | 9,500 |
3.1% 3/21/24, LOC Wells Fargo Bank NA, CP | | 17,850 | 17,850 |
3.55% 3/28/24, LOC Wells Fargo Bank NA, CP | | 20,000 | 20,000 |
| TRAN Series 2023, 5% 6/28/24 | | 41,520 | 41,760 |
| Los Angeles County Metropolitan Trans. Auth. Sales Tax Rev.: | | | |
| Bonds: | | | |
Series 2016 A, 5% 6/1/24 | | 180 | 181 |
Series 2017 A, 5% 7/1/24 | | 100 | 101 |
Series 2020 A, 5% 6/1/24 | | 825 | 828 |
Series 2021 A, 5% 6/1/24 | | 250 | 251 |
Series 2022 A, 5% 7/1/24 | | 260 | 261 |
| Series 2024 ATE: | | | |
3.23% 3/15/24, LOC Bank of America NA, CP | | 3,000 | 3,000 |
3.3% 3/14/24, LOC Bank of America NA, CP | | 2,500 | 2,500 |
| Los Angeles County Pub. Works Fing. Auth. Lease Rev. Bonds: | | | |
| (LACMA Bldg. for the Permanent Collection Proj.) Series 2020 A, 5% 12/1/24 | | 100 | 101 |
| Series 2016 D, 5% 12/1/24 | | 110 | 111 |
| Los Angeles County Schools Pooled Fing. Prog. Ctfs. of Prtn. TRAN Series 2023, 5% 6/28/24 | | 4,000 | 4,024 |
| Los Angeles Dept. Arpt. Rev. Bonds: | | | |
| Series 2016 A: | | | |
5% 5/15/24 (c) | | 4,080 | 4,092 |
5% 5/15/24 (Escrowed to Maturity) (c) | | 120 | 120 |
| Series 2017 A, 5% 5/15/24 (c) | | 310 | 311 |
| Series 2017 B, 5% 5/15/24 (c) | | 3,470 | 3,479 |
| Series 2018 A, 5% 5/15/24 (c) | | 2,330 | 2,336 |
| Series 2018 C, 5% 5/15/24 (c) | | 7,705 | 7,729 |
| Series 2018 D, 5% 5/15/24 (c) | | 250 | 251 |
| Series 2018 E, 5% 5/15/24 | | 100 | 100 |
| Series 2019 D, 5% 5/15/24 (c) | | 135 | 135 |
| Series 2019 E, 4% 5/15/24 | | 400 | 400 |
| Series 2019 F, 5% 5/15/24 (c) | | 420 | 421 |
| Series 2019, 5% 5/15/24 | | 145 | 146 |
| Series 2020 B, 5% 5/15/24 | | 275 | 276 |
| Series 2020 C, 5% 5/15/24 (c) | | 1,100 | 1,103 |
| Series 2022 D, 5% 5/15/24 | | 1,000 | 1,004 |
| Series 2023 A, 5% 5/15/24 (c) | | 225 | 226 |
| Series B, 5% 5/15/24 (c) | | 200 | 201 |
| Los Angeles Dept. of Wtr. & Pwr. Rev. Bonds: | | | |
| Series 2017 A, 5% 7/1/24 | | 100 | 101 |
| Series 2019 B, 5% 7/1/24 | | 1,545 | 1,552 |
| Series 2022 C, 5% 7/1/24 | | 215 | 216 |
| Los Angeles Dept. of Wtr. & Pwr. Wtrwks. Rev. Bonds: | | | |
| Series 2018 B, 5% 7/1/24 | | 335 | 337 |
| Series 2022 B, 5% 7/1/24 | | 955 | 960 |
| Series 2022 D, 5% 7/1/24 | | 100 | 101 |
| Los Angeles Gen. Oblig.: | | | |
| Bonds Series 2021 B, 4% 9/1/24 | | 375 | 376 |
| TRAN Series 2023, 5% 6/27/24 | | 86,225 | 86,705 |
| Los Angeles Hbr. Dept. Rev. Bonds Series 2016 A, 5% 8/1/24 (c) | | 1,125 | 1,133 |
| Los Angeles Muni. Impt. Corp. Lease Rev.: | | | |
| Bonds: | | | |
Series 2016 A: | | | |
4% 11/1/24 | | 110 | 111 |
5% 11/1/24 | | 500 | 506 |
Series 2016 B, 5% 11/1/24 | | 100 | 101 |
Series 2019 A, 5% 5/1/24 (Pre-Refunded to 5/1/24 @ 100) | | 1,290 | 1,294 |
Series 2019 B: | | | |
5% 5/1/24 (Pre-Refunded to 5/1/24 @ 100) | | 300 | 301 |
5% 5/1/24 (Pre-Refunded to 5/1/24 @ 100) | | 470 | 471 |
5% 5/1/24 (Pre-Refunded to 5/1/24 @ 100) | | 560 | 561 |
5% 5/1/24 (Pre-Refunded to 5/1/24 @ 100) | | 150 | 150 |
5% 5/1/24 (Pre-Refunded to 5/1/24 @ 100) | | 270 | 271 |
5% 5/1/24 (Pre-Refunded to 5/1/24 @ 100) | | 155 | 155 |
5% 5/1/24 (Pre-Refunded to 5/1/24 @ 100) | | 900 | 902 |
Series 2020 A, 5% 11/1/24 | | 105 | 106 |
Series 2023 A, 5% 5/1/24 | | 1,100 | 1,103 |
| Series 2024 A1, 3.38% 3/5/24, LOC BMO Harris Bank NA, CP | | 20,000 | 20,000 |
| Series 2024 A2: | | | |
3.35% 4/17/24, LOC Bank of America NA, CP | | 6,428 | 6,428 |
3.38% 3/11/24, LOC Bank of America NA, CP | | 14,300 | 14,300 |
| Los Angeles Unified School District Bonds: | | | |
| Series 2014 B, 5% 7/1/24 | | 830 | 834 |
| Series 2014 C, 5% 7/1/24 | | 1,515 | 1,523 |
| Series 2015 A, 5% 7/1/24 | | 325 | 327 |
| Series 2018 B1, 5% 7/1/24 | | 125 | 126 |
| Series 2020 C, 5% 7/1/24 | | 1,245 | 1,252 |
| Series 2020 RYQ, 5% 7/1/24 | | 100 | 101 |
| Series 2022 QRR, 5% 7/1/24 | | 155 | 156 |
| Series A: | | | |
5% 7/1/24 | | 615 | 618 |
5% 7/1/24 | | 1,900 | 1,909 |
| Los Angeles Unified School District Ctfs. of Prtn. Bonds: | | | |
| Series 2020 A, 5% 10/1/24 | | 975 | 982 |
| Series 2023 A, 5% 10/1/24 | | 500 | 505 |
| Los Angeles Wastewtr. Sys. Rev.: | | | |
| Bonds: | | | |
Series 2012 A, 5% 6/1/24 | | 310 | 311 |
Series 2013 A, 5% 6/1/24 | | 125 | 125 |
Series 2018 A, 5% 6/1/24 | | 150 | 151 |
Series 2022 C, 5% 6/1/24 | | 565 | 567 |
| Series 2023 A2, 3.37% 3/14/24, LOC Toronto-Dominion Bank, CP | | 33,624 | 33,624 |
| North Orange County Cmnty. College District Rev. Bonds Series 2020 C, 5% 8/1/24 | | 800 | 806 |
| Ohlone Cmnty. College District Bonds Series 2014 B, 4% 8/1/24 (Pre-Refunded to 8/1/24 @ 100) | | 3,625 | 3,639 |
| Orange County Trans. Auth. Bonds (I-405 Impt. Proj.) Series 2021: | | | |
| 4% 10/15/24 (Escrowed to Maturity) | | 845 | 849 |
| 5% 10/15/24 (Escrowed to Maturity) | | 4,390 | 4,433 |
| Orange County Wtr. District Rev. Ctfs. of Prtn. Series 2024, 3.08% 3/4/24, LOC Sumitomo Mitsui Banking Corp., CP | | 12,900 | 12,900 |
| Oxnard School District Bonds Series 2014 C, 4% 8/1/24 (Pre-Refunded to 8/1/24 @ 100) | | 1,610 | 1,615 |
| Oxnard Union High School District Gen. Oblig. Bonds Series 2014 C, 5% 8/1/24 (Pre-Refunded to 8/1/24 @ 100) | | 425 | 428 |
| Pub. Utils. Commission San Francisco City & County Wastewtr. Rev. Bonds Series 2018 B, 5% 10/1/24 | | 360 | 364 |
| Riverside County Gen. Oblig. TRAN Series 2023, 5% 6/28/24 | | 34,070 | 34,251 |
| San Diego County Reg'l. Trans. Commission Sales Tax Rev. Bonds: | | | |
| Series 2014 A: | | | |
4.75% 4/1/24 (Pre-Refunded to 4/1/24 @ 100) | | 1,670 | 1,672 |
5% 4/1/24 (Pre-Refunded to 4/1/24 @ 100) | | 100 | 100 |
5% 4/1/24 (Pre-Refunded to 4/1/24 @ 100) | | 350 | 351 |
5% 4/1/24 (Pre-Refunded to 4/1/24 @ 100) | | 565 | 566 |
5% 4/1/24 (Pre-Refunded to 4/1/24 @ 100) | | 4,945 | 4,953 |
5% 4/1/24 (Pre-Refunded to 4/1/24 @ 100) | | 1,425 | 1,427 |
5% 4/1/24 (Pre-Refunded to 4/1/24 @ 100) | | 1,995 | 1,998 |
| Series 2014, 5% 4/1/24 (Pre-Refunded to 4/1/24 @ 100) | | 920 | 921 |
| San Diego Unified School District: | | | |
| Bonds: | | | |
Series 2022 F2, 5% 7/1/24 | | 6,290 | 6,328 |
Series 2022 M2, 5% 7/1/24 | | 640 | 644 |
Series 2022, 5% 7/1/24 | | 220 | 221 |
| TRAN Series 2023 A, 5% 6/28/24 | | 22,165 | 22,295 |
| San Francisco Bay Area Rapid Transit District Sales Tax Rev. Bonds Series 2017 A, 5% 7/1/24 | | 125 | 125 |
| San Francisco Bay Area Rapid Transit Fing. Auth. Bonds: | | | |
| Series 2013 C, 5% 8/1/24 | | 825 | 825 |
| Series 2015 D, 4% 8/1/24 | | 1,240 | 1,243 |
| Series 2019 F1, 4% 8/1/24 | | 1,010 | 1,013 |
| San Francisco City & County: | | | |
| Series 2023 A1, 3.15% 3/5/24, LOC Bank of America NA, CP | | 15,000 | 15,000 |
| Series 2024 A1, 3.1% 5/2/24, LOC Bank of America NA, CP | | 35,000 | 35,000 |
| San Francisco City & County Arpts. Commission Int'l. Arpt. Rev. Series 2024 A6, 3.45% 4/3/24, LOC Bank of America NA, CP (c) | | 15,000 | 15,000 |
| San Francisco City & County Ctfs. of Prtn. Bonds: | | | |
| (Moscone Convention Ctr. Expansion Proj.) Series 2017 B, 5% 4/1/24 | | 1,325 | 1,327 |
| (Multiple Cap. Impt. Projs.) Series 2019 R1, 5% 4/1/24 | | 2,100 | 2,103 |
| Series 2020 R1, 5% 10/1/24 | | 350 | 354 |
| San Francisco City & County Gen. Oblig. Bonds: | | | |
| Series 2015 R1, 5% 6/15/24 | | 100 | 100 |
| Series 2018 C, 5% 6/15/24 | | 430 | 432 |
| Series 2020 R1, 5% 6/15/24 | | 600 | 602 |
| Series 2021 D1, 5% 6/15/24 | | 115 | 116 |
| Series 2021 R2, 5% 6/15/24 | | 240 | 241 |
| Series 2022 R1, 5% 6/15/24 | | 475 | 477 |
| San Francisco Muni. Trans. Agcy. Bonds Series 2014: | | | |
| 5% 3/1/24 (Pre-Refunded to 3/1/24 @ 100) | | 100 | 100 |
| 5% 3/1/24 (Pre-Refunded to 3/1/24 @ 100) | | 1,250 | 1,250 |
| 5% 3/1/24 (Pre-Refunded to 3/1/24 @ 100) | | 710 | 710 |
| 5% 3/1/24 (Pre-Refunded to 3/1/24 @ 100) | | 125 | 125 |
| San Francisco Pub. Utils. Commission Wtr. Rev. Bonds: | | | |
| Series 2016 B, 3% 11/1/24 | | 100 | 100 |
| Series 2016, 5% 11/1/24 | | 155 | 156 |
| San Jose Evergreen Cmnty. College District Bonds Series 2014 C, 4.125% 9/1/24 (Pre-Refunded to 9/1/24 @ 100) | | 125 | 126 |
| San Jose Int. Arpt. Rev. Series 2024 A1: | | | |
| 3.25% 3/19/24, LOC Bank of America NA, CP | | 13,651 | 13,651 |
| 3.25% 3/19/24, LOC Bank of America NA, CP | | 5,000 | 5,000 |
| San Jose Unified School District Santa Clara County Bonds Series 2015 C, 5% 8/1/24 (Pre-Refunded to 8/1/24 @ 100) | | 125 | 126 |
| San Mateo County Cmnty. College District Bonds Series 2014: | | | |
| 5% 9/1/24 (Pre-Refunded to 9/1/24 @ 100) | | 375 | 378 |
| 5% 9/1/24 (Pre-Refunded to 9/1/24 @ 100) | | 100 | 101 |
| Santa Ana Coliseum Imp Dis 1 Rancho Bonds Series 2014 A, 4% 8/1/24 (Pre-Refunded to 8/1/24 @ 100) | | 2,880 | 2,891 |
| Santa Monica Cmnty. College District Gen. Oblig. Bonds Series 2014 B: | | | |
| 4% 8/1/24 (Pre-Refunded to 8/1/24 @ 100) | | 375 | 376 |
| 4% 8/1/24 (Pre-Refunded to 8/1/24 @ 100) | | 130 | 130 |
| 5% 8/1/24 (Pre-Refunded to 8/1/24 @ 100) | | 535 | 539 |
| South Orange County Pub. Fin. Auth. Bonds Series 2016, 5% 4/1/24 | | 100 | 100 |
| Southwestern Cmnty. College District Gen. Oblig. Bonds Series 2016 B, 4% 8/1/24 | | 200 | 201 |
| Univ. of California Regents Med. Ctr. Pool Rev. Bonds Series 2016 L, 5% 5/15/24 | | 3,470 | 3,481 |
| Univ. of California Revs.: | | | |
| Bonds: | | | |
Series 2014 AM: | | | |
4.5% 5/15/24 | | 100 | 100 |
5.25% 5/15/24 (Pre-Refunded to 5/15/24 @ 100) | | 185 | 186 |
Series 2014, 5.25% 5/15/24 (Pre-Refunded to 5/15/24 @ 100) | | 2,625 | 2,636 |
Series 2015 AO: | | | |
4% 5/15/24 | | 130 | 130 |
5% 5/15/24 | | 585 | 587 |
Series 2015 I, 5% 5/15/24 | | 305 | 306 |
Series 2016 K, 4% 5/15/24 | | 100 | 100 |
Series 2017 AV, 5% 5/15/24 | | 340 | 341 |
Series 2017 AY, 5% 5/15/24 | | 300 | 301 |
Series 2017 M, 4% 5/15/24 | | 125 | 125 |
Series 2018 O, 4% 5/15/24 | | 100 | 100 |
Series 2020 BE, 5% 5/15/24 | | 100 | 100 |
Series 2022 S, 5% 5/15/24 | | 250 | 251 |
Series 2023: | | | |
5% 5/15/24 | | 1,295 | 1,299 |
5% 5/15/24 | | 805 | 808 |
| Series 2024: | | | |
3.35% 4/3/24, CP | | 25,000 | 25,000 |
3.35% 4/8/24, CP | | 20,600 | 20,600 |
3.4% 3/5/24, CP | | 7,500 | 7,500 |
3.4% 3/6/24, CP | | 7,500 | 7,500 |
3.5% 5/14/24, CP | | 7,470 | 7,470 |
3.5% 5/15/24, CP | | 18,000 | 18,000 |
3.5% 5/15/24, CP | | 30,000 | 30,000 |
3.5% 5/16/24, CP | | 20,000 | 20,000 |
3.5% 5/22/24, CP | | 10,000 | 10,000 |
3.55% 5/15/24, CP | | 15,000 | 15,000 |
| Walnut Energy Ctr. Auth. Rev. Series 2024 B, 3.15% 4/2/24, LOC Wells Fargo Bank NA, CP | | 18,331 | 18,331 |
TOTAL CALIFORNIA | | | 1,550,031 |
| Michigan - 0.1% | | | |
| Kent Hosp. Fin. Auth. Hosp. Facilities Rev. Bonds (Spectrum Health Sys. Proj.) Series 2015 A, SIFMA Municipal Swap Index + 0.250% 3.49%, tender 9/26/24 (b)(h) | | 1,800 | 1,800 |
| TOTAL OTHER MUNICIPAL SECURITY (Cost $1,551,831) | | | 1,551,831 |
| | | | |
| Investment Company - 7.7% |
| | | Shares | Value ($) (000s) |
Fidelity Municipal Cash Central Fund 3.30% (i)(j) (Cost $327,929) | | 327,868 | 327,929 |
| | | | |
| TOTAL INVESTMENT IN SECURITIES - 98.1% (Cost $4,163,215) | 4,163,215 |
NET OTHER ASSETS (LIABILITIES) - 1.9% | 80,858 |
| NET ASSETS - 100.0% | 4,244,073 |
| | |
Security Type Abbreviations
| CP | - | COMMERCIAL PAPER |
| TRAN | - | TAX AND REVENUE ANTICIPATION NOTE |
| VRDN | - | VARIABLE RATE DEMAND NOTE (A debt instrument that is payable upon demand, either daily, weekly or monthly) |
The date shown for securities represents the date when principal payments must be paid, taking into account any call options exercised by the issuer and any permissible maturity shortening features other than interest rate resets.
Any values shown as $0 in the Schedule of Investments may reflect amounts less than $500.
Legend
| (a) | Amount is stated in United States dollars unless otherwise noted. |
| (b) | Coupon rates for floating and adjustable rate securities reflect the rates in effect at period end. |
| (c) | Private activity obligations whose interest is subject to the federal alternative minimum tax for individuals. |
| (d) | Security exempt from registration under Rule 144A of the Securities Act of 1933. These securities may be resold in transactions exempt from registration, normally to qualified institutional buyers. At the end of the period, the value of these securities amounted to $36,709,000 or 0.9% of net assets. |
| (e) | Provides evidence of ownership in one or more underlying municipal bonds. |
| (f) | Coupon rates are determined by re-marketing agents based on current market conditions. |
| (g) | Restricted securities (including private placements) - Investment in securities not registered under the Securities Act of 1933 (excluding 144A issues). At the end of the period, the value of restricted securities (excluding 144A issues) amounted to $5,000,000 or 0.1% of net assets. |
| (h) | Coupon is indexed to a floating interest rate which may be multiplied by a specified factor and/or subject to caps or floors. |
| (i) | Information in this report regarding holdings by state and security types does not reflect the holdings of the Fidelity Municipal Cash Central Fund. |
| (j) | Affiliated fund that is generally available only to investment companies and other accounts managed by Fidelity Investments. The rate quoted is the annualized seven-day yield of the fund at period end. A complete unaudited listing of the fund's holdings as of its most recent quarter end is available upon request. In addition, each Fidelity Central Fund's financial statements, which are not covered by the Fund's Report of Independent Registered Public Accounting Firm, are available on the SEC's website or upon request. |
| Additional information on each restricted holding is as follows: |
| Security | Acquisition Date | Cost ($) (000s) |
| Central Puget Sound Reg'l. Trans. Auth. Sales & Use Tax Rev. Bonds Series G 123, 3.44%, tender 5/1/24 (Liquidity Facility Royal Bank of Canada) | 11/01/23 | 1,100 |
| | | |
| El Paso Wtr. & Swr. Rev. Bonds Series G 124, 3.44%, tender 9/1/24 (Liquidity Facility Royal Bank of Canada) | 9/01/23 | 1,600 |
| | | |
| Texas Wtr. Dev. Board Rev. Bonds Series MS 00 17, 3.39%, tender 4/25/24 (Liquidity Facility Morgan Stanley Bank, West Valley City Utah) | 10/12/23 | 2,300 |
| | | |
Affiliated Central Funds
Fiscal year to date information regarding the Fund's investments in Fidelity Central Funds, including the ownership percentage, is presented below.
| Affiliate (Amounts in thousands) | Value, beginning of period ($) | Purchases ($) | Sales Proceeds ($) | Dividend Income ($) | Realized Gain (loss) ($) | Change in Unrealized appreciation (depreciation) ($) | Value, end of period ($) | % ownership, end of period |
| Fidelity Municipal Cash Central Fund 3.30% | 229,863 | 2,253,879 | 2,155,811 | 16,000 | (2) | - | 327,929 | 14.6% |
| Total | 229,863 | 2,253,879 | 2,155,811 | 16,000 | (2) | - | 327,929 | |
| | | | | | | | | |
Amounts in the dividend income column in the above table include any capital gain distributions from underlying funds, which are presented in the corresponding line item in the Statement of Operations, if applicable.
Amounts included in the purchases and sales proceeds columns may include in-kind transactions, if applicable.
Investment Valuation
All investments are categorized as Level 2 under the Fair Value Hierarchy. The inputs or methodology used for valuing securities may not be an indication of the risk associated with investing in these securities. For more information on valuation inputs, refer to the Investment Valuation section in the accompanying Notes to Financial Statements.
| Statement of Assets and Liabilities |
| Amounts in thousands (except per-share amounts) | | | | February 29, 2024 |
| | | | | |
| Assets | | | | |
| Investment in securities, at value - See accompanying schedule: | | | | |
Unaffiliated issuers (cost $3,835,286) | $ | 3,835,286 | | |
Fidelity Central Funds (cost $327,929) | | 327,929 | | |
| | | | | |
| | | | | |
| Total Investment in Securities (cost $4,163,215) | | | $ | 4,163,215 |
| Cash | | | | 103 |
| Receivable for investments sold | | | | 60,141 |
| Receivable for fund shares sold | | | | 13,821 |
| Interest receivable | | | | 28,045 |
| Distributions receivable from Fidelity Central Funds | | | | 1,131 |
| Receivable from investment adviser for expense reductions | | | | 132 |
| Other receivables | | | | 2 |
Total assets | | | | 4,266,590 |
| Liabilities | | | | |
| Payable for investments purchased | $ | 2,324 | | |
| Payable for fund shares redeemed | | 18,166 | | |
| Distributions payable | | 1,077 | | |
| Accrued management fee | | 706 | | |
| Other affiliated payables | | 244 | | |
| Total Liabilities | | | | 22,517 |
| Net Assets | | | $ | 4,244,073 |
| Net Assets consist of: | | | | |
| Paid in capital | | | $ | 4,243,899 |
| Total accumulated earnings (loss) | | | | 174 |
| Net Assets | | | $ | 4,244,073 |
| | | | | |
| Net Asset Value and Maximum Offering Price | | | | |
| Fidelity California Municipal Money Market Fund : | | | | |
Net Asset Value, offering price and redemption price per share ($24,826 ÷ 24,827 shares) | | | $ | 1.00 |
| Institutional Class : | | | | |
Net Asset Value, offering price and redemption price per share ($2,669,861 ÷ 2,667,225 shares) | | | $ | 1.00 |
| Premium Class : | | | | |
Net Asset Value, offering price and redemption price per share ($1,549,386 ÷ 1,547,870 shares) | | | $ | 1.00 |
| Statement of Operations |
| Amounts in thousands | | | | Year ended February 29, 2024 |
| Investment Income | | | | |
| Interest | | | $ | 115,071 |
| Income from Fidelity Central Funds | | | | 16,000 |
| Total Income | | | | 131,071 |
| Expenses | | | | |
| Management fee | $ | 8,567 | | |
| Transfer agent fees | | 2,988 | | |
| Independent trustees' fees and expenses | | 14 | | |
| Miscellaneous | | 17 | | |
| Total expenses before reductions | | 11,586 | | |
| Expense reductions | | (1,342) | | |
| Total expenses after reductions | | | | 10,244 |
| Net Investment income (loss) | | | | 120,827 |
| Realized and Unrealized Gain (Loss) | | | | |
| Net realized gain (loss) on: | | | | |
| Investment Securities: | | | | |
| Unaffiliated issuers | | (26) | | |
| Fidelity Central Funds | | (2) | | |
| Total net realized gain (loss) | | | | (28) |
| Net increase in net assets resulting from operations | | | $ | 120,799 |
| Statement of Changes in Net Assets |
| |
| Amount in thousands | | Year ended February 29, 2024 | | Year ended February 28, 2023 |
| Increase (Decrease) in Net Assets | | | | |
| Operations | | | | |
| Net investment income (loss) | $ | 120,827 | $ | 48,256 |
| Net realized gain (loss) | | (28) | | 148 |
Net increase in net assets resulting from operations | | 120,799 | | 48,404 |
| Distributions to shareholders | | (120,738) | | (48,271) |
| | | | | |
| Share transactions - net increase (decrease) | | 266,351 | | 2,008,525 |
| Total increase (decrease) in net assets | | 266,412 | | 2,008,658 |
| | | | | |
| Net Assets | | | | |
| Beginning of period | | 3,977,661 | | 1,969,003 |
| End of period | $ | 4,244,073 | $ | 3,977,661 |
| | | | | |
| | | | | |
Financial Highlights
| Fidelity® California Municipal Money Market Fund |
| |
| Years ended February 28, | | 2024 A | | 2023 B |
Selected Per-Share Data | | | | |
| Net asset value, beginning of period | $ | 1.00 | $ | 1.00 |
| Income from Investment Operations | | | | |
Net investment income (loss) C | | .026 | | .009 |
| Net realized and unrealized gain (loss) | | - D | | - D |
| Total from investment operations | | .026 | | .009 |
| Distributions from net investment income | | (.026) | | (.009) |
| Distributions from net realized gain | | - | | - D |
| Total distributions | | (.026) | | (.009) |
| Net asset value, end of period | $ | 1.00 | $ | 1.00 |
Total Return E,F | | 2.66% | | .89% |
Ratios to Average Net Assets C,G,H | | | | |
| Expenses before reductions | | .42% | | .42% I |
| Expenses net of fee waivers, if any | | .42% | | .42% I |
| Expenses net of all reductions | | .42% | | .42% I |
| Net investment income (loss) | | 2.63% | | 2.12% I |
| Supplemental Data | | | | |
| Net assets, end of period (in millions) | $ | 25 | $ | 11 |
AFor the year ended February 29.
BFor the period September 22, 2022 (commencement of sale of shares) through February 28, 2023.
CNet investment income (loss) is affected by the timing of the declaration of dividends by any underlying mutual funds or exchange-traded funds (ETFs). Net investment income (loss) of any mutual funds or ETFs is not included in the Fund's net investment income (loss) ratio.
DAmount represents less than $.0005 per share.
ETotal returns for periods of less than one year are not annualized.
FTotal returns would have been lower if certain expenses had not been reduced during the applicable periods shown.
GFees and expenses of any underlying mutual funds or exchange-traded funds (ETFs) are not included in the Fund's expense ratio. The Fund indirectly bears its proportionate share of these expenses. For additional expense information related to investments in Fidelity Central Funds, please refer to the "Investments in Fidelity Central Funds" note found in the Notes to Financial Statements section of the most recent Annual or Semi-Annual report.
HExpense ratios reflect operating expenses of the class. Expenses before reductions do not reflect amounts reimbursed, waived, or reduced through arrangements with the investment adviser, brokerage services, or other offset arrangements, if applicable, and do not represent the amount paid by the class during periods when reimbursements, waivers or reductions occur.
IAnnualized.
| Fidelity® California Municipal Money Market Fund Institutional Class |
| |
| Years ended February 28, | | 2024 A | | 2023 | | 2022 | | 2021 | | 2020 A |
Selected Per-Share Data | | | | | | | | | | |
| Net asset value, beginning of period | $ | 1.00 | $ | 1.00 | $ | 1.00 | $ | 1.00 | $ | 1.00 |
| Income from Investment Operations | | | | | | | | | | |
Net investment income (loss) B | | .029 | | .014 | | - C | | .003 | | .012 |
Net realized and unrealized gain (loss) C | | - | | - | | - | | - | | - |
| Total from investment operations | | .029 | | .014 | | - C | | .003 | | .012 |
| Distributions from net investment income | | (.029) | | (.014) | | - C | | (.003) | | (.012) |
| Distributions from net realized gain | | - | | - C | | - | | - C | | - C |
| Total distributions | | (.029) | | (.014) | | - C | | (.003) | | (.012) |
| Net asset value, end of period | $ | 1.00 | $ | 1.00 | $ | 1.00 | $ | 1.00 | $ | 1.00 |
Total Return D | | 2.89% | | 1.38% | | .01% | | .26% | | 1.16% |
Ratios to Average Net Assets B,E,F | | | | | | | | | | |
| Expenses before reductions | | .25% | | .25% | | .25% | | .25% | | .25% |
| Expenses net of fee waivers, if any | | .20% | | .20% | | .09% | | .18% | | .20% |
| Expenses net of all reductions | | .20% | | .20% | | .09% | | .18% | | .20% |
| Net investment income (loss) | | 2.85% | | 1.57% | | .01% | | .29% | | 1.14% |
| Supplemental Data | | | | | | | | | | |
| Net assets, end of period (in millions) | $ | 2,670 | $ | 2,340 | $ | 1,523 | $ | 1,963 | $ | 3,527 |
AFor the year ended February 29.
BNet investment income (loss) is affected by the timing of the declaration of dividends by any underlying mutual funds or exchange-traded funds (ETFs). Net investment income (loss) of any mutual funds or ETFs is not included in the Fund's net investment income (loss) ratio.
CAmount represents less than $.0005 per share.
DTotal returns would have been lower if certain expenses had not been reduced during the applicable periods shown.
EFees and expenses of any underlying mutual funds or exchange-traded funds (ETFs) are not included in the Fund's expense ratio. The Fund indirectly bears its proportionate share of these expenses. For additional expense information related to investments in Fidelity Central Funds, please refer to the "Investments in Fidelity Central Funds" note found in the Notes to Financial Statements section of the most recent Annual or Semi-Annual report.
FExpense ratios reflect operating expenses of the class. Expenses before reductions do not reflect amounts reimbursed, waived, or reduced through arrangements with the investment adviser, brokerage services, or other offset arrangements, if applicable, and do not represent the amount paid by the class during periods when reimbursements, waivers or reductions occur.
| Fidelity® California Municipal Money Market Fund Premium Class |
| |
| Years ended February 28, | | 2024 A | | 2023 | | 2022 | | 2021 | | 2020 A |
Selected Per-Share Data | | | | | | | | | | |
| Net asset value, beginning of period | $ | 1.00 | $ | 1.00 | $ | 1.00 | $ | 1.00 | $ | 1.00 |
| Income from Investment Operations | | | | | | | | | | |
Net investment income (loss) B | | .028 | | .013 | | - C | | .002 | | .011 |
Net realized and unrealized gain (loss) C | | - | | - | | - | | - | | - |
| Total from investment operations | | .028 | | .013 | | - C | | .002 | | .011 |
| Distributions from net investment income | | (.028) | | (.013) | | - C | | (.002) | | (.011) |
| Distributions from net realized gain | | - | | - C | | - | | - C | | - C |
| Total distributions | | (.028) | | (.013) | | - C | | (.002) | | (.011) |
| Net asset value, end of period | $ | 1.00 | $ | 1.00 | $ | 1.00 | $ | 1.00 | $ | 1.00 |
Total Return D | | 2.79% | | 1.28% | | .01% | | .22% | | 1.06% |
Ratios to Average Net Assets B,E,F | | | | | | | | | | |
| Expenses before reductions | | .30% | | .30% | | .30% | | .30% | | .30% |
| Expenses net of fee waivers, if any | | .30% | | .30% | | .09% | | .22% | | .30% |
| Expenses net of all reductions | | .30% | | .30% | | .09% | | .22% | | .30% |
| Net investment income (loss) | | 2.75% | | 1.47% | | .01% | | .25% | | 1.04% |
| Supplemental Data | | | | | | | | | | |
| Net assets, end of period (in millions) | $ | 1,549 | $ | 1,626 | $ | 446 | $ | 513 | $ | 675 |
AFor the year ended February 29.
BNet investment income (loss) is affected by the timing of the declaration of dividends by any underlying mutual funds or exchange-traded funds (ETFs). Net investment income (loss) of any mutual funds or ETFs is not included in the Fund's net investment income (loss) ratio.
CAmount represents less than $.0005 per share.
DTotal returns would have been lower if certain expenses had not been reduced during the applicable periods shown.
EFees and expenses of any underlying mutual funds or exchange-traded funds (ETFs) are not included in the Fund's expense ratio. The Fund indirectly bears its proportionate share of these expenses. For additional expense information related to investments in Fidelity Central Funds, please refer to the "Investments in Fidelity Central Funds" note found in the Notes to Financial Statements section of the most recent Annual or Semi-Annual report.
FExpense ratios reflect operating expenses of the class. Expenses before reductions do not reflect amounts reimbursed, waived, or reduced through arrangements with the investment adviser, brokerage services, or other offset arrangements, if applicable, and do not represent the amount paid by the class during periods when reimbursements, waivers or reductions occur.
For the period ended February 29, 2024
(Amounts in thousands except percentages)
1. Organization.
Fidelity California Municipal Money Market Fund (the Fund) is a fund of Fidelity California Municipal Trust II (the Trust) and is authorized to issue an unlimited number of shares. The Trust is registered under the Investment Company Act of 1940, as amended (the 1940 Act), as an open-end management investment company organized as a Delaware statutory trust. The Fund offers Fidelity California Municipal Money Market Fund, Institutional Class and Premium Class shares, each of which has equal rights as to assets and voting privileges. Each class has exclusive voting rights with respect to matters that affect that class. Shares of the Fund are only available for purchase by retail shareholders. The Fund may be affected by economic and political developments in the state of California.
2. Investments in Fidelity Central Funds.
Funds may invest in Fidelity Central Funds, which are open-end investment companies generally available only to other investment companies and accounts managed by the investment adviser and its affiliates. The Schedule of Investments lists any Fidelity Central Funds held as an investment as of period end, but does not include the underlying holdings of each Fidelity Central Fund. An investing fund indirectly bears its proportionate share of the expenses of the underlying Fidelity Central Funds.
Based on its investment objective, each Fidelity Central Fund may invest or participate in various investment vehicles or strategies that are similar to those of the investing fund. These strategies are consistent with the investment objectives of the investing fund and may involve certain economic risks which may cause a decline in value of each of the Fidelity Central Funds and thus a decline in the value of the investing fund.
| Fidelity Central Fund | Investment Manager | Investment Objective | Investment Practices | Expense RatioA |
| Fidelity Money Market Central Funds | Fidelity Management & Research Company LLC (FMR) | Each fund seeks to obtain a high level of current income consistent with the preservation of capital and liquidity. | Short-term Investments | Less than .005% |
A Expenses expressed as a percentage of average net assets and are as of each underlying Central Fund's most recent annual or semi-annual shareholder report.
A complete unaudited list of holdings for each Fidelity Central Fund is available upon request or at the Securities and Exchange Commission website at www.sec.gov. In addition, the financial statements of the Fidelity Central Funds which contain the significant accounting policies (including investment valuation policies) of those funds, and are not covered by the Report of Independent Registered Public Accounting Firm, are available on the Securities and Exchange Commission website or upon request.
3. Significant Accounting Policies.
The Fund is an investment company and applies the accounting and reporting guidance of the Financial Accounting Standards Board (FASB) Accounting Standards Codification Topic 946 Financial Services - Investment Companies. The financial statements have been prepared in conformity with accounting principles generally accepted in the United States of America (GAAP), which require management to make certain estimates and assumptions at the date of the financial statements. Actual results could differ from those estimates. Subsequent events, if any, through the date that the financial statements were issued have been evaluated in the preparation of the financial statements. The Fund's Schedule of Investments lists any underlying mutual funds or exchange-traded funds (ETFs) but does not include the underlying holdings of these funds. The following summarizes the significant accounting policies of the Fund:
Investment Valuation. The Fund categorizes the inputs to valuation techniques used to value its investments into a disclosure hierarchy consisting of three levels as shown below:
Level 1 - unadjusted quoted prices in active markets for identical investments
Level 2 - other significant observable inputs (including quoted prices for similar investments, interest rates, prepayment speeds, etc.)
Level 3 - unobservable inputs (including the Fund's own assumptions based on the best information available)
As permitted by compliance with certain conditions under Rule 2a-7 of the 1940 Act, securities are valued at amortized cost, which approximates fair value. The amortized cost of an instrument is determined by valuing it at its original cost and thereafter amortizing any discount or premium from its face value at a constant rate until maturity. Securities held by a money market fund are generally high quality and liquid; however, they are reflected as Level 2 because the inputs used to determine fair value are not quoted prices in an active market.
Investments in the Fidelity Central Funds are valued at their closing net asset value (NAV) each business day and are categorized as Level 1 in the hierarchy.
Investment Transactions and Income. The net asset value per share for processing shareholder transactions is calculated as of the close of business of the New York Stock Exchange (NYSE), normally 4:00 p.m. Eastern time. Security transactions, including the Fund's investment activity in the Fidelity Central Funds, are accounted for as of trade date. Gains and losses on securities sold are determined on the basis of identified cost. Income and capital gain distributions from Fidelity Central Funds, if any, are recorded on the ex-dividend date. Interest income is accrued as earned and includes coupon interest and amortization of premium and accretion of discount on debt securities as applicable.
Class Allocations and Expenses. Investment income, realized and unrealized capital gains and losses, common expenses of a fund, and certain fund-level expense reductions, if any, are allocated daily on a pro-rata basis to each class based on the relative net assets of each class to the total net assets of a fund. Each class differs with respect to transfer agent and distribution and service plan fees incurred, as applicable. Certain expense reductions may also differ by class, if applicable. For the reporting period, the allocated portion of income and expenses to each class as a percent of its average net assets may vary due to the timing of recording these transactions in relation to fluctuating net assets of the classes. Expenses directly attributable to a fund are charged to that fund. Expenses attributable to more than one fund are allocated among the respective funds on the basis of relative net assets or other appropriate methods. Expenses included in the accompanying financial statements reflect the expenses of that fund and do not include any expenses associated with any underlying mutual funds or exchange-traded funds (ETFs). Although not included in a fund's expenses, a fund indirectly bears its proportionate share of these expenses through the net asset value of each underlying mutual fund or exchange-traded fund (ETF). Expense estimates are accrued in the period to which they relate and adjustments are made when actual amounts are known.
Income Tax Information and Distributions to Shareholders. Each year, the Fund intends to qualify as a regulated investment company under Subchapter M of the Internal Revenue Code, including distributing substantially all of its taxable income and realized gains. As a result, no provision for U.S. Federal income taxes is required. During the period, the Fund incurred a corporate tax liability on undistributed long-term capital gain which is included in Miscellaneous expense on the Statement of Operations. As of February 29, 2024, the Fund did not have any unrecognized tax benefits in the financial statements; nor is the Fund aware of any tax positions for which it is reasonably possible that the total amounts of unrecognized tax benefits will significantly change in the next twelve months. The Fund files a U.S. federal tax return, in addition to state and local tax returns as required. The Fund's federal income tax returns are subject to examination by the Internal Revenue Service (IRS) for a period of three fiscal years after they are filed. State and local tax returns may be subject to examination for an additional fiscal year depending on the jurisdiction.
Distributions are declared and recorded daily and paid monthly from net investment income. Distributions from realized gains, if any, are declared and recorded on the ex-dividend date. Income and capital gain distributions are declared separately for each class. Income and capital gain distributions are determined in accordance with income tax regulations, which may differ from GAAP.
Capital accounts within the financial statements are adjusted for permanent book-tax differences. These adjustments have no impact on net assets or the results of operations. Capital accounts are not adjusted for temporary book-tax differences which will reverse in a subsequent period.
Book-tax differences are primarily due to market discount, capital loss carryforwards and losses deferred due to wash sales.
The Fund purchases municipal securities whose interest, in the opinion of the issuer, is free from federal income tax. There is no assurance that the IRS will agree with this opinion. In the event the IRS determines that the issuer does not comply with relevant tax requirements, interest payments from a security could become federally taxable, possibly retroactively to the date the security was issued.
As of period end, the cost and unrealized appreciation (depreciation) in securities for federal income tax purposes were as follows:
| Gross unrealized appreciation | $- |
| Gross unrealized depreciation | - |
| Net unrealized appreciation (depreciation) | $- |
| Tax Cost | $4,163,215 |
The tax-based components of distributable earnings as of period end were as follows:
| Undistributed tax-exempt income | $198 |
| Undistributed ordinary income | $- |
| Capital loss carryforward | $(24) |
| Net unrealized appreciation (depreciation) on securities and other investments | $- |
Capital loss carryforwards are only available to offset future capital gains of the Fund to the extent provided by regulations and may be limited. The capital loss carryforward information presented below, including any applicable limitation, is estimated as of fiscal period end and is subject to adjustment.
The tax character of distributions paid was as follows:
| | February 29, 2024 | February 28, 2023 |
| Tax-exempt Income | $120,738 | $48,230 |
| Ordinary Income | - | 41 |
| Long-term Capital Gains | - | - |
| Total | $120,738 | $48,271 |
Restricted Securities (including Private Placements). Funds may invest in securities that are subject to legal or contractual restrictions on resale. These securities generally may be resold in transactions exempt from registration or to the public if the securities are registered. Disposal of these securities may involve time-consuming negotiations and expense, and prompt sale at an acceptable price may be difficult. Information regarding restricted securities held at period end is included at the end of the Schedule of Investments, if applicable.
4. Fees and Other Transactions with Affiliates.
Management Fee and Expense Contract. Fidelity Management & Research Company LLC (the investment adviser) and its affiliates provide the Fund with investment management related services for which the Fund pays a monthly management fee that is based on an annual rate of .20% of the Fund's average net assets. Under the management contract, the investment adviser pays all other fund-level expenses, except the compensation of the independent Trustees and certain other expenses such as interest expense. The management fee is reduced by an amount equal to the fees and expenses paid by the Fund to the independent Trustees.
In addition, under the expense contract, the investment adviser pays class-level expenses for Premium Class so that the total expenses do not exceed .35%, expressed as a percentage of class average net assets, with certain exceptions such as interest expense.
Transfer Agent Fees. Fidelity Investments Institutional Operations Company LLC (FIIOC), an affiliate of the investment adviser, is the transfer, dividend disbursing and shareholder servicing agent for the Fund. FIIOC receives asset-based fees with respect to each account. FIIOC pays for typesetting, printing and mailing of shareholder reports, except proxy statements. For the period, transfer agent fees for each class were as follows:
| | Amount | % of Class-Level Average Net Assets |
| Fidelity California Municipal Money Market Fund | $47 | .22 |
| Institutional Class | 1,330 | .05 |
| Premium Class | 1,611 | .10 |
| | $2,988 | |
Interfund Trades. Funds may purchase from or sell securities to other Fidelity Funds under procedures adopted by the Board. The procedures have been designed to ensure these interfund trades are executed in accordance with Rule 17a-7 of the 1940 Act. Interfund trades during the period are noted in the table below.
| | Purchases ($) | Sales ($) | Realized Gain (Loss) ($) |
| Fidelity California Municipal Money Market Fund | 104,771 | 124,295 | - |
Subsequent Event - Sub-Advisory Arrangements. Effective March 1, 2024, the Fund's sub-advisory agreements with FMR Investment Management (UK) Limited, Fidelity Management & Research (Hong Kong) Limited, and Fidelity Management & Research (Japan) Limited will be amended to provide that the investment adviser will pay each sub-adviser monthly fees equal to 110% of the sub-adviser's costs for providing sub-advisory services.
5. Expense Reductions.
The investment adviser contractually agreed to reimburse Institutional Class to the extent annual operating expenses, expressed as a percentage of average net assets, exceed .20%. Some expenses, for example the compensation of the independent Trustees, and certain other expenses such as interest expense, are excluded from this reimbursement. During the period, this reimbursement reduced Institutional Class expenses by $1,331.
Through arrangements with the Fund's custodian, credits realized as a result of certain uninvested cash balances were used to reduce the Fund's expenses. During the period, custodian credits reduced the Fund's expenses by $11.
6. Distributions to Shareholders.
Distributions to shareholders of each class were as follows:
| | Year ended February 29, 2024 | Year ended February 28, 2023A |
| Fidelity California Municipal Money Market Fund | | |
| Distributions to shareholders | | |
| Fidelity California Municipal Money Market Fund | $559 | $62 |
| Institutional Class | 75,855 | 31,130 |
| Premium Class | 44,324 | 17,079 |
| Total | $120,738 | $48,271 |
A Distributions for Fidelity California Municipal Money Market Fund are for the period September 22, 2022 (commencement of sale of shares) through February 28, 2023.
7. Share Transactions.
Share transactions for each class of shares at a $1.00 per share were as follows and may contain in-kind transactions, automatic conversions between classes or exchanges between affiliated funds:
| | Shares | Shares | Dollars | Dollars |
| | Year ended February 29, 2024 | Year ended February 28, 2023A | Year ended February 29, 2024 | Year ended February 28, 2023A |
| Fidelity California Municipal Money Market Fund | | | | |
| Fidelity California Municipal Money Market Fund | | | | |
| Shares sold | 48,897 | 16,838 | $48,897 | $16,838 |
| Reinvestment of distributions | 471 | 55 | 471 | 55 |
| Shares redeemed | (35,957) | (5,477) | (35,957) | (5,477) |
| Net increase (decrease) | 13,411 | 11,416 | $13,411 | $11,416 |
| Institutional Class | | | | |
| Shares sold | 4,143,961 | 4,488,896 | $4,143,960 | $4,488,896 |
| Reinvestment of distributions | 66,428 | 27,550 | 66,428 | 27,550 |
| Shares redeemed | (3,881,096) | (3,700,040) | (3,881,096) | (3,700,040) |
| Net increase (decrease) | 329,293 | 816,406 | $329,292 | $816,406 |
| Premium Class | | | | |
| Shares sold | 1,018,144 | 701,589 | $1,018,144 | $701,580 |
| Issued in exchange for the shares of the Target Fund(s) | - | 1,125,928 | - | 1,127,846 |
| Reinvestment of distributions | 40,095 | 16,177 | 40,095 | 16,177 |
| Shares redeemed | (1,134,591) | (664,878) | (1,134,591) | (664,878) |
| Net increase (decrease) | (76,352) | 1,178,816 | $(76,352) | $1,180,725 |
| Service Class | | | | |
| Shares sold | - | 6 | $- | $6 |
| Shares redeemed | - | (28) | - | (28) |
| Net increase (decrease) | - | (22) | $- | $(22) |
A Share transactions for Fidelity California Municipal Money Market Fund are for the period September 22, 2022 (commencement of sale of shares) through February 28, 2023.
8. Other.
A fund's organizational documents provide former and current trustees and officers with a limited indemnification against liabilities arising in connection with the performance of their duties to the fund. In the normal course of business, a fund may also enter into contracts that provide general indemnifications. A fund's maximum exposure under these arrangements is unknown as this would be dependent on future claims that may be made against a fund. The risk of material loss from such claims is considered remote.
9. Prior Fiscal Year Merger Information.
On September 16, 2022, Fidelity California Municipal Money Market Fund (formerly Fidelity California AMT Tax-Free Money Market Fund) acquired all of the assets and assumed all of the liabilities of Fidelity California Municipal Money Market Fund ("Target Fund") pursuant to an Agreement and Plan of Reorganization ("Agreements") approved by the Board of Trustees ("The Board"). The securities held by the Target Fund were the primary assets acquired by Fidelity California Municipal Money Market Fund. The acquisition was accomplished by an exchange of Premium Class (formerly Fidelity California AMT Tax-Free Money Market Fund) of Fidelity California Municipal Money Market Fund for shares outstanding of the Target Fund at its respective net asset value on the acquisition date. The reorganization provides shareholders of the Target Fund access to a larger portfolio with a similar investment objective and lower projected expenses. For financial reporting purposes, the assets and liabilities of the Target Fund and shares issued by Fidelity California Municipal Money Market Fund were recorded at fair value; however, the cost basis of the investments received from the Target Fund were carried forward and will be utilized for purposes of Fidelity California Municipal Money Market Fund ongoing reporting of realized and unrealized gains and losses to more closely align subsequent reporting of realized gains with amounts distributable to shareholders for tax purposes. The reorganization qualified as a tax-free reorganization for federal income tax purposes with no gain or loss recognized to the funds or their shareholders.
Target Fund | Investments ($) | Unrealized appreciation (depreciation) ($) | Net Assets ($) | Shares Exchanged | Shares Exchanged Ratio |
Fidelity California Municipal Money Market Fund | 1,117,559 | - | 1,127,846 | 1,125,928 | 1.0000 |
Surviving Fund | Net Assets ($) | Total net assets after the acquisition ($) |
Fidelity California Municipal Money Market Fund (formerly Fidelity California AMT Tax-Free Money Market Fund) | 2,657,669 | 3,785,515 |
Pro forma results of operations of the combined entity for the entire period ended February 28, 2023, as though the acquisition had occurred as of the beginning of the year (rather than on the actual acquisition date), are as follows:
Net investment income (loss) | $52,145 |
Total net realized gain (loss) | 140 |
Total change in net unrealized appreciation (depreciation) | - |
Net increase (decrease) in net assets resulting from operations | $52,285 |
Because the combined investment portfolios have been managed as a single portfolio since the acquisition was completed, it is not practicable to separate the amounts of revenue and earnings of the acquired fund that have been included in the Fund's Statement of Operations since September 16, 2022.
10. Risk and Uncertainties.
Many factors affect a fund's performance. Developments that disrupt global economies and financial markets, such as pandemics, epidemics, outbreaks of infectious diseases, war, terrorism, and environmental disasters, may significantly affect a fund's investment performance. The effects of these developments to a fund will be impacted by the types of securities in which a fund invests, the financial condition, industry, economic sector, and geographic location of an issuer, and a fund's level of investment in the securities of that issuer. Significant concentrations in security types, issuers, industries, sectors, and geographic locations may magnify the factors that affect a fund's performance.
To the Board of Trustees of Fidelity California Municipal Trust II and Shareholders of Fidelity California Municipal Money Market Fund
Opinion on the Financial Statements
We have audited the accompanying statement of assets and liabilities, including the schedule of investments, of Fidelity California Municipal Money Market Fund ("Fund") as of February 29, 2024, the related statement of operations for the year ended February 29, 2024, the statement of changes in net assets for each of the two years in the period ended February 29, 2024, including the related notes, and the financial highlights for each of the periods indicated therein (collectively referred to as the "financial statements"). In our opinion, the financial statements present fairly, in all material respects, the financial position of the Fund as of February 29, 2024, the results of its operations for the year then ended, the changes in its net assets for each of the two years in the period ended February 29, 2024 and the financial highlights for each of the periods indicated therein in conformity with accounting principles generally accepted in the United States of America.
Basis for Opinion
These financial statements are the responsibility of the Fund's management. Our responsibility is to express an opinion on the Fund's financial statements based on our audits. We are a public accounting firm registered with the Public Company Accounting Oversight Board (United States) (PCAOB) and are required to be independent with respect to the Fund in accordance with the U.S. federal securities laws and the applicable rules and regulations of the Securities and Exchange Commission and the PCAOB.
We conducted our audits of these financial statements in accordance with the standards of the PCAOB. Those standards require that we plan and perform the audit to obtain reasonable assurance about whether the financial statements are free of material misstatement, whether due to error or fraud.
Our audits included performing procedures to assess the risks of material misstatement of the financial statements, whether due to error or fraud, and performing procedures that respond to those risks. Such procedures included examining, on a test basis, evidence regarding the amounts and disclosures in the financial statements. Our audits also included evaluating the accounting principles used and significant estimates made by management, as well as evaluating the overall presentation of the financial statements. Our procedures included confirmation of securities owned as of February 29, 2024 by correspondence with the custodian and brokers; when replies were not received from brokers, we performed other auditing procedures. We believe that our audits provide a reasonable basis for our opinion.
/s/ PricewaterhouseCoopers LLP
Boston, Massachusetts
April 10, 2024
We have served as the auditor of one or more investment companies in the Fidelity group of funds since 1932.
The Trustees, Members of the Advisory Board (if any), and officers of the trust and fund, as applicable, are listed below. The Board of Trustees governs the fund and is responsible for protecting the interests of shareholders. The Trustees are experienced executives who meet periodically throughout the year to oversee the fund's activities, review contractual arrangements with companies that provide services to the fund, oversee management of the risks associated with such activities and contractual arrangements, and review the fund's performance. Each of the Trustees oversees 315 funds.
The Trustees hold office without limit in time except that (a) any Trustee may resign; (b) any Trustee may be removed by written instrument, signed by at least two-thirds of the number of Trustees prior to such removal; (c) any Trustee who requests to be retired or who has become incapacitated by illness or injury may be retired by written instrument signed by a majority of the other Trustees; and (d) any Trustee may be removed at any special meeting of shareholders by a two-thirds vote of the outstanding voting securities of the trust. Each Trustee who is not an interested person (as defined in the 1940 Act) of the trust and the fund is referred to herein as an Independent Trustee. Each Independent Trustee shall retire not later than the last day of the calendar year in which his or her 75th birthday occurs. The Independent Trustees may waive this mandatory retirement age policy with respect to individual Trustees. Officers and Advisory Board Members hold office without limit in time, except that any officer or Advisory Board Member may resign or may be removed by a vote of a majority of the Trustees at any regular meeting or any special meeting of the Trustees. Except as indicated, each individual has held the office shown or other offices in the same company for the past five years.
The fund's Statement of Additional Information (SAI) includes more information about the Trustees. To request a free copy, call Fidelity at 1-800-544-8544 if you're a plan sponsor or participant with Fidelity as your recordkeeper or call 1-877-208-0098 on institutional accounts or if you're an advisor or invest through one.
Experience, Skills, Attributes, and Qualifications of the Trustees. The Governance and Nominating Committee has adopted a statement of policy that describes the experience, qualifications, attributes, and skills that are necessary and desirable for potential Independent Trustee candidates (Statement of Policy). The Board believes that each Trustee satisfied at the time he or she was initially elected or appointed a Trustee, and continues to satisfy, the standards contemplated by the Statement of Policy. The Governance and Nominating Committee also engages professional search firms to help identify potential Independent Trustee candidates who have the experience, qualifications, attributes, and skills consistent with the Statement of Policy. From time to time, additional criteria based on the composition and skills of the current Independent Trustees, as well as experience or skills that may be appropriate in light of future changes to board composition, business conditions, and regulatory or other developments, have also been considered by the professional search firms and the Governance and Nominating Committee. In addition, the Board takes into account the Trustees' commitment and participation in Board and committee meetings, as well as their leadership of standing and ad hoc committees throughout their tenure.
In determining that a particular Trustee was and continues to be qualified to serve as a Trustee, the Board has considered a variety of criteria, none of which, in isolation, was controlling. The Board believes that, collectively, the Trustees have balanced and diverse experience, qualifications, attributes, and skills, which allow the Board to operate effectively in governing the fund and protecting the interests of shareholders. Information about the specific experience, skills, attributes, and qualifications of each Trustee, which in each case led to the Board's conclusion that the Trustee should serve (or continue to serve) as a trustee of the fund, is provided below.
Board Structure and Oversight Function. Abigail P. Johnson is an interested person and currently serves as Chairman. The Trustees have determined that an interested Chairman is appropriate and benefits shareholders because an interested Chairman has a personal and professional stake in the quality and continuity of services provided to the fund. Independent Trustees exercise their informed business judgment to appoint an individual of their choosing to serve as Chairman, regardless of whether the Trustee happens to be independent or a member of management. The Independent Trustees have determined that they can act independently and effectively without having an Independent Trustee serve as Chairman and that a key structural component for assuring that they are in a position to do so is for the Independent Trustees to constitute a substantial majority for the Board. The Independent Trustees also regularly meet in executive session. Michael E. Kenneally serves as Chairman of the Independent Trustees and as such (i) acts as a liaison between the Independent Trustees and management with respect to matters important to the Independent Trustees and (ii) with management prepares agendas for Board meetings.
Fidelity® funds are overseen by different Boards of Trustees. The fund's Board oversees Fidelity's investment-grade bond, money market, asset allocation and certain equity funds, and other Boards oversee Fidelity's alternative investment, high income and other equity funds. The asset allocation funds may invest in Fidelity® funds that are overseen by such other Boards. The use of separate Boards, each with its own committee structure, allows the Trustees of each group of Fidelity® funds to focus on the unique issues of the funds they oversee, including common research, investment, and operational issues. On occasion, the separate Boards establish joint committees to address issues of overlapping consequences for the Fidelity® funds overseen by each Board.
The Trustees operate using a system of committees to facilitate the timely and efficient consideration of all matters of importance to the Trustees, the fund, and fund shareholders and to facilitate compliance with legal and regulatory requirements and oversight of the fund's activities and associated risks. The Board, acting through its committees, has charged FMR and its affiliates with (i) identifying events or circumstances the occurrence of which could have demonstrably adverse effects on the fund's business and/or reputation; (ii) implementing processes and controls to lessen the possibility that such events or circumstances occur or to mitigate the effects of such events or circumstances if they do occur; and (iii) creating and maintaining a system designed to evaluate continuously business and market conditions in order to facilitate the identification and implementation processes described in (i) and (ii) above. Because the day-to-day operations and activities of the fund are carried out by or through FMR, its affiliates, and other service providers, the fund's exposure to risks is mitigated but not eliminated by the processes overseen by the Trustees. While each of the Board's committees has responsibility for overseeing different aspects of the fund's activities, oversight is exercised primarily through the Operations and Audit Committees. In addition, an ad hoc Board committee of Independent Trustees has worked with FMR to enhance the Board's oversight of investment and financial risks, legal and regulatory risks, technology risks, and operational risks, including the development of additional risk reporting to the Board. The Operations Committee also worked and continues to work with FMR to enhance the stress tests required under SEC regulations for money market funds. Appropriate personnel, including but not limited to the fund's Chief Compliance Officer (CCO), FMR's internal auditor, the independent accountants, the fund's Treasurer and portfolio management personnel, make periodic reports to the Board's committees, as appropriate, including an annual review of Fidelity's risk management program for the Fidelity® funds. The responsibilities of each standing committee, including their oversight responsibilities, are described further under "Standing Committees of the Trustees."
Interested Trustees*:
Correspondence intended for a Trustee who is an interested person may be sent to Fidelity Investments, 245 Summer Street, Boston, Massachusetts 02210.
Name, Year of Birth; Principal Occupations and Other Relevant Experience+
Abigail P. Johnson (1961)
Year of Election or Appointment: 2009
Trustee
Chairman of the Board of Trustees
Ms. Johnson also serves as Trustee of other Fidelity® funds. Ms. Johnson serves as Chairman (2016-present), Chief Executive Officer (2014-present), and Director (2007-present) of FMR LLC (diversified financial services company), President of Fidelity Financial Services (2012-present) and President of Personal, Workplace and Institutional Services (2005-present). Ms. Johnson is Chairman and Director of Fidelity Management & Research Company LLC (investment adviser firm, 2011-present). Previously, Ms. Johnson served as Chairman and Director of FMR Co., Inc. (investment adviser firm, 2011-2019), Vice Chairman (2007-2016) and President (2013-2016) of FMR LLC, President and a Director of Fidelity Management & Research Company (2001-2005), a Trustee of other investment companies advised by Fidelity Management & Research Company, Fidelity Investments Money Management, Inc. (investment adviser firm), and FMR Co., Inc. (2001-2005), Senior Vice President of the Fidelity® funds (2001-2005), and managed a number of Fidelity® funds.
Jennifer Toolin McAuliffe (1959)
Year of Election or Appointment: 2016
Trustee
Ms. McAuliffe also serves as Trustee of other Fidelity® funds and as Trustee of Fidelity Charitable (2020-present). Previously, Ms. McAuliffe served as Co-Head of Fixed Income of Fidelity Investments Limited (now known as FIL Limited (FIL)) (diversified financial services company), Director of Research for FIL's credit and quantitative teams in London, Hong Kong and Tokyo and Director of Research for taxable and municipal bonds at Fidelity Investments Money Management, Inc. Ms. McAuliffe previously served as a member of the Advisory Board of certain Fidelity® funds (2016). Ms. McAuliffe was previously a lawyer at Ropes & Gray LLP and an international banker at Chemical Bank NA (now JPMorgan Chase & Co.). Ms. McAuliffe also currently serves as director or trustee of several not-for-profit entities.
Christine J. Thompson (1958)
Year of Election or Appointment: 2023
Trustee
Ms. Thompson also serves as a Trustee of other Fidelity® funds. Ms. Thompson serves as Leader of Advanced Technologies for Investment Management at Fidelity Investments (2018-present). Previously, Ms. Thompson served as Chief Investment Officer in the Bond group at Fidelity Management & Research Company (2010-2018) and held various other roles including Director of municipal bond portfolio managers and Portfolio Manager of certain Fidelity® funds.
* Determined to be an "Interested Trustee" by virtue of, among other things, his or her affiliation with the trust or various entities under common control with FMR.
+ The information includes the Trustee's principal occupation during the last five years and other information relating to the experience, attributes, and skills relevant to the Trustee's qualifications to serve as a Trustee, which led to the conclusion that the Trustee should serve as a Trustee for the fund.
Independent Trustees:
Correspondence intended for an Independent Trustee may be sent to Fidelity Investments, P.O. Box 55235, Boston, Massachusetts 02205-5235.
Name, Year of Birth; Principal Occupations and Other Relevant Experience+
Elizabeth S. Acton (1951)
Year of Election or Appointment: 2013
Trustee
Ms. Acton also serves as Trustee of other Fidelity® funds. Prior to her retirement, Ms. Acton served as Executive Vice President, Finance (2011-2012), Executive Vice President, Chief Financial Officer (2002-2011) and Treasurer (2004-2005) of Comerica Incorporated (financial services). Prior to joining Comerica, Ms. Acton held a variety of positions at Ford Motor Company (1983-2002), including Vice President and Treasurer (2000-2002) and Executive Vice President and Chief Financial Officer of Ford Motor Credit Company (1998-2000). Ms. Acton currently serves as a member of the Board and Audit and Finance Committees of Beazer Homes USA, Inc. (homebuilding, 2012-present). Ms. Acton previously served as a member of the Advisory Board of certain Fidelity® funds (2013-2016).
Laura M. Bishop (1961)
Year of Election or Appointment: 2023
Trustee
Ms. Bishop also serves as Trustee or Member of the Advisory Board of other Fidelity® funds. Prior to her retirement, Ms. Bishop held a variety of positions at United Services Automobile Association (2001-2020), including Executive Vice President and Chief Financial Officer (2014-2020) and Senior Vice President and Deputy Chief Financial Officer (2012-2014). Ms. Bishop currently serves as a member of the Audit Committee and Compensation and Personnel Committee (2021-present) of the Board of Directors of Korn Ferry (global organizational consulting). Previously, Ms. Bishop served as a Member of the Advisory Board of certain Fidelity® funds (2022-2023).
Ann E. Dunwoody (1953)
Year of Election or Appointment: 2018
Trustee
General Dunwoody also serves as Trustee of other Fidelity® funds. General Dunwoody (United States Army, Retired) was the first woman in U.S. military history to achieve the rank of four-star general and prior to her retirement in 2012 held a variety of positions within the U.S. Army, including Commanding General, U.S. Army Material Command (2008-2012). General Dunwoody currently serves as a member of the Board, Chair of Nomination Committee and a member of the Corporate Governance Committee of Kforce Inc. (professional staffing services, 2016-present) and a member of the Board of Automattic Inc. (software engineering, 2018-present). Previously, General Dunwoody served as President of First to Four LLC (leadership and mentoring services, 2012-2022), a member of the Advisory Board and Nominating and Corporate Governance Committee of L3 Technologies, Inc. (communication, electronic, sensor and aerospace systems, 2013-2019) and a member of the Board and Audit and Sustainability and Corporate Responsibility Committees of Republic Services, Inc. (waste collection, disposal and recycling, 2013-2016). General Dunwoody also serves on several boards for non-profit organizations, including as a member of the Board, Chair of the Nomination and Governance Committee and a member of the Audit Committee of the Noble Reach Foundation (formerly Logistics Management Institute) (consulting non-profit, 2012-present) and a member of the Board of ThanksUSA (military family education non-profit, 2014-present). Previously, General Dunwoody served as a member of the Board of Florida Institute of Technology (2015-2022) and a member of the Council of Trustees for the Association of the United States Army (advocacy non-profit, 2013-2021). General Dunwoody previously served as a member of the Advisory Board of certain Fidelity® funds (2018).
Robert F. Gartland (1951)
Year of Election or Appointment: 2010
Trustee
Mr. Gartland also serves as Trustee of other Fidelity® funds. Prior to his retirement, Mr. Gartland held a variety of positions at Morgan Stanley (financial services, 1979-2007), including Managing Director (1987-2007) and Chase Manhattan Bank (1975-1978). Mr. Gartland previously served as Chairman and an investor in Gartland & Mellina Group Corp. (consulting, 2009-2019), as a member of the Board of National Securities Clearing Corporation (1993-1996) and as Chairman of TradeWeb (2003-2004).
Robert W. Helm (1957)
Year of Election or Appointment: 2023
Trustee
Mr. Helm also serves as Trustee or Member of the Advisory Board of other Fidelity® funds. Mr. Helm was formerly Deputy Chairman (2003-2020), partner (1991-2020) and an associate (1984-1991) of Dechert LLP (formerly Dechert Price & Rhoads). Mr. Helm currently serves on boards and committees of several not-for-profit organizations, including as a Trustee and member of the Executive Committee of the Baltimore Council on Foreign Affairs, a member of the Board of Directors of the St. Vincent de Paul Society of Baltimore and a member of the Life Guard Society of Mt. Vernon. Previously, Mr. Helm served as a Member of the Advisory Board of certain Fidelity® funds (2021-2023).
Michael E. Kenneally (1954)
Year of Election or Appointment: 2009
Trustee
Chairman of the Independent Trustees
Mr. Kenneally also serves as Trustee of other Fidelity® funds and was Vice Chairman (2018-2021) of the Independent Trustees of certain Fidelity® funds. Prior to retirement in 2005, he was Chairman and Global Chief Executive Officer of Credit Suisse Asset Management, the worldwide fund management and institutional investment business of Credit Suisse Group. Previously, Mr. Kenneally was an Executive Vice President and the Chief Investment Officer for Bank of America. In this role, he was responsible for the investment management, strategy and products delivered to the bank's institutional, high-net-worth and retail clients. Earlier, Mr. Kenneally directed the organization's equity and quantitative research groups. He began his career as a research analyst and then spent more than a dozen years as a portfolio manager for endowments, pension plans and mutual funds. He earned the Chartered Financial Analyst (CFA) designation in 1991.
Mark A. Murray (1954)
Year of Election or Appointment: 2016
Trustee
Mr. Murray also serves as Trustee of other Fidelity® funds. Previously, Mr. Murray served as Co-Chief Executive Officer (2013-2016), President (2006-2013) and Vice Chairman (2013-2020) of Meijer, Inc. Mr. Murray serves as a member of the Board (2009-present) and Public Policy and Responsibility Committee (2009-present) and Chair of the Nuclear Review Committee (2019-present) of DTE Energy Company (diversified energy company). Mr. Murray previously served as a member of the Board of Spectrum Health (not-for-profit health system, 2015-2019) and as a member of the Board and Audit Committee and Chairman of the Nominating and Corporate Governance Committee of Universal Forest Products, Inc. (manufacturer and distributor of wood and wood-alternative products, 2004-2016). Mr. Murray also serves as a member of the Board of many community and professional organizations. Mr. Murray previously served as a member of the Advisory Board of certain Fidelity® funds (2016).
Carol J. Zierhoffer (1960)
Year of Election or Appointment: 2023
Trustee
Ms. Zierhoffer also serves as Trustee or Member of the Advisory Board of other Fidelity® funds. Prior to her retirement, Ms. Zierhoffer held a variety of positions at Bechtel Corporation (engineering company, 2013-2019), including Principal Vice President and Chief Information Officer (2013-2016) and Senior Vice President and Chief Information Officer (2016-2019). Ms. Zierhoffer currently serves as a member of the Board of Directors, Audit Committee and Compensation Committee of Allscripts Healthcare Solutions, Inc. (healthcare technology, 2020-present) and as a member of the Board of Directors, Audit and Finance Committee and Nominating and Governance Committee of Atlas Air Worldwide Holdings, Inc. (aviation operating services, 2021-present). Previously, Ms. Zierhoffer served as a member of the Board of Directors and Audit Committee and as the founding Chair of the Information Technology Committee of MedAssets, Inc. (healthcare technology, 2013-2016), and as a Member of the Advisory Board of certain Fidelity® funds (2023).
+ The information includes the Trustee's principal occupation during the last five years and other information relating to the experience, attributes, and skills relevant to the Trustee's qualifications to serve as a Trustee, which led to the conclusion that the Trustee should serve as a Trustee for the fund.
Advisory Board Members and Officers:
Correspondence intended for a Member of the Advisory Board (if any) may be sent to Fidelity Investments, P.O. Box 55235, Boston, Massachusetts 02205-5235. Correspondence intended for an officer may be sent to Fidelity Investments, 245 Summer Street, Boston, Massachusetts 02210.
Name, Year of Birth; Principal Occupation
Lester Owens (1957)
Year of Election or Appointment: 2024
Member of the Advisory Board
Mr. Owens also serves as a Member of the Advisory Board of other Fidelity® funds. Prior to his retirement, Mr. Owens served as Senior Executive Vice President, Head of Operations, and member of the Operating Committee of Wells Fargo & Company (financial services, 2020-2023). Mr. Owens currently serves as Chairman of the Board of Directors of Robert Wood Johnson Barnabas Health, Inc. (academic healthcare system, 2022-present). Previously, Mr. Owens served as Senior Executive Vice President and Head of Operations at Bank of New York Mellon (financial services, 2019-2020) and held various roles at JPMorgan Chase & Co. (financial services, 2007-2019), including Managing Director for Wholesale Banking Operations. Mr. Owens also previously served as a member of the Board of Directors of the Depository Trust & Clearing Corporation (financial services, 2016) and as Chairman of the Board of Directors of the Clearing House Interbank Payments System (private clearing system, 2015-2016).
Heather Bonner (1977)
Year of Election or Appointment: 2023
Assistant Treasurer
Ms. Bonner also serves as an officer of other funds. Ms. Bonner is a Senior Vice President (2022-present) and is an employee of Fidelity Investments (2022-present). Ms. Bonner serves as Vice President or Treasurer of certain Fidelity entities. Prior to joining Fidelity, Ms. Bonner served as Managing Director at AQR Capital Management (2013-2022) and was the Treasurer and Principal Financial Officer of the AQR Funds (2013-2022).
Craig S. Brown (1977)
Year of Election or Appointment: 2019
Assistant Treasurer
Mr. Brown also serves as an officer of other funds. Mr. Brown is a Vice President (2015-present) and is an employee of Fidelity Investments. Mr. Brown serves as Assistant Treasurer of FIMM, LLC (2021-present). Previously, Mr. Brown served as Assistant Treasurer of certain Fidelity® funds (2019-2022).
John J. Burke III (1964)
Year of Election or Appointment: 2018
Chief Financial Officer
Mr. Burke also serves as Chief Financial Officer of other funds. Mr. Burke is Head of Fidelity Fund and Investment Operations (2018-present) and is an employee of Fidelity Investments. Mr. Burke serves as President, Executive Vice President, or Director of certain Fidelity entities. Previously Mr. Burke served as head of Asset Management Investment Operations (2012-2018).
Margaret Carey (1973)
Year of Election or Appointment: 2023
Secretary and Chief Legal Officer (CLO)
Ms. Carey also serves as an officer of other funds and as CLO of certain Fidelity entities. Ms. Carey is a Senior Vice President, Deputy General Counsel (2019-present) and is an employee of Fidelity Investments.
David J. Carter (1973)
Year of Election or Appointment: 2020
Assistant Secretary
Mr. Carter also serves as Assistant Secretary of other funds. Mr. Carter is a Senior Vice President, Deputy General Counsel (2022-present) and is an employee of Fidelity Investments. Mr. Carter serves as Chief Legal Officer of Fidelity Investments Institutional Operations Company LLC - Shareholder Division (transfer agent, 2020-present).
Jonathan Davis (1968)
Year of Election or Appointment: 2010
Assistant Treasurer
Mr. Davis also serves as an officer of other funds. Mr. Davis is a Vice President (2006-present) and is an employee of Fidelity Investments. Mr. Davis serves as Assistant Treasurer or Director of certain Fidelity entities.
Laura M. Del Prato (1964)
Year of Election or Appointment: 2018
President and Treasurer
Ms. Del Prato also serves as an officer of other funds. Ms. Del Prato is a Senior Vice President (2017-present) and is an employee of Fidelity Investments. Ms. Del Prato serves as Vice President or Assistant Treasurer of certain Fidelity entities. Previously, Ms. Del Prato served as President and Treasurer of The North Carolina Capital Management Trust: Cash Portfolio and Term Portfolio (2018-2020).
Robin Foley (1964)
Year of Election or Appointment: 2023
Vice President
Ms. Foley also serves as Vice President of other funds. Ms. Foley serves as Head of Fidelity's Fixed Income division (2023-present) and is an employee of Fidelity Investments. Previously, Ms. Foley served as Chief Investment Officer of Bonds (2017-2023).
Christopher M. Gouveia (1973)
Year of Election or Appointment: 2023
Chief Compliance Officer
Mr. Gouveia also serves as Chief Compliance Officer of other funds. Mr. Gouveia is a Senior Vice President of Asset Management Compliance (2019-present) and is an employee of Fidelity Investments. Mr. Gouveia serves as Compliance Officer of Fidelity Management Trust Company (2023-present). Previously, Mr. Gouveia served as Chief Compliance Officer of the North Carolina Capital Management Trust (2016-2019).
Colm A. Hogan (1973)
Year of Election or Appointment: 2016
Assistant Treasurer
Mr. Hogan also serves as an officer of other funds. Mr. Hogan is a Vice President (2016-present) and is an employee of Fidelity Investments. Mr. Hogan serves as Assistant Treasurer of certain Fidelity entities. Previously, Mr. Hogan served as Deputy Treasurer of certain Fidelity® funds (2016-2020) and Assistant Treasurer of certain Fidelity® funds (2016-2018).
Chris Maher (1972)
Year of Election or Appointment: 2013
Assistant Treasurer
Mr. Maher also serves as an officer of other funds. Mr. Maher is a Vice President (2008-present) and is an employee of Fidelity Investments. Mr. Maher serves as Assistant Treasurer of certain Fidelity entities. Previously, Mr. Maher served as Assistant Treasurer of certain funds (2013-2020).
Brett Segaloff (1972)
Year of Election or Appointment: 2021
Anti-Money Laundering (AML) Officer
Mr. Segaloff also serves as AML Officer of other funds. Mr. Segaloff is a Vice President (2022-present) and is an employee of Fidelity Investments. Mr. Segaloff serves as Anti Money Laundering Compliance Officer or Anti Money Laundering/Bank Secrecy Act Compliance Officer of certain Fidelity entities.
Stacie M. Smith (1974)
Year of Election or Appointment: 2013
Assistant Treasurer
Ms. Smith also serves as an officer of other funds. Ms. Smith is a Senior Vice President (2016-present) and is an employee of Fidelity Investments. Ms. Smith serves as Assistant Treasurer of certain Fidelity entities and has served in other fund officer roles.
Jim Wegmann (1979)
Year of Election or Appointment: 2021
Deputy Treasurer
Mr. Wegmann also serves as an officer of other funds. Mr. Wegmann is a Vice President (2016-present) and is an employee of Fidelity Investments. Mr. Wegmann serves as Assistant Treasurer of FIMM, LLC (2021-present). Previously, Mr. Wegmann served as Assistant Treasurer of certain Fidelity® funds (2019-2021).
As a shareholder, you incur two types of costs: (1) transaction costs, which may include sales charges (loads) on purchase payments or redemption proceeds, as applicable and (2) ongoing costs, which generally include management fees, distribution and/or service (12b-1) fees and other Fund expenses. This Example is intended to help you understand your ongoing costs (in dollars) of investing in a fund and to compare these costs with the ongoing costs of investing in other mutual funds.
| The Example is based on an investment of $1,000 invested at the beginning of the period and held for the entire period (September 1, 2023 to February 29, 2024). |
Actual Expenses
The first line of the accompanying table provides information about actual account values and actual expenses. You may use the information in this line, together with the amount you invested, to estimate the expenses that you paid over the period. Simply divide your account value by $1,000.00 (for example, an $8,600 account value divided by $1,000.00 = 8.6), then multiply the result by the number in the first line for a class/Fund under the heading entitled "Expenses Paid During Period" to estimate the expenses you paid on your account during this period. If any fund is a shareholder of any underlying mutual funds or exchange-traded funds (ETFs) (the Underlying Funds), such fund indirectly bears its proportional share of the expenses of the Underlying Funds in addition to the direct expenses incurred presented in the table. These fees and expenses are not included in the annualized expense ratio used to calculate the expense estimate in the table below.
Hypothetical Example for Comparison Purposes
The second line of the accompanying table provides information about hypothetical account values and hypothetical expenses based on the actual expense ratio and an assumed rate of return of 5% per year before expenses, which is not the actual return. The hypothetical account values and expenses may not be used to estimate the actual ending account balance or expenses you paid for the period. You may use this information to compare the ongoing costs of investing in the Fund and other funds. To do so, compare this 5% hypothetical example with the 5% hypothetical examples that appear in the shareholder reports of the other funds. If any fund is a shareholder of any Underlying Funds, such fund indirectly bears its proportional share of the expenses of the Underlying Funds in addition to the direct expenses as presented in the table. These fees and expenses are not included in the annualized expense ratio used to calculate the expense estimate in the table below.
Please note that the expenses shown in the table are meant to highlight your ongoing costs only and do not reflect any transaction costs. Therefore, the second line of the table is useful in comparing ongoing costs only, and will not help you determine the relative total costs of owning different funds. In addition, if these transactional costs were included, your costs would have been higher.
| | | | | Annualized Expense Ratio- A | | Beginning Account Value September 1, 2023 | | Ending Account Value February 29, 2024 | | Expenses Paid During Period- C September 1, 2023 to February 29, 2024 |
| Fidelity® California Municipal Money Market Fund | | | | | | | | | | |
| Fidelity® California Municipal Money Market Fund | | | | .42% | | | | | | |
| Actual | | | | | | $ 1,000 | | $ 1,013.40 | | $ 2.10 |
Hypothetical-B | | | | | | $ 1,000 | | $ 1,022.77 | | $ 2.11 |
| Institutional Class | | | | .20% | | | | | | |
| Actual | | | | | | $ 1,000 | | $ 1,014.50 | | $ 1.00 |
Hypothetical-B | | | | | | $ 1,000 | | $ 1,023.87 | | $ 1.01 |
| Premium Class | | | | .30% | | | | | | |
| Actual | | | | | | $ 1,000 | | $ 1,014.00 | | $ 1.50 |
Hypothetical-B | | | | | | $ 1,000 | | $ 1,023.37 | | $ 1.51 |
| |
A Annualized expense ratio reflects expenses net of applicable fee waivers.
B 5% return per year before expenses
C Expenses are equal to the annualized expense ratio, multiplied by the average account value over the period, multiplied by 182/ 366 (to reflect the one-half year period). The fees and expenses of any Underlying Funds are not included in each annualized expense ratio.
The dividend and capital gains distributions for the fund(s) are available on Fidelity.com or Institutional.Fidelity.com.
During fiscal year ended 2024, 100% of the fund's income dividends was free from federal income tax, and 20.77% of the fund's income dividends was subject to the federal alternative minimum tax.
The funds will notify shareholders in January 2025 of amounts for use in preparing 2024 income tax returns.
Board Approval of Investment Advisory Contracts and Management Fees
Fidelity California Municipal Money Market Fund
Each year, the Board of Trustees, including the Independent Trustees (together, the Board), considers the renewal of the fund's management contract with Fidelity Management & Research Company LLC (FMR) and the sub-advisory agreements (together, the Advisory Contracts) for the fund. FMR and the sub-advisers are referred to herein as the Investment Advisers. The Board, assisted by the advice of fund counsel and Independent Trustees' counsel, requests and considers a broad range of information relevant to the renewal of the Advisory Contracts throughout the year.
The Board meets regularly and, at each of its meetings, covers an extensive agenda of topics and materials and considers factors that are relevant to its annual consideration of the renewal of the fund's Advisory Contracts, including the services and support provided to the fund and its shareholders. The Board's Operations Committee, of which all the Independent Trustees are members, meets regularly throughout the year and requests, receives and considers, among other matters, information related to the annual consideration of the renewal of the fund's Advisory Contracts before making its recommendation to the Board. The Board also meets as needed to review matters specifically related to the Board's annual consideration of the renewal of the Advisory Contracts. Members of the Board may also meet from time to time with trustees of other Fidelity funds through joint ad hoc committees to discuss certain matters relevant to all of the Fidelity funds.
At its September 2023 meeting, the Board unanimously determined to renew the fund's Advisory Contracts. In reaching its determination, the Board considered all factors it believed relevant, including (i) the nature, extent, and quality of the services provided to the fund and its shareholders (including the investment performance of the fund); (ii) the competitiveness relative to peer funds of the fund's management fee and the total expense ratio of a representative class (Institutional Class, which was selected because it was the largest class); (iii) the total costs of the services provided by and the profits realized by FMR and its affiliates (Fidelity) from its relationships with the fund; and (iv) the extent to which, if any, economies of scale exist and are realized as the fund grows, and whether any economies of scale are appropriately shared with fund shareholders The Board also considered the broad range of investment choices available to shareholders from FMR's competitors and that the fund's shareholders have chosen to invest in the fund, which is part of the Fidelity family of funds. The Board's decision to renew the Advisory Contracts was not based on any single factor.
The Board reached a determination, with the assistance of fund counsel and Independent Trustees' counsel and through the exercise of its business judgment, that the renewal of the Advisory Contracts was in the best interests of the fund and its shareholders and that the compensation payable under the Advisory Contracts was fair and reasonable in light of all of the surrounding circumstances.
Nature, Extent, and Quality of Services Provided. The Board considered Fidelity's staffing as it relates to the fund, including the backgrounds and experience of investment personnel, and also considered the Investment Advisers' implementation of the fund's investment program. The Independent Trustees also had discussions with senior management of Fidelity's investment operations and investment groups. The Board considered the structure of the investment personnel compensation program and whether this structure provides appropriate incentives to act in the best interests of the fund. Additionally, the Board considered the portfolio managers' investments, if any, in the funds that they manage.
Resources Dedicated to Investment Management and Support Services. The Board reviewed the general qualifications and capabilities of Fidelity's investment staff, including its size, education, experience, and resources, as well as Fidelity's approach to recruiting, managing, training, and compensating investment personnel. The Board noted the resources devoted to Fidelity's global investment organization, and that Fidelity's analysts have extensive resources, tools and capabilities that allow them to conduct quantitative and fundamental analysis, as well as credit analysis of issuers, counterparties, and guarantors. Further, the Board considered that Fidelity's investment professionals have sufficient access to global information and data so as to provide competitive investment results over time, and that those professionals also have access to sophisticated tools that permit them to assess portfolio construction and risk and performance attribution characteristics continuously, as well as to transmit new information and research conclusions rapidly around the world. Additionally, in its deliberations, the Board considered Fidelity's trading, risk management, compliance, cybersecurity, and technology and operations capabilities and resources, which are integral parts of the investment management process.
Shareholder and Administrative Services. The Board considered (i) the nature, extent, quality, and cost of advisory, administrative, and shareholder services performed by Fidelity under the Advisory Contracts and under separate agreements covering transfer agency and pricing and bookkeeping services for the fund; (ii) the nature and extent of Fidelity's supervision of third party service providers, principally custodians, subcustodians, and pricing vendors; and (iii) the resources devoted by Fidelity to, and the record of compliance with, the fund's compliance policies and procedures.
The Board noted that the growth of fund assets over time across the complex allows Fidelity to reinvest in the development of services designed to enhance the value and convenience of the Fidelity funds as investment vehicles. These services include 24-hour access to account information and market information over the Internet and through telephone representatives, investor education materials and asset allocation tools. The Board also considered that it reviews customer service metrics such as telephone response times, continuity of services on the website and metrics addressing services at Fidelity Investor Centers.
Investment in a Large Fund Family. The Board considered the benefits to shareholders of investing in a fund that is part of a large family of funds offering a variety of investment disciplines and providing a large variety of fund investor services. The Board noted that Fidelity had taken, or had made recommendations to the Board that resulted in the Fidelity funds taking, a number of actions over the previous year that benefited particular funds and/or the Fidelity funds in general.
Investment Performance. The Board took into account discussions that occur with representatives of the Investment Advisers, and reports that it receives, at Board meetings throughout the year relating to fund investment performance. In this regard the Board noted that as part of regularly scheduled fund reviews and other reports to the Board on fund performance, the Board considered annualized return information for the fund for different time periods, measured against an appropriate peer group of funds with similar objectives (peer group). The Board also considered information about performance attribution. In its evaluation of fund investment performance at meetings throughout the year, the Board gave particular attention to information indicating underperformance of certain Fidelity funds over different time periods and discussed with the Investment Advisers the reasons for such underperformance.
In addition to reviewing absolute and relative fund performance, the Independent Trustees periodically consider the appropriateness of fund performance metrics in evaluating the results achieved. The Independent Trustees generally give greater weight to fund performance over longer time periods than over shorter time periods.
The Board recognizes that in interest rate environments where many competitors waive fees to maintain a minimum yield, relative money market fund performance on a net basis (after fees and expenses) may not be particularly meaningful due to miniscule performance differences among competitor funds. Depending on the circumstances, the Independent Trustees may be satisfied with a fund's performance notwithstanding that it lags its peer group for certain periods.
Based on its review, the Board concluded that the nature, extent, and quality of services provided to the fund under the Advisory Contracts should continue to benefit the shareholders of the fund.
Competitiveness of Management Fee and Total Expense Ratio. The Board was provided with information regarding industry trends in management fees and expenses. In its review of the fund's management fee and the total expense ratio of Institutional Class, the Board considered other "fund-level" expenses, such as pricing and bookkeeping fees and custodial, legal, and audit fees, paid by FMR under the fund's management contract. The Board also considered other "class-level" expenses, such as transfer agent fees and fund-paid 12b-1 fees. The Board noted that Fidelity may agree to waive fees or reimburse expenses from time to time, and the extent to which, if any, it has done so for the fund.
Comparisons of Management Fees and Total Expense Ratios. Among other things, the Board reviewed data for selected groups of competitive funds and classes (referred to as "mapped groups") that were compiled by Fidelity based on combining similar investment objective categories (as classified by Lipper) that have comparable investment mandates. The data reviewed by the Board included (i) gross management fee comparisons (before taking into account expense reimbursements or caps) relative to the total universe of funds within the mapped group; (ii) gross management fee comparisons relative to a subset of non-Fidelity funds in the mapped group that are similar in size and management fee structure to the fund (referred to as the "asset size peer group"); (iii) total expense comparisons of Institutional Class of the fund relative to funds and classes in the mapped group that have a similar sales load structure to Institutional Class of the fund (referred to as the "similar sales load structure group"); and (iv) total expense comparisons of Institutional Class of the fund relative to funds and classes in the similar sales load structure group that are similar in size and management fee structure to the fund (referred to as the "total expense asset size peer group"). The total expense asset size peer group comparison excludes performance adjustments and fund-paid 12b-1 fees to eliminate variability in fee structures.
The information provided to the Board indicated that the fund's management fee rate ranked equal to the competitive median of the mapped group for 2022 and equal to the competitive median of the asset size peer group for 2022. Further, the information provided to the Board indicated that the total expense ratio of Institutional Class of the fund ranked above the competitive median of the similar sales load structure group for 2022 and above the competitive median of the total expense asset size peer group for 2022.
[In the information provided to the Board, Fidelity noted that competitor comparisons for money market funds are challenging due, in part, to the frequent imposition of reimbursements and waivers on money market funds in recent years. The Board considered that Fidelity believes that excluding fee waivers and reimbursements provides a better total expense comparison until such waivers are less prevalent in competitor data. When fee waivers and reimbursements are excluded from competitor data, the total expense ratio for Institutional Class of the fund was below the competitive medians in 2022.
Other Contractual Arrangements. The Board further considered that current contractual arrangements for the fund oblige FMR to pay all "class-level" expenses of Premium of the fund to the extent necessary to limit total operating expenses, with certain exceptions, to 0.35%. These contractual arrangements may not be amended to increase the fees or expenses payable except by a vote of a majority of the Board and by a vote of a majority of the outstanding voting securities of the class. The Board further considered that FMR has contractually agreed to reimburse Institutional Class of the fund to the extent that total operating expenses, with certain exceptions, as a percentage of their respective average net assets, exceed 0.20% through at least April 29, 2024.
Fees Charged to Other Fidelity Clients. The Board also considered Fidelity fee structures and other information with respect to clients of Fidelity, such as other funds advised or subadvised by Fidelity, pension plan clients, and other institutional clients with similar mandates. The Board noted that a joint ad hoc committee created by it and the boards of other Fidelity funds periodically reviews and compares Fidelity's institutional investment advisory business with its business of providing services to the Fidelity funds and also noted the most recent findings of the committee. The Board noted that the committee's review included a consideration of the differences in services provided, fees charged, and costs incurred, as well as competition in the markets serving the different categories of clients.
Based on its review, the Board concluded that the fund's management fee is fair and reasonable in light of the services that the fund receives and the other factors considered. Further, based on its review of total expense ratios and fees charged to other Fidelity clients, the Board concluded that the total expense ratio of each class of the fund was reasonable in light of the services that the fund and its shareholders receive and the other factors considered.
Costs of the Services and Profitability. The Board considered the revenues earned and the expenses incurred by Fidelity in conducting the business of developing, marketing, distributing, managing, administering and servicing the fund and servicing the fund's shareholders. The Board also considered the level of Fidelity's profits in respect of all the Fidelity funds.
On an annual basis, Fidelity presents to the Board information about the profitability of its relationships with the fund. Fidelity calculates profitability information for each fund, as well as aggregate profitability information for groups of Fidelity funds and all Fidelity funds, using a series of detailed revenue and cost allocation methodologies which originate with the books and records of Fidelity on which Fidelity's audited financial statements are based. The Audit Committee of the Board reviews any significant changes from the prior year's methodologies and the full Board approves such changes.
A public accounting firm has been engaged annually by the Board as part of the Board's assessment of Fidelity's profitability analysis. The engagement includes the review and assessment of the methodologies used by Fidelity in determining the revenues and expenses attributable to Fidelity's fund business, and completion of agreed-upon procedures in respect of the mathematical accuracy of certain fund profitability information and its conformity to established allocation methodologies. After considering the reports issued under the engagement and information provided by Fidelity, the Board concluded that while other allocation methods may also be reasonable, Fidelity's profitability methodologies are reasonable in all material respects.
The Board also reviewed Fidelity's non-fund businesses and potential indirect benefits such businesses may have received as a result of their association with Fidelity's fund business (i.e., fall-out benefits) as well as cases where Fidelity's affiliates may benefit from the funds' business. The Board considered areas where potential indirect benefits to the Fidelity funds from their relationships with Fidelity may exist. The Board's consideration of these matters was informed by the findings of a joint ad hoc committee created by it and the boards of other Fidelity funds to evaluate potential fall-out benefits.
The Board considered the costs of the services provided by and the profits realized by Fidelity in connection with the operation of the fund and was satisfied that the profitability was not excessive.
Economies of Scale. The Board considered whether there have been economies of scale in respect of the management of the Fidelity funds, whether the Fidelity funds (including the fund) have appropriately benefited from any such economies of scale, and whether there is potential for realization of any further economies of scale. The Board considered the extent to which the fund will benefit from economies of scale as assets grow through increased services to the fund, through waivers or reimbursements, or through fee or expense ratio reductions. The Board recognized that, due to the fund's current contractual arrangements, the expense ratio of the retail class will not decline if the class's operating costs decrease as assets grow, or rise as assets decrease. The Board also noted that a committee created by it and the boards of other Fidelity funds periodically analyzes whether Fidelity attains economies of scale in respect of the management and servicing of the Fidelity funds, whether the Fidelity funds have appropriately benefited from such economies of scale, and whether there is potential for realization of any further economies of scale.
The Board concluded, taking into account the analysis of the committee, that economies of scale, if any, are being appropriately shared between fund shareholders and Fidelity.
Additional Information Requested by the Board. In order to develop fully the factual basis for consideration of the Fidelity funds' advisory contracts, the Board requested and received additional information on certain topics, including: (i) Fidelity's fund profitability methodology, profitability trends for certain funds, the allocation of various costs to different funds, and the impact of certain factors on fund profitability results; (ii) portfolio manager changes that have occurred during the past year and Fidelity's views regarding portfolio manager investment in the Fidelity funds that they manage; (iii) hiring, training, and retaining personnel; (iv) the arrangements with and compensation paid to certain fund sub-advisers and the treatment of such compensation within Fidelity's fund profitability methodology; (v) the terms of the funds' various management fee structures, including the basic group fee and the terms of Fidelity's voluntary expense limitation arrangements; (vi) Fidelity's transfer agent, pricing and bookkeeping fees, expense and service structures for different funds and classes relative to competitive trends and market conditions; (vii) the impact on fund profitability of recent industry trends, such as the growth in passively managed funds and the changes in flows for different types of funds; (viii) the types of management fee and total expense comparisons provided, and the challenges and limitations associated with such information; (ix) explanations regarding the relative total expense ratios and management fees of certain funds and classes, total expense and management fee competitive trends, and methodologies for total expense and management fee competitive comparisons; (x) information concerning expense limitations applicable to certain funds; and (xi) matters related to money market funds, exchange-traded funds, and target date funds.
Conclusion. Based on its evaluation of all of the conclusions noted above, and after considering all factors it believed relevant, the Board, including the Independent Trustees, concluded that the advisory and sub-advisory fee arrangements are fair and reasonable in light of all of the surrounding circumstances and that the fund's Advisory Contracts should be renewed through September 30, 2024.
Board Approval of Investment Advisory Contracts
Fidelity California Municipal Money Market Fund
At its January 2024 meeting, the Board of Trustees, including the Independent Trustees (together, the Board), approved amended and restated sub-advisory agreements (the Sub-Advisory Contracts) for the fund, including the fund's sub-advisory agreements with FMR Investment Management (UK) Limited (FMR UK), Fidelity Management & Research (Hong Kong) Limited (FMR H.K.), and Fidelity Management & Research (Japan) Limited (FMR Japan). The Sub-Advisory Contracts will be effective March 1, 2024. The Board will consider the annual renewal of the fund's Sub-Advisory Contracts in September 2024, following its review of additional materials provided by FMR.
The Board considered the Sub-Advisory Contracts, which changed the arrangements for fees paid by FMR to the sub-advisers under the agreements. The Board noted that the agreements with FMR UK, FMR H.K., and FMR Japan were amended to provide that FMR will compensate each sub-adviser at a fee equal to 110% of the sub-adviser's costs incurred in providing services under the agreement. The Board considered that, under the Sub-Advisory Contracts, FMR, and not the fund, will continue to pay the sub-advisory fees to each applicable sub-adviser, and that the management fee paid by the fund under the management contract with FMR will remain unchanged.
The Board considered that the approval of the fund's Sub-Advisory Contracts will not result in any changes in the investment process or strategies employed in the management of the fund's assets or the day-to-day management of the fund or the persons primarily responsible for such management. Further, the Board considered that the Sub-Advisory Contracts would not change the obligations and services of FMR and its affiliates on behalf of the fund, and, in particular, there would be no change in the nature and level of services provided to the fund by FMR and its affiliates.
In connection with its consideration of future renewals of the fund's advisory contracts, the Board will consider: (i) the nature, extent and quality of services provided to the funds, including shareholder and administrative services and investment performance; (ii) the competitiveness of the management fee and total expenses for the fund; (iii) the costs of the services and profitability, including the revenues earned and the expenses incurred in conducting the business of developing, marketing, distributing, managing, administering, and servicing the fund and its shareholders, to the extent applicable; and (iv) whether there have been economies of scale in respect of the Fidelity funds, whether the Fidelity funds (including the fund) have appropriately benefited from any such economies of scale, and whether there is the potential for realization of any further economies.
Based on its evaluation of all of the conclusions noted above, and after considering all factors it believed relevant, the Board concluded that the fund's management fee structure is fair and reasonable, and that the fund's Sub-Advisory Contracts should be approved.
| A special meeting of shareholders was held on October 18, 2023. The results of votes taken among shareholders on the proposal before them are reported below. Each vote reported represents one dollar of net asset value held on the record date for the meeting. |
| Proposal 1 |
| To elect a Board of Trustees. |
| | # of Votes | % of Votes |
| Abigail P. Johnson |
| Affirmative | 4,177,505,174.98 | 96.52 |
| Withheld | 150,748,072.41 | 3.48 |
| TOTAL | 4,328,253,247.39 | 100.00 |
| Jennifer Toolin McAuliffe |
| Affirmative | 4,185,749,506.28 | 96.71 |
| Withheld | 142,503,741.11 | 3.29 |
| TOTAL | 4,328,253,247.39 | 100.00 |
| Christine J. Thompson |
| Affirmative | 4,185,223,408.32 | 96.70 |
| Withheld | 143,029,839.07 | 3.30 |
| TOTAL | 4,328,253,247.39 | 100.00 |
| Elizabeth S. Acton |
| Affirmative | 4,186,809,676.51 | 96.73 |
| Withheld | 141,443,570.88 | 3.27 |
| TOTAL | 4,328,253,247.39 | 100.00 |
| Laura M. Bishop |
| Affirmative | 4,198,325,351.98 | 97.00 |
| Withheld | 129,927,895.41 | 3.00 |
| TOTAL | 4,328,253,247.39 | 100.00 |
| Ann E. Dunwoody |
| Affirmative | 4,196,016,145.04 | 96.94 |
| Withheld | 132,237,102.35 | 3.06 |
| TOTAL | 4,328,253,247.39 | 100.00 |
| John Engler |
| Affirmative | 4,185,984,137.26 | 96.71 |
| Withheld | 142,269,110.13 | 3.29 |
| TOTAL | 4,328,253,247.39 | 100.00 |
| Robert F. Gartland |
| Affirmative | 4,179,991,959.87 | 96.57 |
| Withheld | 148,261,287.52 | 3.43 |
| TOTAL | 4,328,253,247.39 | 100.00 |
| Robert W. Helm |
| Affirmative | 4,188,833,418.16 | 96.78 |
| Withheld | 139,419,829.23 | 3.22 |
| TOTAL | 4,328,253,247.39 | 100.00 |
| Arthur E. Johnson |
| Affirmative | 4,172,091,754.26 | 96.39 |
| Withheld | 156,161,493.13 | 3.61 |
| TOTAL | 4,328,253,247.39 | 100.00 |
| Michael E. Kenneally |
| Affirmative | 4,187,735,890.69 | 96.75 |
| Withheld | 140,517,356.70 | 3.25 |
| TOTAL | 4,328,253,247.39 | 100.00 |
| Mark A. Murray |
| Affirmative | 4,192,680,075.79 | 96.87 |
| Withheld | 135,573,171.60 | 3.13 |
| TOTAL | 4,328,253,247.39 | 100.00 |
| Carol J. Zierhoffer |
| Affirmative | 4,197,220,030.56 | 96.97 |
| Withheld | 131,033,216.83 | 3.03 |
| TOTAL | 4,328,253,247.39 | 100.00 |
| | | |
| Proposal 1 reflects trust wide proposal and voting results. |
1.855631.116
SCM-ANN-0424
Item 2.
Code of Ethics
As of the end of the period, February 29, 2024, Fidelity California Municipal Trust II (the trust) has adopted a code of ethics, as defined in Item 2 of Form N-CSR, that applies to its President and Treasurer and its Chief Financial Officer. A copy of the code of ethics is filed as an exhibit to this Form N-CSR.
Item 3.
Audit Committee Financial Expert
The Board of Trustees of the trust has determined that Elizabeth S. Acton is an audit committee financial expert, as defined in Item 3 of Form N-CSR. Ms. Acton is independent for purposes of Item 3 of Form N-CSR.
Item 4.
Principal Accountant Fees and Services
Fees and Services
The following table presents fees billed by PricewaterhouseCoopers LLP (“PwC”) in each of the last two fiscal years for services rendered to Fidelity California Municipal Money Market Fund (the “Funds”):
Services Billed by PwC
February 29, 2024 FeesA
| | | | |
| Audit Fees | Audit-Related Fees | Tax Fees | All Other Fees |
Fidelity California Municipal Money Market Fund | $43,800 | $3,000 | $2,100 | $1,200 |
| | | | |
| Audit Fees | Audit-Related Fees | Tax Fees | All Other Fees |
Fidelity California Municipal Money Market Fund | $39,600 | $2,800 | $2,100 | $1,200 |
A Amounts may reflect rounding.
The following table(s) present(s) fees billed by PwC that were required to be approved by the Audit Committee for services that relate directly to the operations and financial reporting of the Fund(s) and that are rendered on behalf of Fidelity Management & Research Company LLC ("FMR") and entities controlling, controlled by, or under
common control with FMR (not including any sub-adviser whose role is primarily portfolio management and is subcontracted with or overseen by another investment adviser) that provide ongoing services to the Fund(s) (“Fund Service Providers”):
Services Billed by PwC
| | |
| February 29, 2024A | February 28, 2023A |
Audit-Related Fees | $9,422,800 | $8,469,200 |
Tax Fees | $61,000 | $1,000 |
All Other Fees | $- | $- |
A Amounts may reflect rounding.
“Audit-Related Fees” represent fees billed for assurance and related services that are reasonably related to the performance of the fund audit or the review of the fund's financial statements and that are not reported under Audit Fees.
“Tax Fees” represent fees billed for tax compliance, tax advice or tax planning that relate directly to the operations and financial reporting of the fund.
“All Other Fees” represent fees billed for services provided to the fund or Fund Service Provider, a significant portion of which are assurance related, that relate directly to the operations and financial reporting of the fund, excluding those services that are reported under Audit Fees, Audit-Related Fees or Tax Fees.
Assurance services must be performed by an independent public accountant.
* * *
The aggregate non-audit fees billed by PwC for services rendered to the Fund(s), FMR (not including any sub-adviser whose role is primarily portfolio management and is subcontracted with or overseen by another investment adviser), and any Fund Service Provider for each of the last two fiscal years of the Fund(s) are as follows:
| | |
Billed By | February 29, 2024A | February 28, 2023A |
PwC | $15,034,800 | $14,170,100 |
A Amounts may reflect rounding.
The trust's Audit Committee has considered non-audit services that were not pre-approved that were provided by PwC to Fund Service Providers to be compatible with maintaining the independence of PwC in its(their) audit of the Fund(s), taking into
account representations from PwC, in accordance with Public Company Accounting Oversight Board rules, regarding its independence from the Fund(s) and its(their) related entities and FMR’s review of the appropriateness and permissibility under applicable law of such non-audit services prior to their provision to the Fund(s) Service Providers.
Audit Committee Pre-Approval Policies and Procedures
The trust’s Audit Committee must pre-approve all audit and non-audit services provided by a fund’s independent registered public accounting firm relating to the operations or financial reporting of the fund. Prior to the commencement of any audit or non-audit services to a fund, the Audit Committee reviews the services to determine whether they are appropriate and permissible under applicable law.
The Audit Committee has adopted policies and procedures to, among other purposes, provide a framework for the Committee’s consideration of non-audit services by the audit firms that audit the Fidelity funds. The policies and procedures require that any non-audit service provided by a fund audit firm to a Fidelity fund and any non-audit service provided by a fund auditor to a Fund Service Provider that relates directly to the operations and financial reporting of a Fidelity fund (“Covered Service”) are subject to approval by the Audit Committee before such service is provided.
All Covered Services must be approved in advance of provision of the service either: (i) by formal resolution of the Audit Committee, or (ii) by oral or written approval of the service by the Chair of the Audit Committee (or if the Chair is unavailable, such other member of the Audit Committee as may be designated by the Chair to act in the Chair’s absence). The approval contemplated by (ii) above is permitted where the Treasurer determines that action on such an engagement is necessary before the next meeting of the Audit Committee.
Non-audit services provided by a fund audit firm to a Fund Service Provider that do not relate directly to the operations and financial reporting of a Fidelity fund are reported to the Audit Committee periodically.
Non-Audit Services Approved Pursuant to Rule 2-01(c)(7)(i)(C) and (ii) of Regulation S-X (“De Minimis Exception”)
There were no non-audit services approved or required to be approved by the Audit Committee pursuant to the De Minimis Exception during the Fund’s(s’) last two fiscal years relating to services provided to (i) the Fund(s) or (ii) any Fund Service Provider that relate directly to the operations and financial reporting of the Fund(s).
The Registrant has not retained, for the preparation of the audit report on the financial statements included in the Form N-CSR, a registered public accounting firm that has a branch or office that is located in a foreign jurisdiction and that the Public Company Accounting Oversight Board (the “PCAOB”) has determined that the PCAOB is unable
to inspect or investigate completely because of a position taken by an authority in the foreign jurisdiction.
The Registrant is not a “foreign issuer,” as defined in 17 CFR 240.3b-4.
Item 5.
Audit Committee of Listed Registrants
Not applicable.
Item 6.
Investments
(a)
Not applicable.
(b)
Not applicable.
Item 7.
Disclosure of Proxy Voting Policies and Procedures for Closed-End Management Investment Companies
Not applicable.
Item 8.
Portfolio Managers of Closed-End Management Investment Companies
Not applicable.
Item 9.
Purchase of Equity Securities by Closed-End Management Investment Company and Affiliated Purchasers
Not applicable.
Item 10.
Submission of Matters to a Vote of Security Holders
There were no material changes to the procedures by which shareholders may recommend nominees to the trust’s Board of Trustees.
Item 11.
Controls and Procedures
(a)(i) The President and Treasurer and the Chief Financial Officer have concluded that the trust’s disclosure controls and procedures (as defined in Rule 30a-3(c) under the Investment Company Act) provide reasonable assurances that material information relating to the trust is made known to them by the appropriate persons, based on their evaluation of these controls and procedures as of a date within 90 days of the filing date of this report.
(a)(ii) There was no change in the trust’s internal control over financial reporting (as defined in Rule 30a-3(d) under the Investment Company Act) that occurred during the period covered by this report that has materially affected, or is reasonably likely to materially affect, the trust’s internal control over financial reporting.
Item 12.
Disclosure of Securities Lending Activities for Closed-End Management
Investment Companies
Not applicable.
Item 18.
Recovery of Erroneously Awarded Compensation
(a)
Not applicable.
(b)
Not applicable.
Item 19.
Exhibits
SIGNATURES
Pursuant to the requirements of the Securities Exchange Act of 1934 and the Investment Company Act of 1940, the registrant has duly caused this report to be signed on its behalf by the undersigned, thereunto duly authorized.
Fidelity California Municipal Trust II
| |
By: | /s/Laura M. Del Prato |
| Laura M. Del Prato |
| President and Treasurer (Principal Executive Officer) |
|
|
Date: | April 22, 2024 |
Pursuant to the requirements of the Securities Exchange Act of 1934 and the Investment Company Act of 1940, this report has been signed below by the following persons on behalf of the registrant and in the capacities and on the dates indicated.
| |
By: | /s/Laura M. Del Prato |
| Laura M. Del Prato |
| President and Treasurer (Principal Executive Officer) |
|
|
Date: | April 22, 2024 |
| |
By: | /s/John J. Burke III |
| John J. Burke III |
| Chief Financial Officer (Principal Financial Officer) |
|
|
Date: | April 22, 2024 |