UNITED STATES
SECURITIES AND EXCHANGE COMMISSION
Washington, D.C. 20549
FORM N-CSR
CERTIFIED SHAREHOLDER REPORT OF REGISTERED
MANAGEMENT INVESTMENT COMPANIES
Investment Company Act file number 811-6398
Fidelity New York Municipal Trust II
(Exact name of registrant as specified in charter)
82 Devonshire St., Boston, Massachusetts 02109
(Address of principal executive offices) (Zip code)
Eric D. Roiter, Secretary
82 Devonshire St.
Boston, Massachusetts 02109
(Name and address of agent for service)
Registrant's telephone number, including area code: 617-563-7000
Date of fiscal year end: | January 31 |
| |
Date of reporting period: | July 31, 2005 |
Item 1. Reports to Stockholders
Fidelity® New York AMT Tax-Free
Money Market Fund
(formerly known as Spartan® New York Municipal Money Market Fund)
and
Fidelity New York Municipal
Money Market Fund
Semiannual Report
July 31, 2005
(2_fidelity_logos) (Registered_Trademark)
Contents
To view a fund's proxy voting guidelines and proxy voting record for the 12-month period ended June 30, visit www.fidelity.com/proxyvotingresults or visit the Securities and Exchange Commission's (SEC) web site at www.sec.gov. You may also call 1-800-544-8544 to request a free copy of the proxy voting guidelines.
Standard & Poor's, S&P and S&P 500 are registered service marks of The McGraw-Hill Companies, Inc. and have been licensed for use by Fidelity Distributors Corporation.
Other third party marks appearing herein are the property of their respective owners.
All other marks appearing herein are registered or unregistered trademarks or service marks of FMR Corp. or an affiliated company.
This report and the financial statements contained herein are submitted for the general information of the shareholders of the funds. This report is not authorized for distribution to prospective investors in the funds unless preceded or accompanied by an effective prospectus.
A fund files its complete schedule of portfolio holdings with the SEC for the first and third quarters of each fiscal year on Form N-Q. Forms N-Q are available on the SEC's web site at http://www.sec.gov. A fund's Forms N-Q may be reviewed and copied at the SEC's Public Reference Room in Washington, DC. Information regarding the operation of the SEC's Public Reference Room may be obtained by calling 1-800-SEC-0330. For a complete list of a fund's portfolio holdings, view the most recent quarterly holdings report, semiannual report, or annual report on Fidelity's web site at http://www.fidelity.com/holdings.
NOT FDIC INSURED · MAY LOSE VALUE · NO BANK GUARANTEE
Neither the funds nor Fidelity Distributors Corporation is a bank.
Semiannual Report
Chairman's Message
(photo_of_Edward_C_Johnson_3d)
Dear Shareholder:
During the past year or so, much has been reported about the mutual fund industry, and much of it has been more critical than I believe is warranted. Allegations that some companies have been less than forthright with their shareholders have cast a shadow on the entire industry. I continue to find these reports disturbing, and assert that they do not create an accurate picture of the industry overall. Therefore, I would like to remind everyone where Fidelity stands on these issues. I will say two things specifically regarding allegations that some mutual fund companies were in violation of the Securities and Exchange Commission's forward pricing rules or were involved in so-called "market timing" activities.
First, Fidelity has no agreements that permit customers who buy fund shares after 4 p.m. to obtain the 4 p.m. price. This is not a new policy. This is not to say that someone could not deceive the company through fraudulent acts. However, we are extremely diligent in preventing fraud from occurring in this manner - and in every other. But I underscore again that Fidelity has no so-called "agreements" that sanction illegal practices.
Second, Fidelity continues to stand on record, as we have for years, in opposition to predatory short-term trading that adversely affects shareholders in a mutual fund. Back in the 1980s, we initiated a fee - which is returned to the fund and, therefore, to investors - to discourage this activity. Further, we took the lead several years ago in developing a Fair Value Pricing Policy to prevent market timing on foreign securities in our funds. I am confident we will find other ways to make it more difficult for predatory traders to operate. However, this will only be achieved through close cooperation among regulators, legislators and the industry.
Yes, there have been unfortunate instances of unethical and illegal activity within the mutual fund industry from time to time. That is true of any industry. When this occurs, confessed or convicted offenders should be dealt with appropriately. But we are still concerned about the risk of over-regulation and the quick application of simplistic solutions to intricate problems. Every system can be improved, and we support and applaud well thought out improvements by regulators, legislators and industry representatives that achieve the common goal of building and protecting the value of investors' holdings.
For nearly 60 years, Fidelity has worked very hard to improve its products and service to justify your trust. When our family founded this company in 1946, we had only a few hundred customers. Today, we serve more than 18 million customers including individual investors and participants in retirement plans across America.
Let me close by saying that we do not take your trust in us for granted, and we realize that we must always work to improve all aspects of our service to you. In turn, we urge you to continue your active participation with your financial matters, so that your interests can be well served.
Best regards,
/s/Edward C. Johnson 3d
Edward C. Johnson 3d
Semiannual Report
Shareholder Expense Example
As a shareholder of a Fund, you incur two types of costs: (1) transaction costs, and (2) ongoing costs, including management fees and other Fund expenses. This Example is intended to help you understand your ongoing costs (in dollars) of investing in the Funds and to compare these costs with the ongoing costs of investing in other mutual funds.
The Example is based on an investment of $1,000 invested at the beginning of the period and held for the entire period (February 1, 2005 to July 31, 2005).
Actual Expenses
The first line of the table below for each fund provides information about actual account values and actual expenses. You may use the information in this line, together with the amount you invested, to estimate the expenses that you paid over the period. Simply divide your account value by $1,000.00 (for example, an $8,600 account value divided by $1,000.00 = 8.6), then multiply the result by the number in the first line for a fund under the heading entitled "Expenses Paid During Period" to estimate the expenses you paid on your account during this period. A small balance maintenance fee of $12.00 that is charged once a year may apply for certain accounts with a value of less than $2,000. This fee is not included in the table below. If it was, the estimate of expenses you paid during the period would be higher, and your ending account value lower, by this amount.
Hypothetical Example for Comparison Purposes
The second line of the table below for each fund provides information about hypothetical account values and hypothetical expenses based on a fund's actual expense ratio and an assumed rate of return of 5% per year before expenses, which is not the Fund's actual return. The hypothetical account values and expenses may not be used to estimate the actual ending account balance or expenses you paid for the period. You may use this information to compare the ongoing costs of investing in the Fund and other funds. To do so, compare this 5% hypothetical example with the 5% hypothetical examples that appear in the shareholder reports of the other funds. A small balance maintenance fee of $12.00 that is charged once a year may apply for certain accounts with a value of less than $2,000. This fee is not included in the table below. If it was, the estimate of expenses you paid during the period would be higher, and your ending account value lower, by this amount.
Please note that the expenses shown in the table are meant to highlight your ongoing costs only and do not reflect any transaction costs. Therefore, the second line of the table is useful in comparing ongoing costs only, and will not help you determine the relative total costs of owning different funds.
Semiannual Report
| Beginning
Account Value
February 1, 2005 | Ending
Account Value
July 31, 2005 | Expenses Paid
During Period*
February 1, 2005
to July 31, 2005 |
Fidelity New York AMT Tax-Free Money Market Fund | | | |
Actual | $ 1,000.00 | $ 1,009.70 | $ 1.99 |
HypotheticalA | $ 1,000.00 | $ 1,022.81 | $ 2.01 |
Fidelity New York Municipal Money Market Fund | | | |
Actual | $ 1,000.00 | $ 1,009.20 | $ 2.59 |
HypotheticalA | $ 1,000.00 | $ 1,022.22 | $ 2.61 |
A 5% return per year before expenses
* Expenses are equal to each Fund's annualized expense ratio (shown in the table below); multiplied by the average account value over the period, multiplied by 181/365 (to reflect the one-half year period
| Annualized
Expense Ratio |
Fidelity New York AMT Tax-Free Money Market Fund | .40% |
Fidelity New York Municipal Money Market Fund | .52% |
Semiannual Report
Fidelity New York AMT Tax-Free Money Market Fund
Investment Changes
Maturity Diversification |
Days | % of fund's
investments
7/31/05 | % of fund's
investments
1/31/05 | % of fund's
investments
7/31/04 |
0 - 30 | 93.6 | 84.3 | 93.0 |
31 - 90 | 2.6 | 12.6 | 2.5 |
91 - 180 | 1.0 | 0.9 | 0.6 |
181 - 397 | 2.8 | 2.2 | 3.9 |
Weighted Average Maturity |
| 7/31/05 | 1/31/05 | 7/31/04 |
Fidelity New York AMT Tax-Free Money Market Fund | 17 Days | 19 Days | 21 Days |
New York Tax-Free Money Market
Funds Average* | 24 Days | 28 Days | 38 Days |
Asset Allocation (% of fund's net assets) |
As of July 31, 2005 | As of January 31, 2005 |
 | Variable Rate
Demand Notes
(VRDNs) 79.1% | | | Variable Rate
Demand Notes
(VRDNs) 77.3% | |
 | Commercial Paper (including
CP Mode) 10.6% | | | Commercial Paper (including
CP Mode) 10.3% | |
 | Tender Bonds 0.0% | | | Tender Bonds 2.2% | |
 | Municipal Notes 2.7% | | | Municipal Notes 2.0% | |
 | Other Investments 2.6% | | | Other Investments 2.7% | |
 | Net Other Assets 5.0% | | | Net Other Assets 5.5% | |

*Source: iMoneyNet, Inc.
Semiannual Report
Fidelity New York AMT Tax-Free Money Market Fund
Investments July 31, 2005 (Unaudited)
Showing Percentage of Net Assets
Municipal Securities - 95.0% |
| Principal
Amount | | Value
(Note 1) |
New York - 93.8% |
Battery Park City Auth. Rev. Participating VRDN Series ROC II R4531, 2.36% (Liquidity Facility Citigroup Global Markets Hldgs., Inc.) (a)(c) | $ 5,300,000 | | $ 5,300,000 |
Dutchess County Indl. Dev. Agcy. Civic Facility Rev. (Lutheran Ctr. at Poughkeepsie, Inc. Proj.) 2.43%, LOC Key Bank NA, VRDN (a) | 3,930,000 | | 3,930,000 |
Erie County Gen. Oblig. RAN 3.75% 7/13/06, LOC JPMorgan Chase Bank | 14,100,000 | | 14,223,439 |
Erie County Indl. Dev. Agcy. School Facility Rev. Participating VRDN Series TOC 05 J, 2.35% (Liquidity Facility Goldman Sachs Group, Inc.) (a)(c) | 12,230,000 | | 12,230,000 |
Erie County Tobacco Asset Securitization Corp. Participating VRDN Series PA 1213, 2.41% (Liquidity Facility Merrill Lynch & Co., Inc.) (a)(c) | 6,500,000 | | 6,500,000 |
Lancaster Indl. Dev. Agcy. Civic Facilities Rev. (Greenfield Manor Proj.) 2.45%, LOC Manufacturers & Traders Trust Co., VRDN (a) | 6,740,000 | | 6,740,000 |
Long Island Pwr. Auth. Elec. Sys. Rev. Sub Series 2001 1A, 2.29%, LOC Bayerische Landesbank Girozentrale, LOC Landesbank Baden-Wuert (GTD), VRDN (a) | 15,466,000 | | 15,466,000 |
Metropolitan Trans. Auth. Dedicated Tax Fund Participating VRDN: | | | |
Series EGL 01 3205, 2.36% (Liquidity Facility Citibank NA, New York) (a)(c) | 12,300,000 | | 12,300,000 |
Series EGL 98 3203, 2.36% (Liquidity Facility Citibank NA, New York) (a)(c) | 4,900,000 | | 4,900,000 |
Series EGL 98 3204, 2.36% (Liquidity Facility Citibank NA, New York) (a)(c) | 4,100,000 | | 4,100,000 |
Series PA 1098, 2.36% (Liquidity Facility Merrill Lynch & Co., Inc.) (a)(c) | 1,400,000 | | 1,400,000 |
Metropolitan Trans. Auth. Rev. Participating VRDN: | | | |
Series EGL 03 51, 2.36% (Liquidity Facility Citibank NA, New York) (a)(c) | 5,145,000 | | 5,145,000 |
Series FRRI 02 F, 2.36% (Liquidity Facility Bank of New York, New York) (a)(c) | 1,600,000 | | 1,600,000 |
Series MS 724X, 2.34% (Liquidity Facility Morgan Stanley) (a)(c) | 3,000,000 | | 3,000,000 |
Series MSTC 7001, 2.34% (Liquidity Facility Bear Stearns Companies, Inc.) (a)(c) | 2,500,000 | | 2,500,000 |
Series PA 1036, 2.36% (Liquidity Facility Merrill Lynch & Co., Inc.) (a)(c) | 6,995,000 | | 6,995,000 |
Series PA 1040, 2.36% (Liquidity Facility Merrill Lynch & Co., Inc.) (a)(c) | 5,400,000 | | 5,400,000 |
Municipal Securities - continued |
| Principal
Amount | | Value
(Note 1) |
New York - continued |
Metropolitan Trans. Auth. Rev. Participating VRDN: - continued | | | |
Series PT 1946, 2.36% (Liquidity Facility Merrill Lynch & Co., Inc.) (a)(c) | $ 11,625,000 | | $ 11,625,000 |
Series PT 1969, 2.36% (Liquidity Facility Merrill Lynch & Co., Inc.) (a)(c) | 5,260,000 | | 5,260,000 |
Series PT 2533, 2.36% (Liquidity Facility Merrill Lynch & Co., Inc.) (a)(c) | 3,535,000 | | 3,535,000 |
Series Putters 983, 2.36% (Liquidity Facility JPMorgan Chase & Co.) (a)(c) | 8,000,000 | | 8,000,000 |
Series Putters 989, 2.36% (Liquidity Facility JPMorgan Chase Bank) (a)(c) | 6,295,000 | | 6,295,000 |
Metropolitan Trans. Auth. Svc. Contract Rev. Participating VRDN: | | | |
Series Merlots 02 A43, 2.36% (Liquidity Facility Wachovia Bank NA) (a)(c) | 2,370,000 | | 2,370,000 |
Series PT 1967, 2.36% (Liquidity Facility Merrill Lynch & Co., Inc.) (a)(c) | 6,425,000 | | 6,425,000 |
Series PT 1968, 2.36% (Liquidity Facility Merrill Lynch & Co., Inc.) (a)(c) | 8,580,000 | | 8,580,000 |
Metropolitan Trans. Auth. Transit Facilities Rev.: | | | |
Participating VRDN Series Merlots 00 F, 2.36% (Liquidity Facility Wachovia Bank NA) (a)(c) | 6,000,000 | | 6,000,000 |
Series A, 2.7% 8/10/05, LOC ABN-AMRO Bank NV, CP | 5,500,000 | | 5,500,000 |
Series B: | | | |
2.5% 8/1/05, LOC ABN-AMRO Bank NV, CP | 5,000,000 | | 5,000,000 |
2.85% 8/12/05, LOC ABN-AMRO Bank NV, CP | 12,000,000 | | 12,000,000 |
2.85% 8/19/05, LOC ABN-AMRO Bank NV, CP | 7,400,000 | | 7,400,000 |
Nassau County Indl. Dev. Agcy. Indl. Dev. Rev. (CR/PL, Inc. Proj.) Series 1985, 2.5%, LOC Lasalle Bank NA, VRDN (a) | 4,030,000 | | 4,030,000 |
Nassau County Interim Fin. Auth. Participating VRDN
Series SGA 00 108, 2.34% (Liquidity Facility Societe Generale) (a)(c) | 7,500,000 | | 7,500,000 |
New York City Gen. Oblig.: | | | |
Bonds: | | | |
Series 2002 G: | | | |
5% 8/1/05 | 1,035,000 | | 1,035,000 |
5% 8/1/05 (Escrowed to Maturity) (b) | 505,000 | | 505,000 |
Series 2004 E, 3% 11/1/05 | 13,900,000 | | 13,912,881 |
Series 2005 N, 3% 8/1/05 | 5,695,000 | | 5,695,000 |
Series B, 3% 8/1/05 | 16,080,000 | | 16,080,000 |
Municipal Securities - continued |
| Principal
Amount | | Value
(Note 1) |
New York - continued |
New York City Gen. Oblig.: - continued | | | |
Participating VRDN: | | | |
Series LB 02 L17, 2.33% (Liquidity Facility Lehman Brothers Hldgs., Inc.) (a)(c) | $ 6,450,000 | | $ 6,450,000 |
Series MS 01 525, 2.34% (Liquidity Facility Morgan Stanley) (a)(c) | 5,910,000 | | 5,910,000 |
Series MS 1062, 2.35% (Liquidity Facility Morgan Stanley) (a)(c) | 2,200,000 | | 2,200,000 |
Series PT 2203, 2.36% (Liquidity Facility Merrill Lynch & Co., Inc.) (a)(c) | 4,970,000 | | 4,970,000 |
Series PT 2480, 2.39% (Liquidity Facility Dexia Cr. Local de France) (a)(c) | 4,940,000 | | 4,940,000 |
Series PT 2615, 2.39% (Liquidity Facility Dexia Cr. Local de France) (a)(c) | 2,470,000 | | 2,470,000 |
Series PT 2848, 2.39% (Liquidity Facility Dexia Cr. Local de France) (a)(c) | 1,795,000 | | 1,795,000 |
Series PT 962, 2.36% (Liquidity Facility Landesbank Hess-Thuringen (GTD)) (a)(c) | 2,000,000 | | 2,000,000 |
Series PT 991, 2.36% (Liquidity Facility BNP Paribas SA) (a)(c) | 10,000,000 | | 10,000,000 |
Series Putters 933, 2.36% (Liquidity Facility JPMorgan Chase Bank) (a)(c) | 9,495,000 | | 9,495,000 |
Series ROC II R251, 2.4% (Citigroup Global Markets Hldgs., Inc. Guaranteed) (Liquidity Facility Citigroup Global Markets Hldgs., Inc.) (a)(c) | 13,400,000 | | 13,400,000 |
Series ROC II R389, 2.36% (Liquidity Facility Citibank NA) (a)(c) | 7,000,000 | | 7,000,000 |
Series ROC II R6026, 2.36% (Liquidity Facility Citibank NA) (a)(c) | 4,500,000 | | 4,500,000 |
Series SGB 35, 2.32% (Liquidity Facility Societe Generale) (a)(c) | 13,000,000 | | 13,000,000 |
New York City Hsg. Dev. Corp. Multi-family Rev. Series A: | | | |
2.35%, LOC Fleet Nat'l. Bank, VRDN (a) | 20,000,000 | | 20,000,000 |
2.35%, LOC HSBC Bank USA, VRDN (a) | 5,400,000 | | 5,400,000 |
New York City Indl. Dev. Agcy. Civic Facility Rev. (The Birch Wathen Lenox School Proj.) 2.35%, LOC Allied Irish Banks PLC, VRDN (a) | 2,625,000 | | 2,625,000 |
New York City Indl. Dev. Agcy. Rev. (One Bryant Park LLC Proj.): | | | |
Series A, 2.4%, LOC Bank of America NA, LOC Bank of New York, New York, VRDN (a) | 41,300,000 | | 41,300,001 |
Series B, 2.35%, LOC Bank of America NA, LOC Bank of New York, New York, VRDN (a) | 20,500,000 | | 20,500,000 |
Municipal Securities - continued |
| Principal
Amount | | Value
(Note 1) |
New York - continued |
New York City Muni. Wtr. Fin. Auth. Wtr. & Swr. Sys. Rev.: | | | |
Participating VRDN: | | | |
Series EGL 7050053, 2.36% (Liquidity Facility Citibank NA) (a)(c) | $ 6,300,000 | | $ 6,300,000 |
Series MS 1083, 2.34% (Liquidity Facility Morgan Stanley) (a)(c) | 5,705,000 | | 5,705,000 |
Series MS 1086, 2.34% (Liquidity Facility Morgan Stanley) (a)(c) | 3,045,000 | | 3,045,000 |
Series MS 1105, 2.34% (Liquidity Facility Morgan Stanley) (a)(c) | 3,660,000 | | 3,660,000 |
Series PA 1022, 2.38% (Liquidity Facility Merrill Lynch & Co., Inc.) (a)(c) | 9,000,000 | | 9,000,000 |
Series PA 1307, 2.36% (Liquidity Facility Merrill Lynch & Co., Inc.) (a)(c) | 7,000,000 | | 7,000,000 |
Series PA 921, 2.38% (Liquidity Facility Merrill Lynch & Co., Inc.) (a)(c) | 25,970,000 | | 25,970,000 |
Series PA 960, 2.38% (Liquidity Facility Merrill Lynch & Co., Inc.) (a)(c) | 4,295,000 | | 4,295,000 |
Series Putters 297, 2.36% (Liquidity Facility JPMorgan Chase Bank) (a)(c) | 7,520,000 | | 7,520,000 |
Series ROC II R1015, 2.36% (Liquidity Facility Citigroup Global Markets Hldgs., Inc.) (a)(c) | 2,130,000 | | 2,130,000 |
Series ROC II R3, 2.36% (Liquidity Facility Citibank NA) (a)(c) | 5,000,000 | | 5,000,000 |
Series SGB 25, 2.36% (Liquidity Facility Societe Generale) (a)(c) | 13,200,000 | | 13,200,000 |
Series 1, 2.5% 8/3/05 (Liquidity Facility Dexia Cr. Local de France) (Liquidity Facility JPMorgan Chase Bank), CP | 7,000,000 | | 7,000,000 |
Series 2003 7: | | | |
2.5% 9/1/05, CP | 11,800,000 | | 11,800,000 |
2.88% 8/4/05, CP | 4,600,000 | | 4,600,000 |
Series 5A, 2.5% 8/3/05 (Liquidity Facility Bayerische Landesbank Girozentrale) (Liquidity Facility WestLB AG), CP | 12,300,000 | | 12,300,000 |
Series 6: | | | |
2.85% 8/17/05 (Liquidity Facility Landesbank Baden-Wuert (GTD)) (Liquidity Facility Landesbank Hess-Thuringen (GTD)), CP | 7,400,000 | | 7,400,000 |
2.85% 8/18/05 (Liquidity Facility Landesbank Baden-Wuert (GTD)) (Liquidity Facility Landesbank Hess-Thuringen (GTD)), CP | 12,500,000 | | 12,500,000 |
2.87% 8/17/05 (Liquidity Facility Landesbank Baden-Wuert (GTD)) (Liquidity Facility Landesbank Hess-Thuringen (GTD)), CP | 7,100,000 | | 7,100,000 |
Municipal Securities - continued |
| Principal
Amount | | Value
(Note 1) |
New York - continued |
New York City Transitional Fin. Auth. Rev. Participating VRDN Series MSTC 02 202, 2.34% (Liquidity Facility Bear Stearns Companies, Inc.) (a)(c) | $ 1,000,000 | | $ 1,000,000 |
New York City Trust Cultural Resources Rev. Participating VRDN: | | | |
Series MS 950, 2.34% (Liquidity Facility Morgan Stanley) (a)(c) | 1,500,000 | | 1,500,000 |
Series SGA 91, 2.34% (Liquidity Facility Societe Generale) (a)(c) | 4,085,000 | | 4,085,000 |
New York Local Govt. Assistance Corp. Participating VRDN Series SG 99, 2.36% (Liquidity Facility Societe Generale) (a)(c) | 16,200,000 | | 16,200,000 |
New York State Dorm. Auth. Revs.: | | | |
Participating VRDN: | | | |
Series BA 01 D, 2.36% (Liquidity Facility Bank of America NA) (a)(c) | 1,000,000 | | 1,000,000 |
Series EGL 7050004, 2.36% (Liquidity Facility Citibank NA) (a)(c) | 3,900,000 | | 3,900,000 |
Series FRRI 02 L25J, 2.33% (Liquidity Facility Lehman Brothers Hldgs., Inc.) (a)(c) | 18,480,000 | | 18,480,000 |
Series Merlots 00 A30, 2.36% (Liquidity Facility Wachovia Bank NA) (a)(c) | 6,290,000 | | 6,290,000 |
Series Merlots 00 G, 2.36% (Liquidity Facility Wachovia Bank NA) (a)(c) | 10,700,000 | | 10,700,000 |
Series Merlots 00 X, 2.36% (Liquidity Facility Wachovia Bank NA) (a)(c) | 4,000,000 | | 4,000,000 |
Series Merlots 01 A30, 2.36% (Liquidity Facility Wachovia Bank NA) (a)(c) | 1,380,000 | | 1,380,000 |
Series Merlots 01 A65, 2.36% (Liquidity Facility Wachovia Bank NA) (a)(c) | 3,375,000 | | 3,375,000 |
Series Merlots 02 A56, 2.36% (Liquidity Facility Wachovia Bank NA) (a)(c) | 22,035,000 | | 22,035,000 |
Series MSDW 00 305, 2.34% (Liquidity Facility Morgan Stanley) (a)(c) | 5,200,000 | | 5,200,000 |
Series PA 784R, 2.36% (Liquidity Facility Merrill Lynch & Co., Inc.) (a)(c) | 1,000,000 | | 1,000,000 |
Series PT 1958, 2.36% (Liquidity Facility Merrill Lynch & Co., Inc.) (a)(c) | 5,795,000 | | 5,795,000 |
Series Putters 495, 2.36% (Liquidity Facility PNC Bank NA, Pittsburgh) (a)(c) | 6,695,000 | | 6,695,000 |
Series Putters 734, 2.36% (Liquidity Facility JPMorgan Chase Bank) (a)(c) | 3,875,000 | | 3,875,000 |
Series ROC II R4558, 2.36% (Liquidity Facility Citigroup Global Markets Hldgs., Inc.) (a)(c) | 1,970,000 | | 1,970,000 |
Municipal Securities - continued |
| Principal
Amount | | Value
(Note 1) |
New York - continued |
New York State Dorm. Auth. Revs.: - continued | | | |
(Mental Health Svcs. Facilities Impt. Proj.) Series F2C, 2.3% (FSA Insured), VRDN (a) | $ 20,810,000 | | $ 20,810,000 |
New York State Envir. Facilities Corp. Clean Wtr. & Drinking Wtr. Rev. Participating VRDN: | | | |
Series MS 731, 2.34% (Liquidity Facility Morgan Stanley) (a)(c) | 25,700,000 | | 25,700,000 |
Series PT 2108, 2.36% (Liquidity Facility Merrill Lynch & Co., Inc.) (a)(c) | 7,080,000 | | 7,080,000 |
Series ROC II R3016, 2.36% (Liquidity Facility Citigroup Global Markets Hldgs., Inc.) (a)(c) | 1,845,000 | | 1,845,000 |
Series ROC II R4001, 2.36% (Liquidity Facility Citigroup Global Markets Hldgs., Inc.) (a)(c) | 6,470,000 | | 6,470,000 |
New York State Environmentl Facilities Corp. Participating VRDN: | | | |
Series Putters 652, 2.36% (Liquidity Facility JPMorgan Chase & Co.) (a)(c) | 6,335,000 | | 6,335,000 |
Series ROC II R2169, 2.36% (Liquidity Facility Citigroup Global Markets Hldgs., Inc.) (a)(c) | 7,530,000 | | 7,530,000 |
New York State Hsg. Fin. Agcy. Personal Income Tax Rev. Participating VRDN Series MS 859, 2.34% (Liquidity Facility Morgan Stanley) (a)(c) | 5,525,000 | | 5,525,000 |
New York State Hsg. Fin. Agcy. Rev.: | | | |
(100 Meriden Lane Hsg. Proj.) Series A, 2.35%, LOC Bank of New York, New York, VRDN (a) | 20,800,000 | | 20,800,000 |
Series A, 2.29%, LOC Landesbank Hess-Thuringen (GTD), VRDN (a) | 18,400,000 | | 18,400,000 |
New York State Pwr. Auth. & Gen. Purp. Rev.: | | | |
Series 1994 1: | | | |
2.47% 8/1/05, CP | 26,116,000 | | 26,116,000 |
2.49% 9/1/05, CP | 18,462,000 | | 18,462,000 |
2.53% 9/8/05, CP | 4,700,000 | | 4,700,000 |
Series 1997 2, 2.48% 8/2/05, CP | 10,000,000 | | 10,000,000 |
New York State Thruway Auth. Gen. Rev. Participating VRDN: | | | |
Series ROC II R7005, 2.36% (Liquidity Facility Citibank NA) (a)(c) | 6,995,000 | | 6,995,000 |
Series SG 121, 2.38% (Liquidity Facility Societe Generale) (a)(c) | 6,565,000 | | 6,565,000 |
Series SGA 150, 2.34% (Liquidity Facility Societe Generale) (a)(c) | 6,100,000 | | 6,100,000 |
Municipal Securities - continued |
| Principal
Amount | | Value
(Note 1) |
New York - continued |
New York State Thruway Auth. Hwy. & Bridge Trust Fund Participating VRDN: | | | |
Series EGL 03 17, 2.36% (Liquidity Facility Citibank NA, New York) (a)(c) | $ 12,965,000 | | $ 12,965,000 |
Series MS 00 368, 2.34% (Liquidity Facility Morgan Stanley) (a)(c) | 3,500,000 | | 3,500,000 |
Series MSTC 9045, 2.35% (Liquidity Facility Bear Stearns Companies, Inc.) (a)(c) | 9,990,000 | | 9,990,000 |
Series PT 2090, 2.36% (Liquidity Facility Merrill Lynch & Co., Inc.) (a)(c) | 4,900,000 | | 4,900,000 |
New York State Thruway Auth. State Personal Income Tax Rev. Participating VRDN Series ROC II R6030, 2.36% (Liquidity Facility Citibank NA) (a)(c) | 3,270,000 | | 3,270,000 |
New York State Thruway Auth. Svc. Contract Rev. Participating VRDN: | | | |
Series EGL 00 3205, 2.36% (Liquidity Facility Citibank NA, New York) (a)(c) | 6,325,000 | | 6,324,523 |
Series EGL 00 3208, 2.36% (Liquidity Facility Citibank NA, New York) (a)(c) | 14,850,000 | | 14,850,000 |
New York State Urban Dev. Corp. Rev.: | | | |
Participating VRDN: | | | |
Series Merlots 00 N, 2.36% (Liquidity Facility Wachovia Bank NA) (a)(c) | 6,300,000 | | 6,300,000 |
Series Merlots 05 C1, 2.36% (Liquidity Facility Wachovia Bank NA) (a)(c) | 4,300,000 | | 4,300,000 |
(State Facilities & Equip. Proj.) Sub Series 2004 A3A, 2.31% (CIFG North America Insured), VRDN (a) | 14,580,000 | | 14,580,000 |
New York Transitional Fin. Auth. Rev.: | | | |
Participating VRDN: | | | |
Series EGL 04 20, 2.36% (Liquidity Facility Citibank NA) (a)(c) | 16,450,000 | | 16,450,000 |
Series FRRI 02 L21, 2.33% (Liquidity Facility Lehman Brothers Hldgs., Inc.) (a)(c) | 8,975,000 | | 8,975,000 |
Series Merlots 99 G, 2.36% (Liquidity Facility Wachovia Bank NA) (a)(c) | 11,300,000 | | 11,300,000 |
Series Merlots A40, 2.36% (Liquidity Facility Wachovia Bank NA) (a)(c) | 5,055,000 | | 5,055,000 |
Series MS 00 283, 2.34% (Liquidity Facility Morgan Stanley) (a)(c) | 2,245,000 | | 2,245,000 |
Series MS 00 433, 2.34% (Liquidity Facility Morgan Stanley) (a)(c) | 1,817,500 | | 1,817,500 |
Series MSDW 00 319, 2.34% (Liquidity Facility Morgan Stanley) (a)(c) | 5,465,000 | | 5,465,000 |
Municipal Securities - continued |
| Principal
Amount | | Value
(Note 1) |
New York - continued |
New York Transitional Fin. Auth. Rev.: - continued | | | |
Participating VRDN: | | | |
Series PT 1839, 2.36% (Liquidity Facility Merrill Lynch & Co., Inc.) (a)(c) | $ 5,660,000 | | $ 5,660,000 |
Series Putters 478, 2.36% (Liquidity Facility JPMorgan Chase Bank) (a)(c) | 7,495,000 | | 7,495,000 |
Series Putters 628, 2.36% (Liquidity Facility JPMorgan Chase Bank) (a)(c) | 7,320,000 | | 7,320,000 |
Series Putters 830, 2.36% (Liquidity Facility JPMorgan Chase Bank) (a)(c) | 5,600,000 | | 5,600,000 |
Series ROC II R1039, 2.36% (Liquidity Facility Citigroup Global Markets Hldgs., Inc.) (a)(c) | 2,380,000 | | 2,380,000 |
Series ROC II R2054, 2.38% (Liquidity Facility Citigroup Global Markets Hldgs., Inc.) (a)(c) | 3,790,000 | | 3,790,000 |
Series ROC II R356, 2.36% (Liquidity Facility Citibank NA) (a)(c) | 2,000,000 | | 2,000,000 |
Series Stars 04 90, 2.36% (Liquidity Facility BNP Paribas SA) (a)(c) | 11,710,000 | | 11,710,000 |
Series 2003 C3, 2.3% (Liquidity Facility Bank of Nova Scotia, New York Agcy.), VRDN (a) | 8,600,000 | | 8,600,000 |
Series A, 2.3% (Liquidity Facility JPMorgan Chase Bank), VRDN (a) | 17,005,000 | | 17,005,000 |
Rochester Gen. Oblig. BAN Series I, 3.5% 3/2/06 | 16,800,000 | | 16,901,303 |
Sales Tax Asset Receivables Corp. Participating VRDN: | | | |
Series MS 984, 2.34% (Liquidity Facility Morgan Stanley) (a)(c) | 18,260,000 | | 18,260,000 |
Series PT 2450, 2.36% (Liquidity Facility Merrill Lynch & Co., Inc.) (a)(c) | 1,390,000 | | 1,390,000 |
Series Putters 565, 2.36% (Liquidity Facility JPMorgan Chase Bank) (a)(c) | 5,305,000 | | 5,305,000 |
Series Putters 629, 2.36% (Liquidity Facility JPMorgan Chase Bank) (a)(c) | 2,610,000 | | 2,610,000 |
Southampton Union Free School District TAN 3.75% 6/22/06 | 7,000,000 | | 7,061,898 |
Suffolk County Indl. Dev. Agcy. Civic Facility Rev. (Maryhaven Ctr. of Hope Proj.) Series 1997 A, 2.42%, LOC Key Bank NA, VRDN (a) | 2,400,000 | | 2,400,000 |
Syracuse Ind. Dev. Agcy. Civic Fac. Rev. (Crouse-Irving Hosp. Health Proj.) Series A, 2.37%, LOC Fleet Nat'l. Bank, VRDN (a) | 10,950,000 | | 10,950,000 |
Tobacco Settlement Fing. Corp. Participating VRDN: | | | |
Series PA 1230, 2.39% (Liquidity Facility Merrill Lynch & Co., Inc.) (a)(c) | 5,250,000 | | 5,250,000 |
Series PT 1907, 2.36% (Liquidity Facility Merrill Lynch & Co., Inc.) (a)(c) | 5,335,000 | | 5,335,000 |
Municipal Securities - continued |
| Principal
Amount | | Value
(Note 1) |
New York - continued |
Tobacco Settlement Fing. Corp. Participating VRDN: - continued | | | |
Series PT 2056, 2.39% (Liquidity Facility Merrill Lynch & Co., Inc.) (a)(c) | $ 7,400,000 | | $ 7,400,000 |
Series PT 2182, 2.36% (Liquidity Facility Merrill Lynch & Co., Inc.) (a)(c) | 5,180,000 | | 5,180,000 |
Series PT 835, 2.39% (Liquidity Facility Landesbank Hess-Thuringen (GTD)) (a)(c) | 7,400,000 | | 7,400,000 |
Series PT 875, 2.36% (Liquidity Facility Landesbank Hess-Thuringen (GTD)) (a)(c) | 6,000,000 | | 6,000,000 |
Series PT 893, 2.39% (Liquidity Facility DEPFA BANK PLC) (a)(c) | 16,895,000 | | 16,895,000 |
Series ROC II R2033, 2.37% (Liquidity Facility Citigroup Global Markets Hldgs., Inc.) (a)(c) | 3,400,000 | | 3,400,000 |
Series ROC II R2034, 2.37% (Liquidity Facility Citigroup Global Markets Hldgs., Inc.) (a)(c) | 2,930,000 | | 2,930,000 |
Series ROC II R365, 2.37% (Liquidity Facility Citibank NA) (a)(c) | 5,815,000 | | 5,815,000 |
Series ROC II R4508, 2.37% (Liquidity Facility Citigroup Global Markets Hldgs., Inc.) (a)(c) | 2,300,000 | | 2,300,000 |
Tompkins County Indl. Dev. Agcy. Rev. (Civic Facilities Proj.) Series A, 2.43%, LOC Manufacturers & Traders Trust Co., VRDN (a) | 5,535,000 | | 5,535,000 |
Triborough Bridge & Tunnel Auth. Revs. Participating VRDN: | | | |
Series EGL 02 6024, 2.36% (Liquidity Facility Citibank NA, New York) (a)(c) | 6,000,000 | | 6,000,000 |
Series EGL 03 4, Class A, 2.36% (Liquidity Facility Citibank NA, New York) (a)(c) | 4,500,000 | | 4,500,000 |
Series EGL 03 55, 2.36% (Liquidity Facility Citibank NA, New York) (a)(c) | 3,045,000 | | 3,045,000 |
Series MS 922 2.34% (Liquidity Facility Morgan Stanley) (a)(c) | 5,600,000 | | 5,600,000 |
Series MSTC 02 207, 2.34% (Liquidity Facility Bear Stearns Companies, Inc.) (a)(c) | 9,995,000 | | 9,995,000 |
Series PA 1074, 2.38% (Liquidity Facility Merrill Lynch & Co., Inc.) (a)(c) | 7,000,000 | | 7,000,000 |
Series PA 948, 2.38% (Liquidity Facility Merrill Lynch & Co., Inc.) (a)(c) | 7,200,000 | | 7,200,000 |
Series PT 2017, 2.36% (Liquidity Facility Merrill Lynch & Co., Inc.) (a)(c) | 1,460,000 | | 1,460,000 |
Series Putters 525, 2.36% (Liquidity Facility JPMorgan Chase Bank) (a)(c) | 4,995,000 | | 4,995,000 |
Series ROC II R1008, 2.36% (Liquidity Facility Citigroup Global Markets Hldgs., Inc.) (a)(c) | 3,135,000 | | 3,135,000 |
Municipal Securities - continued |
| Principal
Amount | | Value
(Note 1) |
New York - continued |
Triborough Bridge & Tunnel Auth. Revs. Participating VRDN: - continued | | | |
Series ROC II R1032, 2.36% (Liquidity Facility Citigroup Global Markets Hldgs., Inc.) (a)(c) | $ 5,335,000 | | $ 5,335,000 |
Series ROC II R2013, 2.36% (Liquidity Facility Citigroup Global Markets Hldgs., Inc.) (a)(c) | 3,835,000 | | 3,835,000 |
Series SGB 43, 2.36% (Liquidity Facility Societe Generale) (a)(c) | 15,500,000 | | 15,500,000 |
United Nations Dev. Corp. Rev. Participating VRDN Series PT 2087, 2.39% (Liquidity Facility Merrill Lynch & Co., Inc.) (a)(c) | 3,590,000 | | 3,590,000 |
Upstate Telecommunications Corp. Rev. 2.38%, LOC Manufacturers & Traders Trust Co., VRDN (a) | 5,900,000 | | 5,900,000 |
Yates County Indl. Dev. Agcy. Civic Facilities Rev. (Keuka College Proj.) Series 2003 A, 2.37%, LOC Key Bank NA, VRDN (a) | 3,520,000 | | 3,520,000 |
| | 1,332,645,545 |
New York & New Jersey - 1.2% |
Port Auth. of New York & New Jersey: | | | |
Participating VRDN: | | | |
Series MS 766, 2.34% (Liquidity Facility Morgan Stanley) (a)(c) | 4,245,000 | | 4,245,000 |
Series PA 1251, 2.38% (Liquidity Facility Merrill Lynch & Co., Inc.) (a)(c) | 3,700,000 | | 3,700,000 |
Series ROC II R373, 2.36% (Liquidity Facility Citibank NA) (a)(c) | 5,400,000 | | 5,400,000 |
Series 1998 4, 2.35%, VRDN (a) | 4,400,000 | | 4,400,000 |
| | 17,745,000 |
TOTAL INVESTMENT PORTFOLIO - 95.0% (Cost $1,350,390,545) | | 1,350,390,545 |
NET OTHER ASSETS - 5.0% | | 70,389,317 |
NET ASSETS - 100% | $ 1,420,779,862 |
Security Type Abbreviations |
BAN - BOND ANTICIPATION NOTE |
CP - COMMERCIAL PAPER |
RAN - REVENUE ANTICIPATION NOTE |
TAN - TAX ANTICIPATION NOTE |
VRDN - VARIABLE RATE DEMAND NOTE |
Legend |
(a) The coupon rate shown on floating or adjustable rate securities represents the rate at period end. |
(b) Security collateralized by an amount sufficient to pay interest and principal. |
(c) Provides evidence of ownership in one or more underlying municipal bonds. |
See accompanying notes which are an integral part of the financial statements.
Semiannual Report
Fidelity New York AMT Tax-Free Money Market Fund
Financial Statements
Statement of Assets and Liabilities
| July 31, 2005 (Unaudited) |
| | |
Assets | | |
Investment in securities, at value (cost $1,350,390,545) - See accompanying schedule | | $ 1,350,390,545 |
Cash | | 64,926,906 |
Receivable for fund shares sold | | 1,642,095 |
Interest receivable | | 6,942,707 |
Receivable from investment adviser for expense reductions | | 26,678 |
Other receivables | | 103,767 |
Total assets | | 1,424,032,698 |
| | |
Liabilities | | |
Payable for fund shares redeemed | $ 2,607,163 | |
Distributions payable | 134,778 | |
Accrued management fee | 509,023 | |
Other affiliated payables | 1,872 | |
Total liabilities | | 3,252,836 |
| | |
Net Assets | | $ 1,420,779,862 |
Net Assets consist of: | | |
Paid in capital | | $ 1,420,612,633 |
Undistributed net investment income | | 9,105 |
Accumulated undistributed net realized gain (loss) on investments | | 158,124 |
Net Assets, for 1,420,392,911 shares outstanding | | $ 1,420,779,862 |
Net Asset Value, offering price and redemption price per share ($1,420,779,862 ÷ 1,420,392,911 shares) | | $ 1.00 |
See accompanying notes which are an integral part of the financial statements.
Semiannual Report
Fidelity New York AMT Tax-Free Money Market Fund
Financial Statements - continued
Statement of Operations
| Six months ended July 31, 2005 (Unaudited) |
| | |
Investment Income | | |
Interest | | $ 14,557,008 |
| | |
Expenses | | |
Management fee | $ 2,767,122 | |
Independent trustees' compensation | 2,841 | |
Total expenses before reductions | 2,769,963 | |
Expense reductions | (683,418) | 2,086,545 |
Net investment income | | 12,470,463 |
Net realized gain (loss) on investment securities | | 19,806 |
Net increase in net assets resulting from operations | | $ 12,490,269 |
See accompanying notes which are an integral part of the financial statements.
Semiannual Report
Statement of Changes in Net Assets
| Six months ended
July 31, 2005
(Unaudited) | Year ended
January 31,
2005 |
Increase (Decrease) in Net Assets | | |
Operations | | |
Net investment income | $ 12,470,463 | $ 10,143,313 |
Net realized gain (loss) | 19,806 | 289,048 |
Net increase in net assets resulting from operations | 12,490,269 | 10,432,361 |
Distributions to shareholders from net investment income | (12,464,956) | (10,145,141) |
Distributions to shareholders from net realized gain | - | (227,135) |
Total distributions | (12,464,956) | (10,372,276) |
Share transactions at net asset value of $1.00 per share
Proceeds from sales of shares | 671,104,506 | 661,967,295 |
Reinvestment of distributions | 11,819,416 | 9,747,542 |
Cost of shares redeemed | (434,682,612) | (571,820,146) |
Net increase (decrease) in net assets and shares resulting from share transactions | 248,241,310 | 99,894,691 |
Total increase (decrease) in net assets | 248,266,623 | 99,954,776 |
| | |
Net Assets | | |
Beginning of period | 1,172,513,239 | 1,072,558,463 |
End of period (including undistributed net investment income of $9,105 and undistributed net investment income of $3,598, respectively) | $ 1,420,779,862 | $ 1,172,513,239 |
See accompanying notes which are an integral part of the financial statements.
Semiannual Report
Financial Highlights
| Six months ended July 31, 2005 | Years ended January 31, |
| (Unaudited) | 2005 | 2004 | 2003 | 2002 | 2001 |
Selected Per-Share Data | | | | | |
Net asset value, beginning of period | $ 1.00 | $ 1.00 | $ 1.00 | $ 1.00 | $ 1.00 | $ 1.00 |
Income from Investment Operations | | | | | | |
Net investment income | .010 | .009 | .007 | .011 | .022 | .036 |
Net realized and unrealized gain (loss) E | - | - | - | - | - | - |
Total from investment operations | .010 | .009 | .007 | .011 | .022 | .036 |
Distributions from net investment income | (.010) | (.009) | (.007) | (.011) | (.022) | (.036) |
Distributions from net realized gain | - | - E | - | - | - | - |
Total distributions | (.010) | (.009) | (.007) | (.011) | (.022) | (.036) |
Net asset value, end of period | $ 1.00 | $ 1.00 | $ 1.00 | $ 1.00 | $ 1.00 | $ 1.00 |
Total Return B, C | .97% | .94% | .72% | 1.14% | 2.23% | 3.68% |
Ratios to Average Net Assets D | | | | | |
Expenses before expense reductions | .43% A | .43% | .43% | .43% | .48% | .50% |
Expenses net of voluntary waivers, if any | .40% A | .40% | .40% | .40% | .47% | .50% |
Expenses net of all reductions | .33% A | .37% | .39% | .37% | .44% | .49% |
Net investment income | 1.95% A | .92% | .72% | 1.13% | 2.22% | 3.62% |
Supplemental Data | | | | | |
Net assets,
end of period
(000 omitted) | $ 1,420,780 | $ 1,172,513 | $ 1,072,558 | $ 1,163,393 | $ 940,370 | $ 904,171 |
A Annualized
B Total returns for periods of less than one year are not annualized.
C Total returns would have been lower had certain expenses not been reduced during the periods shown.
D Expense ratios reflect operating expenses of the fund. Expenses before reductions do not reflect amounts reimbursed by the investment adviser or reductions from brokerage service arrangements or other expense offset arrangements and do not represent the amount paid by the fund during periods when reimbursements or reductions occur. Expenses net of any voluntary waivers reflect expenses after reimbursement by the investment adviser but prior to reductions from brokerage service arrangements or other expense offset arrangements. Expenses net of all reductions represent the net expenses paid by the fund.
E Amount represents less than $.001 per share.
See accompanying notes which are an integral part of the financial statements.
Semiannual Report
Fidelity New York Municipal Money Market Fund
Investment Changes
Maturity Diversification |
Days | % of fund's
investments
7/31/05 | % of fund's
investments
1/31/05 | % of fund's
investments
7/31/04 |
0 - 30 | 94.2 | 86.7 | 90.0 |
31 - 90 | 2.4 | 9.5 | 4.5 |
91 - 180 | 0.6 | 1.7 | 0.8 |
181 - 397 | 2.8 | 2.1 | 4.7 |
Weighted Average Maturity |
| 7/31/05 | 1/31/05 | 7/31/04 |
Fidelity New York Municipal Money Market Fund | 16 Days | 18 Days | 24 Days |
New York Tax-Free Money Market
Funds Average* | 24 Days | 28 Days | 38 Days |
Asset Allocation (% of fund's net assets) |
As of July 31, 2005 | As of January 31, 2005 |
| Variable Rate
Demand Notes
(VRDNs) 82.8% | | | Variable Rate
Demand Notes
(VRDNs) 79.2% | |
| Commercial Paper (including
CP Mode) 8.5% | | | Commercial Paper (including
CP Mode) 8.0% | |
| Tender Bonds 0.0% | | | Tender Bonds 2.0% | |
| Municipal Notes 3.4% | | | Municipal Notes 2.2% | |
| Other Investments 0.0% | | | Other Investments 2.2% | |
| Net Other Assets 5.3% | | | Net Other Assets 6.4% | |

*Source: iMoneyNet, Inc.
Semiannual Report
Fidelity New York Municipal Money Market Fund
Investments July 31, 2005 (Unaudited)
Showing Percentage of Net Assets
Municipal Securities - 94.7% |
| Principal
Amount | | Value
(Note 1) |
New York - 90.9% |
Chemung County Indl. Dev. Agcy. Indl. Dev. Rev.: | | | |
(McWane, Inc. Proj.) Series 1992 A, 2.53%, LOC AmSouth Bank NA, Birmingham, VRDN (a)(b) | $ 900,000 | | $ 900,000 |
(MMARS 2nd Prog. Trayer, Inc. Proj.) Series A, 2.45%,
LOC HSBC Bank USA, VRDN (a)(b) | 2,700,000 | | 2,700,000 |
East Rochester Hsg. Auth. Rev. (Daniels Creek at Baytowne Proj.) 2.38%, LOC HSBC Bank USA, VRDN (a)(b) | 3,725,000 | | 3,725,000 |
Erie County Gen. Oblig. RAN 3.75% 7/13/06, LOC JPMorgan Chase Bank | 32,500,000 | | 32,784,523 |
Erie County Tobacco Asset Securitization Corp. Participating VRDN Series PA 1207, 2.41% (Liquidity Facility Merrill Lynch & Co., Inc.) (a)(c) | 11,560,000 | | 11,560,000 |
Grand Central District Mgmt. Assoc., Inc. Participating VRDN Series Putters 394, 2.37% (Liquidity Facility JPMorgan Chase Bank) (a)(c) | 3,565,000 | | 3,565,000 |
Ithaca City Gen. Oblig. BAN 3% 8/5/05 | 5,000,000 | | 5,000,198 |
Lancaster Indl. Dev. Agcy. Civic Facilities Rev. (Greenfield Manor Proj.) 2.45%, LOC Manufacturers & Traders Trust Co., VRDN (a) | 4,285,000 | | 4,285,000 |
Long Island Pwr. Auth. Elec. Sys. Rev. Participating VRDN: | | | |
Series EGL 720050013, 2.36% (Liquidity Facility Citibank NA) (a)(c) | 8,275,000 | | 8,275,000 |
Series SG 125, 2.36% (Liquidity Facility Societe Generale) (a)(c) | 5,200,000 | | 5,200,000 |
Metropolitan Trans. Auth. Dedicated Tax Fund Participating VRDN: | | | |
Series EGL 01 3205, 2.36% (Liquidity Facility Citibank NA, New York) (a)(c) | 15,020,000 | | 15,020,000 |
Series EGL 02 6003, 2.36% (Liquidity Facility Citibank NA, New York) (a)(c) | 7,700,000 | | 7,700,000 |
Series EGL 02 6007, 2.36% (Liquidity Facility Citibank NA, New York) (a)(c) | 7,140,000 | | 7,140,000 |
Series EGL 98 3203, 2.36% (Liquidity Facility Citibank NA, New York) (a)(c) | 6,700,000 | | 6,700,000 |
Series EGL 98 3204, 2.36% (Liquidity Facility Citibank NA, New York) (a)(c) | 8,900,000 | | 8,900,000 |
Series PA 1098, 2.36% (Liquidity Facility Merrill Lynch & Co., Inc.) (a)(c) | 8,700,000 | | 8,700,000 |
Metropolitan Trans. Auth. Rev. Participating VRDN: | | | |
Series EGL 02 6023, 2.36% (Liquidity Facility Citibank NA, New York) (a)(c) | 13,035,000 | | 13,035,000 |
Series EGL 02 6028, 2.36% (Liquidity Facility Citibank NA, New York) (a)(c) | 5,145,000 | | 5,145,000 |
Municipal Securities - continued |
| Principal
Amount | | Value
(Note 1) |
New York - continued |
Metropolitan Trans. Auth. Rev. Participating VRDN: - continued | | | |
Series EGL 03 37, 2.36% (Liquidity Facility Citibank NA) (a)(c) | $ 7,235,000 | | $ 7,235,000 |
Series FRRI 02 F, 2.36% (Liquidity Facility Bank of New York, New York) (a)(c) | 4,067,000 | | 4,067,000 |
Series Merlots 02 A52, 2.36% (Liquidity Facility Wachovia Bank NA) (a)(c) | 9,445,000 | | 9,445,000 |
Series Merlots C18, 2.36% (Liquidity Facility Wachovia Bank NA) (a)(c) | 11,525,000 | | 11,525,000 |
Series MS 1042, 2.34% (Liquidity Facility Morgan Stanley) (a)(c) | 1,520,000 | | 1,520,000 |
Series MS 724X, 2.34% (Liquidity Facility Morgan Stanley) (a)(c) | 6,995,000 | | 6,995,000 |
Series MS 862, 2.34% (Liquidity Facility Morgan Stanley) (a)(c) | 4,660,000 | | 4,660,000 |
Series PA 1040, 2.36% (Liquidity Facility Merrill Lynch & Co., Inc.) (a)(c) | 22,370,000 | | 22,370,000 |
Series PA 1084, 2.36% (Liquidity Facility Merrill Lynch & Co., Inc.) (a)(c) | 8,665,000 | | 8,665,000 |
Series PT 1466, 2.36% (Liquidity Facility Merrill Lynch & Co., Inc.) (a)(c) | 10,765,000 | | 10,765,000 |
Series PT 988, 2.36% (Liquidity Facility Landesbank Hess-Thuringen (GTD)) (a)(c) | 5,500,000 | | 5,500,000 |
Metropolitan Trans. Auth. Svc. Contract Rev. Participating VRDN: | | | |
Series EGL 02 6000, 2.36% (Liquidity Facility Citibank NA, New York) (a)(c) | 8,100,000 | | 8,100,000 |
Series PT 1439, 2.36% (Liquidity Facility Merrill Lynch & Co., Inc.) (a)(c) | 7,280,000 | | 7,280,000 |
Series PT 1756, 2.36% (Liquidity Facility Merrill Lynch & Co., Inc.) (a)(c) | 5,625,000 | | 5,625,000 |
Series PT 1836, 2.36% (Liquidity Facility Merrill Lynch & Co., Inc.) (a)(c) | 9,895,000 | | 9,895,000 |
Series ROC II R2083, 2.36% (Liquidity Facility Citigroup Global Markets Hldgs., Inc.) (a)(c) | 5,245,000 | | 5,245,000 |
Metropolitan Trans. Auth. Transit Facilities Rev.: | | | |
Participating VRDN Series Merlots 00 F, 2.36% (Liquidity Facility Wachovia Bank NA) (a)(c) | 11,165,000 | | 11,165,000 |
Series A, 2.7% 8/10/05, LOC ABN-AMRO Bank NV, CP | 14,500,000 | | 14,500,000 |
Series B: | | | |
2.5% 8/1/05, LOC ABN-AMRO Bank NV, CP | 14,000,000 | | 14,000,000 |
2.58% 8/11/05, LOC ABN-AMRO Bank NV, CP | 15,000,000 | | 15,000,000 |
2.85% 8/19/05, LOC ABN-AMRO Bank NV, CP | 18,600,000 | | 18,600,000 |
Municipal Securities - continued |
| Principal
Amount | | Value
(Note 1) |
New York - continued |
Middle Country Century School District Centereach TAN 3.75% 6/30/06 | $ 6,000,000 | | $ 6,052,224 |
Monroe County Arpt. Auth. Arpt. Rev. Participating VRDN Series Putters 123, 2.38% (Liquidity Facility JPMorgan Chase Bank) (a)(b)(c) | 8,965,000 | | 8,965,000 |
Monroe County Indl. Dev. Agcy. Civic Facility Rev. (Action For Better Communty, Inc. Proj.) 2.43%, LOC Manufacturers & Traders Trust Co., VRDN (a) | 2,200,000 | | 2,200,000 |
Monroe County Indl. Dev. Agcy. Rev.: | | | |
(Advent Tool & Mold Proj.) Series 1990 D, 2.45%, LOC HSBC Bank USA, VRDN (a)(b) | 810,000 | | 810,000 |
(AJL Manufacturing Proj.) Series 1996 A, 2.54%, LOC Manufacturers & Traders Trust Co., VRDN (a)(b) | 4,630,000 | | 4,630,000 |
(Flower City Proj.) 2.49%, LOC Fleet Nat'l. Bank, VRDN (a)(b) | 4,295,000 | | 4,295,000 |
Nassau County Interim Fin. Auth. Participating VRDN
Series SGA 00 108, 2.34% (Liquidity Facility Societe Generale) (a)(c) | 26,100,000 | | 26,100,000 |
Nassau County Tobacco Settlement Corp. Participating VRDN Series PA 1211, 2.41% (Liquidity Facility Merrill Lynch & Co., Inc.) (a)(c) | 10,535,000 | | 10,535,000 |
New York City Gen. Oblig.: | | | |
Bonds Series 1994 H5, 2.78% tender 8/16/05 (MBIA Insured) (Liquidity Facility Landesbank Hess-Thuringen (GTD)), CP mode | 6,000,000 | | 6,000,000 |
Participating VRDN: | | | |
Series LB 02 L17, 2.33% (Liquidity Facility Lehman Brothers Hldgs., Inc.) (a)(c) | 8,525,000 | | 8,525,000 |
Series MS 00 394, 2.34% (Liquidity Facility Morgan Stanley) (a)(c) | 3,455,000 | | 3,455,000 |
Series PA 1249, 2.36% (Liquidity Facility Merrill Lynch & Co., Inc.) (a)(c) | 5,000,000 | | 5,000,000 |
Series PT 2203, 2.36% (Liquidity Facility Merrill Lynch & Co., Inc.) (a)(c) | 1,175,000 | | 1,175,000 |
Series PT 2217, 2.36% (Liquidity Facility Merrill Lynch & Co., Inc.) (a)(c) | 5,370,000 | | 5,370,000 |
Series PT 2480, 2.39% (Liquidity Facility Dexia Cr. Local de France) (a)(c) | 13,640,000 | | 13,640,000 |
Series PT 2544, 2.39% (Liquidity Facility Dexia Cr. Local de France) (a)(c) | 16,620,000 | | 16,620,000 |
Series PT 991, 2.36% (Liquidity Facility BNP Paribas SA) (a)(c) | 10,000,000 | | 10,000,000 |
Series Putters 647, 2.36% (Liquidity Facility JPMorgan Chase & Co.) (a)(c) | 7,740,000 | | 7,740,000 |
Municipal Securities - continued |
| Principal
Amount | | Value
(Note 1) |
New York - continued |
New York City Gen. Oblig.: - continued | | | |
Participating VRDN: | | | |
Series Putters 659, 2.36% (Liquidity Facility JPMorgan Chase Bank) (a)(c) | $ 11,055,000 | | $ 11,055,000 |
Series RobIns 17 Class F, 2.36% (Liquidity Facility Bank of New York, New York) (a)(c) | 6,600,000 | | 6,600,000 |
Series ROC II R2138, 2.36% (Liquidity Facility Citigroup Global Markets Hldgs., Inc.) (a)(c) | 6,800,000 | | 6,800,000 |
Series ROC II R251, 2.4% (Citigroup Global Markets Hldgs., Inc. Guaranteed) (Liquidity Facility Citigroup Global Markets Hldgs., Inc.) (a)(c) | 34,700,000 | | 34,700,000 |
Series ROC II R389, 2.36% (Liquidity Facility Citibank NA) (a)(c) | 5,550,000 | | 5,550,000 |
New York City Hsg. Dev. Corp. Multi-family Rental Hsg. Rev. (Related-Tribeca Tower Proj.) Series 1997 A, 2.34%, LOC Fannie Mae, VRDN (a)(b) | 4,500,000 | | 4,500,000 |
New York City Hsg. Dev. Corp. Multi-family Rev.: | | | |
(15 East Clark Place Apts. Proj.) Series A, 2.34%, LOC JPMorgan Chase Bank, VRDN (a)(b) | 5,800,000 | | 5,800,000 |
(92nd & First Residential Tower Proj.) Series A, 2.37%, LOC Fleet Nat'l. Bank, VRDN (a)(b) | 46,970,000 | | 46,970,000 |
(941 Hoe Avenue Apts. Proj.) Series A, 2.37%, LOC Key Bank NA, VRDN (a)(b) | 6,100,000 | | 6,100,000 |
(Aldus Street Apartments Proj.) Series A, 2.37%, LOC Key Bank NA, VRDN (a)(b) | 14,200,000 | | 14,200,000 |
(Atlantic Court Apts. Proj.) Series A, 2.35%, LOC HSBC Bank USA, VRDN (a)(b) | 5,000,000 | | 5,000,000 |
(Courtland Avenue Apts. Proj.) Series A, 2.38%, LOC Key Bank NA, VRDN (a)(b) | 7,000,000 | | 7,000,000 |
(Louis Nine Boulevard Apts. Proj.) Series A, 2.38%, LOC Key Bank NA, VRDN (a)(b) | 4,500,000 | | 4,500,000 |
(Nagle Courtyard Apts. Proj.) Series A, 2.37%, LOC Fleet Nat'l. Bank, VRDN (a)(b) | 8,400,000 | | 8,400,000 |
(Ogden Avenue Apts. Proj.) Series A, 2.37%, LOC Fleet Nat'l. Bank, VRDN (a)(b) | 10,500,000 | | 10,500,000 |
Series A, 2.34%, LOC Landesbank Baden-Wuert (GTD), VRDN (a)(b) | 46,500,000 | | 46,500,000 |
New York City Indl. Dev. Agcy. Civic Facility Rev.: | | | |
(French Institute-Alliance Francaise de New York-Federation of French Alliances in the United States Proj.) 2.4%, LOC Manufacturers & Traders Trust Co., VRDN (a) | 2,550,000 | | 2,550,000 |
(Mercy College Proj.) Series A, 2.4%, LOC Key Bank NA, VRDN (a) | 7,200,000 | | 7,200,000 |
Municipal Securities - continued |
| Principal
Amount | | Value
(Note 1) |
New York - continued |
New York City Indl. Dev. Agcy. Indl. Dev. Rev. (Linear Ltg. Proj.) 2.55%, LOC JPMorgan Chase Bank, VRDN (a)(b) | $ 1,555,000 | | $ 1,555,000 |
New York City Indl. Dev. Agcy. Rev. (One Bryant Park LLC Proj.) Series A, 2.4%, LOC Bank of America NA, LOC Bank of New York, New York, VRDN (a) | 61,600,000 | | 61,600,001 |
New York City Indl. Dev. Agcy. Solid Waste Facility Rev. (USA Waste Svcs. Proj.) 2.37%, LOC JPMorgan Chase Bank, VRDN (a)(b) | 5,000,000 | | 5,000,000 |
New York City Muni. Wtr. Fin. Auth. Wtr. & Swr. Sys. Rev.: | | | |
Participating VRDN: | | | |
Series EGL 04 33 Class A, 2.36% (Liquidity Facility Citibank NA) (a)(c) | 1,925,000 | | 1,925,000 |
Series EGL 04 37 Class A, 2.36% (Liquidity Facility Citibank NA) (a)(c) | 11,000,000 | | 11,000,000 |
Series EGL 3207, 2.36% (Liquidity Facility Citibank NA, New York) (a)(c) | 12,900,000 | | 12,900,000 |
Series EGL 7050053, 2.36% (Liquidity Facility Citibank NA) (a)(c) | 6,000,000 | | 6,000,000 |
Series Merlots 00 DDD, 2.36% (Liquidity Facility Wachovia Bank NA) (a)(c) | 18,690,000 | | 18,690,000 |
Series PA 1022, 2.38% (Liquidity Facility Merrill Lynch & Co., Inc.) (a)(c) | 24,625,000 | | 24,625,000 |
Series PA 921, 2.38% (Liquidity Facility Merrill Lynch & Co., Inc.) (a)(c) | 17,300,000 | | 17,300,000 |
Series PA 960, 2.38% (Liquidity Facility Merrill Lynch & Co., Inc.) (a)(c) | 20,000,000 | | 20,000,000 |
Series Putters 198, 2.36% (Liquidity Facility JPMorgan Chase Bank) (a)(c) | 4,995,000 | | 4,995,000 |
Series Putters 499, 2.37% (Liquidity Facility JPMorgan Chase Bank) (a)(c) | 4,995,000 | | 4,995,000 |
Series Putters 624, 2.36% (Liquidity Facility JPMorgan Chase Bank) (a)(c) | 1,695,000 | | 1,695,000 |
Series Putters 998, 2.36% (Liquidity Facility JPMorgan Chase Bank) (a)(c) | 19,445,000 | | 19,445,000 |
Series ROC II R1015, 2.36% (Liquidity Facility Citigroup Global Markets Hldgs., Inc.) (a)(c) | 12,385,000 | | 12,385,000 |
Series ROC II R4061, 2.36% (Liquidity Facility Citigroup Global Markets Hldgs., Inc.) (a)(c) | 2,575,000 | | 2,575,000 |
Series SGB 25, 2.36% (Liquidity Facility Societe Generale) (a)(c) | 49,900,000 | | 49,900,000 |
Series 2003 7: | | | |
2.5% 9/1/05, CP | 30,200,000 | | 30,200,000 |
2.88% 8/4/05, CP | 11,900,000 | | 11,900,000 |
Municipal Securities - continued |
| Principal
Amount | | Value
(Note 1) |
New York - continued |
New York City Muni. Wtr. Fin. Auth. Wtr. & Swr. Sys. Rev.: - continued | | | |
Series 5A, 2.5% 8/3/05 (Liquidity Facility Bayerische Landesbank Girozentrale) (Liquidity Facility WestLB AG), CP | $ 34,200,000 | | $ 34,200,000 |
Series 6: | | | |
2.85% 8/17/05 (Liquidity Facility Landesbank Baden-Wuert (GTD)) (Liquidity Facility Landesbank Hess-Thuringen (GTD)), CP | 18,800,000 | | 18,800,000 |
2.85% 8/18/05 (Liquidity Facility Landesbank Baden-Wuert (GTD)) (Liquidity Facility Landesbank Hess-Thuringen (GTD)), CP | 10,000,000 | | 10,000,000 |
2.87% 8/17/05 (Liquidity Facility Landesbank Baden-Wuert (GTD)) (Liquidity Facility Landesbank Hess-Thuringen (GTD)), CP | 17,900,000 | | 17,900,000 |
New York City Transitional Fin. Auth. Rev. Participating VRDN: | | | |
Series EGL 00 3203, 2.36% (Liquidity Facility Citibank NA, New York) (a)(c) | 7,000,000 | | 7,000,000 |
Series EGL 00 3206, 2.36% (Liquidity Facility Citibank NA, New York) (a)(c) | 13,000,000 | | 13,000,000 |
Series EGL 01 3202, 2.36% (Liquidity Facility Citibank NA, New York) (a)(c) | 3,300,000 | | 3,300,000 |
New York Local Govt. Assistance Corp. Participating VRDN Series SG 99, 2.36% (Liquidity Facility Societe Generale) (a)(c) | 14,600,000 | | 14,600,000 |
New York State Dorm. Auth. Revs. Participating VRDN: | | | |
Series EGL 03 2, 2.36% (Liquidity Facility Citibank NA, New York) (a)(c) | 4,720,000 | | 4,720,000 |
Series EGL 7050004, 2.36% (Liquidity Facility Citibank NA) (a)(c) | 10,800,000 | | 10,800,000 |
Series Floaters 05 4, 2.36% (Liquidity Facility BNP Paribas SA) (a)(c) | 7,105,000 | | 7,105,000 |
Series IXIS 05 16, 2.36% (Liquidity Facility CDC Fin.-CDC IXIS) (a)(c) | 17,500,000 | | 17,500,000 |
Series Merlots 00 G, 2.36% (Liquidity Facility Wachovia Bank NA) (a)(c) | 22,920,000 | | 22,920,000 |
Series Merlots 00 X, 2.36% (Liquidity Facility Wachovia Bank NA) (a)(c) | 10,565,000 | | 10,565,000 |
Series Merlots 01 A30, 2.36% (Liquidity Facility Wachovia Bank NA) (a)(c) | 2,980,000 | | 2,980,000 |
Series Merlots 02 A56, 2.36% (Liquidity Facility Wachovia Bank NA) (a)(c) | 57,560,000 | | 57,560,000 |
Series MS 1013, 2.34% (Liquidity Facility Morgan Stanley) (a)(c) | 11,625,000 | | 11,625,000 |
Municipal Securities - continued |
| Principal
Amount | | Value
(Note 1) |
New York - continued |
New York State Dorm. Auth. Revs. Participating VRDN: - continued | | | |
Series MT 98, 2.36% (Liquidity Facility BNP Paribas SA) (a)(c) | $ 4,995,000 | | $ 4,995,000 |
Series PT 2247, 2.36% (Liquidity Facility Merrill Lynch & Co., Inc.) (a)(c) | 5,190,000 | | 5,190,000 |
Series PT 2534, 2.36% (Liquidity Facility Merrill Lynch & Co., Inc.) (a)(c) | 4,340,000 | | 4,340,000 |
Series PT 2541, 2.36% (Liquidity Facility Dexia Cr. Local de France) (a)(c) | 6,870,000 | | 6,870,000 |
Series Putters 480, 2.36% (Liquidity Facility JPMorgan Chase Bank) (a)(c) | 10,410,000 | | 10,410,000 |
Series Putters 495, 2.36% (Liquidity Facility PNC Bank NA, Pittsburgh) (a)(c) | 18,145,000 | | 18,145,000 |
Series Putters 588, 2.36% (Liquidity Facility JPMorgan Chase Bank) (a)(c) | 2,595,000 | | 2,595,000 |
Series SGA 01 132, 2.34% (Liquidity Facility Societe Generale) (a)(c) | 1,805,000 | | 1,805,000 |
New York State Energy Research & Dev. Auth. Facilities Rev. (Consolidated Edison Co. Proj.) Sub Series C3, 2.34%, LOC Citibank NA, VRDN (a)(b) | 6,700,000 | | 6,700,000 |
New York State Energy Research & Dev. Auth. Poll. Cont. Rev. Participating VRDN: | | | |
Series LB 05 L8, 2.58% (Liquidity Facility Lehman Brothers Hldgs., Inc.) (a)(b)(c) | 18,000,000 | | 18,000,000 |
Series MS 181, 2.38% (Liquidity Facility Morgan Stanley) (a)(b)(c) | 10,870,000 | | 10,870,000 |
New York State Envir. Facilities Corp. Clean Wtr. & Drinking Wtr. Rev. Participating VRDN: | | | |
Series CDC 04 8, 2.36% (Liquidity Facility CDC Fin.-CDC IXIS) (a)(c) | 6,210,000 | | 6,210,000 |
Series Merlots B20, 2.36% (Liquidity Facility Wachovia Bank NA) (a)(c) | 5,335,000 | | 5,335,000 |
Series MS 731, 2.34% (Liquidity Facility Morgan Stanley) (a)(c) | 11,927,000 | | 11,927,000 |
Series Putters 611, 2.36% (Liquidity Facility JPMorgan Chase & Co.) (a)(c) | 4,745,000 | | 4,745,000 |
Series Putters 613, 2.36% (Liquidity Facility JPMorgan Chase Bank) (a)(c) | 8,180,000 | | 8,180,000 |
New York State Envir. Facilities Corp. State Wtr. Poll. Cont. Revolving Fund Rev. Participating VRDN Series EGL 94 3202, 2.36% (Liquidity Facility Citibank NA, New York) (a)(c) | 10,000,000 | | 10,000,000 |
Municipal Securities - continued |
| Principal
Amount | | Value
(Note 1) |
New York - continued |
New York State Hsg. Fin. Agcy. Rev.: | | | |
(1115 First Avenue Apts. Hsg. Proj.) Series A, 2.45% (Liquidity Facility Key Bank NA), VRDN (a)(b) | $ 12,900,000 | | $ 12,900,000 |
(1500 Lexington Avenue Proj.) Series A: | | | |
2.35%, LOC Fannie Mae, VRDN (a)(b) | 25,300,000 | | 25,300,000 |
2.35%, LOC Fannie Mae, VRDN (a)(b) | 5,000,000 | | 5,000,000 |
(250 West 50th Street Hsg. Proj.) Series 1997 A, 2.34%, LOC Fannie Mae, VRDN (a)(b) | 21,000,000 | | 21,000,000 |
(250 West 93rd Street Hsg. Proj.) Series A, 2.39%, LOC Fleet Nat'l. Bank, VRDN (a)(b) | 21,000,000 | | 21,000,000 |
(360 West 43rd Street Hsg. Proj.) Series A, 2.36%, LOC Fannie Mae, VRDN (a)(b) | 12,000,000 | | 12,000,000 |
(66 West 38th Street Proj.) Series A, 2.37%, LOC Fannie Mae, VRDN (a)(b) | 17,400,000 | | 17,400,000 |
(750 Sixth Avenue Hsg. Proj.): | | | |
Series 1998 A, 2.34%, LOC Fannie Mae, VRDN (a)(b) | 29,800,000 | | 29,800,000 |
Series 1999 A, 2.34%, LOC Fannie Mae, VRDN (a)(b) | 5,500,000 | | 5,500,000 |
(900 Eighth Avenue Hsg. Proj.) Series A, 2.37%, LOC Key Bank NA, VRDN (a)(b) | 25,900,000 | | 25,900,000 |
(Avalon Chrystie Place I Hsg.Proj.) Series A, 2.37%, LOC Fleet Nat'l. Bank, VRDN (a)(b) | 1,300,000 | | 1,300,000 |
(Biltmore Tower Hsg. Proj.) Series A, 2.34%, LOC Fannie Mae, VRDN (a)(b) | 43,300,000 | | 43,300,000 |
(Chelsea Apts. Proj.) Series A, 2.35%, LOC Fannie Mae, VRDN (a)(b) | 32,800,000 | | 32,800,000 |
(Clinton Green North Hsg. Proj.) Series A, 2.34%, LOC Bank of America NA, VRDN (a)(b) | 20,000,000 | | 20,000,000 |
(Clinton Green South Hsg. Proj.) Series A, 2.34%, LOC Bank of America NA, VRDN (a)(b) | 28,000,000 | | 28,000,000 |
(East 39th Street Hsg. Proj.) Series A, 2.34%, LOC Fannie Mae, VRDN (a)(b) | 24,000,000 | | 24,000,000 |
(Helena Hsg. Proj.) Series A, 2.34%, LOC Fleet Nat'l. Bank, VRDN (a)(b) | 21,000,000 | | 21,000,000 |
(Kew Garden Hills Apts. Proj.) Series A, 2.34%, LOC Fannie Mae, VRDN (a)(b) | 6,200,000 | | 6,200,000 |
(Reverand Polite Avenue Apts. Proj.) Series A, 2.42%, LOC Manufacturers & Traders Trust Co., VRDN (a)(b) | 16,000,000 | | 16,000,000 |
(Saville Hsg. Proj.) Series 2002 A, 2.35%, LOC Fleet Nat'l. Bank, VRDN (a)(b) | 9,000,000 | | 9,000,000 |
(Sea Park West Hsg. Proj.) 2.4%, LOC Freddie Mac, VRDN (a)(b) | 7,500,000 | | 7,500,000 |
(South Cove Plaza Proj.) Series A, 2.35%, LOC Freddie Mac, VRDN (a)(b) | 30,140,000 | | 30,140,000 |
Municipal Securities - continued |
| Principal
Amount | | Value
(Note 1) |
New York - continued |
New York State Hsg. Fin. Agcy. Rev.: - continued | | | |
(Theatre Row Tower Hsg. Proj.): | | | |
Series 2000 A, 2.55%, LOC Bayerische Hypo-und Vereinsbank AG, VRDN (a)(b) | $ 49,985,000 | | $ 49,985,000 |
Series 2001 A, 2.55%, LOC Bayerische Hypo-und Vereinsbank AG, VRDN (a)(b) | 5,000,000 | | 5,000,000 |
(Tower 31 Hsg. Proj.) Series A, 2.38%, LOC Fleet Nat'l. Bank, VRDN (a)(b) | 34,800,000 | | 34,800,000 |
(Worth Street Hsg. Proj.) Series A, 2.36%, LOC Fannie Mae, VRDN (a)(b) | 37,000,000 | | 37,000,000 |
Series A, 2.41%, LOC Fannie Mae, VRDN (a)(b) | 11,300,000 | | 11,300,000 |
New York State Mtg. Agcy. Rev. Participating VRDN: | | | |
Series Merlots 00 A33, 2.36% (Liquidity Facility Wachovia Bank NA) (a)(c) | 3,130,000 | | 3,130,000 |
Series Merlots 97 J, 2.41% (Liquidity Facility Wachovia Bank NA) (a)(b)(c) | 18,680,000 | | 18,680,000 |
Series MSTC 00 89, 2.38% (Liquidity Facility Bear Stearns Companies, Inc.) (a)(b)(c) | 2,595,000 | | 2,595,000 |
Series ROC II R181, 2.4% (Liquidity Facility Citibank NA) (a)(b)(c) | 5,965,000 | | 5,965,000 |
New York State Muni. Bond Bank Agcy. Spl. School Purp. Rev. Participating VRDN Series PT 2066, 2.39% (Liquidity Facility Merrill Lynch & Co., Inc.) (a)(c) | 14,335,000 | | 14,335,000 |
New York State Pwr. Auth. & Gen. Purp. Rev.: | | | |
Series 1994 1: | | | |
2.47% 8/1/05, CP | 34,100,000 | | 34,100,000 |
2.49% 9/1/05, CP | 43,400,000 | | 43,400,000 |
Series 1997 2, 2.48% 8/2/05, CP | 10,000,000 | | 10,000,000 |
New York State Thruway Auth. Series 2001, 2.85% 8/12/05 (Liquidity Facility Landesbank Hess-Thuringen (GTD)), CP | 4,000,000 | | 4,000,000 |
New York State Thruway Auth. Gen. Rev. Participating VRDN Series SGA 150, 2.34% (Liquidity Facility Societe Generale) (a)(c) | 14,325,000 | | 14,325,000 |
New York State Thruway Auth. Hwy. & Bridge Trust Fund Participating VRDN: | | | |
Series EGL 03 17, 2.36% (Liquidity Facility Citibank NA, New York) (a)(c) | 1,000,000 | | 1,000,000 |
Series MS 00 368, 2.34% (Liquidity Facility Morgan Stanley) (a)(c) | 1,000,000 | | 1,000,000 |
Series PT 2090, 2.36% (Liquidity Facility Merrill Lynch & Co., Inc.) (a)(c) | 5,605,000 | | 5,605,000 |
Series Putters 330, 2.36% (Liquidity Facility JPMorgan Chase & Co.) (a)(c) | 16,375,000 | | 16,375,000 |
Municipal Securities - continued |
| Principal
Amount | | Value
(Note 1) |
New York - continued |
New York State Thruway Auth. Hwy. & Bridge Trust Fund Participating VRDN: - continued | | | |
Series ROC II R5012, 2.36% (Liquidity Facility Citigroup Global Markets Hldgs., Inc.) (a)(c) | $ 3,050,000 | | $ 3,050,000 |
New York State Thruway Auth. State Personal Income Tax Rev. Participating VRDN: | | | |
Series IXIS 04 10 Class A, 2.36% (Liquidity Facility CDC Fin.-CDC IXIS) (a)(c) | 6,770,000 | | 6,770,000 |
Series ROC II R6030, 2.36% (Liquidity Facility Citibank NA) (a)(c) | 2,000,000 | | 2,000,000 |
New York State Urban Dev. Corp. Rev. Participating VRDN: | | | |
Series Merlots 00 N, 2.36% (Liquidity Facility Wachovia Bank NA) (a)(c) | 6,700,000 | | 6,700,000 |
Series Putters 633, 2.36% (Liquidity Facility JPMorgan Chase Bank) (a)(c) | 4,795,000 | | 4,795,000 |
New York Transitional Fin. Auth. Rev.: | | | |
Participating VRDN: | | | |
Series EGL 03 52, 2.36% (Liquidity Facility Citibank NA, New York) (a)(c) | 29,700,000 | | 29,700,000 |
Series EGL 04 20, 2.36% (Liquidity Facility Citibank NA) (a)(c) | 33,050,000 | | 33,050,000 |
Series Merlots 99 G, 2.36% (Liquidity Facility Wachovia Bank NA) (a)(c) | 22,695,000 | | 22,695,000 |
Series Merlots A40, 2.36% (Liquidity Facility Wachovia Bank NA) (a)(c) | 33,115,000 | | 33,115,000 |
Series MS 00 433, 2.34% (Liquidity Facility Morgan Stanley) (a)(c) | 650,000 | | 650,000 |
Series MS 01 698, 2.34% (Liquidity Facility Morgan Stanley) (a)(c) | 15,874,000 | | 15,874,000 |
Series PA 536, 2.36% (Liquidity Facility Merrill Lynch & Co., Inc.) (a)(c) | 6,445,000 | | 6,445,000 |
Series PT 1399, 2.36% (Liquidity Facility Merrill Lynch & Co., Inc.) (a)(c) | 19,490,000 | | 19,490,000 |
Series PT 1814, 2.36% (Liquidity Facility Merrill Lynch & Co., Inc.) (a)(c) | 5,320,000 | | 5,320,000 |
Series PT 1839, 2.36% (Liquidity Facility Merrill Lynch & Co., Inc.) (a)(c) | 13,805,000 | | 13,805,000 |
Series PT 2018, 2.36% (Liquidity Facility Merrill Lynch & Co., Inc.) (a)(c) | 8,475,000 | | 8,475,000 |
Series PT 2219, 2.36% (Liquidity Facility Merrill Lynch & Co., Inc.) (a)(c) | 9,305,000 | | 9,305,000 |
Series PT 2271, 2.36% (Liquidity Facility Merrill Lynch & Co., Inc.) (a)(c) | 5,520,000 | | 5,520,000 |
Municipal Securities - continued |
| Principal
Amount | | Value
(Note 1) |
New York - continued |
New York Transitional Fin. Auth. Rev.: - continued | | | |
Participating VRDN: | | | |
Series Putters 129, 2.36% (Liquidity Facility JPMorgan Chase & Co.) (a)(c) | $ 12,885,000 | | $ 12,885,000 |
Series Putters 305, 2.36% (Liquidity Facility JPMorgan Chase & Co.) (a)(c) | 9,955,000 | | 9,955,000 |
Series Putters 386, 2.36% (Liquidity Facility JPMorgan Chase Bank) (a)(c) | 4,995,000 | | 4,995,000 |
Series Putters 387, 2.36% (Liquidity Facility JPMorgan Chase Bank) (a)(c) | 21,125,000 | | 21,125,000 |
Series Putters 424, 2.36% (Liquidity Facility JPMorgan Chase Bank) (a)(c) | 6,890,000 | | 6,890,000 |
Series Putters 628, 2.36% (Liquidity Facility JPMorgan Chase Bank) (a)(c) | 7,395,000 | | 7,395,000 |
Series Putters 830, 2.36% (Liquidity Facility JPMorgan Chase Bank) (a)(c) | 15,660,000 | | 15,660,000 |
Series ROC II R1039, 2.36% (Liquidity Facility Citigroup Global Markets Hldgs., Inc.) (a)(c) | 5,835,000 | | 5,835,000 |
Series ROC II R2019, 2.36% (Liquidity Facility Citigroup Global Markets Hldgs., Inc.) (a)(c) | 10,580,000 | | 10,580,000 |
Series ROC II R3003, 2.36% (Liquidity Facility Citigroup Global Markets Hldgs., Inc.) (a)(c) | 6,690,000 | | 6,690,000 |
Series ROC II R356, 2.36% (Liquidity Facility Citibank NA) (a)(c) | 16,145,000 | | 16,145,000 |
Series ROC II R4052, 2.36% (Liquidity Facility Citigroup Global Markets Hldgs., Inc.) (a)(c) | 16,280,000 | | 16,280,000 |
Series ROC II R4556, 2.36% (Liquidity Facility Citigroup Global Markets Hldgs., Inc.) (a)(c) | 5,210,000 | | 5,210,000 |
Series 2003 1D, 2.31% (Liquidity Facility Landesbank Hess-Thuringen (GTD)), VRDN (a) | 4,400,000 | | 4,400,000 |
Series 2003 2F, 2.31% (Liquidity Facility Bayerische Landesbank Girozentrale), VRDN (a) | 5,000,000 | | 5,000,000 |
Series 2003 C5, 2.28% (Liquidity Facility Toronto-Dominion Bank), VRDN (a) | 8,300,000 | | 8,300,000 |
Niagara Frontier Trans. Auth. Arpt. Rev. Participating VRDN Series Putters 121, 2.38% (Liquidity Facility JPMorgan Chase Bank) (a)(b)(c) | 3,495,000 | | 3,495,000 |
Onondaga County Indl. Dev. Agcy. Indl. Dev. Rev. (ICM Controls Corp. Proj.) 2.48%, LOC Manufacturers & Traders Trust Co., VRDN (a)(b) | 6,360,000 | | 6,360,000 |
Oyster Bay Gen. Oblig. BAN 3.5% 1/20/06 | 20,000,000 | | 20,080,635 |
Riverhead Indl. Dev. Auth. Indl. Dev. Rev. (Adchem Corp. Facility Proj.) Series 1998, 2.37%, LOC European American Bank Uniondale, VRDN (a)(b) | 4,050,000 | | 4,050,000 |
Municipal Securities - continued |
| Principal
Amount | | Value
(Note 1) |
New York - continued |
Rochester Gen. Oblig. BAN Series I, 3.5% 3/2/06 | $ 46,040,000 | | $ 46,317,615 |
Sales Tax Asset Receivables Corp. Participating VRDN: | | | |
Series MS 984, 2.34% (Liquidity Facility Morgan Stanley) (a)(c) | 11,840,000 | | 11,840,000 |
Series Putters 564, 2.36% (Liquidity Facility JPMorgan Chase Bank) (a)(c) | 7,190,000 | | 7,190,000 |
Series Putters 599, 2.36% (Liquidity Facility JPMorgan Chase Bank) (a)(c) | 2,250,000 | | 2,250,000 |
Suffolk County Gen. Oblig. Participating VRDN Series PT 2201, 2.36% (Liquidity Facility Merrill Lynch & Co., Inc.) (a)(c) | 6,320,000 | | 6,320,000 |
Suffolk County Indl. Dev. Agcy. Civic Facility Rev. (Maryhaven Ctr. of Hope Proj.) Series 1997 A, 2.42%, LOC Key Bank NA, VRDN (a) | 1,140,000 | | 1,140,000 |
Syracuse Ind. Dev. Agcy. Civic Fac. Rev. (Crouse-Irving Hosp. Health Proj.) Series A, 2.44%, LOC Manufacturers & Traders Trust Co., VRDN (a) | 5,500,000 | | 5,500,000 |
Tobacco Settlement Fing. Corp. Participating VRDN: | | | |
Series MT 32, 2.36% (Liquidity Facility Merrill Lynch & Co., Inc.) (a)(c) | 4,995,000 | | 4,995,000 |
Series PT 1987, 2.36% (Liquidity Facility Merrill Lynch & Co., Inc.) (a)(c) | 12,855,000 | | 12,855,000 |
Series PT 1992, 2.36% (Liquidity Facility Merrill Lynch & Co., Inc.) (a)(c) | 4,980,000 | | 4,980,000 |
Series PT 2056, 2.39% (Liquidity Facility Merrill Lynch & Co., Inc.) (a)(c) | 17,955,000 | | 17,955,000 |
Series PT 835, 2.39% (Liquidity Facility Landesbank Hess-Thuringen (GTD)) (a)(c) | 25,650,000 | | 25,650,000 |
Series PT 875, 2.36% (Liquidity Facility Landesbank Hess-Thuringen (GTD)) (a)(c) | 4,450,000 | | 4,450,000 |
Series PT 893, 2.39% (Liquidity Facility DEPFA BANK PLC) (a)(c) | 43,090,000 | | 43,090,000 |
Series PT 972, 2.36% (Liquidity Facility Merrill Lynch & Co., Inc.) (a)(c) | 9,995,000 | | 9,995,000 |
Series Putters 533, 2.36% (Liquidity Facility JPMorgan Chase Bank) (a)(c) | 5,310,000 | | 5,310,000 |
Series Putters 600, 2.36% (Liquidity Facility JPMorgan Chase & Co.) (a)(c) | 5,295,000 | | 5,295,000 |
Series Putters 680, 2.36% (Liquidity Facility JPMorgan Chase & Co.) (a)(c) | 10,670,000 | | 10,670,000 |
Series ROC II R 6500, 2.37% (Liquidity Facility Citibank NA) (a)(c) | 2,640,000 | | 2,640,000 |
Series ROC II R4508, 2.37% (Liquidity Facility Citigroup Global Markets Hldgs., Inc.) (a)(c) | 5,720,000 | | 5,720,000 |
Municipal Securities - continued |
| Principal
Amount | | Value
(Note 1) |
New York - continued |
Tompkins County Indl. Dev. Agcy. Rev. (Civic Facilities Proj.) Series A, 2.43%, LOC Manufacturers & Traders Trust Co., VRDN (a) | $ 13,500,000 | | $ 13,500,000 |
Triborough Bridge & Tunnel Auth. Revs. Participating VRDN: | | | |
Series EGL 02 6024, 2.36% (Liquidity Facility Citibank NA, New York) (a)(c) | 13,690,000 | | 13,690,000 |
Series EGL 03 4, Class A, 2.36% (Liquidity Facility Citibank NA, New York) (a)(c) | 10,700,000 | | 10,700,000 |
Series EGL 03 55, 2.36% (Liquidity Facility Citibank NA, New York) (a)(c) | 13,000,000 | | 13,000,000 |
Series MS 922 2.34% (Liquidity Facility Morgan Stanley) (a)(c) | 2,195,000 | | 2,195,000 |
Series PA 1070, 2.38% (Liquidity Facility Merrill Lynch & Co., Inc.) (a)(c) | 15,995,000 | | 15,995,000 |
Series PA 1074, 2.38% (Liquidity Facility Merrill Lynch & Co., Inc.) (a)(c) | 17,400,000 | | 17,400,000 |
Series PA 948, 2.38% (Liquidity Facility Merrill Lynch & Co., Inc.) (a)(c) | 17,590,000 | | 17,590,000 |
Series PA 956, 2.38% (Liquidity Facility Merrill Lynch & Co., Inc.) (a)(c) | 8,995,000 | | 8,995,000 |
Series ROC II R1008, 2.36% (Liquidity Facility Citigroup Global Markets Hldgs., Inc.) (a)(c) | 7,545,000 | | 7,545,000 |
Series SGB 43, 2.36% (Liquidity Facility Societe Generale) (a)(c) | 3,650,000 | | 3,650,000 |
Ulster County Indl. Dev. Agcy. I (Selux Corp. Proj.) Series A, 2.48%, LOC Manufacturers & Traders Trust Co., VRDN (a)(b) | 1,000,000 | | 1,000,000 |
Upstate Telecommunications Corp. Rev. 2.38%, LOC Manufacturers & Traders Trust Co., VRDN (a) | 16,565,000 | | 16,565,000 |
| | 2,968,818,196 |
New York & New Jersey - 3.1% |
Port Auth. of New York & New Jersey: | | | |
Participating VRDN: | | | |
Series MT 56, 2.38% (Liquidity Facility BNP Paribas SA) (a)(b)(c) | 10,000,000 | | 10,000,000 |
Series PA 1251, 2.38% (Liquidity Facility Merrill Lynch & Co., Inc.) (a)(c) | 9,800,000 | | 9,800,000 |
Series PA 1271, 2.38% (Liquidity Facility Merrill Lynch & Co., Inc.) (a)(b)(c) | 1,335,000 | | 1,335,000 |
Series PA 1297, 2.38% (Liquidity Facility Merrill Lynch & Co., Inc.) (a)(b)(c) | 3,750,000 | | 3,750,000 |
Series PT 2700, 2.38% (Liquidity Facility Merrill Lynch & Co., Inc.) (a)(b)(c) | 14,640,000 | | 14,640,000 |
Municipal Securities - continued |
| Principal
Amount | | Value
(Note 1) |
New York & New Jersey - continued |
Port Auth. of New York & New Jersey: - continued | | | |
Participating VRDN: | | | |
Series Putters 153, 2.38% (Liquidity Facility JPMorgan Chase Bank) (a)(b)(c) | $ 4,000,000 | | $ 4,000,000 |
Series ROC II 238, 2.41% (Liquidity Facility Citibank NA) (a)(b)(c) | 3,460,000 | | 3,460,000 |
Series ROC II R42, 2.41% (Liquidity Facility Citibank NA) (a)(b)(c) | 6,155,000 | | 6,155,000 |
Series Stars 121, 2.38% (Liquidity Facility BNP Paribas SA) (a)(b)(c) | 6,905,000 | | 6,905,000 |
Series 1991 2, 2.41%, VRDN (a)(b)(d) | 6,400,000 | | 6,400,000 |
Series 2001 2, 2.45%, VRDN (a)(b) | 11,500,000 | | 11,500,000 |
Series 2004 2, 2.35%, VRDN (a) | 8,300,000 | | 8,300,000 |
Series 2004 3, 2.35%, VRDN (a) | 5,365,000 | | 5,365,000 |
Series 2004 4, 2.35%, VRDN (a)(b) | 3,540,000 | | 3,540,000 |
Port Auth. of New York & New Jersey Spl. Oblig. Rev. Participating VRDN: | | | |
Series Merlots 00 B5, 2.41% (Liquidity Facility Wachovia Bank NA) (a)(b)(c) | 2,260,000 | | 2,260,000 |
Series PA 1258, 2.38% (Liquidity Facility Merrill Lynch & Co., Inc.) (a)(b)(c) | 3,000,000 | | 3,000,000 |
| | 100,410,000 |
Puerto Rico - 0.7% |
Puerto Rico Commonwealth Hwy. & Trans. Auth. Trans. Rev. Participating VRDN Series Merlots C4, 2.34% (Liquidity Facility Wachovia Bank NA) (a)(c) | 11,285,000 | | 11,285,000 |
Puerto Rico Elec. Pwr. Auth. Pwr. Rev. Participating VRDN: | | | |
Series Putters 813T, 2.36% (Liquidity Facility JPMorgan Chase Bank) (a)(c) | 5,200,000 | | 5,200,000 |
Series Putters 815, 2.36% (Liquidity Facility JPMorgan Chase Bank) (a)(c) | 8,015,000 | | 8,015,000 |
| | 24,500,000 |
TOTAL INVESTMENT PORTFOLIO - 94.7% (Cost $3,093,728,196) | | 3,093,728,196 |
NET OTHER ASSETS - 5.3% | | 172,989,425 |
NET ASSETS - 100% | $ 3,266,717,621 |
Security Type Abbreviations |
BAN - BOND ANTICIPATION NOTE |
CP - COMMERCIAL PAPER |
RAN - REVENUE ANTICIPATION NOTE |
TAN - TAX ANTICIPATION NOTE |
VRDN - VARIABLE RATE DEMAND NOTE |
Legend |
(a) The coupon rate shown on floating or adjustable rate securities represents the rate at period end. |
(b) Private activity obligations whose interest is subject to the federal alternative minimum tax for individuals. |
(c) Provides evidence of ownership in one or more underlying municipal bonds. |
(d) Restricted securities - Investment in securities not registered under the Securities Act of 1933 (excluding 144A issues). At the end of the period, the value of restricted securities (excluding 144A issues) amounted to $6,400,000 or 0.2% of net assets. |
Additional information on each holding is as follows: |
Security | Acquisition
Date | Cost |
Port Auth. of New York & New Jersey Series 1991 2, 2.41%, VRDN | 12/3/03 | $ 6,400,000 |
See accompanying notes which are an integral part of the financial statements.
Semiannual Report
Fidelity New York Municipal Money Market Fund
Financial Statements
Statement of Assets and Liabilities
| July 31, 2005 (Unaudited) |
| | |
Assets | | |
Investment in securities, at value (cost $3,093,728,196) - See accompanying schedule | | $ 3,093,728,196 |
Cash | | 156,887,678 |
Receivable for fund shares sold | | 40,930,754 |
Interest receivable | | 14,894,206 |
Prepaid expenses | | 4,827 |
Other receivables | | 340,217 |
Total assets | | 3,306,785,878 |
| | |
Liabilities | | |
Payable for fund shares redeemed | $ 38,623,698 | |
Distributions payable | 56,521 | |
Accrued management fee | 1,009,686 | |
Other affiliated payables | 352,464 | |
Other payables and accrued expenses | 25,888 | |
Total liabilities | | 40,068,257 |
| | |
Net Assets | | $ 3,266,717,621 |
Net Assets consist of: | | |
Paid in capital | | $ 3,266,120,974 |
Distributions in excess of net investment income | | (2,056) |
Accumulated undistributed net realized gain (loss) on investments | | 598,703 |
Net Assets, for 3,264,319,515 shares outstanding | | $ 3,266,717,621 |
Net Asset Value, offering price and redemption price per share ($3,266,717,621 ÷ 3,264,319,515 shares) | | $ 1.00 |
See accompanying notes which are an integral part of the financial statements.
Semiannual Report
Fidelity New York Municipal Money Market Fund
Financial Statements - continued
Statement of Operations
| Six months ended July 31, 2005 (Unaudited) |
| | |
Investment Income | | |
Interest | | $ 36,809,974 |
| | |
Expenses | | |
Management fee | $ 6,137,603 | |
Transfer agent fees | 2,000,851 | |
Accounting fees and expenses | 141,821 | |
Independent trustees' compensation | 7,457 | |
Custodian fees and expenses | 25,674 | |
Registration fees | 36,377 | |
Audit | 29,836 | |
Legal | 4,271 | |
Miscellaneous | 9,952 | |
Total expenses before reductions | 8,393,842 | |
Expense reductions | (1,370,830) | 7,023,012 |
Net investment income | | 29,786,962 |
Net realized gain (loss) on investment securities | | 6,556 |
Net increase in net assets resulting from operations | | $ 29,793,518 |
See accompanying notes which are an integral part of the financial statements.
Semiannual Report
Statement of Changes in Net Assets
| Six months ended
July 31, 2005
(Unaudited) | Year ended
January 31,
2005 |
Increase (Decrease) in Net Assets | | |
Operations | | |
Net investment income | $ 29,786,962 | $ 24,094,509 |
Net realized gain (loss) | 6,556 | 1,413,026 |
Net increase in net assets resulting from operations | 29,793,518 | 25,507,535 |
Distributions to shareholders from net investment income | (29,759,067) | (24,134,841) |
Distributions to shareholders from net realized gain | (331,739) | - |
Total distributions | (30,090,806) | (24,134,841) |
Share transactions at net asset value of $1.00 per share
Proceeds from sales of shares | 4,867,826,152 | 8,221,066,689 |
Reinvestment of distributions | 29,770,992 | 23,877,146 |
Cost of shares redeemed | (4,848,509,955) | (7,834,693,170) |
Net increase (decrease) in net assets and shares resulting from share transactions | 49,087,189 | 410,250,665 |
Total increase (decrease) in net assets | 48,789,901 | 411,623,359 |
| | |
Net Assets | | |
Beginning of period | 3,217,927,720 | 2,806,304,361 |
End of period (including distributions in excess of net investment income of $2,056 and distributions in excess of net investment income of $29,951, respectively) | $ 3,266,717,621 | $ 3,217,927,720 |
See accompanying notes which are an integral part of the financial statements.
Semiannual Report
Financial Highlights
| Six months ended
July 31, 2005 | Years ended January 31, |
| (Unaudited) | 2005 | 2004 | 2003 | 2002 | 2001 |
Selected Per-Share Data | | | | | |
Net asset value, beginning of period | $ 1.00 | $ 1.00 | $ 1.00 | $ 1.00 | $ 1.00 | $ 1.00 |
Income from Investment Operations | | | | | | |
Net investment income | .009 | .008 | .006 | .010 | .021 | .035 |
Net realized and unrealized gain (loss) E | - | - | - | - | - | - |
Total from investment operations | .009 | .008 | .006 | .010 | .021 | .035 |
Distributions from net investment income | (.009) | (.008) | (.006) | (.010) | (.021) | (.035) |
Distributions from net realized gain | - E | - | - | - | - | - |
Total distributions | (.009) | (.008) | (.006) | (.010) | (.021) | (.035) |
Net asset value, end of period | $ 1.00 | $ 1.00 | $ 1.00 | $ 1.00 | $ 1.00 | $ 1.00 |
Total Return B, C | .92% | .80% | .61% | 1.02% | 2.14% | 3.61% |
Ratios to Average Net Assets D | | | | | |
Expenses before expense reductions | .52% A | .52% | .51% | .51% | .52% | .54% |
Expenses net of voluntary waivers, if any | .52% A | .52% | .51% | .51% | .52% | .54% |
Expenses net of all reductions | .43% A | .50% | .50% | .48% | .48% | .53% |
Net investment income | 1.83% A | .81% | .61% | 1.01% | 2.09% | 3.55% |
Supplemental Data | | | | | |
Net assets, end of period (000 omitted) | $ 3,266,718 | $ 3,217,928 | $ 2,806,304 | $ 2,744,750 | $ 2,465,502 | $ 1,953,480 |
A Annualized
B Total returns for periods of less than one year are not annualized.
C Total returns would have been lower had certain expenses not been reduced during the periods shown.
D Expense ratios reflect operating expenses of the fund. Expenses before reductions do not reflect amounts reimbursed by the investment adviser or reductions from brokerage service arrangements or other expense offset arrangements and do not represent the amount paid by the fund during periods when reimbursements or reductions occur. Expenses net of any voluntary waivers reflect expenses after reimbursement by the investment adviser but prior to reductions from brokerage service arrangements or other expense offset arrangements. Expenses net of all reductions represent the net expenses paid by the fund.
E Amount represents less than $.001 per share.
See accompanying notes which are an integral part of the financial statements.
Semiannual Report
Notes to Financial Statements
For the period ended July 31, 2005 (Unaudited)
1. Significant Accounting Policies.
Fidelity New York AMT Tax-Free Money Market Fund and Fidelity New York Municipal Money Market Fund (the funds) are funds of Fidelity New York Municipal Trust II (the trust). On July 21, 2005, the Board of Trustees approved a change in the name of Spartan New York Municipal Money Market Fund to Fidelity New York AMT Tax-Free Money Market Fund effective August 15, 2005. The trust is registered under the Investment Company Act of 1940, as amended (the 1940 Act), as an open-end management investment company organized as a Delaware statutory trust. Each fund is authorized to issue an unlimited number of shares. Each fund may be affected by economic and political developments in the state of New York. The financial statements have been prepared in conformity with accounting principles generally accepted in the United States of America, which require management to make certain estimates and assumptions at the date of the financial statements. The following summarizes the significant accounting policies of the funds:
Security Valuation. Net asset value per share is calculated as of the close of business of the New York Stock Exchange, normally 4:00 p.m. Eastern time. As permitted under Rule 2a-7 of the 1940 Act, and certain conditions therein, securities are valued initially at cost and thereafter assume a constant amortization to maturity of any discount or premium. Investments in open-end investment companies are valued at their net asset value each business day.
Investment Transactions and Income. Security transactions are accounted for as of trade date. Gains and losses on securities sold are determined on the basis of identified cost. Interest income is accrued as earned. Interest income includes coupon interest and amortization of premium and accretion of discount on debt securities.
Expenses. Most expenses of the trust can be directly attributed to a fund. Expenses which cannot be directly attributed are apportioned among each fund in the trust.
Income Tax Information and Distributions to Shareholders. Each year, each fund intends to qualify as a regulated investment company by distributing all of its taxable income and realized gains under Subchapter M of the Internal Revenue Code. As a result, no provision for income taxes is required in the accompanying financial statements.
Dividends are declared daily and paid monthly from net investment income. Distributions from realized gains, if any, are recorded on the ex-dividend date. Income and capital gain distributions are determined in accordance with income tax regulations, which may differ from generally accepted accounting principles. In addition, certain funds claimed a portion of the payment made to redeeming shareholders as a distribution for income tax purposes. Capital accounts within the financial statements are adjusted for permanent book-tax differences. These adjustments have no impact on net assets or the results of operations. Temporary book-tax differences will reverse in a subsequent period.
Semiannual Report
Notes to Financial Statements (Unaudited) - continued
1. Significant Accounting Policies - continued
Income Tax Information and Distributions to Shareholders - continued
Book-tax differences are primarily due to deferred trustees compensation and losses deferred due to excise tax regulations.
The fund purchases municipal securities whose interest, in the opinion of the issuer, is free from federal income tax. There is no assurance that the Internal Revenue Service (IRS) will agree with this opinion. In the event the IRS determines that the issuer does not comply with relevant tax requirements, interest payments from a security could become federally taxable, possibly retroactively to the date the security was issued.
The federal tax cost of investments and unrealized appreciation (depreciation) as of period end were as follows for each fund:
| Cost for Federal
Income Tax Purposes | Unrealized
Appreciation | Unrealized
Depreciation | Net Unrealized
Appreciation/
(Depreciation) |
Fidelity New York AMT Tax-Free Money Market Fund | $ 1,350,390,545 | $ - | $ - | $ - |
Fidelity New York Municipal Money Market Fund | 3,093,728,196 | - | - | - |
2. Operating Policies.
Restricted Securities. Certain funds may invest in securities that are subject to legal or contractual restrictions on resale. These securities generally may be resold in transactions exempt from registration or to the public if the securities are registered. Disposal of these securities may involve time-consuming negotiations and expense, and prompt sale at an acceptable price may be difficult. Information regarding restricted securities is included at the end of each applicable fund's Schedule of Investments.
3. Fees and Other Transactions with Affiliates.
Management Fee. Fidelity Management & Research Company (FMR) and its affiliates provide Fidelity New York Municipal Money Market Fund with investment management related services for which the fund pays a monthly management fee. The management fee is the sum of an individual fund fee rate that is based on an annual rate of .25% of the fund's average net assets and a group fee rate that averaged .12% during the period. The group fee rate is based upon the average net assets of all the mutual funds advised by FMR. The group fee rate decreases as assets under management increase and increases as assets under management decrease. For the period, the total annualized management fee rate was .38% of the fund's average net assets.
Semiannual Report
3. Fees and Other Transactions with Affiliates - continued
Management Fee - continued
FMR and its affiliates provide Fidelity New York AMT Tax-Free Money Market Fund the fund with investment management related services for which the fund pays a monthly management fee that is based on an annual rate of .43% of the fund's average net assets. FMR pays all other expenses, except the compensation of the independent Trustees and certain exceptions such as interest expense. The management fee paid to FMR by the fund is reduced by an amount equal to the fees and expenses paid by the fund to the independent Trustees.
Transfer Agent and Accounting Fees. Citibank, N.A. (Citibank) is the custodian, transfer agent and shareholder servicing agent for Fidelity New York Municipal Money Market Fund. Citibank has entered into a sub-arrangement with Fidelity Service Company, Inc. (FSC), an affiliate of FMR, under which FSC performs the activities associated with the fund's transfer and shareholder servicing agent and accounting functions. The fund pays account fees and asset-based fees that vary according to account size and type of account. FSC pays for typesetting, printing and mailing of shareholder reports, except proxy statements. The accounting fee is based on the level of average net assets for the month. For the period, the transfer agent fees were equivalent to an annualized rate of .12% of average net assets.
Central Funds. Certain funds may invest in affiliated Central Funds managed by Fidelity Investments Money Management, Inc. (FIMM), an affiliate of FMR. The Central Funds are open-end investment companies available only to investment companies and other accounts managed by FMR and its affiliates. The Money Market Central Funds seek preservation of capital and current income. The Central Funds do not pay a management fee. Income distributions earned by the funds are recorded as income in the accompanying financial statements. Distributions from the Central Funds are noted in the table below.
| Income
Distributions |
Fidelity New York Municipal Money Market Fund | $ 8,943 |
4. Expense Reductions.
FMR voluntarily agreed to reimburse certain funds to the extent annual operating expenses exceeded certain levels of average net assets as noted in the table below. Some expenses, for example interest expense, are excluded from this reimbursement.
The following funds were in reimbursement during the period.
| Expense
Limitations | Reimbursement
from adviser |
Fidelity New York AMT Tax-Free Money Market Fund | .40% | $ 211,240 |
Semiannual Report
Notes to Financial Statements (Unaudited) - continued
4. Expense Reductions - continued
In addition, through arrangements with each applicable fund's custodian and transfer agent, credits realized as a result of uninvested cash balances were used to reduce each applicable fund's expenses. All of the applicable expense reductions are noted in the table below.
| Brokerage Service
Arrangements | Custody
expense
reduction | Transfer
Agent
expense
reduction | Accounting
expense
reduction |
Fidelity New York Municipal Money Market Fund | $ - | $ 25,674 | $ 1,334,727 | $ 10,429 |
In addition, through an arrangement with Fidelity New York AMT Tax-Free Money Market Fund's custodian and transfer agent, $472,178 of credits realized as a result of uninvested cash balances were used to reduce the fund's management fee.
5. Other.
The funds' organizational documents provide former and current trustees and officers with a limited indemnification against liabilities arising in connection with the performance of their duties to the funds. In the normal course of business, the funds may also enter into contracts that provide general indemnifications. The funds' maximum exposure under these arrangements is unknown as this would be dependent on future claims that may be made against the funds. The risk of material loss from such claims is considered remote.
Semiannual Report
Board Approval of Investment Advisory Contracts and Management Fees
Fidelity New York AMT Tax-Free Money Market Fund (formerly Spartan New York Municipal Money Market Fund) / Fidelity New York Municipal Money Market Fund
Each year, typically in June, the Board of Trustees, including the independent Trustees (together, the Board), votes on the renewal of the management contract and sub-advisory agreements (together, the Advisory Contracts) for each fund. The Board, assisted by the advice of fund counsel and independent Trustees' counsel, requests and considers a broad range of information throughout the year.
The Board meets regularly each month except August and takes into account throughout the year matters bearing on Advisory Contracts. The Board, acting directly and through its separate committees, considers at each of its meetings factors that are relevant to the annual renewal of each fund's Advisory Contracts, including the services and support provided to each fund and its shareholders by Fidelity. At the time of the renewal, the Board had 11 standing committees, each composed of independent Trustees with varying backgrounds, to which the Board has assigned specific subject matter responsibilities in order to enhance effective decision-making by the Board. Each committee has adopted a written charter outlining the structure and purposes of the committee. One such committee, the Fixed-Income Contract Committee, meets periodically during the first six months of each year and as necessary to consider matters specifically related to the annual renewal of Advisory Contracts. The committee requests and receives information on, and makes recommendations to the independent Trustees concerning, the approval and annual review of the Advisory Contracts.
At its June 2005 meeting, the Board of Trustees, including the independent Trustees, unanimously determined to renew the Advisory Contracts for each fund. In reaching its determination, the Board considered all factors it believed relevant, including (1) the nature, extent, and quality of the services to be provided to each fund and its shareholders by Fidelity (including the investment performance of each fund); (2) the competitiveness of the management fee and total expenses of each fund; (3) the total costs of the services to be provided by and the profits to be realized by the investment adviser and its affiliates from the relationship with each fund; (4) the extent to which economies of scale would be realized as each fund grows; and (5) whether fee levels reflect these economies of scale, if any, for the benefit of fund shareholders.
In determining whether to renew the Advisory Contracts for each fund, the Board ultimately reached a determination, with the assistance of fund counsel and independent Trustees' counsel, that the renewal of the Advisory Contracts and the compensation to be received by Fidelity under the management contracts is consistent with Fidelity's fiduciary duty under applicable law. In addition to evaluating the specific factors noted above, the Board, in reaching its determination, is aware that shareholders in each fund have a broad range of investment choices available to them, including a wide choice among mutual funds offered by competitors to Fidelity, and that each fund's shareholders, with the opportunity to review and weigh the disclosure provided by the fund in its prospectus and other public disclosures, have chosen to invest in that fund, managed by Fidelity.
Semiannual Report
Board Approval of Investment Advisory Contracts and
Management Fees - continued
Nature, Extent, and Quality of Services Provided by Fidelity. The Board considered staffing within the investment adviser, FMR, and the sub-advisers (together, the Investment Advisers), including the backgrounds of the funds' portfolio managers and the funds' investment objectives and disciplines. The independent Trustees also had discussions with senior management of Fidelity's investment operations and investment groups. The Board considered the structure of the portfolio manager compensation program and whether this structure provides appropriate incentives.
Fidelity Resources Dedicated to Investment Management and Support Services. The Board reviewed the size, education, and experience of the Investment Advisers' investment staff, their use of technology, and the Investment Advisers' approach to recruiting, training, and retaining portfolio managers and other research, advisory, and management personnel. The Board considered Fidelity's extensive global research capabilities that enable the Investment Advisers to aggregate data from various sources in an effort to produce positive investment results. The Board noted that Fidelity's analysts have access to a variety of technological tools that enable them to perform both fundamental and quantitative analysis and to specialize in various disciplines. The Board also considered that Fidelity's portfolio managers and analysts have access to daily portfolio attribution that allows for monitoring of a fund's portfolio, as well as an electronic communication system that provides immediate real-time access to research concerning issuers and credit enhancers.
Shareholder and Administrative Services. The Board considered the nature, extent, quality, and cost of administrative, distribution, and shareholder services performed by the Investment Advisers and their affiliates under the Advisory Contracts and under separate agreements covering transfer agency and pricing and bookkeeping services for each fund. The Board also considered the nature and extent of the Investment Advisers' supervision of third party service providers, principally custodians and subcustodians. The Board also considered the resources devoted to, and the record of compliance with, each fund's compliance policies and procedures.
The Board noted that the growth of fund assets across the complex allows Fidelity to reinvest in the development of services designed to enhance the value or convenience of the Fidelity funds as investment vehicles. These services include 24-hour access to account information and market information through phone representatives and over the Internet, and investor education materials and asset allocation tools.
Investment in a Large Fund Family. The Board considered the benefits to shareholders of investing in a Fidelity fund, including the benefits of investing in a fund that is part of a large family of funds offering a variety of investment disciplines and providing for a large variety of mutual fund investor services. For example, fund shareholders are offered the privilege of exchanging shares of a fund for shares of other Fidelity funds, as set forth in the fund's prospectus, without paying a sales charge. The Board noted that, since the last Advisory Contract renewals in June 2004, Fidelity has taken a number of actions that benefited particular funds, including (i) voluntarily deciding in 2004 to stop using "soft" commission dollars to pay for market data and, instead, to pay for that data out of its own resources, (ii) contractually agreeing to impose management fee reductions and expense limitations on its five Spartan stock index funds and its stock index fund available through variable insurance products, (iii) contractually agreeing to eliminate the management fees on the Fidelity Freedom Funds and the Fidelity Advisor Freedom Funds,(iv) contractually agreeing to reduce the management fees on most of its investment-grade taxable bond funds, and (v) contractually agreeing to impose expense limitations on its retail and Spartan investment-grade taxable bond funds.
Semiannual Report
Investment Performance. The Board considered whether each fund has operated within its investment objective, as well as its record of compliance with its investment restrictions. It also reviewed each fund's absolute investment performance, as well as each fund's relative investment performance measured against a peer group of mutual funds deemed appropriate by the Board over multiple periods. For each fund, the following charts considered by the Board show, over the one-, three-, and five-year periods ended December 31, 2004, the fund's returns and a range of returns of a peer group of mutual funds identified by Lipper Inc. as having an investment objective similar to that of the fund. The box within each chart shows the 25th percentile return (bottom of box) and the 75th percentile return (top of box) of the Lipper peer group. The percentage beaten number noted below each chart corresponds to the percentile box and represents the percentage of funds in the Lipper peer group whose performance was equal to or lower than that of the fund.
Semiannual Report
Board Approval of Investment Advisory Contracts and
Management Fees - continued
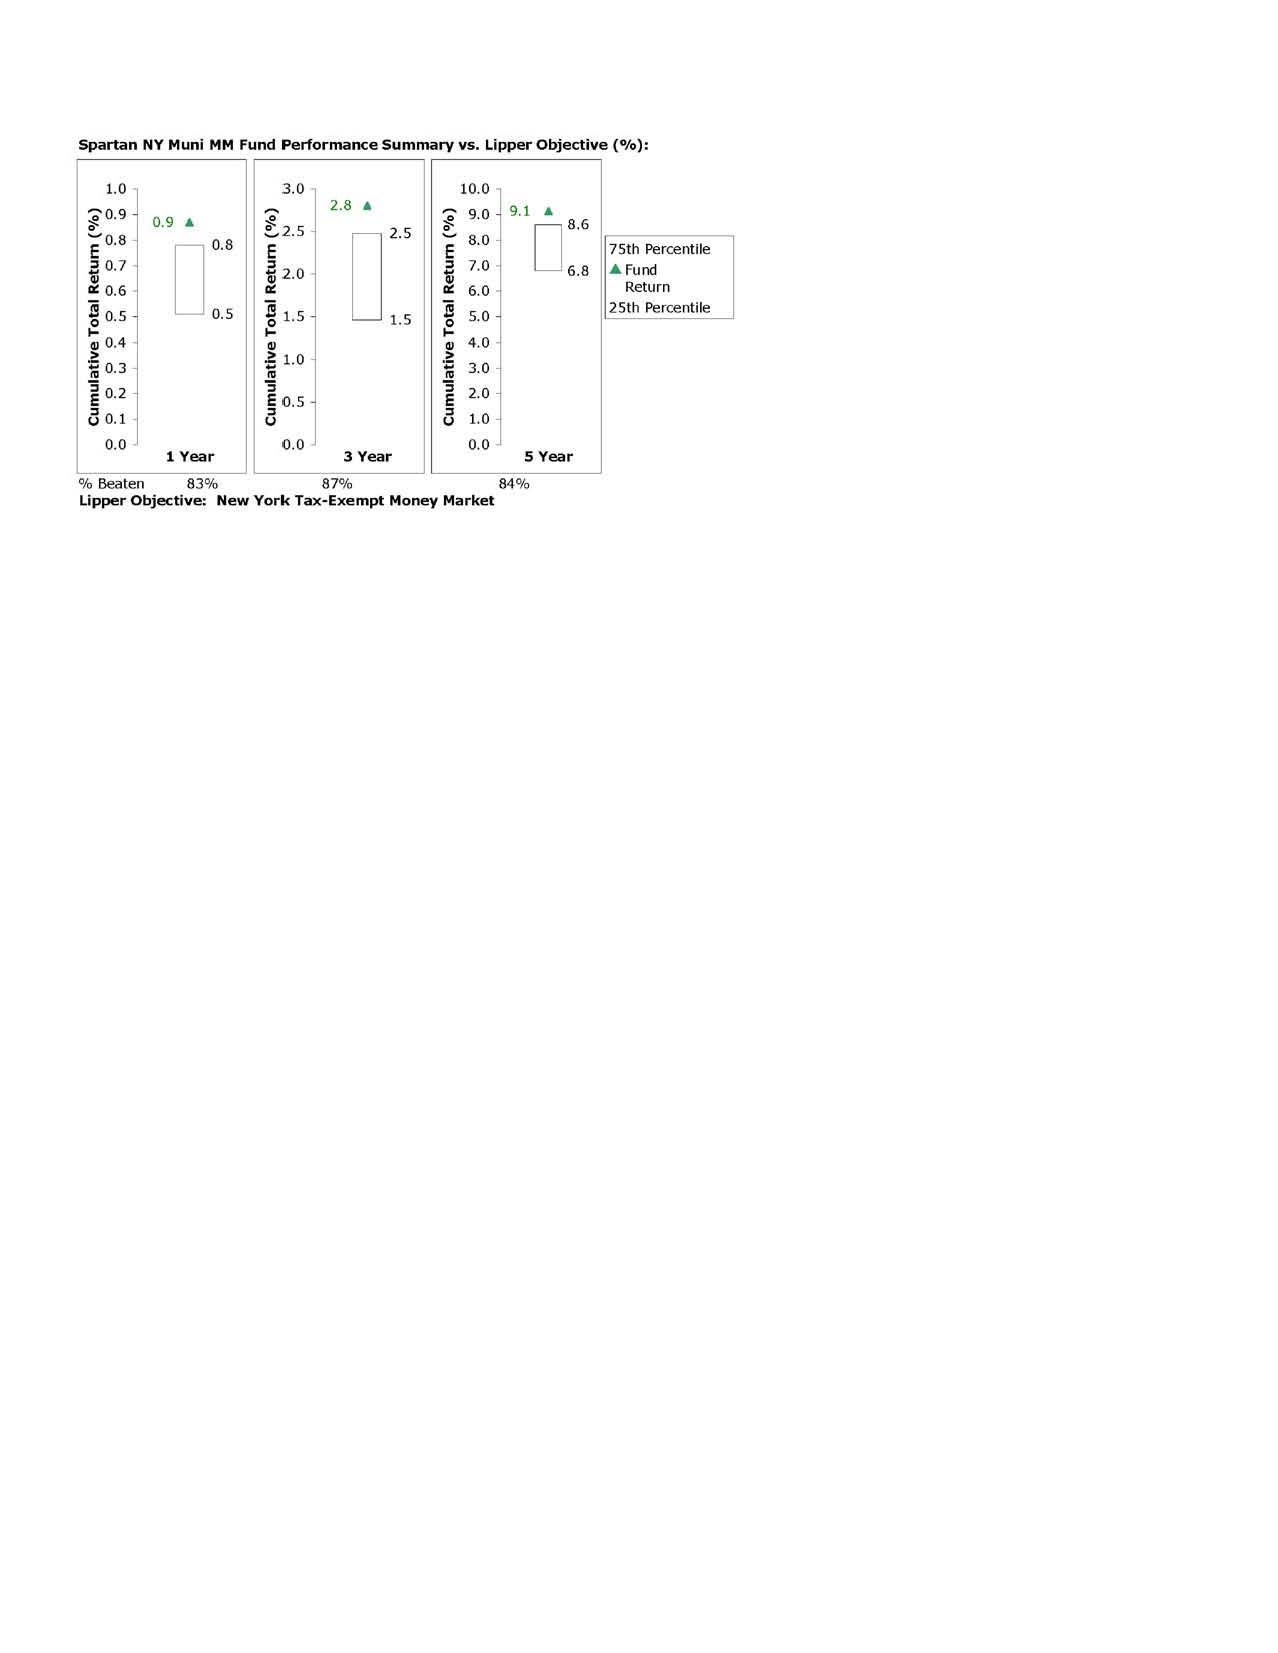

The Board noted that the relative investment performance of each fund has compared favorably to its Lipper peer group over time.
Based on its review, and giving particular weight to the nature and quality of the resources dedicated by the Investment Advisers to maintain and improve relative performance, the Board concluded that the nature, extent, and quality of the services provided by Fidelity will benefit each fund's shareholders, particularly in light of the Board's view that each fund's shareholders benefit from investing in a fund that is part of a large family of funds offering a variety of investment disciplines and services.
Semiannual Report
Competitiveness of Management Fee and Total Fund Expenses. The Board considered each fund's management fee and total expenses compared to "mapped groups" of competitive funds and classes. Fidelity creates "mapped groups" by combining similar Lipper investment objective categories that have comparable management fee characteristics. Combining Lipper investment objective categories aids the Board's management fee and total expense comparisons by broadening the competitive group used for comparison and by reducing the number of universes to which various Fidelity funds are compared.
The Board considered two proprietary management fee comparisons for the 12-month periods shown in the charts below. The group of Lipper funds used by the Board for management fee comparisons is referred to below as the "Total Mapped Group" and, for the reasons explained above, is broader than the Lipper peer group used by the Board for performance comparisons. The Total Mapped Group comparison focuses on a fund's standing relative to the total universe of comparable funds available to investors, in terms of gross management fees before expense reimbursements or caps. "TMG %" represents the percentage of funds in the Total Mapped Group that had management fees that were lower than a fund's. For example, a TMG % of 24% would mean that 76% of the funds in the Total Mapped Group had higher management fees than a fund. The "Asset-Size Peer Group" (ASPG) comparison focuses on a fund's standing relative to non-Fidelity funds similar in size to the fund within the Total Mapped Group. The ASPG represents at least 15% of the funds in the Total Mapped Group with comparable asset size and management fee characteristics, subject to a minimum of 50 funds (or all funds in the Total Mapped Group if fewer than 50). Additional information, such as the ASPG quartile ("quadrant") in which a fund's management fee ranked, is also included in the charts and considered by the Board. For a more meaningful comparison of management fees, Spartan New York Municipal Money Market Fund is compared on the basis of a hypothetical "net management fee," which is derived by subtracting payments made by FMR for non-management expenses (including transfer agent fees, pricing and bookkeeping fees, and custody fees) from the fund's all-inclusive fee. In this regard, the Board realizes that net management fees can vary from year to year because of differences in non-management expenses.
Semiannual Report
Board Approval of Investment Advisory Contracts and
Management Fees - continued
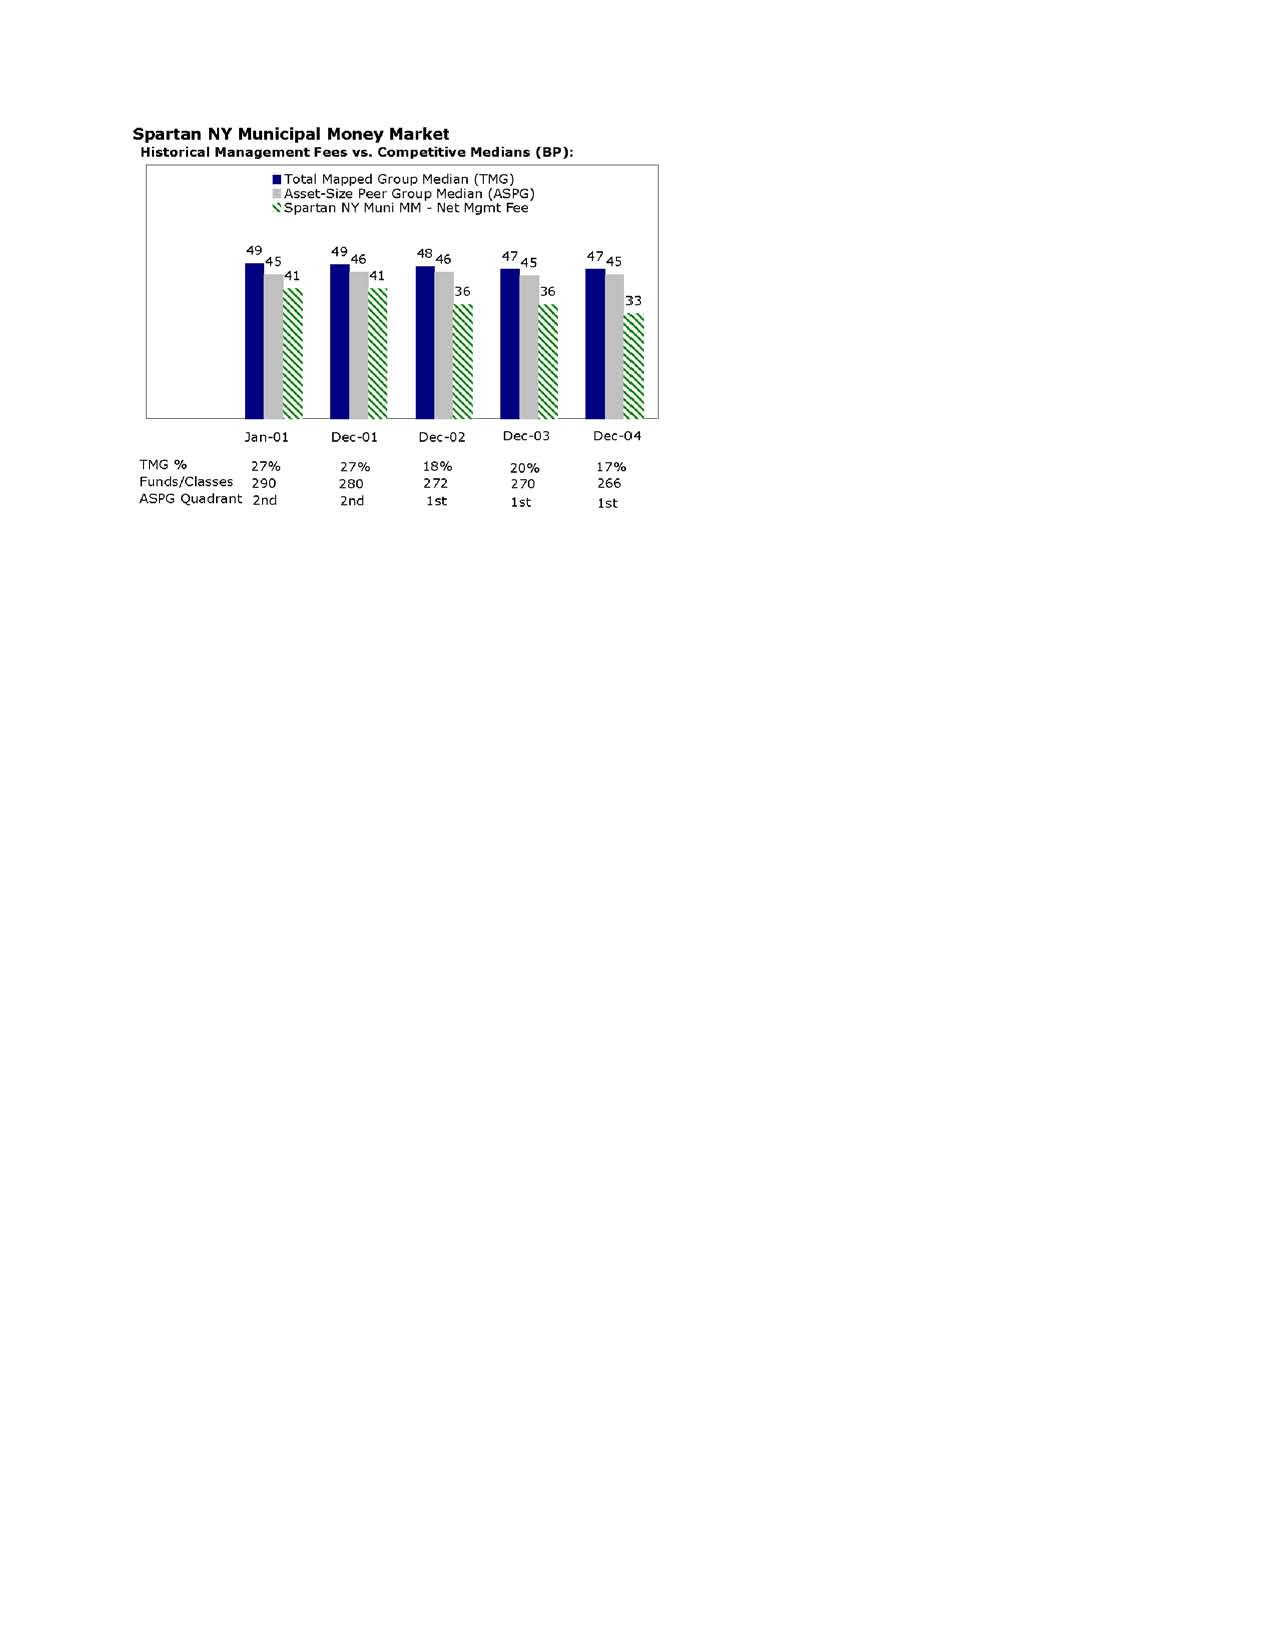
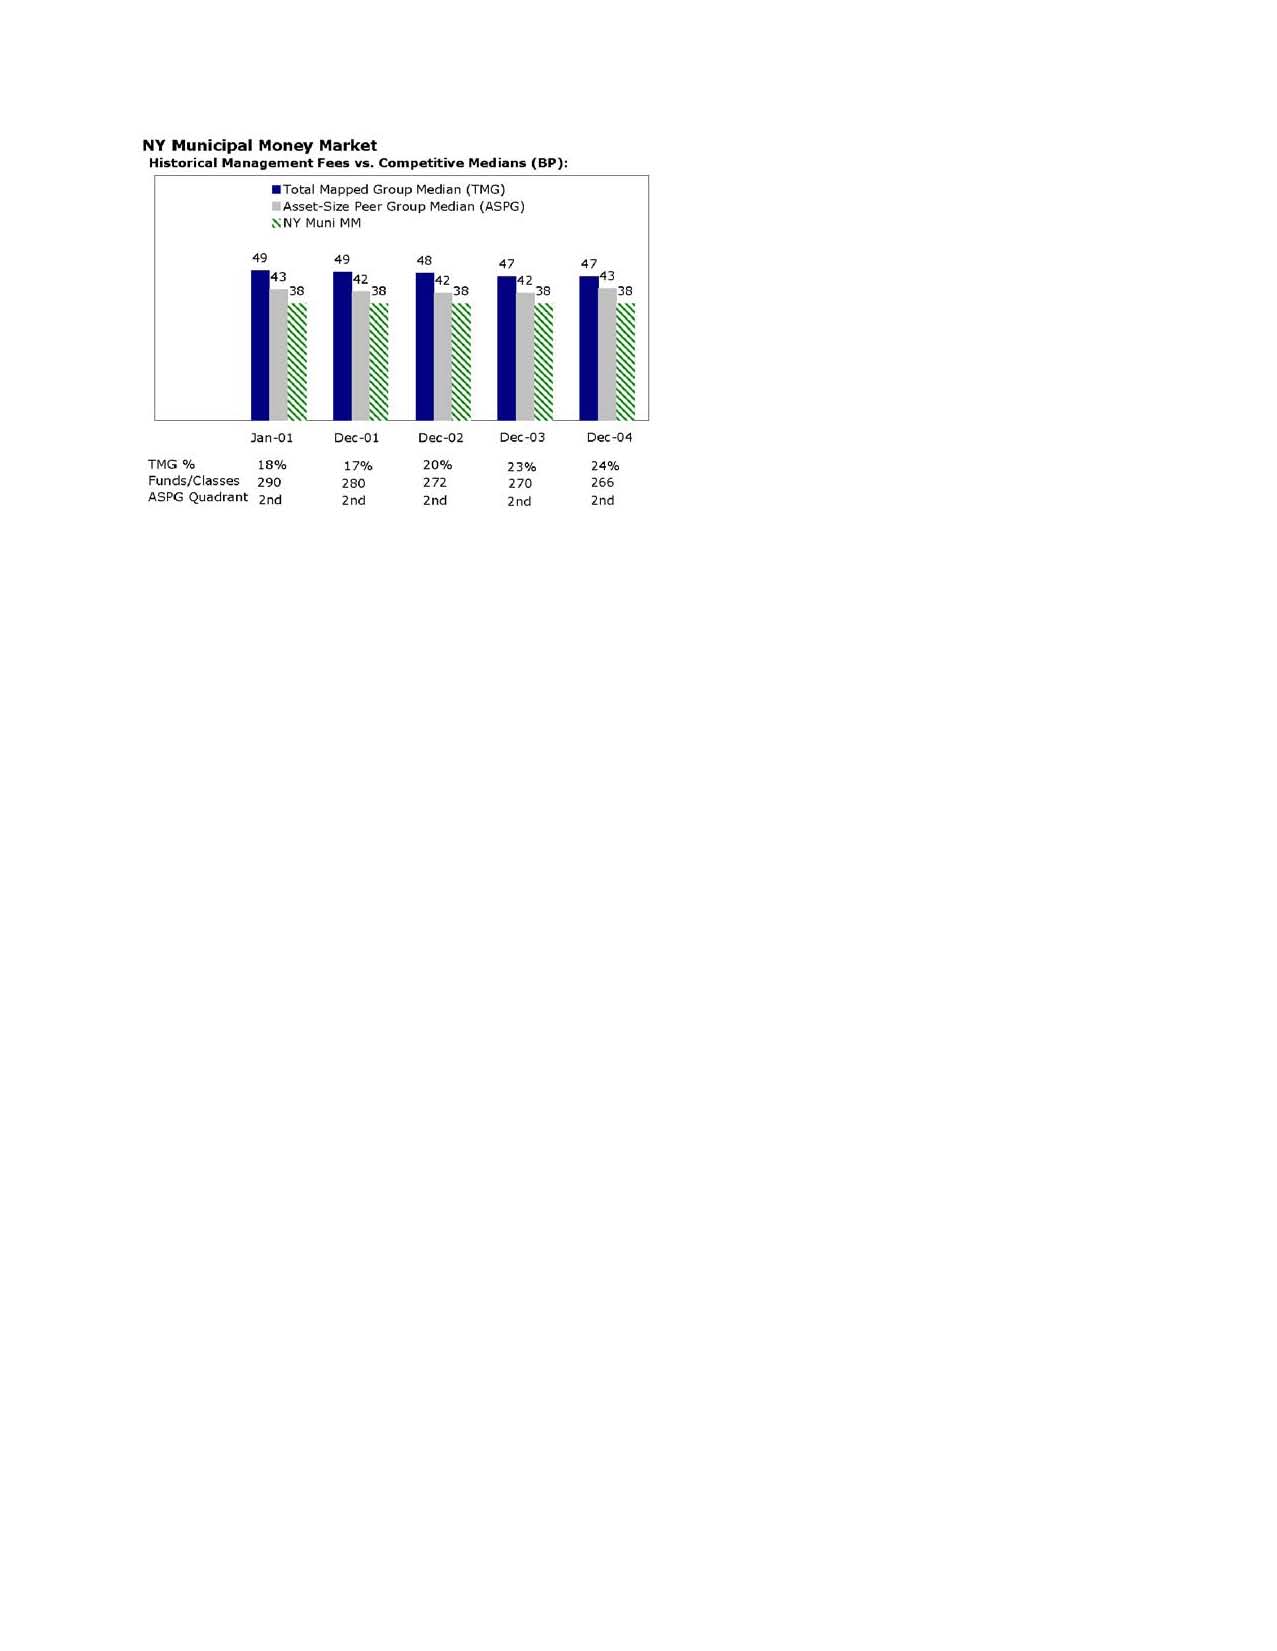
The Board noted that each fund's management fee ranked below the median of its Total Mapped Group and below the median of its ASPG for 2004. Based on its review, the Board concluded that each fund's management fee was fair and reasonable in light of the services that the fund receives and the other factors considered.
In its review of Spartan New York Municipal Money Market Fund's total expenses, the Board considered the fund's hypothetical net management fee as well as the fund's all-inclusive fee. The Board also considered other expenses, such as transfer agent fees, pricing and bookkeeping fees, and custodial, legal, and audit fees, paid by FMR under the all-inclusive arrangement. The Board also noted the effects of any waivers and reimbursements on fees and expenses.
Semiannual Report
In its review of Fidelity New York Municipal Money Market Fund's total expenses, the Board considered the fund's management fee as well as other fund expenses, such as transfer agent fees, pricing and bookkeeping fees, and custodial, legal, and audit fees. The Board also noted the effects of any waivers and reimbursements on fees and expenses.
As part of its review, the Board also considered current and historical total expenses of each fund compared to competitive fund median expenses. Each fund is compared to those funds and classes in the Total Mapped Group (used by the Board for management fee comparisons) that have a similar sales load structure.
The Board noted that each fund's total expenses ranked below its competitive median for 2004.
In its review of total expenses, the Board also considered Fidelity fee structures and other information on clients that FMR and its affiliates service in other competitive markets, such as other mutual funds advised or subadvised by FMR or its affiliates, pension plan clients, and other institutional clients.
Based on its review, the Board concluded that each fund's total expenses were reasonable in light of the services that the fund and its shareholders receive and the other factors considered.
Costs of the Services and Profitability. The Board considered the revenues earned and the expenses incurred by Fidelity in conducting the business of developing, marketing, distributing, managing, administering and servicing each fund and its shareholders. The Board also considered the level of Fidelity's profits in respect of all the Fidelity funds.
On an annual basis, FMR presents to the Board Fidelity's profitability for each fund. Fidelity calculates the profitability for each fund, as well as aggregate profitability for groups of Fidelity funds and all Fidelity funds, using a series of detailed revenue and cost allocation methodologies which originate with the audited books and records of Fidelity. The Audit Committee of the Board reviews any significant changes from the prior year's methodologies.
PricewaterhouseCoopers LLP (PwC), independent registered accounting firm and auditor to Fidelity and certain Fidelity funds, has been engaged annually by the Board as part of the Board's assessment of the results of Fidelity's profitability analysis. PwC's engagement includes the review and assessment of Fidelity's methodologies used in determining the revenues and expenses attributable to Fidelity's mutual fund business, and completion of agreed-upon procedures surrounding the mathematical accuracy of fund profitability and its conformity to allocation methodologies. After considering PwC's reports issued under the engagement and information provided by Fidelity, the Board believes that while other allocation methods may also be reasonable, Fidelity's profitability methodologies are reasonable in all material respects.
Semiannual Report
Board Approval of Investment Advisory Contracts and
Management Fees - continued
The Board has also reviewed Fidelity's non-fund businesses and any fall-out benefits related to the mutual fund business as well as cases where Fidelity's affiliates may benefit from or be related to the funds' business. In addition, a special committee of the Board reviewed services provided to Fidelity by its affiliates and determined that the fees that Fidelity paid for such services were reasonable.
The Board considered the costs of the services provided by and the profits realized by Fidelity in connection with the operation of each fund and determined that the amount of profit is a fair entrepreneurial profit for the management of each fund.
Economies of Scale. The Board considered whether there have been economies of scale in respect of the management of the Fidelity funds, whether the Fidelity funds (including each fund) have appropriately benefited from any such economies of scale, and whether there is potential for realization of any further economies of scale. The Board considered the extent to which each fund will benefit from economies of scale through increased services to the fund, through waivers or reimbursements, or through fee or expense reductions, including (Fidelity New York Municipal Money Market Fund only) reductions that occur through operation of the transfer agent agreement. The transfer agent fee varies in part based on the number of accounts in the fund. If the number of accounts decreases or the average account size increases, the overall transfer agent fee rate decreases.
The Board recognized that Fidelity New York Municipal Money Market Fund's management contract incorporates a "group fee" structure, which provides for lower fee rates as total fund assets under FMR's management increase, and for higher fee rates as total fund assets under FMR's management decrease. The Board considered that the group fee is designed to deliver the benefits of economies of scale to fund shareholders when total fund assets increase, even if assets of any particular fund are unchanged or have declined, because some portion of Fidelity's costs are attributable to services provided to all Fidelity funds, and all funds benefit if those costs can be allocated among more assets. The Board concluded that, given the group fee structure, fund shareholders will achieve a certain level of economies of scale as assets under FMR's management increase at the fund complex level, regardless of whether Fidelity achieves any such economies of scale.
The Board further concluded that any potential economies of scale are being shared between fund shareholders and Fidelity in an appropriate manner.
Additional Information Requested by the Board. In order to develop fully the factual basis for consideration of the Advisory Contracts, the Board requested additional information regarding (i) Fidelity's fund profitability methodology, including additional detail on various cost allocations; (ii) fall-out benefits to Fidelity; and (iii) compensation of portfolio managers and research analysts.
Semiannual Report
Based on its evaluation of all of the conclusions noted above, and after considering all material factors, the Board ultimately concluded that the existing advisory fee structures are fair and reasonable, and that each fund's existing Advisory Contracts should be renewed.
Semiannual Report
Managing Your Investments
Fidelity offers several ways to conveniently manage your personal investments via your telephone or PC. You can access your account information, conduct trades and research your investments 24 hours a day.
By Phone
Fidelity Automated Service Telephone provides a single toll-free number to access account balances, positions, quotes and trading. It's easy to navigate the service, and on your first call, the system will help you create a personal identification number (PIN) for security.
(phone_graphic)
Fidelity Automated
Service Telephone (FAST®)
1-800-544-5555
Press
1 For mutual fund and brokerage trading.
2 For quotes.*
3 For account balances and holdings.
4 To review orders and mutual
fund activity.
5 To change your PIN.
*0 To speak to a Fidelity representative.
By PC
Fidelity's web site on the Internet provides a wide range of information, including daily financial news, fund performance, interactive planning tools and news about Fidelity products and services.
(computer_graphic)
Fidelity's Web Site
www.fidelity.com
* When you call the quotes line, please remember that a fund's yield and return will vary and, except for money market funds, share price will also vary. This means that you may have a gain or loss when you sell your shares. There is no assurance that money market funds will be able to maintain a stable $1 share price; an investment in a money market fund is not insured or guaranteed by the U.S. government. Total returns are historical and include changes in share price, reinvestment of dividends and capital gains, and the effects of any sales charges.
Semiannual Report
To Write Fidelity
We'll give your correspondence immediate attention and send you written confirmation upon completion of your request.
(letter_graphic)
Making Changes
To Your Account
(such as changing name, address, bank, etc.)
Fidelity Investments
P.O. Box 770001
Cincinnati, OH 45277-0002
(letter_graphic)
For Non-Retirement
Accounts
Buying shares
Fidelity Investments
P.O. Box 770001
Cincinnati, OH 45277-0003
Overnight Express
Fidelity Investments
Attn: Distribution Services
100 Crosby Parkway - KC1H
Covington, KY 41015
Selling shares
Fidelity Investments
P.O. Box 770001
Cincinnati, OH 45277-0035
Overnight Express
Fidelity Investments
Attn: Distribution Services
100 Crosby Parkway - KC1H
Covington, KY 41015
General Correspondence
Fidelity Investments
P.O. Box 500
Merrimack, NH 03054-0500
(letter_graphic)
For Retirement
Accounts
Buying shares
Fidelity Investments
P.O. Box 770001
Cincinnati, OH 45277-0003
Selling shares
Fidelity Investments
P.O. Box 770001
Cincinnati, OH 45277-0035
Overnight Express
Fidelity Investments
Attn: Distribution Services
100 Crosby Parkway - KC1H
Covington, KY 41015
General Correspondence
Fidelity Investments
P.O. Box 500
Merrimack, NH 03054-0500
Semiannual Report
To Visit Fidelity
For directions and hours,
please call 1-800-544-9797.
Arizona
7001 West Ray Road
Chandler, AZ
7373 N. Scottsdale Road
Scottsdale, AZ
California
815 East Birch Street
Brea, CA
1411 Chapin Avenue
Burlingame, CA
851 East Hamilton Avenue
Campbell, CA
19200 Von Karman Avenue
Irvine, CA
601 Larkspur Landing Circle
Larkspur, CA
10100 Santa Monica Blvd.
Los Angeles, CA
27101 Puerta Real
Mission Viejo, CA
73-575 El Paseo
Palm Desert, CA
251 University Avenue
Palo Alto, CA
123 South Lake Avenue
Pasadena, CA
16995 Bernardo Ctr. Drive
Rancho Bernardo, CA
1740 Arden Way
Sacramento, CA
7676 Hazard Center Drive
San Diego, CA
8 Montgomery Street
San Francisco, CA
3793 State Street
Santa Barbara, CA
21701 Hawthorne Boulevard
Torrance, CA
2001 North Main Street
Walnut Creek, CA
6300 Canoga Avenue
Woodland Hills, CA
Colorado
1625 Broadway
Denver, CO
9185 East Westview Road
Littleton, CO
Connecticut
48 West Putnam Avenue
Greenwich, CT
265 Church Street
New Haven, CT
300 Atlantic Street
Stamford, CT
29 South Main Street
West Hartford, CT
Delaware
222 Delaware Avenue
Wilmington, DE
Florida
4400 N. Federal Highway
Boca Raton, FL
121 Alhambra Plaza
Coral Gables, FL
2948 N. Federal Highway
Ft. Lauderdale, FL
1907 West State Road 434
Longwood, FL
8880 Tamiami Trail, North
Naples, FL
3550 Tamiami Trail, South
Sarasota, FL
1502 N. Westshore Blvd.
Tampa, FL
2465 State Road 7
Wellington, FL
3501 PGA Boulevard
West Palm Beach, FL
Georgia
3445 Peachtree Road, N.E.
Atlanta, GA
1000 Abernathy Road
Atlanta, GA
Illinois
One North LaSalle Street
Chicago, IL
875 North Michigan Ave.
Chicago, IL
1415 West 22nd Street
Oak Brook, IL
1700 East Golf Road
Schaumburg, IL
3232 Lake Avenue
Wilmette, IL
Indiana
4729 East 82nd Street
Indianapolis, IN
Kansas
5400 College Boulevard
Overland Park, KS
Maine
Three Canal Plaza
Portland, ME
Maryland
7315 Wisconsin Avenue
Bethesda, MD
One W. Pennsylvania Ave.
Towson, MD
Massachusetts
801 Boylston Street
Boston, MA
155 Congress Street
Boston, MA
300 Granite Street
Braintree, MA
44 Mall Road
Burlington, MA
405 Cochituate Road
Framingham, MA
416 Belmont Street
Worcester, MA
Michigan
500 E. Eisenhower Pkwy.
Ann Arbor, MI
280 Old N. Woodward Ave.
Birmingham, MI
43420 Grand River Avenue
Novi, MI
29155 Northwestern Hwy.
Southfield, MI
Minnesota
7600 France Avenue South
Edina, MN
Missouri
8885 Ladue Road
Ladue, MO
Semiannual Report
Nevada
2225 Village Walk Drive
Henderson, NV
New Jersey
150 Essex Street
Millburn, NJ
56 South Street
Morristown, NJ
396 Route 17, North
Paramus, NJ
3518 Route 1 North
Princeton, NJ
530 Highway 35
Shrewsbury, NJ
New York
1055 Franklin Avenue
Garden City, NY
37 West Jericho Turnpike
Huntington Station, NY
1271 Avenue of the Americas
New York, NY
61 Broadway
New York, NY
350 Park Avenue
New York, NY
200 Fifth Avenue
New York, NY
733 Third Avenue
New York, NY
11 Penn Plaza
New York, NY
2070 Broadway
New York, NY
1075 Northern Blvd.
Roslyn, NY
North Carolina
4611 Sharon Road
Charlotte, NC
Ohio
3805 Edwards Road
Cincinnati, OH
1324 Polaris Parkway
Columbus, OH
28699 Chagrin Boulevard
Woodmere Village, OH
Oregon
16850 SW 72nd Avenue
Tigard, OR
Pennsylvania
600 West DeKalb Pike
King of Prussia, PA
1735 Market Street
Philadelphia, PA
12001 Perry Highway
Wexford, PA
Rhode Island
47 Providence Place
Providence, RI
Tennessee
6150 Poplar Avenue
Memphis, TN
Texas
10000 Research Boulevard
Austin, TX
4001 Northwest Parkway
Dallas, TX
12532 Memorial Drive
Houston, TX
2701 Drexel Drive
Houston, TX
6500 N. MacArthur Blvd.
Irving, TX
6005 West Park Boulevard
Plano, TX
14100 San Pedro
San Antonio, TX
1576 East Southlake Blvd.
Southlake, TX
19740 IH 45 North
Spring, TX
Utah
215 South State Street
Salt Lake City, UT
Virginia
1861 International Drive
McLean, VA
Washington
411 108th Avenue, N.E.
Bellevue, WA
1518 6th Avenue
Seattle, WA
Washington, DC
1900 K Street, N.W.
Washington, DC
Wisconsin
595 North Barker Road
Brookfield, WI
Fidelity Brokerage Services, Inc., 100 Summer St., Boston, MA 02110 Member NYSE/SIPC
Semiannual Report
Semiannual Report
Semiannual Report
Investment Adviser
Fidelity Management & Research
Company
Boston, MA
Investment Sub-Advisers
Fidelity Investments
Money Management, Inc.
Fidelity International Investment Advisors
Fidelity International Investment Advisors
(U.K.) Limited
General Distributor
Fidelity Distributors Corporation
Boston, MA
Transfer and Service Agents
Citibank, N.A.
New York, NY
Fidelity Service Company, Inc.
Boston, MA
Custodian
Citibank, N.A.
New York, NY
The Fidelity Telephone Connection
Mutual Fund 24-Hour Service
Exchanges/Redemptions
and Account Assistance 1-800-544-6666
Product Information 1-800-544-6666
Retirement Accounts 1-800-544-4774 (8 a.m. - 9 p.m.)
TDD Service 1-800-544-0118
for the deaf and hearing impaired
(9 a.m. - 9 p.m. Eastern time)
Fidelity Automated Service
Telephone (FAST®) (automated graphic) 1-800-544-5555
(automated graphic) Automated line for quickest service
NYS-USAN-0905
1.789294.102
(Fidelity Investment logo)(registered trademark)
Corporate Headquarters
82 Devonshire St., Boston, MA 02109
www.fidelity.com
Item 2. Code of Ethics
Not applicable.
Item 3. Audit Committee Financial Expert
Not applicable.
Item 4. Principal Accountant Fees and Services
Not applicable.
Item 5. Audit Committee of Listed Registrants
Not applicable.
Item 6. Schedule of Investments
Not applicable.
Item 7. Disclosure of Proxy Voting Policies and Procedures for Closed-End Management Investment Companies
Not applicable.
Item 8. Portfolio Managers of Closed-End Management Investment Companies
Not applicable.
Item 9. Purchase of Equity Securities by Closed-End Management Investment Company and Affiliated Purchasers
Not applicable.
Item 10. Submission of Matters to a Vote of Security Holders
There were no material changes to the procedures by which shareholders may recommend nominees to the Fidelity New York Municipal Trust II's Board of Trustees.
Item 11. Controls and Procedures
(a)(i) The President and Treasurer and the Chief Financial Officer have concluded that the Fidelity New York Municipal Trust II's (the "Trust") disclosure controls and procedures (as defined in Rule 30a-3(c) under the Investment Company Act) provide reasonable assurances that material information relating to the Trust is made known to them by the appropriate persons, based on their evaluation of these controls and procedures as of a date within 90 days of the filing date of this report.
(a)(ii) There was no change in the Trust's internal control over financial reporting (as defined in Rule 30a-3(d) under the Investment Company Act) that occurred during the second fiscal quarter of the period covered by this report that has materially affected, or is reasonably likely to materially affect, the Trust's internal control over financial reporting.
Item 12. Exhibits
(a) | (1) | Not applicable. |
(a) | (2) | Certification pursuant to Rule 30a-2(a) under the Investment Company Act of 1940 (17 CFR 270.30a-2(a)) is filed and attached hereto as Exhibit 99.CERT. |
(a) | (3) | Not applicable. |
(b) | | Certification pursuant to Rule 30a-2(b) under the Investment Company Act of 1940 (17 CFR 270.30a-2(b)) is furnished and attached hereto as Exhibit 99.906CERT. |
SIGNATURES
Pursuant to the requirements of the Securities Exchange Act of 1934 and the Investment Company Act of 1940, the registrant has duly caused this report to be signed on its behalf by the undersigned, thereunto duly authorized.
Fidelity New York Municipal Trust II
By: | /s/Christine Reynolds |
| Christine Reynolds |
| President and Treasurer |
| |
Date: | September 9, 2005 |
Pursuant to the requirements of the Securities Exchange Act of 1934 and the Investment Company Act of 1940, this report has been signed below by the following persons on behalf of the registrant and in the capacities and on the dates indicated.
By: | /s/Christine Reynolds |
| Christine Reynolds |
| President and Treasurer |
| |
Date: | September 9, 2005 |
By: | /s/Timothy F. Hayes |
| Timothy F. Hayes |
| Chief Financial Officer |
| |
Date: | September 9, 2005 |