UNITED STATES
SECURITIES AND EXCHANGE COMMISSION
Washington, D.C. 20549
FORM N-CSR
CERTIFIED SHAREHOLDER REPORT OF REGISTERED
MANAGEMENT INVESTMENT COMPANIES
Investment Company Act file number 811-6398
Fidelity New York Municipal Trust II
(Exact name of registrant as specified in charter)
82 Devonshire St., Boston, Massachusetts 02109
(Address of principal executive offices) (Zip code)
Eric D. Roiter, Secretary
82 Devonshire St.
Boston, Massachusetts 02109
(Name and address of agent for service)
Registrant's telephone number, including area code: 617-563-7000
Date of fiscal year end: | January 31 |
| |
Date of reporting period: | January 31, 2006 |
Item 1. Reports to Stockholders
| | Fidelity® New York AMT Tax-Free
Money Market Fund
(formerly Spartan® New York Municipal
Money Market Fund)
and
Fidelity New York Municipal
Money Market Fund
|
| | Annual Report
January 31, 2006
|


| Contents | | | | |
| |
| Chairman’s Message | | 4 | | Ned Johnson’s message to shareholders. |
| Shareholder Expense | | 5 | | An example of shareholder expenses. |
| Example | | | | |
| Fidelity New York AMT Tax-Free Money Market Fund |
| | | 7 | | Investment Changes |
| | | 8 | | Investments |
| | | 20 | | Financial Statements |
| Fidelity New York Municipal Money Market Fund |
| | | 24 | | Investment Changes |
| | | 25 | | Investments |
| | | 41 | | Financial Statements |
| Notes | | 45 | | Notes to the financial statements |
| Report of Independent | | 50 | | |
| Registered Public | | | | |
| Accounting Firm | | | | |
| Trustees and Officers | | 52 | | |
| Distributions | | 63 | | |
| Proxy Voting Results | | 64 | | |
| Board Approval of | | 65 | | |
| Investment Advisory | | | | |
| Contracts and | | | | |
| Management Fees | | | | |
To view a fund’s proxy voting guidelines and proxy voting record for the 12 month period
ended June 30, visit www.fidelity.com/proxyvotingresults or visit the Securities and Exchange
Commission’s (SEC) web site at www.sec.gov. You may also call 1-800-544-8544 to request a free
copy of the proxy voting guidelines.
Standard & Poor’s, S&P and S&P 500 are registered service marks of The McGraw Hill Companies, Inc.
and have been licensed for use by Fidelity Distributors Corporation.
Other third party marks appearing herein are the property of their respective owners.
All other marks appearing herein are registered or unregistered trademarks or service marks
of FMR Corp. or an affiliated company.
|
Annual Report 2
This report and the financial statements contained herein are submitted for the general
information of the shareholders of the funds. This report is not authorized for distribution to
prospective investors in the funds unless preceded or accompanied by an effective prospectus.
A fund files its complete schedule of portfolio holdings with the SEC for the first and third
quarters of each fiscal year on Form N Q. Forms N Q are available on the SEC’s web site at
http://www.sec.gov. A fund’s Forms N Q may be reviewed and copied at the SEC’s Public
Reference Room in Washington, DC. Information regarding the operation of the SEC’s Public
Reference Room may be obtained by calling 1-800-SEC-0330. For a complete list of a fund’s port
folio holdings, view the most recent quarterly holdings report, semiannual report, or annual
report on Fidelity’s web site at http://www.fidelity.com/holdings.
NOT FDIC INSURED · MAY LOSE VALUE · NO BANK GUARANTEE
Neither the funds nor Fidelity Distributors Corporation is a bank.
|
3 Annual Report
Chairman’s Message
(photograph of Edward C. Johnson 3d)
Dear Shareholder:
During the past year or so, much has been reported about the mutual fund industry, and much of it has been more critical than I believe is warranted. Allegations that some companies have been less than forthright with their shareholders have cast a shadow on the entire industry. I continue to find these reports disturbing, and assert that they do not create an accurate picture of the industry overall. Therefore, I would like to remind every one where Fidelity stands on these issues. I will say two things specifically regarding allegations that some mutual fund companies were in violation of the Securities and Exchange Commission’s forward pricing rules or were involved in so called “market timing” activities.
First, Fidelity has no agreements that permit customers who buy fund shares after 4 p.m. to obtain the 4 p.m. price. This is not a new policy. This is not to say that some one could not deceive the company through fraudulent acts. However, we are extremely diligent in preventing fraud from occurring in this manner and in every other. But I underscore again that Fidelity has no so called “agreements” that sanction illegal practices.
Second, Fidelity continues to stand on record, as we have for years, in opposition to predatory short term trading that adversely affects shareholders in a mutual fund. Back in the 1980s, we initiated a fee which is returned to the fund and, therefore, to investors to discourage this activity. Further, we took the lead several years ago in developing a Fair Value Pricing Policy to prevent market timing on foreign securities in our funds. I am confident we will find other ways to make it more difficult for predatory traders to operate. However, this will only be achieved through close cooperation among regulators, legislators and the industry.
Yes, there have been unfortunate instances of unethical and illegal activity within the mutual fund industry from time to time. That is true of any industry. When this occurs, confessed or convicted offenders should be dealt with appropriately. But we are still concerned about the risk of over regulation and the quick application of simplistic solutions to intricate problems. Every system can be improved, and we support and applaud well thought out improvements by regulators, legislators and industry representatives that achieve the common goal of building and protecting the value of investors’ holdings.
For nearly 60 years, Fidelity has worked very hard to improve its products and service to justify your trust. When our family founded this company in 1946, we had only a few hundred customers. Today, we serve more than 18 million customers including individual investors and participants in retirement plans across America.
Let me close by saying that we do not take your trust in us for granted, and we realize that we must always work to improve all aspects of our service to you. In turn, we urge you to continue your active participation with your financial matters, so that your interests can be well served.
Best regards,
/s/ Edward C. Johnson 3d
Edward C. Johnson 3d
Annual Report 4
Shareholder Expense Example
As a shareholder of a Fund, you incur two types of costs: (1) transaction costs, and (2) ongoing costs, including management fees and other Fund expenses. This Example is intended to help you understand your ongoing costs (in dollars) of investing in the Funds and to compare these costs with the ongoing costs of investing in other mutual funds. The Example is based on an investment of $1,000 invested at the beginning of the period and held for the entire period (August 1, 2005 to January 31, 2006).
The first line of the table below for each fund provides information about actual account values and actual expenses. You may use the information in this line, together with the amount you invested, to estimate the expenses that you paid over the period. Simply divide your account value by $1,000.00 (for example, an $8,600 account value divided by $1,000.00 = 8.6), then multiply the result by the number in the first line for a fund under the heading entitled “Expenses Paid During Period” to estimate the expenses you paid on your account during this period. A small balance maintenance fee of $12.00 that is charged once a year may apply for certain accounts with a value of less than $2,000. This fee is not included in the table below. If it was, the estimate of expenses you paid during the period would be higher, and your ending account value lower, by this amount.
Hypothetical Example for Comparison Purposes
The second line of the table below for each fund provides information about hypothetical account values and hypothetical expenses based on a fund’s actual expense ratio and an assumed rate of return of 5% per year before expenses, which is not the Fund’s actual return. The hypothetical account values and expenses may not be used to estimate the actual ending account balance or expenses you paid for the period. You may use this information to compare the ongoing costs of investing in the Fund and other funds. To do so, compare this 5% hypothetical example with the 5% hypothetical examples that appear in the shareholder reports of the other funds. A small balance maintenance fee of $12.00 that is charged once a year may apply for certain accounts with a value of less than $2,000. This fee is not included in the table below. If it was, the estimate of expenses you paid during the period would be higher, and your ending account value lower, by this amount. Please note that the expenses shown in the table are meant to highlight your ongoing costs only and do not reflect any transaction costs. Therefore, the second line of the table is useful in comparing ongoing costs only, and will not help you determine the relative total costs of owning different funds.
5 Annual Report
| Shareholder Expense Example continued | | | | |
| |
| |
| | | | | | | | | | | Expenses Paid |
| | | | | Beginning | | | | Ending | | During Period* |
| | | | | Account Value | | | | Account Value | | August 1, 2005 |
| | | | | August 1, 2005 | | | | January 31, 2006 | | to January 31, 2006 |
| Fidelity New York AMT Tax Free | | | | | | | | | | | | |
| Money Market Fund | | | | | | | | | | | | |
| Actual | | | $ | 1,000.00 | | | $ | 1,012.20 | | $ | | 2.03 |
| HypotheticalA | | | $ | 1,000.00 | | | $ | 1,023.19 | | $ | | 2.04 |
| Fidelity New York Municipal | | | | | | | | | | | | |
| Money Market Fund | | | | | | | | | | | | |
| Actual | | | $ | 1,000.00 | | | $ | 1,011.70 | | $ | | 2.59 |
| HypotheticalA | | | $ | 1,000.00 | | | $ | 1,022.63 | | $ | | 2.60 |
| |
| A 5% return per year before expenses | | | | | | | | |
* Expenses are equal to each Fund’s annualized expense ratio (shown in the table below); multiplied by the average account value over the period, multiplied by 184/365 (to reflect the one half year period).
| | | Annualized |
| | | Expense Ratio |
| Fidelity New York AMT Tax Free Money Market Fund | | 40% |
| Fidelity New York Municipal Money Market Fund | | 51% |
| Fidelity New York AMT Tax Free Money Market Fund | | |
| Investment Changes | | | | | | |
| |
| Maturity Diversification | | | | | | |
| Days | | % of fund’s | | % of fund’s | | % of fund’s |
| | | investments | | investments | | investments |
| | | 1/31/06 | | 7/31/05 | | 1/31/05 |
| 0 – 30 | | 84.8 | | 93.6 | | 84.3 |
| 31 – 90 | | 6.7 | | 2.6 | | 12.6 |
| 91 – 180 | | 1.6 | | 1.0 | | 0.9 |
| 181 – 397 | | 6.9 | | 2.8 | | 2.2 |
| Weighted Average Maturity | | | | | | |
| | | 1/31/06 | | 7/31/05 | | 1/31/05 |
| Fidelity New York AMT Tax Free Money | | | | | | |
| Market Fund | | 29 Days | | 17 Days | | 19 Days |
| New York Tax Free Money Market Funds | | | | | | |
| Average* | | 26 Days | | 24 Days | | 28 Days |
| Current and Historical Seven Day Yields | | | | | | |
| | | 1/30/06 | | 10/31/05 | | 8/1/05 | | 5/2/05 | | 1/31/05 |
| Fidelity New York AMT Tax Free | | | | | | | | | | |
| Money Market Fund | | 2.64% | | 2.32% | | 1.99% | | 2.51% | | 1.46% |
| If Fidelity had not reimbursed | | | | | | | | | | |
| certain fund expenses | | 2.62% | | 2.30% | | 1.97% | | 2.48% | | 1.43% |
Yield refers to the income paid by the fund over a given period. Yields for money market funds are usually for seven day periods, as they are here, though they are expressed as annual percentage rates. Past performance is no guarantee of future results. Yield will vary and it is possible to lose money by investing in the fund.
*Source: iMoneyNet, Inc.
7 Annual Report
| Fidelity New York AMT Tax Free Money Market Fund | | | | |
| Investments January 31, 2006 | | | | |
| Showing Percentage of Net Assets | | | | | | | | |
| Municipal Securities 95.8% | | | | | | | | |
| | | | | Principal | | | | Value |
| | | | | Amount | | | | (Note 1) |
| New York – 94.2% | | | | | | | | |
| Allegany County BAN 4% 9/27/06, LOC DEPFA BANK PLC . | | $ 5,365,000 | | | | $ 5,400,647 |
| Bank of New York Muni. Ctfs. trust various states Bonds Series | | | | | | |
| BNY 05 4, 3.13%, tender 4/25/06 (Liquidity Facility Bank | | | | | | |
| of New York, New York) (a)(b)(c) | | | | 6,800,000 | | | | 6,800,000 |
| Battery Park City Auth. Rev. Participating VRDN Series ROC II | | | | | | |
| R4531, 3.06% (Liquidity Facility Citigroup Global Markets | | | | | | |
| Hldgs., Inc.) (a)(b) | | | | 5,285,000 | | | | 5,285,000 |
| Dutchess County Indl. Dev. Agcy. Civic Facility Rev. (Lutheran | | | | | | |
| Ctr. at Poughkeepsie, Inc. Proj.) 3.02%, LOC Key Bank NA, | | | | | | |
| VRDN (a) | | | | 3,930,000 | | | | 3,930,000 |
| Eclipse Fdg. Trust Participating VRDN Series Solar 05 05, | | | | | | |
| 3.05% (Liquidity Facility U.S. Bank NA, Minnesota) (a)(b) | | 6,300,000 | | | | 6,300,000 |
| Erie County Indl. Dev. Agcy. School Facility Rev. Participating | | | | | | |
| VRDN Series TOC 05 J, 3.05% (Liquidity Facility Goldman | | | | | | |
| Sachs Group, Inc.) (a)(b) | | | | 12,220,000 | | | | 12,220,000 |
| Erie County Tobacco Asset Securitization Corp. Participating | | | | | | |
| VRDN Series PA 1339, 3.1% (Liquidity Facility Merrill Lynch | | | | | | |
| & Co., Inc.) (a)(b) | | | | 7,970,000 | | | | 7,970,000 |
| Farmingdale Union Free School District TAN 4% 6/29/06 | | 15,000,000 | | | | 15,042,319 |
| Lancaster Indl. Dev. Agcy. Civic Facilities Rev. (Greenfield | | | | | | |
| Manor Proj.) 3.06%, LOC Manufacturers & Traders Trust | | | | | | |
| Co., VRDN (a) | | | | 6,640,000 | | | | 6,640,000 |
| Liberty Dev. Corp. Rev. Participating VRDN: | | | | | | |
| Series Austin 05 Q, 3.06% (Liquidity Facility Bank of | | | | | | |
| America NA) (a)(b) | | | | 17,100,000 | | | | 17,100,000 |
| Series MS 1183, 3.04% (Liquidity Facility Morgan | | | | | | |
| Stanley) (a)(b) | | | | 15,530,000 | | | | 15,530,000 |
| Series MS 1188, 3.04% (Liquidity Facility Morgan | | | | | | |
| Stanley) (a)(b) | | | | 5,830,000 | | | | 5,830,000 |
| Series MS 1207, 3.04% (Liquidity Facility Morgan | | | | | | |
| Stanley) (a)(b) | | | | 8,000,000 | | | | 8,000,000 |
| Metropolitan Trans. Auth. Dedicated Tax Fund Participating | | | | | | |
| VRDN: | | | | | | | | |
| Series EGL 01 3205, 3.06% (Liquidity Facility Citibank NA, | | | | | | |
| New York) (a)(b) | | | | 12,300,000 | | | | 12,300,000 |
| Series EGL 98 3203, 3.06% (Liquidity Facility Citibank NA, | | | | | | |
| New York) (a)(b) | | | | 4,900,000 | | | | 4,900,000 |
| Series EGL 98 3204, 3.06% (Liquidity Facility Citibank NA, | | | | | | |
| New York) (a)(b) | | | | 4,100,000 | | | | 4,100,000 |
| Series PA 1098, 3.05% (Liquidity Facility Merrill Lynch & | | | | | | |
| Co., Inc.) (a)(b) | | | | 1,400,000 | | | | 1,400,000 |
| Metropolitan Trans. Auth. Rev.: | | | | | | | | |
| Bonds Series 2005 C, 4% 11/15/06 | | | | 3,650,000 | | | | 3,673,778 |
| |
| |
| See accompanying notes which are an integral part of the financial statements. | | | | |
| |
| Annual Report | | 8 | | | | | | |
| Municipal Securities continued | | | | | | |
| | | Principal | | | | Value |
| | | Amount | | | | (Note 1) |
| New York – continued | | | | | | |
| Metropolitan Trans. Auth. Rev.: – continued | | | | | | |
| Participating VRDN: | | | | | | |
| Series EGL 03 51, 3.06% (Liquidity Facility Citibank NA, | | | | | | |
| New York) (a)(b) | | $ 5,145,000 | | | | $ 5,145,000 |
| Series EGL 7053019, 3.06% (Liquidity Facility Citibank | | | | | | |
| NA) (a)(b) | | 6,100,000 | | | | 6,100,000 |
| Series FRRI 02 F, 3.05% (Liquidity Facility Bank of New | | | | | | |
| York, New York) (a)(b) | | 1,600,000 | | | | 1,600,000 |
| Series MS 724X, 3.04% (Liquidity Facility Morgan | | | | | | |
| Stanley) (a)(b) | | 3,000,000 | | | | 3,000,000 |
| Series MSTC 7001, 3% (Liquidity Facility Bear Stearns | | | | | | |
| Companies, Inc.) (a)(b) | | 2,500,000 | | | | 2,500,000 |
| Series PA 1036, 3.05% (Liquidity Facility Merrill Lynch & | | | | | | |
| Co., Inc.) (a)(b) | | 2,995,000 | | | | 2,995,000 |
| Series PA 1040, 3.05% (Liquidity Facility Merrill Lynch & | | | | | | |
| Co., Inc.) (a)(b) | | 5,400,000 | | | | 5,400,000 |
| Series PT 1946, 3.05% (Liquidity Facility Merrill Lynch & | | | | | | |
| Co., Inc.) (a)(b) | | 11,605,000 | | | | 11,605,000 |
| Series PT 1969, 3.05% (Liquidity Facility Merrill Lynch & | | | | | | |
| Co., Inc.) (a)(b) | | 5,245,000 | | | | 5,245,000 |
| Series Putters 989, 3.06% (Liquidity Facility JPMorgan | | | | | | |
| Chase Bank) (a)(b) | | 6,295,000 | | | | 6,295,000 |
| Metropolitan Trans. Auth. Svc. Contract Rev. Participating | | | | | | |
| VRDN: | | | | | | |
| Series Merlots 02 A43, 3.05% (Liquidity Facility Wachovia | | | | | | |
| Bank NA) (a)(b) | | 2,355,000 | | | | 2,355,000 |
| Series PT 1968, 3.05% (Liquidity Facility Merrill Lynch & | | | | | | |
| Co., Inc.) (a)(b) | | 8,555,000 | | | | 8,555,000 |
| Metropolitan Trans. Auth. Transit Facilities Rev. Participating | | | | | | |
| VRDN Series Merlots 00 F, 3.05% (Liquidity Facility | | | | | | |
| Wachovia Bank NA) (a)(b) | | 11,000,000 | | | | 11,000,000 |
| New York City Gen. Oblig.: | | | | | | |
| Bonds Series 2005 G, 4% 8/1/06 | | 10,550,000 | | | | 10,588,277 |
| Participating VRDN: | | | | | | |
| Series CRVS 05 22, 3.05% (Liquidity Facility Landesbank | | | | | | |
| Hessen-Thuringen) (a)(b) | | 4,700,000 | | | | 4,700,000 |
| Series DB 167, 3.05% (Liquidity Facility Deutsche Bank | | | | | | |
| AG) (a)(b) | | 8,700,000 | | | | 8,700,000 |
| Series DB 173, 3.05% (Liquidity Facility Deutsche Bank | | | | | | |
| AG) (a)(b) | | 10,865,000 | | | | 10,865,000 |
| Series DB 178, 3.05% (Liquidity Facility Deutsche Bank | | | | | | |
| AG) (a)(b) | | 13,700,000 | | | | 13,700,000 |
See accompanying notes which are an integral part of the financial statements.
| Fidelity New York AMT Tax Free Money Market Fund | | | | |
| Investments continued | | | | | | |
| |
| Municipal Securities continued | | | | | | |
| | | Principal | | | | Value |
| | | Amount | | | | (Note 1) |
| New York – continued | | | | | | |
| New York City Gen. Oblig.: – continued | | | | | | |
| Participating VRDN: | | | | | | |
| Series LB 05 FP09, 3.13% (Lehman Brothers Hldgs., Inc. | | | | | | |
| Guaranteed) (Liquidity Facility Lehman Brothers Hldgs., | | | | | | |
| Inc.) (a)(b) | | $ 7,700,000 | | | | $ 7,700,000 |
| Series MS 01 525, 3.04% (Liquidity Facility Morgan | | | | | | |
| Stanley) (a)(b) | | 5,910,000 | | | | 5,910,000 |
| Series MS 1062, 3.04% (Liquidity Facility Morgan | | | | | | |
| Stanley) (a)(b) | | 2,200,000 | | | | 2,200,000 |
| Series PA 1336, 3.08% (Liquidity Facility Merrill Lynch & | | | | | | |
| Co., Inc.) (a)(b) | | 6,700,000 | | | | 6,700,000 |
| Series PT 2203, 3.05% (Liquidity Facility Merrill Lynch & | | | | | | |
| Co., Inc.) (a)(b) | | 4,950,000 | | | | 4,950,000 |
| Series PT 2480, 3.08% (Liquidity Facility Dexia Cr. Local | | | | | | |
| de France) (a)(b) | | 4,920,000 | | | | 4,920,000 |
| Series PT 2615, 3.08% (Liquidity Facility Dexia Cr. Local | | | | | | |
| de France) (a)(b) | | 2,450,000 | | | | 2,450,000 |
| Series PT 2848, 3.08% (Liquidity Facility Dexia Cr. Local | | | | | | |
| de France) (a)(b) | | 1,795,000 | | | | 1,795,000 |
| Series PT 3069, 3.05% (Liquidity Facility Merrill Lynch & | | | | | | |
| Co., Inc.) (a)(b) | | 5,600,000 | | | | 5,600,000 |
| Series PT 3171, 3.05% (Liquidity Facility Merrill Lynch & | | | | | | |
| Co., Inc.) (a)(b) | | 3,000,000 | | | | 3,000,000 |
| Series PT 3256, 3.08% (Liquidity Facility Merrill Lynch & | | | | | | |
| Co., Inc.) (a)(b) | | 6,400,000 | | | | 6,400,000 |
| Series PT 405, 3.05% (Liquidity Facility DEPFA BANK | | | | | | |
| PLC) (a)(b) | | 9,245,000 | | | | 9,245,000 |
| Series PT 962, 3.05% (Liquidity Facility Landesbank | | | | | | |
| Hessen-Thuringen) (a)(b) | | 2,000,000 | | | | 2,000,000 |
| Series PT 991, 3.05% (Liquidity Facility BNP Paribas | | | | | | |
| SA) (a)(b) | | 10,000,000 | | | | 10,000,000 |
| Series Putters 1087, 3.06% (Liquidity Facility JPMorgan | | | | | | |
| Chase Bank) (a)(b) | | 17,585,000 | | | | 17,585,000 |
| Series Putters 1088, 3.06% (Liquidity Facility JPMorgan | | | | | | |
| Chase Bank) (a)(b) | | 13,880,000 | | | | 13,880,000 |
| Series Putters 1236, 3.06% (Liquidity Facility JPMorgan | | | | | | |
| Chase Bank) (a)(b) | | 2,200,000 | | | | 2,200,000 |
| Series Putters 933, 3.06% (Liquidity Facility JPMorgan | | | | | | |
| Chase Bank) (a)(b) | | 9,495,000 | | | | 9,495,000 |
| Series ROC II R251, 3.09% (Citigroup Global Markets | | | | | | |
| Hldgs., Inc. Guaranteed) (Liquidity Facility Citigroup | | | | | | |
| Global Markets Hldgs., Inc.) (a)(b) | | 22,600,000 | | | | 22,600,000 |
| Series ROC II R389, 3.06% (Liquidity Facility Citibank | | | | | | |
| NA) (a)(b) | | 7,000,000 | | | | 7,000,000 |
See accompanying notes which are an integral part of the financial statements. | | | | |
| |
| Annual Report | | 10 | | | | |
| Municipal Securities continued | | | | | | |
| | | Principal | | | | Value |
| | | Amount | | | | (Note 1) |
| New York – continued | | | | | | |
| New York City Gen. Oblig.: – continued | | | | | | |
| Participating VRDN: | | | | | | |
| Series ROC II R4563, 3.06% (Liquidity Facility Citigroup | | | | | | |
| Global Markets Hldgs., Inc.) (a)(b) | | $ 5,445,000 | | | | $ 5,445,000 |
| Series ROC II R6026, 3.06% (Liquidity Facility Citibank | | | | | | |
| NA) (a)(b) | | 1,580,000 | | | | 1,580,000 |
| Series SGB 35, 3% (Liquidity Facility Societe | | | | | | |
| Generale) (a)(b) | | 13,000,000 | | | | 13,000,000 |
| Series 1994 A4, 3.02%, LOC Bayerische Landesbank | | | | | | |
| Girozentrale, VRDN (a) | | 2,600,000 | | | | 2,600,000 |
| Series 2002 A7, 3.03% (AMBAC Insured), VRDN (a) | | 30,000 | | | | 30,000 |
| New York City Hsg. Dev. Corp. Multi-family Rev. Series A: | | | | | | |
| 3.03%, LOC Fleet Nat’l. Bank, VRDN (a) | | 20,000,000 | | | | 20,000,000 |
| 3.03%, LOC HSBC Bank USA, VRDN (a) | | 5,400,000 | | | | 5,400,000 |
| New York City Indl. Dev. Agcy. Civic Facility Rev.: | | | | | | |
| (Lycee Francais de New York Proj.) Series 2002 B, 3.03%, | | | | | | |
| LOC JPMorgan Chase Bank, VRDN (a) | | 2,530,000 | | | | 2,530,000 |
| (The Birch Wathen Lenox School Proj.) 3.05%, LOC Allied | | | | | | |
| Irish Banks PLC, VRDN (a) | | 2,625,000 | | | | 2,625,000 |
| New York City Indl. Dev. Agcy. Rev. (One Bryant Park LLC | | | | | | |
| Proj.): | | | | | | |
| Series A, 3.07%, LOC Bank of America NA, LOC Citibank | | | | | | |
| NA, VRDN (a) | | 10,000,000 | | | | 10,000,000 |
| Series B, 3.1%, LOC Bank of America NA, LOC Citibank | | | | | | |
| NA, VRDN (a) | | 37,600,000 | | | | 37,600,000 |
| New York City Muni. Wtr. Fin. Auth. Wtr. & Swr. Sys. Rev.: | | | | | | |
| Participating VRDN: | | | | | | |
| Series EGL 7050053, 3.06% (Liquidity Facility Citibank | | | | | | |
| NA) (a)(b) | | 6,300,000 | | | | 6,300,000 |
| Series MS 1105, 3.04% (Liquidity Facility Morgan | | | | | | |
| Stanley) (a)(b) | | 3,660,000 | | | | 3,660,000 |
| Series PA 1022, 3.07% (Liquidity Facility Merrill Lynch & | | | | | | |
| Co., Inc.) (a)(b) | | 9,000,000 | | | | 9,000,000 |
| Series PA 921, 3.07% (Liquidity Facility Merrill Lynch & | | | | | | |
| Co., Inc.) (a)(b) | | 25,970,000 | | | | 25,970,000 |
| Series PA 960, 3.07% (Liquidity Facility Merrill Lynch & | | | | | | |
| Co., Inc.) (a)(b) | | 4,295,000 | | | | 4,295,000 |
| Series Putters 297, 3.06% (Liquidity Facility JPMorgan | | | | | | |
| Chase Bank) (a)(b) | | 7,520,000 | | | | 7,520,000 |
| Series ROC II R3, 3.06% (Liquidity Facility Citibank | | | | | | |
| NA) (a)(b) | | 5,000,000 | | | | 5,000,000 |
| Series ROC II R406, 3.06% (Liquidity Facility Citibank | | | | | | |
| NA) (a)(b) | | 5,000,000 | | | | 5,000,000 |
See accompanying notes which are an integral part of the financial statements.
11 Annual Report
| Fidelity New York AMT Tax Free Money Market Fund | | | | |
| Investments continued | | | | | | | | |
| |
| Municipal Securities continued | | | | | | |
| | | | | Principal | | | | Value |
| | | | | Amount | | | | (Note 1) |
| New York – continued | | | | | | | | |
| New York City Muni. Wtr. Fin. Auth. Wtr. & Swr. Sys. Rev.: - | | | | | | |
| continued | | | | | | | | |
| Participating VRDN: | | | | | | | | |
| Series SGB 25, 3.06% (Liquidity Facility Societe | | | | | | |
| Generale) (a)(b) | | | | $ 13,200,000 | | | | $ 13,200,000 |
| Series 1, 3.14% 4/13/06 (Liquidity Facility Dexia Cr. Local | | | | | | |
| de France) (Liquidity Facility JPMorgan Chase Bank), CP . | | 14,800,000 | | | | 14,800,000 |
| Series 2003 7, 3.05% 2/7/06, CP | | | | 20,000,000 | | | | 20,000,000 |
| Series 5B: | | | | | | | | |
| 3.1% 4/13/06 (Liquidity Facility Bayerische Landesbank | | | | | | |
| Girozentrale) (Liquidity Facility WestLB AG), CP | | 8,900,000 | | | | 8,900,000 |
| 3.13% 4/10/06 (Liquidity Facility Bayerische Landesbank | | | | | | |
| Girozentrale) (Liquidity Facility WestLB AG), CP | | 7,500,000 | | | | 7,500,000 |
| Series 6, 3.1% 3/8/06 (Liquidity Facility Landesbank | | | | | | |
| Baden-Wuert) (Liquidity Facility Landesbank | | | | | | |
| Hessen-Thuringen), CP | | | | 13,800,000 | | | | 13,800,000 |
| New York City Transitional Fin. Auth. Rev. Participating VRDN | | | | | | |
| Series MSTC 02 202, 3.02% (Liquidity Facility Bear Stearns | | | | | | |
| Companies, Inc.) (a)(b) | | | | 1,000,000 | | | | 1,000,000 |
| New York City Trust Cultural Resources Rev. Participating | | | | | | |
| VRDN: | | | | | | | | |
| Series MS 950, 3.04% (Liquidity Facility Morgan | | | | | | |
| Stanley) (a)(b) | | | | 1,500,000 | | | | 1,500,000 |
| Series SGA 91, 3.05% (Liquidity Facility Societe | | | | | | |
| Generale) (a)(b) | | | | 3,600,000 | | | | 3,600,000 |
| New York Counties Tobacco Trust II Participating VRDN Series | | | | | | |
| PA 1347, 3.1% (Liquidity Facility Merrill Lynch & Co., | | | | | | |
| Inc.) (a)(b) | | | | 6,815,000 | | | | 6,815,000 |
| New York Local Govt. Assistance Corp.: | | | | | | | | |
| Bonds Series PT 410, 3.25%, tender 10/26/06 (Liquidity | | | | | | |
| Facility Lloyds TSB Bank PLC) (a)(b)(c) | | | | 5,800,000 | | | | 5,800,000 |
| Participating VRDN Series SG 99, 3.05% (Liquidity Facility | | | | | | |
| Societe Generale) (a)(b) | | | | 16,200,000 | | | | 16,200,000 |
| New York State Dorm. Auth. Revs.: | | | | | | | | |
| Participating VRDN: | | | | | | | | |
| Series BA 01 D, 3.06% (Liquidity Facility Bank of America | | | | | | |
| NA) (a)(b) | | | | 1,000,000 | | | | 1,000,000 |
| Series EGL 7050004, 3.06% (Liquidity Facility Citibank | | | | | | |
| NA) (a)(b) | | | | 3,900,000 | | | | 3,900,000 |
| Series Floaters 00 310, 3.05% (Liquidity Facility Morgan | | | | | | |
| Stanley) (a)(b) | | | | 2,895,000 | | | | 2,895,000 |
| Series Merlots 00 A30, 3.05% (Liquidity Facility | | | | | | |
| Wachovia Bank NA) (a)(b) | | | | 5,070,000 | | | | 5,070,000 |
| |
| See accompanying notes which are an integral part of the financial statements. | | | | |
| |
| Annual Report | | 12 | | | | | | |
| Municipal Securities continued | | | | | | |
| | | Principal | | | | Value |
| | | Amount | | | | (Note 1) |
| New York – continued | | | | | | |
| New York State Dorm. Auth. Revs.: – continued | | | | | | |
| Participating VRDN: | | | | | | |
| Series Merlots 00 G, 3.05% (Liquidity Facility Wachovia | | | | | | |
| Bank NA) (a)(b) | | $ 10,700,000 | | | | $ 10,700,000 |
| Series Merlots 00 X, 3.05% (Liquidity Facility Wachovia | | | | | | |
| Bank NA) (a)(b) | | 4,000,000 | | | | 4,000,000 |
| Series Merlots 01 A30, 3.05% (Liquidity Facility | | | | | | |
| Wachovia Bank NA) (a)(b) | | 1,380,000 | | | | 1,380,000 |
| Series Merlots 01 A65, 3.05% (Liquidity Facility | | | | | | |
| Wachovia Bank NA) (a)(b) | | 2,640,000 | | | | 2,640,000 |
| Series Merlots 02 A56, 3.05% (Liquidity Facility Bank of | | | | | | |
| New York, New York) (a)(b) | | 21,920,000 | | | | 21,920,000 |
| Series MS 12216, 3.04% (Liquidity Facility Morgan | | | | | | |
| Stanley) (a)(b) | | 12,000,000 | | | | 12,000,000 |
| Series MSDW 00 305, 3.04% (Liquidity Facility Morgan | | | | | | |
| Stanley) (a)(b) | | 6,870,000 | | | | 6,870,000 |
| Series PA 784R, 3.05% (Liquidity Facility Merrill Lynch & | | | | | | |
| Co., Inc.) (a)(b) | | 1,000,000 | | | | 1,000,000 |
| Series PT 1958, 3.05% (Liquidity Facility Merrill Lynch & | | | | | | |
| Co., Inc.) (a)(b) | | 5,770,000 | | | | 5,770,000 |
| Series PT 2535, 3.05% (Liquidity Facility Merrill Lynch & | | | | | | |
| Co., Inc.) (a)(b) | | 3,380,000 | | | | 3,380,000 |
| Series ROC II R4558, 3.06% (Liquidity Facility Citigroup | | | | | | |
| Global Markets Hldgs., Inc.) (a)(b) | | 1,965,000 | | | | 1,965,000 |
| Series TOC 05 QQ, 3.05% (Liquidity Facility Goldman | | | | | | |
| Sachs Group, Inc.) (a)(b) | | 3,625,000 | | | | 3,625,000 |
| Series F2A, 2.99% (FSA Insured), VRDN (a) | | 2,900,000 | | | | 2,900,000 |
| New York State Envir. Facilities Corp. Participating VRDN: | | | | | | |
| Series Putters 652, 3.06% (Liquidity Facility JPMorgan | | | | | | |
| Chase & Co.) (a)(b) | | 6,320,000 | | | | 6,320,000 |
| Series ROC II R2169, 3.06% (Liquidity Facility Citigroup | | | | | | |
| Global Markets Hldgs., Inc.) (a)(b) | | 7,500,000 | | | | 7,500,000 |
| New York State Envir. Facilities Corp. Clean Wtr. & Drinking | | | | | | |
| Wtr. Rev. Participating VRDN: | | | | | | |
| Series MS 731, 3.04% (Liquidity Facility Morgan | | | | | | |
| Stanley) (a)(b) | | 25,700,000 | | | | 25,700,000 |
| Series PT 2108, 3.05% (Liquidity Facility Merrill Lynch & | | | | | | |
| Co., Inc.) (a)(b) | | 7,055,000 | | | | 7,055,000 |
| Series ROC II R3016, 3.06% (Liquidity Facility Citigroup | | | | | | |
| Global Markets Hldgs., Inc.) (a)(b) | | 1,840,000 | | | | 1,840,000 |
| Series ROC II R4001, 3.06% (Liquidity Facility Citigroup | | | | | | |
| Global Markets Hldgs., Inc.) (a)(b) | | 6,455,000 | | | | 6,455,000 |
See accompanying notes which are an integral part of the financial statements.
13 Annual Report
| Fidelity New York AMT Tax Free Money Market Fund | | | | |
| Investments continued | | | | | | |
| |
| Municipal Securities continued | | | | | | |
| | | Principal | | | | Value |
| | | Amount | | | | (Note 1) |
| New York – continued | | | | | | |
| New York State Gen. Oblig. Bonds Series 1996 A, 6.5% | | | | | | |
| 7/15/06 | | $ 2,000,000 | | | | $ 2,028,936 |
| New York State Hsg. Fin. Agcy. Personal Income Tax Rev. | | | | | | |
| Participating VRDN Series MS 859, 3.04% (Liquidity Facility | | | | | | |
| Morgan Stanley) (a)(b) | | 5,525,000 | | | | 5,525,000 |
| New York State Hsg. Fin. Agcy. Rev. (100 Meriden Lane Hsg. | | | | | | |
| Proj.) Series A, 3%, LOC Bank of New York, New York, | | | | | | |
| VRDN (a) | | 31,200,000 | | | | 31,200,000 |
| New York State Pwr. Auth. & Gen. Purp. Rev.: | | | | | | |
| Series 1: | | | | | | |
| 3.07% 3/6/06, CP | | 5,700,000 | | | | 5,700,000 |
| 3.08% 3/7/06, CP | | 6,000,000 | | | | 6,000,000 |
| 3.14% 3/7/06, CP | | 12,931,000 | | | | 12,931,000 |
| 3.14% 4/13/06, CP | | 9,000,000 | | | | 9,000,000 |
| Series 2, 3.08% 3/8/06, CP | | 7,500,000 | | | | 7,500,000 |
| New York State Thruway Auth. Gen. Rev. Participating VRDN: | | | | | | |
| Series SG 121, 3.07% (Liquidity Facility Societe | | | | | | |
| Generale) (a)(b) | | 6,565,000 | | | | 6,565,000 |
| Series SGA 150, 3.02% (Liquidity Facility Societe | | | | | | |
| Generale) (a)(b) | | 6,100,000 | | | | 6,100,000 |
| New York State Thruway Auth. Hwy. & Bridge Trust Fund | | | | | | |
| Participating VRDN: | | | | | | |
| Series EGL 03 17, 3.06% (Liquidity Facility Citibank NA, | | | | | | |
| New York) (a)(b) | | 12,965,000 | | | | 12,965,000 |
| Series EGL 7050079, 3.06% (Liquidity Facility Citibank | | | | | | |
| NA) (a)(b) | | 5,700,000 | | | | 5,700,000 |
| Series MS 00 368, 3.04% (Liquidity Facility Morgan | | | | | | |
| Stanley) (a)(b) | | 3,500,000 | | | | 3,500,000 |
| Series MSTC 9045, 3.02% (Liquidity Facility Bear Stearns | | | | | | |
| Companies, Inc.) (a)(b) | | 9,990,000 | | | | 9,990,000 |
| Series PT 2090, 3.05% (Liquidity Facility Merrill Lynch & | | | | | | |
| Co., Inc.) (a)(b) | | 4,900,000 | | | | 4,900,000 |
| Series Putters 1049, 3.06% (Liquidity Facility JPMorgan | | | | | | |
| Chase Bank) (a)(b) | | 16,115,000 | | | | 16,115,000 |
| Series TOC 05 JJ, 3.05% (Liquidity Facility Goldman Sachs | | | | | | |
| Group, Inc.) (a)(b) | | 8,200,000 | | | | 8,200,000 |
| New York State Thruway Auth. State Personal Income Tax Rev. | | | | | | |
| Participating VRDN Series ROC II R6030, 3.06% (Liquidity | | | | | | |
| Facility Citibank NA) (a)(b) | | 3,260,000 | | | | 3,260,000 |
| New York State Thruway Auth. Svc. Contract Rev. | | | | | | |
| Participating VRDN Series EGL 00 3205, 3.06% (Liquidity | | | | | | |
| Facility Citibank NA, New York) (a)(b) | | 6,325,000 | | | | 6,324,543 |
| |
| |
| See accompanying notes which are an integral part of the financial statements. | | | | |
| |
| Annual Report | | 14 | | | | |
| Municipal Securities continued | | | | |
| | | Principal | | Value |
| | | Amount | | (Note 1) |
| New York – continued | | | | |
| New York State Urban Dev. Corp. Rev. Participating VRDN: | | | | |
| Series Merlots 00 N, 3.05% (Liquidity Facility Wachovia | | | | |
| Bank NA) (a)(b) | | $ 13,000,000 | | $ 13,000,000 |
| Series Merlots 05 C1, 3.05% (Liquidity Facility Wachovia | | | | |
| Bank NA) (a)(b) | | 4,290,000 | | 4,290,000 |
| New York Transitional Fin. Auth. Rev.: | | | | |
| Participating VRDN: | | | | |
| Series EGL 04 20, 3.06% (Liquidity Facility Citibank | | | | |
| NA) (a)(b) | | 16,450,000 | | 16,450,000 |
| Series Merlots 99 G, 3.05% (Liquidity Facility Wachovia | | | | |
| Bank NA) (a)(b) | | 11,300,000 | | 11,300,000 |
| Series Merlots A40, 3.05% (Liquidity Facility Wachovia | | | | |
| Bank NA) (a)(b) | | 5,030,000 | | 5,030,000 |
| Series MS 00 283, 3.04% (Liquidity Facility Morgan | | | | |
| Stanley) (a)(b) | | 2,245,000 | | 2,245,000 |
| Series MS 00 433, 3.04% (Liquidity Facility Morgan | | | | |
| Stanley) (a)(b) | | 1,817,500 | | 1,817,500 |
| Series MSDW 00 319, 3.04% (Liquidity Facility Morgan | | | | |
| Stanley) (a)(b) | | 5,465,000 | | 5,465,000 |
| Series PT 1839, 3.05% (Liquidity Facility Merrill Lynch & | | | | |
| Co., Inc.) (a)(b) | | 5,640,000 | | 5,640,000 |
| Series Putters 1101, 3.06% (Liquidity Facility JPMorgan | | | | |
| Chase Bank) (a)(b) | | 6,595,000 | | 6,595,000 |
| Series Putters 478, 3.06% (Liquidity Facility JPMorgan | | | | |
| Chase Bank) (a)(b) | | 7,495,000 | | 7,495,000 |
| Series Putters 628, 3.06% (Liquidity Facility JPMorgan | | | | |
| Chase Bank) (a)(b) | | 7,310,000 | | 7,310,000 |
| Series Putters 830, 3.06% (Liquidity Facility JPMorgan | | | | |
| Chase Bank) (a)(b) | | 5,585,000 | | 5,585,000 |
| Series ROC II R1039, 3.06% (Liquidity Facility Citigroup | | | | |
| Global Markets Hldgs., Inc.) (a)(b) | | 2,380,000 | | 2,380,000 |
| Series ROC II R2052, 3.06% (Liquidity Facility Citigroup | | | | |
| Global Markets Hldgs., Inc.) (a)(b) | | 2,000,000 | | 2,000,000 |
| Series ROC II R2054, 3.07% (Liquidity Facility Citigroup | | | | |
| Global Markets Hldgs., Inc.) (a)(b) | | 3,780,000 | | 3,780,000 |
| Series Stars 04 90, 3.05% (Liquidity Facility BNP Paribas | | | | |
| SA) (a)(b) | | 11,650,000 | | 11,650,000 |
| Series 1999 A1, 3% (Liquidity Facility WestLB AG), | | | | |
| VRDN (a) | | 8,450,000 | | 8,450,000 |
| Series 2003 2F, 3% (Liquidity Facility Bayerische | | | | |
| Landesbank Girozentrale), VRDN (a) | | 8,310,000 | | 8,310,000 |
| Series 2003 C2, 3% (Liquidity Facility Landesbank | | | | |
| Hessen-Thuringen), VRDN (a) | | 1,950,000 | | 1,950,000 |
| |
| See accompanying notes which are an integral part of the financial statements. | | |
| |
| 15 | | | | Annual Report |
| Fidelity New York AMT Tax Free Money Market Fund | | | | |
| Investments continued | | | | | | |
| |
| Municipal Securities continued | | | | | | |
| | | Principal | | | | Value |
| | | Amount | | | | (Note 1) |
| New York – continued | | | | | | |
| North Hempstead Gen. Oblig. BAN 3.25% 4/27/06 | | $ 2,000,000 | | | | $ 2,000,600 |
| Oyster Bay Gen. Oblig. BAN 4.25% 1/19/07 | | 11,900,000 | | | | 12,008,863 |
| Rochester Gen. Oblig. BAN: | | | | | | |
| Series I, 3.5% 3/2/06 | | 29,300,000 | | | | 29,312,582 |
| Series II, 4% 10/20/06 | | 20,305,000 | | | | 20,434,578 |
| Rockland Tobacco Asset Securitization Corp. Participating | | | | | | |
| VRDN Series PA 1345, 3.1% (Liquidity Facility Merrill Lynch | | | | | | |
| & Co., Inc.) (a)(b) | | 2,720,000 | | | | 2,720,000 |
| Rockville Ctr. Union Free School District TAN 4% 6/29/06 | | 5,000,000 | | | | 5,021,046 |
| Sag Hbr. Union Free School District TAN 4% 6/30/06 | | 1,500,000 | | | | 1,506,054 |
| Sales Tax Asset Receivables Corp. Participating VRDN: | | | | | | |
| Series MS 984, 3.04% (Liquidity Facility Morgan | | | | | | |
| Stanley) (a)(b) | | 30,190,000 | | | | 30,190,000 |
| Series PT 2450, 3.05% (Liquidity Facility Merrill Lynch & | | | | | | |
| Co., Inc.) (a)(b) | | 1,390,000 | | | | 1,390,000 |
| Series Putters 1133Z, 3.06% (Liquidity Facility JPMorgan | | | | | | |
| Chase Bank) (a)(b) | | 8,000,000 | | | | 8,000,000 |
| Series Putters 565, 3.06% (Liquidity Facility JPMorgan | | | | | | |
| Chase Bank) (a)(b) | | 5,290,000 | | | | 5,290,000 |
| Series Putters 629, 3.06% (Liquidity Facility JPMorgan | | | | | | |
| Chase Bank) (a)(b) | | 2,605,000 | | | | 2,605,000 |
| Suffolk County Gen. Oblig. TAN 4% 8/16/06 | | 37,900,000 | | | | 38,059,377 |
| Suffolk County Indl. Dev. Agcy. Civic Facility Rev. (Maryhaven | | | | | | |
| Ctr. of Hope Proj.) Series 1997 A, 3.1%, LOC Key Bank | | | | | | |
| NA, VRDN (a) | | 2,400,000 | | | | 2,400,000 |
| Syracuse Ind. Dev. Agcy. Civic Fac. Rev. (Crouse-Irving Hosp. | | | | | | |
| Health Proj.) Series A, 3.02%, LOC Fleet Nat’l. Bank, | | | | | | |
| VRDN (a) | | 10,950,000 | | | | 10,950,000 |
| Tobacco Settlement Fing. Corp.: | | | | | | |
| Bonds Series MT 32, 3.1%, tender 9/28/06 (Liquidity | | | | | | |
| Facility Merrill Lynch & Co., Inc.) (a)(b)(c) | | 4,995,000 | | | | 4,995,000 |
| Participating VRDN: | | | | | | |
| Series PA 1230, 3.08% (Liquidity Facility Merrill Lynch & | | | | | | |
| Co., Inc.) (a)(b) | | 5,250,000 | | | | 5,250,000 |
| Series PT 1907, 3.05% (Liquidity Facility Merrill Lynch & | | | | | | |
| Co., Inc.) (a)(b) | | 5,315,000 | | | | 5,315,000 |
| Series PT 2056, 3.08% (Liquidity Facility Merrill Lynch & | | | | | | |
| Co., Inc.) (a)(b) | | 7,360,000 | | | | 7,360,000 |
| Series PT 2182, 3.05% (Liquidity Facility Merrill Lynch & | | | | | | |
| Co., Inc.) (a)(b) | | 5,170,000 | | | | 5,170,000 |
| Series PT 835, 3.08% (Liquidity Facility Landesbank | | | | | | |
| Hessen-Thuringen) (a)(b) | | 7,400,000 | | | | 7,400,000 |
See accompanying notes which are an integral part of the financial statements.
| Municipal Securities continued | | | | | | |
| | | Principal | | | | Value |
| | | Amount | | | | (Note 1) |
| New York – continued | | | | | | |
| Tobacco Settlement Fing. Corp.: – continued | | | | | | |
| Participating VRDN: | | | | | | |
| Series PT 875, 3.05% (Liquidity Facility Landesbank | | | | | | |
| Hessen-Thuringen) (a)(b) | | $ 6,000,000 | | | | $ 6,000,000 |
| Series PT 893, 3.08% (Liquidity Facility DEPFA BANK | | | | | | |
| PLC) (a)(b) | | 16,895,000 | | | | 16,895,000 |
| Series ROC II R2033, 3.07% (Liquidity Facility Citigroup | | | | | | |
| Global Markets Hldgs., Inc.) (a)(b) | | 3,385,000 | | | | 3,385,000 |
| Series ROC II R2034, 3.07% (Liquidity Facility Citigroup | | | | | | |
| Global Markets Hldgs., Inc.) (a)(b) | | 2,920,000 | | | | 2,920,000 |
| Series ROC II R365, 3.07% (Liquidity Facility Citibank | | | | | | |
| NA) (a)(b) | | 5,815,000 | | | | 5,815,000 |
| Series ROC II R4508, 3.07% (Liquidity Facility Citigroup | | | | | | |
| Global Markets Hldgs., Inc.) (a)(b) | | 2,290,000 | | | | 2,290,000 |
| Tompkins County Indl. Dev. Agcy. Rev. (Civic Facilities Proj.) | | | | | | |
| Series A, 3.12%, LOC Manufacturers & Traders Trust Co., | | | | | | |
| VRDN (a) | | 5,535,000 | | | | 5,535,000 |
| Triborough Bridge & Tunnel Auth. Revs. Participating VRDN: | | | | | | |
| Series EGL 02 6024, 3.06% (Liquidity Facility Citibank NA, | | | | | | |
| New York) (a)(b) | | 6,000,000 | | | | 6,000,000 |
| Series EGL 03 4, Class A, 3.06% (Liquidity Facility Citibank | | | | | | |
| NA, New York) (a)(b) | | 4,500,000 | | | | 4,500,000 |
| Series EGL 03 55, 3.06% (Liquidity Facility Citibank NA, | | | | | | |
| New York) (a)(b) | | 3,045,000 | | | | 3,045,000 |
| Series MS 922 3.04% (Liquidity Facility Morgan | | | | | | |
| Stanley) (a)(b) | | 5,600,000 | | | | 5,600,000 |
| Series MSTC 02 207, 3.02% (Liquidity Facility Bear Stearns | | | | | | |
| Companies, Inc.) (a)(b) | | 9,995,000 | | | | 9,995,000 |
| Series PA 1074, 3.07% (Liquidity Facility Merrill Lynch & | | | | | | |
| Co., Inc.) (a)(b) | | 7,000,000 | | | | 7,000,000 |
| Series PA 948, 3.07% (Liquidity Facility Merrill Lynch & Co., | | | | | | |
| Inc.) (a)(b) | | 7,200,000 | | | | 7,200,000 |
| Series PT 2017, 3.05% (Liquidity Facility Merrill Lynch & | | | | | | |
| Co., Inc.) (a)(b) | | 1,450,000 | | | | 1,450,000 |
| Series Putters 525, 3.06% (Liquidity Facility JPMorgan | | | | | | |
| Chase Bank) (a)(b) | | 4,995,000 | | | | 4,995,000 |
| Series ROC II R1008, 3.06% (Liquidity Facility Citigroup | | | | | | |
| Global Markets Hldgs., Inc.) (a)(b) | | 3,125,000 | | | | 3,125,000 |
| Series ROC II R1032, 3.06% (Liquidity Facility Citigroup | | | | | | |
| Global Markets Hldgs., Inc.) (a)(b) | | 5,325,000 | | | | 5,325,000 |
| Series ROC II R2013, 3.06% (Liquidity Facility Citigroup | | | | | | |
| Global Markets Hldgs., Inc.) (a)(b) | | 3,825,000 | | | | 3,825,000 |
| Series SGB 43, 3.06% (Liquidity Facility Societe | | | | | | |
| Generale) (a)(b) | | 15,500,000 | | | | 15,500,000 |
See accompanying notes which are an integral part of the financial statements.
17 Annual Report
| Fidelity New York AMT Tax Free Money Market Fund | | | | |
| Investments continued | | | | | | |
| |
| Municipal Securities continued | | | | | | |
| | | Principal | | | | Value |
| | | Amount | | | | (Note 1) |
| New York – continued | | | | | | |
| Upstate Telecommunications Corp. Rev. 3.07%, LOC | | | | | | |
| Manufacturers & Traders Trust Co., VRDN (a) | | $ 5,900,000 | | | | $ 5,900,000 |
| Yates County Indl. Dev. Agcy. Civic Facilities Rev. (Keuka | | | | | | |
| College Proj.) Series 2003 A, 3.05%, LOC Key Bank NA, | | | | | | |
| VRDN (a) | | 3,510,000 | | | | 3,510,000 |
| | | | | | | 1,466,390,100 |
| |
| New York & New Jersey – 0.8% | | | | | | |
| Port Auth. of New York & New Jersey Participating VRDN: | | | | | | |
| Series MS 766, 3.04% (Liquidity Facility Morgan | | | | | | |
| Stanley) (a)(b) | | 4,245,000 | | | | 4,245,000 |
| Series PA 1251, 3.07% (Liquidity Facility Merrill Lynch & | | | | | | |
| Co., Inc.) (a)(b) | | 3,700,000 | | | | 3,700,000 |
| Series ROC II R373, 3.06% (Liquidity Facility Citibank | | | | | | |
| NA) (a)(b) | | 5,385,000 | | | | 5,385,000 |
| | | | | | | 13,330,000 |
| |
| Puerto Rico 0.8% | | | | | | |
| Puerto Rico Commonwealth Gen. Oblig. Participating VRDN | | | | | | |
| Series MT 218, 3.04% (Liquidity Facility Merrill Lynch & | | | | | | |
| Co., Inc.) (a)(b) | | 4,000,000 | | | | 4,000,000 |
| Puerto Rico Commonwealth Infrastructure Fing. Auth. Bonds | | | | | | |
| Series MT 172, 3.23%, tender 10/26/06 (Liquidity Facility | | | | | | |
| Merrill Lynch & Co., Inc.) (a)(b)(c) | | 2,485,000 | | | | 2,485,000 |
| Puerto Rico Muni. Fin. Agcy. Bonds Series MT 213, 3.17%, | | | | | | |
| tender 4/13/06 (Liquidity Facility Merrill Lynch & Co., | | | | | | |
| Inc.) (a)(b)(c) | | 5,580,000 | | | | 5,580,000 |
| | | | | | | 12,065,000 |
| |
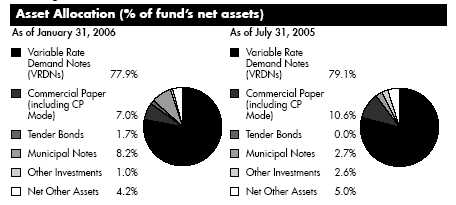
| TOTAL INVESTMENT PORTFOLIO 95.8% | | | | | | |
| (Cost $1,491,785,100) | | | | 1,491,785,100 |
| |
| NET OTHER ASSETS – 4.2% | | | | | | 65,382,498 |
| NET ASSETS 100% | | $ 1,557,167,598 |
| Security Type Abbreviations |
| BAN | | — | | BOND ANTICIPATION NOTE |
| CP | | — | | COMMERCIAL PAPER |
| TAN | | — | | TAX ANTICIPATION NOTE |
| VRDN | | — | | VARIABLE RATE DEMAND NOTE |
See accompanying notes which are an integral part of the financial statements.
Annual Report 18
Legend
(a) The coupon rate shown on floating or
adjustable rate securities represents the
rate at period end.
(b) Provides evidence of ownership in one
or more underlying municipal bonds.
(c) Restricted securities – Investment in
securities not registered under the
Securities Act of 1933 (excluding 144A
issues). At the end of the period, the
value of restricted securities (excluding
144A issues) amounted to $25,660,000
or 1.6% of net assets.
|
Additional information on each holding is as follows:
| | | Acquisition | | |
| Security | | Date | | Cost |
| Bank of New York | | | | |
| Muni. Ctfs. trust | | | | |
| various states | | | | |
| Bonds Series BNY | | | | |
| 05 4, 3.13%, | | | | |
| tender 4/25/06 | | | | |
| (Liquidity Facility | | | | |
| Bank of New | | | | |
| York, New York) | | 11/14/05 | | $ 6,800,000 |
| New York Local | | | | |
| Govt. Assistance | | | | |
| Corp. Bonds | | | | |
| Series PT 410, | | | | |
| 3.25%, tender | | | | |
| 10/26/06 | | | | |
| (Liquidity Facility | | | | |
| Lloyds TSB Bank | | | | |
| PLC) | | 10/27/05 | | $ 5,800,000 |
| | | Acquisition | | | | |
| Security | | Date | | | | Cost |
| Puerto Rico | | | | | | |
| Commonwealth | | | | | | |
| Infrastructure | | | | | | |
| Fing. Auth. Bonds | | | | | | |
| Series MT 172, | | | | | | |
| 3.23%, tender | | | | | | |
| 10/26/06 | | | | | | |
| (Liquidity Facility | | | | | | |
| Merrill Lynch & | | | | | | |
| Co., Inc.) | | 10/27/05 | | | | $ 2,485,000 |
| Puerto Rico Muni. | | | | | | |
| Fin. Agcy. Bonds | | | | | | |
| Series MT 213, | | | | | | |
| 3.17%, tender | | | | | | |
| 4/13/06 | | | | | | |
| (Liquidity Facility | | | | | | |
| Merrill Lynch & | | | | | | |
| Co., Inc.) | | 1/12/06 | | | | $ 5,580,000 |
| Tobacco | | | | | | |
| Settlement Fing. | | | | | | |
| Corp. Bonds | | | | | | |
| Series MT 32, | | | | | | |
| 3.1%, tender | | | | | | |
| 9/28/06 | | | | | | |
| (Liquidity Facility | | | | | | |
| Merrill Lynch & | | | | | | |
| Co., Inc.) | | 9/27/05 | | | | $ 4,995,000 |
Affiliated Central Funds
Information regarding fiscal year to date income received by the fund from the affiliated Central funds is as follows:
| Fund | | | | Income received |
| Fidelity Tax Free Cash Central Fund | | | $ | 169,423 |
See accompanying notes which are an integral part of the financial statements.
19 Annual Report
| Fidelity New York AMT Tax Free Money Market Fund | | | | |
| |
| Financial Statements | | | | | | | | |
| |
| Statement of Assets and Liabilities | | | | | | | | |
| | | | | | | | | January 31, 2006 |
| |
| Assets | | | | | | | | |
| Investment in securities, at value See accompanying | | | | | | | | |
| schedule: | | | | | | | | |
| Unaffiliated issuers (cost $1,491,785,100) | | | | | | $1,491,785,100 |
| Cash | | | | | | | | 42,160,309 |
| Receivable for investments sold | | | | | | | | 6,928,181 |
| Receivable for fund shares sold | | | | | | | | 11,561,347 |
| Interest receivable | | | | | | | | 10,726,496 |
| Receivable from investment adviser for expense | | | | | | | | |
| reductions | | | | | | | | 28,455 |
| Other receivables | | | | | | | | 108,159 |
| Total assets | | | | | | | | 1,563,298,047 |
| |
| Liabilities | | | | | | | | |
| Payable for investments purchased | | | $ | 2,000,600 | | | | |
| Payable for fund shares redeemed | | | | 3,384,612 | | | | |
| Distributions payable | | | | 201,086 | | | | |
| Accrued management fee | | | | 542,352 | | | | |
| Other affiliated payables | | | | 1,799 | | | | |
| Total liabilities | | | | | | | | 6,130,449 |
| |
| Net Assets | | | | | | $ 1,557,167,598 |
| Net Assets consist of: | | | | | | | | |
| Paid in capital | | | | | | $1,556,911,674 |
| Undistributed net investment income | | | | | | | | 1,735 |
| Accumulated undistributed net realized gain (loss) on | | | | | | | | |
| investments | | | | | | | | 254,189 |
| Net Assets, for 1,556,691,809 shares outstanding | | | | | | $ 1,557,167,598 |
| Net Asset Value, offering price and redemption price per | | | | | | |
| share ($1,557,167,598 ÷ 1,556,691,809 shares) | | | | | | | | $ 1.00 |
See accompanying notes which are an integral part of the financial statements.
Annual Report 20
| Statement of Operations | | | | | | |
| | | | | Year ended January 31, 2006 |
| |
| Investment Income | | | | | | |
| Interest | | | | | $ | 34,488,394 |
| Income from affiliated Central Funds | | | | | | 169,423 |
| Total income | | | | | | 34,657,817 |
| |
| Expenses | | | | | | |
| Management fee | | | $ | 5,906,347 | | |
| Independent trustees’ compensation | | | | 5,972 | | |
| Total expenses before reductions | | | | 5,912,319 | | |
| Expense reductions | | | | (1,522,735) | | 4,389,584 |
| |
| Net investment income | | | | | | 30,268,233 |
| Realized and Unrealized Gain (Loss) | | | | | | |
| Net realized gain (loss) on: | | | | | | |
| Investment securities: | | | | | | |
| Unaffiliated issuers | | | | | | 112,172 |
| Net increase in net assets resulting from operations | | | | | $ | 30,380,405 |
See accompanying notes which are an integral part of the financial statements.
21 Annual Report
| Fidelity New York AMT Tax Free Money Market Fund | | |
| Financial Statements continued | | | | |
| |
| Statement of Changes in Net Assets | | | | |
| | | Year ended | | Year ended |
| | | January 31, | | January 31, |
| | | 2006 | | 2005 |
| Increase (Decrease) in Net Assets | | | | |
| Operations | | | | |
| Net investment income | | $ 30,268,233 | | $ 10,143,313 |
| Net realized gain (loss) | | 112,172 | | 289,048 |
| Net increase in net assets resulting | | | | |
| from operations | | 30,380,405 | | 10,432,361 |
| Distributions to shareholders from net investment income . | | (30,266,254) | | (10,145,141) |
| Distributions to shareholders from net realized gain | | — | | (227,135) |
| Total distributions | | (30,266,254) | | (10,372,276) |
| Share transactions at net asset value of $1.00 per share | | | | |
| Proceeds from sales of shares | | 1,278,004,502 | | 661,967,295 |
| Reinvestment of distributions | | 28,578,382 | | 9,747,542 |
| Cost of shares redeemed | | (922,042,676) | | (571,820,146) |
| Net increase (decrease) in net assets and shares | | | | |
| resulting from share transactions | | 384,540,208 | | 99,894,691 |
| Total increase (decrease) in net assets | | 384,654,359 | | 99,954,776 |
| |
| Net Assets | | | | |
| Beginning of period | | 1,172,513,239 | | 1,072,558,463 |
| End of period (including undistributed net investment | | | | |
| income of $1,735 and undistributed net investment | | | | |
| income of $3,598, respectively) | | $ 1,557,167,598 | | $ 1,172,513,239 |
See accompanying notes which are an integral part of the financial statements.
| Financial Highlights | | | | | | | | | | |
| |
| | | | | Years ended January 31, |
| | | | | 2006 | | 2005 | | 2004 | | 2003 | | 2002 |
| Selected Per Share Data | | | | | | | | | | | | |
| Net asset value, | | | | | | | | | | | | |
| beginning of period | | | | $ 1.00 | | $ 1.00 | | $ 1.00 | | $ 1.00 | | $ 1.00 |
| Income from Investment | | | | | | | | | | | | |
| Operations | | | | | | | | | | | | |
| Net investment income | | | | .022 | | .009 | | .007 | | .011 | | .022 |
| Net realized and | | | | | | | | | | | | |
| unrealized gain | | | | | | | | | | | | |
| (loss)C | | | | — | | — | | — | | — | | — |
| Total from investment | | | | | | | | | | | | |
| operations | | | | 022 | | .009 | | .007 | | .011 | | .022 |
| Distributions from net | | | | | | | | | | | | |
| investment income | | | | (.022) | | (.009) | | (.007) | | (.011) | | (.022) |
| Distributions from net | | | | | | | | | | | | |
| realized gain | | | | — | | —C | | — | | — | | — |
| Total distributions | | | | (.022) | | (.009) | | (.007) | | (.011) | | (.022) |
| Net asset value, end of | | | | | | | | | | | | |
| period | | | | $ 1.00 | | $ 1.00 | | $ 1.00 | | $ 1.00 | | $ 1.00 |
| Total ReturnA | | | | 2.20% | | .94% | | .72% | | 1.14% | | 2.23% |
| Ratios to Average Net AssetsB | | | | | | | | |
| Expenses before | | | | | | | | | | | | |
| reductions | | | | 43% | | .43% | | .43% | | .43% | | .48% |
| Expenses net of fee | | | | | | | | | | | | |
| waivers, if any | | | | 40% | | .40% | | .40% | | .40% | | .47% |
| Expenses net of all | | | | | | | | | | | | |
| reductions | | | | 32% | | .37% | | .39% | | .37% | | .44% |
| Net investment income | | | | 2.20% | | .92% | | .72% | | 1.13% | | 2.22% |
| Supplemental Data | | | | | | | | | | | | |
| Net assets, end of | | | | | | | | | | | | |
| period (000 omitted) | | | | $1,557,168 | | $1,172,513 | | $1,072,558 | | $1,163,393 | | $940,370 |
A Total returns would have been lower had certain expenses not been reduced during the periods shown.
B Expense ratios reflect operating expenses of the fund. Expenses before reductions do not reflect amounts reimbursed by the investment adviser or
expense offset arrangements and do not represent the amount paid by the fund during periods when reimbursements or reductions occur.
Expenses net of fee waivers reflect expenses after reimbursement by the investment adviser but prior to reductions from expense offset arrange
ments. Expenses net of all reductions represent the net expenses paid by the fund.
C Amount represents less than $.001 per share.
|
See accompanying notes which are an integral part of the financial statements.
23 Annual Report
| Fidelity New York Municipal Money Market Fund | | |
| Investment Changes | | | | |
| |
| Maturity Diversification | | | | | | |
| Days | | % of fund’s | | % of fund’s | | % of fund’s |
| | | investments | | investments | | investments |
| | | 1/31/06 | | 7/31/05 | | 1/31/05 |
| 0 – 30 | | 85.3 | | 94.2 | | 86.7 |
| 31 – 90 | | 6.8 | | 2.4 | | 9.5 |
| 91 – 180 | | 0.7 | | 0.6 | | 1.7 |
| 181 – 397 | | 7.2 | | 2.8 | | 2.1 |
| Weighted Average Maturity | | | | | | |
| | | 1/31/06 | | 7/31/05 | | 1/31/05 |
| Fidelity New York Municipal Money | | | | | | |
| Market Fund | | 28 Days | | 16 Days | | 18 Days |
| New York Tax Free Money Market | | | | | | |
| Funds Average* | | 26 Days | | 24 Days | | 28 Days |
| Current and Historical Seven Day Yields | | | | | | |
| | | 1/30/06 | | 10/31/05 | | 8/1/05 | | 5/2/05 | | 1/31/05 |
| Fidelity New York Municipal | | | | | | | | | | |
| Money Market Fund | | 2.58% | | 2.25% | | 1.93% | | 2.39% | | 1.34% |
Yield refers to the income paid by the fund over a given period. Yields for money market funds are usually for seven day periods, as they are here, though they are expressed as annual percentage rates. Past performance is no guarantee of future results. Yield will vary and it is possible to lose money by investing in the fund.
*Source: iMoneyNet, Inc.
Annual Report 24
| Fidelity New York Municipal Money Market Fund | | |
| Investments January 31, 2006 | | |
| Showing Percentage of Net Assets | | | | |
| |
| Municipal Securities 94.2% | | | | |
| | | Principal | | Value |
| | | Amount | | (Note 1) |
| New York – 89.2% | | | | |
| Albany City School District BAN Series D, 4% 6/30/06 | | $10,125,000 | | $ 10,154,713 |
| Bank of New York Muni. Ctfs. trust various states Bonds Series | | | | |
| BNY 05 4, 3.13%, tender 4/25/06 (Liquidity Facility Bank | | | | |
| of New York, New York) (a)(c)(d) | | 15,700,000 | | 15,700,000 |
| Chemung County Indl. Dev. Agcy. Indl. Dev. Rev.: | | | | |
| (McWane, Inc. Proj.) Series 1992 A, 3.22%, LOC AmSouth | | | | |
| Bank NA, Birmingham, VRDN (a)(b) | | 900,000 | | 900,000 |
| (MMARS 2nd Prog. Trayer, Inc. Proj.) Series A, 3.15%, LOC | | | | |
| HSBC Bank USA, VRDN (a)(b) | | 2,700,000 | | 2,700,000 |
| East Rochester Hsg. Auth. Rev. (Daniels Creek at Baytowne | | | | |
| Proj.) 3.04%, LOC HSBC Bank USA, VRDN (a)(b) | | 3,635,000 | | 3,635,000 |
| Eclipse Fdg. Trust Participating VRDN: | | | | |
| Series Solar 05 05, 3.05% (Liquidity Facility U.S. Bank NA, | | | | |
| Minnesota) (a)(c) | | 14,565,000 | | 14,565,000 |
| Series Solar 06 4, 3.04% (Liquidity Facility U.S. Bank NA, | | | | |
| Minnesota) (a)(c) | | 8,500,000 | | 8,500,000 |
| Erie County Tobacco Asset Securitization Corp. Participating | | | | |
| VRDN Series PA 1339, 3.1% (Liquidity Facility Merrill Lynch | | | | |
| & Co., Inc.) (a)(c) | | 3,390,000 | | 3,390,000 |
| Lancaster Indl. Dev. Agcy. Civic Facilities Rev. (Greenfield | | | | |
| Manor Proj.) 3.06%, LOC Manufacturers & Traders Trust | | | | |
| Co., VRDN (a) | | 4,285,000 | | 4,285,000 |
| Liberty Dev. Corp. Rev. Participating VRDN: | | | | |
| Series Austin 05 Q, 3.06% (Liquidity Facility Bank of | | | | |
| America NA) (a)(c) | | 39,145,000 | | 39,145,000 |
| Series MS 04 1238, 3.04% (Liquidity Facility Morgan | | | | |
| Stanley) (a)(c) | | 20,000,000 | | 20,000,000 |
| Liverpool Central School District Gen. Oblig. BAN 4% | | | | |
| 9/15/06 | | 12,254,844 | | 12,330,704 |
| Long Island Pwr. Auth. Elec. Sys. Rev.: | | | | |
| Participating VRDN: | | | | |
| Series EGL 720050013, 3.06% (Liquidity Facility Citibank | | | | |
| NA) (a)(c) | | 8,275,000 | | 8,275,000 |
| Series PA 1051, 3.05% (Liquidity Facility Merrill Lynch & | | | | |
| Co., Inc.) (a)(c) | | 11,000,000 | | 11,000,000 |
| Series SG 125, 3.05% (Liquidity Facility Societe | | | | |
| Generale) (a)(c) | | 5,200,000 | | 5,200,000 |
| Subseries 2001 2B, 3.04%, LOC Bayerische Landesbank | | | | |
| Girozentrale, VRDN (a) | | 4,100,000 | | 4,100,000 |
| Metropolitan Trans. Auth. Dedicated Tax Fund Participating | | | | |
| VRDN: | | | | |
| Series EGL 01 3205, 3.06% (Liquidity Facility Citibank NA, | | | | |
| New York) (a)(c) | | 15,020,000 | | 15,020,000 |
| |
| See accompanying notes which are an integral part of the financial statements. | | |
| |
| 25 | | | | Annual Report |
| Fidelity New York Municipal Money Market Fund | | | | |
| Investments continued | | | | | | |
| |
| Municipal Securities continued | | | | | | |
| | | Principal | | | | Value |
| | | Amount | | | | (Note 1) |
| New York – continued | | | | | | |
| Metropolitan Trans. Auth. Dedicated Tax Fund Participating | | | | | | |
| VRDN: – continued | | | | | | |
| Series EGL 02 6003, 3.06% (Liquidity Facility Citibank NA, | | | | | | |
| New York) (a)(c) | | $ 7,700,000 | | | | $ 7,700,000 |
| Series EGL 02 6007, 3.06% (Liquidity Facility Citibank NA, | | | | | | |
| New York) (a)(c) | | 7,140,000 | | | | 7,140,000 |
| Series EGL 98 3203, 3.06% (Liquidity Facility Citibank NA, | | | | | | |
| New York) (a)(c) | | 6,700,000 | | | | 6,700,000 |
| Series EGL 98 3204, 3.06% (Liquidity Facility Citibank NA, | | | | | | |
| New York) (a)(c) | | 8,900,000 | | | | 8,900,000 |
| Series PA 1098, 3.05% (Liquidity Facility Merrill Lynch & | | | | | | |
| Co., Inc.) (a)(c) | | 8,700,000 | | | | 8,700,000 |
| Metropolitan Trans. Auth. Rev.: | | | | | | |
| Bonds: | | | | | | |
| Series 2005 F, 4.5% 11/15/06 | | 11,400,000 | | | | 11,504,736 |
| Series H, 4.25% 11/15/06 | | 19,495,000 | | | | 19,630,717 |
| Participating VRDN: | | | | | | |
| Series EGL 02 6028, 3.06% (Liquidity Facility Citibank | | | | | | |
| NA, New York) (a)(c) | | 5,145,000 | | | | 5,145,000 |
| Series EGL 03 37, 3.06% (Liquidity Facility Citibank | | | | | | |
| NA) (a)(c) | | 7,235,000 | | | | 7,235,000 |
| Series EGL 7053019, 3.06% (Liquidity Facility Citibank | | | | | | |
| NA) (a)(c) | | 13,700,000 | | | | 13,700,000 |
| Series FRRI 02 F, 3.05% (Liquidity Facility Bank of New | | | | | | |
| York, New York) (a)(c) | | 4,064,500 | | | | 4,064,500 |
| Series MS 862, 3.04% (Liquidity Facility Morgan | | | | | | |
| Stanley) (a)(c) | | 4,660,000 | | | | 4,660,000 |
| Series PA 1084, 3.05% (Liquidity Facility Merrill Lynch & | | | | | | |
| Co., Inc.) (a)(c) | | 8,665,000 | | | | 8,665,000 |
| Series PT 1466, 3.05% (Liquidity Facility Merrill Lynch & | | | | | | |
| Co., Inc.) (a)(c) | | 5,680,000 | | | | 5,680,000 |
| Series PT 988, 3.05% (Liquidity Facility Landesbank | | | | | | |
| Hessen-Thuringen) (a)(c) | | 5,500,000 | | | | 5,500,000 |
| Metropolitan Trans. Auth. Svc. Contract Rev. Participating | | | | | | |
| VRDN: | | | | | | |
| Series EGL 02 6000, 3.06% (Liquidity Facility Citibank NA, | | | | | | |
| New York) (a)(c) | | 8,100,000 | | | | 8,100,000 |
| Series PT 1439, 3.05% (Liquidity Facility Merrill Lynch & Co., | | | | | | |
| Inc.) (a)(c) | | 7,265,000 | | | | 7,265,000 |
| Series PT 1836, 3.05% (Liquidity Facility Merrill Lynch & Co., | | | | | | |
| Inc.) (a)(c) | | 9,855,000 | | | | 9,855,000 |
| Series ROC II R2083, 3.06% (Liquidity Facility Citigroup | | | | | | |
| Global Markets Hldgs., Inc.) (a)(c) | | 5,230,000 | | | | 5,230,000 |
| |
| See accompanying notes which are an integral part of the financial statements. | | | | |
| |
| Annual Report | | 26 | | | | |
| Municipal Securities continued | | | | | | |
| | | Principal | | | | Value |
| | | Amount | | | | (Note 1) |
| New York – continued | | | | | | |
| Monroe County Arpt. Auth. Arpt. Rev. Participating VRDN | | | | | | |
| Series Putters 123, 3.09% (Liquidity Facility JPMorgan Chase | | | | | | |
| Bank) (a)(b)(c) | | $ 8,965,000 | | | | $ 8,965,000 |
| Monroe County Indl. Dev. Agcy. Civic Facility Rev. (Action For | | | | | | |
| Better Cmnty., Inc. Proj.) 3.12%, LOC Manufacturers & | | | | | | |
| Traders Trust Co., VRDN (a) | | 2,135,000 | | | | 2,135,000 |
| Monroe County Indl. Dev. Agcy. Rev.: | | | | | | |
| (Advent Tool & Mold Proj.) Series 1990 D, 3.15%, LOC | | | | | | |
| HSBC Bank USA, VRDN (a)(b) | | 700,000 | | | | 700,000 |
| (AJL Manufacturing Proj.) Series 1996 A, 3.22%, LOC | | | | | | |
| Manufacturers & Traders Trust Co., VRDN (a)(b) | | 4,385,000 | | | | 4,385,000 |
| (Flower City Proj.) 3.17%, LOC Fleet Nat’l. Bank, | | | | | | |
| VRDN (a)(b) | | 3,980,000 | | | | 3,980,000 |
| Nassau County Tobacco Settlement Corp. Participating VRDN | | | | | | |
| Series PA 1211, 3.1% (Liquidity Facility Merrill Lynch & Co., | | | | | | |
| Inc.) (a)(c) | | 10,535,000 | | | | 10,535,000 |
| New York City Gen. Oblig.: | | | | | | |
| Bonds: | | | | | | |
| Series 2002 G, 5% 8/1/06 | | 1,735,000 | | | | 1,749,475 |
| Series 2005 G, 4% 8/1/06 | | 20,430,000 | | | | 20,504,123 |
| Participating VRDN: | | | | | | |
| Series CRVS 05 22, 3.05% (Liquidity Facility Landesbank | | | | | | |
| Hessen-Thuringen) (a)(c) | | 10,500,000 | | | | 10,500,000 |
| Series DB 167, 3.05% (Liquidity Facility Deutsche Bank | | | | | | |
| AG) (a)(c) | | 20,140,000 | | | | 20,140,000 |
| Series DB 172, 3.05% (Liquidity Facility Deutsche Bank | | | | | | |
| AG) (a)(c) | | 12,540,000 | | | | 12,540,000 |
| Series DB 178, 3.05% (Liquidity Facility Deutsche Bank | | | | | | |
| AG) (a)(c) | | 31,045,000 | | | | 31,045,000 |
| Series LB 05 F6, 3.13% (Lehman Brothers Hldgs., Inc. | | | | | | |
| Guaranteed) (Liquidity Facility Lehman Brothers Hldgs., | | | | | | |
| Inc.) (a)(c) | | 10,787,000 | | | | 10,787,000 |
| Series LB 05 FP09, 3.13% (Lehman Brothers Hldgs., Inc. | | | | | | |
| Guaranteed) (Liquidity Facility Lehman Brothers Hldgs., | | | | | | |
| Inc.) (a)(c) | | 17,160,000 | | | | 17,160,000 |
| Series LB 05 FP10, 3.13% (Liquidity Facility Lehman | | | | | | |
| Brothers Hldgs., Inc.) (a)(c) | | 6,230,000 | | | | 6,230,000 |
| Series PA 1249, 3.05% (Liquidity Facility Merrill Lynch & | | | | | | |
| Co., Inc.) (a)(c) | | 5,000,000 | | | | 5,000,000 |
| Series PA 1336, 3.08% (Liquidity Facility Merrill Lynch & | | | | | | |
| Co., Inc.) (a)(c) | | 15,050,000 | | | | 15,050,000 |
| Series PT 2203, 3.05% (Liquidity Facility Merrill Lynch & | | | | | | |
| Co., Inc.) (a)(c) | | 1,155,000 | | | | 1,155,000 |
See accompanying notes which are an integral part of the financial statements.
27 Annual Report
| Fidelity New York Municipal Money Market Fund | | | | |
| Investments continued | | | | | | | | |
| |
| Municipal Securities continued | | | | | | |
| | | | | Principal | | | | Value |
| | | | | Amount | | | | (Note 1) |
| New York – continued | | | | | | | | |
| New York City Gen. Oblig.: – continued | | | | | | | | |
| Participating VRDN: | | | | | | | | |
| Series PT 2217, 3.05% (Liquidity Facility Merrill Lynch & | | | | | | |
| Co., Inc.) (a)(c) | | | | $ 1,370,000 | | | | $ 1,370,000 |
| Series PT 2480, 3.08% (Liquidity Facility Dexia Cr. Local | | | | | | |
| de France) (a)(c) | | | | 13,600,000 | | | | 13,600,000 |
| Series PT 2544, 3.08% (Liquidity Facility Dexia Cr. Local | | | | | | |
| de France) (a)(c) | | | | 16,570,000 | | | | 16,570,000 |
| Series PT 3171, 3.05% (Liquidity Facility Merrill Lynch & | | | | | | |
| Co., Inc.) (a)(c) | | | | 4,815,000 | | | | 4,815,000 |
| Series PT 3256, 3.08% (Liquidity Facility Merrill Lynch & | | | | | | |
| Co., Inc.) (a)(c) | | | | 16,755,000 | | | | 16,755,000 |
| Series PT 3333, 3.08% (Liquidity Facility Dexia Cr. Local | | | | | | �� |
| de France) (a)(c) | | | | 5,360,000 | | | | 5,360,000 |
| Series PT 991, 3.05% (Liquidity Facility BNP Paribas | | | | | | |
| SA) (a)(c) | | | | 10,000,000 | | | | 10,000,000 |
| Series Putters 1010, 3.06% (Liquidity Facility JPMorgan | | | | | | |
| Chase Bank) (a)(c) | | | | 5,435,000 | | | | 5,435,000 |
| Series Putters 1087, 3.06% (Liquidity Facility JPMorgan | | | | | | |
| Chase Bank) (a)(c) | | | | 17,000,000 | | | | 17,000,000 |
| Series Putters 647, 3.06% (Liquidity Facility JPMorgan | | | | | | |
| Chase & Co.) (a)(c) | | | | 7,725,000 | | | | 7,725,000 |
| Series Putters 659, 3.06% (Liquidity Facility JPMorgan | | | | | | |
| Chase Bank) (a)(c) | | | | 11,055,000 | | | | 11,055,000 |
| Series RobIns 17 Class F, 3.05% (Liquidity Facility Bank of | | | | | | |
| New York, New York) (a)(c) | | | | 6,600,000 | | | | 6,600,000 |
| Series ROC II R2138, 3.06% (Liquidity Facility Citigroup | | | | | | |
| Global Markets Hldgs., Inc.) (a)(c) | | | | 6,780,000 | | | | 6,780,000 |
| Series ROC II R251, 3.09% (Citigroup Global Markets | | | | | | |
| Hldgs., Inc. Guaranteed) (Liquidity Facility Citigroup | | | | | | |
| Global Markets Hldgs., Inc.) (a)(c) | | | | 55,500,000 | | | | 55,500,000 |
| Series ROC II R389, 3.06% (Liquidity Facility Citibank | | | | | | |
| NA) (a)(c) | | | | 5,550,000 | | | | 5,550,000 |
| Series ROC II R6026, 3.06% (Liquidity Facility Citibank | | | | | | |
| NA) (a)(c) | | | | 4,460,000 | | | | 4,460,000 |
| Series 1994 A7, 3.04%, LOC JPMorgan Chase Bank, | | | | | | |
| VRDN (a) | | | | 3,525,000 | | | | 3,525,000 |
| Subseries 2004 H7, 3.04%, LOC KBC Bank NV, VRDN (a) | | 9,600,000 | | | | 9,600,000 |
| New York City Hsg. Dev. Corp. Multi-family Rental Hsg. Rev.: | | | | | | |
| (One Columbus Place Dev. Proj.) Series A, 3.04%, LOC | | | | | | |
| Fannie Mae, VRDN (a)(b) | | | | 31,000,000 | | | | 31,000,000 |
| Series 2001 A, 3.05%, LOC Fannie Mae, VRDN (a)(b) | | 55,750,000 | | | | 55,750,000 |
| |
| |
| See accompanying notes which are an integral part of the financial statements. | | | | |
| |
| Annual Report | | 28 | | | | | | |
| Municipal Securities continued | | | | | | |
| | | Principal | | | | Value |
| | | Amount | | | | (Note 1) |
| New York – continued | | | | | | |
| New York City Hsg. Dev. Corp. Multi-family Rev.: | | | | | | |
| (15 East Clark Place Apts. Proj.) Series A, 3.04%, LOC | | | | | | |
| JPMorgan Chase Bank, VRDN (a)(b) | | $ 5,800,000 | | | | $ 5,800,000 |
| (270 East Burnside Avenue Apts.) Series A, 3.04%, LOC | | | | | | |
| HSBC Bank USA, VRDN (a)(b) | | 6,500,000 | | | | 6,500,000 |
| (92nd & First Residential Tower Proj.) Series A, 3.08%, LOC | | | | | | |
| Fleet Nat’l. Bank, VRDN (a)(b) | | 46,970,000 | | | | 46,970,000 |
| (941 Hoe Avenue Apts. Proj.) Series A, 3.08%, LOC Key | | | | | | |
| Bank NA, VRDN (a)(b) | | 6,200,000 | | | | 6,200,000 |
| (Aldus Street Apartments Proj.) Series A, 3.08%, LOC Key | | | | | | |
| Bank NA, VRDN (a)(b) | | 14,200,000 | | | | 14,200,000 |
| (Courtland Avenue Apts. Proj.) Series A, 3.05%, LOC Key | | | | | | |
| Bank NA, VRDN (a)(b) | | 7,000,000 | | | | 7,000,000 |
| (Louis Nine Boulevard Apts. Proj.) Series A, 3.05%, LOC Key | | | | | | |
| Bank NA, VRDN (a)(b) | | 4,500,000 | | | | 4,500,000 |
| (Nagle Courtyard Apts. Proj.) Series A, 3.08%, LOC Fleet | | | | | | |
| Nat’l. Bank, VRDN (a)(b) | | 8,400,000 | | | | 8,400,000 |
| (Ogden Avenue Apts. Proj.) Series A, 3.08%, LOC Fleet | | | | | | |
| Nat’l. Bank, VRDN (a)(b) | | 10,175,000 | | | | 10,175,000 |
| Series A: | | | | | | |
| 3.03%, LOC Fleet Nat’l. Bank, VRDN (a) | | 5,000,000 | | | | 5,000,000 |
| 3.04%, LOC Landesbank Baden-Wuert, VRDN (a)(b) | | 50,500,000 | | | | 50,500,000 |
| New York City Indl. Dev. Agcy. Civic Facility Rev.: | | | | | | |
| (French Institute-Alliance Francaise de New York-Federation | | | | | | |
| of French Alliances in the United States Proj.) 3.1%, LOC | | | | | | |
| Manufacturers & Traders Trust Co., VRDN (a) | | 2,450,000 | | | | 2,450,000 |
| (Mercy College Proj.) Series A, 3.02%, LOC Key Bank NA, | | | | | | |
| VRDN (a) | | 7,200,000 | | | | 7,200,000 |
| New York City Indl. Dev. Agcy. Indl. Dev. Rev. (Linear Ltg. | | | | | | |
| Proj.) 3.2%, LOC Manufacturers & Traders Trust Co., | | | | | | |
| VRDN (a)(b) | | 2,255,000 | | | | 2,255,000 |
| New York City Indl. Dev. Agcy. Solid Waste Facility Rev. (USA | | | | | | |
| Waste Svcs. Proj.) 3.03%, LOC JPMorgan Chase Bank, | | | | | | |
| VRDN (a)(b) | | 3,725,000 | | | | 3,725,000 |
| New York City Indl. Dev. Agcy. Spl. Facilities Rev. Participating | | | | | | |
| VRDN: | | | | | | |
| Series MT 189, 3.08% (Liquidity Facility Merrill Lynch & Co., | | | | | | |
| Inc.) (a)(b)(c) | | 8,200,000 | | | | 8,200,000 |
| Series ROC II R474CE, 3.12% (Liquidity Facility Citibank | | | | | | |
| NA) (a)(b)(c) | | 2,410,000 | | | | 2,410,000 |
| New York City Muni. Wtr. Fin. Auth. Wtr. & Swr. Sys. Rev.: | | | | | | |
| Participating VRDN: | | | | | | |
| Series EGL 04 33 Class A, 3.06% (Liquidity Facility | | | | | | |
| Citibank NA) (a)(c) | | 1,925,000 | | | | 1,925,000 |
See accompanying notes which are an integral part of the financial statements.
29 Annual Report
| Fidelity New York Municipal Money Market Fund | | | | |
| Investments continued | | | | | | | | |
| |
| Municipal Securities continued | | | | | | |
| | | | | Principal | | | | Value |
| | | | | Amount | | | | (Note 1) |
| New York – continued | | | | | | | | |
| New York City Muni. Wtr. Fin. Auth. Wtr. & Swr. Sys. Rev.: - | | | | | | |
| continued | | | | | | | | |
| Participating VRDN: | | | | | | | | |
| Series EGL 04 37 Class A, 3.06% (Liquidity Facility | | | | | | |
| Citibank NA) (a)(c) | | | | $ 11,000,000 | | | | $ 11,000,000 |
| Series EGL 3207, 3.06% (Liquidity Facility Citibank NA, | | | | | | |
| New York) (a)(c) | | | | 12,900,000 | | | | 12,900,000 |
| Series EGL 7050053, 3.06% (Liquidity Facility Citibank | | | | | | |
| NA) (a)(c) | | | | 6,000,000 | | | | 6,000,000 |
| Series PA 1022, 3.07% (Liquidity Facility Merrill Lynch & | | | | | | |
| Co., Inc.) (a)(c) | | | | 24,625,000 | | | | 24,625,000 |
| Series PA 921, 3.07% (Liquidity Facility Merrill Lynch & | | | | | | |
| Co., Inc.) (a)(c) | | | | 17,300,000 | | | | 17,300,000 |
| Series PA 960, 3.07% (Liquidity Facility Merrill Lynch & | | | | | | |
| Co., Inc.) (a)(c) | | | | 20,000,000 | | | | 20,000,000 |
| Series Putters 499, 3.06% (Liquidity Facility JPMorgan | | | | | | |
| Chase Bank) (a)(c) | | | | 4,995,000 | | | | 4,995,000 |
| Series Putters 624, 3.06% (Liquidity Facility JPMorgan | | | | | | |
| Chase Bank) (a)(c) | | | | 1,695,000 | | | | 1,695,000 |
| Series Putters 998, 3.06% (Liquidity Facility JPMorgan | | | | | | |
| Chase Bank) (a)(c) | | | | 19,445,000 | | | | 19,445,000 |
| Series ROC II R1015, 3.06% (Liquidity Facility Citigroup | | | | | | |
| Global Markets Hldgs., Inc.) (a)(c) | | | | 12,330,000 | | | | 12,330,000 |
| Series ROC II R406, 3.06% (Liquidity Facility Citibank | | | | | | |
| NA) (a)(c) | | | | 17,520,000 | | | | 17,520,000 |
| Series ROC II R4061, 3.06% (Liquidity Facility Citigroup | | | | | | |
| Global Markets Hldgs., Inc.) (a)(c) | | | | 2,565,000 | | | | 2,565,000 |
| Series SGB 25, 3.06% (Liquidity Facility Societe | | | | | | |
| Generale) (a)(c) | | | | 49,900,000 | | | | 49,900,000 |
| Series Stars 05 143, 3.05% (Liquidity Facility BNP Paribas | | | | | | |
| SA) (a)(c) | | | | 5,000,000 | | | | 5,000,000 |
| Series 1, 3.14% 4/13/06 (Liquidity Facility Dexia Cr. Local | | | | | | |
| de France) (Liquidity Facility JPMorgan Chase Bank), CP | | 33,500,000 | | | | 33,500,000 |
| Series 2003 7, 3.05% 2/7/06, CP | | | | 20,000,000 | | | | 20,000,000 |
| Series 5A, 3.18% 4/13/06 (Liquidity Facility Bayerische | | | | | | |
| Landesbank Girozentrale) (Liquidity Facility WestLB AG), | | | | | | |
| CP | | | | 25,000,000 | | | | 25,000,000 |
| Series 5B: | | | | | | | | |
| 3.1% 4/13/06 (Liquidity Facility Bayerische Landesbank | | | | | | |
| Girozentrale) (Liquidity Facility WestLB AG), CP | | 21,100,000 | | | | 21,100,000 |
| 3.13% 4/10/06 (Liquidity Facility Bayerische Landesbank | | | | | | |
| Girozentrale) (Liquidity Facility WestLB AG), CP | | 17,500,000 | | | | 17,500,000 |
| |
| |
| See accompanying notes which are an integral part of the financial statements. | | | | |
| |
| Annual Report | | 30 | | | | | | |
| Municipal Securities continued | | | | | | |
| | | Principal | | | | Value |
| | | Amount | | | | (Note 1) |
| New York – continued | | | | | | |
| New York City Muni. Wtr. Fin. Auth. Wtr. & Swr. Sys. Rev.: - | | | | | | |
| continued | | | | | | |
| Series 6, 3.1% 3/8/06 (Liquidity Facility Landesbank | | | | | | |
| Baden-Wuert) (Liquidity Facility Landesbank | | | | | | |
| Hessen-Thuringen), CP | | $ 31,200,000 | | | | $ 31,200,000 |
| New York City Transitional Fin. Auth. Rev. Participating VRDN: | | | | | | |
| Series EGL 00 3203, 3.06% (Liquidity Facility Citibank NA, | | | | | | |
| New York) (a)(c) | | 7,000,000 | | | | 7,000,000 |
| Series EGL 00 3206, 3.06% (Liquidity Facility Citibank NA, | | | | | | |
| New York) (a)(c) | | 13,000,000 | | | | 13,000,000 |
| Series EGL 01 3202, 3.06% (Liquidity Facility Citibank NA, | | | | | | |
| New York) (a)(c) | | 3,300,000 | | | | 3,300,000 |
| New York Counties Tobacco Trust II Participating VRDN Series | | | | | | |
| PA 1347, 3.1% (Liquidity Facility Merrill Lynch & Co., | | | | | | |
| Inc.) (a)(c) | | 8,635,000 | | | | 8,635,000 |
| New York Local Govt. Assistance Corp. Participating VRDN | | | | | | |
| Series SG 99, 3.05% (Liquidity Facility Societe | | | | | | |
| Generale) (a)(c) | | 14,600,000 | | | | 14,600,000 |
| New York State Dorm. Auth. Revs. Participating VRDN: | | | | | | |
| Series CRVS 05 13, 3.05% (Liquidity Facility BNP Paribas | | | | | | |
| SA) (a)(c) | | 9,795,000 | | | | 9,795,000 |
| Series EGL 03 2, 3.06% (Liquidity Facility Citibank NA, New | | | | | | |
| York) (a)(c) | | 4,720,000 | | | | 4,720,000 |
| Series EGL 7050004, 3.06% (Liquidity Facility Citibank | | | | | | |
| NA) (a)(c) | | 10,800,000 | | | | 10,800,000 |
| Series IXIS 05 16, 3.05% (Liquidity Facility CDC Fin.-CDC | | | | | | |
| IXIS) (a)(c) | | 17,460,000 | | | | 17,460,000 |
| Series Merlots 00 G, 3.05% (Liquidity Facility Wachovia | | | | | | |
| Bank NA) (a)(c) | | 22,920,000 | | | | 22,920,000 |
| Series Merlots 00 X, 3.05% (Liquidity Facility Wachovia | | | | | | |
| Bank NA) (a)(c) | | 10,565,000 | | | | 10,565,000 |
| Series MS 1214, 3.04% (Liquidity Facility Morgan | | | | | | |
| Stanley) (a)(c) | | 15,865,000 | | | | 15,865,000 |
| Series MS 1215, 3.04% (Liquidity Facility Morgan | | | | | | |
| Stanley) (a)(c) | | 31,340,000 | | | | 31,340,000 |
| Series PA 1265, 3.05% (Liquidity Facility Merrill Lynch & | | | | | | |
| Co., Inc.) (a)(c) | | 15,000,000 | | | | 15,000,000 |
| Series PA 781R, 3.05% (Liquidity Facility Merrill Lynch & | | | | | | |
| Co., Inc.) (a)(c) | | 6,655,000 | | | | 6,655,000 |
| Series PT 2247, 3.05% (Liquidity Facility Merrill Lynch & Co., | | | | | | |
| Inc.) (a)(c) | | 5,180,000 | | | | 5,180,000 |
| Series PT 2541, 3.05% (Liquidity Facility Dexia Cr. Local de | | | | | | |
| France) (a)(c) | | 6,855,000 | | | | 6,855,000 |
See accompanying notes which are an integral part of the financial statements.
31 Annual Report
| Fidelity New York Municipal Money Market Fund | | | | |
| Investments continued | | | | | | |
| |
| Municipal Securities continued | | | | | | |
| | | Principal | | | | Value |
| | | Amount | | | | (Note 1) |
| New York – continued | | | | | | |
| New York State Dorm. Auth. Revs. Participating VRDN: - | | | | | | |
| continued | | | | | | |
| Series Putters 1187, 3.06% (Liquidity Facility JPMorgan | | | | | | |
| Chase Bank) (a)(c) | | $ 5,585,000 | | | | $ 5,585,000 |
| Series Putters 480, 3.06% (Liquidity Facility JPMorgan Chase | | | | | | |
| Bank) (a)(c) | | 10,400,000 | | | | 10,400,000 |
| Series Putters 588, 3.06% (Liquidity Facility JPMorgan Chase | | | | | | |
| Bank) (a)(c) | | 2,590,000 | | | | 2,590,000 |
| Series Putters 734, 3.06% (Liquidity Facility JPMorgan Chase | | | | | | |
| Bank) (a)(c) | | 1,600,000 | | | | 1,600,000 |
| Series SGA 01 132, 3.02% (Liquidity Facility Societe | | | | | | |
| Generale) (a)(c) | | 1,805,000 | | | | 1,805,000 |
| New York State Energy Research & Dev. Auth. Facilities Rev. | | | | | | |
| (Consolidated Edison Co. Proj.) Subseries C3, 3.04%, LOC | | | | | | |
| Citibank NA, VRDN (a)(b) | | 18,060,000 | | | | 18,060,000 |
| New York State Energy Research & Dev. Auth. Poll. Cont. Rev. | | | | | | |
| Participating VRDN Series MS 181, 3.08% (Liquidity Facility | | | | | | |
| Morgan Stanley) (a)(b)(c) | | 10,870,000 | | | | 10,870,000 |
| New York State Envir. Facilities Corp. Clean Wtr. & Drinking | | | | | | |
| Wtr. Rev. Participating VRDN: | | | | | | |
| Series Merlots B20, 3.05% (Liquidity Facility Wachovia Bank | | | | | | |
| NA) (a)(c) | | 5,330,000 | | | | 5,330,000 |
| Series MS 731, 3.04% (Liquidity Facility Morgan | | | | | | |
| Stanley) (a)(c) | | 13,044,500 | | | | 13,044,500 |
| Series Putters 611, 3.06% (Liquidity Facility JPMorgan Chase | | | | | | |
| & Co.) (a)(c) | | 4,735,000 | | | | 4,735,000 |
| Series Putters 613, 3.06% (Liquidity Facility JPMorgan Chase | | | | | | |
| Bank) (a)(c) | | 8,165,000 | | | | 8,165,000 |
| New York State Envir. Facilities Corp. State Wtr. Poll. Cont. | | | | | | |
| Revolving Fund Rev. Participating VRDN Series EGL 94 | | | | | | |
| 3202, 3.06% (Liquidity Facility Citibank NA, New | | | | | | |
| York) (a)(c) | | 10,000,000 | | | | 10,000,000 |
| New York State Gen. Oblig. Bonds: | | | | | | |
| Series 1997 A, 3.1% tender 4/13/06, LOC Bayerische | | | | | | |
| Landesbank Girozentrale, LOC Landesbank | | | | | | |
| Hessen-Thuringen, CP mode | | 7,500,000 | | | | 7,500,000 |
| Series 2000 D, 5.25% 7/15/06 | | 5,880,000 | | | | 5,931,445 |
| New York State Hsg. Fin. Agcy. Rev.: | | | | | | |
| (1115 First Avenue Apts. Hsg. Proj.) Series A, 3.08%, LOC | | | | | | |
| Key Bank NA, VRDN (a)(b) | | 12,900,000 | | | | 12,900,000 |
| (250 West 50th Street Hsg. Proj.) Series 1997 A, 3.05%, | | | | | | |
| LOC Fannie Mae, VRDN (a)(b) | | 10,000,000 | | | | 10,000,000 |
| (250 West 93rd Street Hsg. Proj.) Series A, 3.06%, LOC | | | | | | |
| Fleet Nat’l. Bank, VRDN (a)(b) | | 21,000,000 | | | | 21,000,000 |
| |
| See accompanying notes which are an integral part of the financial statements. | | | | |
| |
| Annual Report | | 32 | | | | |
| Municipal Securities continued | | | | | | |
| | | Principal | | | | Value |
| | | Amount | | | | (Note 1) |
| New York – continued | | | | | | |
| New York State Hsg. Fin. Agcy. Rev.: – continued | | | | | | |
| (360 West 43rd Street Hsg. Proj.) Series A, 3.03%, LOC | | | | | | |
| Fannie Mae, VRDN (a)(b) | | $12,000,000 | | | | $12,000,000 |
| (66 West 38th Street Proj.) Series A, 3.07%, LOC Fannie | | | | | | |
| Mae, VRDN (a)(b) | | 17,400,000 | | | | 17,400,000 |
| (750 Sixth Avenue Hsg. Proj.): | | | | | | |
| Series 1998 A, 3.04%, LOC Fannie Mae, VRDN (a)(b) | | 31,300,000 | | | | 31,300,000 |
| Series 1999 A, 3.04%, LOC Fannie Mae, VRDN (a)(b) | | 8,500,000 | | | | 8,500,000 |
| (Avalon Chrystie Place I Hsg. Proj.) Series A, 3.08%, LOC | | | | | | |
| Fleet Nat’l. Bank, VRDN (a)(b) | | 1,300,000 | | | | 1,300,000 |
| (Biltmore Tower Hsg. Proj.) Series A, 3.04%, LOC Fannie | | | | | | |
| Mae, VRDN (a)(b) | | 43,300,000 | | | | 43,300,000 |
| (Clinton Green North Hsg. Proj.) Series A, 3.04%, LOC Bank | | | | | | |
| of America NA, VRDN (a)(b) | | 68,500,000 | | | | 68,500,000 |
| (Clinton Green South Hsg. Proj.) Series A, 3.04%, LOC Bank | | | | | | |
| of America NA, VRDN (a)(b) | | 60,000,000 | | | | 60,000,000 |
| (East 39th Street Hsg. Proj.): | | | | | | |
| Series 1999 A, 3.04%, LOC Fannie Mae, VRDN (a)(b) | | 26,300,000 | | | | 26,300,000 |
| Series 2000 A, 3.04%, LOC Fannie Mae, VRDN (a)(b) | | 7,000,000 | | | | 7,000,000 |
| (Helena Hsg. Proj.) Series A, 3.05%, LOC Fleet Nat’l. Bank, | | | | | | |
| VRDN (a)(b) | | 7,530,000 | | | | 7,530,000 |
| (Kew Garden Hills Apts. Proj.) Series A, 3.05%, LOC Fannie | | | | | | |
| Mae, VRDN (a)(b) | | 14,700,000 | | | | 14,700,000 |
| (Reverand Polite Avenue Apts. Proj.) Series A, 3.07%, LOC | | | | | | |
| Manufacturers & Traders Trust Co., VRDN (a)(b) | | 16,000,000 | | | | 16,000,000 |
| (Sea Park West Hsg. Proj.) 3.05%, LOC Freddie Mac, | | | | | | |
| VRDN (a)(b) | | 7,400,000 | | | | 7,400,000 |
| (South Cove Plaza Proj.) Series A, 3.07%, LOC Freddie Mac, | | | | | | |
| VRDN (a)(b) | | 30,140,000 | | | | 30,140,000 |
| (Theatre Row Tower Hsg. Proj.): | | | | | | |
| Series 2000 A, 3.03%, LOC Freddie Mac, VRDN (a)(b) | | 50,000,000 | | | | 50,000,000 |
| Series 2001 A, 3.03%, LOC Freddie Mac, VRDN (a)(b) | | 5,000,000 | | | | 5,000,000 |
| (Tower 31 Hsg. Proj.) Series A, 3.05%, LOC Fleet Nat’l. | | | | | | |
| Bank, VRDN (a)(b) | | 44,800,000 | | | | 44,800,000 |
| (Worth Street Hsg. Proj.) Series A, 3.03%, LOC Fannie Mae, | | | | | | |
| VRDN (a)(b) | | 37,000,000 | | | | 37,000,000 |
| New York State Mtg. Agcy. Rev.: | | | | | | |
| Participating VRDN: | | | | | | |
| Series Merlots 00 A33, 3.05% (Liquidity Facility Wachovia | | | | | | |
| Bank NA) (a)(c) | | 2,615,000 | | | | 2,615,000 |
| Series Merlots 97 J, 3.1% (Liquidity Facility Wachovia | | | | | | |
| Bank NA) (a)(b)(c) | | 18,070,000 | | | | 18,070,000 |
See accompanying notes which are an integral part of the financial statements.
33 Annual Report
| Fidelity New York Municipal Money Market Fund | | | | |
| Investments continued | | | | | | |
| |
| Municipal Securities continued | | | | | | |
| | | Principal | | | | Value |
| | | Amount | | | | (Note 1) |
| New York – continued | | | | | | |
| New York State Mtg. Agcy. Rev.: – continued | | | | | | |
| Participating VRDN: | | | | | | |
| Series MSTC 00 89, 3.08% (Liquidity Facility Bear Stearns | | | | | | |
| Companies, Inc.) (a)(b)(c) | | $ 2,305,000 | | | | $ 2,305,000 |
| Series ROC II R181, 3.11% (Liquidity Facility Citibank | | | | | | |
| NA) (a)(b)(c) | | 5,965,000 | | | | 5,965,000 |
| Series ROC II R404, 3.1% (Liquidity Facility Citibank | | | | | | |
| NA) (a)(b)(c) | | 2,975,000 | | | | 2,975,000 |
| Series 2005 129, 3.07% (Liquidity Facility Dexia Cr. Local | | | | | | |
| de France), VRDN (a)(b) | | 20,000,000 | | | | 20,000,000 |
| 2.97% (Liquidity Facility Dexia Cr. Local de France), | | | | | | |
| VRDN (a)(b) | | 1,500,000 | | | | 1,500,000 |
| New York State Pwr. Auth. & Gen. Purp. Rev.: | | | | | | |
| Series 1: | | | | | | |
| 3.07% 3/6/06, CP | | 13,300,000 | | | | 13,300,000 |
| 3.14% 4/13/06, CP | | 20,390,000 | | | | 20,390,000 |
| Series 2, 3.08% 3/8/06, CP | | 17,000,000 | | | | 17,000,000 |
| New York State Thruway Auth. Gen. Rev. Participating VRDN: | | | | | | |
| Series EGL 7050010 Class A, 3.06% (Liquidity Facility | | | | | | |
| Citibank NA) (a)(c) | | 25,000,000 | | | | 25,000,000 |
| Series PT 3216, 3.05% (Liquidity Facility DEPFA BANK | | | | | | |
| PLC) (a)(c) | | 12,935,000 | | | | 12,935,000 |
| Series ROC II R4076, 3.06% (Liquidity Facility Citigroup, | | | | | | |
| Inc.) (a)(c) | | 12,000,000 | | | | 12,000,000 |
| New York State Thruway Auth. Hwy. & Bridge Trust Fund | | | | | | |
| Participating VRDN: | | | | | | |
| Series CRVS 05 17, 3.05% (Liquidity Facility Landesbank | | | | | | |
| Hessen-Thuringen) (a)(c) | | 10,000,000 | | | | 10,000,000 |
| Series EGL 03 17, 3.06% (Liquidity Facility Citibank NA, | | | | | | |
| New York) (a)(c) | | 1,000,000 | | | | 1,000,000 |
| Series EGL 7050079, 3.06% (Liquidity Facility Citibank | | | | | | |
| NA) (a)(c) | | 13,300,000 | | | | 13,300,000 |
| Series EGL 7050080, 3.06% (Liquidity Facility Citibank | | | | | | |
| NA) (a)(c) | | 8,000,000 | | | | 8,000,000 |
| Series MS 00 368, 3.04% (Liquidity Facility Morgan | | | | | | |
| Stanley) (a)(c) | | 1,000,000 | | | | 1,000,000 |
| Series MS 1179, 3.04% (Liquidity Facility Morgan | | | | | | |
| Stanley) (a)(c) | | 10,780,000 | | | | 10,780,000 |
| Series Putters 1047, 3.06% (Liquidity Facility JPMorgan | | | | | | |
| Chase Bank) (a)(c) | | 11,000,000 | | | | 11,000,000 |
| Series Putters 1242, 3.06% (Liquidity Facility JPMorgan | | | | | | |
| Chase Bank) (a)(c) | | 5,355,000 | | | | 5,355,000 |
See accompanying notes which are an integral part of the financial statements.
| Municipal Securities continued | | | | | | |
| | | Principal | | | | Value |
| | | Amount | | | | (Note 1) |
| New York – continued | | | | | | |
| New York State Thruway Auth. Hwy. & Bridge Trust Fund | | | | | | |
| Participating VRDN: - continued | | | | | | |
| Series Putters 1243, 3.06% (Liquidity Facility JPMorgan | | | | | | |
| Chase Bank) (a)(c) | | $ 7,500,000 | | | | $ 7,500,000 |
| Series Putters 330, 3.06% (Liquidity Facility JPMorgan Chase | | | | | | |
| & Co.) (a)(c) | | 16,285,000 | | | | 16,285,000 |
| Series ROC II R5012, 3.06% (Liquidity Facility Citigroup | | | | | | |
| Global Markets Hldgs., Inc.) (a)(c) | | 3,040,000 | | | | 3,040,000 |
| Series TOC 05 JJ, 3.05% (Liquidity Facility Goldman Sachs | | | | | | |
| Group, Inc.) (a)(c) | | 18,405,000 | | | | 18,405,000 |
| New York State Thruway Auth. State Personal Income Tax Rev. | | | | | | |
| Participating VRDN Series ROC II R6030, 3.06% (Liquidity | | | | | | |
| Facility Citibank NA) (a)(c) | | 1,995,000 | | | | 1,995,000 |
| New York State Urban Dev. Corp. Rev. Participating VRDN | | | | | | |
| Series Putters 633, 3.06% (Liquidity Facility JPMorgan Chase | | | | | | |
| Bank) (a)(c) | | 4,785,000 | | | | 4,785,000 |
| New York Transitional Fin. Auth. Rev.: | | | | | | |
| Participating VRDN: | | | | | | |
| Series EGL 03 52, 3.06% (Liquidity Facility Citibank NA, | | | | | | |
| New York) (a)(c) | | 23,700,000 | | | | 23,700,000 |
| Series EGL 04 20, 3.06% (Liquidity Facility Citibank | | | | | | |
| NA) (a)(c) | | 33,050,000 | | | | 33,050,000 |
| Series MS 00 433, 3.04% (Liquidity Facility Morgan | | | | | | |
| Stanley) (a)(c) | | 650,000 | | | | 650,000 |
| Series PA 536, 3.05% (Liquidity Facility Merrill Lynch & | | | | | | |
| Co., Inc.) (a)(c) | | 6,445,000 | | | | 6,445,000 |
| Series PT 1399, 3.05% (Liquidity Facility Merrill Lynch & | | | | | | |
| Co., Inc.) (a)(c) | | 19,490,000 | | | | 19,490,000 |
| Series PT 2271, 3.05% (Liquidity Facility Merrill Lynch & | | | | | | |
| Co., Inc.) (a)(c) | | 5,505,000 | | | | 5,505,000 |
| Series Putters 129, 3.06% (Liquidity Facility JPMorgan | | | | | | |
| Chase & Co.) (a)(c) | | 12,875,000 | | | | 12,875,000 |
| Series Putters 305, 3.06% (Liquidity Facility JPMorgan | | | | | | |
| Chase & Co.) (a)(c) | | 9,940,000 | | | | 9,940,000 |
| Series Putters 386, 3.06% (Liquidity Facility JPMorgan | | | | | | |
| Chase Bank) (a)(c) | | 4,995,000 | | | | 4,995,000 |
| Series Putters 387, 3.06% (Liquidity Facility JPMorgan | | | | | | |
| Chase Bank) (a)(c) | | 21,070,000 | | | | 21,070,000 |
| Series Putters 628, 3.06% (Liquidity Facility JPMorgan | | | | | | |
| Chase Bank) (a)(c) | | 7,385,000 | | | | 7,385,000 |
| Series Putters 830, 3.06% (Liquidity Facility JPMorgan | | | | | | |
| Chase Bank) (a)(c) | | 15,620,000 | | | | 15,620,000 |
| Series ROC II R1039, 3.06% (Liquidity Facility Citigroup | | | | | | |
| Global Markets Hldgs., Inc.) (a)(c) | | 5,820,000 | | | | 5,820,000 |
See accompanying notes which are an integral part of the financial statements.
35 Annual Report
| Fidelity New York Municipal Money Market Fund | | | | |
| Investments continued | | | | | | |
| |
| Municipal Securities continued | | | | | | |
| | | Principal | | | | Value |
| | | Amount | | | | (Note 1) |
| New York – continued | | | | | | |
| New York Transitional Fin. Auth. Rev.: - continued | | | | | | |
| Participating VRDN: | | | | | | |
| Series ROC II R3003, 3.06% (Liquidity Facility Citigroup | | | | | | |
| Global Markets Hldgs., Inc.) (a)(c) | | $ 6,675,000 | | | | $ 6,675,000 |
| Series ROC II R4052, 3.06% (Liquidity Facility Citigroup | | | | | | |
| Global Markets Hldgs., Inc.) (a)(c) | | 16,230,000 | | | | 16,230,000 |
| Series ROC II R4556, 3.06% (Liquidity Facility Citigroup | | | | | | |
| Global Markets Hldgs., Inc.) (a)(c) | | 5,200,000 | | | | 5,200,000 |
| Series 2001 B, 3.02% (Liquidity Facility Landesbank | | | | | | |
| Baden-Wuert), VRDN (a) | | 4,400,000 | | | | 4,400,000 |
| Niagara Frontier Trans. Auth. Arpt. Rev. Participating VRDN | | | | | | |
| Series Putters 121, 3.09% (Liquidity Facility JPMorgan Chase | | | | | | |
| Bank) (a)(b)(c) | | 3,495,000 | | | | 3,495,000 |
| Onondaga County Indl. Dev. Agcy. Indl. Dev. Rev. (ICM | | | | | | |
| Controls Corp. Proj.) 3.17%, LOC Manufacturers & Traders | | | | | | |
| Trust Co., VRDN (a)(b) | | 6,360,000 | | | | 6,360,000 |
| Onondaga County Indl. Dev. Auth. Civic Facility Rev. (Syracuse | | | | | | |
| Research Corp. Facility Proj.) Series 1997 A, 3.1%, LOC | | | | | | |
| Manufacturers & Traders Trust Co., VRDN (a) | | 5,240,000 | | | | 5,240,000 |
| Oyster Bay Gen. Oblig. BAN: | | | | | | |
| Series B, 3.5% 3/17/06 | | 10,000,000 | | | | 10,003,337 |
| Series C, 4% 8/25/06 | | 5,000,000 | | | | 5,027,540 |
| 4.25% 1/19/07 | | 28,100,000 | | | | 28,357,063 |
| Rensselaer Tobacco Asset Securitization Corp. Participating | | | | | | |
| VRDN Series PA 1346, 3.1% (Liquidity Facility Merrill Lynch | | | | | | |
| & Co., Inc.) (a)(c) | | 7,420,000 | | | | 7,420,000 |
| Riverhead Indl. Dev. Auth. Indl. Dev. Rev. (Adchem Corp. | | | | | | |
| Facility Proj.) Series 1998, 3.06%, LOC European American | | | | | | |
| Bank Uniondale, VRDN (a)(b) | | 3,460,000 | | | | 3,460,000 |
| Rochester Gen. Oblig. BAN Series II, 4% 10/20/06 | | 46,200,000 | | | | 46,494,830 |
| Sales Tax Asset Receivables Corp. Participating VRDN: | | | | | | |
| Series MS 984, 3.04% (Liquidity Facility Morgan | | | | | | |
| Stanley) (a)(c) | | 20,525,000 | | | | 20,525,000 |
| Series Putters 1173T, 3.06% (Liquidity Facility JPMorgan | | | | | | |
| Chase Bank) (a)(c) | | 10,345,000 | | | | 10,345,000 |
| Series Putters 1225T, 3.06% (Liquidity Facility JPMorgan | | | | | | |
| Chase Bank) (a)(c) | | 5,350,000 | | | | 5,350,000 |
| Series Putters 564, 3.06% (Liquidity Facility JPMorgan Chase | | | | | | |
| Bank) (a)(c) | | 7,170,000 | | | | 7,170,000 |
| Series Putters 599, 3.06% (Liquidity Facility JPMorgan Chase | | | | | | |
| Bank) (a)(c) | | 2,250,000 | | | | 2,250,000 |
| Suffolk County Gen. Oblig.: | | | | | | |
| Participating VRDN Series PT 2201, 3.05% (Liquidity Facility | | | | | | |
| Merrill Lynch & Co., Inc.) (a)(c) | | 6,310,000 | | | | 6,310,000 |
See accompanying notes which are an integral part of the financial statements.
| Municipal Securities continued | | | | | | |
| | | Principal | | | | Value |
| | | Amount | | | | (Note 1) |
| New York – continued | | | | | | |
| Suffolk County Gen. Oblig.: - continued | | | | | | |
| TAN: | | | | | | |
| Series II, 4.5% 9/7/06 | | $ 6,000,000 | | | | $ 6,050,685 |
| 4% 8/16/06 | | 86,900,000 | | | | 87,265,432 |
| Suffolk County Indl. Dev. Agcy. Civic Facility Rev. (Maryhaven | | | | | | |
| Ctr. of Hope Proj.) Series 1997 A, 3.1%, LOC Key Bank NA, | | | | | | |
| VRDN (a) | | 990,000 | | | | 990,000 |
| Syracuse Ind. Dev. Agcy. Civic Fac. Rev. (Crouse-Irving Hosp. | | | | | | |
| Health Proj.) Series A, 3.05%, LOC Manufacturers & Traders | | | | | | |
| Trust Co., VRDN (a) | | 5,500,000 | | | | 5,500,000 |
| Tobacco Settlement Fing. Corp. Participating VRDN: | | | | | | |
| Series PT 2056, 3.08% (Liquidity Facility Merrill Lynch & Co., | | | | | | |
| Inc.) (a)(c) | | 17,850,000 | | | | 17,850,000 |
| Series PT 835, 3.08% (Liquidity Facility Landesbank | | | | | | |
| Hessen-Thuringen) (a)(c) | | 25,650,000 | | | | 25,650,000 |
| Series PT 875, 3.05% (Liquidity Facility Landesbank | | | | | | |
| Hessen-Thuringen) (a)(c) | | 4,450,000 | | | | 4,450,000 |
| Series PT 893, 3.08% (Liquidity Facility DEPFA BANK | | | | | | |
| PLC) (a)(c) | | 43,090,000 | | | | 43,090,000 |
| Series Putters 533, 3.06% (Liquidity Facility JPMorgan Chase | | | | | | |
| Bank) (a)(c) | | 5,295,000 | | | | 5,295,000 |
| Series Putters 600, 3.06% (Liquidity Facility JPMorgan Chase | | | | | | |
| & Co.) (a)(c) | | 5,275,000 | | | | 5,275,000 |
| Series Putters 680, 3.06% (Liquidity Facility JPMorgan Chase | | | | | | |
| & Co.) (a)(c) | | 10,640,000 | | | | 10,640,000 |
| Series ROC II R4508, 3.07% (Liquidity Facility Citigroup | | | | | | |
| Global Markets Hldgs., Inc.) (a)(c) | | 5,700,000 | | | | 5,700,000 |
| Series ROC II R6500, 3.07% (Liquidity Facility Citibank | | | | | | |
| NA) (a)(c) | | 2,630,000 | | | | 2,630,000 |
| Tompkins County Indl. Dev. Agcy. Rev. (Civic Facilities Proj.) | | | | | | |
| Series A, 3.12%, LOC Manufacturers & Traders Trust Co., | | | | | | |
| VRDN (a) | | 13,500,000 | | | | 13,500,000 |
| Triborough Bridge & Tunnel Auth. Revs. Participating VRDN: | | | | | | |
| Series EGL 02 6011, 3.06% (Liquidity Facility Citibank NA, | | | | | | |
| New York) (a)(c) | | 3,500,000 | | | | 3,500,000 |
| Series EGL 02 6024, 3.06% (Liquidity Facility Citibank NA, | | | | | | |
| New York) (a)(c) | | 13,690,000 | | | | 13,690,000 |
| Series EGL 03 55, 3.06% (Liquidity Facility Citibank NA, | | | | | | |
| New York) (a)(c) | | 4,000,000 | | | | 4,000,000 |
| Series PA 1070, 3.07% (Liquidity Facility Merrill Lynch & | | | | | | |
| Co., Inc.) (a)(c) | | 15,995,000 | | | | 15,995,000 |
| Series PA 1074, 3.07% (Liquidity Facility Merrill Lynch & | | | | | | |
| Co., Inc.) (a)(c) | | 17,400,000 | | | | 17,400,000 |
See accompanying notes which are an integral part of the financial statements.
37 Annual Report
| Fidelity New York Municipal Money Market Fund | | |
| Investments continued | | | | |
| |
| Municipal Securities continued | | | | |
| | | Principal | | Value |
| | | Amount | | (Note 1) |
| New York – continued | | | | |
| Triborough Bridge & Tunnel Auth. Revs. Participating VRDN: - | | | | |
| continued | | | | |
| Series PA 948, 3.07% (Liquidity Facility Merrill Lynch & Co., | | | | |
| Inc.) (a)(c) | | $ 17,590,000 | | $ 17,590,000 |
| Series PA 956, 3.07% (Liquidity Facility Merrill Lynch & Co., | | | | |
| Inc.) (a)(c) | | 8,995,000 | | 8,995,000 |
| Series PT 1092, 3.05% (Liquidity Facility Merrill Lynch & Co., | | | | |
| Inc.) (a)(c) | | 5,045,000 | | 5,045,000 |
| Series ROC II R1008, 3.06% (Liquidity Facility Citigroup | | | | |
| Global Markets Hldgs., Inc.) (a)(c) | | 7,515,000 | | 7,515,000 |
| Series SGB 43, 3.06% (Liquidity Facility Societe | | | | |
| Generale) (a)(c) | | 3,650,000 | | 3,650,000 |
| Ulster County Indl. Dev. Agcy. I (Selux Corp. Proj.) Series A, | | | | |
| 3.17%, LOC Manufacturers & Traders Trust Co., VRDN (a)(b) | | 940,000 | | 940,000 |
| Upstate Telecommunications Corp. Rev. 3.07%, LOC | | | | |
| Manufacturers & Traders Trust Co., VRDN (a) | | 16,565,000 | | 16,565,000 |
| West Islip Union Free School District TAN 3.5% 6/29/06 | | 8,000,000 | | 8,016,210 |
| Westchester Tobacco Asset Securitization Corp. Participating | | | | |
| VRDN Series PA 1322, 3.1% (Liquidity Facility Merrill Lynch | | | | |
| & Co., Inc.) (a)(c) | | 13,680,000 | | 13,680,000 |
| | | | | 3,197,472,010 |
| |
| New York & New Jersey – 4.8% | | | | |
| Port Auth. of New York & New Jersey: | | | | |
| Bonds 107th Series, 6% 10/15/06 (b) | | 2,840,000 | | 2,896,015 |
| Participating VRDN: | | | | |
| Series CRVS 05 16, 3.08% (Liquidity Facility BNP Paribas | | | | |
| SA) (a)(b)(c) | | 6,025,000 | | 6,025,000 |
| Series MT 56, 3.07% (Liquidity Facility BNP Paribas | | | | |
| SA) (a)(b)(c) | | 10,000,000 | | 10,000,000 |
| Series PA 1251, 3.07% (Liquidity Facility Merrill Lynch & | | | | |
| Co., Inc.) (a)(c) | | 9,800,000 | | 9,800,000 |
| Series PA 1271, 3.07% (Liquidity Facility Merrill Lynch & | | | | |
| Co., Inc.) (a)(b)(c) | | 1,335,000 | | 1,335,000 |
| Series PA 1329, 3.07% (Liquidity Facility Merrill Lynch & | | | | |
| Co., Inc.) (a)(b)(c) | | 13,330,000 | | 13,330,000 |
| Series PT 2199, 3.05% (Liquidity Facility Merrill Lynch & | | | | |
| Co., Inc.) (a)(b)(c) | | 14,655,000 | | 14,655,000 |
| Series PT 2700, 3.07% (Liquidity Facility Merrill Lynch & | | | | |
| Co., Inc.) (a)(b)(c) | | 14,640,000 | | 14,640,000 |
| Series PT 3177, 3.07% (Liquidity Facility Merrill Lynch & | | | | |
| Co., Inc.) (a)(b)(c) | | 6,585,000 | | 6,585,000 |
See accompanying notes which are an integral part of the financial statements.
| Municipal Securities continued | | | | |
| | | | | Principal | | Value |
| | | | | Amount | | (Note 1) |
| New York & New Jersey – continued | | | | | | |
| Port Auth. of New York & New Jersey: – continued | | | | |
| Participating VRDN: | | | | | | |
| Series Putters 1095, 3.09% (Liquidity Facility JPMorgan | | | | |
| Chase & Co.) (a)(b)(c) | | | | $ 2,980,000 | | $ 2,980,000 |
| Series Putters 153, 3.09% (Liquidity Facility JPMorgan | | | | |
| Chase Bank) (a)(b)(c) | | | | 4,000,000 | | 4,000,000 |
| Series ROC II 238, 3.1% (Liquidity Facility Citibank | | | | |
| NA) (a)(b)(c) | | | | 3,460,000 | | 3,460,000 |
| Series ROC II R42, 3.1% (Liquidity Facility Citibank | | | | |
| NA) (a)(b)(c) | | | | 6,155,000 | | 6,155,000 |
| Series Stars 121, 3.07% (Liquidity Facility BNP Paribas | | | | |
| SA) (a)(b)(c) | | | | 6,880,000 | | 6,880,000 |
| Series 1991 2, 3.1%, VRDN (a)(b)(d) | | | | 6,400,000 | | 6,400,000 |
| Series 2001 2, 3.15%, VRDN (a)(b) | | | | 11,500,000 | | 11,500,000 |
| Series 2004 2, 3.05%, VRDN (a) | | | | 8,300,000 | | 8,300,000 |
| Series 2004 3, 3.05%, VRDN (a) | | | | 5,365,000 | | 5,365,000 |
| Series 2004 4, 3.15%, VRDN (a)(b) | | | | 3,540,000 | | 3,540,000 |
| Series A, 3.16% 3/7/06 (Liquidity Facility Landesbank | | | | |
| Hessen-Thuringen), CP (b) | | | | 6,015,000 | | 6,015,000 |
| Series B, 3.13% 4/7/06 (Liquidity Facility Landesbank | | | | |
| Hessen-Thuringen), CP | | | | 13,000,000 | | 13,000,000 |
| Port Auth. of New York & New Jersey Spl. Oblig. Rev.: | | | | |
| Participating VRDN: | | | | | | |
| Series Merlots 00 B5, 3.1% (Liquidity Facility Wachovia | | | | |
| Bank NA) (a)(b)(c) | | | | 2,255,000 | | 2,255,000 |
| Series PA 1258, 3.07% (Liquidity Facility Merrill Lynch & | | | | |
| Co., Inc.) (a)(b)(c) | | | | 3,000,000 | | 3,000,000 |
| Series 4, 3.11%, VRDN (a)(b) | | | | 7,500,000 | | 7,500,000 |
| | | | | | | 169,616,015 |
| |
| Puerto Rico 0.2% | | | | | | |
| Puerto Rico Elec. Pwr. Auth. Pwr. Rev. Participating VRDN | | | | |
| Series Putters 815, 3.05% (Liquidity Facility JPMorgan Chase | | | | |
| Bank) (a)(c) | | | | 7,985,000 | | 7,985,000 |
| |
| TOTAL INVESTMENT PORTFOLIO 94.2% | | | | | | |
| (Cost $3,375,073,025) | | | | | | 3,375,073,025 |
| |
| NET OTHER ASSETS – 5.8% | | | | | | 208,819,269 |
| NET ASSETS 100% | | | | $ 3,583,892,294 |
See accompanying notes which are an integral part of the financial statements.
39 Annual Report
Fidelity New York Municipal Money Market Fund
Investments continued
|
| Security Type Abbreviations |
| BAN | | — | | BOND ANTICIPATION NOTE |
| CP | | — | | COMMERCIAL PAPER |
| TAN | | — | | TAX ANTICIPATION NOTE |
| VRDN | | — | | VARIABLE RATE DEMAND NOTE |
Legend
(a) The coupon rate shown on floating or
adjustable rate securities represents the
rate at period end.
(b) Private activity obligations whose
interest is subject to the federal
alternative minimum tax for individuals
(c) Provides evidence of ownership in one
or more underlying municipal bonds.
|
(d) Restricted securities – Investment in
securities not registered under the
Securities Act of 1933 (excluding 144A
issues). At the end of the period, the
value of restricted securities (excluding
144A issues) amounted to $22,100,000
or 0.6% of net assets.
|
Additional information on each holding is as follows:
| | | Acquisition | | |
| Security | | Date | | Cost |
| Bank of New York | | | | |
| Muni. Ctfs. trust | | | | |
| various states | | | | |
| Bonds Series BNY | | | | |
| 05 4, 3.13%, | | | | |
| tender 4/25/06 | | | | |
| (Liquidity Facility | | | | |
| Bank of New | | | | |
| York, New York) | | 11/14/05 | | $15,700,000 |
| Port Auth. of New | | | | |
| York & New | | | | |
| Jersey Series | | | | |
| 1991 2, 3.1%, | | | | |
| VRDN | | 12/3/03 | | $ 6,400,000 |
Affiliated Central Funds
Information regarding fiscal year to date income received by the fund from the affiliated Central funds is as follows:
| Fund | | | | Income received |
| Fidelity Municipal Cash Central Fund | | | $ | 33,521 |
See accompanying notes which are an integral part of the financial statements.
Annual Report 40
| Fidelity New York Municipal Money Market Fund | | | | |
| |
| Financial Statements | | | | | | | | |
| |
| Statement of Assets and Liabilities | | | | | | | | |
| | | | | | | | | January 31, 2006 |
| |
| Assets | | | | | | | | |
| Investment in securities, at value See accompanying | | | | | | | | |
| schedule: | | | | | | | | |
| Unaffiliated issuers (cost $3,375,073,025) | | | | | | $3,375,073,025 |
| Cash | | | | | | | | 165,411,165 |
| Receivable for investments sold | | | | | | | | 15,691,024 |
| Receivable for fund shares sold | | | | | | | | 64,828,357 |
| Interest receivable | | | | | | | | 19,194,744 |
| Prepaid expenses | | | | | | | | 14,244 |
| Other receivables | | | | | | | | 394,412 |
| Total assets | | | | | | | | 3,640,606,971 |
| |
| Liabilities | | | | | | | | |
| Payable for fund shares redeemed | | | | $ 55,063,731 | | | | |
| Distributions payable | | | | 111,880 | | | | |
| Accrued management fee | | | | 1,089,567 | | | | |
| Other affiliated payables | | | | 378,257 | | | | |
| Other payables and accrued expenses | | | | 71,242 | | | | |
| Total liabilities | | | | | | | | 56,714,677 |
| |
| Net Assets | | | | | | $ 3,583,892,294 |
| Net Assets consist of: | | | | | | | | |
| Paid in capital | | | | | | $3,583,837,091 |
| Undistributed net investment income | | | | | | | | 55,203 |
| Net Assets, for 3,581,352,943 shares outstanding | | | | | | $ 3,583,892,294 |
| Net Asset Value, offering price and redemption price per | | | | | | |
| share ($3,583,892,294 ÷ 3,581,352,943 shares) | | | | | | | | $ 1.00 |
See accompanying notes which are an integral part of the financial statements.
41 Annual Report
| Fidelity New York Municipal Money Market Fund | | |
| Financial Statements continued | | | | |
| |
| Statement of Operations | | | | |
| | | Year ended January 31, 2006 |
| |
| Investment Income | | | | |
| Interest | | | | $ 82,462,566 |
| Income from affiliated Central Funds | | | | 33,521 |
| Total income | | | | 82,496,087 |
| |
| Expenses | | | | |
| Management fee | | $ 12,387,629 | | |
| Transfer agent fees | | 4,048,546 | | |
| Accounting fees and expenses | | 286,465 | | |
| Independent trustees’ compensation | | 14,619 | | |
| Custodian fees and expenses | | 51,447 | | |
| Registration fees | | 76,102 | | |
| Audit | | 52,998 | | |
| Legal | | 19,562 | | |
| Miscellaneous | | 20,095 | | |
| Total expenses before reductions | | 16,957,463 | | |
| Expense reductions | | (3,512,713) | | 13,444,750 |
| |
| Net investment income | | | | 69,051,337 |
| Realized and Unrealized Gain (Loss) | | | | |
| Net realized gain (loss) on: | | | | |
| Investment securities: | | | | |
| Unaffiliated issuers | | | | 149,598 |
| Net increase in net assets resulting from operations | | | | $ 69,200,935 |
See accompanying notes which are an integral part of the financial statements.
| Statement of Changes in Net Assets | | | | | | |
| | | Year ended | | | | Year ended |
| | | January 31, | | | | January 31, |
| | | 2006 | | | | 2005 |
| Increase (Decrease) in Net Assets | | | | | | |
| Operations | | | | | | |
| Net investment income | | $ 69,051,337 | | | | $ 24,094,509 |
| Net realized gain (loss) | | 149,598 | | | | 1,413,026 |
| Net increase in net assets resulting | | | | | | |
| from operations | | 69,200,935 | | | | 25,507,535 |
| Distributions to shareholders from net investment income | | (69,025,239) | | | | (24,134,841) |
| Distributions to shareholders from net realized gain | | (331,739) | | | | — |
| Total distributions | | (69,356,978) | | | | (24,134,841) |
| Share transactions at net asset value of $1.00 per share | | | | | | |
| Proceeds from sales of shares | | 10,562,142,297 | | | | 8,221,066,689 |
| Reinvestment of distributions | | 68,497,185 | | | | 23,877,146 |
| Cost of shares redeemed | | (10,264,518,865) | | | | (7,834,693,170) |
| Net increase (decrease) in net assets and shares | | | | | | |
| resulting from share transactions | | 366,120,617 | | | | 410,250,665 |
| Total increase (decrease) in net assets | | 365,964,574 | | | | 411,623,359 |
| |
| Net Assets | | | | | | |
| Beginning of period | | 3,217,927,720 | | | | 2,806,304,361 |
| End of period (including undistributed net investment | | | | | | |
| income of $55,203 and distributions in excess of | | | | | | |
| net investment income of $29,951, respectively) | | $ 3,583,892,294 | | | | $ 3,217,927,720 |
See accompanying notes which are an integral part of the financial statements.
43 Annual Report
| Financial Highlights | | | | | | | | | | |
| |
| | | | | Years ended January 31, |
| | | | | 2006 | | 2005 | | 2004 | | 2003 | | 2002 |
| Selected Per Share Data | | | | | | | | | | | | |
| Net asset value, | | | | | | | | | | | | |
| beginning of period | | | | $ 1.00 | | $ 1.00 | | $ 1.00 | | $ 1.00 | | $ 1.00 |
| Income from Investment | | | | | | | | | | | | |
| Operations | | | | | | | | | | | | |
| Net investment income | | | | .021 | | .008 | | .006 | | .010 | | .021 |
| Net realized and | | | | | | | | | | | | |
| unrealized gain | | | | | | | | | | | | |
| (loss)C | | | | — | | — | | — | | — | | — |
| Total from investment | | | | | | | | | | | | |
| operations | | | | 021 | | .008 | | .006 | | .010 | | .021 |
| Distributions from net | | | | | | | | | | | | |
| investment income | | | | (.021) | | (.008) | | (.006) | | (.010) | | (.021) |
| Distributions from net | | | | | | | | | | | | |
| realized gain | | | | —C | | — | | — | | — | | — |
| Total distributions | | | | (.021) | | (.008) | | (.006) | | (.010) | | (.021) |
| Net asset value, end of | | | | | | | | | | | | |
| period | | | | $ 1.00 | | $ 1.00 | | $ 1.00 | | $ 1.00 | | $ 1.00 |
| Total ReturnA | | | | 2.11% | | .80% | | .61% | | 1.02% | | 2.14% |
| Ratios to Average Net AssetsB | | | | | | | | |
| Expenses before | | | | | | | | | | | | |
| reductions | | | | 51% | | .52% | | .51% | | .51% | | .52% |
| Expenses net of fee | | | | | | | | | | | | |
| waivers, if any | | | | 51% | | .52% | | .51% | | .51% | | .52% |
| Expenses net of all | | | | | | | | | | | | |
| reductions | | | | 40% | | .50% | | .50% | | .48% | | .48% |
| Net investment income | | | | 2.08% | | .81% | | .61% | | 1.01% | | 2.09% |
| Supplemental Data | | | | | | | | | | | | |
| Net assets, end of | | | | | | | | | | | | |
| period (000 omitted) | | | | $3,583,892 | | $3,217,928 | | $2,806,304 | | $2,744,750 | | $2,465,502 |
A Total returns would have been lower had certain expenses not been reduced during the periods shown.
B Expense ratios reflect operating expenses of the fund. Expenses before reductions do not reflect amounts reimbursed by the investment adviser or
expense offset arrangements and do not represent the amount paid by the fund during periods when reimbursements or reductions occur.
Expenses net of fee waivers reflect expenses after reimbursement by the investment adviser but prior to reductions from expense offset arrange
ments. Expenses net of all reductions represent the net expenses paid by the fund.
C Amount represents less than $.001 per share.
|
See accompanying notes which are an integral part of the financial statements.
Notes to Financial Statements
For the period ended January 31, 2006
|
1. Significant Accounting Policies.
Fidelity New York AMT Tax Free Money Market Fund and Fidelity New York Municipal Money Market Fund (the funds) are funds of Fidelity New York Municipal Trust II (the trust). On July 21, 2005, the Board of Trustees approved a change in the name of Spartan New York Municipal Money Market Fund to Fidelity New York AMT Tax Free Money Market Fund effective August 15, 2005. The trust is registered under the Investment Company Act of 1940, as amended (the 1940 Act), as an open end management invest ment company organized as a Delaware statutory trust. Each fund is authorized to issue an unlimited number of shares. Each fund may be affected by economic and political developments in the state of New York. Certain funds may invest in affiliated money market central funds (Money Market Central Funds) which are open end investment companies available to investment companies and other accounts managed by Fidelity Management & Research Company (FMR) and its affiliates. The financial statements have been prepared in conformity with accounting principles generally accepted in the United States of America, which require management to make certain estimates and assumptions at the date of the financial statements. The following summarizes the significant accounting policies of the funds:
Security Valuation. Net asset value per share is calculated as of the close of business of the New York Stock Exchange, normally 4:00 p.m. Eastern time. As permitted by com pliance with certain conditions under Rule 2a 7 of the 1940 Act, securities are valued at amortized cost, which approximates value. Investments in open end mutual funds are valued at their closing net asset value each business day.
Investment Transactions and Income. Security transactions are accounted for as of trade date. Gains and losses on securities sold are determined on the basis of identified cost. Interest income is accrued as earned. Interest income includes coupon interest and amortization of premium and accretion of discount on debt securities.
Expenses. Most expenses of the trust can be directly attributed to a fund. Expenses which cannot be directly attributed are apportioned among each fund in the trust.
Income Tax Information and Distributions to Shareholders. Each year, each fund intends to qualify as a regulated investment company by distributing all of its taxable income and realized gains under Subchapter M of the Internal Revenue Code. As a result, no provision for income taxes is required in the accompanying financial statements.
Dividends are declared daily and paid monthly from net investment income. Distribu tions from realized gains, if any, are recorded on the ex dividend date. Income and capital gain distributions are determined in accordance with income tax regulations, which may differ from generally accepted accounting principles. In addition, certain funds will claim a portion of the payment made to redeeming shareholders as a distribu tion for income tax purposes.
45 Annual Report
| Notes to Financial Statements continued | | |
1. Significant Accounting Policies continued | | |
Income Tax Information and Distributions to Shareholders continued |
Capital accounts within the financial statements are adjusted for permanent book tax differences. These adjustments have no impact on net assets or the results of operations. Temporary book tax differences will reverse in a subsequent period.
Book tax differences are primarily due to deferred trustees compensation and losses deferred due to wash sales and excise tax regulations.
The fund purchases municipal securities whose interest, in the opinion of the issuer, is free from federal income tax. There is no assurance that the Internal Revenue Service (IRS) will agree with this opinion. In the event the IRS determines that the issuer does not comply with relevant tax requirements, interest payments from a security could become federally taxable, possibly retroactively to the date the security was issued.
The tax basis components of distributable earnings and the federal tax cost as of period end were as follows for each fund:
| | | Cost for Federal | | | | | | | | | | Net Unrealized |
| | | Income Tax | | Unrealized | | | | Unrealized | | Appreciation/ |
| | | Purposes | | Appreciation | | | | Depreciation | | (Depreciation) |
| Fidelity New York AMT | | | | | | | | | | | | |
| Tax Free Money | | | | | | | | | | | | |
| Market Fund | | $ | | 1,491,785,100 | | $ | | — | | | $ | | | — | | $ | | — |
| Fidelity New York | | | | | | | | | | | | |
| Municipal Money | | | | | | | | | | | | |
| Market Fund | | | | 3,375,073,025 | | | | — | | | | | | — | | | | — |
| |
| | | | | | | | | | | Undistributed |
| | | | | | | | | | | Ordinary Income |
| Fidelity New York AMT TaxFree Money Market Fund | | | | | | | | $ | | 163,349 |
| Fidelity New York Municipal Money Market Fund | | | | | | | | | | 58,486 |
| 1. Significant Accounting Policies continued | | |
Income Tax Information and Distributions to Shareholders continued |
The tax character of distributions paid was as follows: | | |
| | | | | Tax-exempt | | | | Ordinary | | | | Long-term | | | | |
| January 31, 2006 | | | | Income | | | | Income | | | | Capital Gains | | | | Total |
| Fidelity New York AMT | | | | | | | | | | | | | | | | |
| TaxFree Money | | | | | | | | | | | | | | | | |
| Market Fund | | | $ | 30,266,254 | | | $ | — | | | $ | — | | | $ | 30,266,254 |
| Fidelity New York | | | | | | | | | | | | | | | | |
| Municipal Money | | | | | | | | | | | | | | | | |
| Market Fund | | | | 69,025,239 | | | | — | | | | 331,739 | | | | 69,356,978 |
| |
| | | | | Tax-exempt | | | | Ordinary | | | | Long-term | | | | |
| January 31, 2005 | | | | Income | | | | Income | | | | Capital Gains | | | | Total |
| Fidelity New York AMT | | | | | | | | | | | | | | | | |
| TaxFree Money | | | | | | | | | | | | | | | | |
| Market Fund | | | $ | 10,145,141 | | | $ | 113,567 | | | $ | 113,568 | | | $ | 10,372,276 |
| Fidelity New York | | | | | | | | | | | | | | | | |
| Municipal Money | | | | | | | | | | | | | | | | |
| Market Fund | | | | 24,134,841 | | | | — | | | | — | | | | 24,134,841 |
| |
| 2. Operating Policies. | | | | | | | | | | | | |
Restricted Securities. Certain funds may invest in securities that are subject to legal or contractual restrictions on resale. These securities generally may be resold in transac tions exempt from registration or to the public if the securities are registered. Disposal of these securities may involve time consuming negotiations and expense, and prompt sale at an acceptable price may be difficult. Information regarding restricted securities is included at the end of each applicable fund’s Schedule of Investments.
3. Fees and Other Transactions with Affiliates.
Management Fee. FMR and its affiliates provide the Fidelity New York Municipal Money Market Fund with investment management related services for which the fund pays a monthly management fee. The management fee is the sum of an individual fund fee rate that is based on an annual rate of .25% of the fund’s average net assets and a group fee rate that averaged .12% during the period. The group fee rate is based upon the average net assets of all the mutual funds advised by FMR. The group fee rate decreases as assets under management increase and increases as assets under management decrease. For the period, the total annual management fee rate was .37% of the fund’s average net assets.
FMR and its affiliates provide the Fidelity New York AMT Tax Free Money Market Fund with investment management related services for which the fund pays a monthly
47 Annual Report
| Notes to Financial Statements continued | | |
3. Fees and Other Transactions with Affiliates continued |
Management Fee continued | | |
management fee that is based on an annual rate of .43% of the fund’s average net assets. FMR pays all other expenses, except the compensation of the independent Trustees and certain exceptions such as interest expense. The management fee paid to FMR by the fund is reduced by an amount equal to the fees and expenses paid by the fund to the independent Trustees.
Transfer Agent and Accounting Fees. Citibank, N.A. (Citibank) is the custodian, transfer agent and shareholder servicing agent for the Fidelity New York Municipal Money Market Fund. Citibank has entered into a sub arrangement with Fidelity Service Company, Inc. (FSC), an affiliate of FMR, under which FSC performs the activities associated with the fund’s transfer and shareholder servicing agent and accounting functions. The fund pays account fees and asset based fees that vary according to account size and type of account. FSC pays for typesetting, printing and mailing of shareholder reports, except proxy statements. The accounting fee is based on the level of average net assets for the month. For the period, the transfer agent fees were equivalent to an annual rate of .12% of average net assets.
Affiliated Central Funds. Certain funds may invest in Money Market Central Funds which seek preservation of capital and current income and are managed by Fidelity Investments Money Management, Inc. (FIMM) an affiliate of FMR. The Money Market Central Funds do not pay a management fee.
FMR voluntarily agreed to reimburse funds to the extent annual operating expenses exceeded certain levels of average net assets as noted in the table below. Some expenses, for example interest expense, are excluded from this reimbursement.
The following funds were in reimbursement during the period:
| | | | |
| | | Expense | | | | Reimbursement |
| | | Limitations | | | | from adviser |
| Fidelity New York AMT Tax Free Money Market Fund | | 40% | | | $ | 406,592 |
In addition, through an arrangement with Fidelity New York AMT Tax Free Money Market Fund’s custodian and transfer agent, $1,116,143 of credits realized as a result of uninvested cash balances were used to reduce the fund’s management fee.
4. Expense Reductions - continued
Through arrangements with Fidelity New York Municipal Money Market Fund’s custo dian and transfer agent, credits realized as a result of uninvested cash balances were used to reduce fund expenses. These expense reductions are noted in the table below.
| | | | | | | | | Transfer | | | | |
| | | | | Custody | | | | Agent | | | | Accounting |
| | | | | expense | | | | expense | | | | expense |
| | | | | reduction | | | | reduction | | | | reduction |
| Fidelity New York Municipal Money | | | | | | | | | | | | |
| Market Fund | | | $ | 51,447 | | | $ | 3,355,296 | | | $ | 105,970 |
| |
| |
| 5. Other. | | | | | | | | | | | | |
The funds’ organizational documents provide former and current trustees and officers with a limited indemnification against liabilities arising in connection with the performance of their duties to the funds. In the normal course of business, the funds may also enter into contracts that provide general indemnifications. The funds’ maximum exposure under these arrangements is unknown as this would be dependent on future claims that may be made against the funds. The risk of material loss from such claims is considered remote.
49 Annual Report
Report of Independent Registered Public Accounting Firm
To the Trustees of Fidelity New York Municipal Trust II and the Shareholders of Fidelity New York AMT Tax Free Money Market Fund (formerly Spartan New York Municipal Money Market Fund) and Fidelity New York Municipal Money Market Fund:
We have audited the accompanying statements of assets and liabilities of Fidelity New York AMT Tax Free Money Market Fund and Fidelity New York Municipal Money Market Fund (funds of Fidelity New York Municipal Trust II), including the schedules of invest ments, as of January 31, 2006, and the related statements of operations for the year then ended, the statements of changes in net assets for each of the two years in the period then ended, and the financial highlights for each of the five years in the period then ended. These financial statements and financial highlights are the responsibility of the Funds’ management. Our responsibility is to express an opinion on these financial statements and financial highlights based on our audits.
We conducted our audits in accordance with standards of the Public Company Accounting Oversight Board (United States). Those standards require that we plan and perform the audit to obtain reasonable assurance about whether the financial statements and financial highlights are free of material misstatement. The Funds are not required to have, nor were we engaged to perform, an audit of their internal control over financial reporting. Our audits included consideration of internal control over financial reporting as a basis for designing audit procedures that are appropriate in the circumstances, but not for the purpose of expressing an opinion on the effectiveness of the Funds’ internal control over financial reporting. Accordingly, we express no such opinion. An audit also includes examining, on a test basis, evidence supporting the amounts and disclosures in the financial statements, assessing the accounting principles used and significant estimates made by management, as well as evaluating the overall financial statement presentation. Our procedures included confirmation of securities owned as of January 31, 2006, by correspondence with the custodians and brokers. We believe that our audits provide a reasonable basis for our opinion.
In our opinion, the financial statements and financial highlights referred to above present fairly, in all material respects, the financial position of Fidelity New York AMT Tax Free Money Market Fund and Fidelity New York Municipal Money Market Fund as of Janu ary 31, 2006, the results of their operations for the year then ended, the changes in their net assets for each of the two years in the period then ended, and their financial highlights for each of the five years in the period then ended, in conformity with accounting prin ciples generally accepted in the United States of America.
/s/ Deloitte & Touche LLP
DELOITTE & TOUCHE LLP
Boston, Massachusetts
March 10, 2006
|
Trustees and Officers
The Trustees, Members of the Advisory Board, and executive officers of the trust and funds, as applicable, are listed below. The Board of Trustees governs each fund and is responsible for protecting the interests of shareholders. The Trustees are experienced executives who meet periodically throughout the year to oversee each fund’s activities, review contractual arrangements with companies that provide services to each fund, and review each fund’s performance. Except for William O. McCoy and Albert R. Gamper, Jr., each of the Trustees oversees 326 funds advised by FMR or an affiliate. Mr. McCoy oversees 328 funds advised by FMR or an affiliate. Mr. Gamper oversees 251 funds advised by FMR or an affiliate.
The Trustees hold office without limit in time except that (a) any Trustee may resign; (b) any Trustee may be removed by written instrument, signed by at least two thirds of the number of Trustees prior to such removal; (c) any Trustee who requests to be retired or who has become incapacitated by illness or injury may be retired by written instru ment signed by a majority of the other Trustees; and (d) any Trustee may be removed at any special meeting of shareholders by a two thirds vote of the outstanding voting securities of the trust. Each Trustee who is not an interested person (as defined in the 1940 Act) (Independent Trustee), shall retire not later than the last day of the calendar year in which his or her 72nd birthday occurs. The Independent Trustees may waive this mandatory retirement age policy with respect to individual Trustees. The executive officers and Advisory Board Members hold office without limit in time, except that any officer and Advisory Board Member may resign or may be removed by a vote of a majority of the Trustees at any regular meeting or any special meeting of the Trustees. Except as indicated, each individual has held the office shown or other offices in the same company for the past five years.
The funds’ Statement of Additional Information (SAI) includes more information about the Trustees. To request a free copy, call Fidelity at 1-800-544-8544.
Correspondence intended for each Trustee who is an interested person may be sent to Fidelity Investments, 82 Devonshire Street, Boston, Massachusetts 02109.
| | Name, Age; Principal Occupation
Edward C. Johnson 3d (75)
|
Year of Election or Appointment: 1991
Mr. Johnson is Chairman of the Board of Trustees. Mr. Johnson serves as Chief Executive Officer, Chairman, and a Director of FMR Corp.; a Director and Chairman of the Board and of the Executive Committee of FMR; Chairman and a Director of Fidelity Research & Analysis Company; Chairman and a Director of Fidelity Investments Money Management, Inc.; and Chairman (2001 present) and a Director (2000 present) of FMR Co., Inc.
| | Name, Age; Principal Occupation
Stephen P. Jonas (53)
|
Year of Election or Appointment: 2005
Mr. Jonas is Senior Vice President of New York Municipal Money Market and New York AMT Tax Free Money Market. He also serves as Senior Vice President of other Fidelity funds (2005 present). Mr. Jonas is Executive Director of FMR (2005 present). Previously, Mr. Jonas served as President of Fidelity Enterprise Operations and Risk Services (2004 2005), Chief Administrative Officer (2002 2004), and Chief Financial Officer of FMR Co. (1998 2000). Mr. Jonas has been with Fidelity Investments since 1987 and has held various financial and management positions including Chief Financial Officer of FMR. In addition, he serves on the Boards of Boston Ballet (2003 present) and Simmons College (2003 present).
Year of Election or Appointment: 2003
Mr. Reynolds is a Director (2003 present) and Chief Operating Officer (2002 present) of FMR Corp. He also serves on the Board at Fidelity Investments Canada, Ltd. (2000 present). Previously, Mr. Reynolds served as President of Fidelity Investments Institutional Retirement Group (1996 2000).
* Trustees have been determined to be “Interested Trustees” by virtue of, among other things, their affiliation with the trust or various entities under common control with FMR.
53 Annual Report
Trustees and Officers - continued
Independent Trustees:
Correspondence intended for each Independent Trustee (that is, the Trustees other than the Interested Trustees) may be sent to Fidelity Investments, P.O. Box 55235, Boston, Massachusetts 02205-5235.
| | Name, Age; Principal Occupation
Dennis J. Dirks (57)
|
Year of Election or Appointment: 2005
Prior to his retirement in May 2003, Mr. Dirks was Chief Operating Officer and a member of the Board of The Depository Trust & Clearing Corporation (DTCC) (1999 2003). He also served as President, Chief Operating Officer, and Board member of The Depository Trust Company (DTC) (1999 2003) and President and Board member of the National Securities Clearing Corporation (NSCC) (1999 2003). In addition, Mr. Dirks served as Chief Executive Officer and Board member of the Government Securities Clearing Corporation (2001 2003) and Chief Executive Officer and Board member of the Mortgage Backed Securities Clearing Corporation (2001 2003). Mr. Dirks also serves as a Trustee and a member of the Finance Committee of Manhattan College (2005 present) and a Trustee and a member of the Finance Committee of AHRC of Nassau County (2006 present).
| | Albert R. Gamper, Jr. (63)
|
Year of Election or Appointment: 2006
Mr. Gamper also serves as a Trustee (2006 present) or Member of the Advisory Board (2005 present) of other investment companies advised by FMR. Prior to his retirement in December 2004, Mr. Gamper served as Chairman of the Board of CIT Group Inc. (commercial finance). During his tenure with CIT Group Inc. Mr. Gamper served in numerous senior management positions, including Chairman (1987 1989; 1999 2001; 2002 2004), Chief Executive Officer (1987 2004), and President (1989 2002). He currently serves as a member of the Board of Directors of Public Service Enterprise Group (utilities, 2001 present), Chairman of the Board of Governors, Rutgers University (2004 present), and Chairman of the Board of Saint Barnabas Health Care System.
Name, Age; Principal Occupation
Robert M. Gates (62)
|
Year of Election or Appointment: 1997
Dr. Gates is Chairman of the Independent Trustees (2006 present). Dr. Gates is President of Texas A&M University (2002 present). He was Director of the Central Intelligence Agency (CIA) from 1991 to 1993. From 1989 to 1991, Dr. Gates served as Assistant to the President of the United States and Deputy National Security Advisor. Dr. Gates is a Director of NACCO Industries, Inc. (mining and manufacturing), Parker Drilling Co., Inc. (drilling and rental tools for the energy industry, 2001 present), and Brinker International (restaurant management, 2003 present). Previously, Dr. Gates served as a Director of LucasVarity PLC (automotive components and diesel engines), a Director of TRW Inc. (automotive, space, defense, and information technology), and Dean of the George Bush School of Government and Public Service at Texas A&M University (1999 2001).
Year of Election or Appointment: 2004
Dr. Heilmeier is Chairman Emeritus of Telcordia Technologies (communication software and systems), where prior to his retirement, he served as company Chairman and Chief Executive Officer. He currently serves on the Boards of Directors of The Mitre Corporation (systems engineering and information technology support for the government), and HRL Laboratories (private research and development, 2004 present). He is Chairman of the General Motors Science & Technology Advisory Board and a Life Fellow of the Institute of Electrical and Electronics Engi neers (IEEE). Dr. Heilmeier is a member of the Defense Science Board and the National Security Agency Advisory Board. He is also a member of the National Academy of Engineering, the American Academy of Arts and Sciences, and the Board of Overseers of the School of Engineering and Applied Science of the University of Pennsylvania. Previously, Dr. Heilmeier served as a Director of TRW Inc. (automotive, space, defense, and information technology, 1992 2002), Compaq (1994 2002), Automatic Data Processing, Inc. (ADP) (technology based business outsourcing, 1995 2002), INET Technologies Inc. (telecommunications network surveillance, 2001 2004), and Teletech Holdings (customer management services). He is the recipient of the 2005 Kyoto Prize in Advanced Technology for his invention of the liquid crystal display.
55 Annual Report
Trustees and Officers - continued
| | Name, Age; Principal Occupation
Marie L. Knowles (59)
|
Year of Election or Appointment: 2001
Prior to Ms. Knowles’ retirement in June 2000, she served as Executive Vice President and Chief Financial Officer of Atlantic Richfield Company (ARCO) (diversified energy, 1996 2000). From 1993 to 1996, she was a Senior Vice President of ARCO and President of ARCO Transportation Company. She served as a Director of ARCO from 1996 to 1998. She currently serves as a Director of Phelps Dodge Corporation (copper mining and manufacturing) and McKesson Corporation (healthcare service, 2002 present). Ms. Knowles is a Trustee of the Brookings Institution and the Catalina Island Conservancy and also serves as a member of the Advisory Board for the School of Engineering of the University of Southern California.
Year of Election or Appointment: 2000
Mr. Lautenbach has been a partner of Clayton, Dubilier & Rice, Inc. (private equity investment firm) since September 1998. Previously, Mr. Lautenbach was with the International Business Machines Corpora tion (IBM) from 1968 until his retirement in 1998. Mr. Lautenbach serves as a Director of Italtel Holding S.p.A. (telecommunications (Milan, Italy), 2004 present) and Eaton Corporation (diversified industrial) as well as the Philharmonic Center for the Arts in Naples, Florida. He also is a member of the Board of Trustees of Fairfield University (2005 present), as well as a member of the Council on Foreign Relations.
Year of Election or Appointment: 1997
Prior to his retirement in December 1994, Mr. McCoy was Vice Chair man of the Board of BellSouth Corporation (telecommunications) and President of BellSouth Enterprises. He is currently a Director of Duke Realty Corporation (real estate), and Progress Energy, Inc. (electric utility). He is also a partner of Franklin Street Partners (private invest ment management firm) and a member of the Research Triangle Foundation Board. In addition, Mr. McCoy served as the Interim Chancellor (1999 2000) and a member of the Board of Visitors for the University of North Carolina at Chapel Hill and currently serves as Chairman of the Board of Directors of the University of North Carolina Health Care System and the Board of Visitors of the Kenan Flagler Business School (University of North Carolina at Chapel Hill). He also served as Vice President of Finance for the University of North Carolina (16 school system).
Name, Age; Principal Occupation
Cornelia M. Small (61)
|
Year of Election or Appointment: 2005
Ms. Small is a member (2000 present) and Chairperson (2002 present) of the Investment Committee, and a member (2002 present) of the Board of Trustees of Smith College. Previously, she served as Chief Investment Officer (1999 2000), Director of Global Equity Investments (1996 1999), and a member of the Board of Directors of Scudder, Stevens & Clark (1990 1997) and Scudder Kemper Investments (1997 1999). In addition, Ms. Small served as Co Chair (2000 2003) of the Annual Fund for the Fletcher School of Law and Diplomacy.
William S. Stavropoulos (66)
|
Year of Election or Appointment: 2001
Mr. Stavropoulos is Chairman of the Board (2000 present) and a Member of the Board of Directors of The Dow Chemical Company. Since joining The Dow Chemical Company in 1967, Mr. Stavropoulos served in numerous senior management positions, including President (1993 2000; 2002 2003), CEO (1995 2000; 2002 2004), and Chairman of the Executive Committee (2000 2004). Currently, he is a Director of NCR Corporation (data warehousing and technology solutions), BellSouth Corporation (telecommunications), Chemical Financial Corpo ration, Maersk Inc. (industrial conglomerate, 2002 present), and Metalmark Capital (private equity investment firm, 2005 present). He also serves as a member of the Board of Trustees of the American Enterprise Institute for Public Policy Research. In addition, Mr. Stavropoulos is a member of The Business Council, J.P. Morgan International Council and the University of Notre Dame Advisory Council for the College of Science.
Year of Election or Appointment: 2005
Prior to his retirement in 2001, Mr. Wolfe was Chairman and Chief Executive Officer of Hershey Foods Corporation (1993 2001). He currently serves as a member of the boards of Adelphia Communications Corporation (2003 present), Bausch & Lomb, Inc., and Revlon Inc. (2004 present).
57 Annual Report
Trustees and Officers - continued
Advisory Board Members and Executive Officers:
Correspondence intended for Mr. Keyes may be sent to Fidelity Investments, P.O. Box 55235, Boston, Massachusetts 02205-5235. Correspondence intended for each executive officer and Mr. Lynch may be sent to Fidelity Investments, 82 Devonshire Street, Boston, Massachusetts 02109.
| | Name, Age; Principal Occupation
James H. Keyes (65)
|
Year of Election or Appointment: 2006
Member of the Advisory Board of New York Municipal Trust II. Prior to his retirement in 2003, Mr. Keyes was Chairman, President, and Chief Executive Officer of Johnson Controls, Inc. (automotive supplier, 1993 2003). He currently serves as a member of the boards of LSI Logic Corporation (semiconductor technologies, 1984 present), Navistar International Corporation (manufacture and sale of trucks, buses, and diesel engines, 2002 present), and Pitney Bowes, Inc. (integrated mail, messaging, and document management solutions, 1998 present).
Year of Election or Appointment: 2003
Member of the Advisory Board of New York Municipal Trust II. Vice Chairman and a Director of FMR, and Vice Chairman (2001 present) and a Director (2000 present) of FMR Co., Inc. Previously, Mr. Lynch served as a Trustee of the Fidelity funds (1990 2003). In addition, he serves as a Trustee of Boston College, Massachusetts Eye & Ear Infirmary, Historic Deerfield, John F. Kennedy Library, and the Museum of Fine Arts of Boston.
Year of Election or Appointment: 2005
Vice President of New York Municipal Money Market and New York AMT Tax Free Money Market. Mr. Donovan also serves as Vice President of Fidelity’s High Income Funds (2005 present), Fidelity’s Fixed Income Funds (2005 present), certain Asset Allocation Funds (2005 present), and certain Balanced Funds (2005 present). Mr. Donovan also serves as Executive Vice President of FMR (2005 present) and FMRC (2005 present). Previously, Mr. Donovan served as Vice President and Director of Fidelity’s International Equity Trading group (1998 2005).
Name, Age; Principal Occupation
Charles S. Morrison (45)
|
Year of Election or Appointment: 2005
Vice President of New York Municipal Money Market and New York AMT Tax Free Money Market. Mr. Morrison also serves as Vice President of Fidelity’s Money Market Funds (2005 present) and certain Asset Allocation Funds (2002 present). Previously, he served as Vice President of Fidelity’s Bond Funds (2002 2005) and certain Balanced Funds (2002 2005). He served as Vice President (2002 2005) and Bond Group Leader (2002 2005) of Fidelity Investments Fixed Income Division. Mr. Morrison is also Vice President of FIMM (2002 present) and FMR (2002 present). Mr. Morrison joined Fidelity Investments in 1987 as a Corporate Bond Analyst in the Fixed Income Research Division.
Year of Election or Appointment: 2002
Vice President of New York Municipal Money Market and New York AMT Tax Free Money Market. Mr. Murphy also serves as Vice President of Fidelity’s Money Market Funds (2002 present), certain Asset Allocation Funds (2003 present), Fidelity’s Investment Grade Bond Funds (2005 present), and Fidelity’s Balanced Funds (2005 present). He serves as Senior Vice President (2000 present) and Head (2004 present) of the Fidelity Investments Fixed Income Division. Mr. Murphy is also a Senior Vice President of Fidelity Investments Money Management, Inc. (2003 present) and an Executive Vice President of FMR (2005 present). Previously, Mr. Murphy served as Money Market Group Leader (2002 2004), Bond Group Leader (2000 2002), and Vice President of Fidelity’s Taxable Bond Funds (2000 2002) and Fidelity’s Municipal Bond Funds (2001 2002).
Year of Election or Appointment: 2004
Vice President of New York Municipal Money Market and New York AMT Tax Free Money Market. Mr. Marchese also serves as Vice President of other funds advised by FMR. Prior to assuming current responsibilities, Mr. Marchese worked as a legal analyst, director of research, and portfolio manager.
59 Annual Report
Trustees and Officers - continued
| | Name, Age; Principal Occupation
Eric D. Roiter (57)
|
Year of Election or Appointment: 1998
Secretary of New York Municipal Money Market and New York AMT Tax Free Money Market. He also serves as Secretary of other Fidelity funds; Vice President, General Counsel, and Secretary of FMR Co., Inc. (2001 present) and FMR; Assistant Secretary of Fidelity Management & Research (U.K.) Inc. (2001 present), Fidelity Research & Analysis Com pany (2001 present), and Fidelity Investments Money Management, Inc. (2001 present). Mr. Roiter is an Adjunct Member, Faculty of Law, at Boston College Law School (2003 present). Previously, Mr. Roiter served as Vice President and Secretary of Fidelity Distributors Corporation (FDC) (1998 2005).
Year of Election or Appointment: 2003
Assistant Secretary of New York Municipal Money Market and New York AMT Tax Free Money Market. Mr. Fross also serves as Assistant Secretary of other Fidelity funds (2003 present), Vice President and Secretary of FDC (2005 present), and is an employee of FMR.
Year of Election or Appointment: 2004
President and Treasurer of New York Municipal Money Market and New York AMT Tax Free Money Market. Ms. Reynolds also serves as President and Treasurer of other Fidelity funds (2004 present) and is a Vice President (2003 present) and an employee (2002 present) of FMR. Before joining Fidelity Investments, Ms. Reynolds worked at PricewaterhouseCoopers LLP (PwC) (1980 2002), where she was most recently an audit partner with PwC’s investment management practice.
Year of Election or Appointment: 2006
Anti Money Laundering (AML) officer of New York Municipal Money Market and New York AMT Tax Free Money Market. Mr. Ganis also serves as AML officer of other Fidelity funds (2006 present) and FMR Corp. (2003 present). Before joining Fidelity Investments, Mr. Ganis practiced law at Goodwin Procter, LLP (2000 2002).
Year of Election or Appointment: 2005
Chief Financial Officer of New York Municipal Money Market and New York AMT Tax Free Money Market. Mr. Murphy also serves as Chief Financial Officer of other Fidelity funds (2005 present). He also serves as Senior Vice President of Fidelity Pricing and Cash Management Services Group (FPCMS).
Name, Age; Principal Occupation
Kenneth A. Rathgeber (58)
|
Year of Election or Appointment: 2004
Chief Compliance Officer of New York Municipal Money Market and New York AMT Tax Free Money Market. Mr. Rathgeber also serves as Chief Compliance Officer of other Fidelity funds (2004 present) and Executive Vice President of Risk Oversight for Fidelity Investments (2002 present). He is Chief Compliance Officer of FMR (2005 present), FMR Co., Inc. (2005 present), Fidelity Management & Research (U.K.) Inc. (2005 present), Fidelity Research & Analysis Company (2005 present), Fidelity Investments Money Management, Inc. ( 2005 present), and Strategic Advisers, Inc. (2005 present). Previously, Mr. Rathgeber served as Executive Vice President and Chief Operating Officer for Fidelity Investments Institutional Services Company, Inc. (1998 2002).
Year of Election or Appointment: 2005
Deputy Treasurer of New York Municipal Money Market and New York AMT Tax Free Money Market. Mr. Mehrmann also serves as Deputy Treasurer of other Fidelity funds (2005 present) and is an employee of FMR. Previously, Mr. Mehrmann served as Vice President of Fidelity Investments Institutional Services Group (FIIS)/Fidelity Investments Institu tional Operations Corporation, Inc. (FIIOC) Client Services (1998 2004).
Kimberley H. Monasterio (42)
|
Year of Election or Appointment: 2004
Deputy Treasurer of New York Municipal Money Market and New York AMT Tax Free Money Market. Ms. Monasterio also serves as Deputy Treasurer of other Fidelity funds (2004) and is an employee of FMR (2004). Before joining Fidelity Investments, Ms. Monasterio served as Treasurer (2000 2004) and Chief Financial Officer (2002 2004) of the Franklin Templeton Funds and Senior Vice President of Franklin Templeton Services, LLC (2000 2004).
Year of Election or Appointment: 2005
Deputy Treasurer of New York Municipal Money Market and New York AMT Tax Free Money Market. Mr. Robins also serves as Deputy Treasurer of other Fidelity funds (2005 present) and is an employee of FMR (2004 present). Before joining Fidelity Investments, Mr. Robins worked at KPMG LLP, where he was a partner in KPMG’s department of professional practice (2002 2004) and a Senior Manager (1999 2000). In addition, Mr. Robins served as Assistant Chief Accountant, United States Securities and Exchange Commission (2000 2002).
61 Annual Report
Trustees and Officers - continued
| | Name, Age; Principal Occupation
Robert G. Byrnes (39)
|
Year of Election or Appointment: 2005
Assistant Treasurer of New York Municipal Money Market and New York AMT Tax Free Money Market. Mr. Byrnes also serves as Assistant Treasurer of other Fidelity funds (2005 present) and is an employee of FMR (2005 present). Previously, Mr. Byrnes served as Vice Presi dent of FPCMS (2003 2005). Before joining Fidelity Investments, Mr. Byrnes worked at Deutsche Asset Management where he served as Vice President of the Investment Operations Group (2000 2003).
Year of Election or Appointment: 1986 or 1991 Assistant Treasurer of New York Municipal Money Market (1986 present) and New York AMT Tax Free Money Market (1991 present). Mr. Costello also serves as Assistant Treasurer of other Fidelity funds and is an employee of FMR.
Year of Election or Appointment: 2004
Assistant Treasurer of New York Municipal Money Market and New York AMT Tax Free Money Market. Mr. Lydecker also serves as Assistant Treasurer of other Fidelity funds (2004) and is an employee of FMR.
Year of Election or Appointment: 2002
Assistant Treasurer of New York Municipal Money Market and New York AMT Tax Free Money Market. Mr. Osterheld also serves as Assistant Treasurer of other Fidelity funds (2002) and is an employee of FMR.
Year of Election or Appointment: 2005
Assistant Treasurer of New York Municipal Money Market and New York AMT Tax Free Money Market. Mr. Ryan also serves as Assistant Treasurer of other Fidelity funds (2005 present) and is an employee of FMR (2005 present). Previously, Mr. Ryan served as Vice President of Fund Reporting in FPCMS (1999 2005).
Year of Election or Appointment: 2005
Assistant Treasurer of New York Municipal Money Market and New York AMT Tax Free Money Market. Mr. Schiavone also serves as Assistant Treasurer of other Fidelity funds (2005 present) and is an employee of FMR (2005 present). Before joining Fidelity Investments, Mr. Schiavone worked at Deutsche Asset Management, where he most recently served as Assistant Treasurer (2003 2005) of the Scudder Funds and Vice President and Head of Fund Reporting (1996 2003).
The funds hereby designate as capital gain dividend the amounts noted below for the taxable year ended January, 31, 2006, or, if subsequently determined to be different, the net capital gain of such year.
| Fund | | |
| Fidelity New York AMT Tax-Free Money Market Fund | | $95,209 |
| Fidelity New York Municipal Money Market Fund | | $149,598 |
During fiscal year ended 2006, 100% of each fund’s income dividends were free from federal income tax, and 0% and 30.04% of Fidelity New York AMT Tax Free Money Market Fund’s and Fidelity New York Municipal Money Market Fund’s income dividends were subject to the federal alternative minimum tax.
The fund will notify shareholders in January 2007 of amounts for use in preparing 2006 income tax returns.
63 Annual Report
Proxy Voting Results
A special meeting of each fund’s shareholders was held on February 15, 2006. The results of votes taken among shareholders on the proposal before them are reported below. Each vote reported represents one dollar of net asset value held on the record date for the meeting.
| PROPOSAL 1 | | | | |
| To elect a Board of Trustees.A | | |
| | | # of | | % of |
| | | Votes | | Votes |
| |
| Dennis J. Dirks | | | | |
| Affirmative | | 1,783,648,205.47 | | 95.878 |
| Withheld | | 76,673,364.95 | | 4.122 |
| TOTAL | | 1,860,321,570.42 | | 100.000 |
| Albert R. Gamper, Jr. | | |
| Affirmative | | 1,783,602,273.11 | | 95.876 |
| Withheld | | 76,719,297.31 | | 4.124 |
| TOTAL | | 1,860,321,570.42 | | 100.000 |
| Robert M. Gates | | | | |
| Affirmative | | 1,780,799,671.84 | | 95.725 |
| Withheld | | 79,521,898.58 | | 4.275 |
| TOTAL | | 1,860,321,570.42 | | 100.000 |
| George H. Heilmeier | | |
| Affirmative | | 1,782,114,911.05 | | 95.796 |
| Withheld | | 78,206,659.37 | | 4.204 |
| TOTAL | | 1,860,321,570.42 | | 100.000 |
| Edward C. Johnson 3d | | |
| Affirmative | | 1,780,378,374.71 | | 95.703 |
| Withheld | | 79,943,195.71 | | 4.297 |
| TOTAL | | 1,860,321,570.42 | | 100.000 |
| Stephen P. Jonas | | |
| Affirmative | | 1,783,149,266.81 | | 95.852 |
| Withheld | | 77,172,303.61 | | 4.148 |
| TOTAL | | 1,860,321,570.42 | | 100.000 |
| Marie L. Knowles | | |
| Affirmative | | 1,783,210,446.75 | | 95.855 |
| Withheld | | 77,111,123.67 | | 4.145 |
| TOTAL | | 1,860,321,570.42 | | 100.000 |
| | | # of | | % of |
| | | Votes | | Votes |
| |
| Ned C. Lautenbach | | |
| Affirmative | | 1,782,160,361.68 | | 95.799 |
| Withheld | | 78,161,208.74 | | 4.201 |
| TOTAL | | 1,860,321,570.42 | | 100.000 |
| |
| William O. McCoy | | |
| Affirmative | | 1,782,595,251.74 | | 95.822 |
| Withheld | | 77,726,318.68 | | 4.178 |
| TOTAL | | 1,860,321,570.42 | | 100.000 |
| |
| Robert L. Reynolds | | |
| Affirmative | | 1,783,304,924.11 | | 95.860 |
| Withheld | | 77,016,646.31 | | 4.140 |
| TOTAL | | 1,860,321,570.42 | | 100.000 |
| |
| Cornelia M. Small | | |
| Affirmative | | 1,783,962,741.50 | | 95.895 |
| Withheld | | 76,358,828.92 | | 4.105 |
| TOTAL | | 1,860,321,570.42 | | 100.000 |
| |
| William S. Stavropoulos | | |
| Affirmative | | 1,781,789,355.24 | | 95.779 |
| Withheld | | 78,532,215.18 | | 4.221 |
| TOTAL | | 1,860,321,570.42 | | 100.000 |
| |
| Kenneth L. Wolfe | | |
| Affirmative | | 1,783,473,214.99 | | 95.869 |
| Withheld | | 76,848,355.43 | | 4.131 |
| TOTAL | | 1,860,321,570.42 | | 100.000 |
A Denotes trust-wide proposal and voting results.
Annual Report 64
Board Approval of Investment Advisory Contracts and Management Fees
Fidelity New York Municipal Money Market Fund
Fidelity New York AMT Tax Free Money Market Fund (formerly Spartan New York Municipal Money Market Fund)
On January 19, 2006, the Board of Trustees, including the Independent Trustees (together, the Board), voted to approve a general research services agreement (the Agreement) between FMR, FMR Co., Inc. (FMRC), Fidelity Investments Money Manage ment, Inc. (FIMM), and Fidelity Research & Analysis Company (FRAC) (together, the Investment Advisers) for each fund, effective January 20, 2006, pursuant to which FRAC may provide general research and investment advisory support services to FMRC and FIMM. The Board considered that it has approved previously various sub advisory agreements for each fund with affiliates of FMR that allow FMR to obtain research, non discretionary advice, or discretionary portfolio management at no additional expense to each fund. The Board, assisted by the advice of fund counsel and independent Trustees’ counsel, considered a broad range of information and determined that it would be beneficial for each fund to access the research and investment advisory support services supplied by FRAC at no additional expense to each fund.
The Board reached this determination in part because the new arrangement will involve no changes in (i) the contractual terms of and fees payable under each fund’s manage ment contract or sub advisory agreements; (ii) the investment process or strategies employed in the management of each fund’s assets; (iii) the nature or level of services provided under each fund’s management contract or sub advisory agreements; (iv) the day to day management of each fund or the persons primarily responsible for such management; or (v) the ultimate control or beneficial ownership of FMR, FMRC, or FIMM. The Board also considered that the establishment of each Agreement would not necessitate prior shareholder approval of the Agreement or result in an assignment and termination of each fund’s management contract or sub advisory agreements under the Investment Company Act of 1940.
Because the Board was approving an arrangement with FRAC under which each fund will not bear any additional management fees or expenses and under which each fund’s portfolio manager would not change, it did not consider each fund’s investment perfor mance, competitiveness of management fee and total expenses, costs of services and profitability, or economies of scale to be significant factors in its decision.
In connection with its future renewal of each fund’s management contract and sub advisory agreements, the Board will consider: (i) the nature, extent, and quality of services provided to each fund, including shareholder and administrative services and investment performance; (ii) the competitiveness of each fund’s management fee and total expenses; (iii) the costs of the services and profitability, including the revenues earned and the expenses incurred by Fidelity in conducting the business of developing, marketing, distributing, managing, administering, and servicing each fund and its
65 Annual Report
Board Approval of Investment Advisory Contracts and Management Fees continued
shareholders; and (iv) whether there have been economies of scale in respect of the management of the Fidelity funds, whether the Fidelity funds (including each fund) have appropriately benefited from any such economies of scale, and whether there is potential for realization of any further economies.
Based on its evaluation of all of the conclusions noted above, and after considering all material factors, the Board ultimately concluded that each fund’s Agreement is fair and reasonable, and that each fund’s Agreement should be approved.
Managing Your Investments
Fidelity offers several ways to conveniently manage your personal investments via your telephone or PC. You can access your account information, conduct trades and research your investments 24 hours a day.
By Phone
Fidelity Automated Service Telephone provides a single toll free number to access account balances, positions, quotes and trading. It’s easy to navigate the service, and on your first call, the system will help you create a personal identification number (PIN) for security.


By PC
Fidelity’s web site on the Internet provides a wide range of information, including daily financial news, fund performance, interactive planning tools and news about Fidelity products and services.

* When you call the quotes line, please remember that a fund’s yield and return will vary and, except for money market funds, share price will also vary. This means that you may have a gain or loss when you sell your shares. There is no assurance that money market funds will be able to maintain a stable $1 share price; an investment in a money market fund is not insured or guar anteed by the U.S. government. Total returns are historical and include changes in share price, reinvestment of dividends and capital gains, and the effects of any sales charges.
67 Annual Report
To Write Fidelity
We’ll give your correspondence immediate attention and send you written confirmation upon completion of your request.

| | (such as changing name, address, bank, etc.)
Fidelity Investments
P.O. Box 770001
Cincinnati, OH 45277-0002
|

| | Buying shares
Fidelity Investments
P.O. Box 770001
Cincinnati, OH 45277-0003
Overnight Express
Fidelity Investments
Attn: Distribution Services
100 Crosby Parkway KC1H
Covington, KY 41015
Selling shares
Fidelity Investments
P.O. Box 770001
Cincinnati, OH 45277-0035
Overnight Express
Fidelity Investments
Attn: Distribution Services
100 Crosby Parkway KC1H
Covington, KY 41015
General Correspondence
Fidelity Investments
P.O. Box 500
Merrimack, NH 03054-0500
|

Buying shares
Fidelity Investments
P.O. Box 770001
Cincinnati, OH 45277-0003
Selling shares
Fidelity Investments
P.O. Box 770001
Cincinnati, OH 45277-0035
Overnight Express
Fidelity Investments
Attn: Distribution Services
100 Crosby Parkway KC1H
Covington, KY 41015
General Correspondence
Fidelity Investments
P.O. Box 500
Merrimack, NH 03054-0500
|
Annual Report 68
| | Investment Adviser
Fidelity Management & Research
Company
Boston, MA
Investment Sub Advisers
Fidelity Investments
Money Management, Inc.
Fidelity International Investment Advisors
Fidelity International Investment Advisors
(U.K.) Limited
Fidelity Research & Analysis Company
(formerly Fidelity Management &
Research (Far East) Inc.)
General Distributor
Fidelity Distributors Corporation
Boston, MA
Transfer and Service Agents
Citibank, N.A.
New York, NY
Fidelity Service Company, Inc.
Boston, MA
Custodian
Citibank, N.A.
New York, NY
|
| The Fidelity Telephone Connection |
| Mutual Fund 24-Hour Service |
| Exchanges/Redemptions | | |
| and Account Assistance | | 1-800-544-6666 |
| Product Information | | 1-800-544-6666 |
| Retirement Accounts | | 1-800-544-4774 |
| (8 a.m. - 9 p.m.) | | |
| TDD Service | | 1-800-544-0118 |
| for the deaf and hearing impaired |
| (9 a.m. - 9 p.m. Eastern time) |
| Fidelity Automated Service | | |
| Telephone (FAST® ) (automated phone logo) | | 1-800-544-5555 |
| (automated phone logo) Automated line for quickest service |
NYS-UANN-0306
1.789256.103
|

Item 2. Code of Ethics
As of the end of the period, January 31, 2006, Fidelity New York Municipal Trust II (the trust) has adopted a code of ethics, as defined in Item 2 of Form N-CSR, that applies to its President and Treasurer and its Chief Financial Officer. A copy of the code of ethics is filed as an exhibit to this Form N-CSR.
Item 3. Audit Committee Financial Expert
The Board of Trustees of the trust has determined that Marie L. Knowles is an audit committee financial expert, as defined in Item 3 of Form N-CSR. Ms. Knowles is independent for purposes of Item 3 of Form N-CSR.
Item 4. Principal Accountant Fees and Services
(a) Audit Fees.
For the fiscal years ended January 31, 2006 and January 31, 2005, the aggregate Audit Fees billed by Deloitte & Touche LLP, the member firms of Deloitte Touche Tohmatsu, and their respective affiliates (collectively, "Deloitte Entities") for professional services rendered for the audits of the financial statements, or services that are normally provided in connection with statutory and regulatory filings or engagements for those fiscal years, for Fidelity New York AMT Tax-Free Money Market Fund and Fidelity New York Municipal Money Market Fund (the funds) and for all funds in the Fidelity Group of Funds are shown in the table below.
Fund | 2006A | 2005A |
Fidelity New York AMT Tax-Free Money Market Fund | $26,000 | $27,000 |
Fidelity New York Municipal Money Market Fund | $29,000 | $29,000 |
All funds in the Fidelity Group of Funds audited by Deloitte Entities | $5,700,000 | $4,500,000 |
A | Aggregate amounts may reflect rounding. |
(b) Audit-Related Fees.
In each of the fiscal years ended January 31, 2006 and January 31, 2005, the aggregate Audit-Related Fees billed by Deloitte Entities for services rendered for assurance and related services to each fund that are reasonably related to the performance of the audit or review of the fund's financial statements, but not reported as Audit Fees, are shown in the table below.
Fund | 2006A | 2005A |
Fidelity New York AMT Tax-Free Money Market Fund | $0 | $0 |
Fidelity New York Municipal Money Market Fund | $0 | $0 |
A | Aggregate amounts may reflect rounding. |
In each of the fiscal years ended January 31, 2006 and January 31, 2005, the aggregate Audit-Related Fees that were billed by Deloitte Entities that were required to be approved by the Audit Committee for services rendered on behalf of Fidelity Management & Research Company (FMR) and entities controlling, controlled by, or under common control with FMR (not including any sub-adviser whose role is primarily portfolio management and is subcontracted with or overseen by another investment adviser) that provide ongoing services to the funds ("Fund Service Providers") for assurance and related services that relate directly to the operations and financial reporting of each fund that are reasonably related to the performance of the audit or review of the fund's financial statements, but not reported as Audit Fees, are shown in the table below.
Billed By | 2006A | 2005A |
Deloitte Entities | $0 | $0 |
A | Aggregate amounts may reflect rounding. |
Fees included in the audit-related category comprise assurance and related services (e.g., due diligence services) that are traditionally performed by the independent registered public accounting firm. These audit-related services include due diligence related to mergers and acquisitions, accounting consultations and audits in connection with acquisitions, internal control reviews, attest services that are not required by statute or regulation and consultation concerning financial accounting and reporting standards.
(c) Tax Fees.
In each of the fiscal years ended January 31, 2006 and January 31, 2005, the aggregate Tax Fees billed by Deloitte Entities for professional services rendered for tax compliance, tax advice, and tax planning for each fund is shown in the table below.
Fund | 2006A | 2005A |
Fidelity New York AMT Tax-Free Money Market Fund | $3,500 | $3,400 |
Fidelity New York Municipal Money Market Fund | $3,500 | $3,400 |
A | Aggregate amounts may reflect rounding. |
In each of the fiscal years ended January 31, 2006 and January 31, 2005, the aggregate Tax Fees billed by Deloitte Entities that were required to be approved by the Audit Committee for professional services rendered on behalf of the Fund Service Providers for tax compliance, tax advice, and tax planning that relate directly to the operations and financial reporting of each fund is shown in the table below.
Billed By | 2006A | 2005A |
Deloitte Entities | $0 | $0 |
A | Aggregate amounts may reflect rounding. |
Fees included in the Tax Fees category comprise all services performed by professional staff in the independent registered public accounting firm's tax division except those services related to the audit. Typically, this category would include fees for tax compliance, tax planning, and tax advice. Tax compliance, tax advice, and tax planning services include preparation of original and amended tax returns, claims for refund and tax payment-planning services, assistance with tax audits and appeals, tax advice related to mergers and acquisitions and requests for rulings or technical advice from taxing authorities.
(d) All Other Fees.
In each of the fiscal years ended January 31, 2006 and January 31, 2005, the aggregate Other Fees billed by Deloitte Entities for all other non-audit services rendered to the funds is shown in the table below.
Fund | 2006A | 2005A |
Fidelity New York AMT Tax-Free Money Market Fund | $0 | $0 |
Fidelity New York Municipal Money Market Fund | $0 | $0 |
A | Aggregate amounts may reflect rounding. |
In each of the fiscal years ended January 31, 2006 and January 31, 2005, the aggregate Other Fees billed by Deloitte Entities that were required to be approved by the Audit Committee for all other non-audit services rendered on behalf of the Fund Service Providers that relate directly to the operations and financial reporting of each fund is shown in the table below.
Billed By | 2006A | 2005A |
Deloitte Entities | $160,000 | $760,000 |
A | Aggregate amounts may reflect rounding. |
Fees included in the All Other Fees category include services related to internal control reviews, strategy and other consulting, financial information systems design and implementation, consulting on other information systems, and other tax services unrelated to the fund.
(e) (1) | Audit Committee Pre-Approval Policies and Procedures: |
The trust's Audit Committee must pre-approve all audit and non-audit services provided by the independent registered public accounting firm relating to the operations or financial reporting of the funds. Prior to the commencement of any audit or non-audit services to a fund, the Audit Committee reviews the services to determine whether they are appropriate and permissible under applicable law.
The trust's Audit Committee has adopted policies and procedures to, among other purposes, provide a framework for the Committee's consideration of non-audit services by the audit firms that audit the Fidelity funds. The policies and procedures require that any non-audit service provided by a fund audit firm to a Fidelity Fund and any non-audit service provided by a fund auditor to a Fund Service Provider that relates directly to the operations and financial reporting of a Fidelity fund (Covered Service) are subject to approval by the Audit Committee before such service is provided. Non-audit services provided by a fund audit firm for a Fund Service Provider that do not relate directly to the operations and financial reporting of a Fidelity fund (Non-Covered Service) but that are expected to exceed $50,000 are also subject to pre-approval by the Audit Committee.
All Covered Services, as well as Non-Covered Services that are expected to exceed $50,000, must be approved in advance of provision of the service either: (i) by formal resolution of the Audit Committee, or (ii) by oral or written approval of the service by the Chair of the Audit Committee (or if the Chair is unavailable, such other member of the Audit Committee as may be designated by the Chair to act in the Chair's absence). The approval contemplated by (ii) above is permitted where the Treasurer determines that action on such an engagement is necessary before the next meeting of the Audit Committee. Neither pre-approval nor advance notice of Non-Covered Service engagements for which fees are not expected to exceed $50,000 is required; such engagements are to be reported to the Audit Committee monthly.
(e) (2) | Services approved pursuant to paragraph (c)(7)(i)(C) of Rule 2-01 of Regulation S-X: |
Audit-Related Fees:
There were no amounts that were approved by the Audit Committee pursuant to the de minimis exception for the fiscal years ended January 31, 2006 and January 31, 2005 on behalf of each fund.
There were no amounts that were required to be approved by the Audit Committee pursuant to the de minimis exception for the fiscal years ended January 31, 2006 and January 31, 2005 on behalf of the Fund Service Providers that relate directly to the operations and financial reporting of each fund.
Tax Fees:
There were no amounts that were approved by the Audit Committee pursuant to the de minimis exception for the fiscal years ended January 31, 2006 and January 31, 2005 on behalf of each fund.
There were no amounts that were required to be approved by the Audit Committee pursuant to the de minimis exception for the fiscal years ended January 31, 2006 and January 31, 2005 on behalf of the Fund Service Providers that relate directly to the operations and financial reporting of each fund.
All Other Fees:
There were no amounts that were approved by the Audit Committee pursuant to the de minimis exception for the fiscal years ended January 31, 2006 and January 31, 2005 on behalf of each fund.
There were no amounts that were required to be approved by the Audit Committee pursuant to the de minimis exception for the fiscal years ended January 31, 2006 and January 31, 2005 on behalf of the Fund Service Providers that relate directly to the operations and financial reporting of each fund.
(f) Not Applicable.
(g) For the fiscal years ended January 31, 2006 and January 31, 2005, the aggregate fees billed by Deloitte Entities of $425,000A and $1,100,000A,B for non-audit services rendered on behalf of the funds, FMR (not including any sub-adviser whose role is primarily portfolio management and is subcontracted with or overseen by another investment adviser) and Fund Service Providers relating to Covered Services and Non-Covered Services are shown in the table below.
| 2006A | 2005A |
Covered Services | $175,000 | $750,000 |
Non-Covered Services | $250,000 | $350,000B |
A | Aggregate amounts may reflect rounding. |
B | Reflects current period presentation. |
(h) The trust's Audit Committee has considered Non-Covered Services that were not pre-approved that were provided by Deloitte Entities to Fund Service Providers to be compatible with maintaining the independence of Deloitte Entities in its audit of the funds, taking into account representations from Deloitte Entities, in accordance with Independence Standards Board Standard No.1, regarding its independence from the funds and their related entities.
Item 5. Audit Committee of Listed Registrants
Not applicable.
Item 6. Schedule of Investments
Not applicable.
Item 7. Disclosure of Proxy Voting Policies and Procedures for Closed-End Management Investment Companies
Not applicable.
Item 8. Portfolio Managers of Closed-End Management Investment Companies
Not applicable.
Item 9. Purchase of Equity Securities by Closed-End Management Investment Company and Affiliated Purchasers
Not applicable.
Item 10. Submission of Matters to a Vote of Security Holders
There were no material changes to the procedures by which shareholders may recommend nominees to the trust's Board of Trustees.
Item 11. Controls and Procedures
(a)(i) The President and Treasurer and the Chief Financial Officer have concluded that the trust's disclosure controls and procedures (as defined in Rule 30a-3(c) under the Investment Company Act) provide reasonable assurances that material information relating to the trust is made known to them by the appropriate persons, based on their evaluation of these controls and procedures as of a date within 90 days of the filing date of this report.
(a)(ii) There was no change in the trust's internal control over financial reporting (as defined in Rule 30a-3(d) under the Investment Company Act) that occurred during the second fiscal quarter of the period covered by this report that has materially affected, or is reasonably likely to materially affect, the trust's internal control over financial reporting.
Item 12. Exhibits
(a) | (1) | Code of Ethics pursuant to Item 2 of Form N-CSR is filed and attached hereto as EX-99.CODE ETH. |
(a) | (2) | Certification pursuant to Rule 30a-2(a) under the Investment Company Act of 1940 (17 CFR 270.30a-2(a)) is filed and attached hereto as Exhibit 99.CERT. |
(a) | (3) | Not applicable. |
(b) | | Certification pursuant to Rule 30a-2(b) under the Investment Company Act of 1940 (17 CFR 270.30a-2(b)) is furnished and attached hereto as Exhibit 99.906CERT. |
SIGNATURES
Pursuant to the requirements of the Securities Exchange Act of 1934 and the Investment Company Act of 1940, the registrant has duly caused this report to be signed on its behalf by the undersigned, thereunto duly authorized.
Fidelity New York Municipal Trust II
By: | /s/Christine Reynolds |
| Christine Reynolds |
| President and Treasurer |
| |
Date: | March 27, 2006 |
Pursuant to the requirements of the Securities Exchange Act of 1934 and the Investment Company Act of 1940, this report has been signed below by the following persons on behalf of the registrant and in the capacities and on the dates indicated.
By: | /s/Christine Reynolds |
| Christine Reynolds |
| President and Treasurer |
| |
Date: | March 27, 2006 |
By: | /s/Paul M. Murphy |
| Paul M. Murphy |
| Chief Financial Officer |
| |
Date: | March 27, 2006 |