Fidelity® New York AMT Tax-Free Money Market Fund
Semi-Annual Report
July 31, 2021


Contents
To view a fund's proxy voting guidelines and proxy voting record for the 12-month period ended June 30, visit http://www.fidelity.com/proxyvotingresults or visit the Securities and Exchange Commission's (SEC) web site at http://www.sec.gov.
You may also call 1-800-544-8544, or for Institutional and Service Class, call 1-877-208-0098, to request a free copy of the proxy voting guidelines.
Standard & Poor's, S&P and S&P 500 are registered service marks of The McGraw-Hill Companies, Inc. and have been licensed for use by Fidelity Distributors Corporation.
Other third-party marks appearing herein are the property of their respective owners.
All other marks appearing herein are registered or unregistered trademarks or service marks of FMR LLC or an affiliated company. © 2021 FMR LLC. All rights reserved.
This report and the financial statements contained herein are submitted for the general information of the shareholders of the Fund. This report is not authorized for distribution to prospective investors in the Fund unless preceded or accompanied by an effective prospectus.
A fund files its complete schedule of portfolio holdings with the SEC for the first and third quarters of each fiscal year on Form N-PORT. Forms N-PORT are available on the SEC’s web site at http://www.sec.gov. A fund's Forms N-PORT may be reviewed and copied at the SEC’s Public Reference Room in Washington, DC. Information regarding the operation of the SEC's Public Reference Room may be obtained by calling 1-800-SEC-0330.
For a complete list of a fund's portfolio holdings, view the most recent holdings listing, semiannual report, or annual report on Fidelity's web site at http://www.fidelity.com, http://www.institutional.fidelity.com, or http://www.401k.com, as applicable.
NOT FDIC INSURED •MAY LOSE VALUE •NO BANK GUARANTEE
Neither the Fund nor Fidelity Distributors Corporation is a bank.
Note to Shareholders:
Early in 2020, the outbreak and spread of a new coronavirus emerged as a public health emergency that had a major influence on financial markets, primarily based on its impact on the global economy and the outlook for corporate earnings. The virus causes a respiratory disease known as COVID-19. On March 11, 2020 the World Health Organization declared the COVID-19 outbreak a pandemic, citing sustained risk of further global spread.
In the weeks following, as the crisis worsened, we witnessed an escalating human tragedy with wide-scale social and economic consequences from coronavirus-containment measures. The outbreak of COVID-19 prompted a number of measures to limit the spread, including travel and border restrictions, quarantines, and restrictions on large gatherings. In turn, these resulted in lower consumer activity, diminished demand for a wide range of products and services, disruption in manufacturing and supply chains, and – given the wide variability in outcomes regarding the outbreak – significant market uncertainty and volatility. Amid the turmoil, global governments and central banks took unprecedented action to help support consumers, businesses, and the broader economies, and to limit disruption to financial systems.
The situation continues to unfold, and the extent and duration of its impact on financial markets and the economy remain highly uncertain. Extreme events such as the coronavirus crisis are “exogenous shocks” that can have significant adverse effects on mutual funds and their investments. Although multiple asset classes may be affected by market disruption, the duration and impact may not be the same for all types of assets.
Fidelity is committed to helping you stay informed amid news about COVID-19 and during increased market volatility, and we’re taking extra steps to be responsive to customer needs. We encourage you to visit our websites, where we offer ongoing updates, commentary, and analysis on the markets and our funds.
Investment Summary/Performance (Unaudited)
Effective Maturity Diversification as of July 31, 2021
| Days | % of fund's investments |
| 1 - 7 | 83.3 |
| 8 - 30 | 1.0 |
| 31 - 60 | 5.6 |
| 61 - 90 | 1.3 |
| 91 - 180 | 3.0 |
| > 180 | 5.8 |
Effective maturity is determined in accordance with the requirements of Rule 2a-7 under the Investment Company Act of 1940.
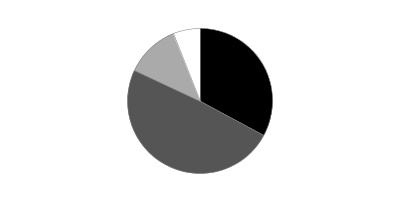
Asset Allocation (% of fund's net assets)
| As of July 31, 2021 |
| | Variable Rate Demand Notes (VRDNs) | 20.3% |
| | Tender Option Bond | 57.6% |
| | Other Municipal Security | 12.8% |
| | Investment Companies | 9.4% |
| | Net Other Assets (Liabilities)* | (0.1)% |

* Short-Term Investments and Net Other Assets (Liabilities) are not included in the pie chart
Current 7-Day Yields
| | 7/30/21 |
| Fidelity® New York AMT Tax-Free Money Market Fund | 0.01% |
| Institutional Class | 0.01% |
| Service Class | 0.01% |
Yield refers to the income paid by the Fund over a given period. Yield for money market funds is usually for seven-day periods, as it is here, though it is expressed as an annual percentage rate. Past performance is no guarantee of future results. Yield will vary and it's possible to lose money investing in the Fund. A portion of the Fund's expenses was reimbursed and/or waived. Absent such reimbursements and/or waivers the yield for the period ending July 31, 2021, the most recent period shown in the table, would have been (.23)% or New York AMT Tax-Free Money Market Fund, (.18)% for Institutional Class and (.43)% for Service Class.
Schedule of Investments July 31, 2021 (Unaudited)
Showing Percentage of Net Assets
| Variable Rate Demand Note - 20.3% | | | |
| | | Principal Amount | Value |
| Indiana - 0.2% | | | |
| Lawrenceburg Poll. Cont. Rev. (Indiana Michigan Pwr. Co. Proj.) Series H, 0.11% 8/6/21, VRDN (a) | | $2,900,000 | $2,900,000 |
| Kansas - 0.7% | | | |
| Burlington Envir. Impt. Rev. (Kansas City Pwr. and Lt. Co. Proj.): | | | |
| Series 2007 A, 0.1% 8/6/21, VRDN (a) | | 700,000 | 700,000 |
| Series 2007 B, 0.1% 8/6/21, VRDN (a) | | 2,600,000 | 2,600,000 |
| Wamego Kansas Poll. Cont. Rfdg. Rev.: | | | |
| (Kansas Gas & Elec. Co. Proj.) Series 1994, 0.07% 8/6/21, VRDN (a) | | 500,000 | 500,000 |
| (Western Resources, Inc. Proj.) Series 1994, 0.07% 8/6/21, VRDN (a) | | 6,500,000 | 6,500,000 |
| | | | 10,300,000 |
| Louisiana - 1.2% | | | |
| Saint James Parish Gen. Oblig. (Nucor Steel Louisiana LLC Proj.): | | | |
| Series 2010 A1, 0.08% 8/6/21, VRDN (a) | | 8,800,000 | 8,800,000 |
| Series 2010 B1, 0.07% 8/6/21, VRDN (a) | | 9,100,000 | 9,100,000 |
| | | | 17,900,000 |
| New York - 18.2% | | | |
| Amherst Dev. Corp. Student Hsg. Facility Rev. (South Lake Village Proj.) Series 2010 B, 0.07% 8/6/21, LOC HSBC Bank U.S.A., NA, VRDN (a) | | 4,395,000 | 4,395,000 |
| Battery Park City Auth. Rev. Series 2019 D2, 0.03% 8/6/21 (Liquidity Facility TD Banknorth, NA), VRDN (a) | | 10,025,000 | 10,025,000 |
| Build NYC Resource Corp. Rev. (The Asia Society Proj.) Series 2015, 0.02% 8/6/21, LOC TD Banknorth, NA, VRDN (a) | | 2,905,000 | 2,905,000 |
| Franklin County Civic Dev. Co. (Alice Hyde Med. Ctr. Proj.) Series 2013 A, 0.04% 8/6/21, LOC HSBC Bank U.S.A., NA, VRDN (a) | | 4,845,000 | 4,845,000 |
| Liberty Dev. Corp. Rev. (377 Greenwich LLC Proj.) Series 2004, 0.02% 8/6/21, LOC Wells Fargo Bank NA, VRDN (a) | | 18,525,000 | 18,525,000 |
| New York Dorm. Auth. Revs. (City Univ. Proj.) Series 2008 D, 0.03% 8/6/21, LOC TD Banknorth, NA, VRDN (a) | | 6,690,000 | 6,690,000 |
| New York Hsg. Fin. Agcy. Rev.: | | | |
| (8 East 102nd Street Hsg. Proj.) Series 2010 A, 0.02% 8/6/21, LOC TD Banknorth, NA, VRDN (a) | | 1,025,000 | 1,025,000 |
| (Tribeca Green Hsg. Proj.) Series 2003 A, 0.04% 8/6/21, LOC Landesbank Hessen-Thuringen, VRDN (a) | | 62,425,000 | 62,425,000 |
| Series 2010 A, 0.02% 8/6/21, LOC Landesbank Hessen-Thuringen, VRDN (a) | | 14,350,000 | 14,350,000 |
| New York Metropolitan Trans. Auth. Dedicated Tax Fund Rev. Series A, 0.02% 8/2/21, LOC TD Banknorth, NA, VRDN (a) | | 6,025,000 | 6,025,000 |
| Triborough Bridge & Tunnel Auth. Revs.: | | | |
| Series 2005 B 2A, 0.06% 8/6/21, LOC State Street Bank & Trust Co., Boston, VRDN (a) | | 10,000,000 | 10,000,000 |
| Series 2005 B 2B, 0.049% 8/6/21, LOC State Street Bank & Trust Co., Boston, VRDN (a) | | 3,900,000 | 3,900,000 |
| FHLMC: | | | |
| New York City Hsg. Dev. Corp. Multi-family Mtg. Rev.: | | | |
| (Bruckner by the Bridge Proj.) Series 2008 A, 0.03% 8/6/21, LOC Freddie Mac, VRDN (a) | | 1,000,000 | 1,000,000 |
| (Elliott Chelsea Dev. Proj.) Series 2010 A, 0.02% 8/6/21, LOC Freddie Mac, VRDN (a) | | 25,705,000 | 25,705,000 |
| Series 2011 B, 0.02% 8/6/21, LOC Freddie Mac, VRDN (a) | | 3,700,000 | 3,700,000 |
| New York Hsg. Fin. Agcy. Rev. Series 2010 A, 0.03% 8/6/21, LOC Freddie Mac, VRDN (a) | | 23,830,000 | 23,830,000 |
| FNMA New York Hsg. Fin. Agcy. Rev.: | | | |
| (10 Barclay Street Hsg. Proj.) Series 2004 A, 0.02% 8/6/21, LOC Fannie Mae, VRDN (a) | | 16,900,000 | 16,900,000 |
| Series 2009 A, 0.03% 8/6/21, LOC Fannie Mae, VRDN (a) | | 57,000,000 | 57,000,000 |
| | | | 273,245,000 |
| TOTAL VARIABLE RATE DEMAND NOTE | | | |
| (Cost $304,345,000) | | | 304,345,000 |
|
| Tender Option Bond - 57.6% | | | |
| California - 0.4% | | | |
| California Gen. Oblig. Participating VRDN Series DB 80 74, 0.09% 8/6/21 (Liquidity Facility Deutsche Bank AG New York Branch) (a)(b)(c) | | 4,300,000 | 4,300,000 |
| Dignityhealthxx Participating VRDN Series DBE 80 11, 0.2% 8/6/21 (Liquidity Facility Deutsche Bank AG New York Branch) (a)(b)(c) | | 2,000,000 | 2,000,000 |
| | | | 6,300,000 |
| Colorado - 0.0% | | | |
| Tender Option Bond Trust Receipts Participating VRDN Series XG 00 68, 0.09% 8/6/21 (Liquidity Facility Deutsche Bank AG New York Branch) (a)(b)(c) | | 480,000 | 480,000 |
| Connecticut - 0.3% | | | |
| Connecticut Gen. Oblig. Participating VRDN: | | | |
| Series Floaters 014, 0.14% 9/10/21 (Liquidity Facility Barclays Bank PLC) (a)(b)(c) | | 1,790,000 | 1,790,000 |
| Series Floaters 016, 0.14% 9/10/21 (Liquidity Facility Barclays Bank PLC) (a)(b)(c) | | 500,000 | 500,000 |
| Connecticut Spl. Tax Oblig. Trans. Infrastructure Rev. Bonds Series Floaters G 110, 0.2%, tender 10/1/21 (Liquidity Facility Royal Bank of Canada) (a)(b)(c)(d) | | 1,800,000 | 1,800,000 |
| | | | 4,090,000 |
| Florida - 0.1% | | | |
| Tampa-Hillsborough Co. Ex Auth. Bonds Series G-113, 0.22%, tender 1/3/22 (Liquidity Facility Royal Bank of Canada) (a)(b)(c)(d) | | 1,000,000 | 1,000,000 |
| Illinois - 0.3% | | | |
| Illinois Fin. Auth. Rev. Participating VRDN Series Floaters 017, 0.14% 9/10/21 (Liquidity Facility Barclays Bank PLC) (a)(b)(c) | | 3,850,000 | 3,850,000 |
| Indiana - 0.2% | | | |
| Indiana Fin. Auth. Rev. Participating VRDN Series 2020 004, 0.17% 9/10/21 (Liquidity Facility Wells Fargo Bank NA) (a)(b)(c) | | 2,855,000 | 2,855,000 |
| Kentucky - 0.1% | | | |
| CommonSpirit Health Participating VRDN Series MIZ 90 21, 0.12% 8/6/21 (Liquidity Facility Mizuho Cap. Markets Llc) (a)(b)(c) | | 1,200,000 | 1,200,000 |
| Kentucky State Property & Buildings Commission Rev. Bonds Series G 116, 0.22%, tender 11/1/21 (Liquidity Facility Royal Bank of Canada) (a)(b)(c)(d) | | 800,000 | 800,000 |
| | | | 2,000,000 |
| Maryland - 0.6% | | | |
| Maryland Gen. Oblig. Participating VRDN Series DB 80 76, 0.09% 8/6/21 (Liquidity Facility Deutsche Bank AG New York Branch) (a)(b)(c) | | 8,475,000 | 8,475,000 |
| Massachusetts - 0.1% | | | |
| Massachusetts Gen. Oblig. Participating VRDN Series 2021 XG 03 15, 0.09% 8/6/21 (Liquidity Facility Deutsche Bank AG New York Branch) (a)(b)(c) | | 1,400,000 | 1,400,000 |
| Mississippi - 0.1% | | | |
| Mississippi Bus. Fin. Corp. Rev. Participating VRDN Series 2021 XF 11 05, 0.12% 8/6/21 (Liquidity Facility Deutsche Bank AG New York Branch) (a)(b)(c) | | 900,000 | 900,000 |
| New York - 54.2% | | | |
| Battery Park City Auth. Rev. Participating VRDN Series E 137, 0.05% 8/6/21 (Liquidity Facility Royal Bank of Canada) (a)(b)(c) | | 53,350,000 | 53,350,000 |
| Clipper Tax-Exempt Trust Participating VRDN Series Clipper 07 43, 0.07% 8/6/21 (Liquidity Facility State Street Bank & Trust Co., Boston) (a)(b)(c) | | 16,315,000 | 16,315,000 |
| Dorm. Auth. New York Univ. Rev. Participating VRDN: | | | |
| Series 2017 XG 0114, 0.04% 8/6/21 (Liquidity Facility Morgan Stanley Bank, West Valley City Utah) (a)(b)(c) | | 7,760,000 | 7,760,000 |
| Series Floaters XF 05 98, 0.06% 8/6/21 (Liquidity Facility Toronto-Dominion Bank) (a)(b)(c) | | 8,000,000 | 8,000,000 |
| Series XF 25 99, 0.04% 8/6/21 (Liquidity Facility Citibank NA) (a)(b)(c) | | 4,800,000 | 4,800,000 |
| Hempstead Local Dev. Corp. Rev. Participating VRDN Series 2021 XG 03 11, 0.05% 8/6/21 (Liquidity Facility Barclays Bank PLC) (a)(b)(c) | | 1,430,000 | 1,430,000 |
| Hudson Yards Infrastructure Corp. New York Rev. Participating VRDN: | | | |
| Series Floaters XF 05 49, 0.06% 8/6/21 (Liquidity Facility Toronto-Dominion Bank) (a)(b)(c) | | 1,200,000 | 1,200,000 |
| Series Floaters XF 05 51, 0.06% 8/6/21 (Liquidity Facility Toronto-Dominion Bank) (a)(b)(c) | | 2,700,000 | 2,700,000 |
| Series Floaters XF 06 77, 0.06% 8/6/21 (Liquidity Facility Toronto-Dominion Bank) (a)(b)(c) | | 2,100,000 | 2,100,000 |
| Series Floaters XF 24 57, 0.12% 8/6/21 (Liquidity Facility Morgan Stanley Bank, West Valley City Utah) (a)(b)(c) | | 2,333,500 | 2,333,500 |
| Series Floaters XF 24 80, 0.05% 8/6/21 (Liquidity Facility JPMorgan Chase Bank) (a)(b)(c) | | 9,600,000 | 9,600,000 |
| Series Floaters XM 07 00, 0.06% 8/6/21 (Liquidity Facility Toronto-Dominion Bank) (a)(b)(c) | | 4,020,000 | 4,020,000 |
| Series Floaters ZM 07 37, 0.09% 8/6/21 (Liquidity Facility JPMorgan Chase Bank) (a)(b)(c) | | 3,000,000 | 3,000,000 |
| Series XF 28 59, 0.12% 8/6/21 (Liquidity Facility Morgan Stanley Bank, West Valley City Utah) (a)(b)(c) | | 4,250,000 | 4,250,000 |
| Monroe County Indl. Dev. Corp. Participating VRDN: | | | |
| Series 20 XM 08 99, 0.05% 8/6/21 (Liquidity Facility Morgan Stanley Bank, West Valley City Utah) (a)(b)(c) | | 5,900,000 | 5,900,000 |
| Series 2021 ZF 12 17, 0.05% 8/6/21 (Liquidity Facility Royal Bank of Canada) (a)(b)(c) | | 3,595,000 | 3,595,000 |
| Series XF 09 91, 0.04% 8/6/21 (Liquidity Facility Toronto-Dominion Bank) (a)(b)(c) | | 5,200,000 | 5,200,000 |
| Series XF 29 17, 0.06% 8/6/21 (Liquidity Facility Barclays Bank PLC) (a)(b)(c) | | 2,470,000 | 2,470,000 |
| MTA Hudson Rail Yards Trust Oblig. Participating VRDN Series XX 1042, 0.06% 8/6/21 (Liquidity Facility Barclays Bank PLC) (a)(b)(c) | | 6,730,000 | 6,730,000 |
| Nassau County Gen. Oblig. Participating VRDN Series Floaters G5, 0.05% 8/6/21 (Liquidity Facility Royal Bank of Canada) (a)(b)(c) | | 5,000,000 | 5,000,000 |
| New York City Gen. Oblig. Participating VRDN: | | | |
| Series 15 ZF0197, 0.05% 8/6/21 (Liquidity Facility JPMorgan Chase Bank) (a)(b)(c) | | 2,500,000 | 2,500,000 |
| Series 2015 ZF0206, 0.05% 8/6/21 (Liquidity Facility JPMorgan Chase Bank) (a)(b)(c) | | 2,700,000 | 2,700,000 |
| Series 2020 003, 0.22% 9/10/21 (Liquidity Facility Wells Fargo Bank NA) (a)(b)(c) | | 19,100,000 | 19,100,000 |
| Series Floaters E87, 0.05% 8/6/21 (Liquidity Facility Royal Bank of Canada) (a)(b)(c) | | 11,495,000 | 11,495,000 |
| Series Floaters E88, 0.05% 8/6/21 (Liquidity Facility Royal Bank of Canada) (a)(b)(c) | | 15,830,000 | 15,830,000 |
| Series Floaters XM 07 06, 0.05% 8/6/21 (Liquidity Facility Royal Bank of Canada) (a)(b)(c) | | 2,100,000 | 2,100,000 |
| Series MS 3324, 0.04% 8/6/21 (Liquidity Facility Sumitomo Mitsui Banking Corp.) (a)(b)(c) | | 11,850,000 | 11,850,000 |
| Series RBC G 55, 0.05% 8/6/21 (Liquidity Facility Royal Bank of Canada) (a)(b)(c) | | 5,000,000 | 5,000,000 |
| Series RBC G 56, 0.05% 8/6/21 (Liquidity Facility Royal Bank of Canada) (a)(b)(c) | | 4,500,000 | 4,500,000 |
| Series Solar 2017 0057, 0.07% 8/6/21 (Liquidity Facility U.S. Bank NA, Cincinnati) (a)(b)(c) | | 1,510,000 | 1,510,000 |
| New York City Indl. Dev. Agcy. Rev. Participating VRDN: | | | |
| Series 2021 XF 29 35, 0.05% 8/6/21 (Liquidity Facility Barclays Bank PLC) (a)(b)(c) | | 6,555,000 | 6,555,000 |
| Series XF 29 10, 0.06% 8/6/21 (Liquidity Facility Barclays Bank PLC) (a)(b)(c) | | 4,230,000 | 4,230,000 |
| Series XF 29 11, 0.06% 8/6/21 (Liquidity Facility Barclays Bank PLC) (a)(b)(c) | | 1,705,000 | 1,705,000 |
| New York City Muni. Wtr. Fin. Auth. Participating VRDN Series ZF 23 15, 0.05% 8/6/21 (Liquidity Facility Barclays Bank PLC) (a)(b)(c) | | 8,040,000 | 8,040,000 |
| New York City Muni. Wtr. Fin. Auth. Wtr. & Swr. Sys. Rev. Participating VRDN: | | | |
| Series 15 XF0129, 0.05% 8/6/21 (Liquidity Facility JPMorgan Chase Bank) (a)(b)(c) | | 16,700,000 | 16,700,000 |
| Series 16 ZM0161, 0.05% 8/6/21 (Liquidity Facility Royal Bank of Canada) (a)(b)(c) | | 8,265,000 | 8,265,000 |
| Series 2015 ZF0207, 0.05% 8/6/21 (Liquidity Facility JPMorgan Chase Bank) (a)(b)(c) | | 6,500,000 | 6,500,000 |
| Series 2017 ZM 0495, 0.05% 8/6/21 (Liquidity Facility Morgan Stanley Bank, West Valley City Utah) (a)(b)(c) | | 3,000,000 | 3,000,000 |
| Series Floaters E 129, 0.05% 8/6/21 (Liquidity Facility Royal Bank of Canada) (a)(b)(c) | | 39,400,000 | 39,400,000 |
| Series Floaters XF 07 45, 0.05% 8/6/21 (Liquidity Facility Royal Bank of Canada) (a)(b)(c) | | 4,500,000 | 4,500,000 |
| Series Floaters XF 10 11, 0.05% 8/6/21 (Liquidity Facility Barclays Bank PLC) (a)(b)(c) | | 4,460,000 | 4,460,000 |
| Series Floaters XM 03 83, 0.05% 8/6/21 (Liquidity Facility JPMorgan Chase Bank) (a)(b)(c) | | 2,500,000 | 2,500,000 |
| Series Floaters XM 04 36, 0.05% 8/6/21 (Liquidity Facility Barclays Bank PLC) (a)(b)(c) | | 9,800,000 | 9,800,000 |
| Series Floaters XM 07 31, 0.05% 8/6/21 (Liquidity Facility Bank of America NA) (a)(b)(c) | | 4,000,000 | 4,000,000 |
| Series Floaters ZF 06 87, 0.05% 8/6/21 (Liquidity Facility Bank of America NA) (a)(b)(c) | | 5,025,000 | 5,025,000 |
| Series Floaters ZM 05 47, 0.05% 8/6/21 (Liquidity Facility Wells Fargo Bank NA) (a)(b)(c) | | 6,540,000 | 6,540,000 |
| Series MS 3373, 0.05% 8/6/21 (Liquidity Facility Morgan Stanley Bank, West Valley City Utah) (a)(b)(c) | | 1,040,000 | 1,040,000 |
| Series Putters 15 XM0002, 0.05% 8/6/21 (Liquidity Facility JPMorgan Chase Bank) (a)(b)(c) | | 40,305,000 | 40,305,000 |
| Series XG 0112, 0.05% 8/6/21 (Liquidity Facility Barclays Bank PLC) (a)(b)(c) | | 2,800,000 | 2,800,000 |
| Series XX 1046, 0.05% 8/6/21 (Liquidity Facility Barclays Bank PLC) (a)(b)(c) | | 1,500,000 | 1,500,000 |
| New York City Transitional Fin. Auth. Participating VRDN: | | | |
| Series XM 03 03, 0.05% 8/6/21 (Liquidity Facility Royal Bank of Canada) (a)(b)(c) | | 5,620,000 | 5,620,000 |
| Series XM 03 51, 0.05% 8/6/21 (Liquidity Facility JPMorgan Chase Bank) (a)(b)(c) | | 4,080,000 | 4,080,000 |
| New York City Transitional Fin. Auth. Bldg. Aid Rev. Participating VRDN: | | | |
| Series Floaters XF 05 61, 0.05% 8/6/21 (Liquidity Facility Toronto-Dominion Bank) (a)(b)(c) | | 8,250,000 | 8,250,000 |
| Series Floaters XF 25 55, 0.04% 8/6/21 (Liquidity Facility Toronto-Dominion Bank) (a)(b)(c) | | 5,920,000 | 5,920,000 |
| Series Floaters XM 06 19, 0.05% 8/6/21 (Liquidity Facility Wells Fargo Bank NA) (a)(b)(c) | | 3,750,000 | 3,750,000 |
| Series Floaters XM 06 20, 0.05% 8/6/21 (Liquidity Facility Wells Fargo Bank NA) (a)(b)(c) | | 7,385,000 | 7,385,000 |
| Series MS 3414, 0.1% 8/6/21 (Liquidity Facility Toronto-Dominion Bank) (a)(b)(c) | | 4,000,000 | 4,000,000 |
| New York City Transitional Fin. Auth. Rev. Participating VRDN: | | | |
| Series 002, 0.17% 9/10/21 (Liquidity Facility Wells Fargo Bank NA) (a)(b)(c) | | 38,500,000 | 38,500,000 |
| Series 2014 XM0029, 0.05% 8/6/21 (Liquidity Facility Royal Bank of Canada) (a)(b)(c) | | 10,200,000 | 10,200,000 |
| Series Floaters E99, 0.05% 8/6/21 (Liquidity Facility Royal Bank of Canada) (a)(b)(c) | | 12,895,000 | 12,895,000 |
| Series Floaters XF 07 16, 0.05% 8/6/21 (Liquidity Facility Toronto-Dominion Bank) (a)(b)(c) | | 4,200,000 | 4,200,000 |
| Series Floaters XF 07 17, 0.06% 8/6/21 (Liquidity Facility Toronto-Dominion Bank) (a)(b)(c) | | 12,285,000 | 12,285,000 |
| Series Floaters ZF 26 37, 0.05% 8/6/21 (Liquidity Facility Morgan Stanley Bank, West Valley City Utah) (a)(b)(c) | | 2,795,000 | 2,795,000 |
| Series Floaters ZM 05 44, 0.05% 8/6/21 (Liquidity Facility Bank of America NA) (a)(b)(c) | | 4,445,000 | 4,445,000 |
| Series MS 3360, 0.05% 8/6/21 (Liquidity Facility Morgan Stanley Bank, West Valley City Utah) (a)(b)(c) | | 4,800,000 | 4,800,000 |
| Series MS 3393, 0.05% 8/6/21 (Liquidity Facility Morgan Stanley Bank, West Valley City Utah) (a)(b)(c) | | 3,615,000 | 3,615,000 |
| Series XF 06 37, 0.05% 8/6/21 (Liquidity Facility Toronto-Dominion Bank) (a)(b)(c) | | 14,520,000 | 14,520,000 |
| Series XF 29 12, 0.05% 8/6/21 (Liquidity Facility Morgan Stanley Bank, West Valley City Utah) (a)(b)(c) | | 2,000,000 | 2,000,000 |
| Series ZF 09 62, 0.05% 8/6/21 (Liquidity Facility Toronto-Dominion Bank) (a)(b)(c) | | 3,800,000 | 3,800,000 |
| New York Dorm. Auth. Personal Income Tax Rev. Participating VRDN Series 15 XF1030, 0.05% 8/6/21 (Liquidity Facility Wells Fargo Bank NA) (a)(b)(c) | | 23,240,000 | 23,240,000 |
| New York Dorm. Auth. Rev. Participating VRDN: | | | |
| Series E-146, 0.05% 8/6/21 (Liquidity Facility Royal Bank of Canada) (a)(b)(c) | | 4,200,000 | 4,200,000 |
| Series XF 28 88, 0.06% 8/6/21 (Liquidity Facility Barclays Bank PLC) (a)(b)(c) | | 16,700,000 | 16,700,000 |
| Series XG 02 76, 0.05% 8/6/21 (Liquidity Facility Bank of America NA) (a)(b)(c) | | 12,960,000 | 12,960,000 |
| Series XG 02 77, 0.05% 8/6/21 (Liquidity Facility Bank of America NA) (a)(b)(c) | | 14,460,000 | 14,460,000 |
| Series XL 01 53, 0.06% 8/6/21 (Liquidity Facility Barclays Bank PLC) (a)(b)(c) | | 2,500,000 | 2,500,000 |
| New York Envir. Facilities Corp. Clean Wtr. & Drinking Wtr. Participating VRDN: | | | |
| Series 16 XL0002, 0.05% 8/6/21 (Liquidity Facility Barclays Bank PLC) (a)(b)(c) | | 8,100,000 | 8,100,000 |
| Series Floaters XF 25 86, 0.05% 8/6/21 (Liquidity Facility JPMorgan Chase Bank) (a)(b)(c) | | 3,750,000 | 3,750,000 |
| Series Floaters XG 01 69, 0.05% 8/6/21 (Liquidity Facility Barclays Bank PLC) (a)(b)(c) | | 10,800,000 | 10,800,000 |
| New York Liberty Dev. Corp. Participating VRDN: | | | |
| Series 2016 ZF 03 68, 0.07% 8/6/21 (Liquidity Facility JPMorgan Chase Bank) (a)(b)(c) | | 27,985,000 | 27,985,000 |
| Series Floaters XF 10 27, 0.09% 8/6/21 (Liquidity Facility Deutsche Bank AG New York Branch) (a)(b)(c) | | 12,259,000 | 12,259,000 |
| New York Metropolitan Trans. Auth. Rev. Participating VRDN: | | | |
| Series RBC E 126, 0.07% 8/6/21 (Liquidity Facility Royal Bank of Canada) (a)(b)(c) | | 13,665,000 | 13,665,000 |
| Series XF 05 91, 0.07% 8/6/21 (Liquidity Facility Bank of America NA) (a)(b)(c) | | 2,000,000 | 2,000,000 |
| Series XF 06 57, 0.07% 8/6/21 (Liquidity Facility Bank of America NA) (a)(b)(c) | | 6,065,000 | 6,065,000 |
| Series XF 08 65, 0.07% 8/6/21 (Liquidity Facility Bank of America NA) (a)(b)(c) | | 9,450,000 | 9,450,000 |
| Series XF 29 14, 0.06% 8/6/21 (Liquidity Facility Barclays Bank PLC) (a)(b)(c) | | 14,245,000 | 14,245,000 |
| Series XM 06 97, 0.07% 8/6/21 (Liquidity Facility Bank of America NA) (a)(b)(c) | | 1,500,000 | 1,500,000 |
| Series XM 08 43, 0.07% 8/6/21 (Liquidity Facility Bank of America NA) (a)(b)(c) | | 11,800,000 | 11,800,000 |
| New York Sales Tax Asset Receivables Corp. Participating VRDN: | | | |
| Series 15 XF0139, 0.05% 8/6/21 (Liquidity Facility JPMorgan Chase Bank) (a)(b)(c) | | 3,340,000 | 3,340,000 |
| Series 16 ZM0174, 0.1% 8/6/21 (Liquidity Facility Morgan Stanley Bank, West Valley City Utah) (a)(b)(c) | | 9,145,000 | 9,145,000 |
| Series 2015 ZF0209, 0.05% 8/6/21 (Liquidity Facility JPMorgan Chase Bank) (a)(b)(c) | | 1,000,000 | 1,000,000 |
| New York Thruway Auth. Gen. Rev. Participating VRDN: | | | |
| Series XF 08 29, 0.05% 8/6/21 (Liquidity Facility Royal Bank of Canada) (a)(b)(c) | | 5,075,000 | 5,075,000 |
| Series XF 08 47, 0.05% 8/6/21 (Liquidity Facility Royal Bank of Canada) (a)(b)(c) | | 5,710,000 | 5,710,000 |
| Series XX 11 27, 0.06% 8/6/21 (Liquidity Facility Barclays Bank PLC) (a)(b)(c) | | 3,220,000 | 3,220,000 |
| Series ZF 08 32, 0.05% 8/6/21 (Liquidity Facility Bank of America NA) (a)(b)(c) | | 2,820,000 | 2,820,000 |
| Series ZF 09 29, 0.05% 8/6/21 (Liquidity Facility Bank of America NA) (a)(b)(c) | | 4,255,000 | 4,255,000 |
| Oneida County Local Dev. Corp. Rev. Participating VRDN Series XG 02 82, 0.06% 8/6/21 (Liquidity Facility Bank of America NA) (a)(b)(c) | | 1,650,000 | 1,650,000 |
| Triborough Bridge and Tunnel Auth. Participating VRDN Series 2021 XL 01 69, 0.04% 8/6/21 (Liquidity Facility Bank of America NA) (a)(b)(c) | | 1,800,000 | 1,800,000 |
| Util. Debt Securitization Auth. Participating VRDN: | | | |
| Series 2015 ZF0195, 0.05% 8/6/21 (Liquidity Facility JPMorgan Chase Bank) (a)(b)(c) | | 7,700,000 | 7,700,000 |
| Series Floaters ZF 27 40, 0.05% 8/6/21 (Liquidity Facility Morgan Stanley Bank, West Valley City Utah) (a)(b)(c) | | 2,600,000 | 2,600,000 |
| Series Floaters ZM 01 22, 0.05% 8/6/21 (Liquidity Facility Royal Bank of Canada) (a)(b)(c) | | 4,000,000 | 4,000,000 |
| Series Floaters ZM 04 56, 0.05% 8/6/21 (Liquidity Facility JPMorgan Chase Bank) (a)(b)(c) | | 2,500,000 | 2,500,000 |
| Series Floaters ZM 04 62, 0.05% 8/6/21 (Liquidity Facility Royal Bank of Canada) (a)(b)(c) | | 4,000,000 | 4,000,000 |
| Westchester County Local Dev. Co. Participating VRDN Series Floaters XF 24 81, 0.06% 8/6/21 (Liquidity Facility Barclays Bank PLC) (a)(b)(c) | | 4,320,000 | 4,320,000 |
| | | | 815,077,500 |
| New York And New Jersey - 0.5% | | | |
| Port Auth. of New York & New Jersey Participating VRDN: | | | |
| Series 2021 XF 12 28, 0.05% 8/6/21 (Liquidity Facility JPMorgan Chase Bank) (a)(b)(c) | | 1,015,000 | 1,015,000 |
| Series Floaters XF 06 97, 0.09% 8/6/21 (Liquidity Facility Bank of America NA) (a)(b)(c) | | 5,910,000 | 5,910,000 |
| Series MS 15 ZM0099, 0.1% 8/6/21 (Liquidity Facility Morgan Stanley Bank, West Valley City Utah) (a)(b)(c) | | 1,100,000 | 1,100,000 |
| | | | 8,025,000 |
| Ohio - 0.2% | | | |
| Middletown Hosp. Facilities Rev. Participating VRDN Series Floaters 003, 0.14% 9/10/21 (Liquidity Facility Barclays Bank PLC) (a)(b)(c) | | 785,000 | 785,000 |
| Ohio Hosp. Rev. Participating VRDN Series 002, 0.14% 9/10/21 (Liquidity Facility Barclays Bank PLC) (a)(b)(c) | | 1,600,000 | 1,600,000 |
| Ohio Univ. Gen. Receipts Athens Bonds Series Floaters G 27, 0.22%, tender 12/1/21 (Liquidity Facility Royal Bank of Canada) (a)(b)(c)(d) | | 800,000 | 800,000 |
| | | | 3,185,000 |
| Pennsylvania - 0.0% | | | |
| Pennsylvania Tpk. Commission Tpk. Rev. Bonds Series Floaters G 43, 0.22%, tender 12/1/21 (Liquidity Facility Royal Bank of Canada) (a)(b)(c)(d) | | 400,000 | 400,000 |
| South Carolina - 0.0% | | | |
| South Carolina Trans. Infrastructure Bank Rev. Bonds Series Floaters G 109, 0.22%, tender 10/1/21 (Liquidity Facility Royal Bank of Canada) (a)(b)(c)(d) | | 500,000 | 500,000 |
| Virginia - 0.5% | | | |
| Lynchburg Econ. Dev. Participating VRDN Series 2020 10, 0.14% 9/10/21 (Liquidity Facility Barclays Bank PLC) (a)(b)(c) | | 4,945,000 | 4,945,000 |
| Suffolk Econ. Dev. Auth. Hosp. Facilities Rev. Participating VRDN Series MIZ 90 25, 0.09% 8/6/21 (Liquidity Facility Mizuho Cap. Markets Llc) (a)(b)(c) | | 2,125,000 | 2,125,000 |
| Virginia Pub. Bldg. Auth. Pub. Facilities Rev. Bonds Series Floaters G 40, 0.22%, tender 2/1/22 (Liquidity Facility Royal Bank of Canada) (a)(b)(c)(d) | | 400,000 | 400,000 |
| | | | 7,470,000 |
| TOTAL TENDER OPTION BOND | | | |
| (Cost $866,007,500) | | | 866,007,500 |
|
| Other Municipal Security - 12.8% | | | |
| Michigan - 0.0% | | | |
| Kent Hosp. Fin. Auth. Hosp. Facilities Rev. Bonds (Spectrum Health Sys. Proj.) Series 2015 A, SIFMA Municipal Swap Index + 0.250% 0.27%, tender 2/25/22 (a)(e) | | 100,000 | 100,000 |
| New York - 9.1% | | | |
| Burnt Hills Ballston Lake NY BAN Series 2021, 2% 6/23/22 | | 7,650,000 | 7,774,763 |
| Casenovia Central School District BAN Series 2021, 1.5% 7/15/22 | | 9,600,000 | 9,722,374 |
| Dobbs Ferry Union Free School District BAN Series 2021, 1.5% 6/3/22 | | 5,700,000 | 5,763,443 |
| Ithaca City City School District BAN Series 2021, 1.5% 7/15/22 | | 10,200,000 | 10,330,995 |
| Middle Country Century School District TAN Series 2021, 1% 6/24/22 (f) | | 5,000,000 | 5,037,150 |
| New York City Transitional Fin. Auth. Rev. Bonds Series 2021 A, 5% 11/1/21 | | 1,340,000 | 1,356,283 |
| New York City Trust For Cultural Bonds: | | | |
| Series 2014 B1, 0.12%, tender 11/5/21 (a) | | 3,100,000 | 3,100,000 |
| Series 2014 B2, SIFMA Municipal Swap Index + 0.050% 0.01%, tender 2/14/22 (a)(e) | | 4,840,000 | 4,840,000 |
| New York Pwr. Auth.: | | | |
| Series 1: | | | |
| 0.29% 8/3/21, CP | | 450,000 | 450,000 |
| 0.29% 8/3/21, CP | | 250,000 | 250,000 |
| Series 2, 0.16% 1/6/22, CP | | 16,000,000 | 16,000,000 |
| Series 2021 2, 0.12% 11/18/21, CP | | 9,000,000 | 9,000,000 |
| Series 2021: | | | |
| 0.08% 9/14/21, CP | | 1,662,000 | 1,662,000 |
| 0.14% 8/17/21, CP | | 8,400,000 | 8,400,000 |
| New York Thruway Auth. Gen. Rev. Bonds Series 2012 I: | | | |
| 5% 1/1/22 (Pre-Refunded to 1/1/22 @ 100) | | 100,000 | 102,011 |
| 5% 1/1/22 (Pre-Refunded to 1/1/22 @ 100) | | 100,000 | 102,011 |
| 5% 1/1/22 (Pre-Refunded to 1/1/22 @ 100) | | 360,000 | 367,106 |
| New York Urban Dev. Corp. Rev. Bonds Series 2013 C, 5% 3/15/22 | | 125,000 | 128,721 |
| Putnam Valley Central School District BAN Series 2021, 2% 7/15/22 | | 8,000,000 | 8,138,514 |
| Rockland County Gen. Oblig. TAN Series 2021, 2% 4/1/22 | | 3,000,000 | 3,037,191 |
| Three Village Central School District TAN Series 2021, 1% 6/24/22 | | 12,000,000 | 12,091,097 |
| Vestal Central School District BAN Series 2021, 1.25% 7/28/22 | | 15,300,000 | 15,466,153 |
| Webster Central School District BAN Series 2021, 1.75% 6/29/22 | | 9,000,000 | 9,129,917 |
| Westchester County TAN Series B, 2% 10/18/21 | | 3,700,000 | 3,714,873 |
| | | | 135,964,602 |
| New York And New Jersey - 3.7% | | | |
| Port Auth. of New York & New Jersey: | | | |
| Bonds Series 173, 4% 12/1/21 | | 155,000 | 156,916 |
| Series 2021 B: | | | |
| 0.1% 8/4/21, CP | | 12,500,000 | 12,500,000 |
| 0.1% 9/22/21, CP | | 4,000,000 | 4,000,000 |
| 0.11% 8/11/21, CP | | 7,000,000 | 7,000,000 |
| 0.11% 10/6/21, CP | | 3,000,000 | 3,000,000 |
| 0.11% 10/13/21, CP | | 10,400,000 | 10,400,000 |
| 0.14% 9/15/21, CP | | 4,000,000 | 4,000,000 |
| Series 2021, 0.25% 12/8/21, CP | | 15,000,000 | 15,000,000 |
| | | | 56,056,916 |
| TOTAL OTHER MUNICIPAL SECURITY | | | |
| (Cost $192,121,518) | | | 192,121,518 |
| | | Shares | Value |
|
| Investment Company - 9.4% | | | |
| Fidelity Tax-Free Cash Central Fund 0.04% (g)(h) | | | |
| (Cost $141,361,913) | | 141,336,611 | 141,361,913 |
| TOTAL INVESTMENT IN SECURITIES - 100.1% | | | |
| (Cost $1,503,835,931) | | | 1,503,835,931 |
| NET OTHER ASSETS (LIABILITIES) - (0.1)% | | | (930,371) |
| NET ASSETS - 100% | | | $1,502,905,560 |
Security Type Abbreviations
BAN – BOND ANTICIPATION NOTE
CP – COMMERCIAL PAPER
TAN – TAX ANTICIPATION NOTE
VRDN – VARIABLE RATE DEMAND NOTE (A debt instrument that is payable upon demand, either daily, weekly or monthly)
The date shown for securities represents the date when principal payments must be paid, taking into account any call options exercised by the issuer and any permissible maturity shortening features other than interest rate resets.
Legend
(a) Coupon rates for floating and adjustable rate securities reflect the rates in effect at period end.
(b) Provides evidence of ownership in one or more underlying municipal bonds.
(c) Coupon rates are determined by re-marketing agents based on current market conditions.
(d) Restricted securities (including private placements) - Investment in securities not registered under the Securities Act of 1933 (excluding 144A issues). At the end of the period, the value of restricted securities (excluding 144A issues) amounted to $5,700,000 or 0.4% of net assets.
(e) Coupon is indexed to a floating interest rate which may be multiplied by a specified factor and/or subject to caps or floors.
(f) Security or a portion of the security purchased on a delayed delivery or when-issued basis.
(g) Information in this report regarding holdings by state and security types does not reflect the holdings of the Fidelity Tax-Free Cash Central Fund.
(h) Affiliated fund that is available only to investment companies and other accounts managed by Fidelity Investments. The rate quoted is the annualized seven-day yield of the fund at period end. A complete unaudited listing of the fund's holdings as of its most recent quarter end is available upon request. In addition, each Fidelity Central Fund's financial statements are available on the SEC's website or upon request.
Additional information on each restricted holding is as follows:
| Security | Acquisition Date | Cost |
| Connecticut Spl. Tax Oblig. Trans. Infrastructure Rev. Bonds Series Floaters G 110, 0.2%, tender 10/1/21 (Liquidity Facility Royal Bank of Canada) | 4/1/21 | $1,800,000 |
| Kentucky State Property & Buildings Commission Rev. Bonds Series G 116, 0.22%, tender 11/1/21 (Liquidity Facility Royal Bank of Canada) | 5/3/21 | $800,000 |
| Ohio Univ. Gen. Receipts Athens Bonds Series Floaters G 27, 0.22%, tender 12/1/21 (Liquidity Facility Royal Bank of Canada) | 6/1/21 | $800,000 |
| Pennsylvania Tpk. Commission Tpk. Rev. Bonds Series Floaters G 43, 0.22%, tender 12/1/21 (Liquidity Facility Royal Bank of Canada) | 6/1/21 | $400,000 |
| South Carolina Trans. Infrastructure Bank Rev. Bonds Series Floaters G 109, 0.22%, tender 10/1/21 (Liquidity Facility Royal Bank of Canada) | 4/1/21 | $500,000 |
| Tampa-Hillsborough Co. Ex Auth. Bonds Series G-113, 0.22%, tender 1/3/22 (Liquidity Facility Royal Bank of Canada) | 7/1/21 | $1,000,000 |
| Virginia Pub. Bldg. Auth. Pub. Facilities Rev. Bonds Series Floaters G 40, 0.22%, tender 2/1/22 (Liquidity Facility Royal Bank of Canada) | 2/1/21 | $400,000 |
Affiliated Central Funds
Information regarding fiscal year to date income earned by the Fund from investments in Fidelity Central Funds is as follows:
| Fund | Income earned |
| Fidelity Tax-Free Cash Central Fund | $45,120 |
| Total | $45,120 |
Amounts in the income column in the above table include any capital gain distributions from underlying funds, which are presented in the corresponding line-item in the Statement of Operations, if applicable.
Fiscal year to date information regarding the Fund's investments in Fidelity Central Funds, including the ownership percentage, is presented below.
| Fund | Value, beginning of period | Purchases | Sales Proceeds | Realized Gain/Loss | Change in Unrealized appreciation (depreciation) | Value, end of period | % ownership, end of period |
| Fidelity Tax-Free Cash Central Fund 0.04% | $191,372,073 | $378,083,400 | $428,097,000 | $3,440 | $-- | $141,361,913 | 12.0% |
| Total | $191,372,073 | $378,083,400 | $428,097,000 | $3,440 | $-- | $141,361,913 | |
Investment Valuation
All investments are categorized as Level 2 under the Fair Value Hierarchy. The inputs or methodology used for valuing securities may not be an indication of the risk associated with investing in those securities. For more information on valuation inputs please refer to the Investment Valuation section in the accompanying Notes to Financial Statements.
See accompanying notes which are an integral part of the financial statements.
Financial Statements
Statement of Assets and Liabilities
| | | July 31, 2021 (Unaudited) |
| Assets | | |
Investment in securities, at value — See accompanying schedule:
Unaffiliated issuers (cost $1,362,474,018) | $1,362,474,018 | |
| Fidelity Central Funds (cost $141,361,913) | 141,361,913 | |
| Total Investment in Securities (cost $1,503,835,931) | | $1,503,835,931 |
| Cash | | 1,170 |
| Receivable for investments sold | | 5,000,000 |
| Receivable for fund shares sold | | 774,011 |
| Interest receivable | | 311,400 |
| Distributions receivable from Fidelity Central Funds | | 4,879 |
| Receivable from investment adviser for expense reductions | | 41,261 |
| Other receivables | | 280 |
| Total assets | | 1,509,968,932 |
| Liabilities | | |
| Payable for investments purchased | | |
| Regular delivery | $1,000,000 | |
| Delayed delivery | 5,037,150 | |
| Payable for fund shares redeemed | 909,771 | |
| Distributions payable | 1,634 | |
| Accrued management fee | 114,801 | |
| Other affiliated payables | 16 | |
| Total liabilities | | 7,063,372 |
| Net Assets | | $1,502,905,560 |
| Net Assets consist of: | | |
| Paid in capital | | $1,502,478,376 |
| Total accumulated earnings (loss) | | 427,184 |
| Net Assets | | $1,502,905,560 |
| Net Asset Value and Maximum Offering Price | | |
| New York AMT Tax-Free Money Market Fund: | | |
| Net Asset Value, offering price and redemption price per share ($436,750,496 ÷ 436,251,813 shares) | | $1.00 |
| Institutional Class: | | |
| Net Asset Value, offering price and redemption price per share ($1,066,038,243 ÷ 1,064,931,867 shares) | | $1.00 |
| Service Class: | | |
| Net Asset Value, offering price and redemption price per share ($116,821 ÷ 116,697 shares) | | $1.00 |
See accompanying notes which are an integral part of the financial statements.
Statement of Operations
| | | Six months ended July 31, 2021 (Unaudited) |
| Investment Income | | |
| Interest | | $812,188 |
| Income from Fidelity Central Funds | | 45,120 |
| Total income | | 857,308 |
| Expenses | | |
| Management fee | $1,600,045 | |
| Transfer agent fees | 514,191 | |
| Distribution and service plan fees | 163 | |
| Independent trustees' fees and expenses | 2,166 | |
| Total expenses before reductions | 2,116,565 | |
| Expense reductions | (1,338,754) | |
| Total expenses after reductions | | 777,811 |
| Net investment income (loss) | | 79,497 |
| Realized and Unrealized Gain (Loss) | | |
| Net realized gain (loss) on: | | |
| Investment securities: | | |
| Unaffiliated issuers | 189,369 | |
| Fidelity Central Funds | 3,440 | |
| Total net realized gain (loss) | | 192,809 |
| Net increase in net assets resulting from operations | | $272,306 |
See accompanying notes which are an integral part of the financial statements.
Statement of Changes in Net Assets
| | Six months ended July 31, 2021 (Unaudited) | Year ended January 31, 2021 |
| Increase (Decrease) in Net Assets | | |
| Operations | | |
| Net investment income (loss) | $79,497 | $8,373,488 |
| Net realized gain (loss) | 192,809 | 509,178 |
| Net increase in net assets resulting from operations | 272,306 | 8,882,666 |
| Distributions to shareholders | (79,292) | (8,555,119) |
| Share transactions - net increase (decrease) | (240,520,481) | (791,972,341) |
| Total increase (decrease) in net assets | (240,327,467) | (791,644,794) |
| Net Assets | | |
| Beginning of period | 1,743,233,027 | 2,534,877,821 |
| End of period | $1,502,905,560 | $1,743,233,027 |
See accompanying notes which are an integral part of the financial statements.
Financial Highlights
Fidelity New York AMT Tax-Free Money Market Fund
| | Six months ended (Unaudited) July 31, | Years endedJanuary 31, | | | | |
| | 2021 | 2021 | 2020 | 2019 | 2018 | 2017 |
| Selected Per–Share Data | | | | | | |
| Net asset value, beginning of period | $1.00 | $1.00 | $1.00 | $1.00 | $1.00 | $1.00 |
| Income from Investment Operations | | | | | | |
| Net investment income (loss) | –A | .003 | .012 | .012 | .006 | .002 |
| Net realized and unrealized gain (loss) | –A | –A | –A | –A | –A | .001 |
| Total from investment operations | –A | .003 | .012 | .012 | .006 | .003 |
| Distributions from net investment income | –A | (.003) | (.012) | (.012) | (.006) | (.002) |
| Distributions from net realized gain | – | –A | –A | –A | –A | –A |
| Total distributions | –A | (.003) | (.012) | (.012) | (.006) | (.003)B |
| Net asset value, end of period | $1.00 | $1.00 | $1.00 | $1.00 | $1.00 | $1.00 |
| Total ReturnC,D | - %E | .33% | 1.18% | 1.18% | .64% | .27% |
| Ratios to Average Net AssetsF,G | | | | | | |
| Expenses before reductions | .30%H | .30% | .30% | .30% | .30% | .30% |
| Expenses net of fee waivers, if any | .10%H | .26% | .30% | .30% | .30% | .27% |
| Expenses net of all reductions | .10%H | .26% | .30% | .30% | .30% | .27% |
| Net investment income (loss) | .01%H | .35% | 1.15% | 1.18% | .65% | .25% |
| Supplemental Data | | | | | | |
| Net assets, end of period (000 omitted) | $436,750 | $468,986 | $566,254 | $530,339 | $379,101 | $286,218 |
A Amount represents less than $.0005 per share.
B Total distributions per share do not sum due to rounding.
C Total returns for periods of less than one year are not annualized.
D Total returns would have been lower if certain expenses had not been reduced during the applicable periods shown.
E Amount represents less than .005%.
F Fees and expenses of any underlying mutual funds or exchange-traded funds (ETFs) are not included in the Fund's expense ratio. The Fund indirectly bears its proportionate share of these expenses. For additional expense information related to investments in Fidelity Central Funds, please refer to the "Investments in Fidelity Central Funds" note found in the Notes to Financial Statements section of the most recent Annual or Semi-Annual report.
G Expense ratios reflect operating expenses of the class. Expenses before reductions do not reflect amounts reimbursed, waived, or reduced through arrangements with the investment adviser, brokerage services, or other offset arrangements, if applicable, and do not represent the amount paid by the class during periods when reimbursements, waivers or reductions occur.
H Annualized
See accompanying notes which are an integral part of the financial statements.
Fidelity New York AMT Tax-Free Money Market Fund Institutional Class
| | Six months ended (Unaudited) July 31, | Years endedJanuary 31, | | | | |
| | 2021 | 2021 | 2020 | 2019 | 2018 | 2017 |
| Selected Per–Share Data | | | | | | |
| Net asset value, beginning of period | $1.00 | $1.00 | $1.00 | $1.00 | $1.00 | $1.00 |
| Income from Investment Operations | | | | | | |
| Net investment income (loss) | –A | .004 | .013 | .013 | .007 | .003 |
| Net realized and unrealized gain (loss)A | – | – | – | – | – | – |
| Total from investment operations | –A | .004 | .013 | .013 | .007 | .003 |
| Distributions from net investment income | –A | (.004) | (.013) | (.013) | (.007) | (.003) |
| Distributions from net realized gain | – | –A | –A | –A | –A | – |
| Total distributions | –A | (.004) | (.013) | (.013) | (.007) | (.003) |
| Net asset value, end of period | $1.00 | $1.00 | $1.00 | $1.00 | $1.00 | $1.00 |
| Total ReturnB,C | - %D | .39% | 1.28% | 1.28% | .74% | .32% |
| Ratios to Average Net AssetsE,F | | | | | | |
| Expenses before reductions | .25%G | .25% | .25% | .25% | .25% | .25% |
| Expenses net of fee waivers, if any | .10%G | .20% | .20% | .20% | .20% | .19% |
| Expenses net of all reductions | .10%G | .20% | .20% | .20% | .20% | .19% |
| Net investment income (loss) | .01%G | .42% | 1.25% | 1.28% | .75% | .33% |
| Supplemental Data | | | | | | |
| Net assets, end of period (000 omitted) | $1,066,038 | $1,274,107 | $1,968,318 | $1,405,962 | $1,013,988 | $639,741 |
A Amount represents less than $.0005 per share.
B Total returns for periods of less than one year are not annualized.
C Total returns would have been lower if certain expenses had not been reduced during the applicable periods shown.
D Amount represents less than .005%.
E Fees and expenses of any underlying mutual funds or exchange-traded funds (ETFs) are not included in the Fund's expense ratio. The Fund indirectly bears its proportionate share of these expenses. For additional expense information related to investments in Fidelity Central Funds, please refer to the "Investments in Fidelity Central Funds" note found in the Notes to Financial Statements section of the most recent Annual or Semi-Annual report.
F Expense ratios reflect operating expenses of the class. Expenses before reductions do not reflect amounts reimbursed, waived, or reduced through arrangements with the investment adviser, brokerage services, or other offset arrangements, if applicable, and do not represent the amount paid by the class during periods when reimbursements, waivers or reductions occur.
G Annualized
See accompanying notes which are an integral part of the financial statements.
Fidelity New York AMT Tax-Free Money Market Fund Service Class
| | Six months ended (Unaudited) July 31, | Years endedJanuary 31, | | | | |
| | 2021 | 2021 | 2020 | 2019 | 2018 | 2017 |
| Selected Per–Share Data | | | | | | |
| Net asset value, beginning of period | $1.00 | $1.00 | $1.00 | $1.00 | $1.00 | $1.00 |
| Income from Investment Operations | | | | | | |
| Net investment income (loss) | –A | .003 | .010 | .010 | .005 | .001 |
| Net realized and unrealized gain (loss)A | – | – | – | – | – | – |
| Total from investment operations | –A | .003 | .010 | .010 | .005 | .001 |
| Distributions from net investment income | –A | (.003) | (.010) | (.010) | (.005) | (.001) |
| Distributions from net realized gain | – | –A | –A | –A | –A | –A |
| Total distributions | –A | (.003) | (.010) | (.010) | (.005) | (.001) |
| Net asset value, end of period | $1.00 | $1.00 | $1.00 | $1.00 | $1.00 | $1.00 |
| Total ReturnB,C | - %D | .27% | 1.03% | 1.02% | .49% | .13% |
| Ratios to Average Net AssetsE,F | | | | | | |
| Expenses before reductions | .51%G | .50% | .50% | .50% | .50% | .50% |
| Expenses net of fee waivers, if any | .10%G | .36% | .45% | .45% | .45% | .38% |
| Expenses net of all reductions | .10%G | .36% | .45% | .45% | .45% | .38% |
| Net investment income (loss) | .01%G | .26% | 1.00% | 1.03% | .50% | .14% |
| Supplemental Data | | | | | | |
| Net assets, end of period (000 omitted) | $117 | $140 | $306 | $350 | $134 | $133 |
A Amount represents less than $.0005 per share.
B Total returns for periods of less than one year are not annualized.
C Total returns would have been lower if certain expenses had not been reduced during the applicable periods shown.
D Amount represents less than .005%.
E Fees and expenses of any underlying mutual funds or exchange-traded funds (ETFs) are not included in the Fund's expense ratio. The Fund indirectly bears its proportionate share of these expenses. For additional expense information related to investments in Fidelity Central Funds, please refer to the "Investments in Fidelity Central Funds" note found in the Notes to Financial Statements section of the most recent Annual or Semi-Annual report.
F Expense ratios reflect operating expenses of the class. Expenses before reductions do not reflect amounts reimbursed, waived, or reduced through arrangements with the investment adviser, brokerage services, or other offset arrangements, if applicable, and do not represent the amount paid by the class during periods when reimbursements, waivers or reductions occur.
G Annualized
See accompanying notes which are an integral part of the financial statements.
Notes to Financial Statements (Unaudited)
For the period ended July 31, 2021
1. Organization.
Fidelity New York AMT Tax-Free Money Market Fund (the Fund) is a fund of Fidelity New York Municipal Trust II (the Trust) and is authorized to issue an unlimited number of shares. The Trust is registered under the Investment Company Act of 1940, as amended (the 1940 Act), as an open-end management investment company organized as a Delaware statutory trust. The Fund offers New York AMT Tax-Free Money Market Fund, Institutional Class and Service Class shares, each of which has equal rights as to assets and voting privileges. Each class has exclusive voting rights with respect to matters that affect that class. Shares of the Fund are only available for purchase by retail shareholders The Fund may be affected by economic and political developments in the state of New York.
2. Investments in Fidelity Central Funds.
Funds may invest in Fidelity Central Funds, which are open-end investment companies generally available only to other investment companies and accounts managed by the investment adviser and its affiliates. The Schedule of Investments lists any Fidelity Central Funds held as an investment as of period end, but does not include the underlying holdings of each Fidelity Central Fund. An investing fund indirectly bears its proportionate share of the expenses of the underlying Fidelity Central Funds.
Based on its investment objective, each Fidelity Central Fund may invest or participate in various investment vehicles or strategies that are similar to those of the investing fund. These strategies are consistent with the investment objectives of the investing fund and may involve certain economic risks which may cause a decline in value of each of the Fidelity Central Funds and thus a decline in the value of the investing fund.
| Fidelity Central Fund | Investment Manager | Investment Objective | Investment Practices | Expense Ratio(a) |
| Fidelity Money Market Central Funds | Fidelity Management & Research Company LLC (FMR) | Each fund seeks to obtain a high level of current income consistent with the preservation of capital and liquidity. | Short-term Investments | Less than .005% to .01% |
(a) Expenses expressed as a percentage of average net assets and are as of each underlying Central Fund's most recent annual or semi-annual shareholder report.
A complete unaudited list of holdings for each Fidelity Central Fund is available upon request or at the Securities and Exchange Commission website at www.sec.gov. In addition, the financial statements of the Fidelity Central Funds which contain the significant accounting policies (including investment valuation policies) of those funds, and are not covered by the Report of Independent Registered Public Accounting Firm, are available on the Securities and Exchange Commission website or upon request.
3. Significant Accounting Policies.
The Fund is an investment company and applies the accounting and reporting guidance of the Financial Accounting Standards Board (FASB) Accounting Standards Codification Topic 946 Financial Services - Investment Companies. The financial statements have been prepared in conformity with accounting principles generally accepted in the United States of America (GAAP), which require management to make certain estimates and assumptions at the date of the financial statements. Actual results could differ from those estimates. Subsequent events, if any, through the date that the financial statements were issued have been evaluated in the preparation of the financial statements. The Fund's Schedule of Investments lists any underlying mutual funds or exchange-traded funds (ETFs) but does not include the underlying holdings of these funds. The following summarizes the significant accounting policies of the Fund:
Investment Valuation. The Fund categorizes the inputs to valuation techniques used to value its investments into a disclosure hierarchy consisting of three levels as shown below:
- Level 1 – quoted prices in active markets for identical investments
- Level 2 – other significant observable inputs (including quoted prices for similar investments, interest rates, prepayment speeds, etc.)
- Level 3 – unobservable inputs (including the Fund's own assumptions based on the best information available)
As permitted by compliance with certain conditions under Rule 2a-7 of the 1940 Act, securities are valued at amortized cost, which approximates fair value. The amortized cost of an instrument is determined by valuing it at its original cost and thereafter amortizing any discount or premium from its face value at a constant rate until maturity. Securities held by a money market fund are generally high quality and liquid; however, they are reflected as Level 2 because the inputs used to determine fair value are not quoted prices in an active market.
Investment Transactions and Income. The net asset value per share for processing shareholder transactions is calculated as of the close of business of the New York Stock Exchange (NYSE), normally 4:00 p.m. Eastern time. Security transactions, including the Fund's investment activity in the Fidelity Central Funds, are accounted for as of trade date. Gains and losses on securities sold are determined on the basis of identified cost. Income and capital gain distributions from Fidelity Central Funds, if any, are recorded on the ex-dividend date. Interest income is accrued as earned and includes coupon interest and amortization of premium and accretion of discount on debt securities as applicable.
Class Allocations and Expenses. Investment income, realized and unrealized capital gains and losses, common expenses of a fund, and certain fund-level expense reductions, if any, are allocated daily on a pro-rata basis to each class based on the relative net assets of each class to the total net assets of a fund. Each class differs with respect to transfer agent and distribution and service plan fees incurred, as applicable. Certain expense reductions may also differ by class, if applicable. For the reporting period, the allocated portion of income and expenses to each class as a percent of its average net assets may vary due to the timing of recording these transactions in relation to fluctuating net assets of the classes. Expenses directly attributable to a fund are charged to that fund. Expenses attributable to more than one fund are allocated among the respective funds on the basis of relative net assets or other appropriate methods. Expenses included in the accompanying financial statements reflect the expenses of that fund and do not include any expenses associated with any underlying mutual funds or exchange-traded funds. Although not included in a fund's expenses, a fund indirectly bears its proportionate share of these expenses through the net asset value of each underlying mutual fund or exchange-traded fund. Expense estimates are accrued in the period to which they relate and adjustments are made when actual amounts are known.
Income Tax Information and Distributions to Shareholders. Each year, the Fund intends to qualify as a regulated investment company under Subchapter M of the Internal Revenue Code, including distributing substantially all of its taxable income and realized gains. As a result, no provision for U.S. Federal income taxes is required. The Fund files a U.S. federal tax return, in addition to state and local tax returns as required. The Fund's federal income tax returns are subject to examination by the Internal Revenue Service (IRS) for a period of three fiscal years after they are filed. State and local tax returns may be subject to examination for an additional fiscal year depending on the jurisdiction.
Distributions are declared and recorded daily and paid monthly from net investment income. Distributions from realized gains, if any, are declared and recorded on the ex-dividend date. Income and capital gain distributions are declared separately for each class. Income and capital gain distributions are determined in accordance with income tax regulations, which may differ from GAAP.
Capital accounts within the financial statements are adjusted for permanent book-tax differences. These adjustments have no impact on net assets or the results of operations. Capital accounts are not adjusted for temporary book-tax differences which will reverse in a subsequent period.
Book-tax differences are primarily due to the short-term gain distributions from the Fidelity Central Funds.
The Fund purchases municipal securities whose interest, in the opinion of the issuer, is free from federal income tax. There is no assurance that the IRS will agree with this opinion. In the event the IRS determines that the issuer does not comply with relevant tax requirements, interest payments from a security could become federally taxable, possibly retroactively to the date the security was issued.
As of period end, the cost and unrealized appreciation (depreciation) in securities for federal income tax purposes were as follows:
| Gross unrealized appreciation | $– |
| Gross unrealized depreciation | – |
| Net unrealized appreciation (depreciation) | $– |
| Tax cost | $1,503,835,931 |
Delayed Delivery Transactions and When-Issued Securities. During the period, certain Funds transacted in securities on a delayed delivery or when-issued basis. Payment and delivery may take place after the customary settlement period for that security. The price of the underlying securities and the date when the securities will be delivered and paid for are fixed at the time the transaction is negotiated. Securities purchased on a delayed delivery or when-issued basis are identified as such in the Schedule of Investments. Compensation for interest forgone in the purchase of a delayed delivery or when-issued debt security may be received. With respect to purchase commitments, each applicable Fund identifies securities as segregated in its records with a value at least equal to the amount of the commitment. Payables and receivables associated with the purchases and sales of delayed delivery securities having the same coupon, settlement date and broker are offset. Delayed delivery or when-issued securities that have been purchased from and sold to different brokers are reflected as both payables and receivables in the Statement of Assets and Liabilities under the caption "Delayed delivery", as applicable. Losses may arise due to changes in the value of the underlying securities or if the counterparty does not perform under the contract's terms, or if the issuer does not issue the securities due to political, economic, or other factors.
Restricted Securities (including Private Placements). Funds may invest in securities that are subject to legal or contractual restrictions on resale. These securities generally may be resold in transactions exempt from registration or to the public if the securities are registered. Disposal of these securities may involve time-consuming negotiations and expense, and prompt sale at an acceptable price may be difficult. Information regarding restricted securities held at period end is included at the end of the Schedule of Investments, if applicable.
4. Fees and Other Transactions with Affiliates.
Management Fee and Expense Contract. Fidelity Management & Research Company LLC (the investment adviser) and its affiliates provide the Fund with investment management related services for which the Fund pays a monthly management fee that is based on an annual rate of .20% of the Fund's average net assets. Under the management contract, the investment adviser pays all other fund-level expenses, except the compensation of the independent Trustees and certain other expenses such as interest expense. The management fee is reduced by an amount equal to the fees and expenses paid by the Fund to the independent Trustees.
In addition, under the expense contract, the investment adviser pays class-level expenses for New York AMT Tax-Free Money Market Fund so that the total expenses do not exceed .35%, expressed as a percentage of class average net assets, with certain exceptions such as interest expense.
During the period, the investment adviser or its affiliates waived a portion of these fees.
Distribution and Service Plan Fees. In accordance with Rule 12b-1 of the 1940 Act, the Fund has adopted separate Distribution and Service Plans for each class of shares. Service Class pays Fidelity Distributors Company LLC (FDC), an affiliate of the investment adviser, a Service Fee based on an annual percentage of Service Class' average net assets. In addition, FDC may pay financial intermediaries for selling shares of the Fund and providing shareholder support services. For the period, the Service Fee rate, total service fees and amounts retained by FDC were as follows:
| | Service Fee | Total Fees | Retained by FDC |
| Service Class | .25% | $163 | $138 |
During the period, the investment adviser or its affiliates waived a portion of these fees.
Transfer Agent Fees. Fidelity Investments Institutional Operations Company LLC (FIIOC), an affiliate of the investment adviser, is the transfer, dividend disbursing and shareholder servicing agent for the Fund. FIIOC receives asset-based fees with respect to each account. FIIOC pays for typesetting, printing and mailing of shareholder reports, except proxy statements. Each class, with the exception of New York AMT Tax-Free Money Market Fund, pays a transfer agent fee equal to an annual rate of .05% of class-level average net assets. New York AMT Tax-Free Money Market Fund pays a transfer agent fee equal to an annual rate of .10% of class-level average net assets. For the period, transfer agent fees for each class were as follows:
| | Amount |
| New York AMT Tax-Free Money Market Fund | $227,276 |
| Institutional Class | 286,882 |
| Service Class | 33 |
| | $514,191 |
During the period, the investment adviser or its affiliates waived a portion of these fees.
Interfund Trades. Funds may purchase from or sell securities to other Fidelity Funds under procedures adopted by the Board. The procedures have been designed to ensure these interfund trades are executed in accordance with Rule 17a-7 of the 1940 Act.
| | Purchases ($) | Sales ($) |
| Fidelity New York AMT Tax-Free Money Market Fund | 41,730,000 | 74,565,000 |
5. Expense Reductions.
The investment adviser contractually agreed to reimburse Institutional Class and Service Class to the extent annual operating expenses, expressed as a percentage of each class' average net assets, exceed .20% and .45%, respectively. Some expenses, for example the compensation of the independent Trustees and certain other expenses such as interest expense, are excluded from this reimbursement. During the period, this reimbursement reduced Institutional Class and Service Class expenses by $297,748 and $36, respectively.
Additionally, the investment adviser or its affiliates voluntarily agreed to waive certain fees in order to avoid a negative yield. Such arrangements may be discontinued by the investment adviser at any time. For the period, the amount of the waiver for each class was as follows:
| New York AMT Tax-Free Money Market Fund | $461,964 |
| Institutional Class | 578,452 |
| Service Class | 226 |
In addition, through arrangements with the Fund's custodian, credits realized as a result of certain uninvested cash balances were used to reduce the Fund's expenses. During the period, custodian credits reduced the Fund's expenses by $328.
6. Distributions to Shareholders.
Distributions to shareholders of each class were as follows:
| | Six months ended
July 31, 2021 | Year ended
January 31, 2021 |
| Distributions to shareholders | | |
| New York AMT Tax-Free Money Market Fund | $22,497 | $1,752,983 |
| Institutional Class | 56,789 | 6,800,969 |
| Service Class | 6 | 1,167 |
| Total | $79,292 | $8,555,119 |
7. Share Transactions.
Share transactions for each class of shares at a $1.00 per share were as follows and may contain in-kind transactions, automatic conversions between classes or exchanges between affiliated funds:
| | Shares | Shares | Dollars | Dollars |
| | Six months ended July 31, 2021 | Year ended January 31, 2021 | Six months ended July 31, 2021 | Year ended January 31, 2021 |
| New York AMT Tax-Free Money Market Fund | | | | |
| Shares sold | 88,780,064 | 333,996,746 | $88,780,064 | $333,996,746 |
| Reinvestment of distributions | 21,007 | 1,621,170 | 21,007 | 1,621,170 |
| Shares redeemed | (121,120,661) | (433,008,309) | (121,120,661) | (433,008,309) |
| Net increase (decrease) | (32,319,590) | (97,390,393) | $(32,319,590) | $(97,390,393) |
| Institutional Class | | | | |
| Shares sold | 157,575,258 | 1,436,909,619 | $157,575,258 | $1,436,909,619 |
| Reinvestment of distributions | 48,610 | 5,832,425 | 48,610 | 5,832,425 |
| Shares redeemed | (365,801,432) | (2,137,158,639) | (365,801,432) | (2,137,158,639) |
| Net increase (decrease) | (208,177,564) | (694,416,595) | $(208,177,564) | $(694,416,595) |
| Service Class | | | | |
| Shares sold | 200 | 180,367 | $200 | $180,367 |
| Reinvestment of distributions | 6 | 1,167 | 6 | 1,167 |
| Shares redeemed | (23,533) | (346,887) | (23,533) | (346,887) |
| Net increase (decrease) | (23,327) | (165,353) | $(23,327) | $(165,353) |
8. Other.
Fund's organizational documents provide former and current trustees and officers with a limited indemnification against liabilities arising in connection with the performance of their duties to the fund. In the normal course of business, the fund may also enter into contracts that provide general indemnifications. The fund's maximum exposure under these arrangements is unknown as this would be dependent on future claims that may be made against the fund. The risk of material loss from such claims is considered remote.
9. Coronavirus (COVID-19) Pandemic.
An outbreak of COVID-19 first detected in China during December 2019 has since spread globally and was declared a pandemic by the World Health Organization during March 2020. Developments that disrupt global economies and financial markets, such as the COVID-19 pandemic, may magnify factors that affect the Fund's performance.
Shareholder Expense Example
As a shareholder, you incur two types of costs: (1) transaction costs, which may include sales charges (loads) on purchase payments or redemption proceeds, as applicable and (2) ongoing costs, which generally include management fees, distribution and/or service (12b-1) fees and other Fund expenses. This Example is intended to help you understand your ongoing costs (in dollars) of investing in a fund and to compare these costs with the ongoing costs of investing in other mutual funds.
The Example is based on an investment of $1,000 invested at the beginning of the period and held for the entire period (February 1, 2021 to July 31, 2021).
Actual Expenses
The first line of the accompanying table provides information about actual account values and actual expenses. You may use the information in this line, together with the amount you invested, to estimate the expenses that you paid over the period. Simply divide your account value by $1,000.00 (for example, an $8,600 account value divided by $1,000.00 = 8.6), then multiply the result by the number in the first line for a class/Fund under the heading entitled "Expenses Paid During Period" to estimate the expenses you paid on your account during this period. If any fund is a shareholder of any underlying mutual funds or exchange-traded funds (ETFs) (the Underlying Funds), such fund indirectly bears its proportional share of the expenses of the Underlying Funds in addition to the direct expenses incurred presented in the table. These fees and expenses are not included in the annualized expense ratio used to calculate the expense estimate in the table below.
Hypothetical Example for Comparison Purposes
The second line of the accompanying table provides information about hypothetical account values and hypothetical expenses based on the actual expense ratio and an assumed rate of return of 5% per year before expenses, which is not the actual return. The hypothetical account values and expenses may not be used to estimate the actual ending account balance or expenses you paid for the period. You may use this information to compare the ongoing costs of investing in the Fund and other funds. To do so, compare this 5% hypothetical example with the 5% hypothetical examples that appear in the shareholder reports of the other funds. If any fund is a shareholder of any Underlying Funds, such fund indirectly bears its proportional share of the expenses of the Underlying Funds in addition to the direct expenses as presented in the table. These fees and expenses are not included in the annualized expense ratio used to calculate the expense estimate in the table below.
Please note that the expenses shown in the table are meant to highlight your ongoing costs only and do not reflect any transaction costs. Therefore, the second line of the table is useful in comparing ongoing costs only, and will not help you determine the relative total costs of owning different funds.
| | Annualized Expense Ratio-A | Beginning
Account Value
February 1, 2021 | Ending
Account Value
July 31, 2021 | Expenses Paid
During Period-B
February 1, 2021
to July 31, 2021 |
| Fidelity New York AMT Tax-Free Money Market Fund | | | | |
| New York AMT Tax-Free Money Market Fund | .10% | | | |
| Actual | | $1,000.00 | $1,000.00 | $.50** |
| Hypothetical-C | | $1,000.00 | $1,024.30 | $.50** |
| Institutional Class | .10% | | | |
| Actual | | $1,000.00 | $1,000.00 | $.50** |
| Hypothetical-C | | $1,000.00 | $1,024.30 | $.50** |
| Service Class | .10% | | | |
| Actual | | $1,000.00 | $1,000.00 | $.50** |
| Hypothetical-C | | $1,000.00 | $1,024.30 | $.50** |
A Annualized expense ratio reflects expenses net of applicable fee waivers.
B Expenses are equal to the annualized expense ratio, multiplied by the average account value over the period, multiplied by 181/ 365 (to reflect the one-half year period). The fees and expenses of any Underlying Funds are not included in each annualized expense ratio.
C 5% return per year before expenses
** If certain fees were not voluntarily waived by the investment adviser or its affiliates during the period, the annualized expense ratio and the expenses paid in the actual and hypothetical examples above would have been as shown in table below:
| | Annualized Expense Ratio-(a)
| Expenses Paid
|
| Fidelity New York AMT Tax-Free Money Market Fund | | |
| New York AMT Tax-Free Money Market Fund | .30% | |
| Actual | | $1.49 |
| Hypothetical-(b) | | $1.51 |
| Institutional Class | .20% | |
| Actual | | $.99 |
| Hypothetical-(b) | | $1.00 |
| Service Class | .45% | |
| Actual | | $2.23 |
| Hypothetical-(b) | | $2.26 |
(a) Annualized expense ratio reflects expenses net of applicable fee waivers.
(b) 5% return per year before expenses

NYS-SANN-0921
1.536272.124
Fidelity® New York Municipal Money Market Fund
Semi-Annual Report
July 31, 2021
Contents
To view a fund's proxy voting guidelines and proxy voting record for the 12-month period ended June 30, visit http://www.fidelity.com/proxyvotingresults or visit the Securities and Exchange Commission's (SEC) web site at http://www.sec.gov.
You may also call 1-800-544-8544 to request a free copy of the proxy voting guidelines.
Standard & Poor's, S&P and S&P 500 are registered service marks of The McGraw-Hill Companies, Inc. and have been licensed for use by Fidelity Distributors Corporation.
Other third-party marks appearing herein are the property of their respective owners.
All other marks appearing herein are registered or unregistered trademarks or service marks of FMR LLC or an affiliated company. © 2021 FMR LLC. All rights reserved.
This report and the financial statements contained herein are submitted for the general information of the shareholders of the Fund. This report is not authorized for distribution to prospective investors in the Fund unless preceded or accompanied by an effective prospectus.
A fund files its complete schedule of portfolio holdings with the SEC for the first and third quarters of each fiscal year on Form N-PORT. Forms N-PORT are available on the SEC’s web site at http://www.sec.gov. A fund's Forms N-PORT may be reviewed and copied at the SEC’s Public Reference Room in Washington, DC. Information regarding the operation of the SEC's Public Reference Room may be obtained by calling 1-800-SEC-0330.
For a complete list of a fund's portfolio holdings, view the most recent holdings listing, semiannual report, or annual report on Fidelity's web site at http://www.fidelity.com, http://www.institutional.fidelity.com, or http://www.401k.com, as applicable.
NOT FDIC INSURED •MAY LOSE VALUE •NO BANK GUARANTEE
Neither the Fund nor Fidelity Distributors Corporation is a bank.
Note to Shareholders:
Early in 2020, the outbreak and spread of a new coronavirus emerged as a public health emergency that had a major influence on financial markets, primarily based on its impact on the global economy and the outlook for corporate earnings. The virus causes a respiratory disease known as COVID-19. On March 11, 2020 the World Health Organization declared the COVID-19 outbreak a pandemic, citing sustained risk of further global spread.
In the weeks following, as the crisis worsened, we witnessed an escalating human tragedy with wide-scale social and economic consequences from coronavirus-containment measures. The outbreak of COVID-19 prompted a number of measures to limit the spread, including travel and border restrictions, quarantines, and restrictions on large gatherings. In turn, these resulted in lower consumer activity, diminished demand for a wide range of products and services, disruption in manufacturing and supply chains, and – given the wide variability in outcomes regarding the outbreak – significant market uncertainty and volatility. Amid the turmoil, global governments and central banks took unprecedented action to help support consumers, businesses, and the broader economies, and to limit disruption to financial systems.
The situation continues to unfold, and the extent and duration of its impact on financial markets and the economy remain highly uncertain. Extreme events such as the coronavirus crisis are “exogenous shocks” that can have significant adverse effects on mutual funds and their investments. Although multiple asset classes may be affected by market disruption, the duration and impact may not be the same for all types of assets.
Fidelity is committed to helping you stay informed amid news about COVID-19 and during increased market volatility, and we’re taking extra steps to be responsive to customer needs. We encourage you to visit our websites, where we offer ongoing updates, commentary, and analysis on the markets and our funds.
Investment Summary/Performance (Unaudited)
Effective Maturity Diversification as of July 31, 2021
| Days | % of fund's investments |
| 1 - 7 | 83.3 |
| 8 - 30 | 1.4 |
| 31 - 60 | 4.9 |
| 61 - 90 | 1.5 |
| 91 - 180 | 2.9 |
| > 180 | 6.0 |
Effective maturity is determined in accordance with the requirements of Rule 2a-7 under the Investment Company Act of 1940.
Asset Allocation (% of fund's net assets)
| As of July 31, 2021 |
| | Variable Rate Demand Notes (VRDNs) | 33.1% |
| | Tender Option Bond | 49.5% |
| | Other Municipal Security | 12.1% |
| | Investment Companies | 6.1% |
| | Net Other Assets (Liabilities)* | (0.8)% |
* Short-Term Investments and Net Other Assets (Liabilities) are not included in the pie chart
Current 7-Day Yields
| | 7/30/21 |
| Fidelity® New York Municipal Money Market Fund | 0.01% |
Yield refers to the income paid by the Fund over a given period. Yield for money market funds is usually for seven-day periods, as it is here, though it is expressed as an annual percentage rate. Past performance is no guarantee of future results. Yield will vary and it's possible to lose money investing in the Fund. A portion of the Fund's expenses was reimbursed and/or waived. Absent such reimbursements and/or waivers the yield for the period ending July 31, 2021, the most recent period shown in the table, would have been (.39)%.
Schedule of Investments July 31, 2021 (Unaudited)
Showing Percentage of Net Assets
| Variable Rate Demand Note - 33.1% | | | |
| | | Principal Amount | Value |
| Alabama - 0.6% | | | |
| Decatur Indl. Dev. Board Exempt Facilities Rev. (Nucor Steel Decatur LLC Proj.) Series 2003 A, 0.1% 8/6/21, VRDN (a)(b) | | $6,161,000 | $6,161,000 |
| Arkansas - 0.1% | | | |
| Blytheville Indl. Dev. Rev. (Nucor Corp. Proj.) Series 2002, 0.09% 8/6/21, VRDN (a)(b) | | 1,500,000 | 1,500,000 |
| Kansas - 0.7% | | | |
| Burlington Envir. Impt. Rev. (Kansas City Pwr. and Lt. Co. Proj.): | | | |
| Series 2007 A, 0.1% 8/6/21, VRDN (a) | | 1,900,000 | 1,900,000 |
| Series 2007 B, 0.1% 8/6/21, VRDN (a) | | 900,000 | 900,000 |
| St. Mary's Kansas Poll. Cont. Rev. (Kansas Gas and Elec. Co. Proj.) Series 1994, 0.07% 8/6/21, VRDN (a) | | 3,700,000 | 3,700,000 |
| Wamego Kansas Poll. Cont. Rfdg. Rev. (Western Resources, Inc. Proj.) Series 1994, 0.07% 8/6/21, VRDN (a) | | 700,000 | 700,000 |
| | | | 7,200,000 |
| Louisiana - 0.8% | | | |
| Saint James Parish Gen. Oblig. (Nucor Steel Louisiana LLC Proj.): | | | |
| Series 2010 A1, 0.08% 8/6/21, VRDN (a) | | 2,600,000 | 2,600,000 |
| Series 2010 B1, 0.07% 8/6/21, VRDN (a) | | 5,200,000 | 5,200,000 |
| | | | 7,800,000 |
| New York - 30.1% | | | |
| New York City Hsg. Dev. Corp. Multi-family Mtg. Rev.: | | | |
| (Cook Street Apts. Proj.) Series A, 0.05% 8/6/21, LOC JPMorgan Chase Bank, VRDN (a)(b) | | 3,980,000 | 3,980,000 |
| (East 165th Street Proj.) Series A, 0.06% 8/6/21, LOC Citibank NA, VRDN (a)(b) | | 7,165,000 | 7,165,000 |
| (Granite Terrace Apts. Proj.) Series A, 0.07% 8/6/21, LOC Citibank NA, VRDN (a)(b) | | 3,060,000 | 3,060,000 |
| (Intervale Gardens Apts.) Series A, 0.07% 8/6/21, LOC Citibank NA, VRDN (a)(b) | | 3,115,000 | 3,115,000 |
| (Manhattan Court Dev. Proj.) Series A, 0.06% 8/6/21, LOC Citibank NA, VRDN (a)(b) | | 16,050,000 | 16,050,000 |
| (Related-Upper East Proj.) Series A, 0.05% 8/6/21, LOC Landesbank Baden-Wurttemberg, VRDN (a)(b) | | 35,800,000 | 35,800,000 |
| New York Dorm. Auth. Rev. Series 2019 B, 0.07% 8/6/21, LOC Manufacturers & Traders Trust Co., VRDN (a) | | 16,000,000 | 16,000,000 |
| New York Hsg. Fin. Agcy. Rev. (750 Sixth Avenue Hsg. Proj.): | | | |
| Series 1998 A, 0.05% 8/6/21, LOC Landesbank Hessen-Thuringen, VRDN (a)(b) | | 19,750,000 | 19,750,000 |
| Series 1999 A, 0.05% 8/6/21, LOC Landesbank Hessen-Thuringen, VRDN (a)(b) | | 25,700,000 | 25,700,000 |
| New York State Energy Research & Dev. Auth. Facilities Rev. (Consolidated Edison Co. of New York, Inc. Proj.): | | | |
| Series 2004 C1, 0.06% 8/6/21, LOC Mizuho Bank Ltd., VRDN (a)(b) | | 15,350,000 | 15,350,000 |
| Series 2004 C2, 0.04% 8/6/21, LOC Mizuho Bank Ltd., VRDN (a)(b) | | 15,500,000 | 15,500,000 |
| Series 2010 A2, 0.04% 8/6/21, LOC Bank of Nova Scotia, VRDN (a)(b) | | 15,600,000 | 15,600,000 |
| Onondaga County Indl. Dev. Agcy. Indl. Dev. Rev. (ICM Controls Corp. Proj.) Series 2004, 0.22% 8/6/21, LOC Manufacturers & Traders Trust Co., VRDN (a)(b) | | 1,030,000 | 1,030,000 |
| Triborough Bridge & Tunnel Auth. Revs. Series 2005 B 2A, 0.06% 8/6/21, LOC State Street Bank & Trust Co., Boston, VRDN (a) | | 8,000,000 | 8,000,000 |
| FHLMC: | | | |
| New York City Hsg. Dev. Corp. Multi-family Mtg. Rev. Series 2011 A, 0.05% 8/6/21, LOC Freddie Mac, VRDN (a)(b) | | 2,000,000 | 2,000,000 |
| New York City Hsg. Dev. Corp. Multi-family Rental Hsg. Rev. (Rivereast Apts. Proj.) Series A, 0.06% 8/6/21, LOC Freddie Mac, VRDN (a)(b) | | 10,000,000 | 10,000,000 |
| New York Hsg. Fin. Agcy. Rev. (Sea Park East Hsg. Proj.) Series 2004 A, 0.04% 8/6/21, LOC Freddie Mac, VRDN (a)(b) | | 13,300,000 | 13,300,000 |
| FNMA: | | | |
| New York City Hsg. Dev. Corp. Multi-family Rental Hsg. Rev. (Sierra Dev. Proj.) Series A, 0.05% 8/6/21, LOC Fannie Mae, VRDN (a)(b) | | 18,000,000 | 18,000,000 |
| New York Hsg. Fin. Agcy. Rev.: | | | |
| (1500 Lexington Avenue Proj.) Series A, 0.04% 8/6/21, LOC Fannie Mae, VRDN (a)(b) | | 1,000,000 | 1,000,000 |
| (316 Eleventh Ave. Hsg. Proj.) Series 2007 A, 0.07% 8/6/21, LOC Fannie Mae, VRDN (a)(b) | | 10,000,000 | 10,000,000 |
| (360 West 43rd Street Hsg. Proj.) Series A, 0.07% 8/6/21, LOC Fannie Mae, VRDN (a)(b) | | 13,700,000 | 13,700,000 |
| (600 West and 42nd St. Hsg. Proj.) Series 2007 A, 0.06% 8/6/21, LOC Fannie Mae, VRDN (a)(b) | | 33,000,000 | 33,000,000 |
| (West 23rd Street Hsg. Proj.) Series 2001 A, 0.05% 8/6/21, LOC Fannie Mae, VRDN (a)(b) | | 2,900,000 | 2,900,000 |
| Series 2004 A, 0.06% 8/6/21, LOC Fannie Mae, VRDN (a)(b) | | 9,900,000 | 9,900,000 |
| | | | 299,900,000 |
| New York And New Jersey - 0.5% | | | |
| Port Auth. of New York & New Jersey Series 1995 3, 0.1% 8/30/21, VRDN (a)(b)(c) | | 4,600,000 | 4,600,000 |
| North Carolina - 0.2% | | | |
| Hertford County Indl. Facilities Poll. Cont. Fing. Auth. (Nucor Corp. Proj.) Series 2000 A, 0.09% 8/6/21, VRDN (a)(b) | | 1,700,000 | 1,700,000 |
| West Virginia - 0.1% | | | |
| West Virginia Econ. Dev. Auth. Solid Waste Disp. Facilities Rev. (Appalachian Pwr. Co. - Amos Proj.) Series 2008 B, 0.11% 8/6/21, VRDN (a)(b) | | 900,000 | 900,000 |
| TOTAL VARIABLE RATE DEMAND NOTE | | | |
| (Cost $329,761,000) | | | 329,761,000 |
|
| Tender Option Bond - 49.5% | | | |
| California - 0.5% | | | |
| California Gen. Oblig. Participating VRDN Series DB 80 74, 0.09% 8/6/21 (Liquidity Facility Deutsche Bank AG New York Branch) (a)(d)(e) | | 3,100,000 | 3,100,000 |
| Univ. of California Revs. Participating VRDN Series Floaters XG 00 61, 0.09% 8/6/21 (Liquidity Facility Deutsche Bank AG New York Branch) (a)(d)(e) | | 1,600,000 | 1,600,000 |
| | | | 4,700,000 |
| Colorado - 0.0% | | | |
| Denver City & County Arpt. Rev. Bonds Series G-114, 0.27%, tender 9/1/21 (Liquidity Facility Royal Bank of Canada) (a)(b)(c)(d)(e) | | 300,000 | 300,000 |
| Connecticut - 0.5% | | | |
| Connecticut Gen. Oblig. Participating VRDN: | | | |
| Series Floaters 014, 0.14% 9/10/21 (Liquidity Facility Barclays Bank PLC) (a)(d)(e) | | 4,055,000 | 4,055,000 |
| Series Floaters 016, 0.14% 9/10/21 (Liquidity Facility Barclays Bank PLC) (a)(d)(e) | | 300,000 | 300,000 |
| Connecticut Spl. Tax Oblig. Trans. Infrastructure Rev. Bonds Series Floaters G 110, 0.2%, tender 10/1/21 (Liquidity Facility Royal Bank of Canada) (a)(c)(d)(e) | | 1,100,000 | 1,100,000 |
| | | | 5,455,000 |
| Florida - 0.2% | | | |
| Broward County Port Facilities Rev. Bonds Series G 115, 0.27%, tender 3/1/22 (Liquidity Facility Royal Bank of Canada) (a)(b)(c)(d)(e) | | 400,000 | 400,000 |
| Greater Orlando Aviation Auth. Arpt. Facilities Rev. Bonds Series Floaters G 25, 0.27%, tender 10/1/21 (Liquidity Facility Royal Bank of Canada) (a)(b)(c)(d)(e) | | 500,000 | 500,000 |
| Tampa-Hillsborough Co. Ex Auth. Bonds Series G-113, 0.22%, tender 1/3/22 (Liquidity Facility Royal Bank of Canada) (a)(c)(d)(e) | | 600,000 | 600,000 |
| | | | 1,500,000 |
| Illinois - 0.4% | | | |
| Illinois Fin. Auth. Rev. Participating VRDN Series Floaters 017, 0.14% 9/10/21 (Liquidity Facility Barclays Bank PLC) (a)(d)(e) | | 4,040,000 | 4,040,000 |
| Indiana - 0.2% | | | |
| Indiana Fin. Auth. Rev. Participating VRDN Series 2020 004, 0.17% 9/10/21 (Liquidity Facility Wells Fargo Bank NA) (a)(d)(e) | | 1,670,000 | 1,670,000 |
| Kentucky - 0.1% | | | |
| CommonSpirit Health Participating VRDN Series MIZ 90 21, 0.12% 8/6/21 (Liquidity Facility Mizuho Cap. Markets Llc) (a)(d)(e) | | 400,000 | 400,000 |
| Kentucky State Property & Buildings Commission Rev. Bonds Series G 116, 0.22%, tender 11/1/21 (Liquidity Facility Royal Bank of Canada) (a)(c)(d)(e) | | 500,000 | 500,000 |
| | | | 900,000 |
| Massachusetts - 0.0% | | | |
| Massachusetts Gen. Oblig. Participating VRDN Series 2021 XG 03 15, 0.09% 8/6/21 (Liquidity Facility Deutsche Bank AG New York Branch) (a)(d)(e) | | 400,000 | 400,000 |
| Mississippi - 0.1% | | | |
| Mississippi Bus. Fin. Corp. Rev. Participating VRDN Series 2021 XF 11 05, 0.12% 8/6/21 (Liquidity Facility Deutsche Bank AG New York Branch) (a)(d)(e) | | 660,000 | 660,000 |
| New York - 42.2% | | | |
| Battery Park City Auth. Rev. Participating VRDN Series E 137, 0.05% 8/6/21 (Liquidity Facility Royal Bank of Canada) (a)(d)(e) | | 11,120,000 | 11,120,000 |
| Clipper Tax-Exempt Trust Participating VRDN Series Clipper 07 43, 0.07% 8/6/21 (Liquidity Facility State Street Bank & Trust Co., Boston) (a)(d)(e) | | 9,300,000 | 9,300,000 |
| Dorm. Auth. New York Univ. Rev. Participating VRDN Series Floaters XF 05 98, 0.06% 8/6/21 (Liquidity Facility Toronto-Dominion Bank) (a)(d)(e) | | 1,200,000 | 1,200,000 |
| Hudson Yards Infrastructure Corp. New York Rev. Participating VRDN: | | | |
| Series Floaters XF 05 49, 0.06% 8/6/21 (Liquidity Facility Toronto-Dominion Bank) (a)(d)(e) | | 2,800,000 | 2,800,000 |
| Series Floaters XF 05 51, 0.06% 8/6/21 (Liquidity Facility Toronto-Dominion Bank) (a)(d)(e) | | 6,550,000 | 6,550,000 |
| Series Floaters XF 06 77, 0.06% 8/6/21 (Liquidity Facility Toronto-Dominion Bank) (a)(d)(e) | | 2,500,000 | 2,500,000 |
| Series Floaters XF 24 57, 0.12% 8/6/21 (Liquidity Facility Morgan Stanley Bank, West Valley City Utah) (a)(d)(e) | | 5,666,500 | 5,666,500 |
| Series Floaters XM 07 00, 0.06% 8/6/21 (Liquidity Facility Toronto-Dominion Bank) (a)(d)(e) | | 4,000,000 | 4,000,000 |
| Series Floaters ZM 07 37, 0.09% 8/6/21 (Liquidity Facility JPMorgan Chase Bank) (a)(d)(e) | | 2,030,000 | 2,030,000 |
| Series XF 28 59, 0.12% 8/6/21 (Liquidity Facility Morgan Stanley Bank, West Valley City Utah) (a)(d)(e) | | 2,500,000 | 2,500,000 |
| Monroe County Indl. Dev. Corp. Participating VRDN: | | | |
| Series 20 XM 08 99, 0.05% 8/6/21 (Liquidity Facility Morgan Stanley Bank, West Valley City Utah) (a)(d)(e) | | 3,260,000 | 3,260,000 |
| Series XF 09 91, 0.04% 8/6/21 (Liquidity Facility Toronto-Dominion Bank) (a)(d)(e) | | 2,950,000 | 2,950,000 |
| New York City Gen. Oblig. Participating VRDN: | | | |
| Series 20 XM 09 00, 0.05% 8/6/21 (Liquidity Facility JPMorgan Chase Bank) (a)(d)(e) | | 2,500,000 | 2,500,000 |
| Series 2020 003, 0.22% 9/10/21 (Liquidity Facility Wells Fargo Bank NA) (a)(d)(e) | | 11,200,000 | 11,200,000 |
| Series Floaters XF 07 26, 0.05% 8/6/21 (Liquidity Facility Bank of America NA) (a)(d)(e) | | 5,600,000 | 5,600,000 |
| Series Floaters ZF 07 24, 0.05% 8/6/21 (Liquidity Facility Bank of America NA) (a)(d)(e) | | 1,000,000 | 1,000,000 |
| Series MS 3324, 0.04% 8/6/21 (Liquidity Facility Sumitomo Mitsui Banking Corp.) (a)(d)(e) | | 2,100,000 | 2,100,000 |
| Series Solar 2017 0057, 0.07% 8/6/21 (Liquidity Facility U.S. Bank NA, Cincinnati) (a)(d)(e) | | 3,225,000 | 3,225,000 |
| Series XL 01 65, 0.05% 8/6/21 (Liquidity Facility Bank of America NA) (a)(d)(e) | | 1,040,000 | 1,040,000 |
| Series XM 09 06, 0.05% 8/6/21 (Liquidity Facility JPMorgan Chase Bank) (a)(d)(e) | | 8,750,000 | 8,750,000 |
| Series XM 09 07, 0.05% 8/6/21 (Liquidity Facility JPMorgan Chase Bank) (a)(d)(e) | | 3,935,000 | 3,935,000 |
| Series XM 09 08, 0.05% 8/6/21 (Liquidity Facility JPMorgan Chase Bank) (a)(d)(e) | | 4,315,000 | 4,315,000 |
| New York City Hsg. Dev. Corp. Multifamily Hsg. Participating VRDN Series ZF 09 00, 0.05% 8/6/21 (Liquidity Facility JPMorgan Chase Bank) (a)(d)(e) | | 2,500,000 | 2,500,000 |
| New York City Indl. Dev. Agcy. Rev. Participating VRDN: | | | |
| Series 2021 XF 29 35, 0.05% 8/6/21 (Liquidity Facility Barclays Bank PLC) (a)(d)(e) | | 6,180,000 | 6,180,000 |
| Series XF 29 10, 0.06% 8/6/21 (Liquidity Facility Barclays Bank PLC) (a)(d)(e) | | 11,225,000 | 11,225,000 |
| New York City Muni. Wtr. Fin. Auth. Wtr. & Swr. Sys. Rev. Participating VRDN: | | | |
| Series 2015 ZF0207, 0.05% 8/6/21 (Liquidity Facility JPMorgan Chase Bank) (a)(d)(e) | | 1,500,000 | 1,500,000 |
| Series Floaters E 129, 0.05% 8/6/21 (Liquidity Facility Royal Bank of Canada) (a)(d)(e) | | 17,800,000 | 17,800,000 |
| Series Floaters XF 10 11, 0.05% 8/6/21 (Liquidity Facility Barclays Bank PLC) (a)(d)(e) | | 10,340,000 | 10,340,000 |
| Series Floaters XM 03 83, 0.05% 8/6/21 (Liquidity Facility JPMorgan Chase Bank) (a)(d)(e) | | 2,215,000 | 2,215,000 |
| Series Floaters XM 04 36, 0.05% 8/6/21 (Liquidity Facility Barclays Bank PLC) (a)(d)(e) | | 2,000,000 | 2,000,000 |
| Series Floaters ZM 05 47, 0.05% 8/6/21 (Liquidity Facility Wells Fargo Bank NA) (a)(d)(e) | | 8,460,000 | 8,460,000 |
| Series MS 3373, 0.05% 8/6/21 (Liquidity Facility Morgan Stanley Bank, West Valley City Utah) (a)(d)(e) | | 260,000 | 260,000 |
| Series XG 0112, 0.05% 8/6/21 (Liquidity Facility Barclays Bank PLC) (a)(d)(e) | | 2,400,000 | 2,400,000 |
| Series XL 00 64, 0.04% 8/6/21 (Liquidity Facility Citibank NA) (a)(d)(e) | | 2,000,000 | 2,000,000 |
| Series XM 08 74, 0.05% 8/6/21 (Liquidity Facility JPMorgan Chase Bank) (a)(d)(e) | | 1,500,000 | 1,500,000 |
| New York City Transitional Fin. Auth. Participating VRDN Series XM 03 51, 0.05% 8/6/21 (Liquidity Facility JPMorgan Chase Bank) (a)(d)(e) | | 2,400,000 | 2,400,000 |
| New York City Transitional Fin. Auth. Rev. Participating VRDN: | | | |
| Series 002, 0.17% 9/10/21 (Liquidity Facility Wells Fargo Bank NA) (a)(d)(e) | | 22,500,000 | 22,500,000 |
| Series 15 XM0086, 0.05% 8/6/21 (Liquidity Facility JPMorgan Chase Bank) (a)(d)(e) | | 4,500,000 | 4,500,000 |
| Series 2014 XM0029, 0.05% 8/6/21 (Liquidity Facility Royal Bank of Canada) (a)(d)(e) | | 2,800,000 | 2,800,000 |
| Series Floaters XF 27 31, 0.05% 8/6/21 (Liquidity Facility JPMorgan Chase Bank) (a)(d)(e) | | 4,600,000 | 4,600,000 |
| Series XF 06 37, 0.05% 8/6/21 (Liquidity Facility Toronto-Dominion Bank) (a)(d)(e) | | 3,000,000 | 3,000,000 |
| Series XF 28 64, 0.05% 8/6/21 (Liquidity Facility Morgan Stanley Bank, West Valley City Utah) (a)(d)(e) | | 5,000,000 | 5,000,000 |
| Series XF 29 12, 0.05% 8/6/21 (Liquidity Facility Morgan Stanley Bank, West Valley City Utah) (a)(d)(e) | | 2,000,000 | 2,000,000 |
| New York Dorm. Auth. Rev. Participating VRDN: | | | |
| Series E-146, 0.05% 8/6/21 (Liquidity Facility Royal Bank of Canada) (a)(d)(e) | | 1,300,000 | 1,300,000 |
| Series XF 28 88, 0.06% 8/6/21 (Liquidity Facility Barclays Bank PLC) (a)(d)(e) | | 7,220,000 | 7,220,000 |
| New York Envir. Facilities Corp. Clean Wtr. & Drinking Wtr. Participating VRDN Series Floaters XF 25 86, 0.05% 8/6/21 (Liquidity Facility JPMorgan Chase Bank) (a)(d)(e) | | 2,000,000 | 2,000,000 |
| New York Gen. Oblig. Participating VRDN Series Floaters XG 01 05, 0.05% 8/6/21 (Liquidity Facility Bank of America NA) (a)(d)(e) | | 3,480,000 | 3,480,000 |
| New York Liberty Dev. Corp. Participating VRDN: | | | |
| Series 2016 ZF 03 68, 0.07% 8/6/21 (Liquidity Facility JPMorgan Chase Bank) (a)(d)(e) | | 19,300,000 | 19,300,000 |
| Series Floaters XF 10 27, 0.09% 8/6/21 (Liquidity Facility Deutsche Bank AG New York Branch) (a)(d)(e) | | 3,091,000 | 3,091,000 |
| New York Metropolitan Trans. Auth. Rev. Participating VRDN: | | | |
| Series RBC E 126, 0.07% 8/6/21 (Liquidity Facility Royal Bank of Canada) (a)(d)(e) | | 62,000,000 | 62,000,000 |
| Series XF 06 57, 0.07% 8/6/21 (Liquidity Facility Bank of America NA) (a)(d)(e) | | 1,935,000 | 1,935,000 |
| Series XF 08 65, 0.07% 8/6/21 (Liquidity Facility Bank of America NA) (a)(d)(e) | | 2,030,000 | 2,030,000 |
| Series XF 28 68, 0.06% 8/6/21 (Liquidity Facility Barclays Bank PLC) (a)(d)(e) | | 12,805,000 | 12,805,000 |
| Series XF 28 78, 0.06% 8/6/21 (Liquidity Facility Barclays Bank PLC) (a)(d)(e) | | 35,795,000 | 35,795,000 |
| Series XF 29 14, 0.06% 8/6/21 (Liquidity Facility Barclays Bank PLC) (a)(d)(e) | | 8,400,000 | 8,400,000 |
| Series XG 02 90, 0.06% 8/6/21 (Liquidity Facility Barclays Bank PLC) (a)(d)(e) | | 2,385,000 | 2,385,000 |
| Series XM 06 97, 0.07% 8/6/21 (Liquidity Facility Bank of America NA) (a)(d)(e) | | 3,500,000 | 3,500,000 |
| Series XM 08 43, 0.07% 8/6/21 (Liquidity Facility Bank of America NA) (a)(d)(e) | | 6,665,000 | 6,665,000 |
| Series XX 11 56, 0.06% 8/6/21 (Liquidity Facility Barclays Bank PLC) (a)(d)(e) | | 9,165,000 | 9,165,000 |
| New York Thruway Auth. Gen. Rev. Participating VRDN: | | | |
| Series XX 11 27, 0.06% 8/6/21 (Liquidity Facility Barclays Bank PLC) (a)(d)(e) | | 2,000,000 | 2,000,000 |
| Series ZF 09 29, 0.05% 8/6/21 (Liquidity Facility Bank of America NA) (a)(d)(e) | | 1,355,000 | 1,355,000 |
| New York Trans. Dev. Corp. Participating VRDN: | | | |
| Series Floaters XF 23 96, 0.07% 8/6/21 (Liquidity Facility Barclays Bank PLC) (a)(b)(d)(e) | | 7,975,000 | 7,975,000 |
| Series Floaters XM 00 89, 0.07% 8/6/21 (Liquidity Facility Barclays Bank PLC) (a)(b)(d)(e) | | 3,790,000 | 3,790,000 |
| Series Floaters XX 10 38, 0.07% 8/6/21 (Liquidity Facility Barclays Bank PLC) (a)(b)(d)(e) | | 5,835,000 | 5,835,000 |
| Oneida County Local Dev. Corp. Rev. Participating VRDN Series XG 02 82, 0.06% 8/6/21 (Liquidity Facility Bank of America NA) (a)(d)(e) | | 1,650,000 | 1,650,000 |
| Tender Option Bond Trust Receipts Participating VRDN Series 2018, 0.05% 8/6/21 (Liquidity Facility JPMorgan Chase Bank) (a)(d)(e) | | 2,625,000 | 2,625,000 |
| Triborough Bridge and Tunnel Auth. Participating VRDN Series 2021 XL 01 69, 0.04% 8/6/21 (Liquidity Facility Bank of America NA) (a)(d)(e) | | 1,105,000 | 1,105,000 |
| | | | 420,127,500 |
| New York And New Jersey - 4.9% | | | |
| Port Auth. of New York & New Jersey Participating VRDN: | | | |
| Series 16 ZF0326, 0.06% 8/6/21 (Liquidity Facility JPMorgan Chase Bank) (a)(b)(d)(e) | | 5,415,000 | 5,415,000 |
| Series Floaters XM 06 16, 0.07% 8/6/21 (Liquidity Facility Barclays Bank PLC) (a)(b)(d)(e) | | 6,600,000 | 6,600,000 |
| Series Floaters ZF 02 69, 0.11% 8/6/21 (Liquidity Facility Toronto-Dominion Bank) (a)(b)(d)(e) | | 2,200,000 | 2,200,000 |
| Series ROC 14086, 0.07% 8/6/21 (Liquidity Facility Citibank NA) (a)(b)(d)(e) | | 2,700,000 | 2,700,000 |
| Series XF 08 08, 0.06% 8/6/21 (Liquidity Facility JPMorgan Chase Bank) (a)(b)(d)(e) | | 1,600,000 | 1,600,000 |
| Series XF 09 38, 0.06% 8/6/21 (Liquidity Facility JPMorgan Chase Bank) (a)(b)(d)(e) | | 7,645,000 | 7,645,000 |
| Series XG 02 65 0.11% 8/6/21 (Liquidity Facility Bank of America NA) (a)(b)(d)(e) | | 19,770,000 | 19,770,000 |
| Series ZF 09 96, 0.06% 8/6/21 (Liquidity Facility JPMorgan Chase Bank) (a)(b)(d)(e) | | 3,190,000 | 3,190,000 |
| | | | 49,120,000 |
| Ohio - 0.0% | | | |
| Ohio Univ. Gen. Receipts Athens Bonds Series Floaters G 27, 0.22%, tender 12/1/21 (Liquidity Facility Royal Bank of Canada) (a)(c)(d)(e) | | 500,000 | 500,000 |
| Pennsylvania - 0.0% | | | |
| Pennsylvania Tpk. Commission Tpk. Rev. Bonds Series Floaters G 43, 0.22%, tender 12/1/21 (Liquidity Facility Royal Bank of Canada) (a)(c)(d)(e) | | 200,000 | 200,000 |
| South Carolina - 0.0% | | | |
| South Carolina Trans. Infrastructure Bank Rev. Bonds Series Floaters G 109, 0.22%, tender 10/1/21 (Liquidity Facility Royal Bank of Canada) (a)(c)(d)(e) | | 300,000 | 300,000 |
| Texas - 0.1% | | | |
| Houston Arpt. Sys. Rev. Participating VRDN Series XF 11 11, 0.12% 8/6/21 (Liquidity Facility Deutsche Bank AG New York Branch) (a)(b)(d)(e) | | 600,000 | 600,000 |
| Virginia - 0.3% | | | |
| Lynchburg Econ. Dev. Participating VRDN Series 2020 10, 0.14% 9/10/21 (Liquidity Facility Barclays Bank PLC) (a)(d)(e) | | 2,700,000 | 2,700,000 |
| Virginia Pub. Bldg. Auth. Pub. Facilities Rev. Bonds Series Floaters G 40, 0.22%, tender 2/1/22 (Liquidity Facility Royal Bank of Canada) (a)(c)(d)(e) | | 300,000 | 300,000 |
| | | | 3,000,000 |
| TOTAL TENDER OPTION BOND | | | |
| (Cost $493,472,500) | | | 493,472,500 |
|
| Other Municipal Security - 12.1% | | | |
| Michigan - 0.0% | | | |
| Kent Hosp. Fin. Auth. Hosp. Facilities Rev. Bonds (Spectrum Health Sys. Proj.) Series 2015 A, SIFMA Municipal Swap Index + 0.250% 0.27%, tender 2/25/22 (a)(f) | | 100,000 | 100,000 |
| New York - 9.5% | | | |
| Burnt Hills Ballston Lake NY BAN Series 2021, 2% 6/23/22 | | 5,100,000 | 5,183,176 |
| Casenovia Central School District BAN Series 2021, 1.5% 7/15/22 | | 6,383,948 | 6,465,326 |
| Dobbs Ferry Union Free School District BAN Series 2021, 1.5% 6/3/22 | | 3,800,000 | 3,842,295 |
| Ithaca City City School District BAN Series 2021, 1.5% 7/15/22 | | 6,800,000 | 6,887,330 |
| Middle Country Century School District TAN Series 2021, 1% 6/24/22 (g) | | 5,000,000 | 5,037,150 |
| New York City Gen. Oblig. Bonds: | | | |
| Series 2012 A, 5% | | 500,000 | 500,000 |
| Series 2012 D, 5% 10/1/21 (Pre-Refunded to 10/1/21 @ 100) | | 2,510,000 | 2,529,777 |
| Series 2016 E, 5% 8/1/21 | | 2,250,000 | 2,250,000 |
| Series A, 5% | | 425,000 | 425,000 |
| New York City Trust For Cultural Bonds: | | | |
| Series 2014 B1, 0.12%, tender 11/5/21 (a) | | 1,900,000 | 1,900,000 |
| Series 2014 B2, SIFMA Municipal Swap Index + 0.050% 0.01%, tender 2/14/22 (a)(f) | | 3,200,000 | 3,200,000 |
| New York Pwr. Auth.: | | | |
| Series 2, 0.16% 1/6/22, CP | | 10,400,000 | 10,400,000 |
| Series 2021 2, 0.12% 11/18/21, CP | | 6,000,000 | 6,000,000 |
| Series 2021, 0.14% 8/17/21, CP | | 5,100,000 | 5,100,000 |
| New York State Dorm. Auth. Bonds Series 2020 A, 5% 9/15/21 | | 365,000 | 367,119 |
| Putnam Valley Central School District BAN Series 2021, 2% 7/15/22 | | 5,310,000 | 5,401,938 |
| Rockland County Gen. Oblig. TAN Series 2021, 2% 4/1/22 | | 2,000,000 | 2,024,794 |
| Three Village Central School District TAN Series 2021, 1% 6/24/22 | | 8,000,000 | 8,060,731 |
| Triborough Bridge & Tunnel Auth. Revs. Bonds Series 2011 A, 5% 1/1/22 (Pre-Refunded to 1/1/22 @ 100) | | 295,000 | 300,923 |
| Vestal Central School District BAN Series 2021, 1.25% 7/28/22 | | 10,175,000 | 10,285,497 |
| Webster Central School District BAN Series 2021, 1.75% 6/29/22 | | 6,000,000 | 6,086,611 |
| Westchester County TAN Series B, 2% 10/18/21 | | 2,800,000 | 2,811,138 |
| | | | 95,058,805 |
| New York And New Jersey - 2.6% | | | |
| Port Auth. of New York & New Jersey: | | | |
| Bonds: | | | |
| Series 173, 4% 12/1/21 | | 155,000 | 156,924 |
| Series 185, 5% 9/1/21 (b) | | 1,630,000 | 1,636,342 |
| Series 197, 5% 11/15/21 (b) | | 790,000 | 801,075 |
| Series 2021 A, 0.12% 11/3/21, CP (b) | | 10,000,000 | 10,000,000 |
| Series 2021 B: | | | |
| 0.11% 8/11/21, CP | | 4,675,000 | 4,675,000 |
| 0.11% 10/13/21, CP | | 8,100,000 | 8,100,000 |
| | | | 25,369,341 |
| TOTAL OTHER MUNICIPAL SECURITY | | | |
| (Cost $120,528,146) | | | 120,528,146 |
| | | Shares | Value |
|
| Investment Company - 6.1% | | | |
| Fidelity Municipal Cash Central Fund 0.04% (h)(i) | | | |
| (Cost $60,664,442) | | 60,657,923 | 60,664,442 |
| TOTAL INVESTMENT IN SECURITIES - 100.8% | | | |
| (Cost $1,004,426,088) | | | 1,004,426,088 |
| NET OTHER ASSETS (LIABILITIES) - (0.8)% | | | (7,839,103) |
| NET ASSETS - 100% | | | $996,586,985 |
Security Type Abbreviations
BAN – BOND ANTICIPATION NOTE
CP – COMMERCIAL PAPER
TAN – TAX ANTICIPATION NOTE
VRDN – VARIABLE RATE DEMAND NOTE (A debt instrument that is payable upon demand, either daily, weekly or monthly)
The date shown for securities represents the date when principal payments must be paid, taking into account any call options exercised by the issuer and any permissible maturity shortening features other than interest rate resets.
Legend
(a) Coupon rates for floating and adjustable rate securities reflect the rates in effect at period end.
(b) Private activity obligations whose interest is subject to the federal alternative minimum tax for individuals.
(c) Restricted securities (including private placements) - Investment in securities not registered under the Securities Act of 1933 (excluding 144A issues). At the end of the period, the value of restricted securities (excluding 144A issues) amounted to $9,300,000 or 0.9% of net assets.
(d) Provides evidence of ownership in one or more underlying municipal bonds.
(e) Coupon rates are determined by re-marketing agents based on current market conditions.
(f) Coupon is indexed to a floating interest rate which may be multiplied by a specified factor and/or subject to caps or floors.
(g) Security or a portion of the security purchased on a delayed delivery or when-issued basis.
(h) Information in this report regarding holdings by state and security types does not reflect the holdings of the Fidelity Municipal Cash Central Fund.
(i) Affiliated fund that is available only to investment companies and other accounts managed by Fidelity Investments. The rate quoted is the annualized seven-day yield of the fund at period end. A complete unaudited listing of the fund's holdings as of its most recent quarter end is available upon request. In addition, each Fidelity Central Fund's financial statements are available on the SEC's website or upon request.
Additional information on each restricted holding is as follows:
| Security | Acquisition Date | Cost |
| Broward County Port Facilities Rev. Bonds Series G 115, 0.27%, tender 3/1/22 (Liquidity Facility Royal Bank of Canada) | 3/1/21 | $400,000 |
| Connecticut Spl. Tax Oblig. Trans. Infrastructure Rev. Bonds Series Floaters G 110, 0.2%, tender 10/1/21 (Liquidity Facility Royal Bank of Canada) | 4/1/21 | $1,100,000 |
| Denver City & County Arpt. Rev. Bonds Series G-114, 0.27%, tender 9/1/21 (Liquidity Facility Royal Bank of Canada) | 6/1/21 | $300,000 |
| Greater Orlando Aviation Auth. Arpt. Facilities Rev. Bonds Series Floaters G 25, 0.27%, tender 10/1/21 (Liquidity Facility Royal Bank of Canada) | 4/1/21 | $500,000 |
| Kentucky State Property & Buildings Commission Rev. Bonds Series G 116, 0.22%, tender 11/1/21 (Liquidity Facility Royal Bank of Canada) | 5/3/21 | $500,000 |
| Ohio Univ. Gen. Receipts Athens Bonds Series Floaters G 27, 0.22%, tender 12/1/21 (Liquidity Facility Royal Bank of Canada) | 6/1/21 | $500,000 |
| Pennsylvania Tpk. Commission Tpk. Rev. Bonds Series Floaters G 43, 0.22%, tender 12/1/21 (Liquidity Facility Royal Bank of Canada) | 6/1/21 | $200,000 |
| Port Auth. of New York & New Jersey Series 1995 3, 0.1% 8/30/21, VRDN | 10/17/19 - 3/6/20 | $4,600,000 |
| South Carolina Trans. Infrastructure Bank Rev. Bonds Series Floaters G 109, 0.22%, tender 10/1/21 (Liquidity Facility Royal Bank of Canada) | 4/1/21 | $300,000 |
| Tampa-Hillsborough Co. Ex Auth. Bonds Series G-113, 0.22%, tender 1/3/22 (Liquidity Facility Royal Bank of Canada) | 7/1/21 | $600,000 |
| Virginia Pub. Bldg. Auth. Pub. Facilities Rev. Bonds Series Floaters G 40, 0.22%, tender 2/1/22 (Liquidity Facility Royal Bank of Canada) | 2/1/21 | $300,000 |
Affiliated Central Funds
Information regarding fiscal year to date income earned by the Fund from investments in Fidelity Central Funds is as follows:
| Fund | Income earned |
| Fidelity Municipal Cash Central Fund | $22,602 |
| Total | $22,602 |
Amounts in the income column in the above table include any capital gain distributions from underlying funds, which are presented in the corresponding line-item in the Statement of Operations, if applicable.
Fiscal year to date information regarding the Fund's investments in Fidelity Central Funds, including the ownership percentage, is presented below.
| Fund | Value, beginning of period | Purchases | Sales Proceeds | Realized Gain/Loss | Change in Unrealized appreciation (depreciation) | Value, end of period | % ownership, end of period |
| Fidelity Municipal Cash Central Fund 0.04% | $77,834,857 | $266,640,000 | $283,809,000 | $(1,415) | $-- | $60,664,442 | 3.6% |
| Total | $77,834,857 | $266,640,000 | $283,809,000 | $(1,415) | $-- | $60,664,442 | |
Investment Valuation
All investments are categorized as Level 2 under the Fair Value Hierarchy. The inputs or methodology used for valuing securities may not be an indication of the risk associated with investing in those securities. For more information on valuation inputs please refer to the Investment Valuation section in the accompanying Notes to Financial Statements.
See accompanying notes which are an integral part of the financial statements.
Financial Statements
Statement of Assets and Liabilities
| | | July 31, 2021 (Unaudited) |
| Assets | | |
Investment in securities, at value — See accompanying schedule:
Unaffiliated issuers (cost $943,761,646) | $943,761,646 | |
| Fidelity Central Funds (cost $60,664,442) | 60,664,442 | |
| Total Investment in Securities (cost $1,004,426,088) | | $1,004,426,088 |
| Receivable for investments sold | | 1,299,984 |
| Receivable for fund shares sold | | 157,259 |
| Interest receivable | | 368,501 |
| Distributions receivable from Fidelity Central Funds | | 2,767 |
| Prepaid expenses | | 708 |
| Other receivables | | 119 |
| Total assets | | 1,006,255,426 |
| Liabilities | | |
| Payable to custodian bank | $805,993 | |
| Payable for investments purchased | | |
| Regular delivery | 3,500,000 | |
| Delayed delivery | 5,037,150 | |
| Payable for fund shares redeemed | 245,944 | |
| Distributions payable | 312 | |
| Accrued management fee | 43,039 | |
| Other affiliated payables | 9,770 | |
| Other payables and accrued expenses | 26,233 | |
| Total liabilities | | 9,668,441 |
| Net Assets | | $996,586,985 |
| Net Assets consist of: | | |
| Paid in capital | | $996,499,864 |
| Total accumulated earnings (loss) | | 87,121 |
| Net Assets | | $996,586,985 |
| Net Asset Value, offering price and redemption price per share ($996,586,985 ÷ 994,804,368 shares) | | $1.00 |
See accompanying notes which are an integral part of the financial statements.
Statement of Operations
| | | Six months ended July 31, 2021 (Unaudited) |
| Investment Income | | |
| Interest | | $552,487 |
| Income from Fidelity Central Funds | | 22,602 |
| Total income | | 575,089 |
| Expenses | | |
| Management fee | $1,797,662 | |
| Transfer agent fees | 632,403 | |
| Accounting fees and expenses | 59,853 | |
| Custodian fees and expenses | 5,391 | |
| Independent trustees' fees and expenses | 1,363 | |
| Registration fees | 13,964 | |
| Audit | 19,253 | |
| Legal | 4,106 | |
| Miscellaneous | 2,091 | |
| Total expenses before reductions | 2,536,086 | |
| Expense reductions | (2,012,487) | |
| Total expenses after reductions | | 523,599 |
| Net investment income (loss) | | 51,490 |
| Realized and Unrealized Gain (Loss) | | |
| Net realized gain (loss) on: | | |
| Investment securities: | | |
| Unaffiliated issuers | 85,206 | |
| Fidelity Central Funds | (1,415) | |
| Total net realized gain (loss) | | 83,791 |
| Net increase in net assets resulting from operations | | $135,281 |
See accompanying notes which are an integral part of the financial statements.
Statement of Changes in Net Assets
| | Six months ended July 31, 2021 (Unaudited) | Year ended January 31, 2021 |
| Increase (Decrease) in Net Assets | | |
| Operations | | |
| Net investment income (loss) | $51,490 | $3,442,934 |
| Net realized gain (loss) | 83,791 | 126,799 |
| Net increase in net assets resulting from operations | 135,281 | 3,569,733 |
| Distributions to shareholders | (51,146) | (3,942,788) |
| Share transactions | | |
| Proceeds from sales of shares | 41,720,641 | 172,773,501 |
| Reinvestment of distributions | 49,302 | 3,786,729 |
| Cost of shares redeemed | (111,921,356) | (476,269,162) |
| Net increase (decrease) in net assets and shares resulting from share transactions | (70,151,413) | (299,708,932) |
| Total increase (decrease) in net assets | (70,067,278) | (300,081,987) |
| Net Assets | | |
| Beginning of period | 1,066,654,263 | 1,366,736,250 |
| End of period | $996,586,985 | $1,066,654,263 |
| Other Information | | |
| Shares | | |
| Sold | 41,720,641 | 172,773,501 |
| Issued in reinvestment of distributions | 49,302 | 3,786,729 |
| Redeemed | (111,921,356) | (476,269,162) |
| Net increase (decrease) | (70,151,413) | (299,708,932) |
See accompanying notes which are an integral part of the financial statements.
Financial Highlights
Fidelity New York Municipal Money Market Fund
| | Six months ended (Unaudited) July 31, | Years endedJanuary 31, | | | | |
| | 2021 | 2021 | 2020 | 2019 | 2018 | 2017 |
| Selected Per–Share Data | | | | | | |
| Net asset value, beginning of period | $1.00 | $1.00 | $1.00 | $1.00 | $1.00 | $1.00 |
| Income from Investment Operations | | | | | | |
| Net investment income (loss) | –A | .003 | .010 | .010 | .005 | .001 |
| Net realized and unrealized gain (loss) | –A | –A | –A | .001 | –A | –A |
| Total from investment operations | –A | .003 | .010 | .011 | .005 | .001 |
| Distributions from net investment income | –A | (.003) | (.010) | (.010) | (.005) | (.001) |
| Distributions from net realized gain | – | –A | –A | (.001) | (.001) | –A |
| Total distributions | –A | (.003) | (.010) | (.011) | (.005)B | (.001) |
| Net asset value, end of period | $1.00 | $1.00 | $1.00 | $1.00 | $1.00 | $1.00 |
| Total ReturnC,D | - %E | .31% | 1.02% | 1.10% | .52% | .12% |
| Ratios to Average Net AssetsF,G | | | | | | |
| Expenses before reductions | .49%H | .49% | .49% | .49% | .49% | .49% |
| Expenses net of fee waivers, if any | .10%H | .33% | .49% | .49% | .49% | .39% |
| Expenses net of all reductions | .10%H | .33% | .49% | .49% | .49% | .39% |
| Net investment income (loss) | .01%H | .29% | 1.02% | 1.00% | .46% | .10% |
| Supplemental Data | | | | | | |
| Net assets, end of period (000 omitted) | $996,587 | $1,066,654 | $1,366,736 | $1,603,906 | $2,091,201 | $2,900,940 |
A Amount represents less than $.0005 per share.
B Total distributions per share do not sum due to rounding.
C Total returns for periods of less than one year are not annualized.
D Total returns would have been lower if certain expenses had not been reduced during the applicable periods shown.
E Amount represents less than .005%.
F Fees and expenses of any underlying mutual funds or exchange-traded funds (ETFs) are not included in the Fund's expense ratio. The Fund indirectly bears its proportionate share of these expenses. For additional expense information related to investments in Fidelity Central Funds, please refer to the "Investments in Fidelity Central Funds" note found in the Notes to Financial Statements section of the most recent Annual or Semi-Annual report.
G Expense ratios reflect operating expenses of the class. Expenses before reductions do not reflect amounts reimbursed, waived, or reduced through arrangements with the investment advisor, brokerage services, or other offset arrangements, if applicable, and do not represent the amount paid by the class during periods when reimbursements, waivers or reductions occur.
H Annualized
See accompanying notes which are an integral part of the financial statements.
Notes to Financial Statements (Unaudited)
For the period ended July 31, 2021
1. Organization.
Fidelity New York Municipal Money Market Fund (the Fund) is a fund of Fidelity New York Municipal Trust II (the Trust) and is authorized to issue an unlimited number of shares. Share transactions on the Statement of Changes in Net Assets may contain exchanges between affiliated funds. The Trust is registered under the Investment Company Act of 1940, as amended (the 1940 Act), as an open-end management investment company organized as a Delaware statutory trust. Shares of the Fund are only available for purchase by retail shareholders The Fund may be affected by economic and political developments in the state of New York.
2. Investments in Fidelity Central Funds.
Funds may invest in Fidelity Central Funds, which are open-end investment companies generally available only to other investment companies and accounts managed by the investment adviser and its affiliates. The Schedule of Investments lists any Fidelity Central Funds held as an investment as of period end, but does not include the underlying holdings of each Fidelity Central Fund. An investing fund indirectly bears its proportionate share of the expenses of the underlying Fidelity Central Funds.
Based on its investment objective, each Fidelity Central Fund may invest or participate in various investment vehicles or strategies that are similar to those of the investing fund. These strategies are consistent with the investment objectives of the investing fund and may involve certain economic risks which may cause a decline in value of each of the Fidelity Central Funds and thus a decline in the value of the investing fund.
| Fidelity Central Fund | Investment Manager | Investment Objective | Investment Practices | Expense Ratio(a) |
| Fidelity Money Market Central Funds | Fidelity Management & Research Company LLC (FMR) | Each fund seeks to obtain a high level of current income consistent with the preservation of capital and liquidity. | Short-term Investments | Less than .005% to .01% |
(a) Expenses expressed as a percentage of average net assets and are as of each underlying Central Fund's most recent annual or semi-annual shareholder report.
A complete unaudited list of holdings for each Fidelity Central Fund is available upon request or at the Securities and Exchange Commission website at www.sec.gov. In addition, the financial statements of the Fidelity Central Funds which contain the significant accounting policies (including investment valuation policies) of those funds, and are not covered by the Report of Independent Registered Public Accounting Firm, are available on the Securities and Exchange Commission website or upon request.
3. Significant Accounting Policies.
The Fund is an investment company and applies the accounting and reporting guidance of the Financial Accounting Standards Board (FASB) Accounting Standards Codification Topic 946 Financial Services - Investment Companies. The financial statements have been prepared in conformity with accounting principles generally accepted in the United States of America (GAAP), which require management to make certain estimates and assumptions at the date of the financial statements. Actual results could differ from those estimates. Subsequent events, if any, through the date that the financial statements were issued have been evaluated in the preparation of the financial statements. The Fund's Schedule of Investments lists any underlying mutual funds or exchange-traded funds (ETFs) but does not include the underlying holdings of these funds. The following summarizes the significant accounting policies of the Fund:
Investment Valuation. The Fund categorizes the inputs to valuation techniques used to value its investments into a disclosure hierarchy consisting of three levels as shown below:
- Level 1 – quoted prices in active markets for identical investments
- Level 2 – other significant observable inputs (including quoted prices for similar investments, interest rates, prepayment speeds, etc.)
- Level 3 – unobservable inputs (including the Fund's own assumptions based on the best information available)
As permitted by compliance with certain conditions under Rule 2a-7 of the 1940 Act, securities are valued at amortized cost, which approximates fair value. The amortized cost of an instrument is determined by valuing it at its original cost and thereafter amortizing any discount or premium from its face value at a constant rate until maturity. Securities held by a money market fund are generally high quality and liquid; however, they are reflected as Level 2 because the inputs used to determine fair value are not quoted prices in an active market.
Investment Transactions and Income. The net asset value per share for processing shareholder transactions is calculated as of the close of business of the New York Stock Exchange (NYSE), normally 4:00 p.m. Eastern time. Security transactions, including the Fund's investment activity in the Fidelity Central Funds, are accounted for as of trade date. Gains and losses on securities sold are determined on the basis of identified cost. Income and capital gain distributions from Fidelity Central Funds, if any, are recorded on the ex-dividend date. Interest income is accrued as earned and includes coupon interest and amortization of premium and accretion of discount on debt securities as applicable.
Expenses. Expenses directly attributable to a fund are charged to that fund. Expenses attributable to more than one fund are allocated among the respective funds on the basis of relative net assets or other appropriate methods. Expenses included in the accompanying financial statements reflect the expenses of that fund and do not include any expenses associated with any underlying mutual funds or exchange-traded funds. Although not included in a fund's expenses, a fund indirectly bears its proportionate share of these expenses through the net asset value of each underlying mutual fund or exchange-traded fund. Expense estimates are accrued in the period to which they relate and adjustments are made when actual amounts are known.
Income Tax Information and Distributions to Shareholders. Each year, the Fund intends to qualify as a regulated investment company under Subchapter M of the Internal Revenue Code, including distributing substantially all of its taxable income and realized gains. As a result, no provision for U.S. Federal income taxes is required. The Fund files a U.S. federal tax return, in addition to state and local tax returns as required. The Fund's federal income tax returns are subject to examination by the Internal Revenue Service (IRS) for a period of three fiscal years after they are filed. State and local tax returns may be subject to examination for an additional fiscal year depending on the jurisdiction.
Distributions are declared and recorded daily and paid monthly from net investment income. Distributions from realized gains, if any, are declared and recorded on the ex-dividend date. Income and capital gain distributions are determined in accordance with income tax regulations, which may differ from GAAP.
Capital accounts within the financial statements are adjusted for permanent book-tax differences. These adjustments have no impact on net assets or the results of operations. Capital accounts are not adjusted for temporary book-tax differences which will reverse in a subsequent period.
Book-tax differences are primarily due to the short-term gain distributions from the Fidelity Central Funds.
The Fund purchases municipal securities whose interest, in the opinion of the issuer, is free from federal income tax. There is no assurance that the IRS will agree with this opinion. In the event the IRS determines that the issuer does not comply with relevant tax requirements, interest payments from a security could become federally taxable, possibly retroactively to the date the security was issued.
As of period end, the cost and unrealized appreciation (depreciation) in securities for federal income tax purposes were as follows:
| Gross unrealized appreciation | $– |
| Gross unrealized depreciation | – |
| Net unrealized appreciation (depreciation) | $– |
| Tax cost | $1,004,426,088 |
Delayed Delivery Transactions and When-Issued Securities. During the period, certain Funds transacted in securities on a delayed delivery or when-issued basis. Payment and delivery may take place after the customary settlement period for that security. The price of the underlying securities and the date when the securities will be delivered and paid for are fixed at the time the transaction is negotiated. Securities purchased on a delayed delivery or when-issued basis are identified as such in the Schedule of Investments. Compensation for interest forgone in the purchase of a delayed delivery or when-issued debt security may be received. With respect to purchase commitments, each applicable Fund identifies securities as segregated in its records with a value at least equal to the amount of the commitment. Payables and receivables associated with the purchases and sales of delayed delivery securities having the same coupon, settlement date and broker are offset. Delayed delivery or when-issued securities that have been purchased from and sold to different brokers are reflected as both payables and receivables in the Statement of Assets and Liabilities under the caption "Delayed delivery", as applicable. Losses may arise due to changes in the value of the underlying securities or if the counterparty does not perform under the contract's terms, or if the issuer does not issue the securities due to political, economic, or other factors.
Restricted Securities (including Private Placements). Funds may invest in securities that are subject to legal or contractual restrictions on resale. These securities generally may be resold in transactions exempt from registration or to the public if the securities are registered. Disposal of these securities may involve time-consuming negotiations and expense, and prompt sale at an acceptable price may be difficult. Information regarding restricted securities held at period end is included at the end of the Schedule of Investments, if applicable.
4. Fees and Other Transactions with Affiliates.
Management Fee. Fidelity Management & Research Company LLC (the investment adviser) and its affiliates provide the Fund with investment management related services for which the Fund pays a monthly management fee. The management fee is the sum of an individual fund fee rate that is based on an annual rate of .25% of the Fund's average net assets and an annualized group fee rate that averaged .10% during the period. The group fee rate is based upon the monthly average net assets of a group of registered investment companies with which the investment adviser has management contracts. The group fee rate decreases as assets under management increase and increases as assets under management decrease. For the reporting period, the total annualized management fee rate was .35% of the Fund's average net assets.
During the period, the investment adviser or its affiliates waived a portion of these fees.
Transfer Agent Fees. Fidelity Investments Institutional Operations Company LLC (FIIOC), an affiliate of the investment adviser, is the transfer, dividend disbursing and shareholder servicing agent for the Fund. FIIOC receives account fees and asset-based fees that vary according to account size and type of account. FIIOC pays for typesetting, printing and mailing of shareholder reports, except proxy statements. For the period, transfer agent fees were equivalent to an annualized rate of .12% of average net assets.
During the period, the investment adviser or its affiliates waived a portion of these fees.
Accounting Fees. Fidelity Service Company, Inc. (FSC), an affiliate of the investment adviser, maintains the Fund's accounting records. The accounting fee is based on the level of average net assets for each month. For the period, the fees were equivalent to the following annualized rates:
| | % of Average Net Assets |
| Fidelity New York Municipal Money Market Fund | .01 |
Interfund Trades. Funds may purchase from or sell securities to other Fidelity Funds under procedures adopted by the Board. The procedures have been designed to ensure these interfund trades are executed in accordance with Rule 17a-7 of the 1940 Act.
| | Purchases ($) | Sales ($) |
| Fidelity New York Municipal Money Market Fund | 68,900,000 | 139,055,000 |
5. Expense Reductions.
The investment adviser or its affiliates voluntarily agreed to waive certain fees in order to avoid a negative yield. Such arrangements may be discontinued by the investment adviser at any time. For the period, the amount of the waiver was $2,008,028.
In addition, through arrangements with the Fund's custodian, credits realized as a result of certain uninvested cash balances were used to reduce the Fund's expenses by $63.
In addition, during the period the investment adviser or an affiliate reimbursed and/or waived a portion of operating expenses in the amount of $4,396.
6. Other.
Fund's organizational documents provide former and current trustees and officers with a limited indemnification against liabilities arising in connection with the performance of their duties to the fund. In the normal course of business, the fund may also enter into contracts that provide general indemnifications. The fund's maximum exposure under these arrangements is unknown as this would be dependent on future claims that may be made against the fund. The risk of material loss from such claims is considered remote.
7. Coronavirus (COVID-19) Pandemic.
An outbreak of COVID-19 first detected in China during December 2019 has since spread globally and was declared a pandemic by the World Health Organization during March 2020. Developments that disrupt global economies and financial markets, such as the COVID-19 pandemic, may magnify factors that affect the Fund's performance.
Shareholder Expense Example
As a shareholder, you incur two types of costs: (1) transaction costs, which may include sales charges (loads) on purchase payments or redemption proceeds, as applicable and (2) ongoing costs, which generally include management fees, distribution and/or service (12b-1) fees and other Fund expenses. This Example is intended to help you understand your ongoing costs (in dollars) of investing in a fund and to compare these costs with the ongoing costs of investing in other mutual funds.
The Example is based on an investment of $1,000 invested at the beginning of the period and held for the entire period (February 1, 2021 to July 31, 2021).
Actual Expenses
The first line of the accompanying table provides information about actual account values and actual expenses. You may use the information in this line, together with the amount you invested, to estimate the expenses that you paid over the period. Simply divide your account value by $1,000.00 (for example, an $8,600 account value divided by $1,000.00 = 8.6), then multiply the result by the number in the first line for a class/Fund under the heading entitled "Expenses Paid During Period" to estimate the expenses you paid on your account during this period. If any fund is a shareholder of any underlying mutual funds or exchange-traded funds (ETFs) (the Underlying Funds), such fund indirectly bears its proportional share of the expenses of the Underlying Funds in addition to the direct expenses incurred presented in the table. These fees and expenses are not included in the annualized expense ratio used to calculate the expense estimate in the table below.
Hypothetical Example for Comparison Purposes
The second line of the accompanying table provides information about hypothetical account values and hypothetical expenses based on the actual expense ratio and an assumed rate of return of 5% per year before expenses, which is not the actual return. The hypothetical account values and expenses may not be used to estimate the actual ending account balance or expenses you paid for the period. You may use this information to compare the ongoing costs of investing in the Fund and other funds. To do so, compare this 5% hypothetical example with the 5% hypothetical examples that appear in the shareholder reports of the other funds. If any fund is a shareholder of any Underlying Funds, such fund indirectly bears its proportional share of the expenses of the Underlying Funds in addition to the direct expenses as presented in the table. These fees and expenses are not included in the annualized expense ratio used to calculate the expense estimate in the table below.
Please note that the expenses shown in the table are meant to highlight your ongoing costs only and do not reflect any transaction costs. Therefore, the second line of the table is useful in comparing ongoing costs only, and will not help you determine the relative total costs of owning different funds.
| | Annualized Expense Ratio-A | Beginning
Account Value
February 1, 2021 | Ending
Account Value
July 31, 2021 | Expenses Paid
During Period-B
February 1, 2021
to July 31, 2021 |
| Fidelity New York Municipal Money Market Fund | .10% | | | |
| Actual | | $1,000.00 | $1,000.00 | $.50-C |
| Hypothetical-D | | $1,000.00 | $1,024.30 | $.50-C |
A Annualized expense ratio reflects expenses net of applicable fee waivers.
B Expenses are equal to the annualized expense ratio, multiplied by the average account value over the period, multiplied by 181/ 365 (to reflect the one-half year period). The fees and expenses of any Underlying Funds are not included in each annualized expense ratio.
C If certain fees were not voluntarily waived by the investment adviser or its affiliates during the period, the annualized expense ratio would have been .49% and the expenses paid in the actual and hypothetical examples above would have been $2.43 and $2.46, respectively.
D 5% return per year before expenses
NFS-SANN-0921
1.853336.114