UNITED STATES
SECURITIES AND EXCHANGE COMMISSION
Washington, D.C. 20549
FORM N-CSR
CERTIFIED SHAREHOLDER REPORT OF REGISTERED MANAGEMENT
INVESTMENT COMPANIES
Investment Company Act file number 811-06400
The Advisors’ Inner Circle Fund
(Exact name of registrant as specified in charter)
SEI Investments
One Freedom Valley Drive
Oaks, PA 19456
(Address of principal executive offices) (Zip code)
SEI Investments
One Freedom Valley Drive
Oaks, PA 19456
(Name and address of agent for service)
Registrant’s telephone number, including area code: (877) 446-3863
Date of fiscal year end: October 31, 2022
Date of reporting period: October 31, 2022
| Item 1. | Reports to Stockholders. |
A copy of the report transmitted to stockholders pursuant to Rule 30e-1 under the Investment Company Act of 1940, as amended (the “Act”) (17 CFR § 270.30e-1), is attached hereto.
The Advisors’ Inner Circle Fund
| ||
| The Rice Hall James Funds | ||
Annual Report
| October 31, 2022
| |
RICE HALL JAMES SMALL CAP PORTFOLIO
RICE HALL JAMES MICRO CAP PORTFOLIO

Investment Adviser:
Rice Hall James & Associates, LLC
| The Advisors’ Inner Circle Fund | RHJ FUNDS October 31, 2022
|
| 1 | ||||
| 6 | ||||
| 9 | ||||
| 13 | ||||
| 14 | ||||
| 15 | ||||
| 16 | ||||
| 17 | ||||
| 18 | ||||
| 19 | ||||
| 29 | ||||
| 32 | ||||
| 34 | ||||
| 42 | ||||
| 46 | ||||
| 47 |
The Funds file their complete schedules of investments with the Securities and Exchange Commission (“SEC”) for the first and third quarters of each fiscal year as an exhibit to their reports on Form N-PORT. The Funds’ Forms N-Q and N-PORT are available on the SEC’s website at http://www.sec.gov, and may be reviewed and copied at the SEC’s Public Reference Room in Washington, DC. Information on the operation of the Public Reference Room may be obtained by calling 1-800-SEC-0330.
A description of the policies and procedures that the Funds use to determine how to vote proxies relating to fund securities, as well as information relating to how a Fund voted proxies relating to fund securities during the most recent 12-month period ended June 30, is available (i) without charge, upon request, by calling 1-866-474-5669; and (ii) on the SEC’s website at https://www.sec.gov.
| The Advisors’ Inner Circle Fund | RHJ FUNDS October 31, 2022 (Unaudited)
|
|
RHJ Funds Annual Report
As of October 31, 2022
Fiscal 2022 was dispiriting for investors.
The seeds of the unwind took hold early in the new year with the Federal Reserve’s revelation that the “transitory inflation” was no longer “transitory”. The corporate earnings outlook soured shortly thereafter, hindered by the inability to source inputs as well as extreme high prices to ship the finished goods. In February, the world was shocked and horrified by Russia’s incursion into Ukraine, which marked the first major invasion in Europe since World War II. Unfortunately, the difficulties worsened from there, and the headwinds became intertwined.
Not surprisingly, global stock markets cratered under the weight of so many different cross currents and pressures. In the U.S., the S&P 500 and Russell 2000 indices declined -14.61% and -18.54% respectively, while the Nasdaq Composite sank -29.10%. Value trounced growth on both ends of the market cap spectrum. Returns would have been significantly worse if not for a sharp October rally into fiscal year end.
The primary driver of the stock market sell-off was the sharp pivot in monetary policy from (abnormally) accommodative to desperate and aggressive. Once the Federal Reserve conceded that the inflationary pressures in the economy had become entrenched, the situation deteriorated quickly. In February, consumer prices increased at the fastest annual pace since 1982. The tightening cycle commenced shortly thereafter. The central bank raised interest rates by 25 basis points in March, 50 basis points in May, and by 75 basis points at each of the four subsequent Federal Open Market Committee meetings. The cumulative increase was higher, faster than in any of the four previous tightening episodes since 1990.
The other major concern was that as policy became more restrictive, there were more signs of flagging growth. While the most interest rate sensitive indicators – like housing – had long rolled over, the deterioration extended into the manufacturing and retail economic reports. In July, the U.S. 2- and 10-year bond yields inverted, which is widely considered a harbinger of recession. There was also a spate of disappointing business updates from high-profile corporates in September and October, including a huge increase in inventory at Nike, the first earnings preannouncement from FedEx in nine years, as well as tempered outlooks (and layoffs) at Google, Facebook, and Amazon among others.
The combination of the intense policy and waning growth devastated sentiment. Although the annual returns were lifted by a rally in October, the swoons were sharp
1
| The Advisors’ Inner Circle Fund | RHJ FUNDS October 31, 2022 (Unaudited)
|
and deep as investors consistently underestimated the central bank’s resolve. At different points, the S&P 500 and Russell 2000 indices were down -25.42% and -32.46% from their respective peaks. Furthermore, the more stocks fell, the more investors fretted that there was another shoe to drop – the consequence of too much tightening too fast.
At this point, the obvious question for investors is whether there is cause to believe that the recent gains can mark a turning point for the market. Unfortunately, it is hard to have confidence after several prior short-lived bounces, and considering that the October strength followed an abysmal September. There are, however, many reasons to expect that next year can be a more constructive period for stocks.
First, after interest rates increased by 4.0% in nine months, it is unlikely that there will be as much (financial) confusion going forward, which is key to more stable markets. It is also clear that policy is working. In the September ISM Manufacturing Survey, new orders contracted, prices paid decreased, delivery times accelerated, and hiring slowed. These trends are both indicative of lessening supply chain constraints, and consistent with the Federal Reserve’s stated objectives. Lastly, there have been reports that Beijing intends to tone down the country’s zero-COVID-19 policy, which has been another major cause of uncertainty for business.
As such, the hope is that last year’s headwinds will become more muted, if not tailwinds for fiscal 2023. After walking a tightrope between inflation and recession, we are excited about the prospect for more stable business and financial conditions. We believe that our profitability-focused, conservative growth process will help us to weather the lingering uncertainty while we strive to capitalize on attractive small cap valuations to position for better days ahead.
Investment Management Team
The RHJ Funds
November 17, 2022
This represents management’s assessment of the Funds and the market environment at a specific point in time and should not be relied upon by the reader as research or investment advice.
Past performance is not a guarantee of future results. Mutual fund investing involves risk including the possible loss of principal. There are specific risks inherent in small cap investing, such as greater share volatility as compared to other funds that invest in stocks of companies with larger and potentially more stable market capitalizations.
2
| The Advisors’ Inner Circle Fund | RHJ FUNDS October 31, 2022 (Unaudited)
|
Definition of Comparative Indices
Nasdaq Composite Index is a stock market index that includes almost all stocks listed on the Nasdaq stock exchange.
Russell 2000 Index is an unmanaged index comprised of 2,000 stocks of U.S. companies with small market capitalization.
Russell 2000 Growth Index measures the performance of those Russell 2000 companies with higher price-to-book ratios and higher forecasted growth values.
Russell Microcap Index is an unmanaged index that consists of the smallest 2,000 securities in the small-cap Russell 2000 Index plus the next 2,000 securities.
Russell Microcap Growth Index measures the performance of those Russell Microcap companies with higher price-to-book ratios and higher forecasted growth values.
S&P 500 Index is an unmanaged capitalization-weighted index of 500 stocks designed to measure performance of the broad domestic economy through changes in the aggregate market value of 500 stocks representing all major industries.
3
| The Advisors’ Inner Circle Fund | RHJ SMALL CAP PORTFOLIO October 31, 2022 (Unaudited)
|
Growth of a $10,000 Investment
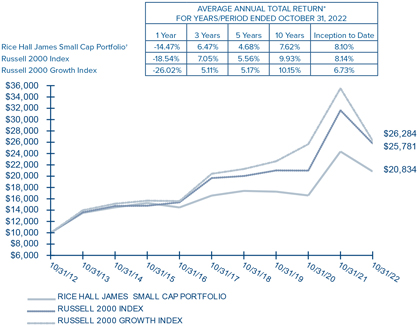
| † | The Rice Hall James Small Cap Portfolio commenced operations on November 1, 1996. |
| * | If the Adviser and/or Fund’s service providers had not limited certain expenses, the Fund’s total return would have been lower. |
The performance data quoted herein represents past performance and the return and value of an investment in the Fund will fluctuate so that, when redeemed, may be worth less than its original cost. The performance data quoted represents past performance. Past performance does not guarantee future results. The investment return and principal value of an investment will fluctuate so that an investor’s shares, when redeemed, may be worth more or less than their original cost, and current performance may be higher or lower than the performance quoted. The Fund’s performance assumes the reinvestment of all dividends and all capital gains. Index returns assume reinvestment of dividends but, unlike a fund’s returns, do not reflect the deduction of any fees or expenses. If such fees and expenses were included in the index returns the performance would have been lower. Please note that one cannot invest directly in an unmanaged index.
There are no assurances that the Fund will meet its stated objectives. The Fund’s holdings and allocations may change at any given time; they do not constitute, and should not be considered, recommendations to buy individual securities.
Returns shown do not reflect the deduction of taxes that a shareholder would pay on Fund distributions or the redemption of Fund shares.
See definition of comparative indices on page 3.
4
| The Advisors’ Inner Circle Fund | RHJ MICRO CAP PORTFOLIO October 31, 2022 (Unaudited)
|
Growth of a $10,000 Investment
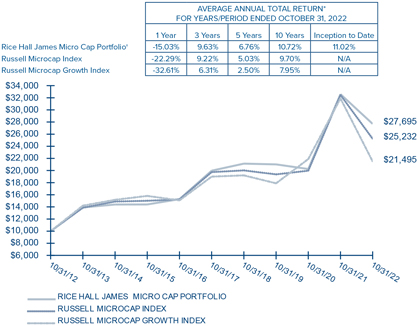
| † | The Rice Hall James Micro Cap Portfolio commenced operations on July 1, 1994. |
| * | If the Adviser and/or Fund’s service providers had not limited certain expenses, the Fund’s total return would have been lower. |
N/A Not applicable
The performance data quoted herein represents past performance and the return and value of an investment in the Fund will fluctuate so that, when redeemed, may be worth less than its original cost. The performance data quoted represents past performance. Past performance does not guarantee future results. The investment return and principal value of an investment will fluctuate so that an investor’s shares, when redeemed, may be worth more or less than their original cost, and current performance may be higher or lower than the performance quoted. The Fund’s performance assumes the reinvestment of all dividends and all capital gains. Index returns assume reinvestment of dividends but, unlike a fund’s returns, do not reflect the deduction of any fees or expenses. If such fees and expenses were included in the index returns the performance would have been lower. Please note that one cannot invest directly in an unmanaged index.
There are no assurances that the Fund will meet its stated objectives. The Fund’s holdings and allocations may change at any given time; they do not constitute, and should not be considered, recommendations to buy individual securities.
Returns shown do not reflect the deduction of taxes that a shareholder would pay on Fund distributions or the redemption of Fund shares.
See definition of comparative indices on page 3.
5
| The Advisors’ Inner Circle Fund | October 31, 2022
|
SECTOR WEIGHTINGS (Unaudited)†
|
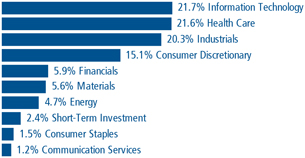
† Percentages based on total investments.
COMMON STOCK — 97.9%
|
Shares | Value | |||
COMMUNICATION SERVICES — 1.2% | ||||
PubMatic, Cl A* | 10,300 | $ 179,220 | ||
| ||||
CONSUMER DISCRETIONARY — 15.1% | ||||
Bowlero* | 24,100 | 350,896 | ||
Chuy’s Holdings* | 9,100 | 266,630 | ||
Five Below* | 1,700 | 248,795 | ||
Fox Factory Holding* | 1,700 | 149,345 | ||
Monro | 5,300 | 253,075 | ||
Papa John’s International | 3,200 | 232,416 | ||
PowerSchool Holdings, Cl A* | 20,100 | 402,000 | ||
Skyline Champion* | 3,000 | 174,630 | ||
Topgolf Callaway Brands* | 10,300 | 192,816 | ||
| ||||
| 2,270,603 | ||||
| ||||
CONSUMER STAPLES — 1.5% | ||||
Primo Water | 15,600 | 227,604 | ||
| ||||
ENERGY — 4.7% | ||||
Clean Energy Fuels* | 38,200 | 256,322 | ||
Denbury* | 4,900 | 447,909 | ||
| ||||
| 704,231 | ||||
| ||||
The accompanying notes are an integral part of the financial statements.
6
| The Advisors’ Inner Circle Fund | RHJ SMALL CAP PORTFOLIO October 31, 2022
|
COMMON STOCK — continued
| ||||
Shares | Value | |||
FINANCIALS — 5.9% | ||||
Live Oak Bancshares | 7,300 | $ 237,031 | ||
Nicolet Bankshares* | 4,000 | 305,160 | ||
Umpqua Holdings | 17,200 | 341,936 | ||
| ||||
| 884,127 | ||||
| ||||
HEALTH CARE — 21.6% | ||||
Azenta | 3,500 | 155,400 | ||
Bioventus, Cl A* | 23,000 | 187,220 | ||
Encompass Health | 3,900 | 212,316 | ||
Ensign Group | 3,200 | 287,296 | ||
Haemonetics* | 5,600 | 475,720 | ||
Harmony Biosciences Holdings* | 5,800 | 301,600 | ||
Heska* | 1,700 | 121,992 | ||
ModivCare* | 2,200 | 213,928 | ||
NextGen Healthcare* | 14,400 | 288,576 | ||
Omnicell* | 2,700 | 208,764 | ||
Pacira BioSciences* | 4,100 | 212,216 | ||
R1 RCM* | 15,100 | 266,666 | ||
STAAR Surgical* | 4,500 | 318,915 | ||
| ||||
| 3,250,609 | ||||
| ||||
INDUSTRIALS — 20.4% | ||||
Albany International, Cl A | 3,800 | 348,156 | ||
API Group* | 12,300 | 202,827 | ||
Construction Partners, Cl A* | 6,100 | 189,954 | ||
Evoqua Water Technologies* | 4,000 | 156,720 | ||
GATX | 3,300 | 345,543 | ||
Griffon | 12,000 | 385,680 | ||
Hub Group, Cl A* | 3,300 | 256,080 | ||
ICF International | 4,200 | 502,446 | ||
Matson | 2,200 | 161,876 | ||
Tetra Tech | 2,300 | 324,944 | ||
Vicor* | 3,798 | 181,431 | ||
| ||||
| 3,055,657 | ||||
| ||||
INFORMATION TECHNOLOGY — 21.8% | ||||
A10 Networks | 21,500 | 361,200 | ||
Axcelis Technologies* | 5,100 | 295,800 | ||
Fabrinet* | 3,000 | 343,200 | ||
The accompanying notes are an integral part of the financial statements.
7
| The Advisors’ Inner Circle Fund | RHJ SMALL CAP PORTFOLIO October 31, 2022
|
COMMON STOCK — continued
| ||||
Shares | Value | |||
INFORMATION TECHNOLOGY — continued | ||||
Model N* | 10,613 | $ 403,294 | ||
Power Integrations | 3,500 | 233,485 | ||
Progress Software | 9,100 | 464,373 | ||
Rambus* | 11,400 | 343,824 | ||
Viavi Solutions* | 20,300 | 306,530 | ||
WNS Holdings ADR* | 4,505 | 387,790 | ||
Zuora, Cl A* | 17,800 | 136,882 | ||
| ||||
| 3,276,378 | ||||
| ||||
MATERIALS — 5.7% | ||||
Materion | 3,800 | 325,698 | ||
Mativ Holdings | 9,900 | 235,026 | ||
Osisko Gold Royalties | 27,200 | 292,128 | ||
| ||||
| 852,852 | ||||
| ||||
TOTAL COMMON STOCK | 14,701,281 | |||
| ||||
SHORT-TERM INVESTMENT (A) — 2.4%
| ||||
First American Government Obligations | 360,770 | 360,770 | ||
| ||||
TOTAL INVESTMENTS— 100.3% | $ 15,062,051 | |||
| ||||
Percentages are based on Net Assets of $15,024,399. |
| * | Non-income producing security. |
| (A) | The rate reported is the 7-day effective yield as of October 31, 2022. |
| ADR | American Depositary Receipt |
| Cl | Class |
As of October 31, 2022, all of the Fund’s investments were considered Level 1, in accordance with the authoritative guidance on fair value measurements under U.S. generally accepted accounting principles.
For more information on valuation inputs, see Note 2 in the Notes to Financial Statements.
The accompanying notes are an integral part of the financial statements.
8
| The Advisors’ Inner Circle Fund | October 31, 2022
|
SECTOR WEIGHTINGS (Unaudited)†
| ||||||||
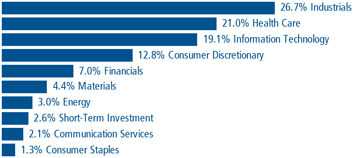
† Percentages based on total investments.
SCHEDULE OF INVESTMENTS
COMMON STOCK††— 97.7% | ||||||||
| Shares | Value | |||||||
COMMUNICATION SERVICES — 2.1% | ||||||||
QuinStreet* | 41,754 | $ | 476,413 | |||||
Thryv Holdings* | 22,000 | 450,120 | ||||||
|
| |||||||
| 926,533 | ||||||||
CONSUMER DISCRETIONARY — 12.8% | ||||||||
Chuy’s Holdings* | 23,800 | 697,340 | ||||||
Clarus | 32,405 | 392,425 | ||||||
Designer Brands, Cl A | 35,100 | 534,573 | ||||||
Duluth Holdings, Cl B* | 56,700 | 493,290 | ||||||
Funko, Cl A* | 34,300 | 708,295 | ||||||
Green Brick Partners* | 23,100 | 534,303 | ||||||
Johnson Outdoors, Cl A | 6,224 | 327,507 | ||||||
Lindblad Expeditions Holdings* | 47,700 | 400,203 | ||||||
XPEL* | 8,868 | 613,577 | ||||||
Xponential Fitness, Cl A* | 32,400 | 626,940 | ||||||
Zumiez* | 20,354 | 456,540 | ||||||
|
| |||||||
| 5,784,993 | ||||||||
CONSUMER STAPLES — 1.3% | ||||||||
elf Beauty* | 13,592 | 587,990 | ||||||
|
| |||||||
ENERGY — 3.0% | ||||||||
Clean Energy Fuels* | 80,500 | 540,155 | ||||||
The accompanying notes are an integral part of the financial statements.
9
| The Advisors’ Inner Circle Fund | RHJ MICRO CAP PORTFOLIO October 31, 2022
|
COMMON STOCK — continued
| ||||||||
| Shares | Value | |||||||
ENERGY — continued | ||||||||
DMC Global* | 16,000 | $ | 346,240 | |||||
National Energy Services Reunited* | 61,182 | 462,536 | ||||||
|
| |||||||
| 1,348,931 | ||||||||
|
| |||||||
FINANCIALS — 7.0% | ||||||||
Federal Agricultural Mortgage, Cl C | 5,800 | 668,160 | ||||||
Guaranty Bancshares | 14,393 | 532,973 | ||||||
Live Oak Bancshares | 15,000 | 487,050 | ||||||
QCR Holdings | 15,700 | 796,147 | ||||||
Trico Bancshares | 12,000 | 694,920 | ||||||
|
| |||||||
| 3,179,250 | ||||||||
|
| |||||||
HEALTH CARE — 21.1% | ||||||||
Accuray* | 125,711 | 256,450 | ||||||
Bioventus, Cl A* | 48,300 | 393,162 | ||||||
Cerus* | 101,497 | 371,479 | ||||||
Cutera* | 14,700 | 675,759 | ||||||
DocGo* | 82,700 | 818,730 | ||||||
Heska* | 5,000 | 358,800 | ||||||
iRadimed | 13,438 | 390,374 | ||||||
Lantheus Holdings* | 10,715 | 792,803 | ||||||
LeMaitre Vascular | 15,204 | 659,854 | ||||||
Mesa Laboratories | 2,704 | 357,496 | ||||||
NextGen Healthcare* | 31,800 | 637,272 | ||||||
Pennant Group* | 37,800 | 465,318 | ||||||
Semler Scientific* | 5,500 | 231,055 | ||||||
Simulations Plus | 12,400 | 514,600 | ||||||
Surmodics* | 15,500 | 529,170 | ||||||
U.S. Physical Therapy | 4,528 | 402,086 | ||||||
UFP Technologies* | 11,239 | 1,054,780 | ||||||
Utah Medical Products | 6,860 | 614,313 | ||||||
|
| |||||||
| 9,523,501 | ||||||||
|
| |||||||
INDUSTRIALS — 26.8% | ||||||||
Air Transport Services Group* | 19,228 | 561,458 | ||||||
Alamo Group | 4,600 | 699,568 | ||||||
Allied Motion Technologies | 21,327 | 721,279 | ||||||
CBIZ* | 18,151 | 901,016 | ||||||
Construction Partners, Cl A* | 24,721 | 769,812 | ||||||
CRA International | 6,096 | 626,303 | ||||||
Douglas Dynamics | 18,000 | 611,100 | ||||||
The accompanying notes are an integral part of the financial statements.
10
| The Advisors’ Inner Circle Fund | RHJ MICRO CAP PORTFOLIO October 31, 2022
|
COMMON STOCK — continued
| ||||||||
| Shares | Value | |||||||
INDUSTRIALS — continued | ||||||||
Ducommun* | 12,300 | $ | 580,683 | |||||
Energy Recovery* | 41,671 | 1,072,195 | ||||||
Exponent | 6,706 | 638,813 | ||||||
Huron Consulting Group* | 12,672 | 933,039 | ||||||
Liquidity Services* | 18,700 | 321,266 | ||||||
Montrose Environmental Group* | 16,347 | 715,672 | ||||||
MYR Group* | 5,966 | 522,085 | ||||||
Radiant Logistics* | 80,875 | 490,911 | ||||||
Shyft Group | 17,677 | 406,217 | ||||||
Sterling Infrastructure* | 25,891 | 698,798 | ||||||
Thermon Group Holdings* | 32,300 | 573,648 | ||||||
Vicor* | 4,960 | 236,939 | ||||||
|
| |||||||
| 12,080,802 | ||||||||
|
| |||||||
INFORMATION TECHNOLOGY — 19.2% | ||||||||
A10 Networks | 64,500 | 1,083,600 | ||||||
Absolute Software | 72,100 | 865,921 | ||||||
ADTRAN Holdings | 33,879 | 760,922 | ||||||
Axcelis Technologies* | 13,141 | 762,178 | ||||||
Cambium Networks* | 31,600 | 611,460 | ||||||
Harmonic* | 56,277 | 869,480 | ||||||
Luna Innovations* | 93,400 | 484,746 | ||||||
MagnaChip Semiconductor* | 43,627 | 434,089 | ||||||
Model N* | 15,633 | 594,054 | ||||||
nLight* | 51,300 | 552,501 | ||||||
Perficient* | 8,249 | 552,435 | ||||||
Vishay Precision Group* | 19,400 | 654,750 | ||||||
Zuora, Cl A* | 54,300 | 417,567 | ||||||
|
| |||||||
| 8,643,703 | ||||||||
|
| |||||||
MATERIALS — 4.4% | ||||||||
American Vanguard | 30,500 | 709,735 | ||||||
Haynes International | 16,113 | 788,087 | ||||||
Mativ | 20,300 | 481,922 | ||||||
|
| |||||||
| 1,979,744 | ||||||||
|
| |||||||
TOTAL COMMON STOCK | 44,055,447 | |||||||
|
| |||||||
The accompanying notes are an integral part of the financial statements.
11
| The Advisors’ Inner Circle Fund | RHJ MICRO CAP PORTFOLIO October 31, 2022
|
SHORT-TERM INVESTMENT (A) — 2.7%
| ||||||||
| Shares | Value | |||||||
First American Government Obligations Fund, | 1,195,046 | $ | 1,195,046 | |||||
|
| |||||||
TOTAL INVESTMENTS— 100.4% | $ | 45,250,493 | ||||||
|
| |||||||
Percentages are based on Net Assets of $45,075,009. |
| * | Non-income producing security. |
| †† | More narrow industries are utilized for compliance purposes, whereas broad sectors are utilized for reporting purposes. |
| (A) | The rate reported is the 7-day effective yield as of October 31, 2022. |
| Cl | Class |
As of October 31, 2022, all of the Fund’s investments were considered Level 1, in accordance with the authoritative guidance on fair value measurements under U.S. generally accepted accounting principles.
For more information on valuation inputs, see Note 2 in the Notes to Financial Statements.
The accompanying notes are an integral part of the financial statements.
12
| The Advisors’ Inner Circle Fund | RHJ FUNDS October 31, 2022
|
| * | Redemption price per share may be less if the shares are redeemed less than 90 days from the date of purchase. See Note 2 of the Notes to Financial Statements. |
The accompanying notes are an integral part of the financial statements.
13
| The Advisors’ Inner Circle Fund | RHJ FUNDS For the year ended October 31, 2022
|
| ||||
Small Cap | Micro Cap | |||
Investment Income | ||||
Dividends | $ 140,678 | $ 240,121 | ||
Less: Foreign Taxes Withheld | (1,664) | (1,324) | ||
|
| |||
Total Investment Income | 139,014 | 238,797 | ||
|
| |||
Expenses | ||||
Investment Advisory Fees | 134,349 | 348,491 | ||
Administration Fees | 39,741 | 110,259 | ||
Trustees’ Fees | 12,678 | 35,172 | ||
Chief Compliance Officer Fees | 4,894 | 9,642 | ||
Transfer Agent Fees | 72,543 | 174,080 | ||
Registration and Filing Fees | 24,288 | 27,936 | ||
Audit Fees | 17,716 | 19,284 | ||
Legal Fees | 6,435 | 30,478 | ||
Printing Fees | 6,280 | 15,504 | ||
Custodian Fees | 4,999 | 5,000 | ||
Other Expenses | 16,277 | 40,748 | ||
|
| |||
Expenses Before Expense Waiver, Reimbursement and Fees Paid Indirectly | 340,200 | 816,594 | ||
|
| |||
Less: | ||||
Waiver of Investment Advisory Fees | (170,743) | (234,963) | ||
Fees Paid Indirectly(1) | (2,799) | (8,544) | ||
|
| |||
Net Expenses After Expense Waiver, Reimbursement and Fees Paid Indirectly | 166,658 | 573,087 | ||
|
| |||
Net Investment Loss | (27,644) | (334,290) | ||
|
| |||
Net Realized Gain on Investments | 468,762 | 2,686,482 | ||
Net Change in Unrealized Appreciation (Depreciation) on Investments | (3,260,849) | (10,032,877) | ||
|
| |||
Total Net Realized and Unrealized Loss on Investments | (2,792,087) | (7,346,395) | ||
|
| |||
Net Decrease in Net Assets Resulting from Operations | $ (2,819,731) | $ (7,680,685) | ||
|
| |||
| (1) | See Note 4 in the Notes to Financial Statements. |
The accompanying notes are an integral part of the financial statements.
14
| The Advisors’ Inner Circle Fund |
|
The accompanying notes are an integral part of the financial statements.
15
| The Advisors’ Inner Circle Fund |
|
STATEMENTS OF CHANGES IN NET ASSETS
| ||||
Year Ended | Year Ended | |||
Operations: | ||||
Net Investment Loss | $ (334,290) | $ (467,070) | ||
Net Realized Gain on Investments | 2,686,482 | 11,919,890 | ||
Net Change in Unrealized Appreciation | (10,032,877) | 10,844,498 | ||
|
| |||
Net Increase (Decrease) in Net Assets Resulting in Operations | (7,680,685) | 22,297,318 | ||
|
| |||
Distributions | (10,288,639) | — | ||
|
| |||
Capital Share Transactions: | ||||
Issued | 6,346,308 | 2,840,257 | ||
Reinvestment of Distributions | 9,122,498 | — | ||
Redemption Fees(1) | 657 | 304 | ||
Redeemed | (7,224,598) | (8,286,557) | ||
|
| |||
Net Increase (Decrease) in Net Assets from Capital Share Transactions | 8,244,865 | (5,445,996) | ||
|
| |||
Total Increase (Decrease) in Net Assets | (9,724,459) | 16,851,322 | ||
Net Assets: | ||||
Beginning of Year | 54,799,468 | 37,948,146 | ||
|
| |||
End of Year | $ 45,075,009 | $ 54,799,468 | ||
|
| |||
Shares Issued and Redeemed: | ||||
Issued | 206,656 | 72,645 | ||
Reinvestment of Distributions | 264,497 | — | ||
Redeemed | (222,145) | (218,980) | ||
|
| |||
Net Increase (Decrease) in Shares Outstanding from Share Transactions | 249,008 | (146,335) | ||
|
| |||
(1) See Note 2 in the Notes to Financial Statements.
The accompanying notes are an integral part of the financial statements.
16
| The Advisors’ Inner Circle Fund |
|
|
| |||||||||||||||||||
Selected Per Share Data & Ratios For a Share Outstanding Throughout Each Year | ||||||||||||||||||||
| Years Ended October 31, | ||||||||||||||||||||
| 2022 | 2021 | 2020 | 2019 | 2018 | ||||||||||||||||
Net Asset Value, | ||||||||||||||||||||
Beginning of Year | $ | 11.36 | $ | 7.74 | $ | 8.05 | $ | 10.99 | $ | 11.16 | ||||||||||
|
|
|
|
|
|
|
|
|
| |||||||||||
Income (Loss) from | ||||||||||||||||||||
Investment Operations: | ||||||||||||||||||||
Net Investment Loss(1) | (0.02) | (0.06) | (0.03) | (0.03) | (0.05) | |||||||||||||||
Net Realized and Unrealized Gain (Loss) | (1.58) | 3.68 | (0.28) | (0.45) | 0.60 | |||||||||||||||
|
|
|
|
|
|
|
|
|
| |||||||||||
Total from Investment Operations | (1.60) | 3.62 | (0.31) | (0.48) | 0.55 | |||||||||||||||
|
|
|
|
|
|
|
|
|
| |||||||||||
Distributions from: | ||||||||||||||||||||
Net Realized Gain | (0.30) | — | — | (2.45) | (0.72) | |||||||||||||||
Return of Capital | — | — | — | (0.01) | — | |||||||||||||||
|
|
|
|
|
|
|
|
|
| |||||||||||
Total Distributions | (0.30) | — | — | (2.46) | (0.72) | |||||||||||||||
|
|
|
|
|
|
|
|
|
| |||||||||||
Net Asset Value, | ||||||||||||||||||||
End of Year | $ | 9.46 | $ | 11.36 | $ | 7.74 | $ | 8.05 | $ | 10.99 | ||||||||||
|
|
|
|
|
|
|
|
|
| |||||||||||
Total Return† | (14.47)% | 46.77% | (3.85)% | (0.80)% | 5.00% | |||||||||||||||
|
|
|
|
|
|
|
|
|
| |||||||||||
Ratios and Supplemental Data | ||||||||||||||||||||
Net Assets, End of Year (Thousands) | $ | 15,024 | $ | 19,962 | $ | 14,305 | $ | 40,601 | $ | 45,107 | ||||||||||
Ratio of Net Expenses to Average Net Assets | 1.00%(2) | 1.00%(2) | 1.00%(2) | 1.00%(2) | 1.00%(2) | |||||||||||||||
Ratio of Expenses to Average Net Assets | 2.03% | 1.88% | 1.83% | 1.77% | 1.68% | |||||||||||||||
Ratio of Net Investment Loss to Average Net Assets | (0.16)% | (0.56)% | (0.40)% | (0.42)% | (0.41)% | |||||||||||||||
Portfolio Turnover Rate | 39% | 52% | 65% | 84% | 103% | |||||||||||||||
| (1) | Per share calculations were performed using average shares for the year. |
| (2) | The Ratio of Expenses to Average Net Assets excludes the effect of fees paid indirectly. If these expense offsets were included, the ratios would have decreased by 2 basis points (bps), 3 bps, 5 bps, 1 bps, and 5 bps, respectively. |
| † | Returns shown do not reflect the deduction of taxes that a shareholder would pay on Fund distributions or the redemption of Fund shares. Total return would have been lower had certain fees not been waived and/or expenses assumed by the Adviser during the year. |
The accompanying notes are an integral part of the financial statements.
17
| The Advisors’ Inner Circle Fund |
|
FINANCIAL HIGHLIGHTS
|
| |||||||||||||||||||
Selected Per Share Data & Ratios For a Share Outstanding Throughout Each Year | ||||||||||||||||||||
| Years Ended October 31, | ||||||||||||||||||||
| 2022 | 2021 | 2020 | 2019 | 2018 | ||||||||||||||||
Net Asset Value, | ||||||||||||||||||||
Beginning of Year | $ | 42.96 | $ | 26.69 | $ | 28.01 | $ | 35.85 | $ | 38.16 | ||||||||||
|
|
|
|
|
|
|
|
|
| |||||||||||
Income (Loss) from | ||||||||||||||||||||
Investment Operations: | ||||||||||||||||||||
Net Investment Loss(1) | (0.23) | (0.35) | (0.19) | (0.20) | (0.28) | |||||||||||||||
Net Realized and Unrealized Gain (Loss) | (5.08) | 16.62 | (0.82) | (0.93) | 2.23 | |||||||||||||||
|
|
|
|
|
|
|
|
|
| |||||||||||
Total from Investment Operations | (5.31) | 16.27 | (1.01) | (1.13) | 1.95 | |||||||||||||||
|
|
|
|
|
|
|
|
|
| |||||||||||
Redemption Fees | — ^ | — ^ | 0.01 | — ^ | — ^ | |||||||||||||||
|
|
|
|
|
|
|
|
|
| |||||||||||
Distributions from: | ||||||||||||||||||||
Net Realized Gain | (8 .08) | — | (0.32) | (6.71) | (4.26) | |||||||||||||||
|
|
|
|
|
|
|
|
|
| |||||||||||
Total Distributions | (8.08) | — | (0.32) | (6.71) | (4.26) | |||||||||||||||
|
|
|
|
|
|
|
|
|
| |||||||||||
Net Asset Value, | ||||||||||||||||||||
End of Year | $ | 29.57 | $ | 42.96 | $ | 26.69 | $ | 28.01 | $ | 35.85 | ||||||||||
|
|
|
|
|
|
|
|
|
| |||||||||||
Total Return† | (15.03)% | 60.96% | (3.65)% | (0.55)% | 5.84% | |||||||||||||||
|
|
|
|
|
|
|
|
|
| |||||||||||
Ratios and Supplemental Data | ||||||||||||||||||||
Net Assets, End of Year (Thousands) | $ | 45,075 | $ | 54,799 | $ | 37,948 | $ | 44,898 | $ | 52,201 | ||||||||||
Ratio of Net Expenses to Average Net Assets | 1.25%(2) | 1.25%(2) | 1.25%(2) | 1.25%(2) | 1.25%(2) | |||||||||||||||
Ratio of Expenses to Average Net Assets | 1.76% | 1.56% | 1.65% | 1.54% | 1.39% | |||||||||||||||
Ratio of Net Investment Loss to Average Net Assets | (0.72)% | (0.90)% | (0.76)% | (0.68)% | (0.78)% | |||||||||||||||
Portfolio Turnover Rate | 43% | 40% | 69% | 67% | 64% | |||||||||||||||
| (1) | Per share calculations were performed using average shares for the year. |
| (2) | The Ratio of Expenses to Average Net Assets excludes the effect of fees paid indirectly. If these expense offsets were included, the ratios would have decreased by 2 basis points (bps), 1 bps, 2 bps, 2 bps, and 1 bps, respectively. |
| † | Returns shown do not reflect the deduction of taxes that a shareholder would pay on Fund distributions or the redemption of Fund shares. Total return would have been lower had certain fees not been waived and/or expenses assumed by the Adviser during the year. |
| ^ | Value is less than $0.005 per share. |
The accompanying notes are an integral part of the financial statements.
18
| The Advisors’ Inner Circle Fund | RHJ FUNDS October 31, 2022
|
|
1. Organization:
The Advisors’ Inner Circle Fund (the “Trust”) is organized as a Massachusetts business trust under an Amended and Restated Agreement and Declaration of Trust dated February 18, 1997, as amended on May 15, 2012 and August 18, 2020. The Trust is registered under the Investment Company Act of 1940, as amended (the “1940 Act”), as an open-end management investment company with 28 funds. The financial statements herein are those of the Rice Hall James Small Cap Portfolio (“Small Cap Portfolio”) and Rice Hall James Micro Cap Portfolio (“Micro Cap Portfolio”) (each a “Fund” and collectively the “Funds”). Each Fund is classified as a “diversified” investment company under the 1940 Act. The investment objective of the Small Cap Portfolio is maximum capital appreciation. The Small Cap Portfolio invests primarily (at least 80% of its net assets) in equity securities of U.S. small cap companies with market capitalizations that, at the time of initial purchase, fall within the range of the companies in the Russell 2000 Index at reconstitution each June. The investment objective of the Micro Cap Portfolio is maximum capital appreciation. The Micro Cap Portfolio invests primarily (at least 80% of its net assets) in equity securities of U.S. micro cap companies that, at the time of initial purchase, fall within the range of companies in the Russell Microcap Index at reconstitution each June. The financial statements of the remaining funds of the Trust are presented separately. The assets of each Fund are segregated, and a shareholder’s interest is limited to the Fund in which shares are held.
2. Significant Accounting Policies:
The following are significant accounting policies, which are consistently followed in preparation of the financial statements of the Funds. The Funds are investment companies that apply the accounting and reporting guidance issued in Topic 946 by the U.S. Financial Accounting Standards Board (“FASB”).
Use of Estimates — The preparation of financial statements, in conformity with U.S. generally accepted accounting principles (“U.S. GAAP”), requires management to make estimates and assumptions that affect the reported amounts of assets and liabilities and disclosure of contingent assets and liabilities as of the date of the financial statements and the reported amounts of increases and decreases in net assets from operations during the reporting period. Actual results could differ from those estimates and such differences could be material.
Security Valuation — Securities listed on a securities exchange, market or automated quotation system for which quotations are readily available (except for securities traded on NASDAQ), including securities traded over the counter, are valued at the last quoted sale price on an exchange or market (foreign or domestic) on which they are traded on valuation date (or approximately 4:00
19
| The Advisors’ Inner Circle Fund | RHJ FUNDS October 31, 2022
|
pm ET if a security’s primary exchange is normally open at that time), or, if there is no such reported sale on the valuation date, at the most recent quoted bid price. For securities traded on NASDAQ, the NASDAQ Official Closing Price will be used. Values of debt securities are generally reported at the last sales price if the security is actively traded. If a debt security is not actively traded, it is valued at an evaluated bid price by employing methodologies that utilize actual market transactions, broker-supplied valuations, or other methodologies designed to identify the market value for such securities. Debt obligations with remaining maturities of sixty days or less may be valued at their amortized cost, which approximates market value. The prices of foreign securities are reported in local currency and converted to U.S. dollars using currency exchange rates.
Securities for which market prices are not “readily available” are required to be fair valued under the 1940 Act.
In December 2020, the SEC adopted Rule 2a-5 under the 1940 Act, establishing requirements to determine fair value in good faith for purposes of the 1940 Act. The rule permits fund boards to designate a fund’s investment adviser to perform fair-value determinations, subject to board oversight and certain other conditions. The rule also defines when market quotations are “readily available” for purposes of the 1940 Act and requires a fund to fair value a portfolio investment when a market quotation is not readily available. The SEC also adopted new Rule 31a-4 under the 1940 Act, which sets forth recordkeeping requirements associated with fair-value determinations. The compliance date for Rule 2a-5 and Rule 31a-4 was September 8, 2022.
Effective September 8, 2022, and pursuant to the requirements of Rule 2a-5, the Trust’s Board of Trustees (the “Board”) designated the Adviser as the Board’s valuation designee to perform fair-value determinations for the Funds through a Fair Value Committee (the “Committee”) established by the Adviser and approved new Adviser Fair Value Procedures for the Funds. Prior to September 8, 2022, fair-value determinations were performed in accordance with the Trust’s Fair Value Procedures established by the Board and were implemented through a Fair Value Committee designated by the Board.
Some of the more common reasons that may necessitate that a security be valued using fair value procedures include: the security’s trading has been halted or suspended; the security has been de-listed from a national exchange; the security’s primary trading market is temporarily closed at a time when under normal conditions it would be open; the security has not been traded for an extended period of time; the security’s primary pricing source is not able or willing to provide a price; or trading of the security is subject to local government-imposed restrictions. When a security is valued in accordance with
20
| The Advisors’ Inner Circle Fund | RHJ FUNDS October 31, 2022
|
the fair value procedures, the Committee will determine the value after taking into consideration relevant information reasonably available to the Committee. As of October 31, 2022, there were no securities valued in accordance with the fair value procedures.
Investments in open-end and closed-end registered investment companies that do not trade on an exchange are valued at the end-of-day net asset value per share. Investments in open-end and closed-end registered investment companies that trade on an exchange are valued at the last sales price or official closing price as of the close of the customary trading session of the exchange on which the security is principally traded.
In accordance with the authoritative guidance on fair value measurement under U.S. GAAP, the Funds disclose fair value of their investments in a hierarchy that prioritizes the inputs to valuation techniques used to measure the fair value. The objective of a fair value measurement is to determine the price that would be received to sell an asset or paid to transfer a liability in an orderly transaction between market participants at the measurement date (an exit price). Accordingly, the fair value hierarchy gives the highest priority to quoted prices (unadjusted) in active markets for identical assets or liabilities (Level 1) and the lowest priority to unobservable inputs (Level 3). The three levels of the fair value hierarchy are described below:
| • | Level 1 — Unadjusted quoted prices in active markets for identical, unrestricted assets or liabilities that the Funds have the ability to access at the measurement date; |
| • | Level 2 — Other significant observable inputs (includes quoted prices for similar securities, interest rates, prepayment speed, credit risk, referenced indices, quoted prices in inactive markets, adjusted quoted prices in active markets, etc.); and |
| • | Level 3 — Prices, inputs or exotic modeling techniques that are both significant to the fair value measurement and unobservable (supported by little or no market activity). |
The inputs or methodology used for valuing securities are not necessarily an indicator of the risk associated with investing in these securities.
Investments are classified within the level of the lowest significant input considered in determining fair value. Investments classified within Level 3 whose fair value measurement considers several inputs may include Level 1 or Level 2 inputs as components of the overall fair value measurement.
21
| The Advisors’ Inner Circle Fund | RHJ FUNDS October 31, 2022
|
Federal Income Taxes — It is the Funds’ intention to continue to qualify as regulated investment companies for Federal income tax purposes by complying with the appropriate provisions of Subchapter M of the Internal Revenue Code of 1986, as amended. Accordingly, no provisions for Federal income taxes have been made in the financial statements.
The Funds evaluate tax positions taken or expected to be taken in the course of preparing the Funds’ tax returns to determine whether it is “more likely than not” (i.e., a greater than 50% probability) that each tax position will be sustained upon examination by a taxing authority based on the technical merits of the position. Tax positions not deemed to meet the more likely than not threshold are recorded as a tax benefit or expense in the current year. The Funds did not record any tax provision in the current period. However, management’s conclusions regarding tax positions taken may be subject to review and adjustment at a later date based on factors including, but not limited to, examination by tax authorities (i.e., the last 3 open tax year ends, as applicable), on-going analysis of and changes to tax laws, regulations and interpretations thereof.
As of and during the year ended October 31, 2022, the Funds did not have a liability for any unrecognized tax benefits. The Funds recognize interest and penalties, if any, related to unrecognized tax benefits as income tax expense in the Statements of Operations. During the year ended October 31, 2022, the Funds did not incur any significant interest or penalties.
Security Transactions and Investment Income — Security transactions are accounted for on trade date. Costs used in determining realized gains or losses on the sale of investment securities are based on the specific identification method. Dividend income is recorded on the ex-dividend date.
Expenses — Most expenses of the Trust can be directly attributed to a particular fund. Certain expenses are apportioned among the Trust based on the number of funds and/or relative net assets.
Dividends and Distributions to Shareholders — Each Fund distributes substantially all of its net investment income, if any, quarterly. Any net realized capital gains are distributed at least annually. All distributions are recorded on ex-dividend date.
Cash — Idle cash may be swept into various time deposit accounts and is classified as cash on the Statements of Assets and Liabilities. Each Fund maintains cash in bank deposit accounts which, at times, may exceed United States federally insured limits. Amounts invested are available on the same business day.
22
| The Advisors’ Inner Circle Fund | RHJ FUNDS October 31, 2022
|
Redemption Fees — The Micro Cap Portfolio imposes a 2.00% redemption fee on the value of Institutional Class shares redeemed fewer than 90 days from the date of purchase. The redemption fee is recorded as an increase to paid-in capital. The Micro Cap Portfolio imposed redemption fees of $657 and $304 for the year ended October 31, 2022 and the year ended October 31, 2021, respectively.
3. Transactions with Affiliates:
Certain officers of the Trust are also employees of SEI Investments Global Funds Services (the “Administrator”), a wholly owned subsidiary of SEI Investments Company, and/or SEI Investments Distribution Co. (the “Distributor”). Such officers are paid no fees by the Trust, other than the Chief Compliance Officer (“CCO”) as described below, for serving as officers of the Trust.
A portion of the services provided by the CCO and his staff, who are employees of the Administrator, are paid for by the Trust as incurred. The services include regulatory oversight of the Trust’s Advisors and service providers as required by SEC regulations. The CCO’s services have been approved by and are reviewed by the Board.
| 4. | Administration, Distribution, Commission Recapture, Shareholder Servicing, Transfer Agent and Custodian Agreements: |
The Funds and the Administrator are parties to an Administration Agreement, under which the Administrator provides management and administrative services to the Funds. For these services, the Administrator is paid an asset-based fee, which will vary depending on the number of share classes and the average daily net assets of the Funds. For the year ended October 31, 2022, the Small Cap Portfolio and Micro Cap Portfolio incurred fees of $39,741 and $110,259, respectively, for these services.
The Funds direct, via a network of executing brokers, certain fund trades to the Distributor, who pays a portion of the Funds’ expenses. Under this arrangement, the Small Cap Portfolio and the Micro Cap Portfolio had expenses reduced by $1,599 and $6,996, respectively, savings that were used to pay administrative expenses. These amounts are included in “Fees Paid Indirectly” on the Statements of Operations.
Certain brokers, dealers, banks, trust companies and other financial representatives received compensation from the Funds for providing a variety of services, including record keeping and transaction processing. Such fees are based on the assets of the Funds that are serviced by the financial representative. Such fees are paid by the Funds to the extent that the number of accounts serviced by the financial representative multiplied by the account fee charged by the Funds’ transfer agent would not exceed the amount that would have been charged had the accounts serviced by the financial representative been registered directly through the transfer agent. All fees in excess of this calculated amount are paid by Rice Hall James
23
| The Advisors’ Inner Circle Fund | RHJ FUNDS October 31, 2022
|
& Associates, LLC (the “Adviser”). These fees are disclosed on the Statements of Operations as Shareholder Servicing fees, if applicable.
DST Systems, Inc. serves as the transfer agent and dividend-disbursing agent for the Funds under a transfer agency agreement with the Trust.
The Funds may earn cash management credits that can be used to offset transfer agent expenses. During the year ended October 31, 2022, the Small Cap Portfolio and the Micro Cap Portfolio earned credits of $1,200 and $1,548, respectively, which were used to offset transfer agent expenses. These amounts are included in “Fees Paid Indirectly” on the Statements of Operations.
U.S. Bank, N.A. acts as custodian (the “Custodian”) for the Funds. The Custodian plays no role in determining the investment policies of the Funds or which securities are to be purchased or sold by the Funds.
5. Investment Advisory Agreements:
Under the terms of an investment advisory agreement, the Adviser provides investment advisory services to the Funds. For its services, the Small Cap Portfolio and the Micro Cap Portfolio have a fee calculated at an annual rate of 0.80% and 0.75% of each Fund’s average daily net assets, respectively. The Adviser has contractually agreed to reduce fees and reimburse expenses in order to keep total annual Fund operating expenses (excluding interest, taxes, brokerage commissions, acquired fund fees and expenses, and non-routine expenses (collectively “excluded expenses”)) from exceeding certain levels as set forth below until February 28, 2023. Refer to waiver of investment advisory fees on the Statements of Operations for fees waived for the year ended October 31, 2022. In addition, the Adviser may receive from a Fund the difference between the total annual Fund operating expenses (not including excluded expenses) and the expense cap to recoup all or a portion of its prior fee reductions or expense reimbursements made during the three-year period preceding the recoupment if at any point total annual Fund operating expenses (not including excluded expenses) are below the expense cap (i) at the time of the fee reduction and/or expense reimbursement and (ii) at the time of the recoupment.
RHJ Fund | Contractual Expense Limitation | |
Small Cap Portfolio | 1.00% | |
Micro Cap Portfolio | 1.25% |
24
| The Advisors’ Inner Circle Fund | RHJ FUNDS October 31, 2022
|
As of October 31, 2022, the Adviser may seek as reimbursement of previously reduced fees for the Funds as follows:
| Expiring | Expiring | Expiring | ||||||||||||||
RHJ Fund | 2023 | 2024 | 2025 | Total | ||||||||||||
Small Cap Portfolio | $217,444 | $169,354 | $170,743 | $557,541 | ||||||||||||
Micro Cap Portfolio | 154,080 | 159,879 | 234,963 | 548,922 | ||||||||||||
6. Investment Transactions:
For the year ended October 31, 2022, the purchases and sales of investment securities other than long-term U.S. Government and short-term securities were:
RHJ Fund | Purchases | Sales | ||||||
Small Cap Portfolio | $ 6,393,388 | $ 7,975,649 | ||||||
Micro Cap Portfolio | 19,462,001 | 21,660,926 | ||||||
There were no purchases or sales of long-term U.S. Government Securities.
7. Federal Tax Information:
The amount and character of income and capital gain distributions to be paid, if any, are determined in accordance with Federal income tax regulations, which may differ from U.S. GAAP. As a result, net investment income (loss) and net realized gain (loss) on investment transactions for a reporting period may differ significantly from distributions during the year. The book/tax differences may be temporary or permanent. The permanent differences primarily consist of net of operating loss offset against short term capital gains.
The permanent difference that is credited or charged to Paid-in Capital and Distributable Earnings as of October 31, 2022 is primarily related to net operating losses.
| Distributable Earnings | Paid-in Capital | |||||||
Small Cap Portfolio | $ 108,270 | $ (108,270) | ||||||
Micro Cap Portfolio | 490,710 | (490,710) | ||||||
These reclassifications have no impact on net assets or net asset value per share.
25
| The Advisors’ Inner Circle Fund | RHJ FUNDS October 31, 2022
|
The tax character of dividends and distributions declared during the last two fiscal years was as follows:
RHJ Fund | Ordinary Income | Long-Term Capital Gains | Total | |||
Small Cap Portfolio | ||||||
2022 | $ — | $ 521,648 | $ 521,648 | |||
2021 | — | — | — | |||
Micro Cap Portfolio | ||||||
2022 | 1,098,674 | 9,189,965 | 10,288,639 | |||
2021 | — | — | — | |||
As of October 31, 2022, the components of distributable earnings (accumulated losses) on a tax basis were as follows:
RHJ Fund | Undistributed Ordinary Income | Undistributed Long-Term Capital | Late-Year Loss | Unrealized | Total Distributable | |||||
Small Cap Portfolio | $ — | $ 417,459 | $ (20,123) | $ 1,796,773 | $ 2,194,109 | |||||
Micro Cap Portfolio | — | 2,707,993 | (259,435) | 8,213,829 | 10,662,387 | |||||
Late-year loss deferrals represent ordinary losses realized on investment transactions from January 1, 2022 through October 31, 2022, that, in accordance with Federal income tax regulations, the Funds defer and treat as having arisen in the following fiscal year.
For Federal income tax purposes, the difference between Federal tax cost and book cost is due to wash sales, which cannot be used for Federal income tax purposes in the current year and have been deferred for use in future years.
The Federal tax cost and aggregate gross unrealized appreciation and depreciation on investments, held by the Funds at October 31, 2022, were as follows:
RHJ Fund | Federal Tax Cost | Aggregate Gross Unrealized Appreciation | Aggregate Gross Unrealized Depreciation | Net Unrealized Appreciation | ||||||||||||
Small Cap Portfolio | $ | 13,265,278 | $ | 2,744,300 | $ | (947,527) | $ | 1,796,773 | ||||||||
Micro Cap Portfolio | 37,036,664 | 11,199,942 | (2,986,113) | 8,213,829 | ||||||||||||
8. Concentration of Risks:
Equity Risk (Small Cap Portfolio, Micro Cap Portfolio) — Since the Funds purchase equity securities, the Funds are subject to equity risk, or the risk that stock prices may fall over short or extended periods of time. Historically, the equity markets have moved in cycles, and accordingly the value of the Funds’ equity securities may
26
| The Advisors’ Inner Circle Fund | RHJ FUNDS October 31, 2022
|
fluctuate drastically from day to day. Individual companies may report poor results or be negatively affected by industry and/or economic trends and developments. The prices of securities issued by such companies may suffer a decline in response. These factors contribute to price volatility, which is the principal risk of investing in the Funds.
Small-Capitalization Company Risk (Small Cap Portfolio, Micro Cap Portfolio) — The small-capitalization companies in which the Funds will invest may be more vulnerable to adverse business or economic events as compared to larger, more established companies. In particular, investments in these small-sized companies may pose additional risks, including liquidity risk, because these companies tend to have comparatively limited product lines, markets and financial resources, and may depend upon a relatively small management group. Therefore, small-cap stocks may be more volatile than those of larger companies. These securities may be traded over-the-counter or listed on an exchange.
Growth Style Risk (Small Cap Portfolio, Micro Cap Portfolio) — The Funds pursue a “growth style” of investing, meaning that the Funds invest in equity securities of companies that the Adviser believes can potentially offer above-average rates of earnings growth and that therefore may experience stock price increases that exceed the increases observed in the benchmark or in the stock’s peer universe. Over time and in different market environments, growth-style investing may fall in or out of favor, and in the latter case, the Funds may underperform other equity funds that rely on different investing styles or pursue different objectives.
Micro-Capitalization Company Risk (Micro Cap Portfolio) — Micro-capitalization companies may be newly formed or in the early stages of development with limited product lines, markets or financial resources. Therefore, micro-capitalization companies may be less financially secure than large-, mid and small-capitalization companies and may be more vulnerable to key personnel losses due to reliance on a smaller number of management personnel. In addition, as compared to the volume of information available about larger peers, there may be less public information available about these companies. Micro-capitalization stock prices may be more volatile than stock prices corresponding to large-, mid- and small-capitalization companies, and such stocks may be more thinly traded and thus difficult for the Fund to buy and sell in the market.
Market Risk (Small Cap Portfolio, Micro Cap Portfolio) — The risk that the market value of an investment may move up and down, sometimes rapidly and unpredictably. Markets for securities in which the Funds invest may decline significantly in response to adverse issuer, political, regulatory, market, economic or other developments that may cause broad changes in market value, public perceptions concerning these developments, and adverse investor sentiment or publicity. Similarly, the impact of any epidemic, pandemic or natural disaster, or widespread fear that such events may occur, could negatively affect the global economy, as well as the economies of individual countries, the financial performance of individual companies and sectors,
27
| The Advisors’ Inner Circle Fund | RHJ FUNDS October 31, 2022
|
and the markets in general in significant and unforeseen ways. Any such impact could adversely affect the prices and liquidity of the securities and other instruments in which the Funds invest, which in turn could negatively impact the Funds’ performance and cause losses on your investment in the Funds.
The foregoing is not intended to be a complete discussion of the risks associated with investing in the Funds. A more complete description of risks associated with the Funds is included in the prospectus and statement of additional information.
9. Other:
At October 31, 2022, the percentage of total shares outstanding held by a limited number of shareholders for each Fund, (shareholder segments comprised of omnibus accounts that were held on behalf of individual shareholders), each owning 10% or greater of the aggregate shares outstanding, was as follows:
| No. of | ||||
| RHJ Fund | Shareholders | % Ownership | ||
Small Cap Portfolio | 2 | 46% | ||
Micro Cap Portfolio | 1 | 49% |
10. Indemnifications:
In the normal course of business, the Funds enter into contracts that provide general indemnifications. The Funds’ maximum exposure under these arrangements is dependent on future claims that may be made against the Funds and, therefore, cannot be established; however, remote, based on experience, the risk of loss from such claims is considered remote.
11. Subsequent Events:
The Funds have evaluated the need for additional disclosures and/or adjustments resulting from subsequent events through the date the financial statements were issued. Based on this evaluation, no additional disclosures and/or adjustments to the financial statements were required.
28
| The Advisors’ Inner Circle Fund | RHJ FUNDS October 31, 2022
|
REPORT OF INDEPENDENT REGISTERED PUBLIC ACCOUNTING FIRM
|
To the Board of Trustees of The Advisors’ Inner Circle Fund
and the Shareholders of Rice Hall James Small Cap Portfolio
and Rice Hall James Micro Cap Portfolio
Opinion on the Financial Statements
We have audited the accompanying statements of assets and liabilities of Rice Hall James Small Cap Portfolio and Rice Hall James Micro Cap Portfolio, each a series of shares of beneficial interest in The Advisors’ Inner Circle Fund (the “Funds”), including the schedules of investments, as of October 31, 2022, and the related statements of operations for the year then ended, the statements of changes in net assets for each of the years in the two-year period then ended, the financial highlights for each of the years in the five-year period then ended and the related notes (collectively referred to as the “financial statements”). In our opinion, the financial statements present fairly, in all material respects, the financial position of the Funds as of October 31, 2022, and the results of their operations for the year then ended, the changes in their net assets for each of the years in the two-year period then ended and their financial highlights for each of the years in the five-year period then ended, in conformity with accounting principles generally accepted in the United States of America.
Basis for Opinion
These financial statements are the responsibility of the Funds’ management. Our responsibility is to express an opinion on the Funds’ financial statements based on our audits. We are a public accounting firm registered with the Public Company Accounting Oversight Board (United States) (“PCAOB”) and are required to be independent with respect to the Funds in accordance with the U.S. federal securities law and the applicable rules and regulations of the Securities and Exchange Commission and the PCAOB.
We conducted our audits in accordance with the standards of the PCAOB. Those standards require that we plan and perform the audits to obtain reasonable assurance about whether the financial statements are free of material misstatement, whether due to error or fraud. The Funds are not required to have, nor were we engaged to perform, an audit of their internal control over financial reporting. As part of our audits we are required to obtain an understanding of internal control over financial reporting but not for the purpose of expressing an opinion on the effectiveness of the Funds’ internal control over financial reporting. Accordingly, we express no such opinion.
Our audits included performing procedures to assess the risk of material misstatement of the financial statements, whether due to error or fraud, and performing procedures that respond to those risks. Such procedures included examining, on a test basis, evidence regarding the amounts and disclosures in the financial statements. Our procedures included confirmation of securities owned as of October 31, 2022 by
29
| The Advisors’ Inner Circle Fund | RHJ FUNDS October 31, 2022
|
correspondence with the custodian, brokers, or by other appropriate auditing procedures where replies from brokers were not received. Our audits also included evaluating the accounting principles used and significant estimates made by management, as well as evaluating the overall presentation of the financial statements. We believe that our audits provide a reasonable basis for our opinion.

We have served as the auditor of one or more of the Funds in The Advisors’ Inner Circle Fund since 2013.
Philadelphia, Pennsylvania
December 22, 2022
30
This page intentionally left blank.
| The Advisors’ Inner Circle Fund | RHJ FUNDS October 31, 2022
|
DISCLOSURE OF FUND EXPENSES (Unaudited)
|
All mutual funds have operating expenses. As a shareholder of a mutual fund, you hold an investment that is affected by these ongoing costs, which include (among others) costs for portfolio management, administrative services, and shareholder reports like this one. It is important for you to understand the impact of these costs on your investment returns.
Operating expenses such as these are deducted from a mutual fund’s gross income and directly reduce its final investment return. These expenses are expressed as a percentage of a mutual fund’s average net assets; this percentage is known as a mutual fund’s expense ratio.
The following examples use the expense ratio and are intended to help you understand the ongoing costs (in dollars) of investing in your Fund and to compare these costs with those of other mutual funds. The examples are based on an investment of $1,000 made at the beginning of the period and held for the entire period (May 1, 2022 through October 31, 2022).
The table on the following page illustrates your Fund’s costs in two ways.
• Actual Fund Return. This section helps you to estimate the actual expenses, after fee waivers that your Fund incurred over the period. The “Expenses Paid During Period” column shows the actual dollar expense incurred by a $1,000 investment in the Fund, and the “Ending Account Value” number is derived from deducting that expense from the Fund’s gross investment return.
You can use this information, together with the actual amount you invested in the Fund, to estimate the expenses you paid over that period. Simply divide your actual account value by $1,000 to arrive at a ratio (for example, an $8,600 account value divided by $1,000 = 8.6), then multiply that ratio by the number shown for your Fund under “Expenses Paid During Period.”
• Hypothetical 5% Return. This section helps you compare your Fund’s costs with those of other mutual funds. It assumes that the Fund had an annual 5% return before expenses during the year, but that the expense ratio (Column 3) for the period is unchanged. This example is useful in making comparisons because the Securities and Exchange Commission requires all mutual funds to make this 5% calculation. You can assess your Fund’s comparative cost by comparing the hypothetical result for your Fund in the “Expenses Paid During Period” column with those that appear in the same charts in the shareholder reports for other mutual funds.
Note: Because the return is set at 5% for comparison purposes — and does NOT represent your Fund’s actual return — the account values shown may not apply to your specific investment.
32
| The Advisors’ Inner Circle Fund | RHJ FUNDS October 31, 2022
|
DISCLOSURE OF FUND EXPENSES (Unaudited)
|
| Beginning Account Value 05/01/22 | Ending Account Value 10/31/22 | Annualized Expense Ratios | Expenses During | |||||||||||||
Actual Fund Return | ||||||||||||||||
Small Cap Portfolio | $ | 1,000.00 | $ | 1,017.20 | 0.99 | % | $5.03 | |||||||||
Micro Cap Portfolio | $ | 1,000.00 | 1,022.80 | 1.24 | 6.32 | |||||||||||
Hypothetical 5% Return | ||||||||||||||||
Small Cap Portfolio | $ | 1,000.00 | $ | 1,020.21 | 0.99 | % | $5.04 | |||||||||
Micro Cap Portfolio | 1,000.00 | 1,018.95 | 1.24 | 6.31 | ||||||||||||
| * | Expenses are equal to the Fund’s annualized expense ratio multiplied by the average account value over the period, multiplied by 184/365 (to reflect the one half year period shown). |
33
| The Advisors’ Inner Circle Fund | RHJ FUNDS October 31, 2022
|
TRUSTEES AND OFFICERS OF THE ADVISORS’ INNER CIRCLE FUND (UNAUDITED) |
Set forth below are the names, years of birth, positions with the Trust, length of term of office, and the principal occupations for the last five years of each of the persons currently serving as Trustees and Officers of the Trust. Unless otherwise noted, the business address of each Trustee is SEI Investments Company, 1 Freedom Valley Drive, Oaks, Pennsylvania 19456. Trustees who are deemed not to be “interested persons” of the Trust are referred to as “Independent
Name and Year of Birth | Position with Trust and Length of Time Served1 | Principal Occupations in the Past Five Years | ||
INTERESTED TRUSTEES 3,4
| ||||
Robert Nesher (Born: 1946) | Chairman of the Board of Trustees (since 1991) | SEI employee 1974 to present; currently performs various services on behalf of SEI Investments for which Mr. Nesher is compensated. President, Chief Executive Officer and Trustee of SEI Daily Income Trust, SEI Tax Exempt Trust, SEI Institutional Managed Trust, SEI Institutional International Trust, SEI Institutional Investments Trust, SEI Asset Allocation Trust, Adviser Managed Trust, New Covenant Funds, SEI Insurance Products Trust and SEI Catholic Values Trust. President and Director of SEI Structured Credit Fund, LP. Vice Chairman of Winton Series Trust to 2017. Vice Chairman of Winton Diversified Opportunities Fund (closed-end investment company), The Advisors’ Inner Circle Fund III, Gallery Trust, Schroder Series Trust and Schroder Global Series Trust to 2018. | ||
N. Jeffrey Klauder (Born: 1952) | Trustee (since 2018) | Senior Advisor of SEI Investments since 2018. Executive Vice President and General Counsel of SEI Investments, 2004 to 2018.
| ||
| 1 | Each Trustee shall hold office during the lifetime of this Trust until the election and qualification of his or her successor, or until he or she sooner dies, resigns, or is removed in accordance with the Trust’s Declaration of Trust. |
| 2 | Directorships of Companies required to report to the Securities and Exchange Commission under the Securities Exchange Act of 1934 (i.e., “public companies”) or other investment companies under the 1940 Act. |
| 3 | Denotes Trustees who may be deemed to be “interested” persons of the Fund as that term is defined in the 1940 Act by virtue of their affiliation with the Distributor and/or its affiliates. |
| 4 | Trustees oversee 28 funds in The Advisors’ Inner Circle Fund. |
34
| The Advisors’ Inner Circle Fund | RHJ FUNDS October 31, 2022
|
|
Trustees.” Messrs. Nesher and Klauder are Trustees who may be deemed to be “interested” person of the Trust as that term is defined in the 1940 Act by virtue of their affiliation with the Trust’s Distributor. The Trust’s Statement of Additional Information (“SAI”) includes additional information about the Trustees and Officers. The SAI may be obtained without charge by calling 1-866-474-5669. The following chart lists Trustees and Officers as of October 31, 2022.
Other Directorships
Held in the Past Five Years2
Current Directorships: Trustee of The Advisors’ Inner Circle Fund II, Bishop Street Funds, Frost Family of Funds, Catholic Responsible Investments Funds, SEI Daily Income Trust, SEI Institutional International Trust, SEI Institutional Investments Trust, SEI Institutional Managed Trust, SEI Asset Allocation Trust, SEI Tax Exempt Trust, Adviser Managed Trust, New Covenant Funds, SEI Insurance Products Trust and SEI Catholic Values Trust. Director of SEI Structured Credit Fund, LP, SEI Global Master Fund plc, SEI Global Assets Fund plc, SEI Global Investments Fund plc, SEI Investments—Global Funds Services, Limited, SEI Investments Global, Limited, SEI Investments (Europe) Ltd., SEI Investments—Unit Trust Management (UK) Limited, SEI Multi-Strategy Funds PLC and SEI Global Nominee Ltd.
Former Directorships: Trustee of The KP Funds to 2022.
Current Directorships: Trustee of The Advisors’ Inner Circle Fund II, Bishop Street Funds and Catholic Responsible Investments Funds. Director of SEI Private Trust Company, SEI Global Fund Services Ltd., SEI Investments Global Limited, SEI Global Master Fund, SEI Global Investments Fund, SEI Global Assets Fund and SEI Investments - Guernsey Limited.
Former Directorships: Trustee of SEI Investments Management Corporation, SEI Trust Company, SEI Investments (South Africa), Limited and SEI Investments (Canada) Company to 2018. Trustee of The KP Funds to 2022.
35
| The Advisors’ Inner Circle Fund | RHJ FUNDS October 31, 2022
|
Name and Year of Birth | Position with Trust and Length of Time Served1 | Principal Occupations in the Past Five Years | ||
INDEPENDENT TRUSTEES3
| ||||
Kathleen Gaffney (Born: 1961) | Trustee (since 2022)
| Retired since 2019. Vice President and Portfolio Manager, Eaton Vance Management from 2012 to 2019. | ||
Joseph T. Grause, Jr. (Born: 1952) | Trustee (since 2011) Lead Independent Trustee (since 2018) | Self-Employed Consultant since 2012. Director of Endowments and Foundations, Morningstar Investment Management, Morningstar, Inc., 2010 to 2011. Director of International Consulting and Chief Executive Officer of Morningstar Associates Europe Limited, Morningstar, Inc., 2007 to 2010. Country Manager – Morningstar UK Limited, Morningstar, Inc., 2005 to 2007.
| ||
Mitchell A. Johnson (Born: 1942) | Trustee (since 2005)
| Retired. Private Investor since 1994. | ||
Betty L. Krikorian (Born: 1943) | Trustee (since 2005) | Vice President, Compliance, AARP Financial Inc., from 2008 to 2010. Self-Employed Legal and Financial Services Consultant since 2003. Counsel (in-house) for State Street Bank from 1995 to 2003. | ||
Robert Mulhall (Born: 1958) | Trustee (since 2019) | Partner, Ernst & Young LLP, from 1998 to 2018. | ||
Bruce Speca (Born: 1956) | Trustee (since 2011) | Global Head of Asset Allocation, Manulife Asset Management (subsidiary of Manulife Financial), 2010 to 2011. Executive Vice President – Investment Management Services, John Hancock Financial Services (subsidiary of Manulife Financial), 2003 to 2010. | ||
Monica Walker (Born: 1958) | Trustee (since 2022) | Retired since 2017. Co-Founder, Chairman, Chief Executive Officer and Chief Investment Officer, Holland Capital Management, LLC from 1991 to 2017. | ||
OFFICERS
| ||||
Michael Beattie (Born: 1965) | President (since 2011) | Director of Client Service, SEI Investments, since 2004. | ||
| 1 | Each Trustee shall hold office during the lifetime of this Trust until the election and qualification of his or her successor, or until he or she sooner dies, resigns, or is removed in accordance with the Trust’s Declaration of Trust. |
| 2 | Directorships of Companies required to report to the Securities and Exchange Commission under the Securities Exchange Act of 1934 (i.e., “public companies”) or other investment companies under the 1940 Act. |
| 3 | Trustees oversee 28 funds in The Advisors’ Inner Circle Fund. |
36
| The Advisors’ Inner Circle Fund | RHJ FUNDS October 31, 2022
|
Other Directorships
Held in the Past Five Years2
Current Directorships: Trustee of The Advisors’ Inner Circle Fund II, Bishop Street Funds and Catholic Responsible Investments Funds. Director of RQSI GAA Systematic Global Macro Fund Ltd.
Current Directorships: Trustee of The Advisors’ Inner Circle Fund II, Bishop Street Funds, Frost Family of Funds, and Catholic Responsible Investments Funds. Director of RQSI GAA Systematic Global Macro Fund Ltd.
Former Directorships: Director of The Korea Fund, Inc. to 2019. Trustee of The KP Funds to 2022.
Current Directorships: Trustee of The Advisors’ Inner Circle Fund II, Bishop Street Funds, Catholic Responsible Investments Funds, SEI Asset Allocation Trust, SEI Daily Income Trust, SEI Institutional International Trust, SEI Institutional Managed Trust, SEI Institutional Investments Trust, SEI Tax Exempt Trust, Adviser Managed Trust, New Covenant Funds, SEI Insurance Products Trust and SEI Catholic Values Trust. Director of Federal Agricultural Mortgage Corporation (Farmer Mac) since 1997 and RQSI GAA Systematic Global Macro Fund Ltd.
Former Directorships: Trustee of The KP Funds to 2022.
Current Directorships: Trustee of The Advisors’ Inner Circle Fund II, Bishop Street Funds, and Catholic Responsible Investments Funds. Director of RQSI GAA Systematic Global Macro Fund Ltd.
Former Directorships: Trustee of The KP Funds to 2022.
Current Directorships: Trustee of The Advisors’ Inner Circle Fund II, Bishop Street Funds, Frost Family of Funds and Catholic Responsible Investments Funds. Director of RQSI GAA Systematic Global Macro Fund Ltd.
Former Directorships: Trustee of Villanova University Alumni Board of Directors to 2018. Trustee of The KP Funds to 2022.
Current Directorships: Trustee of The Advisors’ Inner Circle Fund II, Bishop Street Funds, Frost Family of Funds and Catholic Responsible Investments Funds. Director of Stone Harbor Investments Funds (8 Portfolios), Stone Harbor Emerging Markets Income Fund (closed-end fund) and Stone Harbor Emerging Markets Total Income Fund (closed-end fund). Director of RQSI GAA Systematic Global Macro Fund Ltd.
Former Directorships: Trustee of The KP Funds to 2022.
Current Directorships: Trustee of The Advisors’ Inner Circle Fund II, Bishop Street Funds and Catholic Responsible Investments Funds. Director of RQSI GAA Systematic Global Macro Fund Ltd.
None.
37
| The Advisors’ Inner Circle Fund | RHJ FUNDS October 31, 2022
|
Name and Year of Birth | Position with Trust and Length of Time Served | Principal Occupations in the Past Five Years | ||
OFFICERS (continued)
| ||||
James Bernstein (Born: 1962) | Vice President and Assistant Secretary (since 2017) | Attorney, SEI Investments, since 2017.
Prior Positions: Self-employed consultant, 2017. Associate General Counsel & Vice President, Nationwide Funds Group and Nationwide Mutual Insurance Company, from 2002 to 2016. Assistant General Counsel & Vice President, Market Street Funds and Provident Mutual Insurance Company, from 1999 to 2002.
| ||
John Bourgeois (Born: 1973) | Assistant Treasurer (since 2017) | Fund Accounting Manager, SEI Investments, since 2000. | ||
Eric C. Griffith (Born: 1969) | Vice President and Assistant Secretary (since 2019) | Counsel at SEI Investments since 2019. Vice President and Assistant General Counsel, JPMorgan Chase & Co., from 2012 to 2018. | ||
Matthew M. Maher (Born: 1975) | Vice President
Secretary | Counsel at SEI Investments since 2018. Attorney, Blank Rome LLP, from 2015 to 2018. Assistant Counsel & Vice President, Bank of New York Mellon, from 2013 to 2014. Attorney, Dilworth Paxson LLP, from 2006 to 2013. | ||
Andrew Metzger (Born: 1980) | Treasurer, Controller and Chief Financial Officer (since 2021) | Director of Fund Accounting, SEI Investments, since 2020. Senior Director, Embark, from 2019 to 2020. Senior Manager, PricewaterhouseCoopers LLP, from 2002 to 2019. | ||
38
| The Advisors’ Inner Circle Fund | RHJ FUNDS October 31, 2022
|
Other Directorships
Held in the Past Five Years
None.
None.
None.
None.
None.
39
| The Advisors’ Inner Circle Fund | RHJ FUNDS October 31, 2022
|
Name and Year of Birth | Position with Trust and Length of Time Served | Principal Occupation in the Past Five Years | ||
OFFICERS (continued) | ||||
Robert Morrow (Born: 1968) | Vice President (since 2017) | Account Manager, SEI Investments, since 2007. | ||
Stephen F. Panner (Born: 1970) | Chief Compliance Officer (since 2022) | Chief Compliance Officer of SEI Asset Allocation Trust, SEI Daily Income Trust, SEl Institutional Investments Trust. SEI Institutional International Trust, SEI Institutional Managed Trust, SEl Tax Exempt Trust, Adviser Managed Trust, New Covenant Funds, SEl Catholic Values Trust, SEI Exchange Traded Funds, SEI Structured Credit Fund LP, The Advisors’ Inner Circle Fund, The Advisors Inner Circle Fund I. The Advisors Inner Circle Fund Ill, Bishop Street Funds, Frost Family of Funds, Gallery Trust, Delaware Wilshire Private Markets Fund, Delaware Wilshire Private Markets Master Fund, Delaware Wilshire Private Markets Tender Fund and Catholic Responsible Investments Funds since September 2022. Fund Compliance Officer of SEI Investments Company from February 2011 to September 2022. Fund Accounting Director and CFO and Controller for the SEI Funds from July 2005 to February 2011 | ||
Alexander F. Smith (Born: 1977) | Vice President and Assistant Secretary (since 2020) | Counsel at SEI Investments since 2020. Associate Counsel & Manager, Vanguard, 2012 to 2020. Attorney, Stradley Ronon Stevens & Young, LLP, 2008 to 2012. | ||
Bridget E. Sudall (Born: 1980) | Privacy Officer
Anti-Money Laundering Officer | Senior Associate and AML Officer, Morgan Stanley Alternative Investment Partners, from 2011 to 2015. Investor Services Team Lead, Morgan Stanley Alternative Investment Partners, from 2007 to 2011. | ||
40
| The Advisors’ Inner Circle Fund | RHJ FUNDS October 31, 2022
|
Other Directorships
Held in the Past Five Years
None.
None.
None.
None.
41
| The Advisors’ Inner Circle Fund | RHJ FUNDS October 31, 2022
|
BOARD CONSIDERATIONS IN RE-APPROVING THE INVESTMENT ADVISORY AGREEMENT (Unaudited) |
Pursuant to Section 15 of the Investment Company Act of 1940 (the “1940 Act”), the Funds’ advisory agreement (the “Agreement”) must be renewed at least annually after its initial two-year term: (i) by the vote of the Board of Trustees (the “Board” or the “Trustees”) of The Advisors’ Inner Circle Fund (the “Trust”) or by a vote of a majority of the shareholders of the Funds; and (ii) by the vote of a majority of the Trustees who are not parties to the Agreement or “interested persons” of any party thereto, as defined in the 1940 Act (the “Independent Trustees”), cast in person at a meeting called for the purpose of voting on such renewal.
A Board meeting was held on May 22-23, 2022 to decide whether to renew the Agreement for an additional one-year term. In preparation for the meeting, the Trustees requested that the Adviser furnish information necessary to evaluate the terms of the Agreement. Prior to the meeting, the Independent Trustees of the Funds met to review and discuss the information provided and submitted a request for additional information to the Adviser, and information was provided in response to this request. The Trustees used this information, as well as other information that the Adviser and other service providers of the Funds presented or submitted to the Board at the meeting and other meetings held during the prior year, to help them decide whether to renew the Agreement for an additional year.
Specifically, the Board requested and received written materials from the Adviser and other service providers of the Funds regarding: (i) the nature, extent and quality of the Adviser’s services; (ii) the Adviser’s investment management personnel; (iii) the Adviser’s operations and financial condition; (iv) the Adviser’s brokerage practices (including any soft dollar arrangements) and investment strategies; (v) the Funds’ advisory fees paid to the Adviser and overall fees and operating expenses compared with peer groups of mutual funds; (vi) the level of the Adviser’s profitability from its relationship with the Funds, including both direct and indirect benefits accruing to the Adviser and its affiliates; (vii) the Adviser’s potential economies of scale; (viii) the Adviser’s compliance program, including a description of material compliance matters and material compliance violations; (ix) the Adviser’s policies on and compliance procedures for personal securities transactions; and (x) the Funds’ performance compared with peer groups of mutual funds and the Funds’ benchmark indices.
Representatives from the Adviser, along with other Fund service providers, presented additional information and participated in question and answer sessions at the Board meeting to help the Trustees evaluate the Adviser’s services, fees and other aspects of the Agreement. The Independent Trustees received advice from independent counsel and met in executive sessions outside the presence of Fund management and the Adviser.
At the Board meeting, the Trustees, including all of the Independent Trustees, based on their evaluation of the information provided by the Adviser and other service providers of the Funds, renewed the Agreement. In considering the renewal of
42
| The Advisors’ Inner Circle Fund | RHJ FUNDS October 31, 2022
|
the Agreement, the Board considered various factors that they determined were relevant, including: (i) the nature, extent and quality of the services provided by the Adviser; (ii) the investment performance of the Funds and the Adviser; (iii) the costs of the services provided and profits realized by the Adviser from its relationship with the Funds, including both direct and indirect benefits accruing to the Adviser and its affiliates; (iv) the extent to which economies of scale are being realized by the Adviser; and (v) whether fee levels reflect such economies of scale for the benefit of Fund investors, as discussed in further detail below.
Nature, Extent and Quality of Services Provided by the Adviser
In considering the nature, extent and quality of the services provided by the Adviser, the Board reviewed the portfolio management services provided by the Adviser to the Funds, including the quality and continuity of the Adviser’s portfolio management personnel, the resources of the Adviser, and the Adviser’s compliance history and compliance program. The Trustees reviewed the terms of the Agreement. The Trustees also reviewed the Adviser’s investment and risk management approaches for the Funds. The most recent investment adviser registration form (“Form ADV”) for the Adviser was available to the Board, as was the response of the Adviser to a detailed series of questions which included, among other things, information about the investment advisory services provided by the Adviser to the Funds.
The Trustees also considered other services provided to the Funds by the Adviser such as selecting broker-dealers for executing portfolio transactions, monitoring adherence to the Funds’ investment restrictions, and monitoring compliance with various Fund policies and procedures and with applicable securities laws and regulations. Based on the factors above, as well as those discussed below, the Board concluded, within the context of its full deliberations, that the nature, extent and quality of the services provided to the Funds by the Adviser were sufficient to support renewal of the Agreement.
Investment Performance of the Funds and the Adviser
The Board was provided with regular reports regarding the Funds’ performance over various time periods. The Trustees also reviewed reports prepared by the Funds’ administrator comparing the Funds’ performance to their benchmark indices and peer groups of mutual funds as classified by Lipper, an independent provider of investment company data, over various periods of time. Representatives from the Adviser provided information regarding and led discussions of factors impacting the performance of the Funds, outlining current market conditions and explaining their expectations and strategies for the future. The Trustees determined that the Funds’ performance was satisfactory, or, where the Funds’ performance was materially below their benchmarks and/or peer groups, the Trustees were satisfied by the reasons for the underperformance and/or the steps taken by the Adviser in an effort to improve the performance of the Funds. Based on this information, the Board concluded, within the context of its full deliberations, that the investment results that the Adviser
43
| The Advisors’ Inner Circle Fund | RHJ FUNDS October 31, 2022
|
had been able to achieve for the Funds were sufficient to support renewal of the Agreement.
Costs of Advisory Services, Profitability and Economies of Scale
In considering the advisory fees payable by the Funds to the Adviser, the Trustees reviewed, among other things, a report of the advisory fees paid to the Adviser. The Trustees also reviewed reports prepared by the Funds’ administrator comparing the Funds’ net and gross expense ratios and advisory fees to those paid by peer groups of mutual funds as classified by Lipper. The Trustees reviewed the management fees charged by the Adviser to other clients with comparable mandates. The Trustees considered any differences in management fees and took into account the respective demands, resources and complexity associated with the Funds and other client accounts as well as the extensive regulatory, compliance and tax regimes to which the Funds are subject. The Board concluded, within the context of its full deliberations, that the advisory fees were reasonable in light of the nature and quality of the services rendered by the Adviser.
The Trustees reviewed the costs of services provided by and the profits realized by the Adviser from its relationship with the Funds, including both direct benefits and indirect benefits, such as research and brokerage services received under soft dollar arrangements, accruing to the Adviser and its affiliates. The Trustees considered how the Adviser’s profitability was affected by factors such as its organizational structure and method for allocating expenses. The Trustees concluded that the profit margins of the Adviser with respect to the management of the Funds were not unreasonable. The Board also considered the Adviser’s commitment to managing the Funds and its willingness to continue its expense limitation and fee waiver arrangements with the Funds.
The Trustees considered the Adviser’s views relating to economies of scale in connection with the Funds as Fund assets grow and the extent to which the benefits of any such economies of scale are shared with the Funds and Fund shareholders. The Board considered the existence of any economies of scale and whether those were passed along to the Funds’ shareholders through a graduated advisory fee schedule or other means, including fee waivers. The Trustees recognized that economies of scale are difficult to identify and quantify and are rarely identifiable on a fund-by-fund basis. Based on this evaluation, the Board concluded that the advisory fee was reasonable in light of the information that was provided to the Trustees by the Adviser with respect to economies of scale.
Renewal of the Agreement
Based on the Board’s deliberations and its evaluation of the information described above and other factors and information it believed relevant in the exercise of its reasonable business judgment, the Board, including all of the Independent Trustees, with the assistance of Fund counsel and Independent Trustees’ counsel, unanimously
44
| The Advisors’ Inner Circle Fund | RHJ FUNDS October 31, 2022
|
concluded that the terms of the Agreement, including the fees payable thereunder, were fair and reasonable and agreed to renew the Agreement for another year. In its deliberations, the Board did not identify any absence of information as material to its decision, or any particular factor (or conclusion with respect thereto) or single piece of information that was all-important, controlling or determinative of its decision, but considered all of the factors together, and each Trustee may have attributed different weights to the various factors (and conclusions with respect thereto) and information.
45
| The Advisors’ Inner Circle Fund | RHJ FUNDS October 31, 2022
|
|
Pursuant to Rule 22e-4 under the 1940 Act, the Funds’ investment adviser has adopted, and the Board has approved, a liquidity risk management program (the “Program”) to govern the Funds’ approach to managing liquidity risk. The Program is overseen by the Funds’ Liquidity Risk Management Program Administrator (the “Program Administrator”), and the Program’s principal objectives include assessing, managing and periodically reviewing each Fund’s liquidity risk, based on factors specific to the circumstances of the Funds.
At a meeting of the Board held on May 24, 2022, the Trustees received a report from the Program Administrator addressing the operations of the Program and assessing its adequacy and effectiveness of implementation for the period from January 1, 2021 through December 31, 2021. The Program Administrator’s report included an assessment of how market conditions caused by the COVID-19 pandemic impacted the Funds’ liquidity risk during the period covered by the report. The Program Administrator’s report noted that the Program Administrator had determined that the Program is reasonably designed to assess and manage each Fund’s liquidity risk and has operated adequately and effectively to manage each Fund’s liquidity risk during the period covered by the report. The Program Administrator’s report noted that during the period covered by the report, there were no liquidity events that impacted the Funds or their ability to timely meet redemptions without dilution to existing shareholders. The Program Administrator’s report also noted that the Board approved a change to the membership of the committee serving as Program Administrator. The Program Administrator’s report further noted that no material changes have been made to the Program during the period covered by the report.
There can be no assurance that the Program will achieve its objectives in the future. Please refer to the prospectus for more information regarding a Fund’s exposure to liquidity risk and other principal risks to which an investment in the Funds may be subject.
46
| The Advisors’ Inner Circle Fund | RHJ FUNDS October 31, 2022
|
|
For shareholders that do not have an October 31, 2022 tax year end, this notice is for informational purposes only. For shareholders with an October 31, 2022 tax year end, please consult your tax advisor as to the pertinence of this notice. For the fiscal year ended October 31, 2022, the Fund is designating the following items with regard to distributions paid during the year.
| Return of Capital | Ordinary Income Distribution | Long-Term Capital Gain Distributions | Total Distributions | Qualifying for Corporate Dividends Received Deduction (1) | Qualifying Dividend Income (2) | Short-term Capital Gain Dividends (3) | ||||||||
Small Cap Portfolio | 0.00% | 0.00% | 100.00% | 100.00% | 0.00% | 0.00% | 0.00% | |||||||
Micro Cap Portfolio | 0.00% | 10.68% | 89.32% | 100.00% | 0.00% | 0.00% | 100.00% |
| (1) | Qualifying dividends represent dividends which qualify for the corporate dividends received deduction and is reflected as a percentage of ordinary Income distributions (the total of short-term capital gain and net investment income distributions). |
| (2) | The percentage in this column represents the amount of “Qualifying Dividend Income” as created by the Jobs and Growth Tax Relief Reconciliation Act of 2003 and is reflected as a percentage of ordinary income distributions (the total of short-term capital gain and net investment income distributions). It is the intention of each of the aforementioned funds to designate the maximum amount permitted by law. |
| (3) | The percentage of this column represents the amount of “Short-Term Capital Gain Dividends” and is reflected as a percentage of short- term capital gain distribution that is exempt from U.S. withholding tax when paid to foreign investors. |
The information reported herein may differ from the information and distributions taxable to the shareholder for the calendar year ending December 31, 2022. Complete information will be computed and reported with your 2022 Form 1099-DIV.
47
This page intentionally left blank.
This page intentionally left blank.
The Rice Hall James Funds
P.O. Box 219009
Kansas City, MO 64121
866-474-5669
www.rhjfunds.com
Adviser:
Rice Hall James & Associates, LLC
600 West Broadway, Suite 1000
San Diego, CA 92101
Distributor:
SEI Investments Distribution Co.
One Freedom Valley Drive
Oaks, PA 19456
Administrator:
SEI Investments Global Funds Services
One Freedom Valley Drive
Oaks, PA 19456
Legal Counsel:
Morgan, Lewis & Bockius LLP
1701 Market Street
Philadelphia, PA 19103
This information must be preceded or accompanied by a current
prospectus for the Funds described.
RHJ-AR-001-2100
| Item 2. | Code of Ethics. |
The Registrant (also referred to as the “Trust”) has adopted a code of ethics that applies to the Registrant’s principal executive officer, principal financial officer, controller or principal accounting officer, and any person who performs a similar function. There have been no amendments to or waivers granted to this code of ethics during the period covered by this report.
| Item 3. | Audit Committee Financial Expert. |
(a)(1) The Registrant’s board of trustees has determined that the Registrant has at least one audit committee financial expert serving on the audit committee.
(a)(2) The audit committee financial expert is Robert Mulhall. Mr. Mulhall is considered to be “independent,” as that term is defined in Form N-CSR Item 3(a)(2).
| Item 4. | Principal Accountant Fees and Services. |
Fees billed by PricewaterhouseCoopers LLP (“PwC”) relate to The Advisors’ Inner Circle Fund (the “Trust”).
PwC billed the Trust aggregate fees for services rendered to the Trust for the last two fiscal years as follows:
| 2022 | 2021 | |||||||||||||
All fees and services to approved | All fees and approved | All other approval | All fees and approved | All fees and approved | All other approval | |||||||||
(a) | Audit Fees(1) | $72,710 | None | None | $104,400 | None | None | |||||||
(b) | Audit-Related Fees | None | None | None | None | None | None | |||||||
(c) | Tax Fees | $10,000(2) | None | $256,295(4) | $10,000(2) | None | $150,670(4) | |||||||
(d) | All Other Fees | None | None | $86,500(5) | None | None | $385,179(5) | |||||||
Fees billed by Ernst & Young LLP (“E&Y”) related to the Trust
E&Y billed the Trust aggregate fees for services rendered to the Trust for the last two fiscal years as follows:
| 2022 | 2021 | |||||||||||||
All fees and services to the Trust that approved | All fees and services to service affiliates that were pre- approved | All other fees and services to service affiliates that did not require pre- approval | All fees and services to the Trust that were pre- approved | All fees and services to service pre- approved | All other fees and services to service affiliates require pre- approval | |||||||||
(a) | Audit Fees(1) | $529,590 | None | None | $719,590 | None | None | |||||||
(b) | Audit-Related Fees | $10,000(6) | None | None | None | None | None | |||||||
(c) | Tax Fees | $2,000(3) | None | None | None | None | None | |||||||
(d) | All Other Fees | None | None | None | None | None | None | |||||||
Fees billed by BBD, LLP (“BBD”) related to the Trust
BBD billed the Trust aggregate fees for services rendered to the Trust for the last two fiscal years as follows:
| 2022 | 2021 | |||||||||||||
All fees and services to the Trust that were pre- approved | All fees and services to service affiliates that were approved | All other fees and services to service affiliates that did not require pre- approval | All fees and services to the Trust that were pre- approved | All fees and services to service affiliates that were pre- approved | All other fees and services to service affiliates that did not require pre- approval | |||||||||
(a) | Audit Fees(1) | $61,000 | None | None | $77,300 | None | None | |||||||
(b) | Audit-Related Fees | None | None | None | None | None | None | |||||||
(c) | Tax Fees | None | None | None | None | None | None | |||||||
(d) | All Other Fees | None | None | None | None | None | None | |||||||
Notes:
| (1) | Audit fees include amounts related to the audit of the Trust’s annual financial statements and services normally provided by the accountant in connection with statutory and regulatory filings. |
| (2) | Final tax compliance services provided to McKee International Equity Portfolio. |
| (3) | Common Reporting Standard (“CRS”) tax services for the Sands Capital Global Growth Fund. |
| (4) | Tax compliance services provided to service affiliates of the funds. |
| (5) | Non-audit assurance engagements for service affiliates of the funds. |
| (6) | Fees related to consents for Cambiar N-14 filings. |
(e)(1) The Trust’s Audit Committee has adopted and the Board of Trustees has ratified an Audit and Non-Audit Services Pre-Approval Policy (the “Policy”), which sets forth the procedures and the conditions pursuant to which services proposed to be performed by the independent auditor of the Funds may be pre-approved.
The Policy provides that all requests or applications for proposed services to be provided by the independent auditor must be submitted to the Registrant’s Chief Financial Officer (“CFO”) and must include a detailed description of the services proposed to be rendered. The CFO will determine whether such services:
| 1. | require specific pre-approval; |
| 2. | are included within the list of services that have received the general pre-approval of the Audit Committee pursuant to the Policy; or |
| 3. | have been previously pre-approved in connection with the independent auditor’s annual engagement letter for the applicable year or otherwise. In any instance where services require pre-approval, the Audit Committee will consider whether such services are consistent with SEC’s rules and whether the provision of such services would impair the auditor’s independence. |
Requests or applications to provide services that require specific pre-approval by the Audit Committee will be submitted to the Audit Committee by the CFO. The Audit Committee will be informed by the CFO on a quarterly basis of all services rendered by the independent auditor. The Audit Committee has delegated specific pre-approval authority to either the Audit Committee Chair or financial expert, provided that the estimated fee for any such proposed pre-approved service does not exceed $100,000 and any pre-approval decisions are reported to the Audit Committee at its next regularly-scheduled meeting.
Services that have received the general pre-approval of the Audit Committee are identified and described in the Policy. In addition, the Policy sets forth a maximum fee per engagement with respect to each identified service that has received general pre-approval.
All services to be provided by the independent auditor shall be provided pursuant to a signed written engagement letter with the Registrant, the investment adviser, or applicable control affiliate (except that matters as to which an engagement letter would be impractical because of timing issues or because the matter is small may not be the subject of an engagement letter) that sets forth both the services to be provided by the independent auditor and the total fees to be paid to the independent auditor for those services.
In addition, the Audit Committee has determined to take additional measures on an annual basis to meet the Audit Committee’s responsibility to oversee the work of the independent auditor and to assure the auditor’s independence from the Registrant, such as (a) reviewing a formal written statement from the independent auditor delineating all relationships between the independent auditor and the Registrant, and (b) discussing with the independent auditor the independent auditor’s methods and procedures for ensuring independence.
(e)(2) Percentage of fees billed applicable to non-audit services pursuant to waiver of pre-approval requirement were as follows (PwC):
| 2022 | 2021 | |||
Audit-Related Fees
| None
| None
| ||
Tax Fees
| None
| None
| ||
All Other Fees
| None
| None
|
(e)(2) Percentage of fees billed applicable to non-audit services pursuant to waiver of pre-approval requirement were as follows (E&Y):
| 2022 | 2021 | |||
Audit-Related Fees
| None
| None
| ||
Tax Fees
| None
| None
| ||
All Other Fees
| None
| None
|
(e)(2) Percentage of fees billed applicable to non-audit services pursuant to waiver of pre-approval requirement were as follows (BBD):
| 2022 | 2021 | |||
Audit-Related Fees
| None
| None
| ||
Tax Fees
| None
| None
| ||
All Other Fees
| None
| None
|
(f) Not applicable.
(g) The aggregate non-audit fees and services billed by PwC for services rendered to the Registrant, and rendered to the Registrant’s investment adviser (not including any sub-adviser whose role is primarily portfolio management and is subcontracted with or overseen by another investment adviser), and any entity controlling, controlled by, or under common control with the adviser that provides ongoing services to the Registrant for the last two fiscal-years-ended October 31st were $342,795 and $535,849 for 2022 and 2021, respectively.
(g) The aggregate non-audit fees and services billed by E&Y for services rendered to the Registrant, and rendered to the Registrant’s investment adviser (not including any sub-adviser whose role is primarily portfolio management and is subcontracted with or overseen by another investment adviser), and any entity controlling, controlled by, or under common control with the
adviser that provides ongoing services to the Registrant for the last two fiscal-years-ended October 31st were $2,000 and $0 for 2022 and 2021, respectively.
(g) The aggregate non-audit fees and services billed by BBD for services rendered to the Registrant, and rendered to the Registrant’s investment adviser (not including any sub-adviser whose role is primarily portfolio management and is subcontracted with or overseen by another investment adviser), and any entity controlling, controlled by, or under common control with the adviser that provides ongoing services to the Registrant for the last two fiscal-years-ended October 31st were $0 and $0 for 2022 and 2021, respectively.
(h) During the past fiscal year, all non-audit services provided by the Registrant’s principal accountant to either the Registrant’s investment adviser or to any entity controlling, controlled by, or under common control with the Registrant’s investment adviser that provides ongoing services to the Registrant were pre-approved by the Audit Committee of Registrant’s Board of Trustees. Included in the Audit Committee’s pre-approval of these non-audit service were the review and consideration as to whether the provision of these non-audit services is compatible with maintaining the principal accountant’s independence.
(i) Not applicable. The Registrant has not retained, for the preparation of the audit report on the financial statements included in the Form N-CSR, a registered public accounting firm that has a branch or office that is located in a foreign jurisdiction and that the Public Company Accounting Oversight Board (the “PCAOB”) has determined that the PCAOB is unable to inspect or investigate completely because of a position taken by an authority in the foreign jurisdiction.
(j) Not applicable. The Registrant is not a “foreign issuer,” as defined in 17 CFR 240.3b-4.
| Item 5. | Audit Committee of Listed Registrants. |
Not applicable to open-end management investment companies.
| Item 6. | Schedule of Investments. |
Schedule of Investments is included as part of the Report to Shareholders filed under Item 1 of this form.
| Item 7. | Disclosure of Proxy Voting Policies and Procedures for Closed-End Management Investment Companies. |
Not applicable to open-end management investment companies.
| Item 8. | Portfolio Managers of Closed-End Management Investment Companies |
Not applicable to open-end management investment companies.
| Item 9. | Purchases of Equity Securities by Closed-End Management Company and Affiliated Purchasers. |
Not applicable to open-end management investment companies.
| Item 10. | Submission of Matters to a Vote of Security Holders. |
There have been no changes to the procedures by which shareholders may recommend nominees to the Registrant’s Board of Trustees during the period covered by this report.
| Item 11. | Controls and Procedures. |
(a) The Registrant’s principal executive and principal financial officers, or persons performing similar functions, have concluded that the Registrant’s disclosure controls and procedures, as defined in Rule 30a-3(c) under the Act (17 CFR § 270.30a-3(c)), as of a date within 90 days of the filing date of the report, are effective based on the evaluation of these controls and procedures required by Rule 30a-3(b) under the Act (17 CFR § 270.30a-3(b)) and Rule 13a-15(b) or Rule 15d-15(b) under the Exchange Act, as amended (17 CFR § 240.13a-15(b) or § 240.15d-15(b)).
(b) There has been no change in the Registrant’s internal control over financial reporting (as defined in Rule 30a-3(d) under the Act (17 CFR § 270.3a-3(d)) that occurred during the period covered by this report that has materially affected, or is reasonably likely to materially affect, the Registrant’s internal control over financial reporting.
| Item 12. | Disclosure of Securities Lending Activities for Closed-End Management Investment Companies. |
Not applicable to open-end management investment companies.
| Item 13. | Exhibits. |
SIGNATURES
Pursuant to the requirements of the Securities Exchange Act of 1934 and the Investment Company Act of 1940, the Registrant has duly caused this report to be signed on its behalf by the undersigned, thereunto duly authorized.
| (Registrant) | The Advisors’ Inner Circle Fund | |||||
By (Signature and Title) | /s/ Michael Beattie | |||||
| Michael Beattie, President | ||||||
Date: January 6, 2023
Pursuant to the requirements of the Securities Exchange Act of 1934 and the Investment Company Act of 1940, this report has been signed below by the following persons on behalf of the Registrant and in the capacities and on the dates indicated.
By (Signature and Title) | /s/ Michael Beattie | |||||
| Michael Beattie, President | ||||||
| Date: January 6, 2023 | ||||||
By (Signature and Title) | /s/ Andrew Metzger | |||||
| Andrew Metzger, | ||||||
| Treasurer, Controller, and CFO | ||||||
| Date: January 6, 2023 | ||||||