Exhibit 99.1

Enabling the Wireless Future May 15, 2019
Safe Harbor Statement This presentation contains “forward - looking statements” within the meaning of Section 27 A of the Securities Act of 1933 , as amended, and Section 21 E of the Securities Exchange Act of 1934 , as amended . In some cases, such forward - looking statements may be identified by terms such as believe, expect, seek, may, will, intend, project, anticipate, plan, estimate, guidance or similar words . Forward - looking statements include, among others, long term targets for revenue growth, gross margin, adjusted EBITDA margin, and future addressable markets . Investors are cautioned that any such forward - looking statements are not guarantees of future performance and involve a number of risks and uncertainties that could materially affect actual results, including, among others, the ability of management to successfully implement the Company’s business plan and strategy ; the loss of any significant customers of the Company ; the Company’s ability to acquire accretive businesses and successfully integrate acquired businesses ; product demand and development of competitive technologies in the Company’s market sector ; the ability of the Company to grow addressable markets ; the impact of competitive products and pricing ; and other risks and uncertainties set forth in the Company’s Annual Report on Form 10 - K for the year ended December 31 , 2018 . These forward - looking statements speak only as of the date of this presentation and the Company does not undertake any obligation to update or revise any forward - looking information to reflect changes in assumptions, the occurrence of unanticipated events, or otherwise, as except as required by law . May 15, 2019 2
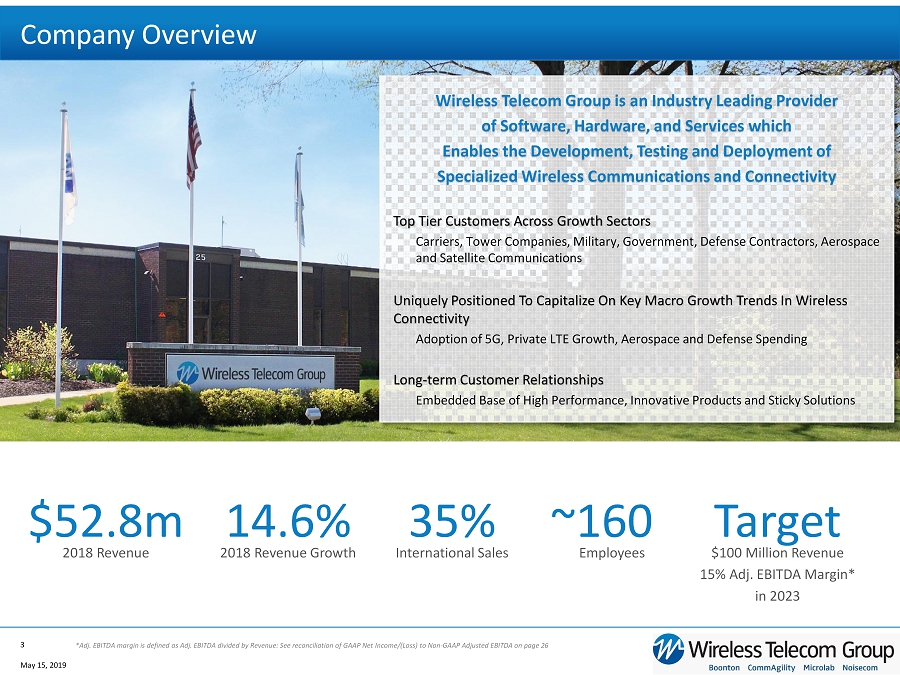
Company Overview May 15, 2019 3 Wireless Telecom Group i s an Industry Leading Provider of Software, Hardware, and Services which Enables the Development, Testing and Deployment of Specialized Wireless Communications and Connectivity Top Tier Customers Across Growth Sectors Carriers, Tower Companies, Military, Government, Defense Contractors, Aerospace and Satellite Communications Uniquely Positioned To Capitalize On Key Macro Growth Trends In Wireless Connectivity Adoption of 5G, Private LTE Growth, Aerospace and Defense Spending Long - term Customer Relationships Embedded Base of High Performance, Innovative Products and Sticky Solutions 35% International Sales 14.6% 2018 Revenue Growth $ 52.8m 2018 Revenue ~160 Employees Target $100 Million Revenue 15% Adj. EBITDA Margin* i n 2023 *Adj. EBITDA margin is defined as Adj. EBITDA divided by Revenue: See reconciliation of GAAP Net Income/(Loss) to Non - GAAP Adjus ted EBITDA on page 26
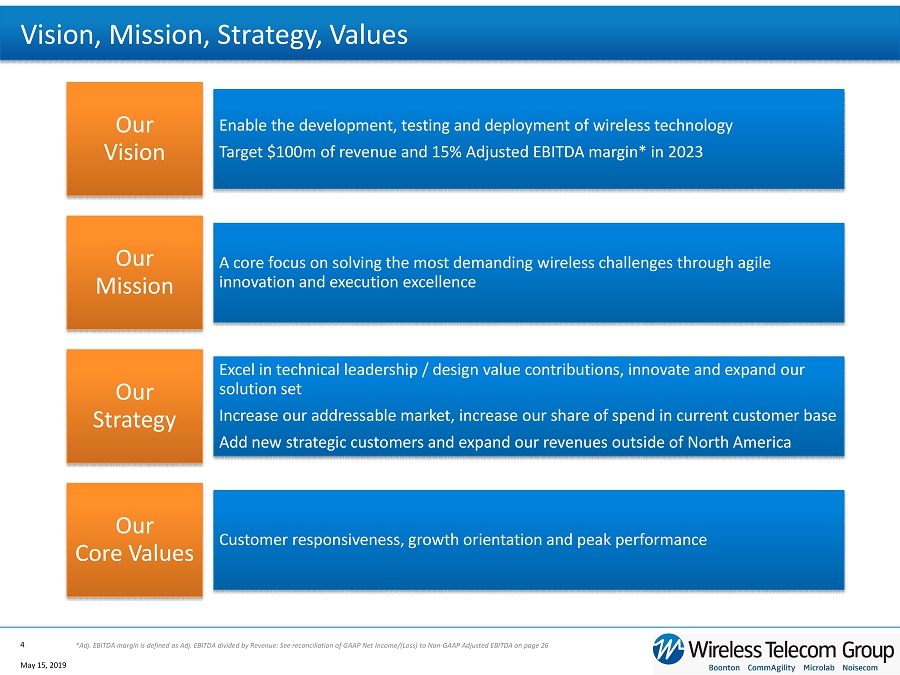
Vision, Mission, Strategy, Values May 15, 2019 4 Our Vision Enable the development, testing and deployment of wireless technology Target $100m of revenue and 15% Adjusted EBITDA margin* in 2023 Our Strategy Excel in technical leadership / design value contributions, innovate and expand our solution set Increase our addressable market, increase our share of spend in current customer base Add new strategic customers and expand our revenues outside of North America Our Mission A core focus on solving the most demanding wireless challenges through agile innovation and execution excellence Our Core Values Customer responsiveness, growth orientation and peak performance *Adj. EBITDA margin is defined as Adj. EBITDA divided by Revenue: See reconciliation of GAAP Net Income/(Loss) to Non - GAAP Adjus ted EBITDA on page 26

End - to - end customized solutions for 4G and 5G private wireless networks What We Do Components and integrated solutions enabling wireless network densification and reliable in - building coverage Specialized devices and instruments for design and test of satellite, military, and commercial wireless systems May 15, 2019 5 We go to market in 3 business segments with specialized products across the lifecycle of wireless connectivity; our solution focus is agile and customized Develop Test Deploy ▪ Software: LTE Phy stack – modifications ▪ Hardware: Embedded Signal Processing modules ▪ Peak RF power meters ▪ Real - time power sensors ▪ RF noise source for signal communication testing ▪ RF conditioning components ▪ DAS trays, splitters, combiners, filters, tappers; GPS Signal repeaters
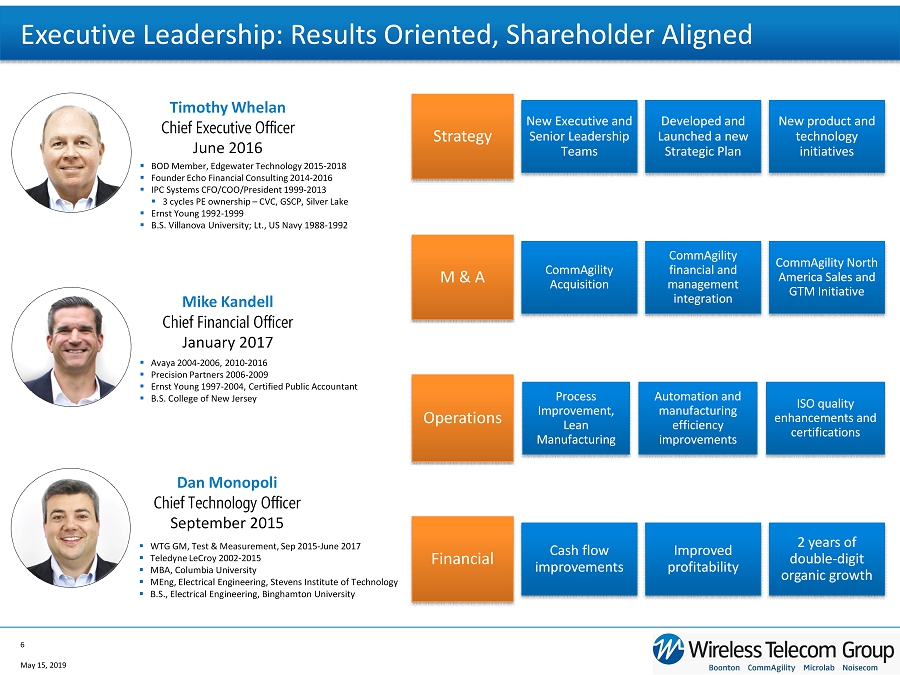
Executive Leadership: Results Oriented, Shareholder Aligned May 15, 2019 6 Dan Monopoli Chief Technology Officer September 2015 Mike Kandell Chief Financial Officer January 2017 Timothy Whelan Chief Executive Officer June 2016 Strategy New Executive and Senior Leadership Teams Developed and Launched a new Strategic Plan New product and technology initiatives M & A CommAgility Acquisition CommAgility financial and management integration CommAgility North America Sales and GTM Initiative Operations Process Improvement, Lean Manufacturing Automation and manufacturing efficiency improvements ISO quality enhancements and certifications Financial Cash flow improvements Improved profitability 2 years of double - digit organic growth ▪ BOD Member, Edgewater Technology 2015 - 2018 ▪ Founder Echo Financial Consulting 2014 - 2016 ▪ IPC Systems CFO/COO/President 1999 - 2013 ▪ 3 cycles PE ownership – CVC, GSCP, Silver Lake ▪ Ernst Young 1992 - 1999 ▪ B.S. Villanova University; Lt., US Navy 1988 - 1992 ▪ Avaya 2004 - 2006, 2010 - 2016 ▪ Precision Partners 2006 - 2009 ▪ Ernst Young 1997 - 2004, Certified Public Accountant ▪ B.S. College of New Jersey ▪ WTG GM, Test & Measurement, Sep 2015 - June 2017 ▪ Teledyne LeCroy 2002 - 2015 ▪ MBA, Columbia University ▪ MEng, Electrical Engineering, Stevens Institute of Technology ▪ B.S., Electrical Engineering, Binghamton University
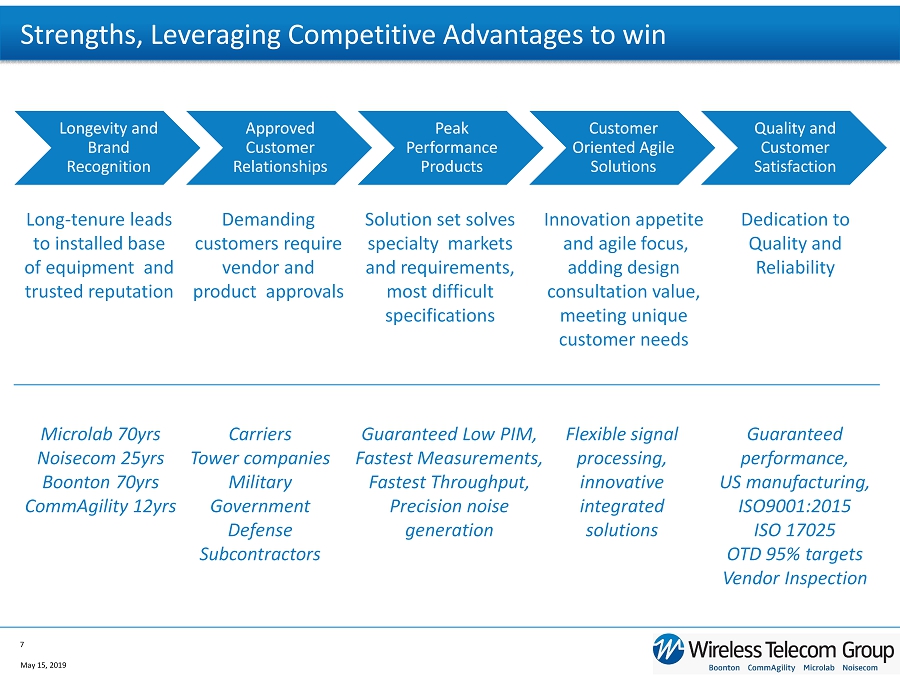
Strengths, Leveraging Competitive Advantages to win Longevity and Brand Recognition Approved Customer Relationships Peak Performance Products Customer Oriented Agile Solutions Quality and Customer Satisfaction May 15, 2019 7 Long - tenure leads to installed base of equipment and trusted reputation Demanding customers require vendor and product approvals Solution set solves specialty markets and requirements, most difficult specifications Innovation appetite and agile focus, adding design consultation value, meeting unique customer needs Dedication to Quality and Reliability Carriers Tower companies Military Government Defense Subcontractors Guaranteed Low PIM, Fastest Measurements, Fastest Throughput, Precision noise generation Flexible signal processing, innovative integrated solutions Guaranteed performance, US manufacturing, ISO9001:2015 ISO 17025 OTD 95% targets Vendor Inspection Microlab 70yrs Noisecom 25yrs Boonton 70yrs CommAgility 12yrs
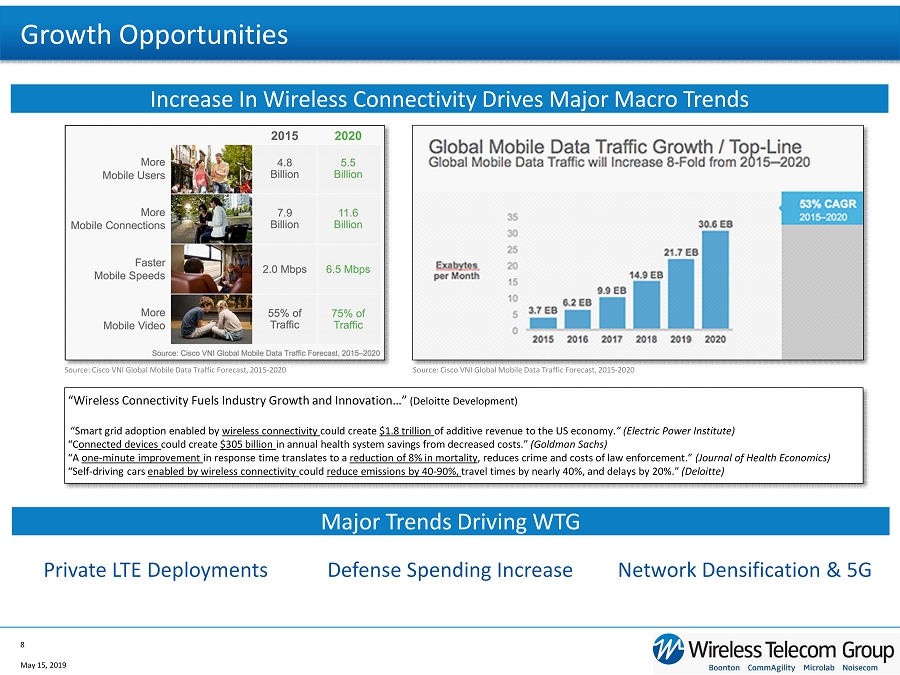
Increase In Wireless Connectivity Drives Major Macro Trends Major Trends Driving WTG Growth Opportunities May 15, 2019 8 Private LTE Deployments Defense Spending Increase Network Densification & 5G Source: Cisco VNI Global Mobile Data Traffic Forecast, 2015 - 2020 Source: Cisco VNI Global Mobile Data Traffic Forecast, 2015 - 2020 “Wireless Connectivity Fuels Industry Growth and Innovation…” (Deloitte Development) “Smart grid adoption enabled by wireless connectivity could create $1.8 trillion of additive revenue to the US economy. ” ( Electric Power Institute ) “ C onnected devices could create $305 billion in annual health system savings from decreased costs.” ( Goldman Sachs ) “ A one - minute improvement in response time translates to a reduction of 8% in mortality , reduces crime and costs of law enforcement.” (Journal of Health Economics ) “ Self - driving cars enabled by wireless connectivity could reduce emissions by 40 - 90%, travel times by nearly 40%, and delays by 20 %.” ( Deloitte )
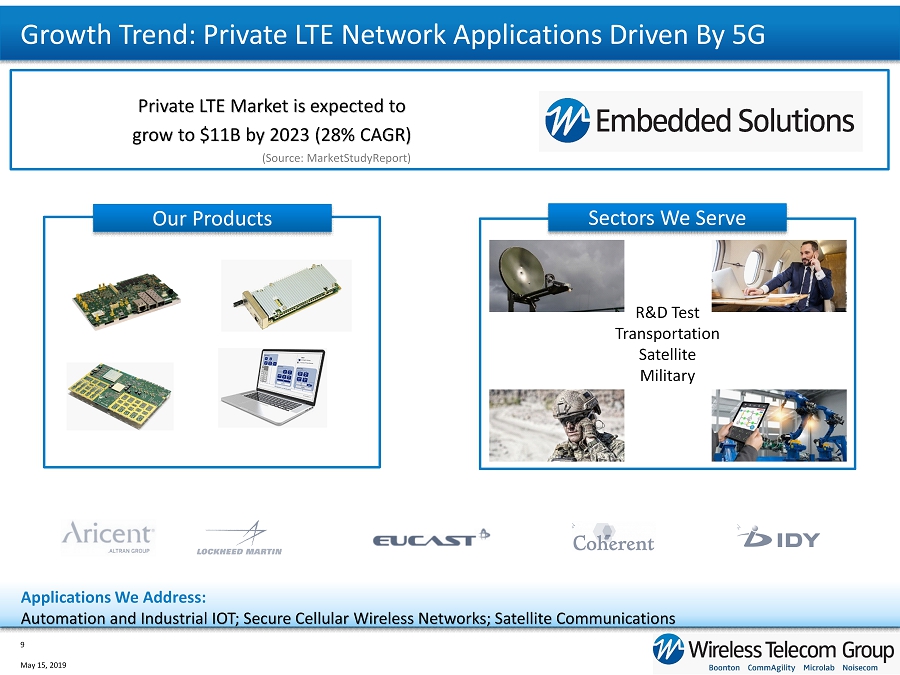
R&D Test Transportation Satellite Military Growth Trend: Private LTE Network Applications Driven By 5G Private LTE Market is expected to grow to $11B by 2023 (28% CAGR) May 15, 2019 9 Our Products Applications We Address: Automation and Industrial IOT; Secure Cellular Wireless Networks; Satellite Communications (Source: MarketStudyReport ) Sectors We Serve
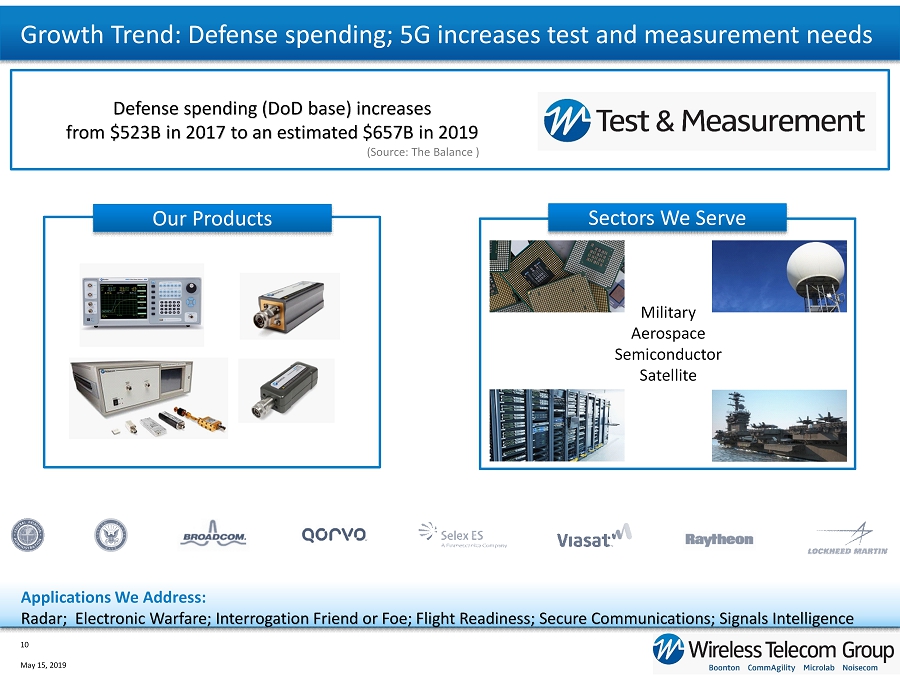
Our Products Growth Trend: Defense spending; 5G increases test and measurement needs Defense spending (DoD base) increases from $523B in 2017 to an estimated $657B in 2019 May 15, 2019 10 Applications We Address: Radar; Electronic Warfare; Interrogation Friend or Foe ; Flight Readiness ; Secure Communications ; Signals Intelligence Military Aerospace Semiconductor Satellite (Source: The Balance ) Sectors We Serve
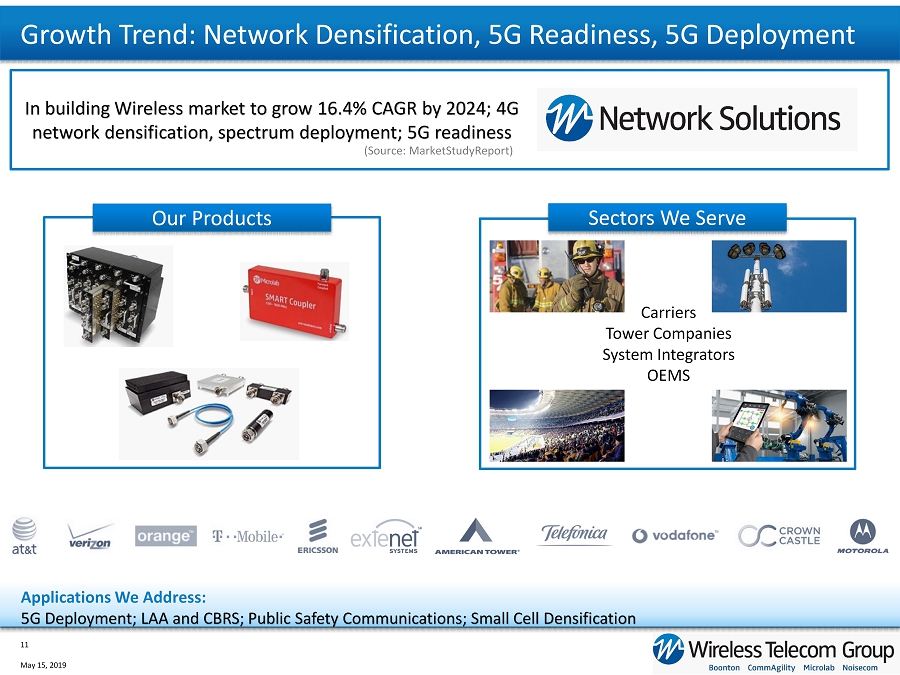
Carriers Tower Companies System Integrators OEMS Growth Trend: Network Densification, 5G Readiness, 5G Deployment In building Wireless market to grow 16.4% CAGR by 2024; 4G network densification, spectrum deployment; 5G readiness May 15, 2019 11 Our Products Applications We Address: 5G Deployment; LAA and CBRS; Public Safety Communications; Small Cell Densification (Source: MarketStudyReport ) Sectors We Serve

Company Turnaround and Building Blocks to Future Success May 15, 2019 12 Acquisition / Integration Strategy 2/17 Acquired CommAgility / Active M&A strategy Infrastructure, Product & Process Investments Customer Portal; Customer Engagement/CRM; IT/ERP; Cyber Security; Product Roadmap $33,109 $31,327 $46,078 $52,788 $377 $(1,832) $(4,493) $35 4.9% 0.0% 7.9% 9.1% 0% 5% 10% 15% -$20,000 $0 $20,000 $40,000 $60,000 2015 2016 2017 2018 Revenue Net Income / (Loss) Adj. EBITDA Margin* 2015 - 2018 Revenue/Adj. EBITDA Margin (in $000’s) Executive Team Rebuild Tim Whelan CEO Mike Kandell CFO Dan Monopoli CTO BOD Rebuild Tim Whelan Mitch Herbets Allan Weinstein, Mike Milligan Change and Improvement: Board, Executive Team, Strategy, Go - To - Market Execution *Adj. EBITDA margin is defined as Adj. EBITDA divided by Revenue: See reconciliation of GAAP Net Income/(Loss) to Non - GAAP Adjus ted EBITDA on page 26 2018 2015 2017 2016
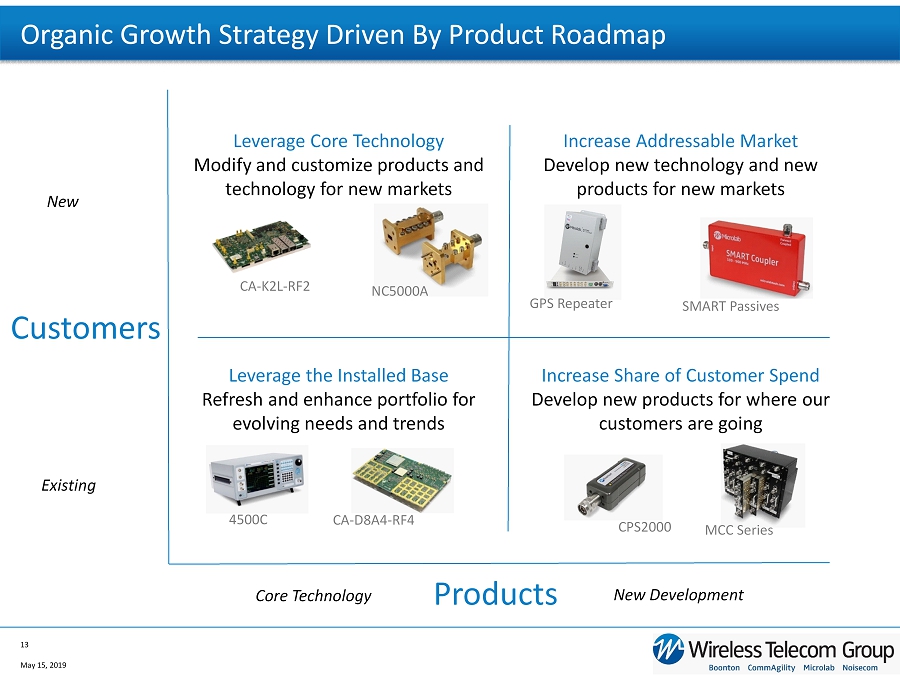
Organic Growth Strategy Driven By Product Roadmap May 15, 2019 13 Customers Products Leverage the Installed Base Refresh and enhance portfolio for evolving needs and trends Leverage Core Technology Modify and customize products and technology for new markets Increase Addressable Market Develop new technology and new products for new markets Increase Share of Customer Spend Develop new products for where our customers are going Core Technology New Development Existing New CA - K2L - RF2 NC5000A SMART Passives 4500C CA - D8A4 - RF4 MCC Series CPS2000 GPS Repeater
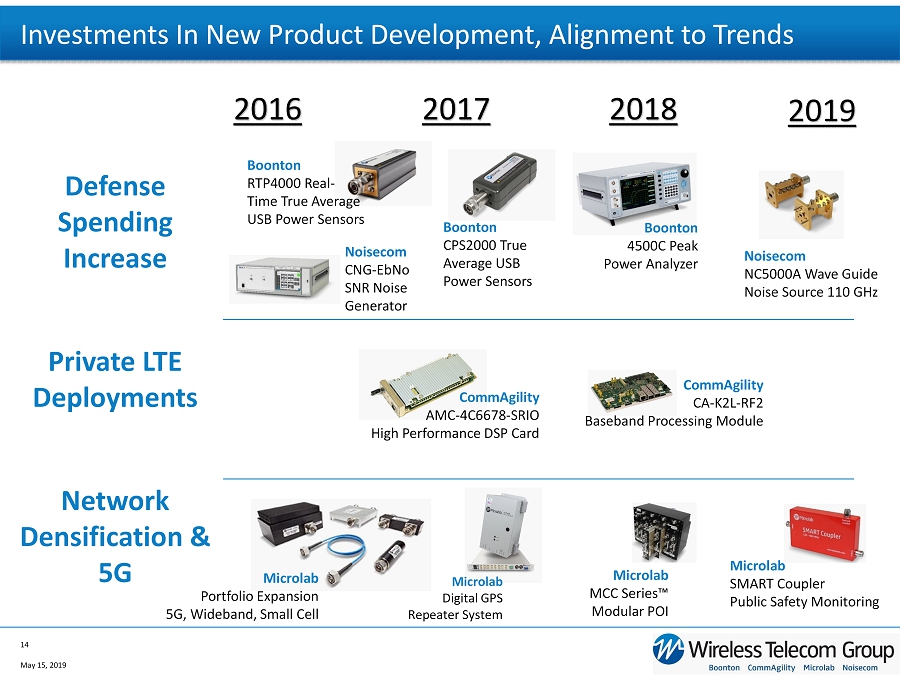
Investments In New Product Development, Alignment to Trends May 15, 2019 14 2016 2017 2019 Microlab MCC Series™ Modular POI Boonton 4500C Peak Power Analyzer Microlab SMART Coupler Public Safety Monitoring Noisecom NC5000A Wave Guide Noise Source 110 GHz CommAgility CA - K2L - RF2 Baseband Processing Module 2018 Boonton CPS2000 True Average USB Power Sensors Boonton RTP4000 Real - Time True Average USB Power Sensors Noisecom CNG - EbNo SNR Noise Generator CommAgility AMC - 4C6678 - SRIO High Performance DSP Card Private LTE Deployments Defense Spending Increase Network Densification & 5G Microlab Portfolio Expansion 5G, Wideband, Small Cell Microlab Digital GPS Repeater System
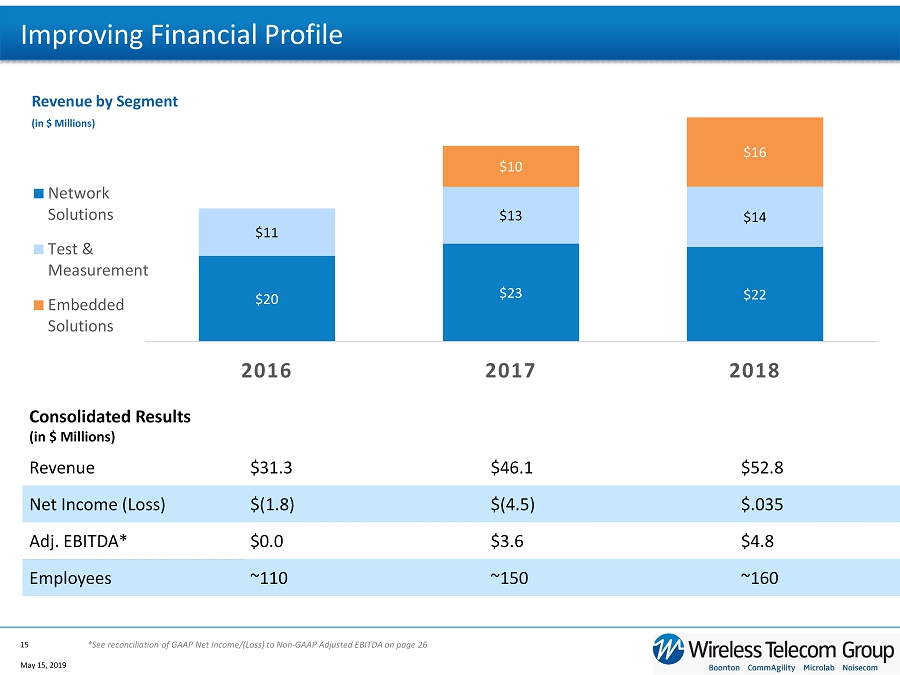
Improving Financial Profile $20 $23 $22 $11 $13 $14 $0 $10 $16 2016 2017 2018 Network Solutions Test & Measurement Embedded Solutions Consolidated Results (in $ Millions) Revenue $31.3 $46.1 $52.8 Net Income (Loss) $(1.8) $(4.5) $.035 Adj. EBITDA* $0.0 $3.6 $4.8 Employees ~110 ~150 ~160 May 15, 2019 15 Revenue by Segment (in $ Millions) *See reconciliation of GAAP Net Income/(Loss) to Non - GAAP Adjusted EBITDA on page 26
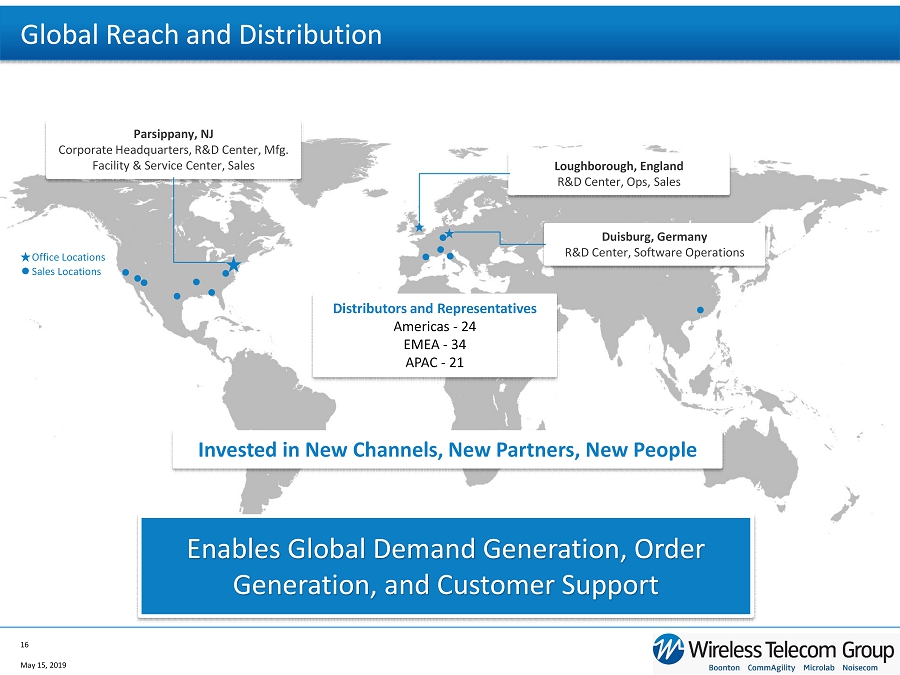
Global Reach and Distribution May 15, 2019 16 Parsippany, NJ Corporate Headquarters, R&D Center, Mfg. Facility & Service Center, Sales Loughborough, England R&D Center, Ops, Sales Duisburg, Germany R&D Center, Software Operations Office Locations Sales Locations Distributors and Representatives Americas - 24 EMEA - 34 APAC - 21 Enables Global Demand Generation, Order Generation, and Customer Support Invested in New Channels, New Partners, New People
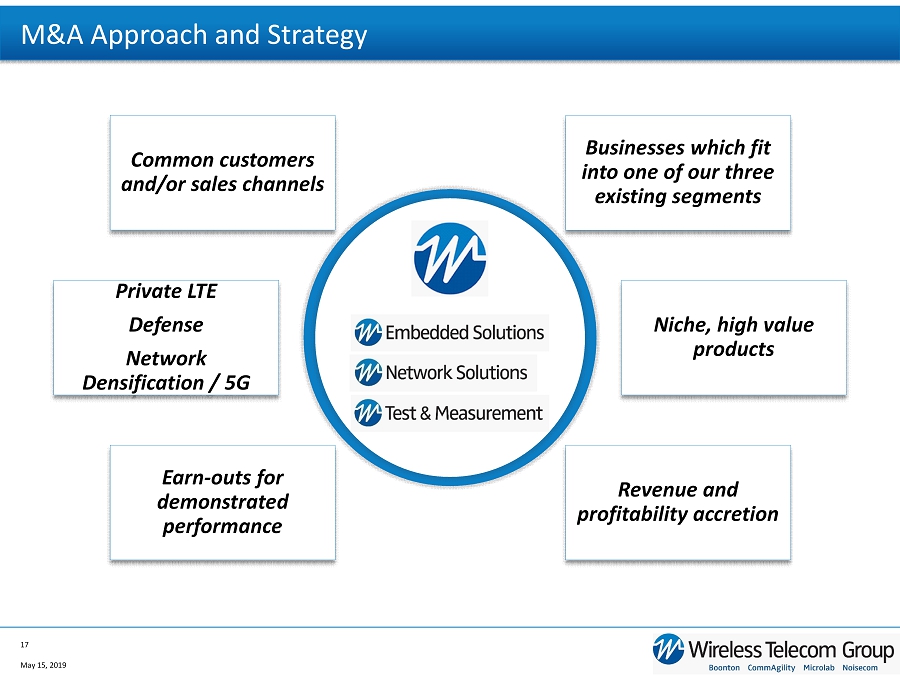
M&A Approach and Strategy May 15, 2019 17 Businesses which fit into one of our three existing segments Revenue and profitability accretion Earn - outs for demonstrated performance Common customers and/or sales channels Private LTE Defense Network Densification / 5G Niche, high value products

Long - Term Targets Metrics 2017 2018 2023 Targets (1) Revenue Growth 48% (2) 15% $100m (3), (4) Gross Margin 41.8% 45.8% 47 - 49% Adjusted EBITDA Margin 7.9% 9.1% 15% (1) Long - Term targets are operating targets we seek to accomplish in 2023 through a combination of organic initiatives and strategic acquisitions. (2) Revenue growth metrics in 2017 - 2018 are presented as the year - year growth rate; 2017 revenue growth is inclusive of the CommAgil ity acquisition representing two - thirds of the 48% year over year growth. (3) The revenue target is presented in dollars and assumes strategic acquisitions and organic revenue growth of 10 - 12 % per year. (4) See explanation of use of non - GAAP measures on slide 25 and Adjusted EBIDTA reconciliation on slide 26. Adjusted EBITDA margin is defined as Adjusted EBITDA div ide d by revenue. Adjusted EBITDA is defined as net earnings before interest, taxes, depreciation and amortization, stock compensation expense, restructuring charges, acquisitio n e xpenses, integration expenses, non - cash one - time inventory obsolescence charges, realized and unrealized foreign exchange gains and losses, and other non - recurring costs. We do not provide a forward - looking reconciliat ion of expected Adjusted EBITDA Margin as the amount and significance of special items required to develop meaningful comparable GAAP financial measures cannot be estimated at this time without unreasonable effor ts. These special items could be meaningful. May 15, 2019 18
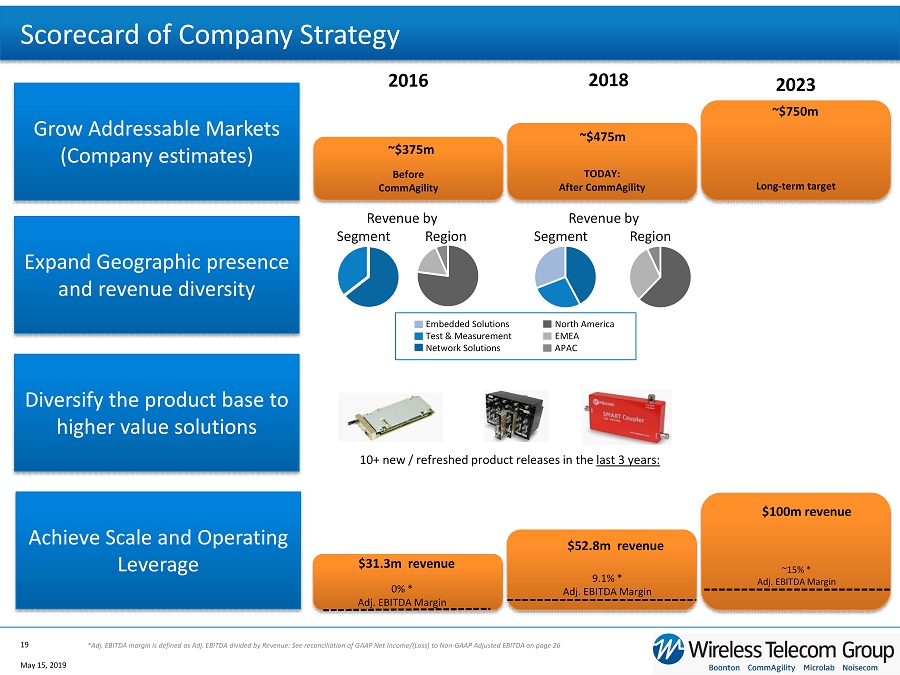
Scorecard of Company Strategy Grow Addressable Markets (Company estimates) Expand Geographic presence and revenue diversity Before CommAgility TODAY: After CommAgility Long - term target Diversify the product base to higher value solutions Achieve Scale and Operating Leverage ~$375m ~$475m 10+ new / refreshed product releases in the last 3 years: $ 31.3m revenue $ 52.8m revenue $100m revenue ~15% * Adj. EBITDA Margin 0% * Adj. EBITDA Margin 9.1% * Adj. EBITDA Margin May 15, 2019 19 *Adj. EBITDA margin is defined as Adj. EBITDA divided by Revenue: See reconciliation of GAAP Net Income/(Loss) to Non - GAAP Adjus ted EBITDA on page 26 2016 2018 2023 ~$750m Revenue by Segment Region Revenue by Segment Region Embedded Solutions Test & Measurement Network Solutions North America EMEA APAC
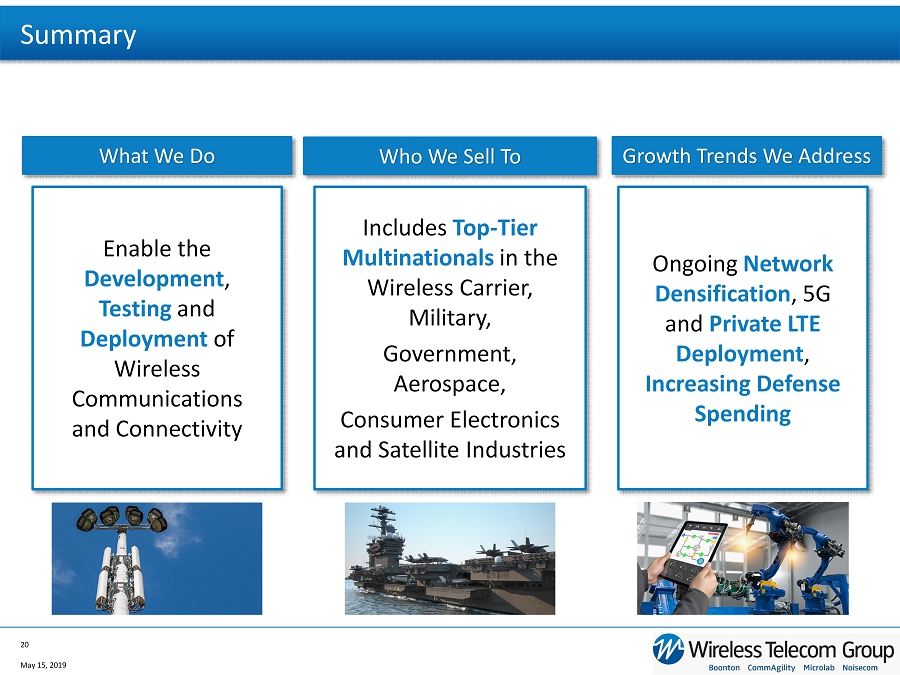
Summary Enable the Development , Testing and Deployment of Wireless Communications and Connectivity Includes Top - Tier Multinationals in the Wireless Carrier, Military, Government, Aerospace , Consumer Electronics and Satellite I ndustries Ongoing Network Densification , 5G and Private LTE Deployment , Increasing Defense Spending May 15, 2019 20 What We Do Who We Sell To Growth Trends We Address

Financials
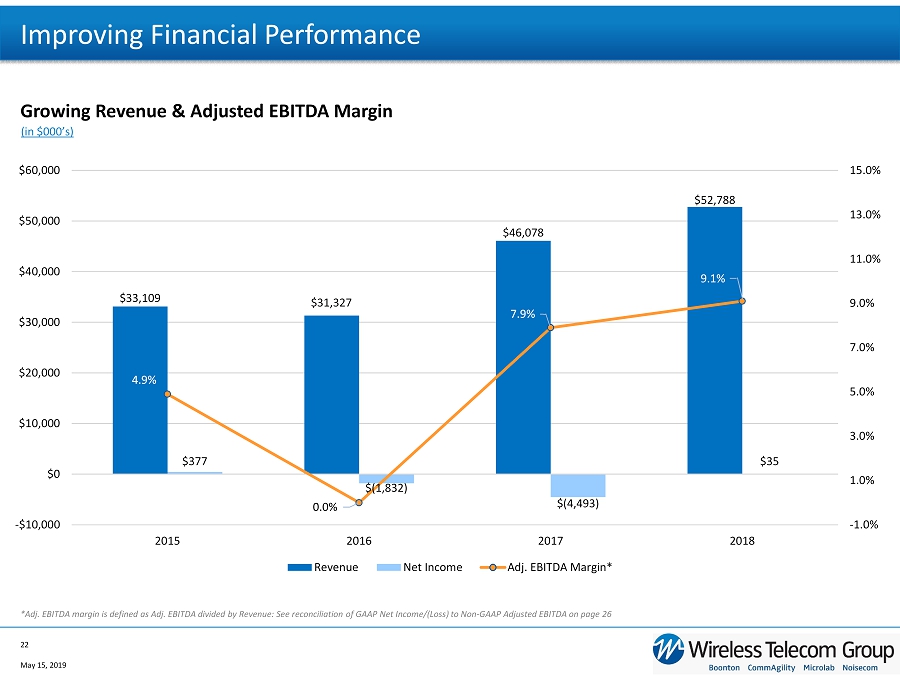
Growing Revenue & Adjusted EBITDA Margin (in $000’s) $33,109 $31,327 $46,078 $52,788 $377 $(1,832) $(4,493) $35 4.9% 0.0% 7.9% 9.1% -1.0% 1.0% 3.0% 5.0% 7.0% 9.0% 11.0% 13.0% 15.0% -$10,000 $0 $10,000 $20,000 $30,000 $40,000 $50,000 $60,000 2015 2016 2017 2018 Revenue Net Income Adj. EBITDA Margin* Improving Financial Performance May 15, 2019 22 *Adj. EBITDA margin is defined as Adj. EBITDA divided by Revenue: See reconciliation of GAAP Net Income/(Loss) to Non - GAAP Adjus ted EBITDA on page 26

Twelve months ended December 31 Revenue % of Revenue Change 2018 2017 2018 2017 Amount Pct. Network Solutions $ 22,275 $ 23,052 42.2% 50.0% $ (777) - 3.4% Test & Measurement 14,212 13,380 26.9% 29.0% 832 6.2% Embedded Solutions 16,301 9,646 30.9% 21.0% 6,655 69.0% Total Net Revenues $ 52,788 $ 46,078 100.0% 100.0% $ 6,710 14.6% Twelve months ended December 31 Gross Profit % of Revenue Change 2018 2017 2018 2017 Amount Pct. Network Solutions $ 9,756 $ 9,064 43.8% 39.3% $ 692 7.6% Test & Measurement 7,018 5,854 49.4% 43.8% 1,164 19.9% Embedded Solutions 7,393 4,343 45.4% 45.0% 3,050 70.2% Total Gross Profit $ 24,167 $ 19,261 45.8% 41.8% $ 4,906 25.5% Revenue (in 000’s) Gross Profit (in 000’s) Segment Financials May 15, 2019 23
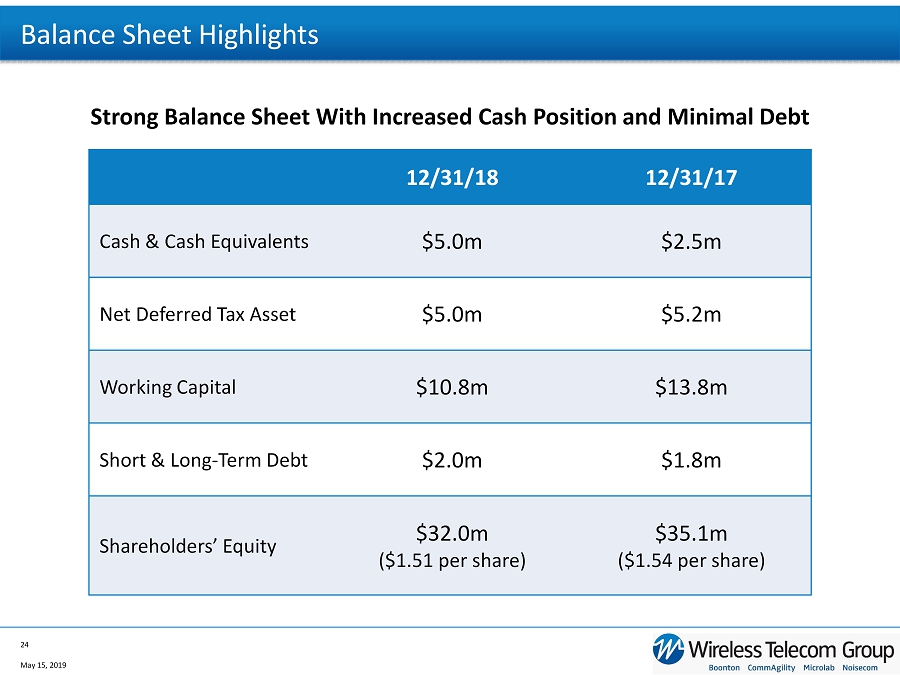
Strong Balance Sheet With Increased Cash Position and Minimal Debt 12/31/18 12/31/17 Cash & Cash Equivalents $5.0m $2.5m Net Deferred Tax Asset $5.0m $5.2m Working Capital $10.8m $13.8m Short & Long - Term Debt $2.0m $1.8m Shareholders’ Equity $32.0m ($1.51 per share) $35.1m ($1.54 per share) Balance Sheet Highlights May 15, 2019 24
Explanation of Use of Non - GAAP Measures Wireless Telecom Group, (the “Company”), reports its financial results in accordance with generally accepted accounting principles (“GAAP”) . Management believes, however, that certain non-GAAP financial measures used in managing the Company’s business may provide users of this financial information with additional meaningful comparisons between current results and prior reported results . Certain of the information set forth herein constitutes non-GAAP financial measures within the meaning of Regulation G adopted by the Securities and Exchange Commission . We have presented herein a reconciliation of these measures to the most directly comparable GAAP financial measure . The non-GAAP measures presented herein may not be comparable to similarly titled measures presented by other companies . The foregoing measures do not serve as a substitute and should not be construed as a substitute for GAAP performance, but provide supplemental information concerning our performance that our investors and we find useful . The Company defines EBITDA as its net earnings before interest, taxes, depreciation and amortization . “Adjusted EBITDA” is EBITDA excluding our stock compensation expense, restructuring charges, acquisition expenses, integration expenses, the one - time non - cash inventory impairment charges, unrealized and realized foreign exchange gains and losses, and other non - recurring costs and includes cash received in 2018 related to revenue that would have been recognized in 2018 but for the adoption of ASU 606 . A reconciliation of net income to non - GAAP Adjusted EBITDA set forth on page 26 . The Company defines Adjusted EBITDA margin as Adjusted EBITDA divided by revenue . The Company does not provide a forward - looking reconciliation of expected Adjusted EBITDA Margin as the amount and significance of special items required to develop meaningful comparable GAAP financial measures cannot be estimated at this time without unreasonable efforts . These special items could be meaningful . The Company views Adjusted EBITDA and Adjusted EBITDA margin as important indicators of performance, consistent with the mann er in which management measures and forecasts the Company’s performance. We believe Adjusted EBITDA and Adjusted EBITDA margin are impor tan t performance metrics because they facilitate the analysis of our results, exclusive of certain non-cash items, including items which do no t d irectly correlate to our business operations. The Company believes that Adjusted EBITDA and Adjusted EBITDA margin metrics provide qualitative insight into our current per for mance and we use these measures to evaluate our results. Additionally, we use Adjusted EBITDA to measure the performance of our management te am and management’s entitlement to incentive compensation. We believe that making this information available to investors enables them to view o ur performance the way that we view our performance and thereby gain a meaningful understanding of our core operating results, in general, and from per iod to period. May 15, 2019 25

Twelve Months Ended Reconciliation of Net Income/(Loss) to Non - GAAP EBITDA and Non - GAAP Adjusted EBITDA: December 31 2018 2017 2016 2015 GAAP Net Income/(Loss), as reported $ 35 $ (4,493) $ ( 1,832) $ 377 Tax Provision/(Benefit) 48 1,247 (352) 346 Depreciation and Amortization Expense 2,305 1,747 636 458 Interest Expense 575 296 - - Non - GAAP EBITDA 2,963 (1,203) (1,548) 1,181 Stock Compensation Expense 702 536 699 313 ASC 606 Adjustment 345 - - - Merger and Acquisition Expenses - 1,290 1,208 - Integration Expenses 60 386 - - Inventory Impairment - 1,930 - - Inventory Recovery (28) (25) - - FX Loss 104 32 - - US GAAP Purchase Accounting 105 71 - - Change in Fair Value of Contingent Consideration 578 (253) - - Restructuring Charges and Other Non - Recurring Costs - 881 51 137 Insurance Settlement Gain - - (410) - Non - GAAP Adjusted EBITDA $ 4,829 $ 3,645 $ 0 $ 1,631 Adjusted EBITDA Margin (% of revenue) 9.1% 7.9% 0% 4.9% 2015 to 2018 Adjusted EBITDA Reconciliation May 15, 2019 26