Exhibit 99.1

Platts 20th Annual Global Power Markets Conference
CEO Roundtable: Operating in a New Era
Bruce A. Williamson Chairman, President & CEO
Forward-looking Statement
This presentation contains statements reflecting assumptions, expectations, projections, intentions or beliefs about future events that are intended as “forward-looking statements.” You can identify these statements by the fact that they do not relate strictly to historical or current facts. Management cautions that any or all of Dynegy’s forward-looking statements may turn out to be wrong. Please read Dynegy’s annual, quarterly and current reports under the Securities Exchange Act of 1934, as amended, including its 2004 Form 10-K, for additional information about the risks, uncertainties and other factors affecting these forward-looking statements and Dynegy generally. Dynegy’s actual future results may vary materially from those expressed or implied in any forward-looking statements. All of Dynegy’s forward-looking statements, whether written or oral, are expressly qualified by these cautionary statements and any other cautionary statements that may accompany such forward-looking statements. In addition, Dynegy disclaims any obligation to update any forward-looking statements to reflect events or circumstances after the date hereof.
2
Company Overview
Headquartered in Houston, Texas
Power Generation and Natural Gas Liquids facilities/operations throughout the United States 2,300 employees “DYN” ticker symbol; traded on NYSE
Successful execution of self-restructuring plan
Focused on core unregulated energy businesses Solid liquidity and cash positions
Renewed commitments to ethics, compliance, accountability and transparency Leadership team with a proven track record of results
3
Power Generation
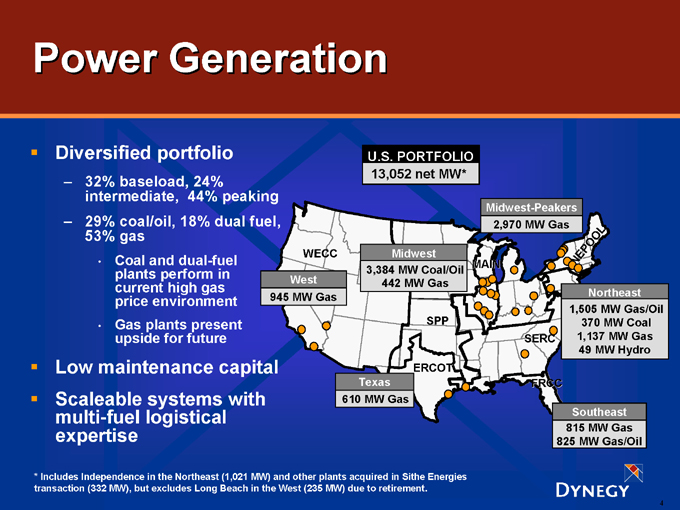
Diversified portfolio
32% baseload, 24% intermediate, 44% peaking 29% coal/oil, 18% dual fuel, 53% gas
Coal and dual-fuel plants perform in current high gas price environment Gas plants present upside for future
Low maintenance capital Scaleable systems with multi-fuel logistical expertise
U.S. PORTFOLIO 13,052 net MW*
West 945 MW Gas
Texas 610 MW Gas
Midwest 3,384 MW Coal/Oil 442 MW Gas
WECC
SPP
ERCOT
MAIN
Midwest-Peakers 2,970 MW Gas
SERC
NEPOOL
Northeast 1,505 MW Gas/Oil 370 MW Coal 1,137 MW Gas 49 MW Hydro
FRCC
Southeast 815 MW Gas 825 MW Gas/Oil
* Includes Independence in the Northeast (1,021 MW) and other plants acquired in Sithe Energies transaction (332 MW), but excludes Long Beach in the West (235 MW) due to retirement.
4
Natural Gas Liquids
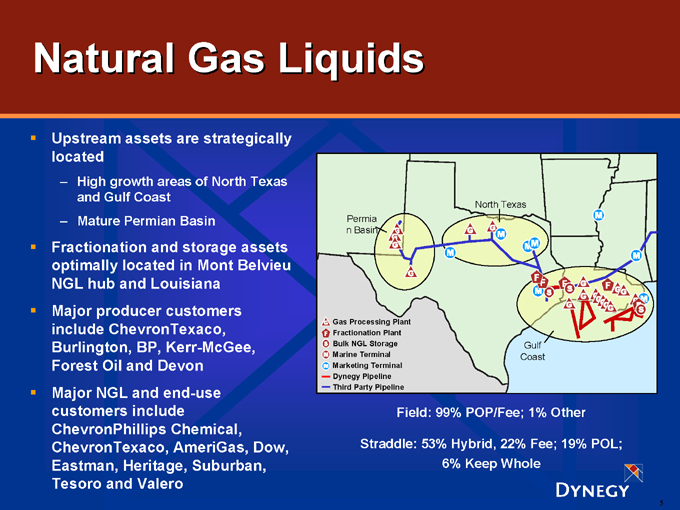
Upstream assets are strategically located
High growth areas of North Texas and Gulf Coast Mature Permian Basin
Fractionation and storage assets optimally located in Mont Belvieu NGL hub and Louisiana Major producer customers include ChevronTexaco, Burlington, BP, Kerr-McGee, Forest Oil and Devon Major NGL and end-use customers include ChevronPhillips Chemical, ChevronTexaco, AmeriGas, Dow, Eastman, Heritage, Suburban, Tesoro and Valero
Permia n Basin
North Texas
Gulf Coast
Gas Processing Plant Fractionation Plant Bulk NGL Storage Marine Terminal Marketing Terminal Dynegy Pipeline Third Party Pipeline
Field: 99% POP/Fee; 1% Other
Straddle: 53% Hybrid, 22% Fee; 19% POL; 6% Keep Whole
5
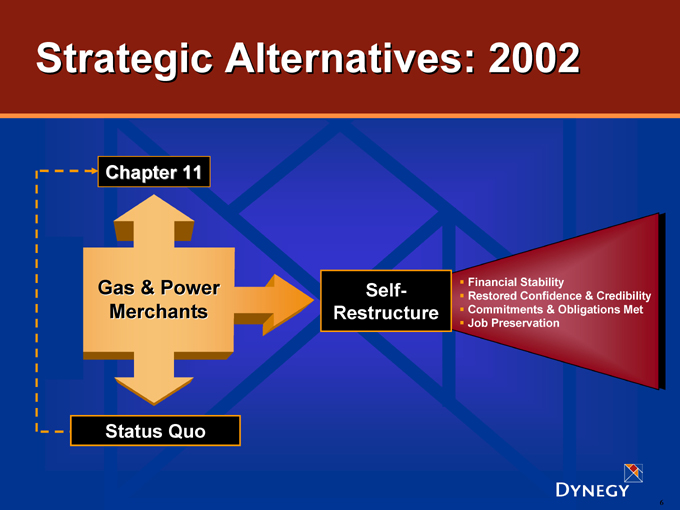
Strategic Alternatives: 2002
Chapter 11
Gas & Power Merchants
Status Quo
Self-Restructure
Financial Stability
Restored Confidence & Credibility Commitments & Obligations Met Job Preservation
6
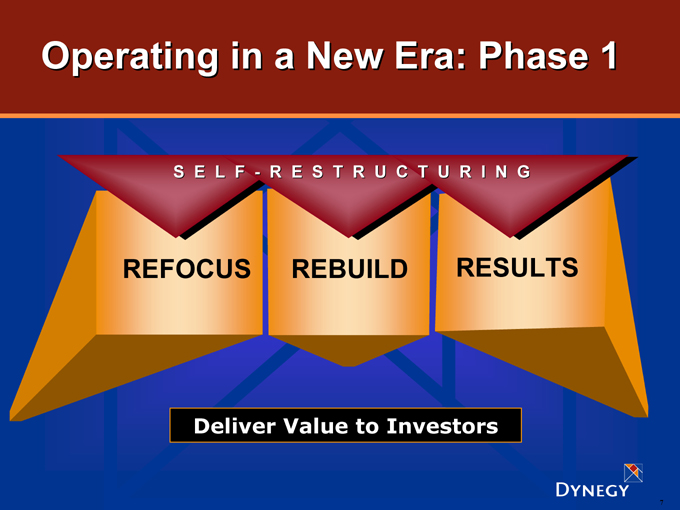
Operating in a New Era: Phase 1
SELF-RESTRUCTURING
REFOCUS
REBUILD
RESULTS
Deliver Value to Investors
7
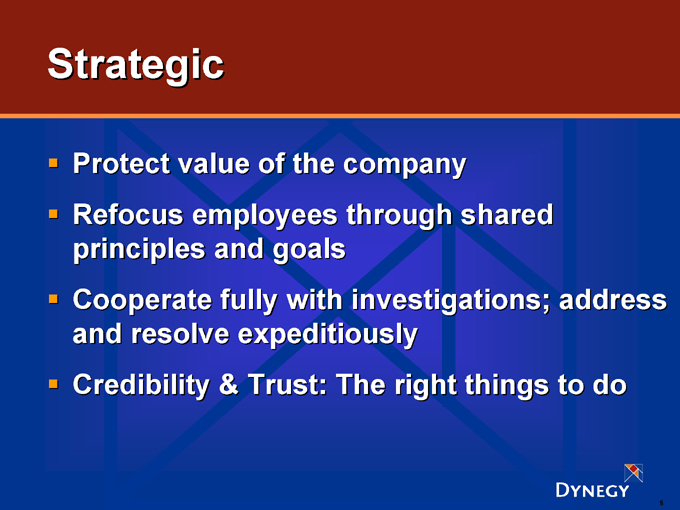
Strategic
Protect value of the company Refocus employees through shared principles and goals Cooperate fully with investigations; address and resolve expeditiously Credibility & Trust: The right things to do
8
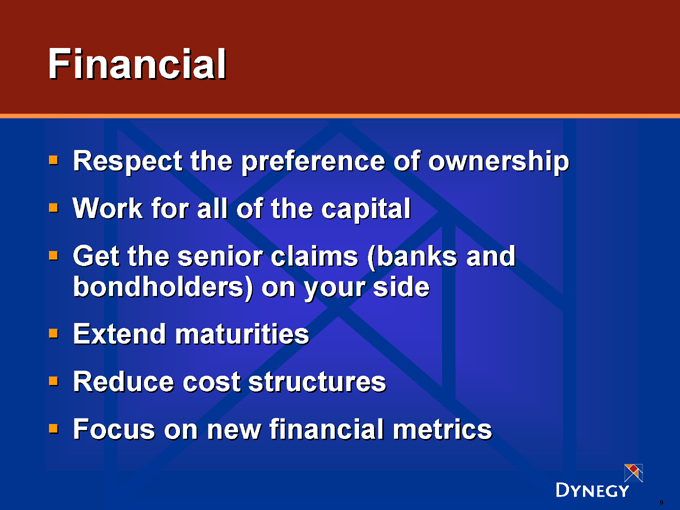
Financial
Respect the preference of ownership Work for all of the capital Get the senior claims (banks and bondholders) on your side Extend maturities Reduce cost structures Focus on new financial metrics
9
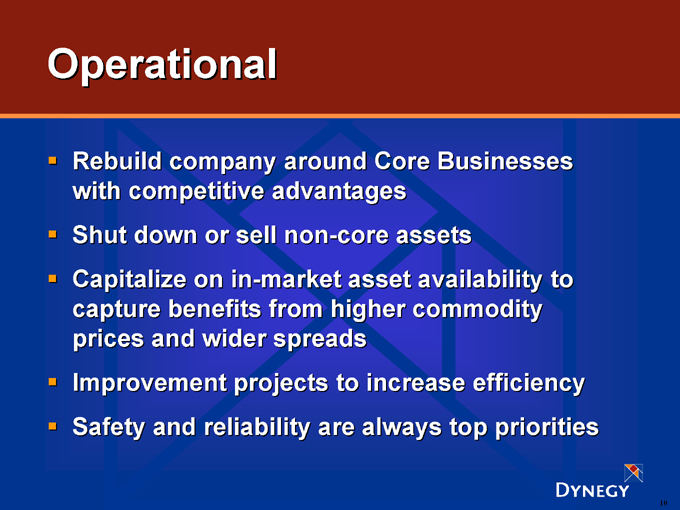
Operational
Rebuild company around Core Businesses with competitive advantages Shut down or sell non-core assets Capitalize on in-market asset availability to capture benefits from higher commodity prices and wider spreads Improvement projects to increase efficiency Safety and reliability are always top priorities
10
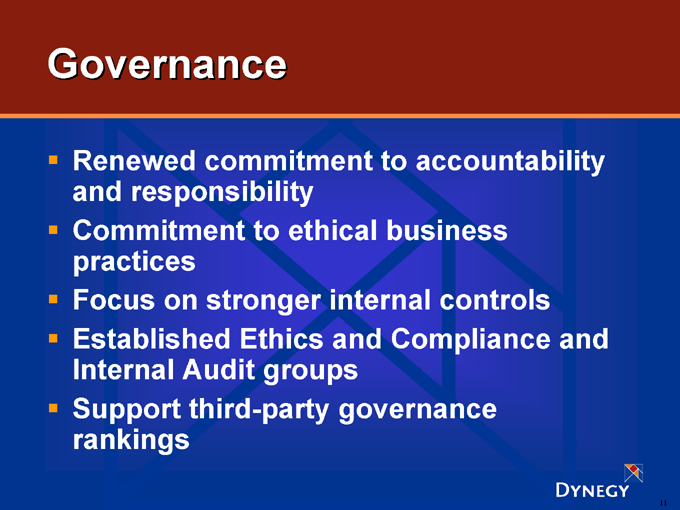
Governance
Renewed commitment to accountability and responsibility Commitment to ethical business practices Focus on stronger internal controls Established Ethics and Compliance and Internal Audit groups Support third-party governance rankings
11
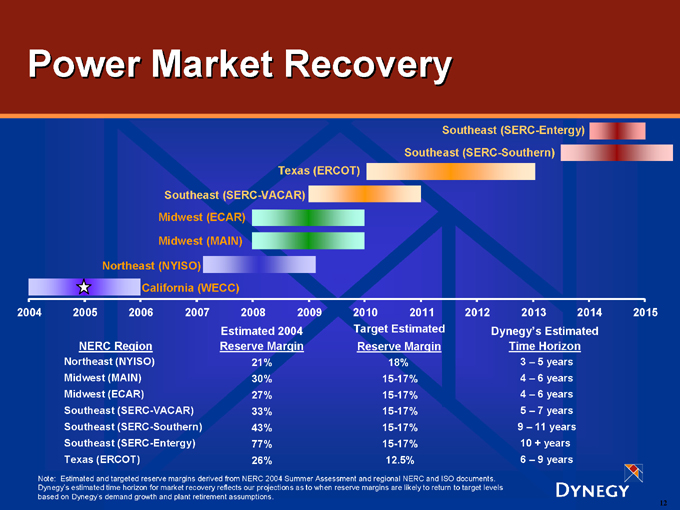
Power Market Recovery
Southeast (SERC-Entergy)
Southeast (SERC-Southern)
Texas (ERCOT)
Southeast (SERC-VACAR)
Midwest (ECAR)
Midwest (MAIN)
Northeast (NYISO)
California (WECC)
2004 2005 2006 2007 2008 2009 2010 2011 2012 2013 2014 2015
Estimated 2004 Target Estimated Dynegy’s Estimated
NERC Region Reserve Margin Reserve Margin Time Horizon
Northeast (NYISO) 21% 18% 3 – 5 years
Midwest (MAIN) 30% 15-17% 4 – 6 years
Midwest (ECAR) 27% 15-17% 4 – 6 years
Southeast (SERC-VACAR) 33% 15-17% 5 – 7 years
Southeast (SERC-Southern) 43% 15-17% 9 – 11 years
Southeast (SERC-Entergy) 77% 15-17% 10 + years
Texas (ERCOT) 26% 12.5% 6 – 9 years
Note: Estimated and targeted reserve margins derived from NERC 2004 Summer Assessment and regional NERC and ISO documents. Dynegy’s estimated time horizon for market recovery reflects our projections as to when reserve margins are likely to return to target levels based on Dynegy’s demand growth and plant retirement assumptions.
12
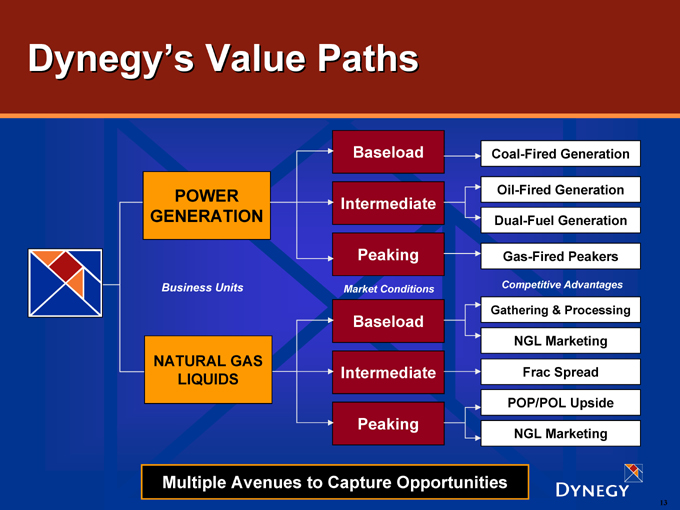
Dynegy’s Value Paths
POWER GENERATION
Business Units
NATURAL GAS LIQUIDS
Baseload
Intermediate
Peaking
Market Conditions
Baseload
Intermediate
Peaking
Coal-Fired Generation
Oil-Fired Generation
Dual-Fuel Generation
Gas-Fired Peakers
Competitive Advantages
Gathering & Processing
NGL Marketing
Frac Spread
POP/POL Upside
NGL Marketing
Multiple Avenues to Capture Opportunities
13

Operating in a New Era: Phase 2
Organic Growth
Gas & Power Merchants
Status Quo
Measured Growth
Strategic Alternatives
Combination Consolidation
Deliver Even Greater Value to Investors
14
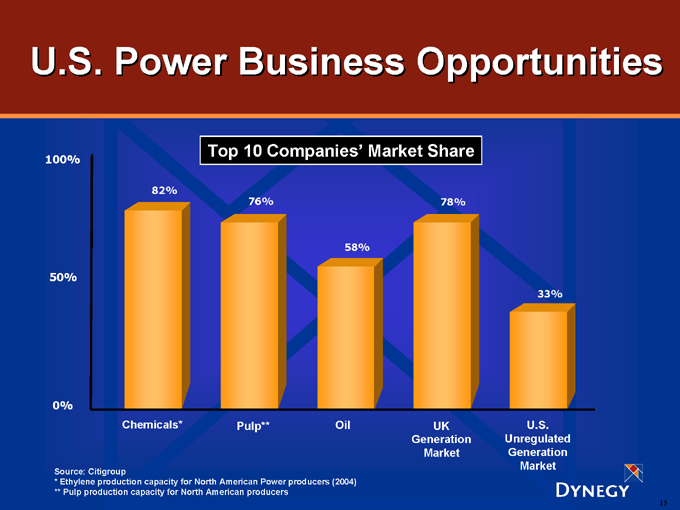
U.S. Power Business Opportunities
Top 10 Companies’ Market Share
100% 50% 0%
82%
76%
58%
78%
33%
Chemicals* Pulp** Oil UK Generation Market U.S. Unregulated Generation Market
Source: Citigroup
* Ethylene production capacity for North American Power producers (2004) ** Pulp production capacity for North American producers
15
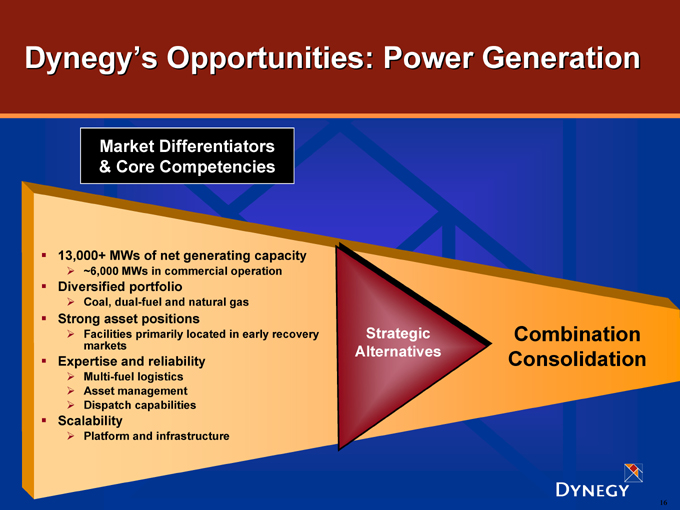
Dynegy’s Opportunities: Power Generation
Market Differentiators & Core Competencies
13,000+ MWs of net generating capacity
~6,000 MWs in commercial operation
Diversified portfolio
Coal, dual-fuel and natural gas
Strong asset positions
Facilities primarily located in early recovery markets
Expertise and reliability
Multi-fuel logistics Asset management Dispatch capabilities
Scalability
Platform and infrastructure
Strategic Alternatives
Combination Consolidation
16
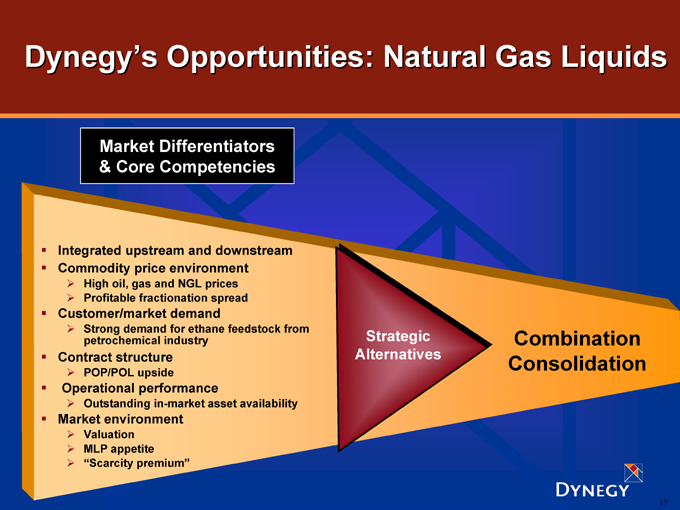
Dynegy’s Opportunities: Natural Gas Liquids
Market Differentiators & Core Competencies
Integrated upstream and downstream Commodity price environment
High oil, gas and NGL prices Profitable fractionation spread
Customer/market demand
Strong demand for ethane feedstock from petrochemical industry
Contract structure
POP/POL upside
Operational performance
Outstanding in-market asset availability
Market environment
Valuation MLP appetite “Scarcity premium”
Strategic Alternatives
Combination Consolidation
17
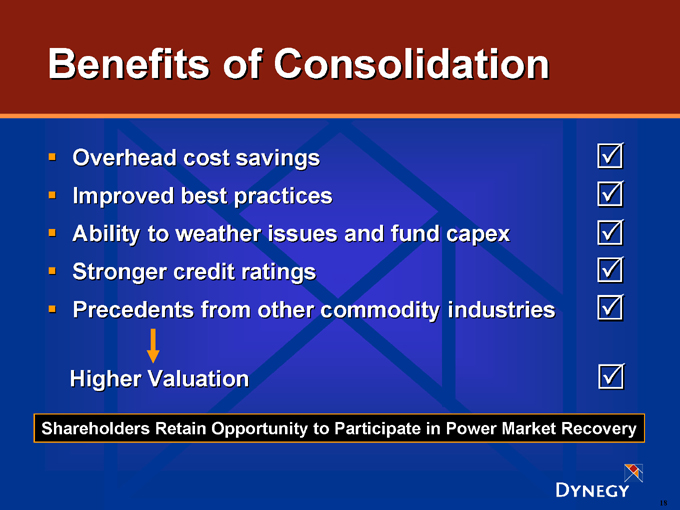
Benefits of Consolidation
Overhead cost savings Improved best practices
Ability to weather issues and fund capex Stronger credit ratings Precedents from other commodity industries
Higher Valuation
Shareholders Retain Opportunity to Participate in Power Market Recovery
18
Platts 20th Annual Global Power Markets Conference
CEO Roundtable: Operating in a New Era
Bruce A. Williamson Chairman, President & CEO