Exhibit 99.1
Investor Relations:
Peter J. Wilt, Vice President Hillarie C. Bloxom, Senior Analyst
(713) 507-6466 ir@dynegy.com
DYNEGY
Merrill Lynch 2005 Global Power & Gas Leaders Conference September 27, 2005 New York City
FORWARD LOOKING STATEMENTS
This presentation contains statements reflecting assumptions, expectations, projections, intentions or beliefs about future events that are intended as “forward-looking statements.” You can identify these statements, including those relating to Dynegy’s 2005 financial estimates, by the fact that they do not relate strictly to historical or current facts. Management cautions that any or all of Dynegy’s forward-looking statements may turn out to be wrong. Please read Dynegy’s annual, quarterly and current reports under the Securities Exchange Act of 1934, as amended, including its 2004 Form 10-K and second quarter 2005 Form 10-Q, for additional information about the risks, uncertainties and other factors affecting these forward-looking statements and Dynegy generally. Dynegy’s actual future results may vary materially from those expressed or implied in any forward-looking statements. All of Dynegy’s forward-looking statements, whether written or oral, are expressly qualified by these cautionary statements and any other cautionary statements that may accompany such forward-looking statements. In addition, Dynegy disclaims any obligation to update any forward-looking statements to reflect events or circumstances after the date hereof.
Non-GAAP Financial Measures:
We use the non-GAAP financial measures “EBITDA” and “free cash flow” in these materials. We have defined these terms in the Appendix. For our 2005 guidance, we have provided reconciliations of non-GAAP measures to the most directly comparable GAAP measures, reconciling EBITDA to net income and “free cash flow” to cash flow from operations.
2
2005 HIGHLIGHTS
Completed Sithe Energies acquisition
Reached final resolution on Midwest environmental litigation
Received court approval for shareholder class action lawsuit settlement Announced sale of Midstream business to Targa Resources for ~$2.475 B Steve Furbacher promoted to President and COO of Dynegy Entered into new Lyondell contract to capture greater financial benefits Experiencing hot weather and greater power demand in key regions
Northeast volumes for July – August 2005 already 18% over total 3Q 2004
Southeast peaking volumes 23% higher YTD 2005 compared to YTD 2004
Steady Progress, Continued Improvement
3
MIDSTREAM FACILITIES UPDATE: HURRICANE KATRINA
All evacuated employees accounted for and safe
In the process of mobilizing resources to Venice and Yscloskey
Immediate focus: Create safe working environment for detailed assessment and evaluation of assets
Insurance expected to cover majority of losses beyond deductibles
Dynegy working with producers, pipelines and competitors in the region to produce and move gas
Recovery period to be measured in months
Sale to Targa Resources remains on track for 4Q 2005 close
4
MIDSTREAM TRANSACTION OVERVIEW AND STRATEGIC DIRECTION
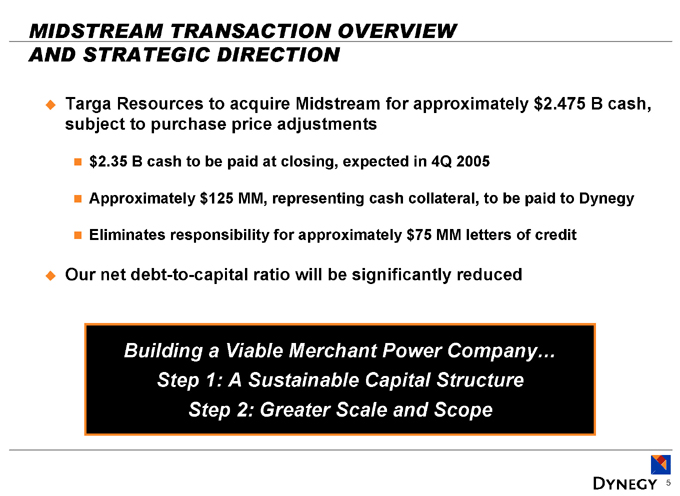
Targa Resources to acquire Midstream for approximately $2.475 B cash, subject to purchase price adjustments $2.35 B cash to be paid at closing, expected in 4Q 2005
Approximately $125 MM, representing cash collateral, to be paid to Dynegy
Eliminates responsibility for approximately $75 MM letters of credit
Our net debt-to-capital ratio will be significantly reduced
Building a Viable Merchant Power Company… Step 1: A Sustainable Capital Structure Step 2: Greater Scale and Scope
5

MIDSTREAM TRANSACTION PROCEEDS APPLICATION
Dynegy to receive approximately $2.475 B cash, subject to purchase price adjustments $594 MM to be used to repay Term Loan
$189 MM to be used to repay Riverside debt
Remaining proceeds of approximately $1.6 B available
Reinvest in permitted lines of business
Redeem Second Priority Notes (SPNs) per terms of indenture
Pursue other liability management activities
6
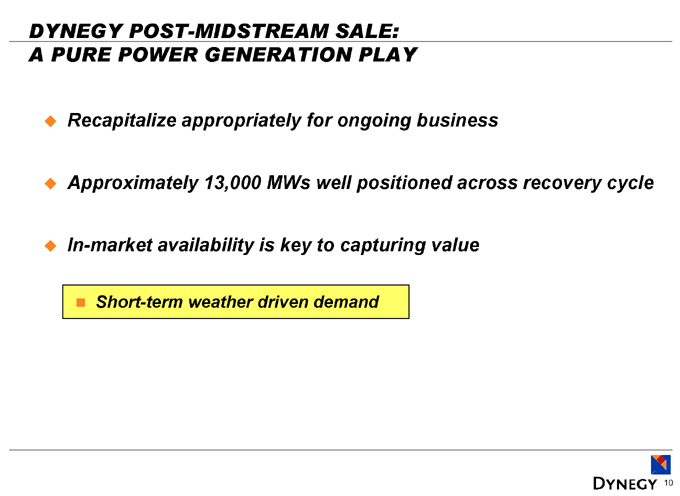
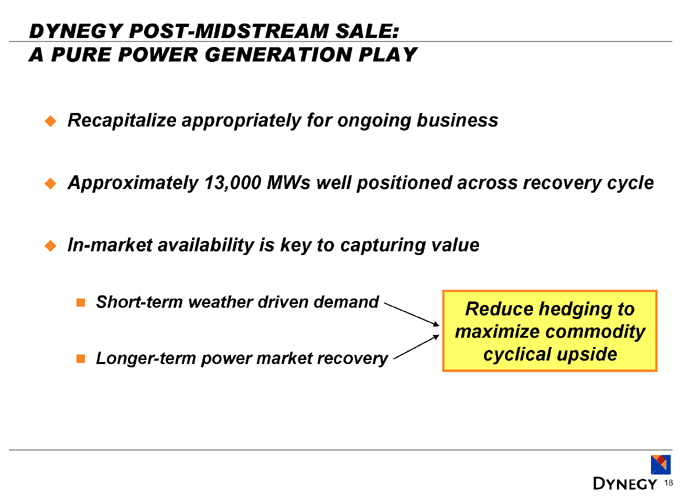
DYNEGY POST-MIDSTREAM SALE: A PURE POWER GENERATION PLAY
Recapitalize appropriately for ongoing business
Approximately 13,000 MWs well positioned across recovery cycle
7
DYNEGY POST-MIDSTREAM SALE: A PURE POWER GENERATION PLAY
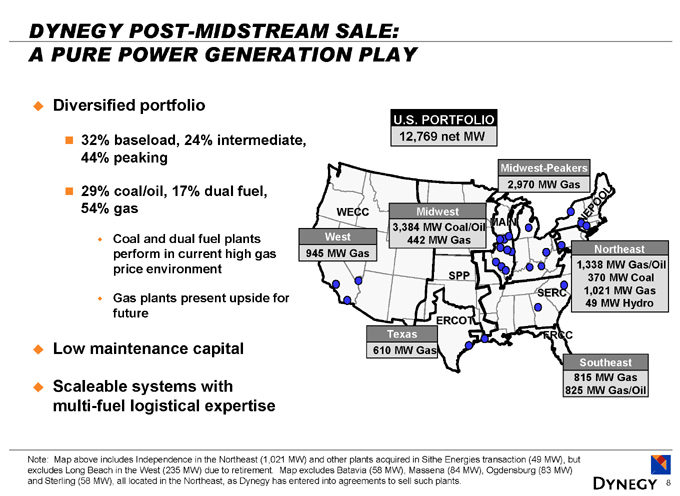
Diversified portfolio
32% baseload, 24% intermediate, 44% peaking
29% coal/oil, 17% dual fuel, 54% gas
Coal and dual fuel plants perform in current high gas price environment
Gas plants present upside for future
Low maintenance capital
Scaleable systems with multi-fuel logistical expertise
U.S. PORTFOLIO 12,769 net MW
Midwest-Peakers 2,970 MW Gas
Midwest 3,384 MW Coal/Oil 442 MW Gas
West 945 MW Gas
WECC SPP ERCOT
Texas 610 MW Gas
SERC
Northeast 1,338 MW Gas/Oil 370 MW Coal 1,021 MW Gas 49 MW Hydro
FRCC
Southeast 815 MW Gas 825 MW Gas/Oil
Note: Map above includes Independence in the Northeast (1,021 MW) and other plants acquired in Sithe Energies transaction (49 MW), but excludes Long Beach in the West (235 MW) due to retirement. Map excludes Batavia (58 MW), Massena (84 MW), Ogdensburg (83 MW) and Sterling (58 MW), all located in the Northeast, as Dynegy has entered into agreements to sell such plants.
8
DYNEGY POST-MIDSTREAM SALE: A PURE POWER GENERATION PLAY
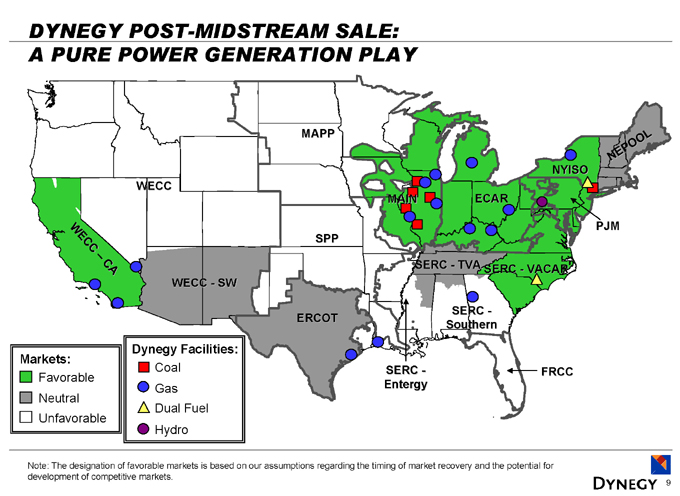
WECC MAPP WECC – CA WECC – SW SPP MAIN
ECAR NYISO NEPOOL PJM SERC – TVA SERC - VACAR
ERCOT SERC -Southern
SERC –Entergy FRCC
Markets:
Favorable Neutral Unfavorable
Dynegy Facilities:
Coal Gas Dual Fuel Hydro
Hydro
Note: The designation of favorable markets is based on our assumptions regarding the timing of market recovery and the potential for development of competitive markets.
9
DYNEGY POST-MIDSTREAM SALE: A PURE POWER GENERATION PLAY
Recapitalize appropriately for ongoing business
Approximately 13,000 MWs well positioned across recovery cycle
In-market availability is key to capturing value
Short-term weather driven demand
10
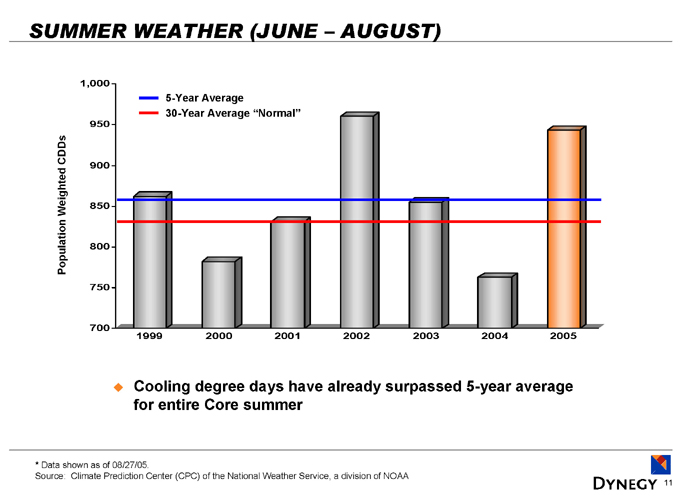
SUMMER WEATHER (JUNE – AUGUST)
Population Weighted CDDs
1,000 950 900 850 800 750 700
5-Year Average
30-Year Average “Normal”
1999 2000 2001 2002 2003 2004 2005
Cooling degree days have already surpassed 5-year average for entire Core summer
* Data shown as of 08/27/05.
Source: Climate Prediction Center (CPC) of the National Weather Service, a division of NOAA
11
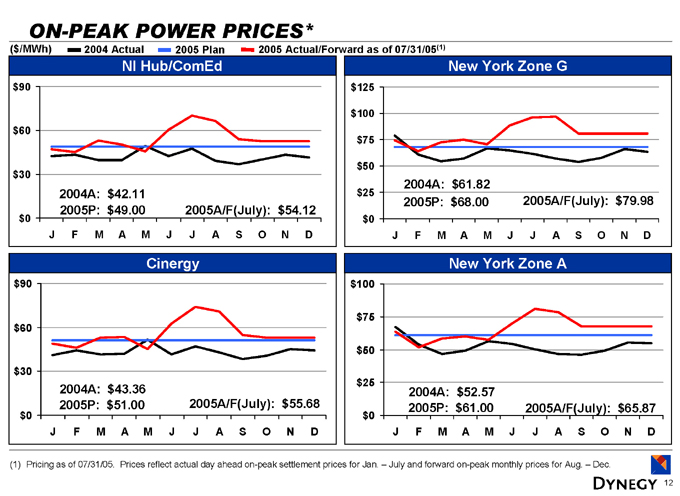
ON-PEAK POWER PRICES*
($/MWh) 2004 Actual 2005 Plan 2005 Actual/Forward as of 07/31/05(1)
NI Hub/ComEd $90 $60 $30 $0
2004A: $42.11 2005P: $49.00
2005A/F(July): $54.12
J F M A M J J A S O N D
New York Zone G
$125 $100 $75 $50 $25 $0
2004A: $61.82 2005P: $68.00
2005A/F(July): $79.98
J F M A M J J A S O N D
Cinergy $90 $60 $30 $0
2004A: $43.36 2005P: $51.00
2005A/F(July): $55.68
J F M A M J J A S O N D
New York Zone A
$100 $75 $50 $25 $0
2004A: $52.57 2005P: $61.00
2005A/F(July): $65.87
J F M A M J J A S O N D
(1) Pricing as of 07/31/05. Prices reflect actual day ahead on-peak settlement prices for Jan. – July and forward on-peak monthly prices for Aug. – Dec.
12
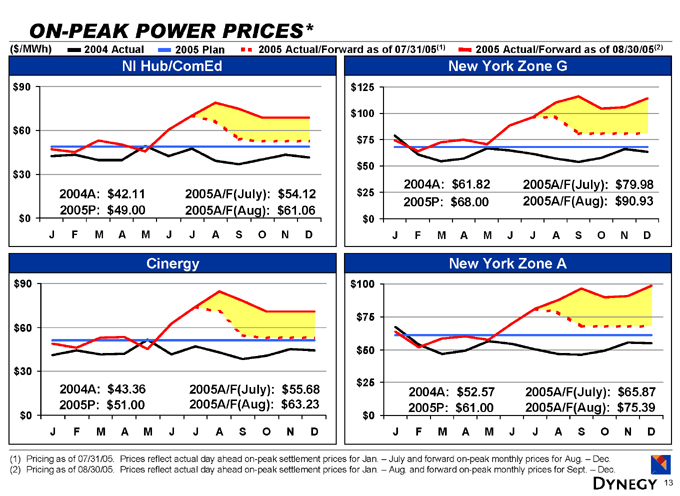
ON-PEAK POWER PRICES*
($/MWh) 2004 Actual 2005 Plan 2005 Actual/Forward as of 07/31/05(1) 2005 Actual/Forward as of 08/30/05(2)
NI Hub/ComEd $90 $60 $30 $0
2004A: $42.11 2005P: $49.00
2005A/F(July): $54.12 2005A/F(Aug): $61.06
J F M A M J J A S O N D
New York Zone G
$125 $100 $75 $50 $25 $0
2004A: $61.82 2005P: $68.00
2005A/F(July): $79.98 2005A/F(Aug): $90.93
J F M A M J J A S O N D
Cinergy $90 $60 $30 $0
2004A: $43.36 2005P: $51.00
2005A/F(July): $55.68 2005A/F(Aug): $63.23
J F M A M J J A S O N D
New York Zone A
$100 $75 $50 $25 $0
2004A: $52.57 2005P: $61.00
2005A/F(July): $65.87 2005A/F(Aug): $75.39
J F M A M J J A S O N D
(1) Pricing as of 07/31/05. Prices reflect actual day ahead on-peak settlement prices for Jan. – July and forward on-peak monthly prices for Aug. – Dec. (2) Pricing as of 08/30/05. Prices reflect actual day ahead on-peak settlement prices for Jan. – Aug. and forward on-peak monthly prices for Sept. – Dec.
13
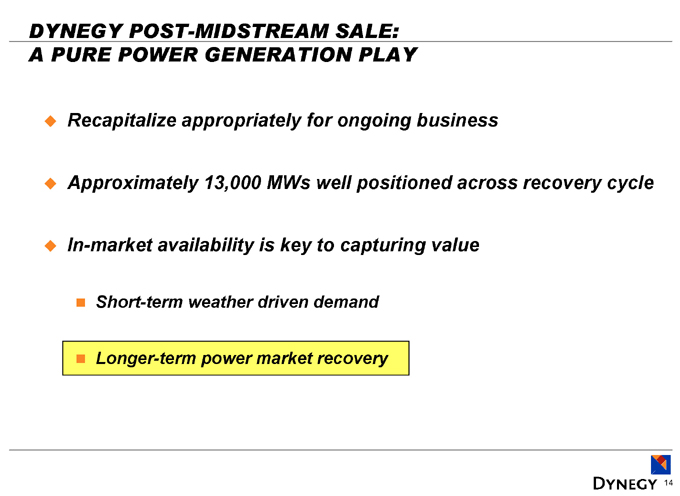
DYNEGY POST-MIDSTREAM SALE: A PURE POWER GENERATION PLAY
Recapitalize appropriately for ongoing business
Approximately 13,000 MWs well positioned across recovery cycle
In-market availability is key to capturing value
Short-term weather driven demand
Longer-term power market recovery
14
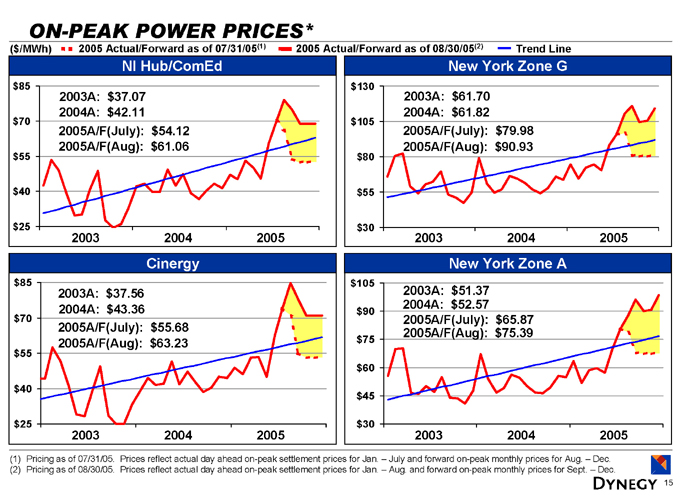
ON-PEAK POWER PRICES*
($/MWh) 2005 Actual/Forward as of 07/31/05(1) 2005 Actual/Forward as of 08/30/05(2) Trend Line
NI Hub/ComEd $85 $70 $55 $40 $25
2003A: $37.07 2004A: $42.11 2005A/F(July): $54.12 2005A/F(Aug): $61.06
2003 2004 2005
New York Zone G
$130 $105 $80 $55 $30
2003A: $61.70 2004A: $61.82 2005A/F(July): $79.98 2005A/F(Aug): $90.93
2003 2004 2005
Cinergy $85 $70 $55 $40 $25
2003A: $37.56 2004A: $43.36 2005A/F(July): $55.68 2005A/F(Aug): $63.23
2003 2004 2005
New York Zone A
$105 $90 $75 $60 $45 $30
2003A: $51.37 2004A: $52.57 2005A/F(July): $65.87 2005A/F(Aug): $75.39
2003 2004 2005
(1) Pricing as of 07/31/05. Prices reflect actual day ahead on-peak settlement prices for Jan. – July and forward on-peak monthly prices for Aug. – Dec. (2) Pricing as of 08/30/05. Prices reflect actual day ahead on-peak settlement prices for Jan. – Aug. and forward on-peak monthly prices for Sept. – Dec.
15
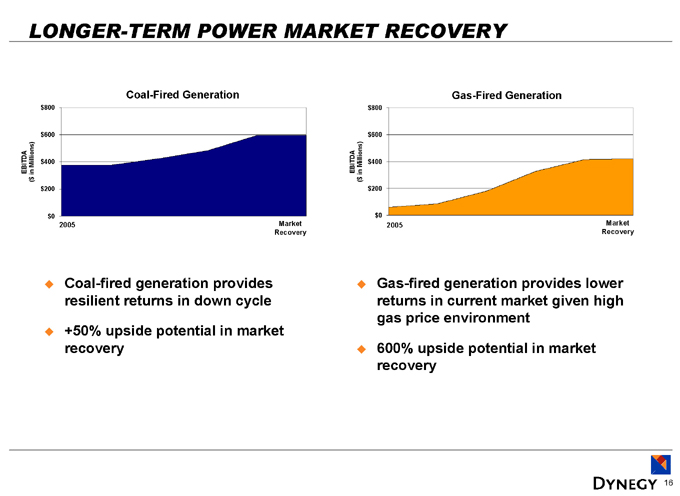
LONGER-TERM POWER MARKET RECOVERY
Coal-Fired Generation
EBITDA ($ in Millions) $800 $600 $400 $200 $0
2005
Market Recovery
Gas-Fired Generation
EBITDA ($ in Millions) $800 $600 $400 $200 $0
2005
Market Recovery
Coal-fired generation provides resilient returns in down cycle
+50% upside potential in market recovery
Gas-fired generation provides lower returns in current market given high gas price environment
600% upside potential in market recovery
16
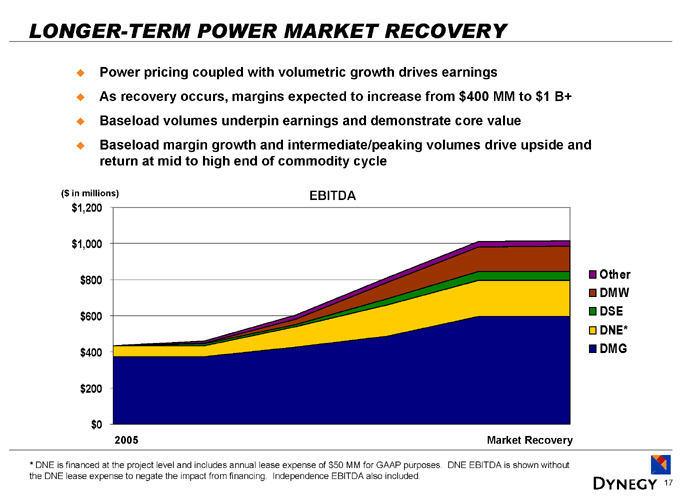
LONGER-TERM POWER MARKET RECOVERY
Power pricing coupled with volumetric growth drives earnings
As recovery occurs, margins expected to increase from $400 MM to $1 B+ Baseload volumes underpin earnings and demonstrate core value Baseload margin growth and intermediate/peaking volumes drive upside and return at mid to high end of commodity cycle
($ in millions) $1,200 $1,000 $800 $600 $400 $200 $0
2005
Market Recovery
Other DMW DSE DNE* DMG
EBITDA
* DNE is financed at the project level and includes annual lease expense of $50 MM for GAAP purposes. DNE EBITDA is shown without the DNE lease expense to negate the impact from financing. Independence EBITDA also included.
17
DYNEGY POST-MIDSTREAM SALE: A PURE POWER GENERATION PLAY
Recapitalize appropriately for ongoing business
Approximately 13,000 MWs well positioned across recovery cycle
In-market availability is key to capturing value
Short-term weather driven demand
Longer-term power market recovery
Reduce hedging to maximize commodity cyclical upside
18
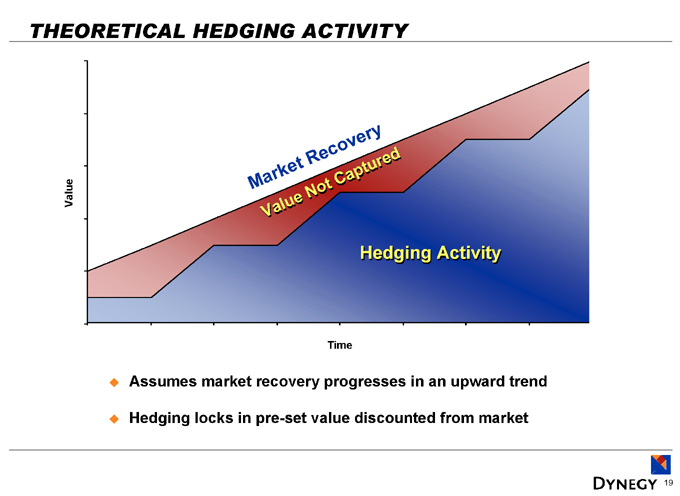
THEORETICAL HEDGING ACTIVITY
Value
Market Recovery
Value Not Captured
Hedging Activity
Time
Assumes market recovery progresses in an upward trend
Hedging locks in pre-set value discounted from market
19
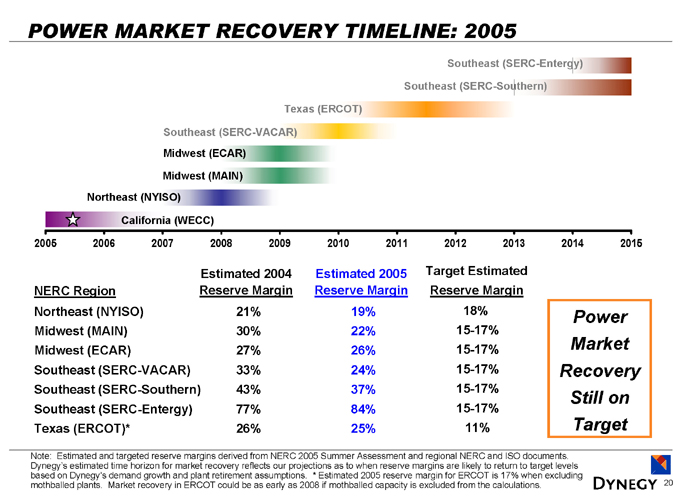
POWER MARKET RECOVERY TIMELINE: 2005
Southeast (SERC-Entergy)
Southeast (SERC-Southern)
Texas (ERCOT)
Southeast (SERC-VACAR) Midwest (ECAR)
Midwest (MAIN)
Northeast (NYISO)
California (WECC)
2005 2006 2007 2008 2009 2010 2011 2012 2013 2014 2015
NERC Region Estimated 2004 Reserve Margin Estimated 2005 Reserve Margin Target Estimated Reserve Margin
Northeast (NYISO) 21% 19% 18%
Midwest (MAIN) 30% 22% 15-17%
Midwest (ECAR) 27% 26% 15-17%
Southeast (SERC-VACAR) 33% 24% 15-17%
Southeast (SERC-Southern) 43% 37% 15-17%
Southeast (SERC-Entergy) 77% 84% 15-17%
Texas (ERCOT)* 26% 25% 11%
Power Market Recovery Still on Target
Note: Estimated and targeted reserve margins derived from NERC 2005 Summer Assessment and regional NERC and ISO documents. Dynegy’s estimated time horizon for market recovery reflects our projections as to when reserve margins are likely to return to target levels based on Dynegy’s demand growth and plant retirement assumptions. * Estimated 2005 reserve margin for ERCOT is 17% when excluding mothballed plants. Market recovery in ERCOT could be as early as 2008 if mothballed capacity is excluded from the calculations.
20
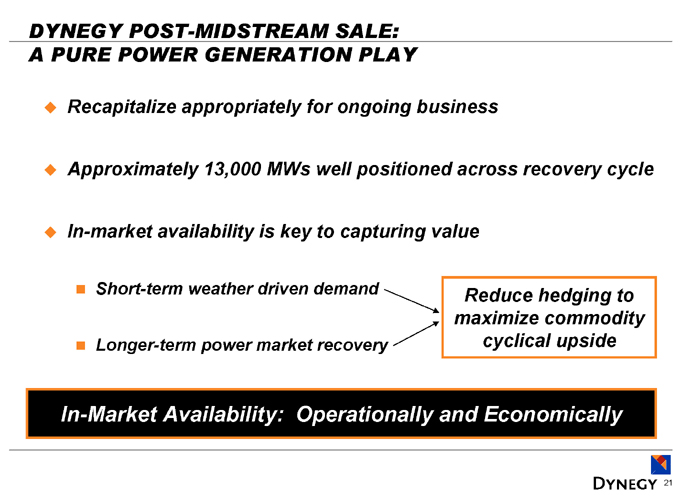
DYNEGY POST-MIDSTREAM SALE: A PURE POWER GENERATION PLAY
Recapitalize appropriately for ongoing business
Approximately 13,000 MWs well positioned across recovery cycle
In-market availability is key to capturing value
Short-term weather driven demand
Longer-term power market recovery
Reduce hedging to maximize commodity cyclical upside
In-Market Availability: Operationally and Economically
21
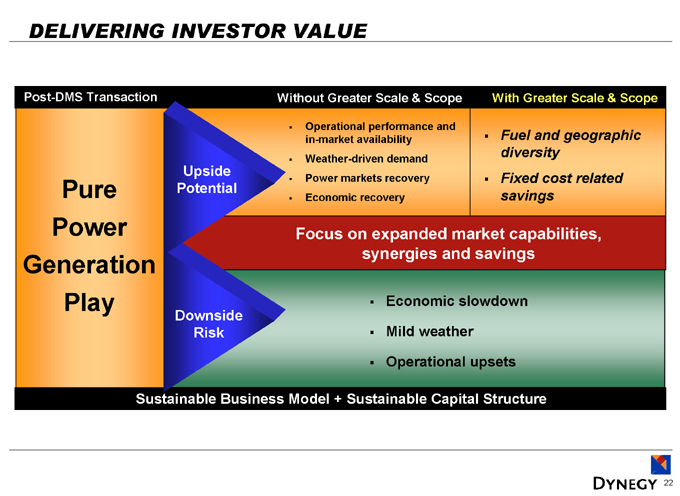
DELIVERING INVESTOR VALUE
Post-DMS Transaction
Pure Power Generation Play
Upside Potential
Without Greater Scale & Scope
Operational performance and in-market availability Weather-driven demand Power markets recovery Economic recovery
With Greater Scale & Scope
Fuel and geographic diversity Fixed cost related savings
Focus on expanded market capabilities, synergies and savings
Economic slowdown Mild weather Operational upsets
Downside Risk
Sustainable Business Model + Sustainable Capital Structure
22
APPENDIX
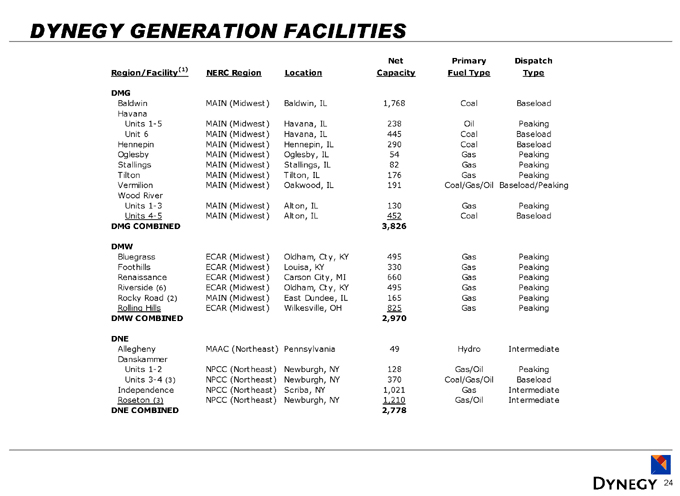
DYNEGY GENERATION FACILITIES
Region/Facility(1) NERC Region Location Net Capacity Primary Fuel Type Dispatch Type
DMG
Baldwin MAIN (Midwest) Baldwin, IL 1,768 Coal Baseload
Havana
Units 1-5 MAIN (Midwest) Havana, IL 238 Oil Peaking
Unit 6 MAIN (Midwest) Havana, IL 445 Coal Baseload
Hennepin MAIN (Midwest) Hennepin, IL 290 Coal Baseload
Oglesby MAIN (Midwest) Oglesby, IL 54 Gas Peaking
Stallings MAIN (Midwest) Stallings, IL 82 Gas Peaking
Tilton MAIN (Midwest) Tilton, IL 176 Gas Peaking
Vermilion MAIN (Midwest) Oakwood, IL 191 Coal/Gas/Oil Baseload/Peaking
Wood River
Units 1-3 MAIN (Midwest) Alton, IL 130 Gas Peaking
Units 4-5 MAIN (Midwest) Alton, IL 452 Coal Baseload
DMG COMBINED 3,826
DMW
Bluegrass ECAR (Midwest) Oldham, Cty, KY 495 Gas Peaking
Foothills ECAR (Midwest) Louisa, KY 330 Gas Peaking
Renaissance ECAR (Midwest) Carson City, MI 660 Gas Peaking
Riverside (6) ECAR (Midwest) Oldham, Cty, KY 495 Gas Peaking
Rocky Road (2) MAIN (Midwest) East Dundee, IL 165 Gas Peaking
Rolling Hills ECAR (Midwest) Wilkesville, OH 825 Gas Peaking
DMW COMBINED 2,970
DNE
Allegheny MAAC (Northeast) Pennsylvania 49 Hydro Intermediate
Danskammer
Units 1-2 NPCC (Northeast) Newburgh, NY 128 Gas/Oil Peaking
Units 3-4 (3) NPCC (Northeast) Newburgh, NY 370 Coal/Gas/Oil Baseload
Independence NPCC (Northeast) Scriba, NY 1,021 Gas Intermediate
Roseton (3) NPCC (Northeast) Newburgh, NY 1,210 Gas/Oil Intermediate
DNE COMBINED 2,778
24
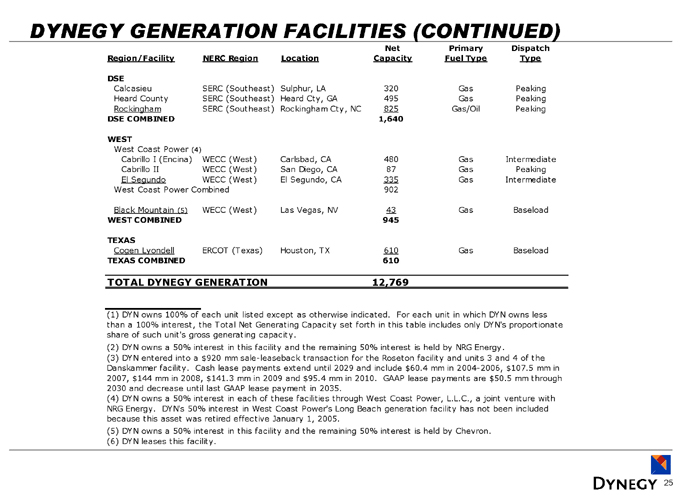
DYNEGY GENERATION FACILITIES (CONTINUED)
Region/Facility NERC Region Location Net Capacity Primary Fuel Type Dispatch Type
DSE
Calcasieu SERC (Southeast) Sulphur, LA 320 Gas Peaking
Heard County SERC (Southeast) Heard Cty, GA 495 Gas Peaking
Rockingham SERC (Southeast) Rockingham Cty, NC 825 Gas/Oil Peaking
DSE COMBINED 1,640
WEST
West Coast Power (4)
Cabrillo I (Encina) WECC (West) Carlsbad, CA 480 Gas Intermediate
Cabrillo II WECC (West) San Diego, CA 87 Gas Peaking
El Segundo WECC (West) El Segundo, CA 335 Gas Intermediate
West Coast Power Combined 902
Black Mountain (5) WECC (West) Las Vegas, NV 43 Gas Baseload
WEST COMBINED 945
TEXAS
Cogen Lyondell ERCOT (Texas) Houston, TX 610 Gas Baseload
TEXAS COMBINED 610
TOTAL DYNEGY GENERATION 12,769
(1) DYN owns 100% of each unit listed except as otherwise indicated. For each unit in which DYN owns less than a 100% interest, the Total Net Generating Capacity set forth in this table includes only DYN’s proportionate share of such unit’s gross generating capacity.
(2) DYN owns a 50% interest in this facility and the remaining 50% interest is held by NRG Energy.
(3) DYN entered into a $920 mm sale-leaseback transaction for the Roseton facility and units 3 and 4 of the Danskammer facility. Cash lease payments extend until 2029 and include $60.4 mm in 2004-2006, $107.5 mm in 2007, $144 mm in 2008, $141.3 mm in 2009 and $95.4 mm in 2010. GAAP lease payments are $50.5 mm through 2030 and decrease until last GAAP lease payment in 2035.
(4) DYN owns a 50% interest in each of these facilities through West Coast Power, L.L.C., a joint venture with NRG Energy. DYN’s 50% interest in West Coast Power’s Long Beach generation facility has not been included because this asset was retired effective January 1, 2005.
(5) DYN owns a 50% interest in this facility and the remaining 50% interest is held by Chevron. (6) DYN leases this facility.
25
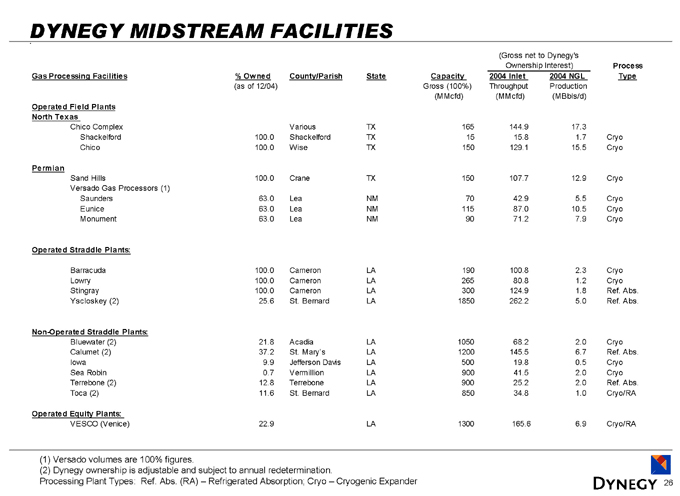
DYNEGY MIDSTREAM FACILITIES
(Gross net to Dynegy’s Ownership Interest)
Gas Processing Facilities % Owned (as of 12/04) County/Parish State Capacity Gross (100%) (MMcfd) 2004 Inlet Throughput (MMcfd) 2004 NGL Production (MBbls/d) Process Type
Operated Field Plants
North Texas
Chico Complex Various TX 165 144.9 17.3
Shackelford 100.0 Shackelford TX 15 15.8 1.7 Cryo
Chico 100.0 Wise TX 150 129.1 15.5 Cryo
Permian
Sand Hills 100.0 Crane TX 150 107.7 12.9 Cryo
Versado Gas Processors (1)
Saunders 63.0 Lea NM 70 42.9 5.5 Cryo
Eunice 63.0 Lea NM 115 87.0 10.5 Cryo
Monument 63.0 Lea NM 90 71.2 7.9 Cryo
Operated Straddle Plants:
Barracuda 100.0 Cameron LA 190 100.8 2.3 Cryo
Lowry 100.0 Cameron LA 265 80.8 1.2 Cryo
Stingray 100.0 Cameron LA 300 124.9 1.8 Ref. Abs.
Yscloskey (2) 25.6 St. Bernard LA 1850 262.2 5.0 Ref. Abs.
Non-Operated Straddle Plants:
Bluewater (2) 21.8 Acadia LA 1050 68.2 2.0 Cryo
Calumet (2) 37.2 St. Mary’s LA 1200 145.5 6.7 Ref. Abs.
Iowa 9.9 Jefferson Davis LA 500 19.8 0.5 Cryo
Sea Robin 0.7 Vermillion LA 900 41.5 2.0 Cryo
Terrebone (2) 12.8 Terrebone LA 900 25.2 2.0 Ref. Abs.
Toca (2) 11.6 St. Bernard LA 850 34.8 1.0 Cryo/RA
Operated Equity Plants:
VESCO (Venice) 22.9 LA 1300 165.6 6.9 Cryo/RA
(1) Versado volumes are 100% figures.
(2) Dynegy ownership is adjustable and subject to annual redetermination.
Processing Plant Types: Ref. Abs. (RA) – Refrigerated Absorption; Cryo – Cryogenic Expander
26
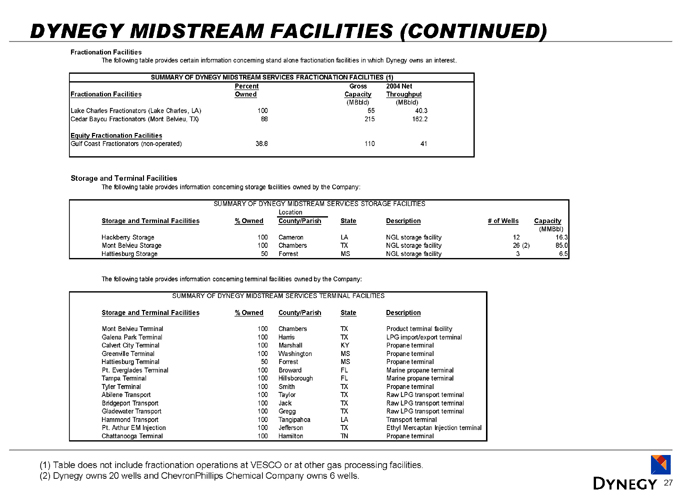
DYNEGY MIDSTREAM FACILITIES (CONTINUED)
Fractionation Facilities
The following table provides certain information concerning stand alone fractionation facilities in which Dynegy owns an interest.
SUMMARY OF DYNEGY MIDSTREAM SERVICES FRACTIONATION FACILITIES (1)
Fractionation Facilities Percent Owned Gross Capacity 2004 Net Throughput
(MBbld) (MBbld)
Lake Charles Fractionators (Lake Charles, LA) 100 55 40.3
Cedar Bayou Fractionators (Mont Belvieu, TX) 88 215 162.2
Equity Fractionation Facilities
Gulf Coast Fractionators (non-operated) 38.8 110 41
Storage and Terminal Facilities
The following table provides information concerning storage facilities owned by the Company:
SUMMARY OF DYNEGY MIDSTREAM SERVICES STORAGE FACILITIES
Location
Storage and Terminal Facilities % Owned County/Parish State Description # of Wells Capacity
(MMBbl)
Hackberry Storage 100 Cameron LA NGL storage facility 12 16.3
Mont Belvieu Storage 100 Chambers TX NGL storage facility 26 (2) 85.0
Hattiesburg Storage 50 Forrest MS NGL storage facility 3 6.5
The following table provides information concerning terminal facilities owned by the Company:
SUMMARY OF DYNEGY MIDSTREAM SERVICES TERMINAL FACILITIES
Storage and Terminal Facilities % Owned County/Parish State Description
Mont Belvieu Terminal 100 Chambers TX Product terminal facility
Galena Park Terminal 100 Harris TX LPG import/export terminal
Calvert City Terminal 100 Marshall KY Propane terminal
Greenville Terminal 100 Washington MS Propane terminal
Hattiesburg Terminal 50 Forrest MS Propane terminal
Pt. Everglades Terminal 100 Broward FL Marine propane terminal
Tampa Terminal 100 Hillsborough FL Marine propane terminal
Tyler Terminal 100 Smith TX Propane terminal
Abilene Transport 100 Taylor TX Raw LPG transport terminal
Bridgeport Transport 100 Jack TX Raw LPG transport terminal
Gladewater Transport 100 Gregg TX Raw LPG transport terminal
Hammond Transport 100 Tangipahoa LA Transport terminal
Pt. Arthur EM Injection 100 Jefferson TX Ethyl Mercaptan Injection terminal
Chattanooga Terminal 100 Hamilton TN Propane terminal
(1) Table does not include fractionation operations at VESCO or at other gas processing facilities. (2) Dynegy owns 20 wells and ChevronPhillips Chemical Company owns 6 wells.
27
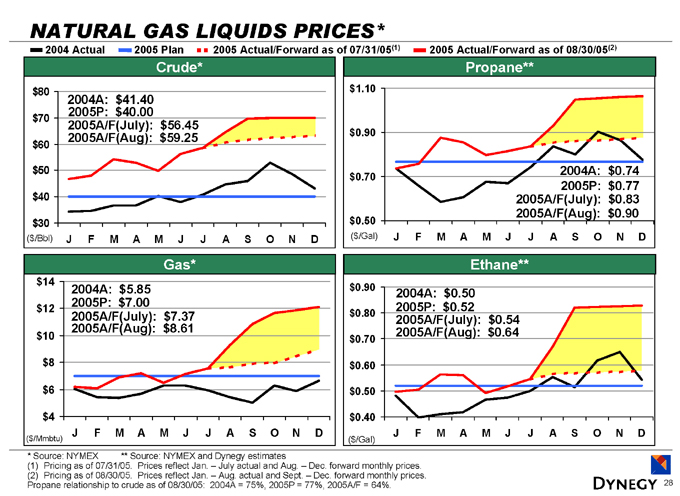
NATURAL GAS LIQUIDS PRICES*
2004 Actual 2005 Plan 2005 Actual/Forward as of 07/31/05(1) 2005 Actual/Forward as of 08/30/05(2)
Crude* $80 $70 $60 $50 $40 $30 ($/Bbl)
2004A: $41.40 2005P: $40.00 2005A/F(July): $56.45 2005A/F(Aug): $59.25
J F M A M J J A S O N D
Propane** $1.10 $0.90 $0.70 $0.50 ($/Gal)
2004A: $0.74 2005P: $0.77 2005A/F(July): $0.83 2005A/F(Aug): $0.90
J F M A M J J A S O N D
Gas* $14 $12 $10 $8 $6 $4 ($/Mmbtu)
2004A: $5.85 2005P: $7.00 2005A/F(July): $7.37 2005A/F(Aug): $8.61
J F M A M J J A S O N D
Ethane** $0.90 $0.80 $0.70 $0.60 $0.50 $0.40 ($/Gal)
2004A: $0.50 2005P: $0.52 2005A/F(July): $0.54 2005A/F(Aug): $0.64
J F M A M J J A S O N D
* Source: NYMEX ** Source: NYMEX and Dynegy estimates
(1) Pricing as of 07/31/05. Prices reflect Jan. – July actual and Aug. – Dec. forward monthly prices. (2) Pricing as of 08/30/05. Prices reflect Jan. – Aug. actual and Sept. – Dec. forward monthly prices. Propane relationship to crude as of 08/30/05: 2004A = 75%, 2005P = 77%, 2005A/F = 64%.
28
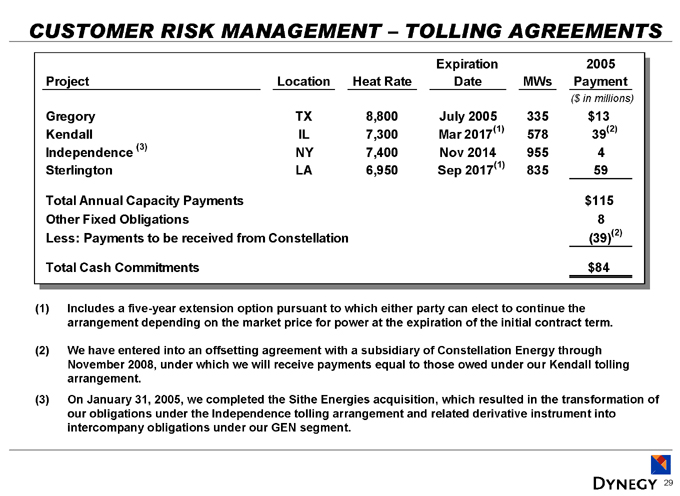
CUSTOMER RISK MANAGEMENT – TOLLING AGREEMENTS
Project Location Heat Rate Expiration Date MWs 2005 Payment
($in millions)
Gregory TX 8,800 July 2005 335 $13
Kendall IL 7,300 Mar 2017(1) 578 39(2)
Independence (3) NY 7,400 Nov 2014 955 4
Sterlington LA 6,950 Sep 2017(1) 835 59
Total Annual Capacity Payments $115
Other Fixed Obligations 8
Less: Payments to be received from Constellation (39)(2)
Total Cash Commitments $84
(1) Includes a five-year extension option pursuant to which either party can elect to continue the arrangement depending on the market price for power at the expiration of the initial contract term.
(2) We have entered into an offsetting agreement with a subsidiary of Constellation Energy through November 2008, under which we will receive payments equal to those owed under our Kendall tolling arrangement.
(3) On January 31, 2005, we completed the Sithe Energies acquisition, which resulted in the transformation of our obligations under the Independence tolling arrangement and related derivative instrument into intercompany obligations under our GEN segment.
29
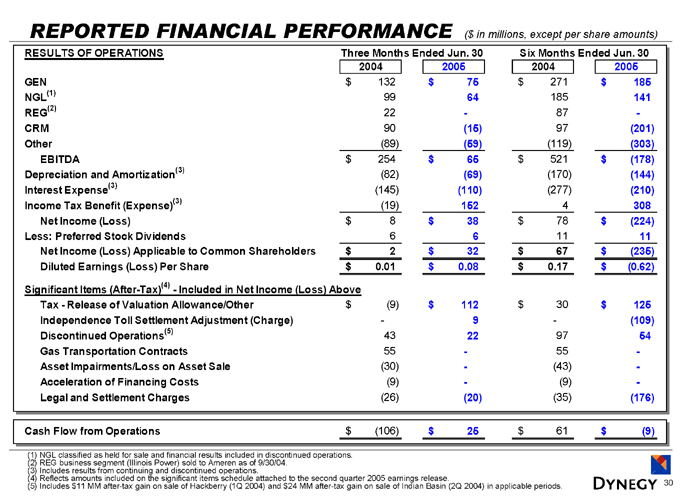
REPORTED FINANCIAL PERFORMANCE ($ in millions, except per share amounts)
RESULTS OF OPERATIONS Three Months Ended Jun. 30 Six Months Ended Jun. 30
2004 2005 2004 2005
GEN $132 $75 $271 $185
NGL(1) 99 64 185 141
REG(2) 22 - 87 -
CRM 90 (15) 97 (201)
Other (89) (59) (119) (303)
EBITDA $254 $65 $521 $(178)
Depreciation and Amortization(3) (82) (69) (170) (144)
Interest Expense(3) (145) (110) (277) (210)
Income Tax Benefit (Expense)(3) (19) 152 4 308
Net Income (Loss) $8 $38 $78 $(224)
Less: Preferred Stock Dividends 6 6 11 11
Net Income (Loss) Applicable to Common Shareholders $2 $32 $67 $(235)
Diluted Earnings (Loss) Per Share $0.01 $0.08 $0.17 $(0.62)
Significant Items (After-Tax)(4)—Included in Net Income (Loss) Above
Tax—Release of Valuation Allowance/Other $(9) $112 $30 $125
Independence Toll Settlement Adjustment (Charge) - 9 - (109)
Discontinued Operations(5) 43 22 97 54
Gas Transportation Contracts 55 - 55 - -
Asset Impairments/Loss on Asset Sale (30) - (43) -
Acceleration of Financing Costs (9) - (9) -
Legal and Settlement Charges (26) (20) (35) (176)
Cash Flow from Operations $(106) $25 $61 $(9)
(1) NGL classified as held for sale and financial results included in discontinued operations. (2) REG business segment (Illinois Power) sold to Ameren as of 9/30/04.
(3) Includes results from continuing and discontinued operations.
(4) Reflects amounts included on the significant items schedule attached to the second quarter 2005 earnings release.
(5) Includes $11 MM after-tax gain on sale of Hackberry (1Q 2004) and $24 MM after-tax gain on sale of Indian Basin (2Q 2004) in applicable periods.
30
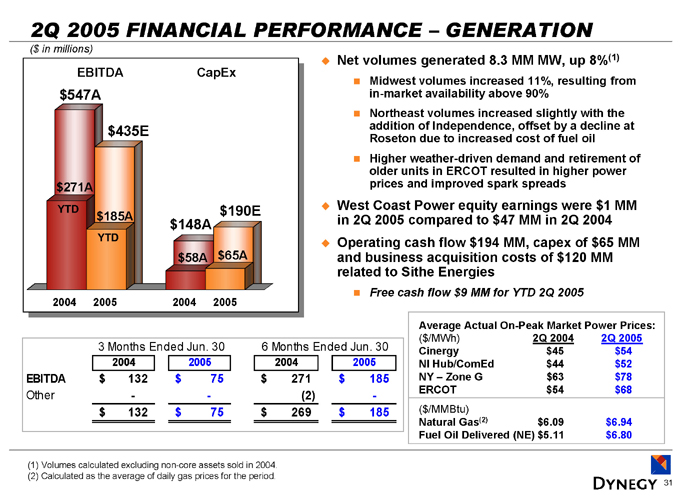
2Q 2005 FINANCIAL PERFORMANCE – GENERATION
($ in millions)
EBITDA CapEx $547A $271A
YTD $435E $185A
YTD $148A $58A $190E $65A
2004 2005 2004 2005
Net volumes generated 8.3 MM MW, up 8%(1)
Midwest volumes increased 11%, resulting from in-market availability above 90%
Northeast volumes increased slightly with the addition of Independence, offset by a decline at Roseton due to increased cost of fuel oil
Higher weather-driven demand and retirement of older units in ERCOT resulted in higher power prices and improved spark spreads
West Coast Power equity earnings were $1 MM in 2Q 2005 compared to $47 MM in 2Q 2004 Operating cash flow $194 MM, capex of $65 MM and business acquisition costs of $120 MM related to Sithe Energies
Free cash flow $9 MM for YTD 2Q 2005
3 Months Ended Jun. 30 6 Months Ended Jun. 30
2004 2005 2004 2005
EBITDA $132 $75 $271 $185
Other - - (2) -
$132 $75 $269 $185
Average Actual On-Peak Market Power Prices:
($/MWh) 2Q 2004 2Q 2005
Cinergy $45 $54
NI Hub/ComEd $44 $52
NY – Zone G $63 $78
ERCOT $54 $68
($/MMBtu)
Natural Gas(2) $6.09 $6.94
Fuel Oil Delivered (NE) $5.11 $6.80
(1) Volumes calculated excluding non-core assets sold in 2004. (2) Calculated as the average of daily gas prices for the period.
31
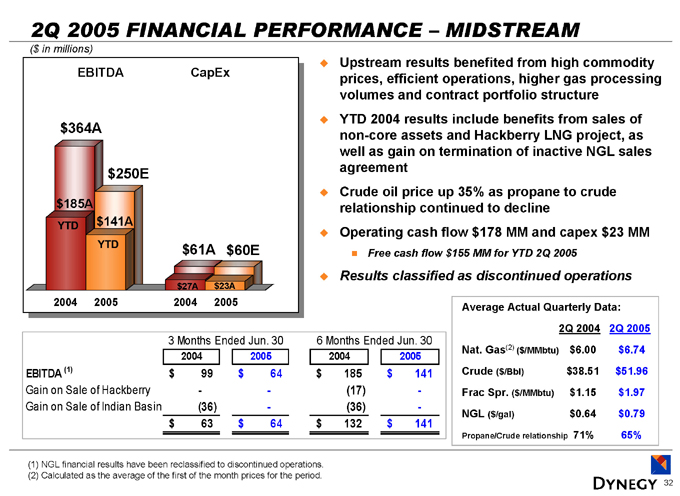
2Q 2005 FINANCIAL PERFORMANCE – MIDSTREAM
($ in millions)
EBITDA CapEx $364A $185A
YTD $250E $141A YTD
$61A $27A $60E $23A
2004 2005 2004 2005
Upstream results benefited from high commodity prices, efficient operations, higher gas processing volumes and contract portfolio structure YTD 2004 results include benefits from sales of non-core assets and Hackberry LNG project, as well as gain on termination of inactive NGL sales agreement Crude oil price up 35% as propane to crude relationship continued to decline Operating cash flow $178 MM and capex $23 MM
Free cash flow $155 MM for YTD 2Q 2005
Results classified as discontinued operations
3 Months Ended Jun. 30 6 Months Ended Jun. 30
2004 2005 2004 2005
EBITDA (1) $99 $64 $185 $141
Gain on Sale of Hackberry - - (17) -
Gain on Sale of Indian Basin (36) - (36) -
$63 $64 $132 $141
Average Actual Quarterly Data:
2Q 2004 2Q 2005
Nat. Gas(2) ($/MMbtu) $6.00 $6.74
Crude ($/Bbl) $38.51 $51.96
Frac Spr. ($/MMbtu) $1.15 $1.97
NGL ($/gal) $0.64 $0.79
Propane/Crude relationship 71% 65%
(1) NGL financial results have been reclassified to discontinued operations. (2) Calculated as the average of the first of the month prices for the period.
32
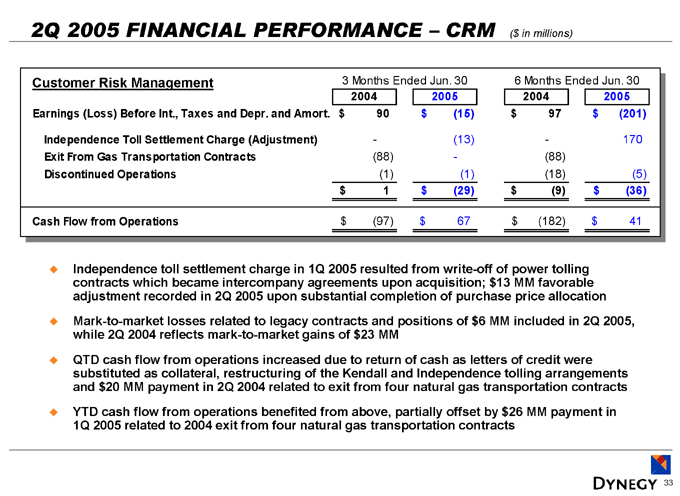
2Q 2005 FINANCIAL PERFORMANCE – CRM ($ in millions)
Customer Risk Management 3 Months Ended Jun. 30 6 Months Ended Jun. 30
2004 2005 2004 2005
Earnings (Loss) Before Int., Taxes and Depr. and Amort. $90 $(15) $97 $(201)
Independence Toll Settlement Charge (Adjustment) - (13) - 170
Exit From Gas Transportation Contracts (88) - (88)
Discontinued Operations (1) (1) (18) (5)
$1 $(29) $(9) $(36)
Cash Flow from Operations $(97) $67 $(182) $41
Independence toll settlement charge in 1Q 2005 resulted from write-off of power tolling contracts which became intercompany agreements upon acquisition; $13 MM favorable adjustment recorded in 2Q 2005 upon substantial completion of purchase price allocation Mark-to-market losses related to legacy contracts and positions of $6 MM included in 2Q 2005, while 2Q 2004 reflects mark-to-market gains of $23 MM
QTD cash flow from operations increased due to return of cash as letters of credit were substituted as collateral, restructuring of the Kendall and Independence tolling arrangements and $20 MM payment in 2Q 2004 related to exit from four natural gas transportation contracts YTD cash flow from operations benefited from above, partially offset by $26 MM payment in 1Q 2005 related to 2004 exit from four natural gas transportation contracts
33
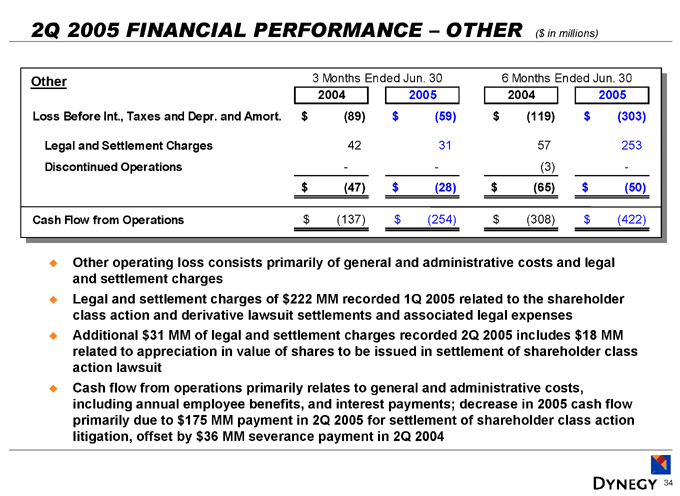
2Q 2005 FINANCIAL PERFORMANCE – OTHER ($ in millions)
Other 3 Months Ended Jun. 30 6 Months Ended Jun. 30
2004 2005 2004 2005
Loss Before Int., Taxes and Depr. and Amort. $(89) $(59) $(119) $(303)
Legal and Settlement Charges 42 31 57 253
Discontinued Operations - - (3) -
$(47) $(28) $(65) $(50)
Cash Flow from Operations $(137) $(254) $(308) $(422)
Other operating loss consists primarily of general and administrative costs and legal and settlement charges Legal and settlement charges of $222 MM recorded 1Q 2005 related to the shareholder class action and derivative lawsuit settlements and associated legal expenses Additional $31 MM of legal and settlement charges recorded 2Q 2005 includes $18 MM related to appreciation in value of shares to be issued in settlement of shareholder class action lawsuit Cash flow from operations primarily relates to general and administrative costs, including annual employee benefits, and interest payments; decrease in 2005 cash flow primarily due to $175 MM payment in 2Q 2005 for settlement of shareholder class action litigation, offset by $36 MM severance payment in 2Q 2004
34
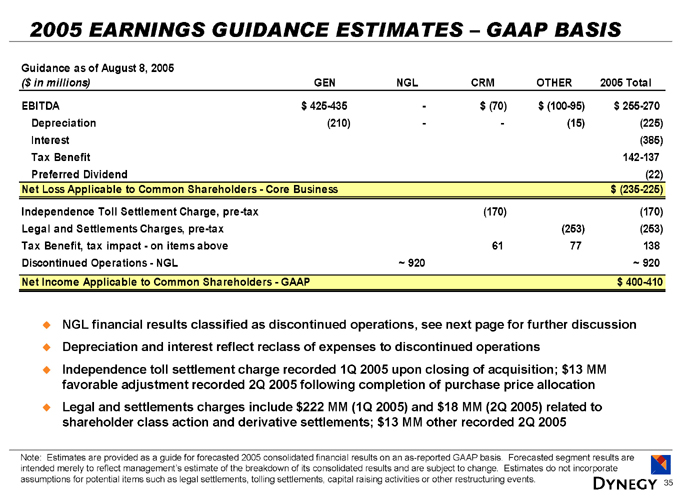
2005 EARNINGS GUIDANCE ESTIMATES – GAAP BASIS
Guidance as of August 8, 2005
($ in millions) GEN NGL CRM OTHER 2005 Total
EBITDA $425-435 - $(70) $(100-95) $255-270
Depreciation (210) - - (15) (225)
Interest (385)
Tax Benefit 142-137
Preferred Dividend (22)
Net Loss Applicable to Common Shareholders - Core Business $(235-225)
Independence Toll Settlement Charge, pre-tax (170) (170)
Legal and Settlements Charges, pre-tax (253) (253)
Tax Benefit, tax impact - - on items above 61 77 138
Discontinued Operations - NGL ~920 ~920
Net Income Applicable to Common Shareholders - GAAP $400-410
NGL financial results classified as discontinued operations, see next page for further discussion Depreciation and interest reflect reclass of expenses to discontinued operations Independence toll settlement charge recorded 1Q 2005 upon closing of acquisition; $13 MM favorable adjustment recorded 2Q 2005 following completion of purchase price allocation Legal and settlements charges include $222 MM (1Q 2005) and $18 MM (2Q 2005) related to shareholder class action and derivative settlements; $13 MM other recorded 2Q 2005
Note: Estimates are provided as a guide for forecasted 2005 consolidated financial results on an as-reported GAAP basis. Forecasted segment results are intended merely to reflect management’s estimate of the breakdown of its consolidated results and are subject to change. Estimates do not incorporate assumptions for potential items such as legal settlements, tolling settlements, capital raising activities or other restructuring events.
35
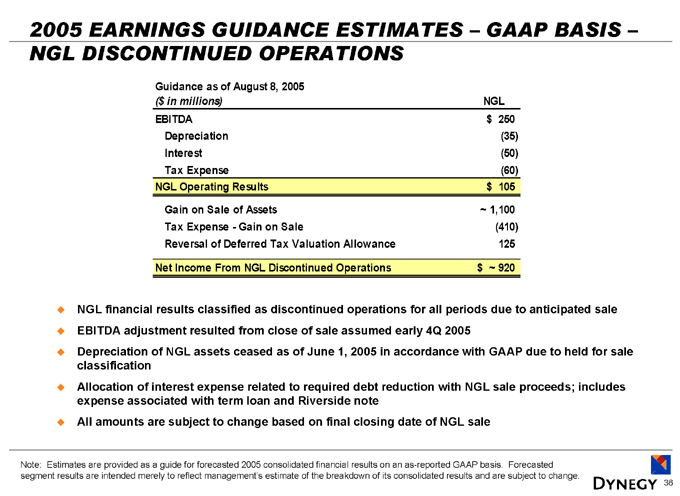
2005 EARNINGS GUIDANCE ESTIMATES – GAAP BASIS –NGL DISCONTINUED OPERATIONS
Guidance as of August 8, 2005
($in millions) NGL
EBITDA $250
Depreciation (35)
Interest (50)
Tax Expense (60)
NGL Operating Results $105
Gain on Sale of Assets ~1,100
Tax Expense - Gain on Sale (410)
Reversal of Deferred Tax Valuation Allowance 125
Net Income From NGL Discontinued Operations $~920
NGL financial results classified as discontinued operations for all periods due to anticipated sale EBITDA adjustment resulted from close of sale assumed early 4Q 2005 Depreciation of NGL assets ceased as of June 1, 2005 in accordance with GAAP due to held for sale classification Allocation of interest expense related to required debt reduction with NGL sale proceeds; includes expense associated with term loan and Riverside note All amounts are subject to change based on final closing date of NGL sale
Note: Estimates are provided as a guide for forecasted 2005 consolidated financial results on an as-reported GAAP basis. Forecasted segment results are intended merely to reflect management’s estimate of the breakdown of its consolidated results and are subject to change.
36
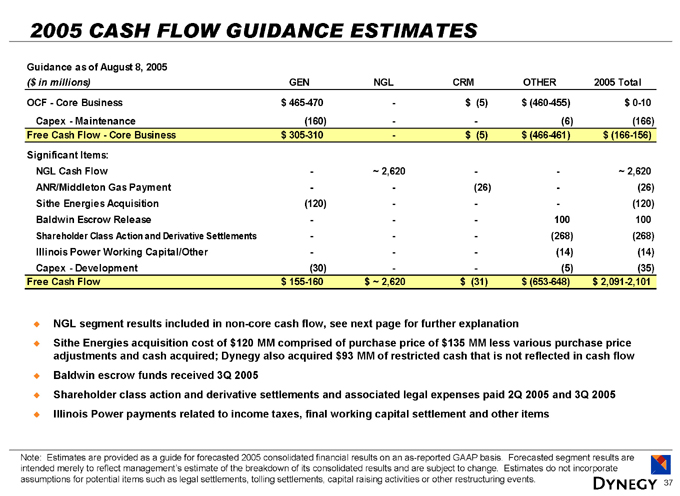
2005 CASH FLOW GUIDANCE ESTIMATES
Guidance as of August 8, 2005
($in millions) GEN NGL CRM OTHER 2005 Total
OCF - Core Business $465-470 - $(5) $(460-455) $0-10
Capex - Maintenance (160) - - (6) (166)
Free Cash Flow - Core Business $305-310 - $(5) $(466-461) $(166-156)
Significant Items:
NGL Cash Flow - ~2,620 - - ~2,620
ANR/Middleton Gas Payment - - (26) - (26)
Sithe Energies Acquisition (120) - - - (120)
Baldwin Escrow Release - - - 100 100
Shareholder Class Action and Derivative Settlements - - - (268) (268)
Illinois Power Working Capital/Other - - - (14) (14)
Capex - Development (30) - - (5) (35)
Free Cash Flow $155-160 $~2,620 $(31) $(653-648) $2,091-2,101
NGL segment results included in non-core cash flow, see next page for further explanation
Sithe Energies acquisition cost of $120 MM comprised of purchase price of $135 MM less various purchase price adjustments and cash acquired; Dynegy also acquired $93 MM of restricted cash that is not reflected in cash flow Baldwin escrow funds received 3Q 2005 Shareholder class action and derivative settlements and associated legal expenses paid 2Q 2005 and 3Q 2005 Illinois Power payments related to income taxes, final working capital settlement and other items
Note: Estimates are provided as a guide for forecasted 2005 consolidated financial results on an as-reported GAAP basis. Forecasted segment results are intended merely to reflect management’s estimate of the breakdown of its consolidated results and are subject to change. Estimates do not incorporate assumptions for potential items such as legal settlements, tolling settlements, capital raising activities or other restructuring events.
37
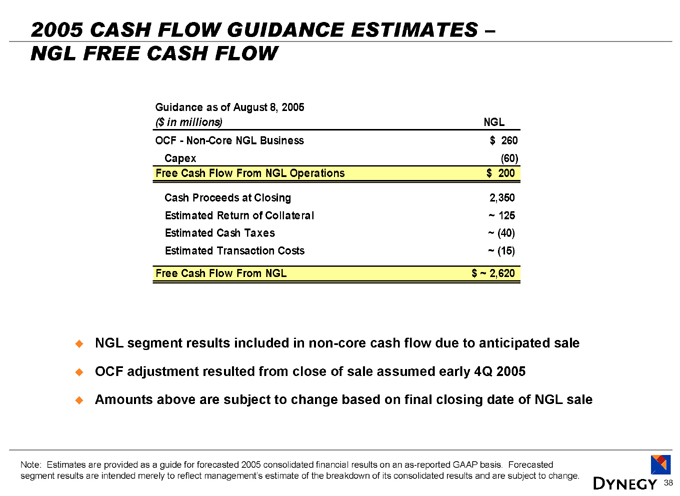
2005 CASH FLOW GUIDANCE ESTIMATES –NGL FREE CASH FLOW
Guidance as of August 8, 2005
($in millions) NGL
OCF - Non-Core NGL Business $260
Capex (60)
Free Cash Flow From NGL Operations $200
Cash Proceeds at Closing 2,350
Estimated Return of Collateral ~ 125
Estimated Cash Taxes ~ (40)
Estimated Transaction Costs ~ (15)
Free Cash Flow From NGL $~ 2,620
NGL segment results included in non-core cash flow due to anticipated sale OCF adjustment resulted from close of sale assumed early 4Q 2005 Amounts above are subject to change based on final closing date of NGL sale
Note: Estimates are provided as a guide for forecasted 2005 consolidated financial results on an as-reported GAAP basis. Forecasted segment results are intended merely to reflect management’s estimate of the breakdown of its consolidated results and are subject to change.
38
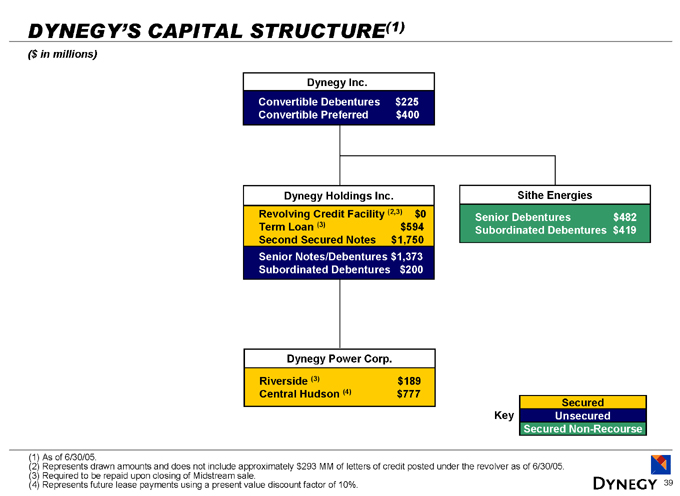
DYNEGY’S CAPITAL STRUCTURE(1)
($ in millions)
Dynegy Inc
Convertible Debentures $225
Convertible Preferred $400
Dynegy Holdings Inc.
Revolving Credit Facility(2,3) $0
Term Loan (3) $594
Second Secured Notes $1,750
Senior Notes/Debentures $1,373
Subordinated Debentures $200
Sithe Energies
Senior Debentures $482
Subordinated Debentures $419
Dynegy Power Corp.
Riverside (3) $189
Central Hudson (4) $777
Key
Secured Unsecured Secured Non-Recourse
(1) As of 6/30/05.
(2) Represents drawn amounts and does not include approximately $293 MM of letters of credit posted under the revolver as of 6/30/05. (3) Required to be repaid upon closing of Midstream sale.
(4) Represents future lease payments using a present value discount factor of 10%.
39
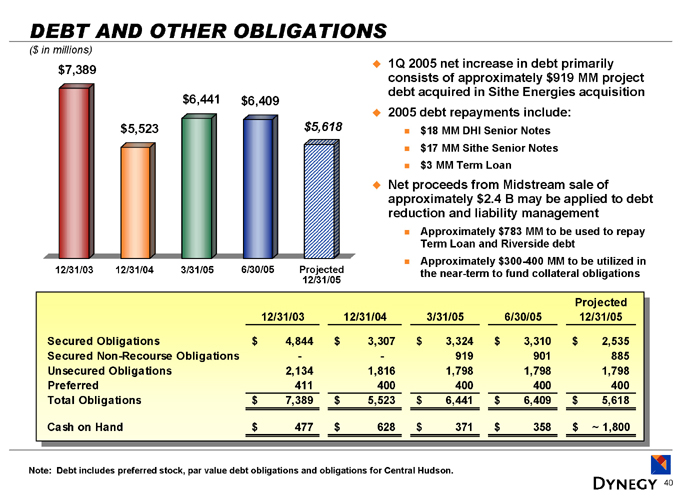
DEBT AND OTHER OBLIGATIONS
($ in millions) $7,389 $5,523 $6,441 $6,409 $5,618
12/31/03 12/31/04 3/31/05 6/30/05
Projected 12/31/05
1Q 2005 net increase in debt primarily consists of approximately $919 MM project debt acquired in Sithe Energies acquisition 2005 debt repayments include: $18 MM DHI Senior Notes $17 MM Sithe Senior Notes $3 MM Term Loan
Net proceeds from Midstream sale of approximately $2.4 B may be applied to debt reduction and liability management
Approximately $783 MM to be used to repay Term Loan and Riverside debt Approximately $300-400 MM to be utilized in the near-term to fund collateral obligations
12/31/03 12/31/04 3/31/05 6/30/05 Projected 12/31/05
Secured Obligations $4,844 $3,307 $3,324 $3,310 $2,535
Secured Non-Recourse Obligations - - 919 901 885
Unsecured Obligations 2,134 1,816 1,798 1,798 1,798
Preferred 411 400 400 400 400
Total Obligations $7,389 $5,523 $6,441 $6,409 $5,618
Cash on Hand $477 $628 $371 $358 $ 1,800
Note: Debt includes preferred stock, par value debt obligations and obligations for Central Hudson.
40
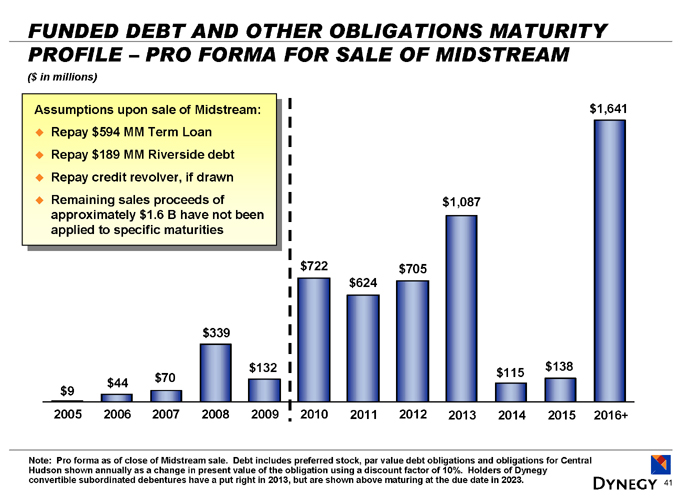
FUNDED DEBT AND OTHER OBLIGATIONS MATURITY PROFILE – PRO FORMA FOR SALE OF MIDSTREAM
($ in millions)
Assumptions upon sale of Midstream:
Repay $594 MM Term Loan Repay $189 MM Riverside debt Repay credit revolver, if drawn Remaining sales proceeds of approximately $1.6 B have not been applied to specific maturities $9 $44 $70 $339 $132 $722 $624 $705 $1,087 $115 $138 $1,641
2005 2006 2007 2008 2009 2010 2011 2012 2013 2014 2015 2016+
Note: Pro forma as of close of Midstream sale. Debt includes preferred stock, par value debt obligations and obligations for Central Hudson shown annually as a change in present value of the obligation using a discount factor of 10%. Holders of Dynegy convertible subordinated debentures have a put right in 2013, but are shown above maturing at the due date in 2023.
41
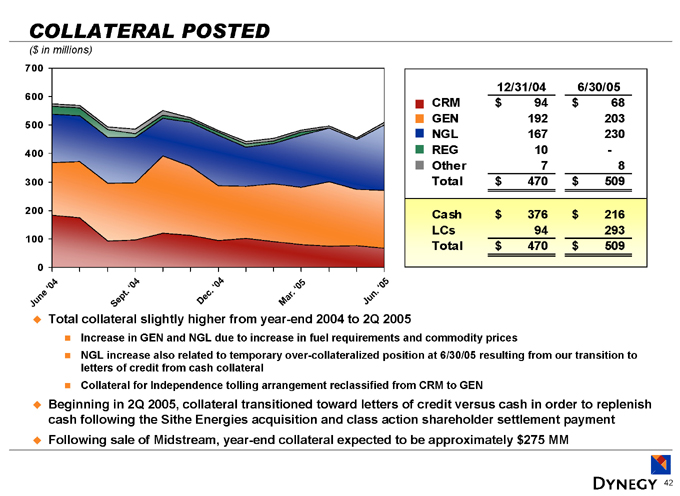
COLLATERAL POSTED
($ in millions)
700 600 500 400 300 200 100 0
June ‘04 Sept. ‘04 Dec. ‘04 Mar. ‘05 Jun. ‘05
12/31/04 6/30/05
CRM $94 $68
GEN 192 203
NGL 167 230
REG 10 -
Other 7 8
Total $470 $509
Cash $376 $216
LCs 94 293
Total $470 $509
Total collateral slightly higher from year-end 2004 to 2Q 2005
Increase in GEN and NGL due to increase in fuel requirements and commodity prices
NGL increase also related to temporary over-collateralized position at 6/30/05 resulting from our transition to letters of credit from cash collateral
Collateral for Independence tolling arrangement reclassified from CRM to GEN
Beginning in 2Q 2005, collateral transitioned toward letters of credit versus cash in order to replenish cash following the Sithe Energies acquisition and class action shareholder settlement payment Following sale of Midstream, year-end collateral expected to be approximately $275 MM
42
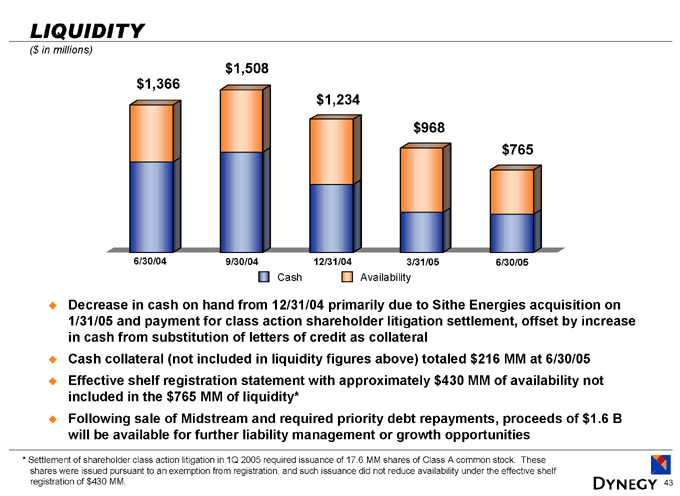
LIQUIDITY
($ in millions) $1,366 $1,508 $1,234 $968 $765
6/30/04 9/30/04 12/31/04 3/31/05 6/30/05
Cash Availability
Decrease in cash on hand from 12/31/04 primarily due to Sithe Energies acquisition on 1/31/05 and payment for class action shareholder litigation settlement, offset by increase in cash from substitution of letters of credit as collateral Cash collateral (not included in liquidity figures above) totaled $216 MM at 6/30/05 Effective shelf registration statement with approximately $430 MM of availability not included in the $765 MM of liquidity* Following sale of Midstream and required priority debt repayments, proceeds of $1.6 B will be available for further liability management or growth opportunities
* Settlement of shareholder class action litigation in 1Q 2005 required issuance of 17.6 MM shares of Class A common stock. These shares were issued pursuant to an exemption from registration, and such issuance did not reduce availability under the effective shelf registration of $430 MM.
43
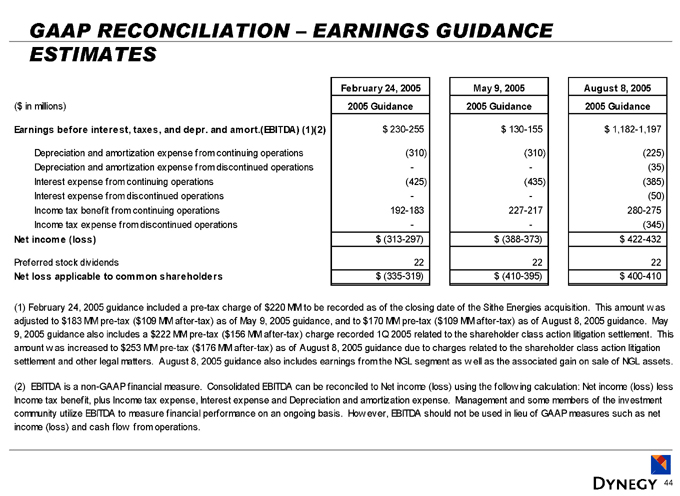
GAAP RECONCILIATION – EARNINGS GUIDANCE ESTIMATES
February 24, 2005 May 9, 2005 August 8, 2005
($in millions) 2005 Guidance 2005 Guidance 2005 Guidance
Earnings before interest, taxes, and depr. and amort.(EBITDA) (1)(2) $230-255 $130-155 $1,182-1,197
Depreciation and amortization expense from continuing operations (310) (310) (225)
Depreciation and amortization expense from discontinued operations - - (35)
Interest expense from continuing operations (425) (435) (385)
Interest expense from discontinued operations - - (50)
Income tax benefit from continuing operations 192-183 227-217 280-275
Income tax expense from discontinued operations - - (345)
Net income (loss) $(313-297) $(388-373) $422-432
Preferred stock dividends 22 22 22
Net loss applicable to common shareholders $(335-319) $(410-395) $400-410
(1) February 24, 2005 guidance included a pre-tax charge of $220 MM to be recorded as of the closing date of the Sithe Energies acquisition. This amount was adjusted to $183 MM pre-tax ($109 MM after-tax) as of May 9, 2005 guidance, and to $170 MM pre-tax ($109 MM after-tax) as of August 8, 2005 guidance. May 9, 2005 guidance also includes a $222 MM pre-tax ($156 MM after-tax) charge recorded 1Q 2005 related to the shareholder class action litigation settlement. This amount was increased to $253 MM pre-tax ($176 MM after-tax) as of August 8, 2005 guidance due to charges related to the shareholder class action litigation settlement and other legal matters. August 8, 2005 guidance also includes earnings from the NGL segment as well as the associated gain on sale of NGL assets.
(2) EBITDA is a non-GAAP financial measure. Consolidated EBITDA can be reconciled to Net income (loss) using the following calculation: Net income (loss) less Income tax benefit, plus Income tax expense, Interest expense and Depreciation and amortization expense. Management and some members of the investment community utilize EBITDA to measure financial performance on an ongoing basis. How ever, EBITDA should not be used in lieu of GAAP measures such as net income (loss) and cash flow from operations.
44
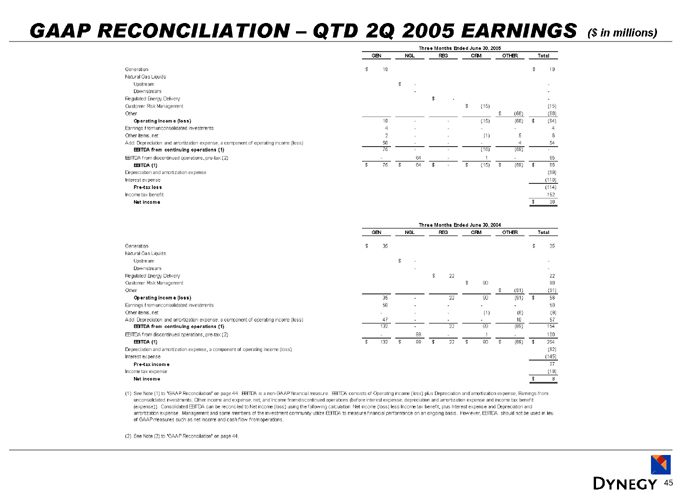
GAAP RECONCILIATION – QTD 2Q 2005 EARNINGS ($ in millions)
Three Months Ended June 30, 2005
GEN NGL REG CRM OTHER Total
Generation $19 $19
Natural Gas Liquids
Upstream $- -
Downstream - -
Regulated Energy Delivery $- -
Customer Risk Management $(15) (15)
Other $(68) (68)
Operating income (loss) 19 - - (15) (68) $(64)
Earnings from unconsolidated investments 4 - - - - 4
Other items, net 2 - - (1) 5 6
Add: Depreciation and amortization expense, a component of operating income (loss) 50 - - - 4 54
EBITDA from continuing operations (1) 75 - - (16) (59) -
EBITDA from discontinued operations, pre-tax (2) - 64 - 1 - 65
EBITDA (1) $75 $64 $- $(15) $(59) $65
Depreciation and amortization expense (69)
Interest expense (110)
Pre-tax loss (114)
Income tax benefit 152
Net income $38
Three Months Ended June 30, 2004
GEN NGL REG CRM OTHER Total
Generation $35 $35
Natural Gas Liquids
Upstream $- -
Downstream - -
Regulated Energy Delivery $22 22
Customer Risk Management $90 90
Other $(91) (91)
Operating income (loss) 35 - 22 90 (91) $56
Earnings from unconsolidated investments 50 - - - - 50
Other items, net - - - (1) (8) (9)
Add: Depreciation and amortization expense, a component of operating income (loss) 47 - - - 10 57
EBITDA from continuing operations (1) 132 - 22 89 (89) 154
EBITDA from discontinued operations, pre-tax (2) - 99 - 1 - 100
EBITDA (1) $132 $99 $22 $90 $(89) $254
Depreciation and amortization expense, a component of operating income (loss) (82)
Interest expense (145)
Pre-tax income 27
Income tax expense (19)
Net income $8
(1) See Note (1) to “GAAP Reconciliation” on page 44. EBITDA is a non-GAAP financial measure. EBITDA consists of Operating income (loss) plus Depreciation and amortization expense; Earnings from unconsolidated investments; Other income and expense, net; and Income from discontinued operations (before interest expense, depreciation and amortization expense and income tax benefit (expense)). Consolidated EBITDA can be reconciled to Net income (loss) using the following calculation: Net income (loss) less Income tax benefit, plus Interest expense and Depreciation and amortization expense. Management and some members of the investment community utilize EBITDA to measure financial performance on an ongoing basis. However, EBITDA should not be used in lieu of GAAP measures such as net income and cash flow from operations.
(2) See Note (2) to “GAAP Reconciliation” on page 44.
45
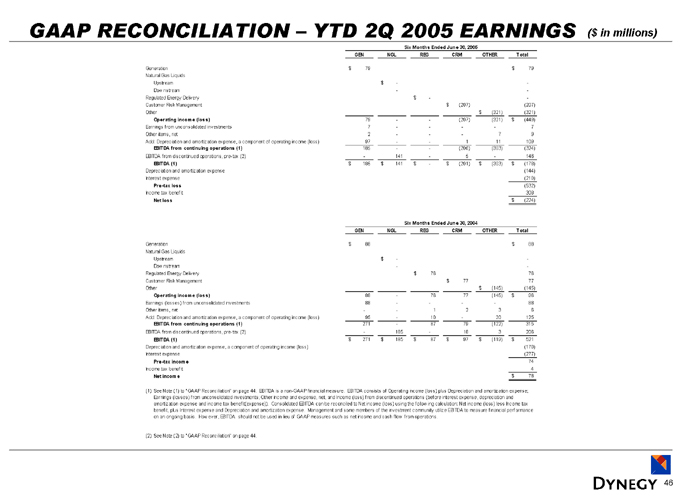
GAAP RECONCILIATION – YTD 2Q 2005 EARNINGS ($ in millions)
Six Months Ended June 30, 2005
GEN NGL REG CRM OTHER Total
Generation $79 $79
Natural Gas Liquids
Upstream $- -
Downstream - -
Regulated Energy Delivery $- -
Customer Risk Management $(207) (207)
Other $(321) (321)
Operating income (loss) 79 - - (207) (321) $(449)
Earnings from unconsolidated investments 7 - - - - 7
Other items, net 2 - - - 7 9
Add: Depreciation and amortization expense, a component of operating income (loss) 97 - - 1 11 109
EBITDA from continuing operations (1) 185 - - (206) (303) (324)
EBITDA from discontinued operations, pre-tax (2) - 141 - 5 - 146
EBITDA (1) $185 $141 $- $(201) $(303) $(178)
Depreciation and amortization expense (144)
Interest expense (210)
Pre-tax loss (532)
Income tax benefit 308
Net loss $(224)
Six Months Ended June 30, 2004
GEN NGL REG CRM OTHER Total
Generation $88 $88
Natural Gas Liquids
Upstream $- -
Downstream - -
Regulated Energy Delivery $76 76
Customer Risk Management $77 77
Other $(145) (145)
Operating income (loss) 88 - 76 77 (145) $96
Earnings (losses) from unconsolidated investments 88 - - - - - 88
Other items, net - - 1 2 3 6
Add: Depreciation and amortization expense, a component of operating income (loss) 95 - 10 - 20 125
EBITDA from continuing operations (1) 271 - 87 79 (122) 315
EBITDA from discontinued operations, pre-tax (2) - 185 - 18 3 206
EBITDA (1) $271 $185 $87 $97 $(119) $521
Depreciation and amortization expense, a component of operating income (loss) (170)
Interest expense (277)
Pre-tax income 74
Income tax benefit 4
Net income $78
(1) See Note (1) to “GAAP Reconciliation” on page 44. EBITDA is a non-GAAP financial measure. EBITDA consists of Operating income (loss) plus Depreciation and amortization expense;
Earnings (losses) from unconsolidated investments; Other income and expense, net; and Income (loss) from discontinued operations (before interest expense, depreciation and amortization expense and income tax benefit(expense)). Consolidated EBITDA can be reconciled to Net income (loss) using the follow ing calculation: Net income (loss) less Income tax benefit, plus Interest expense and Depreciation and amortization expense. Management and some members of the investment community utilize EBITDA to measure financial performance on an ongoing basis. However, EBITDA should not be used in lieu of GAAP measures such as net income and cash flow from operations.
(2) See Note (2) to “GAAP Reconciliation” on page 44.
46
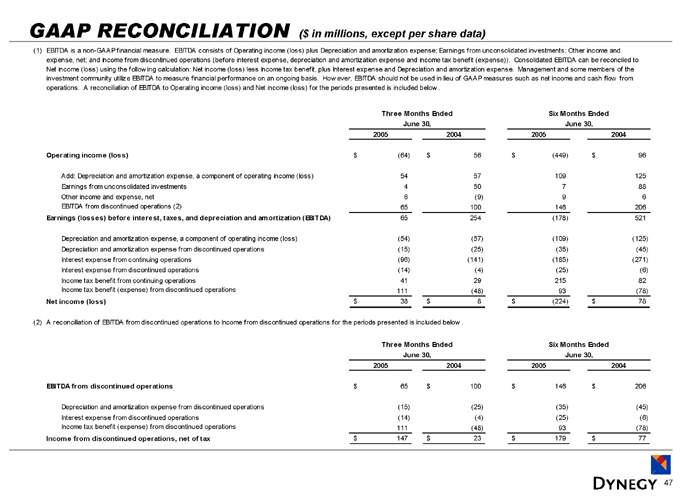
GAAP RECONCILIATION ($ in millions, except per share data)
(1) EBITDA is a non-GAAP financial measure. EBITDA consists of Operating income (loss) plus Depreciation and amortization expense; Earnings from unconsolidated investments; Other income and expense, net; and Income from discontinued operations (before interest expense, depreciation and amortization expense and income tax benefit (expense)). Consolidated EBITDA can be reconciled to Net income (loss) using the following calculation: Net income (loss) less Income tax benefit, plus Interest expense and Depreciation and amortization expense. Management and some members of the investment community utilize EBITDA to measure financial performance on an ongoing basis. How ever, EBITDA should not be used in lieu of GAAP measures such as net income and cash flow from operations. A reconciliation of EBITDA to Operating income (loss) and Net income (loss) for the periods presented is included below.
Three Months Ended June 30, Six Months Ended June 30,
2005 2004 2005 2004
Operating income (loss) $(64) $56 $(449) $96
Add: Depreciation and amortization expense, a component of operating income (loss) 54 57 109 125
Earnings from unconsolidated investments 4 50 7 88
Other income and expense, net 6 (9) 9 6
EBITDA from discontinued operations (2) 65 100 146 206
Earnings (losses) before interest, taxes, and depreciation and amortization (EBITDA) 65 254 (178) 521
Depreciation and amortization expense, a component of operating income (loss) (54) (57) (109) (125)
Depreciation and amortization expense from discontinued operations (15) (25) (35) (45)
Interest expense from continuing operations (96) (141) (185) (271)
Interest expense from discontinued operations (14) (4) (25) (6)
Income tax benefit from continuing operations 41 29 215 82
Income tax benefit (expense) from discontinued operations 111 (48) 93 (78)
Net income (loss) $38 $8 $(224) $78
(2) A reconciliation of EBITDA from discontinued operations to Income from discontinued operations for the periods presented is included below.
Three Months Ended June 30, Six Months Ended June 30,
2005 2004 2005 2004
EBITDA from discontinued operations $65 $100 $146 $206
Depreciation and amortization expense from discontinued operations (15) (25) (35) (45)
Interest expense from discontinued operations (14) (4) (25) (6)
Income tax benefit (expense) from discontinued operations 111 (48) 93 (78)
Income from discontinued operations, net of tax $147 $23 $179 $77
47
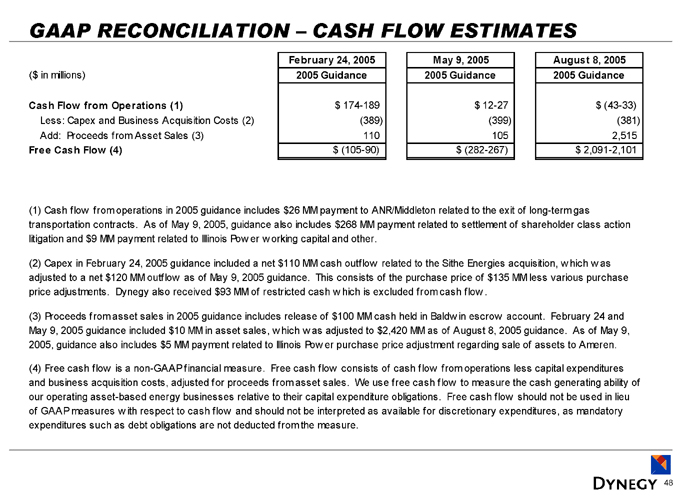
GAAP RECONCILIATION – CASH FLOW ESTIMATES
February 24, 2005 May 9, 2005 August 8, 2005
($ in millions) 2005 Guidance 2005 Guidance 2005 Guidance
Cash Flow from Operations (1) $ 174-189 $ 12-27 $ (43-33)
Less: Capex and Business Acquisition Costs (2) (389) (399) (381)
Add: Proceeds from Asset Sales (3) 110 105 2,515
Free Cash Flow (4) $ (105-90) $ (282-267) $ 2,091-2,101
(1) Cash flow from operations in 2005 guidance includes $26 MM payment to ANR/Middleton related to the exit of long-term gas transportation contracts. As of May 9, 2005, guidance also includes $268 MM payment related to settlement of shareholder class action litigation and $9 MM payment related to Illinois Power working capital and other.
(2) Capex in February 24, 2005 guidance included a net $110 MM cash outflow related to the Sithe Energies acquisition, which was adjusted to a net $120 MM outflow as of May 9, 2005 guidance. This consists of the purchase price of $135 MM less various purchase price adjustments. Dynegy also received $93 MM of restricted cash which is excluded from cash flow.
(3) Proceeds from asset sales in 2005 guidance includes release of $100 MM cash held in Baldwin escrow account. February 24 and May 9, 2005 guidance included $10 MM in asset sales, which was adjusted to $2,420 MM as of August 8, 2005 guidance. As of May 9, 2005, guidance also includes $5 MM payment related to Illinois Power purchase price adjustment regarding sale of assets to Ameren.
(4) Free cash flow is a non-GAAP financial measure. Free cash flow consists of cash flow from operations less capital expenditures and business acquisition costs, adjusted for proceeds from asset sales. We use free cash flow to measure the cash generating ability of our operating asset-based energy businesses relative to their capital expenditure obligations. Free cash flow should not be used in lieu of GAAP measures with respect to cash flow and should not be interpreted as available for discretionary expenditures, as mandatory expenditures such as debt obligations are not deducted from the measure.
48
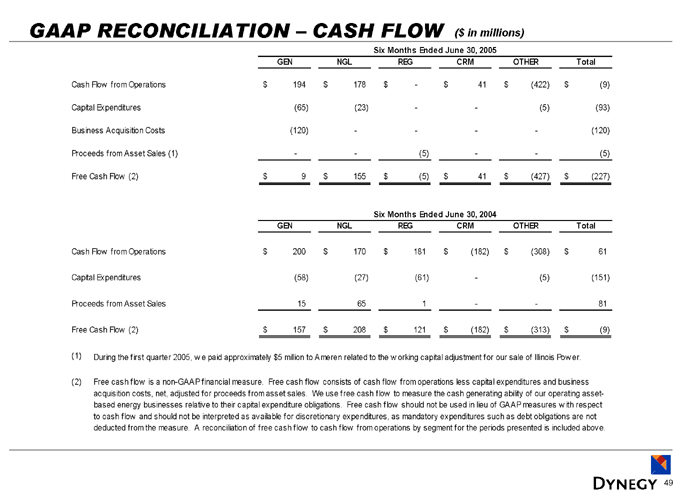
GAAP RECONCILIATION – CASH FLOW ($ in millions)
Six Months Ended June 30, 2005
GEN NGL REG CRM OTHER Total
Cash Flow from Operations $194 $178 $- $41 $(422) $(9)
Capital Expenditures (65) (23) - - (5) (93)
Business Acquisition Costs (120) - - - - (120)
Proceeds from Asset Sales (1) - - (5) - - (5)
Free Cash Flow (2) $9 $155 $(5) $41 $(427) $(227)
Six Months Ended June 30, 2004
GEN NGL REG CRM OTHER Total
Cash Flow from Operations $200 $170 $181 $(182) $(308) $61
Capital Expenditures (58) (27) (61) - (5) (151)
Proceeds from Asset Sales 15 65 1 - - 81
Free Cash Flow (2) $157 $208 $121 $(182) $(313) $(9)
(1) During the first quarter 2005, we paid approximately $5 million to Ameren related to the working capital adjustment for our sale of Illinois Power.
(2) Free cash flow is a non-GAAP financial measure. Free cash flow consists of cash flow from operations less capital expenditures and business acquisition costs, net, adjusted for proceeds from asset sales. We use free cash flow to measure the cash generating ability of our operating asset-based energy businesses relative to their capital expenditure obligations. Free cash flow should not be used in lieu of GAAP measures with respect to cash flow and should not be interpreted as available for discretionary expenditures, as mandatory expenditures such as debt obligations are not deducted from the measure. A reconciliation of free cash flow to cash flow from operations by segment for the periods presented is included above.
49