WABASH NATIONAL CORPORATION RW Baird Global Industrial Conference November 11, 2020

Safe Harbor Statement & N on -GAAP F inancial Measures This presentation contains certain forward-looking statements as defined by the Private Securities Litigation Reform Act of 1995. Forward-looking statements convey Wabash National Corporation's (the "Company") current expectations or forecasts of future events. All statements contained in this presentation other than statements of historical fact are forward-looking statements. These forward-looking statements include, among other things, all statements regarding the Company’s outlook for trailer and truck body shipments, backlog, expectations regarding demand levels for trailers, truck bodies, non-trailer equipment and our other diversified product offerings, pricing, profitability and earnings, cash flow and liquidity, opportunity to capture higher margin sales, new product innovations, our growth and diversification strategies, our expectations for improved financial performance during the course of the year and our expectations with regards to capital allocation. These and the Company’s other forward-looking statements are subject to certain risks and uncertainties that could cause actual results to differ materially from those implied by the forward-looking statements. Without limitation, these risks and uncertainties include a continued or prolonged shutdown or reduction of our operations, substantially reduced customer orders or sales volumes and supply disruptions due to the coronavirus (COVID-19) outbreak, the continued integration of Supreme into the Company’s business, adverse reactions to the transaction by customers, suppliers or strategic partners, uncertain economic conditions including the possibility that customer demand may not meet our expectations, increased competition, reliance on certain customers and corporate partnerships, risks of customer pick-up delays, shortages and costs of raw materials including the impact of tariffs or other international trade developments, risks in implementing and sustaining improvements in the Company’s manufacturing operations and cost containment, dependence on industry trends and timing, supplier constraints, labor costs and availability, customer acceptance of and reactions to pricing changes and costs of indebtedness. Readers should review and consider the various disclosures made by the Company in this presentation and in the Company’s reports to its stockholders and periodic reports on Forms 10-K and 10-Q. We cannot give assurance that the expectations reflected in our forward-looking statements will prove to be correct. Our actual results could differ materially from those anticipated in these forward-looking statements. All written and oral forward-looking statements attributable to us are expressly qualified in their entirety by the factors we disclose that could cause our actual results to differ materially from our expectations. In addition to disclosing financial results calculated in accordance with United States generally accepted accounting principles (GAAP), the financial information included in this presentation contains non-GAAP financial measures, including free cash flow. This non-GAAP measure should not be considered a substitute for, or superior to, financial measures and results calculated in accordance with GAAP, including net income (loss) and cash provided by operating activities, and reconciliations to GAAP financial statements should be carefully evaluated. Free cash flow is defined as net cash provided by operating activities minus capital expenditures. Management believes providing free cash flow is useful for investors to understand the Company’s performance and results of cash generation period to period with the exclusion of the item identified above. Management believes the presentation of free cash flow, when combined with the GAAP presentations of cash provided by operating activities, is beneficial to an investor’s understanding of the Company’s operating performance. A reconciliation of free cash flow to cash provided by operating activities is included in this presentation. 2 2

Wabash National – Changing How the World Reaches You Key Messages . Wabash National is the leader in transportation solutions with a portfolio of equipment spanning from First to Final Mile. . New organizational structure facilitates ease of doing business while allowing $20M of run-rate cost reduction. . Exciting growth opportunities within Cold Chain, Home Delivery and Parts & Services. . Strong execution in a difficult 2020 market environment: decremental margins of 15% in Q2, 13% in Q3 as a result of rapid cost control. Strong YTD free cash flow generation. . Wabash National is uniquely incentivized to align with ESG trends as weight reduction, improved aerodynamics and enhanced thermal efficiency add value for customers. 3 3

Wabash at a Glance (NYSE: WNC) 1985 Lafayette, IN ~$900M 1 ~6,900 17 $2.3B 6.2% $109M Founded Headquarters Market-cap Global Employees Manufacturing 2019 Revenue 2019 Operating 2019 Free Cash Locations Margin Flow 2019 Revenue by Segment 19% Commercial Trailer Products 16% Diversified Products 65% Final Mile Products Vision To be the innovation leader of engineered solutions for the transportation, logistics and distribution industries 4 4 1 As of 11’06’2020 4

Portfolio of Engineered Solutions COMMERCIAL TRAILER DIVERSIFIED PRODUCTS FINAL MILE $1.5B 1 $385M1 $442M1 PRODUCTS (CTP) GROUP (DPG) PRODUCTS (FMP) . Dry and Refrigerated Van Trailers . Tank Trailers and Truck-Mounted Tanks . Truck-Mounted Dry Bodies . Platform Trailers . Composite Panels and Products . Truck-Mounted Refrigerated Bodies . Aftermarket Parts and Service . Food, Dairy and Beverage Equipment . Service and Stake Bodies . Containment and Aseptic Systems . FRP Panel Sales . Aftermarket Parts and Service . Upfitting Parts and Services Leading Brands in Diverse End Markets and Industries 5 5 1 2019 Revenue 5

Broadening Exposure Across Transportation, Logistics and Distribution FIRST MILE MIDDLE MILE FINAL MILE . Long-haul routes of goods . Products moved into or redistributed . Delivery of goods to home or final among fulfillment centers destination . Driven by freight activity . Driven by strategic positioning of goods . Driven by strong growth in e-Commerce . Traditional First Mile carriers can no to allow for 2-day delivery or less longer ignore Middle and Final Mile . Positioning to be a more strategic player opportunities in Final Mile: invest in technology; focus on operational excellence; disciplined and strategic M&A Our Portfolio of Solutions Spans First to Final Mile 6 6

Our Future Will be Built as One Wabash Purpose To change how the world reaches you To be the innovation leader of engineered solutions for the transportation, Vision logistics and distribution industries To enable our customers to succeed with breakthrough ideas and solutions Mission that help them move everything from first to final mile Refreshed Purpose, Vision, Mission Drive Alignment with Strategic Plan 7 7

Change is Underway: Strategy, Organization & Culture Catalyst for Change: Helping our Customers Move Everything from First to Final Mile Strategy Focused • Strategic focus narrowed - able to scale core competencies by growing in and around core markets with known customers • Increased commitment to leverage innovation to provide differentiated, breakthrough solutions for customers • “One Wabash” approach to our customers and business • We have an exciting future; engineering the equipment that will support changes in transportation, logistics and distribution Organizing to Enable our Strategy • Unified sales organization, focused on creating value for customers • Elimination of silos across businesses, fully integrating prior acquisitions • Acceleration of Wabash Management System implementation to drive process discipline and continuous improvement • Standardizing processes and integrating systems, readying the backbone of the company for future growth • Right-sized cost structure, reducing layers, simplifying the organization • Footprint optimization & rationalization 8 8

New Organizational Structure Benefits All Stakeholders 2019 2020 thru 2022 • Streamlined commercial structure to facilitate ease of interaction Customers • Enhanced ability to innovate to support rapidly changing transportation needs • Strategic partner with a diverse portfolio of transportation equipment • Broader span of control, reducing organizational complexity Employees • Stronger company with greater focus on innovation and exciting growth markets • Opportunities for career development across diverse transportation equipment products • Improved cost structure through elimination of redundancies Shareholders • Accelerating growth through greater customer intimacy increasing share of wallet • Enhanced focus on margin accretive Parts & Service initiative 9 9

Strategic Growth Focus 2019 2020 thru 2022 • Expand share in markets driven by movement of goods through the temperature- Cold Chain controlled cold chain • Bringing differentiated solutions to create customer value by leveraging innovative technology offerings (Molded Structural Composite, eNow, refrigerated inserts) • Grow within the rapidly expanding market for home delivery of goods Home Delivery • Augment truck body offering to include vehicles specifically engineered to facilitate efficient home delivery of small packages • Organic growth opportunities within trailer repair and truck body upfitting Parts & Services • Unifying historically disparate parts & services revenue streams to drive alignment and growth focus 10 10

COVID -19 Impact 2019 Market Conditions2020 thru 2022 • Phase 1: March – May 2020 • Phase 2: June 2020 – Current • Plummeting freight demand and declining freight rates. • Freight rates rapidly rise to strong levels on snap-back in Capacity (small & medium-sized carriers) exits the industry. demand • Final Mile equipment market heavily affected as truck body • eCommerce spending surges 45% YoY in Q2 2020 bolstering customers generally not professional freight carriers - some long-term outlook for Final Mile customers did not qualify as essential businesses. • Trailer orders log significant YoY increases Net Trailer Orders 200% 150% 100% 50% YoY 0% -50% -100% Jul-14 Jul-15 Jul-16 Jul-17 Jul-18 Jul-19 Jul-20 Jan-14 Jan-15 Jan-16 Jan-17 Jan-18 Jan-19 Jan-20 Oct-14 Oct-15 Oct-16 Oct-17 Oct-18 Oct-19 Apr-14 Apr-15 Apr-16 Apr-17 Apr-18 Apr-19 Apr-20 Source: FTR 11 11

Wabash National 2020 Performance Highlights 2019 2020 thru 2022 • Rapid action on cost control results in decremental margins in the mid-teens • Substantially positive free cash flow generation YTD in 2020 • Maintained dividend throughout crisis as a sign of more resilient portfolio and improved free cash flow profile • Balance sheet has remained strong with ample liquidity, no material covenants on outstanding debt 158 111 118 94 110 109 93 61 73 78 52 41 39 54 20 18 -8 -9 Free Cash Flow ($M) -32 -70 -144 2000 2001 2002 2003 2004 2005 2006 2007 2008 2009 2010 2011 2012 2013 2014 2015 2016 2017 2018 2019 2020 YTD Raising the Floor & Ceiling on Financial Performance Through the Cycle 12 12

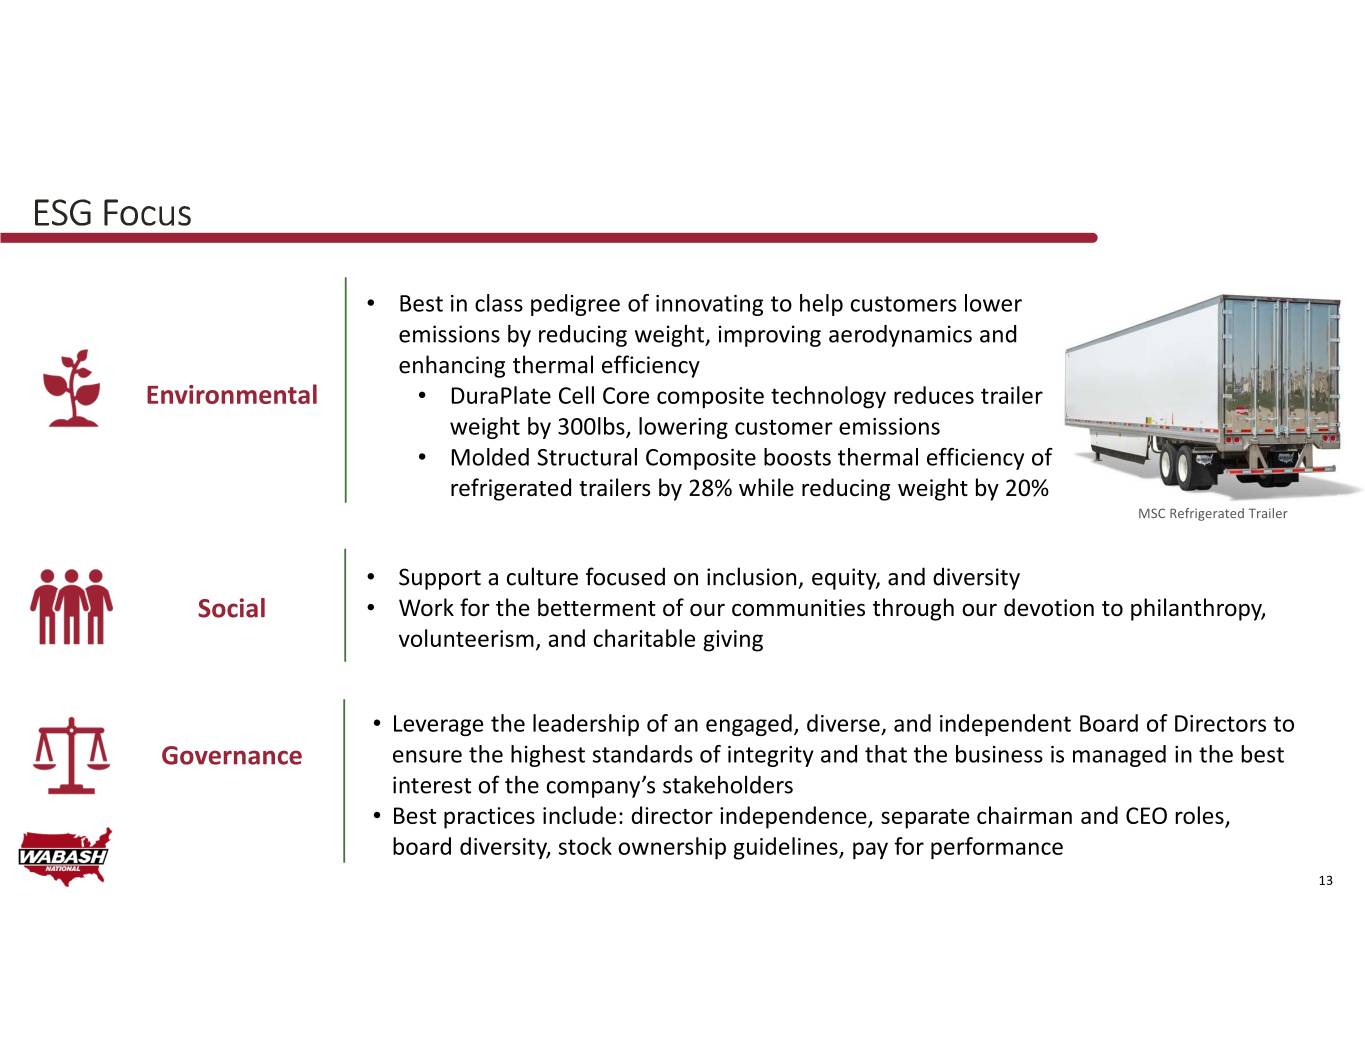
ESG Focus 2019 2020 thru 2022 • Best in class pedigree of innovating to help customers lower emissions by reducing weight, improving aerodynamics and enhancing thermal efficiency Environmental • DuraPlate Cell Core composite technology reduces trailer weight by 300lbs, lowering customer emissions • Molded Structural Composite boosts thermal efficiency of refrigerated trailers by 28% while reducing weight by 20% MSC Refrigerated Trailer • Support a culture focused on inclusion, equity, and diversity Social • Work for the betterment of our communities through our devotion to philanthropy, volunteerism, and charitable giving • Leverage the leadership of an engaged, diverse, and independent Board of Directors to Governance ensure the highest standards of integrity and that the business is managed in the best interest of the company’s stakeholders • Best practices include: director independence, separate chairman and CEO roles, board diversity, stock ownership guidelines, pay for performance 13 13

Free Cash Flow Reconciliation Unaudited - dollars in millions Nine Months Free Cash Flow 1 Twelve Months Ended December 31 Ended Sept 30 2000 2001 2002 2003 2004 2005 2006 2007 2008 2009 2010 2011 2012 2013 2014 2015 2016 2017 2018 2019 2020 Net cash provided by operating activities -13.70 6.39 109.88 58.26 56.92 50.50 51.77 60.69 30.67 -7.00 -30.30 -1.20 76.02 128.67 92.64 131.80 178.75 144.38 112.47 146.28 107.10 Capital expenditures -129.90 -76.30 -15.50 -6.50 -15.50 -30.90 -12.90 -6.70 -12.60 -1.00 -1.80 -7.30 -14.90 -18.40 -20.00 -20.80 -20.30 -26.10 -34.00 -37.60 -13.72 Free cash flow -143.60 -69.91 94.38 51.76 41.42 19.60 38.87 53.99 18.07 -8.00 -32.10 -8.50 61.12 110.27 72.64 111.00 158.45 118.28 78.47 108.68 93.38 1 Free cash flow is defined as net cash provided by (used in) operating activities minus capital expenditures. 14 14


