Exhibit 99.1

| (r) Annual Meeting of Stockholders June 2003 |
| Cautionary Statement This presentation will contain certain forward-looking statements, as defined by the Private Securities Litigation Reform Act of 1995. These forward-looking statements are, however, subject to certain risks and uncertainties that could cause actual results to differ materially from those implied by the forward-looking statements. Without limitation, these risks and uncertainties include increased competition, dependence on key management, reliance on certain customers and corporate partnerships, shortages of raw materials, dependence on industry trends, access to capital, acceptance of new technology and products, and government regulation. Listeners should review and consider the various disclosures made by the Company in this presentation and in its reports to its stockholders and periodic reports on Forms 10-K and 10-Q. |
| Goals Achieve The Numbers! Operational Excellence! Focus On Customer! Grow The Business! EXECUTION IS CRITICAL KEEP IT SIMPLE |
| Critical Issues Cash Generation Safety Quality Schedule Attainment & Capacity Product & Process Standardization Branch Integration & Optimization Continuous Improvement Everywhere Operational Excellence & Financial Strength |

| Overview |

| Trucking Industry: 2000 to 20?? Fuel cost spikes Rising insurance costs Declining asset values Limited capital Economic recession Record failures Consolidation "THE PERFECT STORM" |
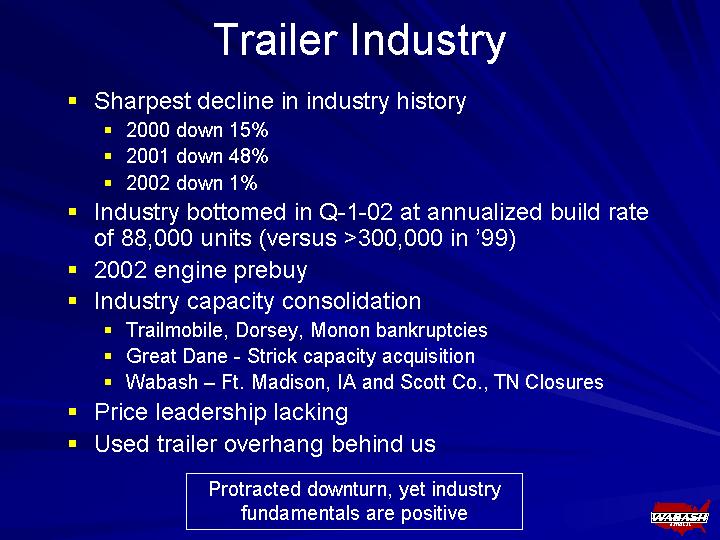
| Trailer Industry Sharpest decline in industry history 2000 down 15% 2001 down 48% 2002 down 1% Industry bottomed in Q-1-02 at annualized build rate of 88,000 units (versus >300,000 in '99) 2002 engine prebuy Industry capacity consolidation Trailmobile, Dorsey, Monon bankruptcies Great Dane - Strick capacity acquisition Wabash - Ft. Madison, IA and Scott Co., TN Closures Price leadership lacking Used trailer overhang behind us Protracted downturn, yet industry fundamentals are positive |
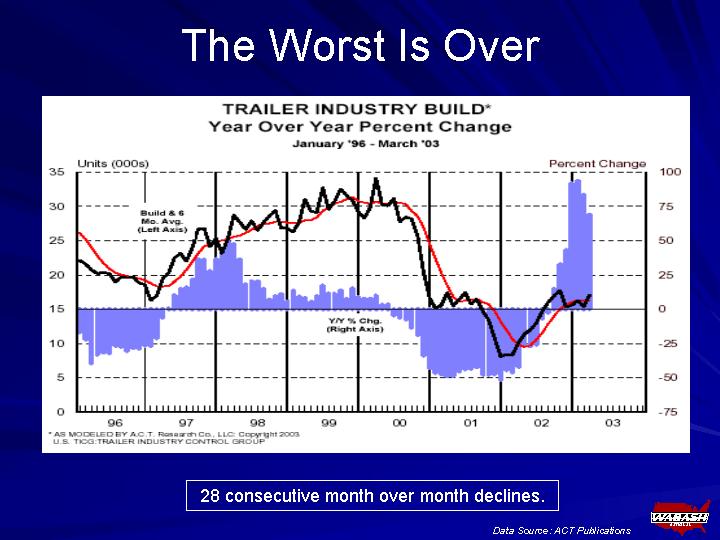
| The Worst Is Over 28 consecutive month over month declines. Data Source: ACT Publications Data Source: ACT Publications |

| Total TL, LTL and Other Truck Capital Expenditure Comparison 2002 Actual 2003 Estimated Tractors 56.68 45.8 Trailers 25.02 44.51 Other 17.55 27.47 Tractors, $56.68 57.1% Tractors, $45.80 38.9% Trailers, $25.02 25.2% Trailers, $44.51 37.8% Other, $27.47 23.3% Other, $17.55 17.7% Data Source: Bear, Stearns & Co. Inc. 2003 Trucking Capacity Survey 78% YOY Increase |
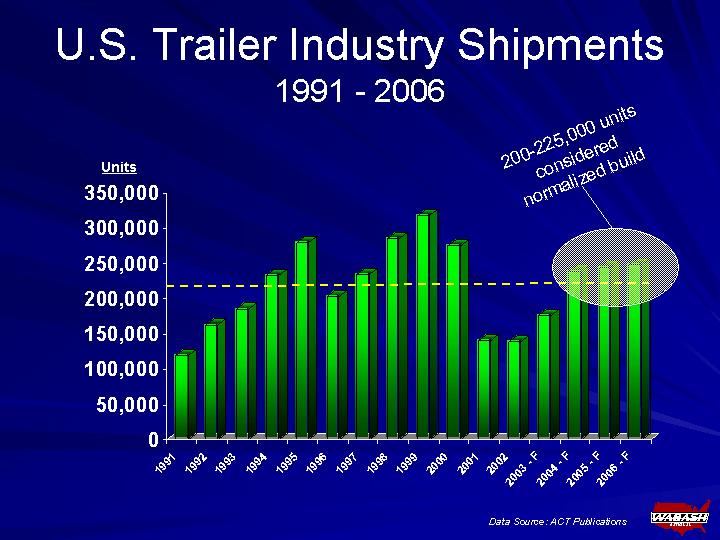
| U.S. Trailer Industry Shipments 1991 - 2006 Data Source: ACT Publications 1985 1986 1987 1988 1989 1990 1991 1992 1993 1994 1995 1996 1997 1998 1999 2000 2001 2002 2003 - F 2004 - F 2005 - F 2006 - F Total Trailers 179000 173000 164000 161000 161000 147677 120156 162881 185304 233189 279242 202952 235517 285230 318788 275223 140100 139658 176600 239000 245500 248800 Units 200-225,000 units considered normalized build |
| Wabash National Business Model Strong Core Customers Proprietary Products Retail, Service & Distribution Network |

| Truckload Market Consolidation 1st Qtr 2nd Qtr 3rd Qtr 4th Qtr Other 0.99 27.4 90 20.4 Top Ten Carriers 0.01 1st Qtr 2nd Qtr 3rd Qtr 4th Qtr Other 0.89 27.4 90 20.4 Top Ten Carriers 0.11 Other - 99% Top-10 Carriers - 1% 1980 2000 Other - 89% Top-10 Carriers - 11% Data Source: Eno Transportation Foundation Trend will continue at accelerated pace |

| (r) Core Customers |

| DuraPlate(r) Trailer Production 1997 1998 1999 2000 2001 2002 East 7288 17983 36649 36755 24782 27275 West 15.1 29.5 52.5 55.5 78.2 78.6 In Units Percentage % Low maintenance Excellent long-term durability Excellent trade-in value 25% of dry freight market uses DuraPlate(r) trailers Growing at 3-5% per year |
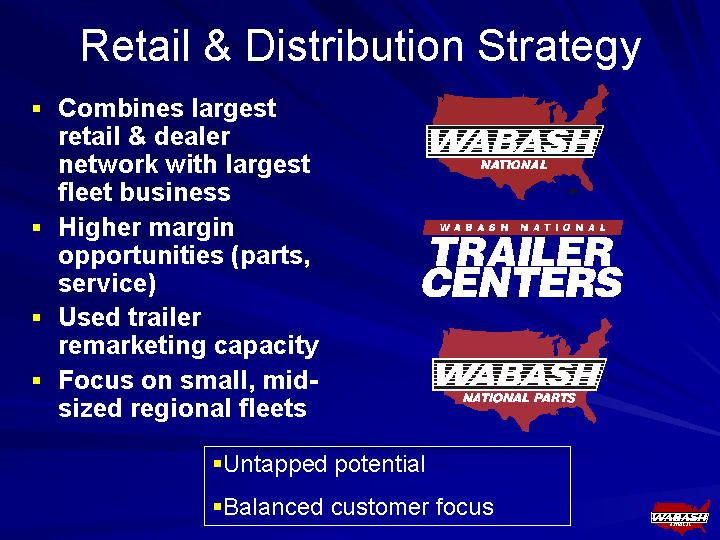
| Retail & Distribution Strategy Combines largest retail & dealer network with largest fleet business Higher margin opportunities (parts, service) Used trailer remarketing capacity Focus on small, mid- sized regional fleets sized regional fleets sized regional fleets sized regional fleets sized regional fleets sized regional fleets sized regional fleets sized regional fleets sized regional fleets sized regional fleets sized regional fleets sized regional fleets Untapped potential Balanced customer focus Balanced customer focus Balanced customer focus |
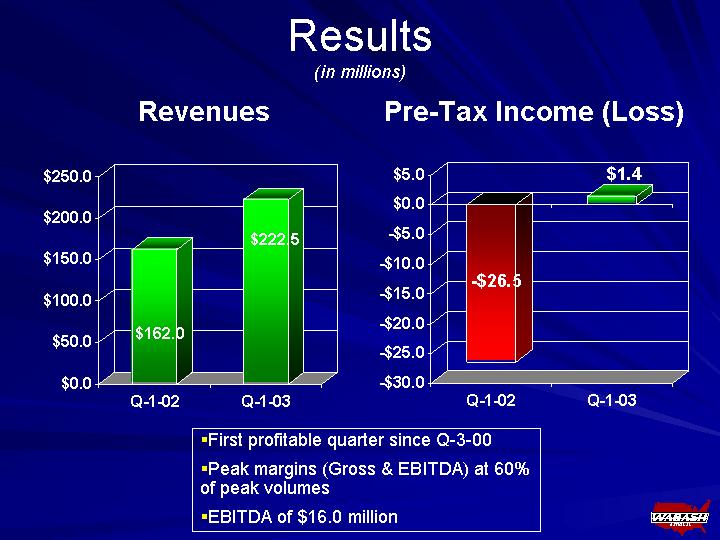
| Results (in millions) Revenues Q-1-02 Q-1-03 East -26.5 1.4 Q-1-02 Q-1-03 East 162 222.5 Pre-Tax Income (Loss) First profitable quarter since Q-3-00 Peak margins (Gross & EBITDA) at 60% of peak volumes EBITDA of $16.0 million |

| Total Debt Levels $110 million (24%) Debt Reduction $100 million in debt reduction in 2002 $100 million debt reduction goal for 2003 |
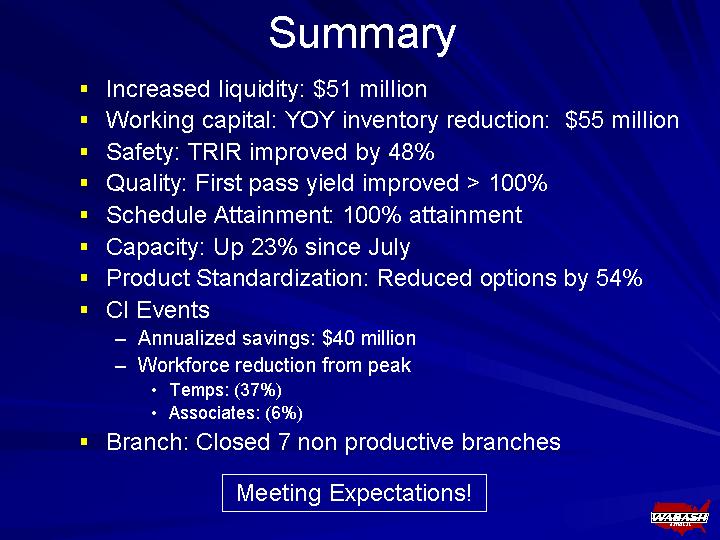
| Summary Increased liquidity: $51 million Working capital: YOY inventory reduction: $55 million Safety: TRIR improved by 48% Quality: First pass yield improved > 100% Schedule Attainment: 100% attainment Capacity: Up 23% since July Product Standardization: Reduced options by 54% CI Events Annualized savings: $40 million Workforce reduction from peak Temps: (37%) Associates: (6%) Branch: Closed 7 non productive branches Meeting Expectations! |