
ANNUAL SHAREHOLDER MEETING May 15, 2014 Dick Giromini, President & CEO Wabash National Corporation

2 This presentation contains certain forward - looking statements, as defined by the Private Securities Litigation Reform Act of 1995. All statements other than historical facts are forward - looking statements, including without limit, those regarding shipment outlook, Operating EBITDA, backlog, demand level expectations, profitability and earnings capacity, margin opportunities, and potential benefits of any recent acquisitions. Any forward - looking statements are subject to certain risks and uncertainties that could cause actual results to differ materially from those implied by the forward - looking statements. Without limit, these risks and uncertainties include economic conditions, increased competition, dependence on new management, reliance on certain customers and corporate partnerships, shortages and costs of raw materials, manufacturing capacity and cost containment risks, dependence on industry trends, access to capital, acceptance of products, and government regulation. You should review and consider the various disclosures made by the Company in this presentation and in its reports to its stockholders and periodic reports on Forms 10 - K and 10 - Q. We cannot give assurance that the expectations reflected in our forward - looking statements will prove to be correct. Our actual results could differ materially from those anticipated in these forward - looking statements. All written and oral forward - looking statements attributable to us are expressly qualified in their entirety by the factors we disclose that could cause our actual results to differ materially from our expectations. S AFE H ARBOR S TATEMENT © 2014 Wabash National, L.P. All rights reserved. Wabash®, Wabash National®, DuraPlate ®, DuraPlate AeroSkirt ®, Walker, Brenner® and Beall® are marks owned by Wabash National, L.P. Transcraft ® and Benson® are marks owned by Transcraft Corporation.
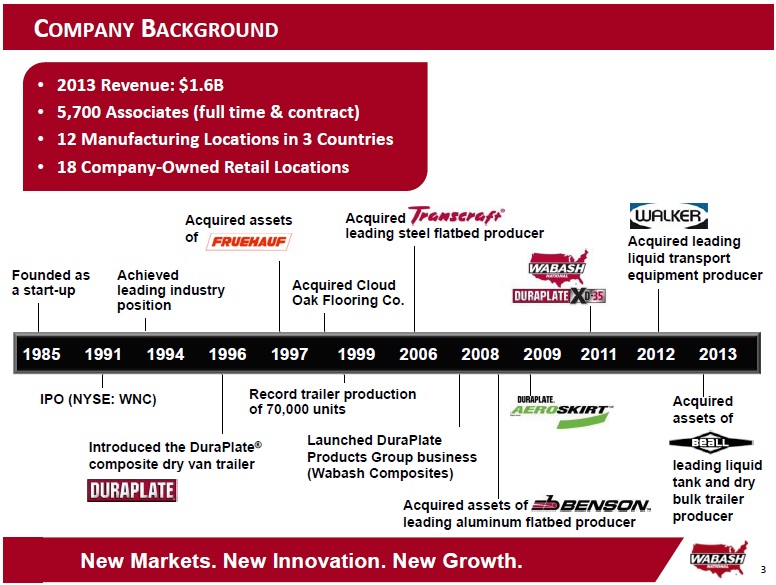
3 Acquired assets of leading liquid tank and dry bulk trailer producer C OMPANY B ACKGROUND Acquired assets of leading aluminum flatbed producer Founded as a start - up IPO ( NYSE : WNC ) Achieved leading industry position Introduced the DuraPlate ® composite dry van trailer Record trailer production of 70,000 units Acquired leading liquid transport equipment producer Acquired leading steel flatbed producer Acquired assets of Acquired Cloud Oak Flooring Co. • 2013 Revenue: $1.6B • 5,700 Associates (full time & contract) • 12 Manufacturing Locations in 3 Countries • 18 Company - Owned Retail Locations Launched DuraPlate Products Group business (Wabash Composites) 1985 1991 1994 1996 1997 1999 2006 2008 2009 2011 2012 2013 New Markets. New Innovation. New Growth.
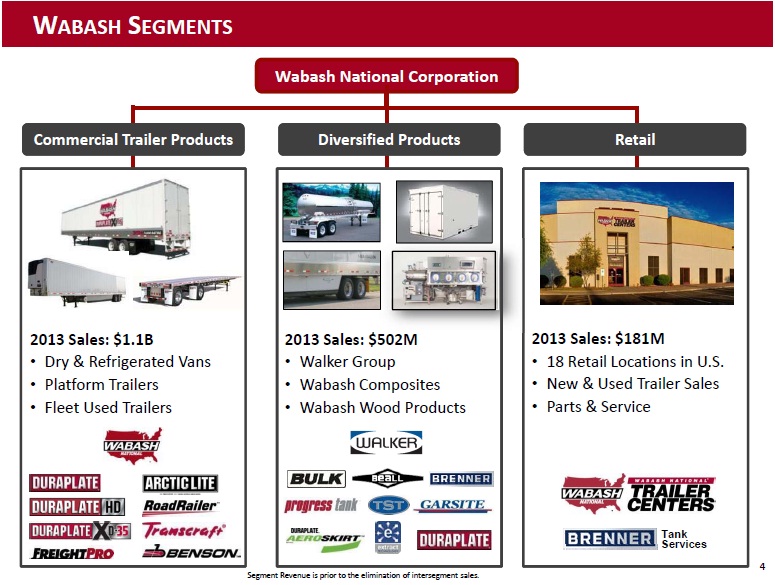
4 W ABASH S EGMENTS Wabash National Corporation Commercial Trailer Products 2013 Sales: $1.1B • Dry & Refrigerated Vans • Platform Trailers • Fleet Used Trailers Retail 2013 Sales: $ 181M • 18 Retail L ocations in U.S. • New & Used Trailer Sales • Parts & Service Tank Services Diversified Products 2013 Sales: $502M • Walker Group • Wabash Composites • Wabash Wood Products Segment Revenue is prior to the elimination of intersegment sales.
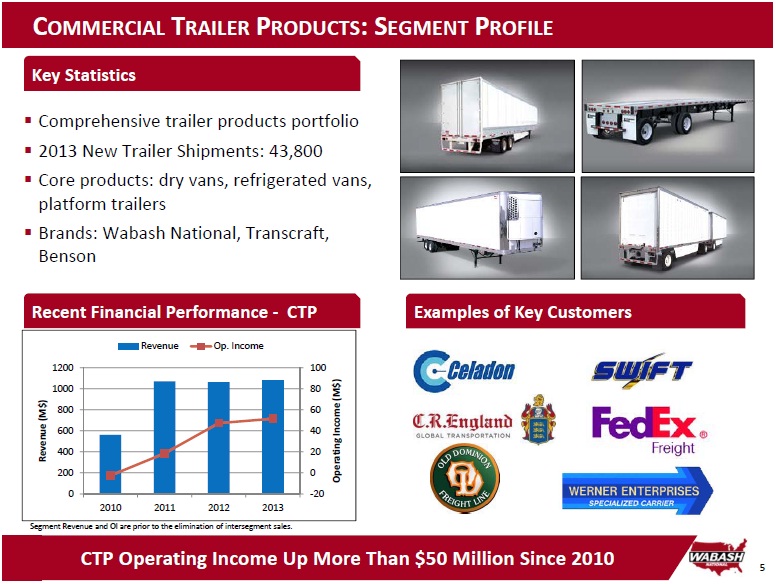
5 CTP Operating Income Up More Than $50 Million Since 2010 Key Statistics Recent Financial Performance - CTP Examples of Key Customers ▪ Comprehensive trailer products portfolio ▪ 2013 New Trailer Shipments: 43,800 ▪ Core products: dry vans, refrigerated vans, platform trailers ▪ Brands: Wabash National, Transcraft, Benson C OMMERCIAL T RAILER P RODUCTS : S EGMENT P ROFILE Segment Revenue and OI are prior to the elimination of intersegment sales. -20 0 20 40 60 80 100 0 200 400 600 800 1000 1200 2010 2011 2012 2013 Operating Income (M$) Revenue (M$) Revenue Op. Income

6 Broad Product Portfolio Serving Diverse Markets Key Statistics Recent Financial Performance Key Brands ▪ Walker Group, Wabash Composites, and Wabash Wood Products ▪ Diverse portfolio of products and services ▪ Broad customer, geographic, and end market diversification ▪ Higher growth and higher margin businesses D IVERSIFIED P RODUCTS : S EGMENT P ROFILE Segment Revenue and OI are prior to the elimination of intersegment sales. 0 20 40 60 80 100 0 100 200 300 400 500 600 2010 2011 2012 2013 Operating Income (M$) Revenue (M$) Revenue Op. Income
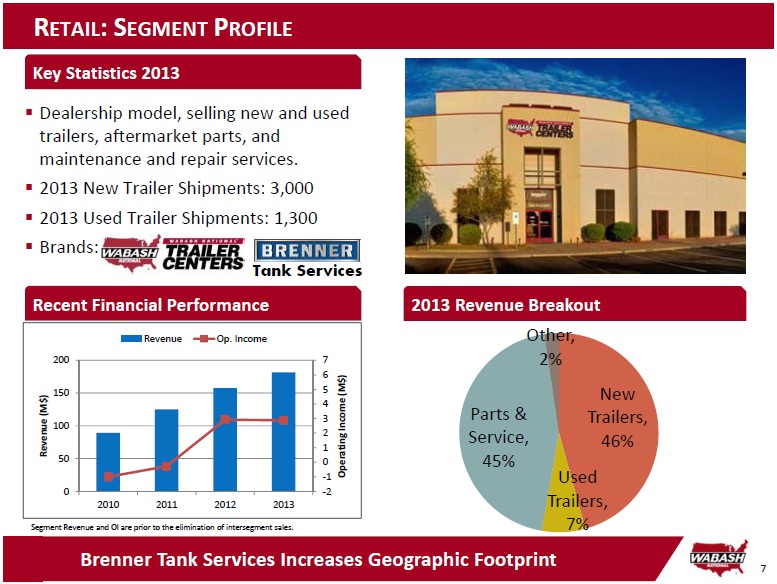
7 Brenner Tank Services Increases Geographic Footprint Key Statistics 2013 Recent Financial Performance 2013 Revenue Breakout R ETAIL : S EGMENT P ROFILE ▪ Dealership model, selling new and used trailers, aftermarket parts, and maintenance and repair services. ▪ 2013 New Trailer Shipments: 3,0 00 ▪ 2013 Used Trailer Shipments: 1,300 ▪ Brands: Tank Services New Trailers, 46% Used Trailers, 7% Parts & Service, 45% Other, 2% Segment Revenue and OI are prior to the elimination of intersegment sales. -2 -1 0 1 2 3 4 5 6 7 0 50 100 150 200 2010 2011 2012 2013 Operating Income (M$) Revenue (M$) Revenue Op. Income
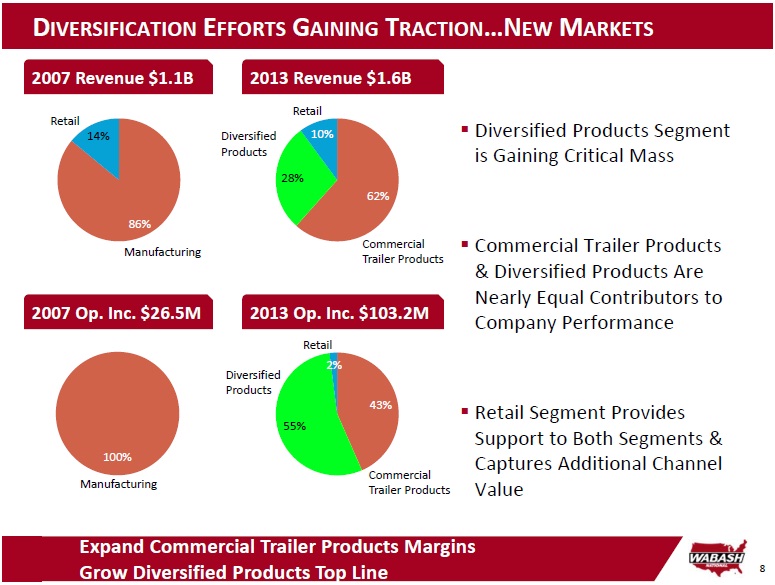
8 Expand Commercial Trailer Products Margins Grow Diversified Products Top Line ▪ Diversified Products Segment is Gaining Critical Mass ▪ Commercial Trailer Products & Diversified Products Are Nearly Equal Contributors to Company Performance ▪ Retail Segment Provides Support to Both Segments & Captures Additional Channel Value 43% 55% 2% D IVERSIFICATION E FFORTS G AINING T RACTION …N EW M ARKETS 86% 14% 62% 28% 10% Manufacturing Retail Commercial Trailer Products Diversified Products Retail Manufacturing Retail 100% Diversified Products Commercial Trailer Products 2007 Revenue $1.1B 2013 Revenue $1.6B 2007 Op. Inc. $26.5M 2013 Op. Inc. $103.2M
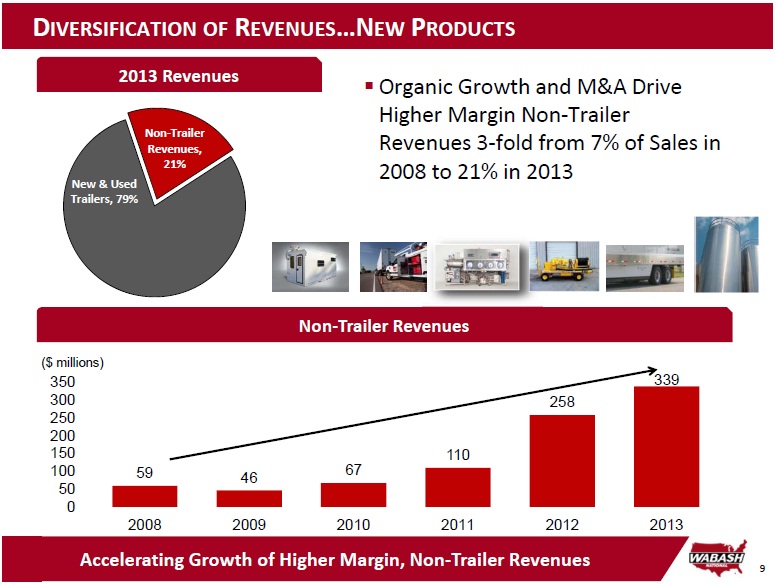
9 Non - Trailer Revenues, 21% New & Used Trailers, 79% D IVERSIFICATION OF R EVENUES …N EW P RODUCTS 2013 Revenues Non - Trailer Revenues Accelerating Growth of Higher Margin, Non - Trailer Revenues 59 46 67 110 258 339 0 50 100 150 200 250 300 350 2008 2009 2010 2011 2012 2013 ($ millions) ▪ Organic Growth and M&A Drive Higher Margin Non - Trailer Revenues 3 - fold from 7% of Sales in 2008 to 21% in 2013
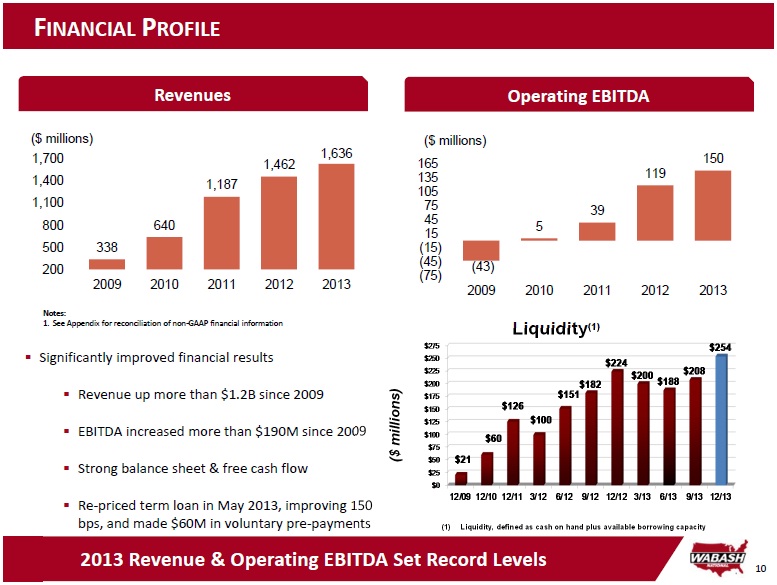
10 ($ millions) ($ millions) Notes: 1. See Appendix for reconciliation of non - GAAP financial information F INANCIAL P ROFILE Revenues 2013 Revenue & Operating EBITDA Set Record Levels Operating EBITDA ▪ Significantly improved financial results ▪ Revenue up more than $1.2B since 2009 ▪ EBITDA increased more than $190M since 2009 ▪ Strong balance sheet & free cash flow ▪ Re - priced term loan in May 2013, improving 150 bps, and made $60M in voluntary pre - payments 338 640 1,187 1,462 1,636 200 500 800 1,100 1,400 1,700 2009 2010 2011 2012 2013 (43) 5 39 119 150 (75) (45) (15) 15 45 75 105 135 165 2009 2010 2011 2012 2013 ($ millions) Liquidity (1) (1) Liquidity, defined as cash on hand plus available borrowing capacity $0 $25 $50 $75 $100 $125 $150 $175 $200 $225 $250 $275 12/09 12/10 12/11 3/12 6/12 9/12 12/12 3/13 6/13 9/13 12/13 $21 $60 $126 $100 $151 $182 $224 $200 $188 $208 $254
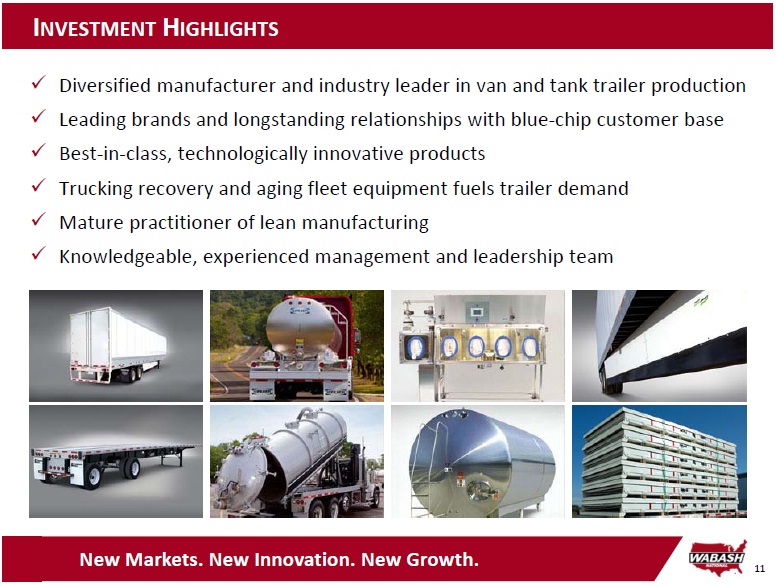
11 I NVESTMENT H IGHLIGHTS x Diversified manufacturer and industry leader in van and tank trailer production x Leading brands and longstanding relationships with blue - chip customer base x Best - in - class, technologically innovative products x Trucking recovery and aging fleet equipment fuels trailer demand x Mature practitioner of lean manufacturing x Knowledgeable, experienced management and leadership team New Markets. New Innovation. New Growth.


2 R ECONCILIATION OF N ON - GAAP M EASURES New Markets. New Innovation. New Growth. ($ in millions) Note: This table reconciles annual net income (loss) for the periods presented to the non - GAAP measure of Operating EBITDA. Di fferences may exist in the calculation of Operating EBITDA due to rounding. 2009 2010 2011 2012 2013 Net (loss) income (101.8)$ (141.8)$ 15.0$ 105.6$ 46.5$ Income tax (benefit) expense (3.0) (0.1) 0.2 (57.1) 31.1 Increase in fair value of warrant 33.4 121.6 - - - Interest expense 4.4 4.1 4.1 21.7 26.3 Depreciation and amortization 19.6 16.9 15.6 25.6 38.3 Stock-based compensation 3.4 3.5 3.4 5.2 7.5 Acquisition expenses - - - 17.3 0.9 Other non-operating expense (income) 0.9 0.7 0.5 0.2 (0.7) Operating EBITDA (43.1)$ 4.9$ 38.8$ 118.5$ 149.9$ % of sales -12.8% 0.8% 3.3% 8.1% 9.2%