Exhibit 99.1

2015 ANALYST/INVESTOR DAY August 18, 2015 Wabash National Corporation

2 A GENDA 7:45 – 8:00 a.m. Agenda & Safety Overview – PPE Handout 8:00 – 9:30 a.m. Plant Tours (tour groups determined by the color on name tag) 9:30 – 9:40 a.m. Break/Product Displays 9:40 – 11:40 a.m. Management Presentations 11:40 – 12:10 p.m. Panel Q&A: Dick , Jeff, Mark, Brent and Rick 12:10 – 12:50 p.m. Box lunch and board bus for Frankfort Tour 12:50 – 1:35 p.m. Frankfort Tour and Product Displays 1:35 – 2:15 p.m. Bus Returns to Lafayette Headquarters
3 EH&S M ISSION Wabash National is committed to our associates, customers and shareholders to manage all of our business activities in a responsible manner, with our highest value being the health and safety of our associates. We believe that all injuries and occupational illnesses, as well as environmental incidents, are preventable. In support of this, all associates are expected to perform their work in such a manner as to not jeopardize the environment or the safety and health of themselves and their fellow workers. We will meet, or exceed, all applicable environmental, health and safety standards, regulations, and other requirements. With the commitment and full support of every associate, we will continually improve our adherence to these principles.
4
5 B ASIC S AFETY R EQUIREMENTS Plant Tour Safety • Steel - toed shoes • Safety glasses with side - shields • Ear plugs or ear muffs for hearing protection • Stay in the pedestrian aisles where available • No walking through overhead doors • No cell phone use
6 G ENERAL P LANT H AZARDS Plant Tour Safety • Noise levels make communication difficult • Industrial truck traffic • Line cart traffic • Overhead cranes/hoists • All parts are extremely sharp and generally heavy • ~450 welders throughout the plant

7 T OUR PPE • Safety Glasses • Radio headsets • Steel toe overshoe
8 First, please note this presentation is being recorded. Second, this presentation contains certain forward - looking statements, as defined by the Private Securities Litigation Reform Act of 1995. All statements other than historical facts are forward - looking statements, including without limit, those regarding shipment outlook, Operating EBITDA, backlog, demand level expectations, profitability and earnings capacity, and margin opportunities. Any forward - looking statements are subject to certain risks and uncertainties that could cause actual results to differ materially from those implied by the forward - looking statements. Without limit, these risks and uncertainties include economic conditions, increased competition, reliance on certain customers and corporate partnerships, shortages and costs of raw materials, manufacturing capacity and cost containment risks, dependence on industry trends, access to and ability to manage capital , acceptance of products, growth of anticipated market opportunities, ability to execute on strategic acquisitions, and government regulation. You should review and consider the various disclosures made by the Company in this presentation and in its reports to its stockholders and periodic reports on Forms 10 - K and 10 - Q. We cannot give assurance that the expectations reflected in our forward - looking statements will prove to be correct. Our actual results could differ materially from those anticipated in these forward - looking statements. All written and oral forward - looking statements attributable to us are expressly qualified in their entirety by the factors we disclose that could cause our actual results to differ materially from our expectations . S AFE H ARBOR S TATEMENT © 2015 Wabash National, L.P. All rights reserved. Wabash®, Wabash National®, DuraPlate®, DuraPlate AeroSkirt®, Walker, Brenner® and Beall® are marks owned by Wabash National, L. P. Transcraft® and Benson® are marks owned by Transcraft Corporation.

2015 ANALYST/INVESTOR DAY Dick Giromini President and Chief Executive Officer Wabash National Corporation August 18, 2015
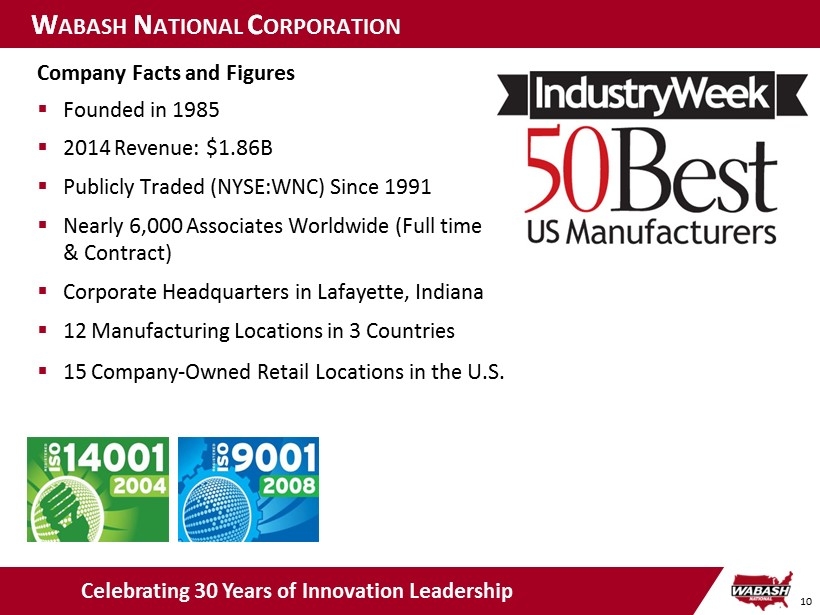
10 Company Facts and Figures ▪ Founded in 1985 ▪ 2014 Revenue: $1.86B ▪ Publicly Traded (NYSE:WNC) Since 1991 ▪ Nearly 6,000 Associates Worldwide (Full time & Contract) ▪ Corporate Headquarters in Lafayette, Indiana ▪ 12 Manufacturing Locations in 3 Countries W ABASH N ATIONAL C ORPORATION ▪ 15 Company - Owned Retail Locations in the U.S. Celebrating 30 Years of Innovation Leadership
11 Mission To provide ever - increasing value to all of our stakeholders, including customers, shareholders, associates, suppliers, and our community. Based on core values of integrity, trust and mutual respect , we will drive continuous improvement, thus assuring leadership positions in: ▪ safety performance, ▪ product innovation and quality, ▪ customer satisfaction, ▪ community involvement, and ▪ associate development and teamwork. W ABASH N ATIONAL C ORPORATION Our Vision, Mission & Values Drive Everything We Do
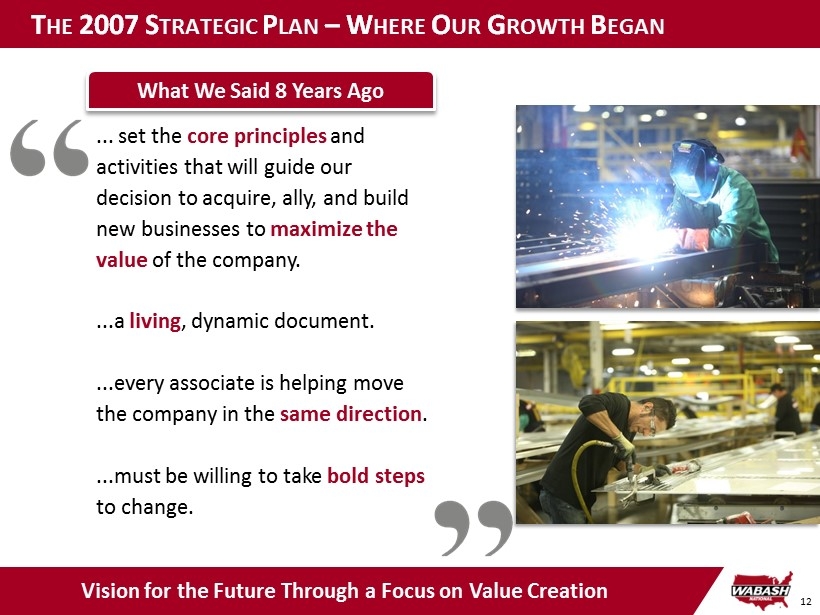
12 T HE 2007 S TRATEGIC P LAN – W HERE O UR G ROWTH B EGAN ... set the core principles and activities that will guide our decision to acquire, ally, and build new businesses to maximize the value of the company. ...a living , dynamic document. ...every associate is helping move the company in the same direction . ...must be willing to take bold steps to change. What We Said 8 Years Ago Vision for the Future Through a Focus on Value Creation

13 S TRATEGIC P LAN G OALS /O BJECTIVES Diversify the Business Operational Excellence Grow the Business Objectives Goals Enhanced Shareholder Value Reduce Cyclicality Improve Profitability Drive Top - Line Growth Focus on High - Margin Opportunities

14 Corporate Strategy • Aligned with Vision, Mission, and Values • 5 - yr Strategic Goals • Encompasses Growth and Diversification Objectives Segment Strategy Portfolio Strategy • Aligned with Corporate Strategy • 5 - yr Strategic Goals • Encompasses Segment Specific Growth Initiatives • Aligned with Segment Strategy • Identifies Business Specific Growth Initiatives and Tactics, including Customer and Market Plans W ABASH N ATIONAL S TRATEGIC P LAN Focus on Value Creation
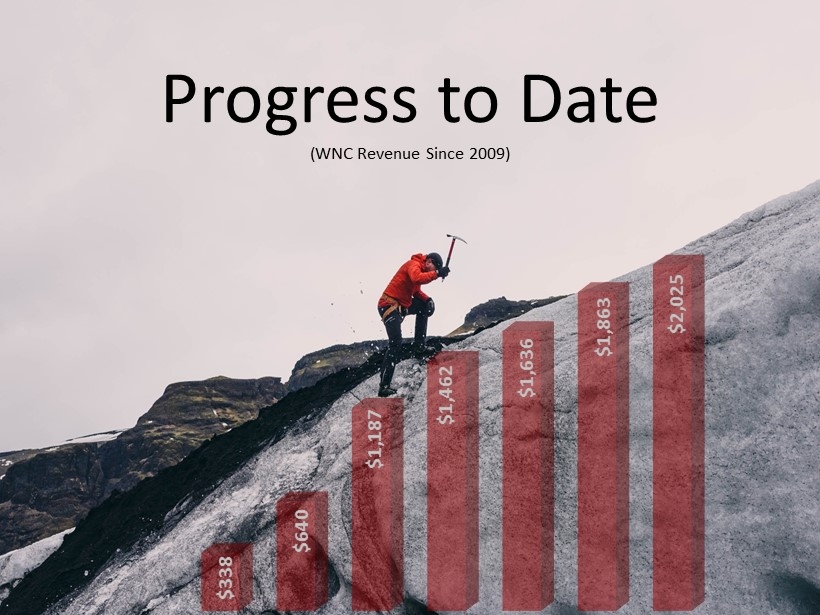
15 $338 $640 $1,187 $1,462 $1,636 $1,863 $2,025 Progress to Date (WNC Revenue Since 2009)

16 S TRATEGIC S EGMENTS IN 2007 Wabash National Corporation Manufacturing 2007 Sales: $1,015M • Dry & Refrigerated Vans • Platform Trailers Retail 2007 Sales: $ 150M • 11 Retail Locations in U.S. • New & Used Trailer Sales • Parts & Service Revenue Heavily Dependent on a Single, Cyclical Market Segment Revenue is prior to the elimination of intersegment sales.
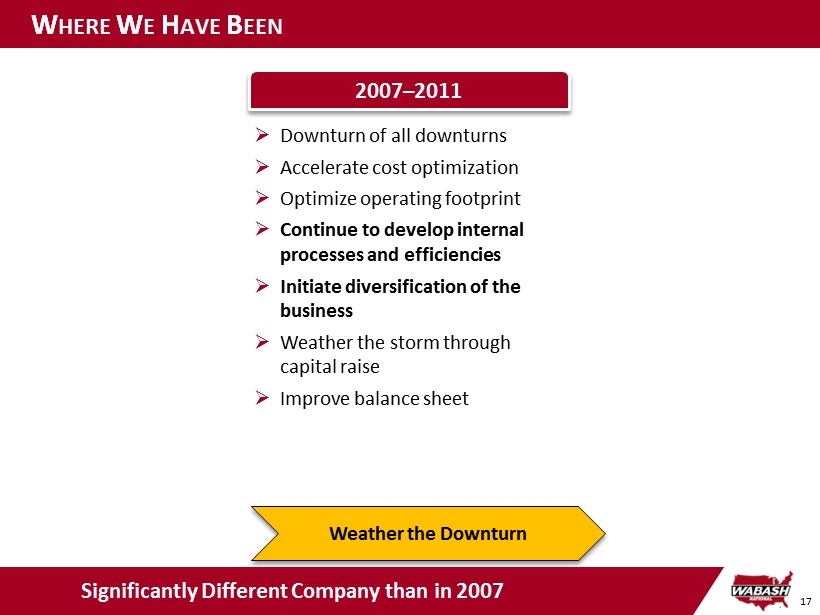
17 W HERE W E H AVE B EEN 2007 – 2011 Weather the Downturn » Downturn of all downturns » Accelerate cost optimization » Optimize operating footprint » Continue to develop internal processes and efficiencies » Initiate diversification of the business » Weather the storm through capital raise » Improve balance sheet Significantly Different Company than in 2007
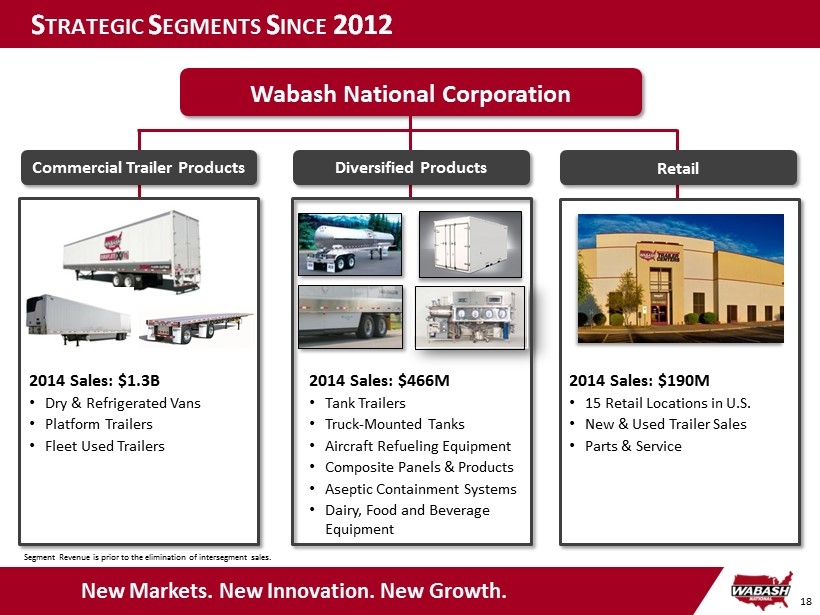
18 S TRATEGIC S EGMENTS S INCE 2012 Wabash National Corporation Commercial Trailer Products 2014 Sales: $1.3B • Dry & Refrigerated Vans • Platform Trailers • Fleet Used Trailers Diversified Products 2014 Sales: $466M • Tank Trailers • Truck - Mounted Tanks • Aircraft Refueling Equipment • Composite Panels & Products • Aseptic Containment Systems • Dairy, Food and Beverage Equipment New Markets. New Innovation. New Growth. Retail 2014 Sales: $190M • 15 Retail Locations in U.S. • New & Used Trailer Sales • Parts & Service Segment Revenue is prior to the elimination of intersegment sales.

19 W HERE W E H AVE B EEN 2007 – 2011 2012 – 2014 Weather the Downturn Recovery, Growth & Diversification » Downturn of all downturns » Accelerate cost optimization » Optimize operating footprint » Continue to develop internal processes and efficiencies » Initiate diversification of the business » Weather the storm through capital raise » Improve balance sheet » Trailer market recovery » Return to profitability » Organic diversification efforts gain momentum » Diversification through acquisitions of Walker and Beall » Improved depth of leadership talent » Focused SBUs » Margin enhancement initiatives » Continued pursuit of operational excellence through CI » Transformed balance sheet Significantly Different Company than in 2007
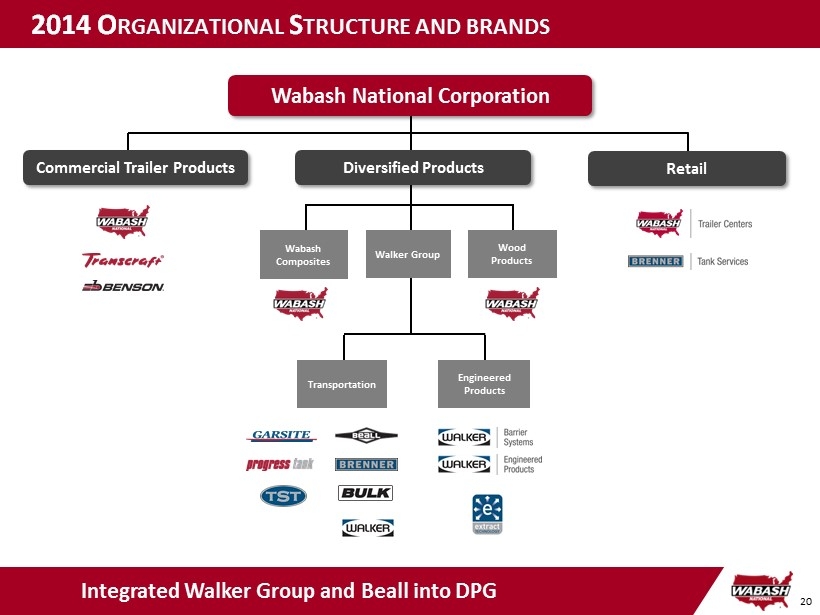
20 2014 O RGANIZATIONAL S TRUCTURE AND BRANDS Wabash National Corporation Commercial Trailer Products Diversified Products Retail Wabash Composites Wood Products Walker Group Engineered Products Transportation Integrated Walker Group and Beall into DPG

21 2015 O RGANIZATIONAL S TRUCTURE AND BRANDS Composites Tank Trailer Aviation & Truck Equip. Process Systems Wabash National Corporation Commercial Trailer Products Diversified Products Retail Enhancing Alignment Between Product Lines and Markets

22 2014 S EGMENT R EVENUE AND P RODUCT M IX New Markets. New Innovation. New Growth. 2014 Consolidated Revenue: $1.86B

23 2007 Higher Growth and Margin Profile, Less Cyclicality 2014 D IVERSIFICATION E FFORTS D RIVING R ESULTS Revenue Manufacturing Retail 14% 86% 24% Commercial Trailer Products Diversified Products Retail 66% 10% Operating Income Manufacturing Retail Diversified Products Commercial Trailer Products 39% 3% 58% Gross Margin 0% 5% 10% 15% 20% 25% 8.1% 22.2% 10.9% 12.5% CTP Retail Consol. DPG 0% 5% 10% 15% 20% 25% 8.7% 6.3% 8.3% Mfg Retail Consol. $1.1B $1.9B $92M $233M 100% $26M $122M Growth > 69% > 153% > 362%
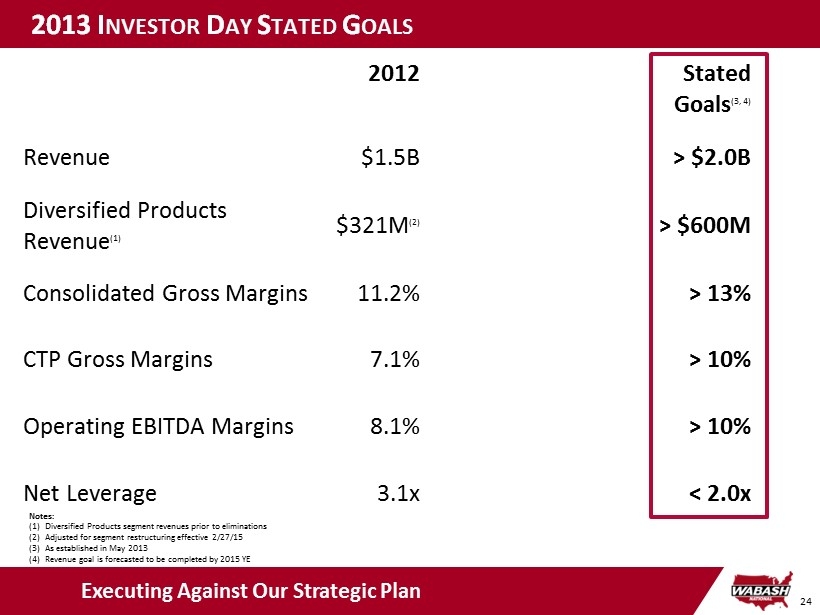
24 2013 I NVESTOR D AY S TATED G OALS 2012 Stated Goals (3, 4) Revenue $1.5B > $ 2.0B Diversified Products Revenue (1) $321M (2) > $600M Consolidated Gross Margins 11.2% > 13% CTP Gross Margins 7.1% > 10% Operating EBITDA Margins 8.1% > 10% Net Leverage 3.1x < 2.0x Executing Against Our Strategic Plan Notes: (1) Diversified Products segment revenues prior to eliminations (2) Adjusted for segment restructuring effective 2/27/15 (3) As established in May 2013 (4) Revenue goal is forecasted to be completed by 2015 YE

25 2013 I NVESTOR D AY S TATED G OALS 2012 2013 2014 Stated Goals (3, 4) Revenue $1.5B $1.6B $1.9B > $ 2.0B Diversified Products Revenue (1) $321M (2) $459M (2) $466M (2) > $600M Consolidated Gross Margins 11.2% 13.2% 12.5% > 13% CTP Gross Margins 7.1% 7.8% 8.1% > 10% Operating EBITDA Margins 8.1% 9.2% 9.1% > 10% Net Leverage 3.1x 1.9x 1.2x < 2.0x Executing Against Our Strategic Plan x x x x x Notes: (1) Diversified Products segment revenues prior to eliminations (2) Adjusted for segment restructuring effective 2/27/15 (3) As established in May 2013 (4) Revenue goal is forecasted to be completed by 2015 YE

26 Future Growth Initiatives
27

28 L ONG - T ERM G ROWTH D RIVERS ▪ Pricing discipline ▪ Operational efficiency / lean manufacturing ▪ Supply chain optimization Margin Expansion ▪ New end markets and geographies ▪ Product innovations / portfolio expansion ▪ Aftermarket parts and service capabilities Organic Growth ▪ Proven ability to acquire and integrate ▪ Enhance business stability and reduce cyclicality ▪ Operational and business synergies ▪ Strategic but selective Mergers & Acquisitions New Markets. New Innovation. New Growth.
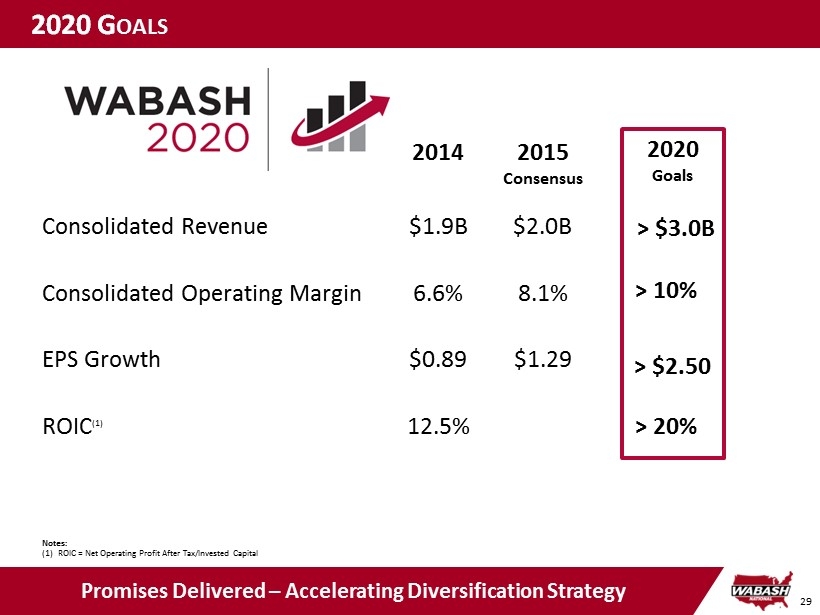
29 2020 G OALS 2014 2015 Consensus Consolidated Revenue $1.9B $2.0B Consolidated Operating Margin 6.6% 8.1% EPS Growth $0.89 $1.29 ROIC (1) 12.5% Notes: (1) ROIC = Net Operating Profit After Tax/Invested Capital Promises Delivered – Accelerating Diversification Strategy 2020 Goals > $3.0B > 10% > 20% > $2.50

30 DPG O RGANIC G ROWTH I NITIATIVES New Markets. New Innovation. New Growth. 2015 2016 2017 2018 2019 2020 ▪ Aluminum Trailer Growth Nationally ▪ MCR Product Line Expansion ▪ Aerodynamic Products Portfolio Growth ▪ LTL Truck Boxes ▪ Mexico Silo Growth ▪ Custom Tank Container Solutions ▪ Energy Related Products ▪ Custom Cargo Boxes ▪ Processing Equipment (Food, Dairy, Pharma) ▪ Next Generation Composite Panels
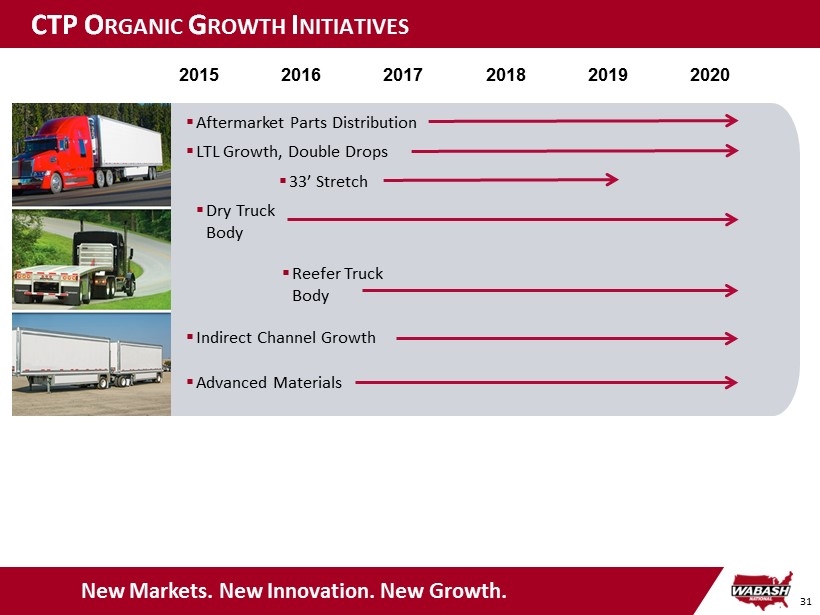
31 CTP O RGANIC G ROWTH I NITIATIVES New Markets. New Innovation. New Growth. 2015 2016 2017 2018 2019 2020 ▪ Aftermarket Parts Distribution ▪ LTL Growth, Double Drops ▪ Reefer Truck Body ▪ Indirect Channel Growth ▪ Dry Truck Body ▪ 33’ Stretch ▪ Advanced Materials
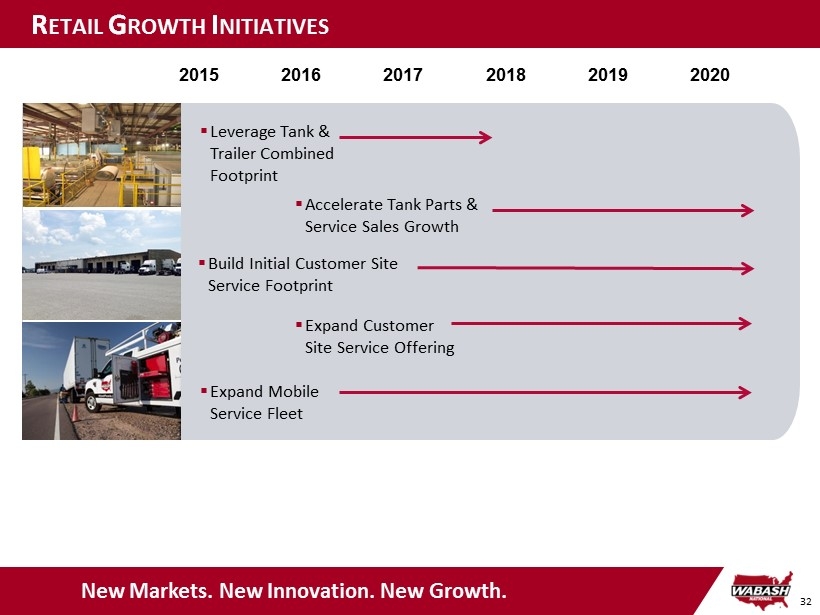
32 R ETAIL G ROWTH I NITIATIVES New Markets. New Innovation. New Growth. ▪ Build Initial Customer Site Service Footprint ▪ Leverage Tank & Trailer Combined Footprint ▪ Expand Mobile Service Fleet ▪ Accelerate Tank Parts & Service Sales Growth ▪ Expand Customer Site Service Offering 2015 2016 2017 2018 2019 2020
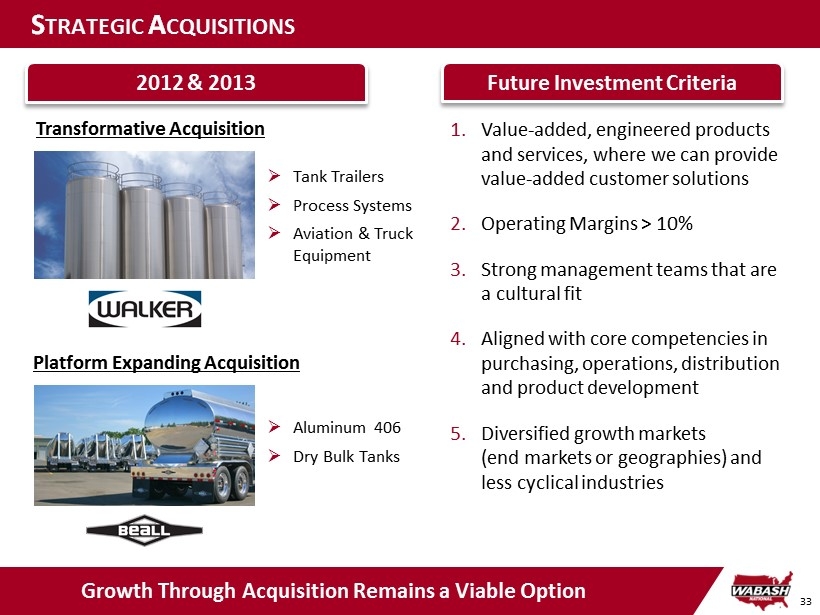
33 S TRATEGIC A CQUISITIONS Growth Through Acquisition Remains a Viable Option 1. Value - added, engineered products and services, where we can provide value - added customer solutions 2. Operating Margins > 10% 3. Strong management teams that are a cultural fit 4. Aligned with core competencies in purchasing, operations, distribution and product development 5. Diversified growth markets ( end markets or geographies) and less cyclical industries » Tank Trailers » Process Systems » Aviation & Truck Equipment Transformative Acquisition Platform Expanding Acquisition » Aluminum 406 » Dry Bulk Tanks 2012 & 2013 Future Investment Criteria

2015 ANALYST/INVESTOR DAY Commercial Trailer Products August 18, 2015 Brent Yeagy Group President – CTP
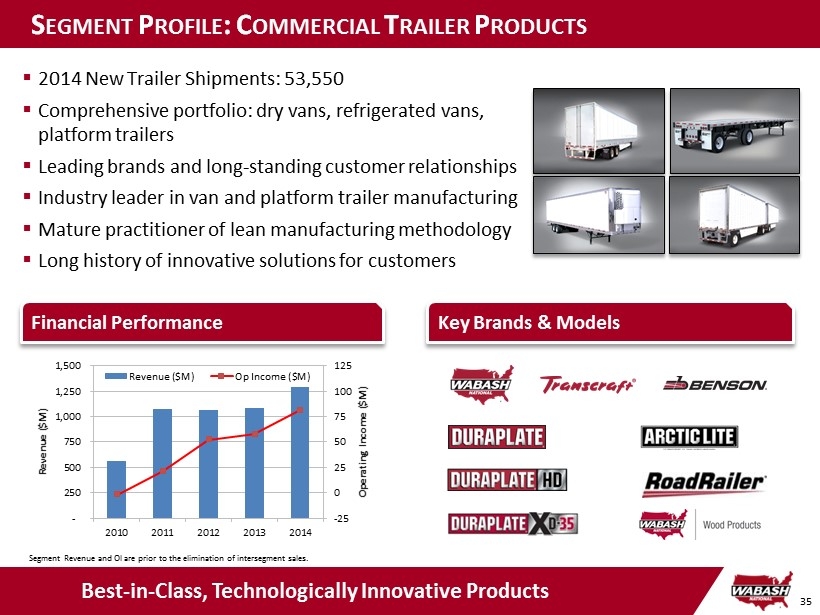
35 Best - in - Class, Technologically Innovative Products Financial Performance ▪ 2014 New Trailer Shipments: 53,550 ▪ Comprehensive portfolio: dry vans, refrigerated vans, platform trailers ▪ Leading brands and long - standing customer relationships ▪ Industry leader in van and platform trailer manufacturing ▪ Mature practitioner of lean manufacturing methodology ▪ Long history of innovative solutions for customers S EGMENT P ROFILE : C OMMERCIAL T RAILER P RODUCTS Segment Revenue and OI are prior to the elimination of intersegment sales. Key Brands & Models -25 0 25 50 75 100 125 - 250 500 750 1,000 1,250 1,500 2010 2011 2012 2013 2014 Operating Income ($M) Revenue ($M) Revenue ($M) Op Income ($M)
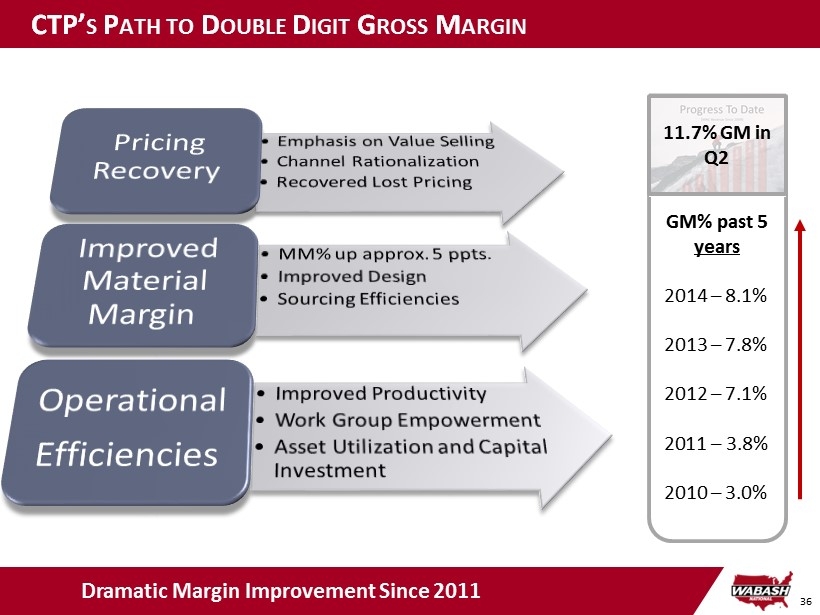
36 Dramatic Margin Improvement Since 2011 CTP’ S P ATH TO D OUBLE D IGIT G ROSS M ARGIN GM% past 5 years 2014 – 8.1% 2013 – 7.8% 2012 – 7.1% 2011 – 3.8% 2010 – 3.0% 11.7% GM in Q2

37 L ONG - T ERM G ROWTH D RIVERS New Markets. New Innovation. New Growth. ▪ Align to serve “Final Mile” needs for Today and Beyond ▪ Configure Manufacturing for Efficiency and Capability ▪ Align Supply Chain for further Optimization & New Market Needs ▪ Capture New Customers through New Channels Position for the Future ▪ Indirect Channel Growth & Development ▪ Aftermarket Part Manufacturing ▪ Trailer and Adjacent Markets Organic Growth ▪ Bringing the Next Wave of Change in Advanced Materials ▪ Redefine the Design and Manufacture of Equipment through Industry - Leading Bonding and Assembly Methods Leading Through Innovation

38 Final Mile
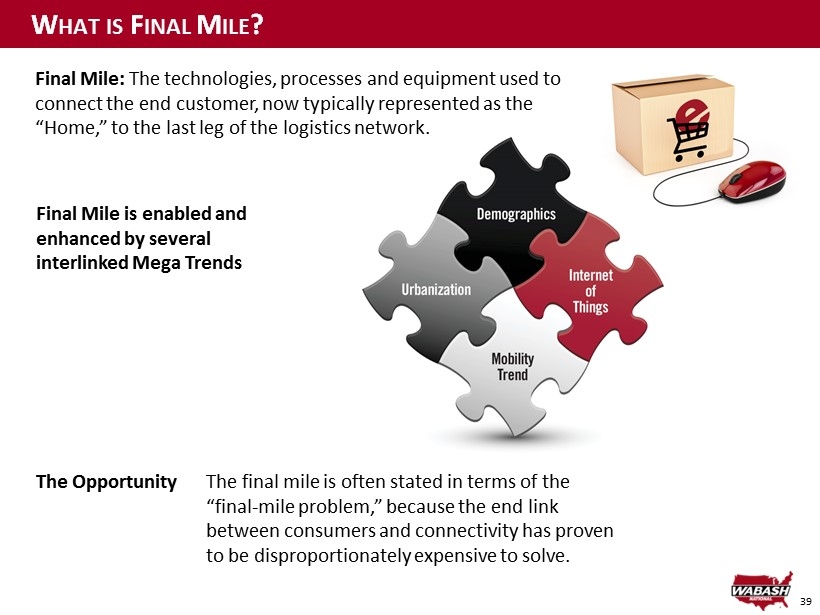
39 W HAT IS F INAL M ILE ? Final Mile: The technologies, processes and equipment used to connect the end customer, now typically represented as the “ Home,” to the last leg of the logistics network . The final mile is often stated in terms of the “final - mile problem,” because the end link between consumers and connectivity has proven to be disproportionately expensive to solve. Final Mile is enabled and enhanced by several interlinked Mega Trends The Opportunity

40 We’re J.B. Hunt Final Mile Services. We bring a coast - to - coast network of equipment, technology, cross docks and, most importantly, a strategy to every customer. As one of the largest final mile providers, we have the resources to tackle the biggest transportation and logistics challenges. But we’re also nimble and responsive; we can scale our solutions to fit your needs, whether it’s two trucks or two hundred. J.B. H UNT – A N E XAMPLE OF L OOKING T OWARD THE F UTURE Source: JB Hunt Residential Delivery Services

41 F INAL M ILE D ELIVERY – T HE N EXT W AVE OF L OGISTICS C HANGE “Final Mile” Market is Fragmented Carrier’s Truck / Fleet Size 1 ▪ 160 carriers profiled ▪ Nearly 80% have 250 trucks or less ▪ For reference, USPS has ~100,000 delivery vehicles Carrier’s Coverage 1 ▪ 252 carriers profiled ▪ Nearly 50% cover 3 states or less ▪ Less than 20% cover 36 states or more 1 Source: Stifel Oct. 2014 Home Delivery and Final Mile report [ AlixPartners ]
42 Indirect Channel Expansion
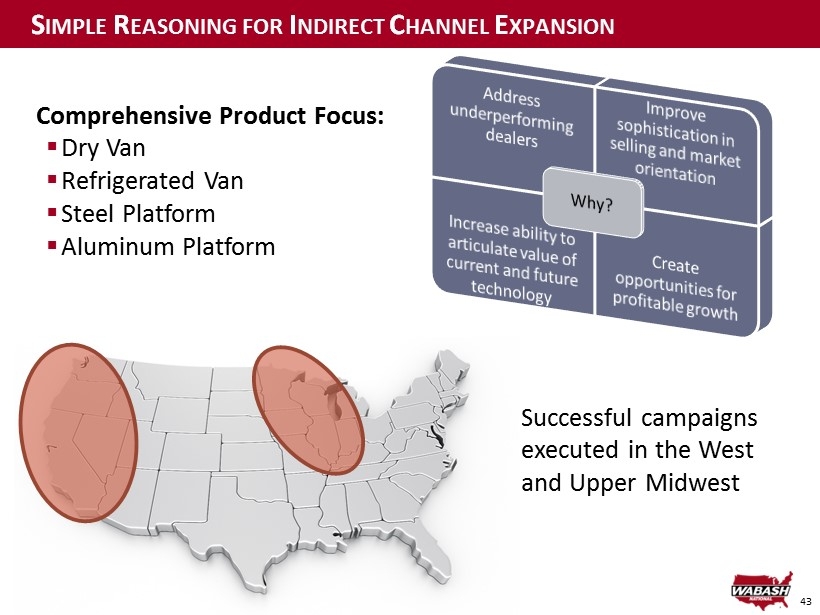
43 S IMPLE R EASONING FOR I NDIRECT C HANNEL E XPANSION Comprehensive Product Focus: ▪ Dry Van ▪ Refrigerated Van ▪ Steel Platform ▪ Aluminum Platform Successful campaigns executed in the West and Upper Midwest
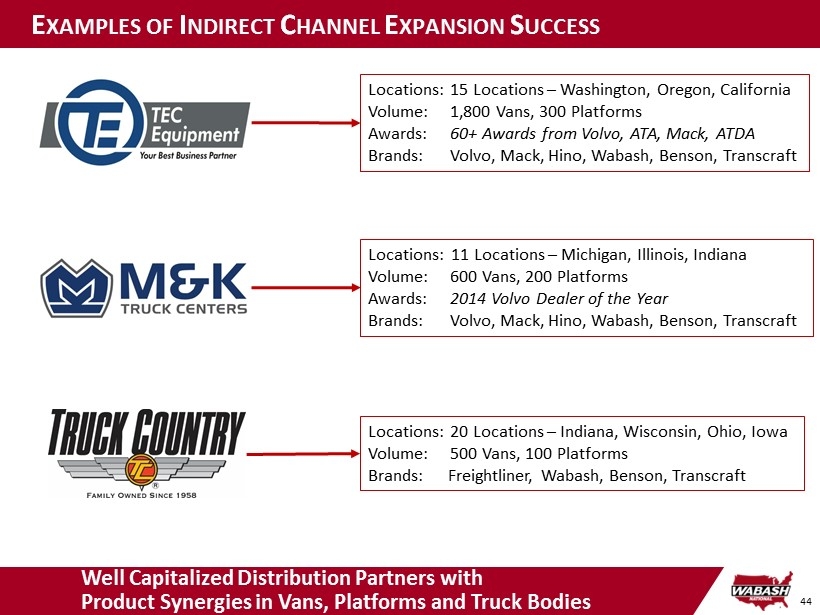
44 E XAMPLES OF I NDIRECT C HANNEL E XPANSION S UCCESS Locations: 15 Locations – Washington, Oregon, California Volume: 1,800 Vans, 300 Platforms Awards: 60+ Awards from Volvo, ATA, Mack, ATDA Brands: Volvo, Mack, Hino, Wabash, Benson, Transcraft Locations: 11 Locations – Michigan, Illinois, Indiana Volume: 600 Vans, 200 Platforms Awards: 2014 Volvo Dealer of the Year Brands: Volvo, Mack, Hino, Wabash , Benson, Transcraft Locations: 20 Locations – Indiana, Wisconsin, Ohio, Iowa Volume: 500 Vans, 100 Platforms Brands: Freightliner , Wabash, Benson, Transcraft Well Capitalized Distribution Partners with Product Synergies in Vans, Platforms and Truck Bodies
45 Aftermarket Part Manufacturing
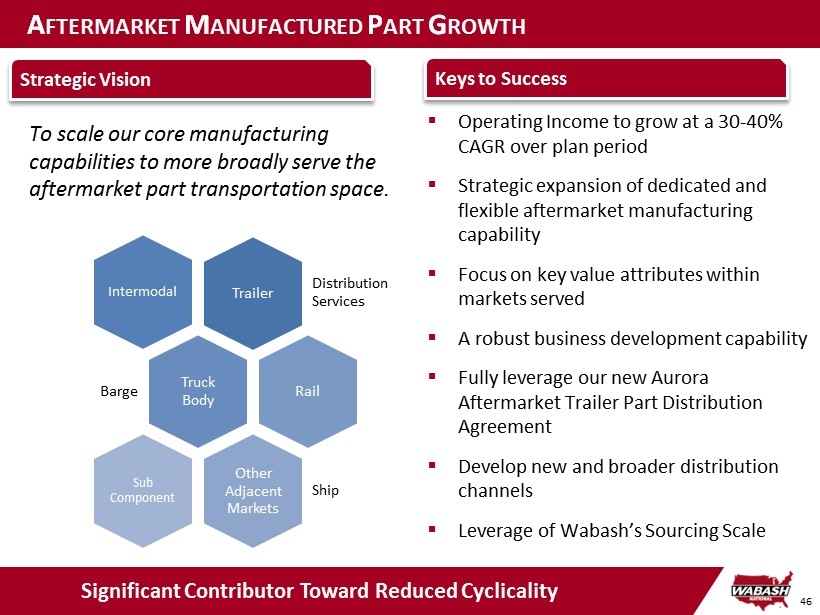
46 A FTERMARKET M ANUFACTURED P ART G ROWTH To scale our core manufacturing capabilities to more broadly serve the aftermarket part transportation space. ▪ Operating Income to grow at a 30 - 40% CAGR over plan period ▪ Strategic expansion of dedicated and flexible aftermarket manufacturing capability ▪ Focus on key value attributes within markets served ▪ A robust business development capability ▪ Fully leverage our new Aurora Aftermarket Trailer Part Distribution A greement ▪ Develop new and broader distribution channels ▪ Leverage of Wabash’s Sourcing Scale Significant Contributor Toward Reduced Cyclicality Keys to Success Strategic Vision Trailer Distribution Services Intermodal Truck Body Barge Rail Other Adjacent Markets Ship Sub Component
47 Advanced Design
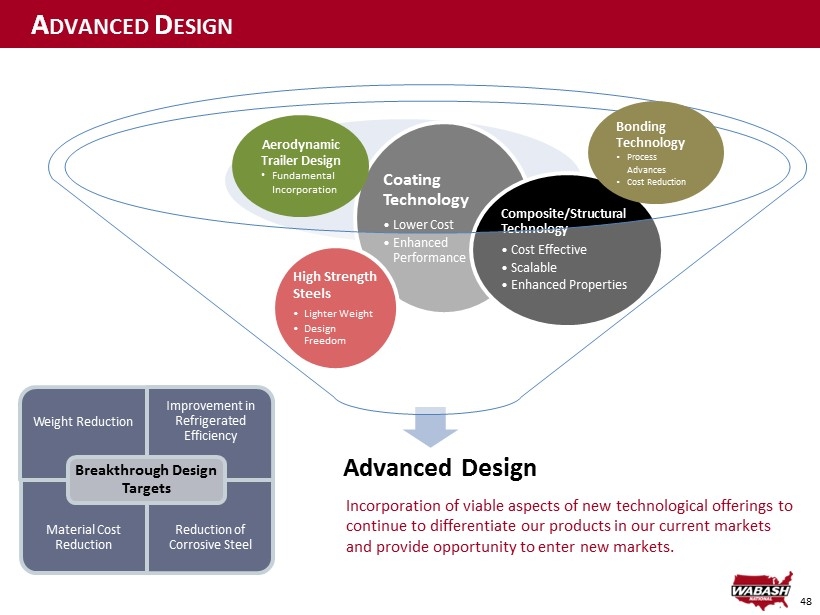
48 A DVANCED D ESIGN Incorporation of viable aspects of new technological offerings to continue to differentiate our products in our current markets and provide opportunity to enter new markets. Weight Reduction Improvement in Refrigerated Efficiency Material Cost Reduction Reduction of Corrosive Steel Breakthrough Design Targets Advanced Design Coating Technology • Lower Cost • Enhanced Performance High Strength Steels • Lighter Weight • Design Freedom Composite/Structural Technology • Cost Effective • Scalable • Enhanced Properties Aerodynamic Trailer Design • Fundamental Incorporation Bonding Technology • Process Advances • Cost Reduction

49 A DVANCED D ESIGN O VERVIEW Advanced Design 2020 Bonding (2014+) HSS Components (2015+) Composite Components (2015+) Lightweight Panel Technology (2017) Flush Mount Intermediate Logistics (2017) Advanced Structures (2016+) Advanced Coatings (2016+) Coming Soon Coming Soon
50 In Closing

51 S HAPING CTP INITIATIVES – R EASON TO B ELIEVE Proven Ability to Execute Industry Leading Brand Manufacturing Leverage and Scale “The Innovation Leader” for 30 Years Aligned, Engaged and Motivated Associates Indisputable Mega Forces Final Mile Cold Chain Advanced Materials Indirect Channel Aftermarket

52 C OMMERCIAL T RAILER P RODUCTS F OCUS & S TRENGTHS Opportunity Awaits Us We Face Real Market Forces of Change Just as We Promised We Performed As We Should We Ran Our Business The Market Responds When We Innovate It’s With Impact When We Invest And We Do It with the Best People and Brands in the Industry

53 T HANK Y OU The Best People and Most Respected Brand in Our Industry

2015 ANALYST/INVESTOR DAY Diversified Products August 18, 2015 Mark Weber Group President – DPG

55 Diverse Products and End Markets Financial Performance Key Brands ▪ Divisions: Tank Trailers, Aviation & Truck Equipment, Process Systems, and Composites ▪ Diverse portfolio of products serving a variety of customers and attractive end markets ▪ Leading brands and long - standing relationships with blue - chip customer base ▪ Higher growth and higher margin businesses ▪ Stable, strong cash flow profile S EGMENT P ROFILE : D IVERSIFIED P RODUCTS Segment Revenue and OI are prior to the elimination of intersegment sales. 0 15 30 45 60 75 90 - 100 200 300 400 500 600 2010 2011 2012 2013 2014 Operating Income ($M) Revenue ($M) Revenue ($M) Op Income ($M)
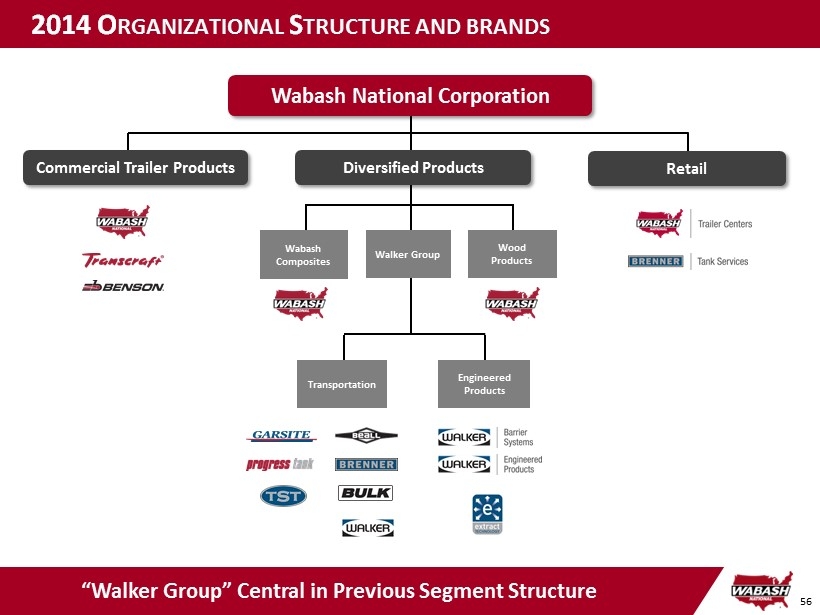
56 2014 O RGANIZATIONAL S TRUCTURE AND BRANDS Wabash National Corporation Commercial Trailer Products Diversified Products Retail Wabash Composites Wood Products Walker Group Engineered Products Transportation “Walker Group” Central in Previous Segment Structure
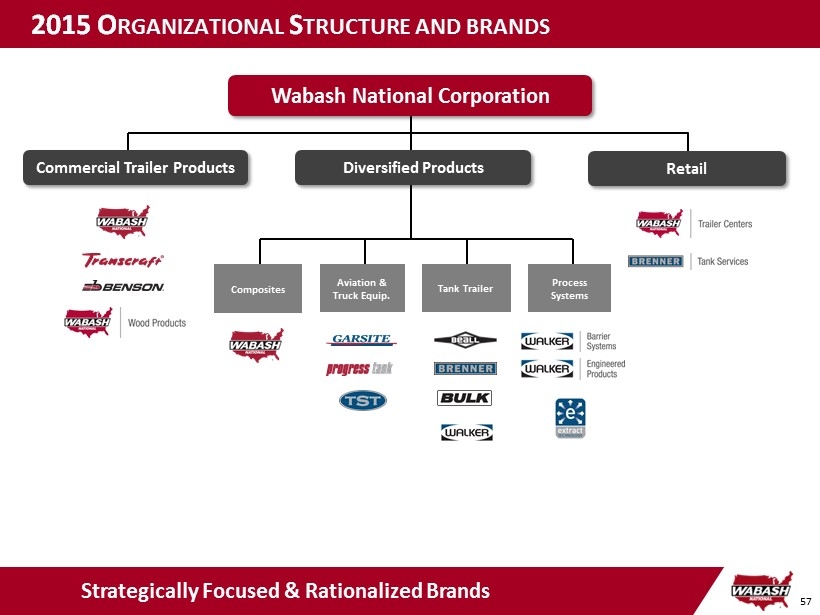
57 2015 O RGANIZATIONAL S TRUCTURE AND BRANDS Composites Tank Trailer Aviation & Truck Equip. Process Systems Wabash National Corporation Commercial Trailer Products Diversified Products Retail Strategically Focused & Rationalized Brands

58 Strong Platforms for Growth DPG – B USINESS P ROFILES Diversified Products Group Tank Trailers 53% of Total • Chemical • Sanitary • Refined Fuel • Crude Oil • Corrosive Materials • Asphalt • Agriculture • Dry Bulk • Used Trailers • Parts Aviation & Truck Equip. Process Systems Composites 12% of Total • Aircraft Refuelers • Hydrant Servicers • Hydrant Carts • Above Ground Storage Systems • Refined Fuel Trucks • Vacuum Trucks • Propane Trucks • Refurbished Equip. • Parts & Service 15% of Total • Composite Panels • Aerodynamic Devices • Portable Storage Containers • Custom Solutions • Parts 20% of Total • Silos • Stationary Tanks • Processors & Mixers • Isolators • Downflow Booths • Mobile Clean Rooms • Tank Heads • Custom Equipment • Field Service • Parts Business Revenues as a % of DPG Total based on 2014 Revenue
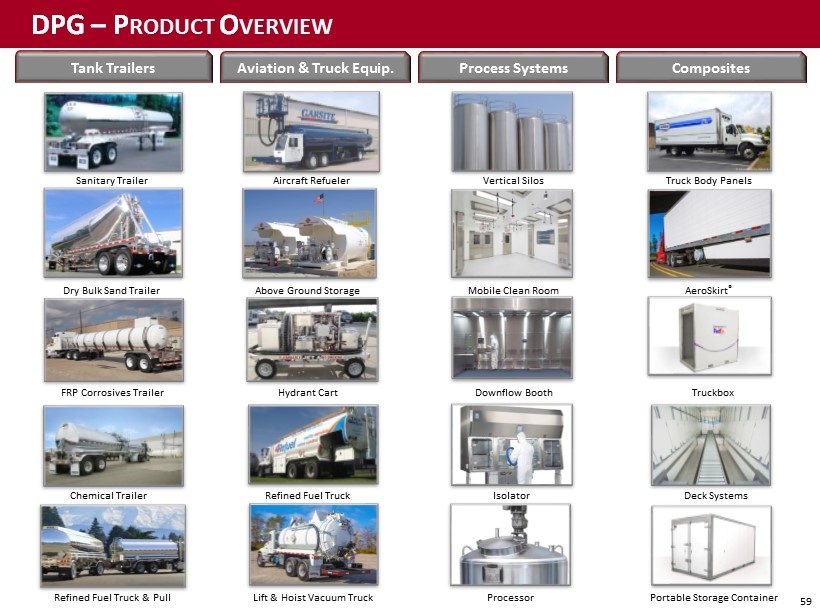
59 Sanitary Trailer Refined Fuel Truck Processor Downflow Booth Isolator Aircraft Refueler Dry Bulk Sand Trailer Vertical Silos Above Ground Storage Tanks Mobile Clean Room Hydrant Cart FRP Corrosives Trailer Lift & Hoist Vacuum Truck Refined Fuel Truck & Pull Chemical Trailer Truck Body Panels AeroSkirt ® Truckbox Deck Systems Portable Storage Container DPG – P RODUCT O VERVIEW Tank Trailers Process Systems Aviation & Truck Equip. Composites
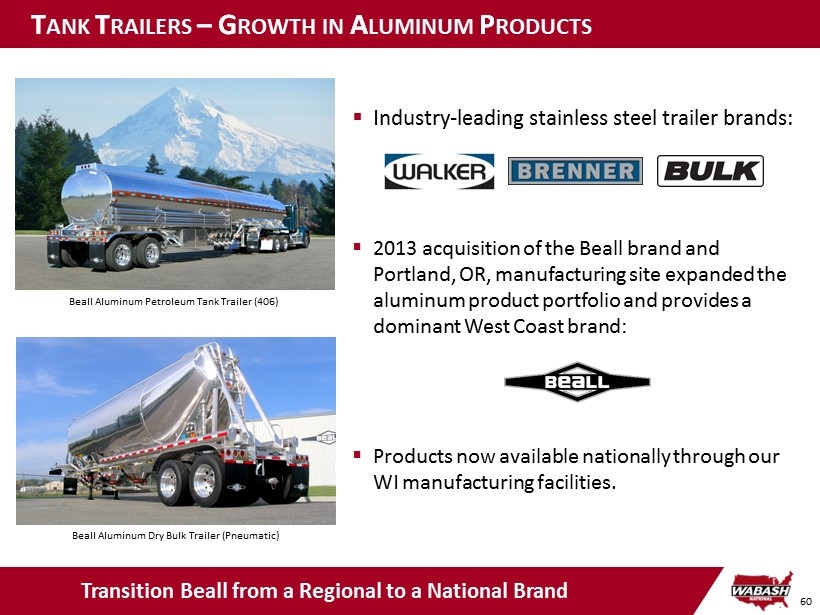
60 Transition Beall from a Regional to a National Brand T ANK T RAILERS – G ROWTH IN A LUMINUM P RODUCTS Beall Aluminum Petroleum Tank Trailer (406) Beall Aluminum Dry Bulk Trailer (Pneumatic) ▪ Industry - leading stainless steel trailer brands: ▪ 2013 acquisition of the Beall brand and Portland, OR, manufacturing site expanded the aluminum product portfolio and provides a dominant West Coast brand: ▪ Products now available nationally through our WI manufacturing facilities.
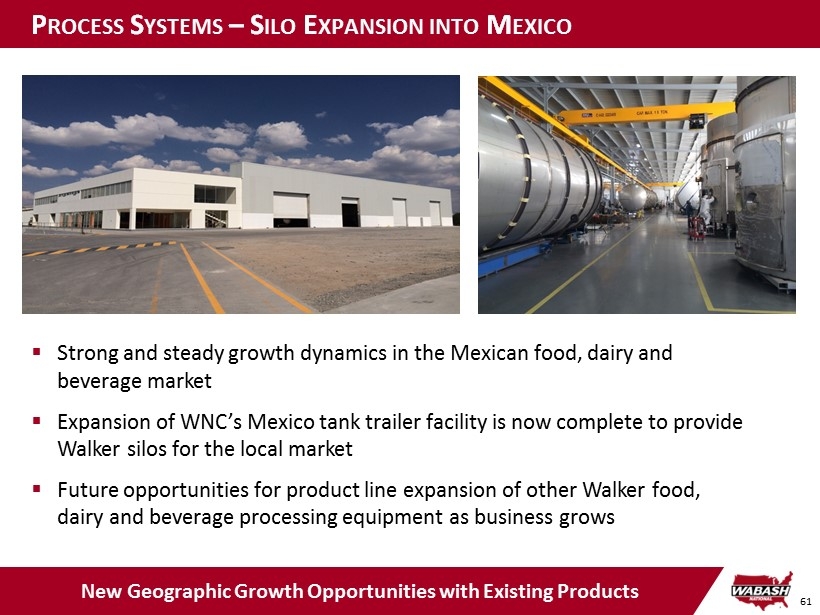
61 P ROCESS S YSTEMS – S ILO E XPANSION INTO M EXICO New Geographic Growth Opportunities with Existing Products ▪ Strong and steady growth dynamics in the Mexican food, dairy and beverage market ▪ Expansion of WNC’s Mexico tank trailer facility is now complete to provide Walker silos for the local market ▪ Future opportunities for product line expansion of other Walker food, dairy and beverage processing equipment as business grows

62 P ROCESS S YSTEMS – L IFE S CIENCES Growth Opportunities Through New Innovation ▪ Developing new Mobile Clean Room (MCR) offerings for domestic and international use in new markets ▪ Developing standard product offerings for key end markets and customers around the globe Mobile Clean Rooms Isolator/ Downflow Booths
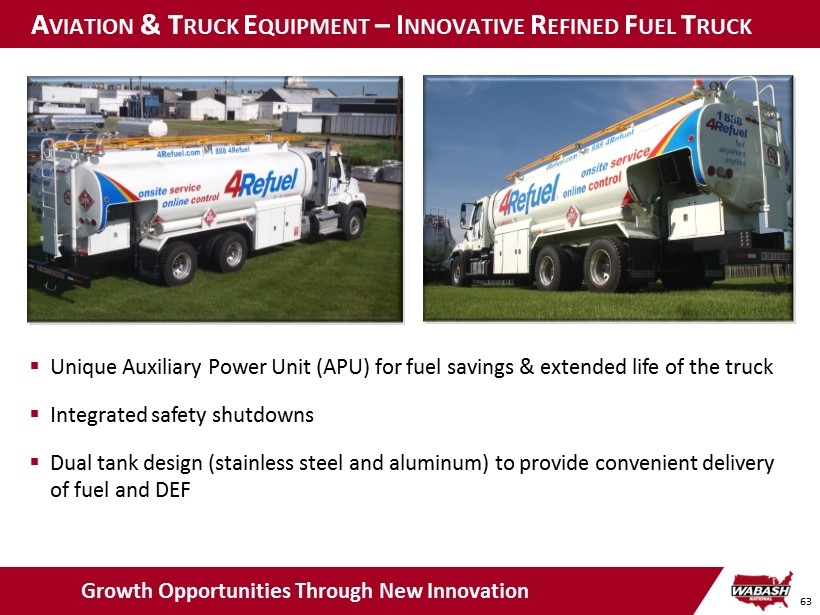
63 A VIATION & T RUCK E QUIPMENT – I NNOVATIVE R EFINED F UEL T RUCK Growth Opportunities Through New Innovation ▪ Unique Auxiliary Power Unit (APU) for fuel savings & extended life of the truck ▪ Integrated safety shutdowns ▪ Dual tank design (stainless steel and aluminum) to provide convenient delivery of fuel and DEF

64 Aerodynamic Solutions Panel Solutions Custom Solutions Mobile Solutions Broad and Diverse Portfolio OHD Application Swing Door Application LTL Conveyor System Specialty Vehicle Ramp LTL Dividers Non - Stack PSC European Dry Van Trailer Stackable PSC LTL Decking System LTL Pup Aero Package AeroFin XL Ventix DRS Package 5S Container AeroSkirt CX Composite Truck Body Truck Box Cargo Container C OMPOSITES P RODUCT P LATFORMS
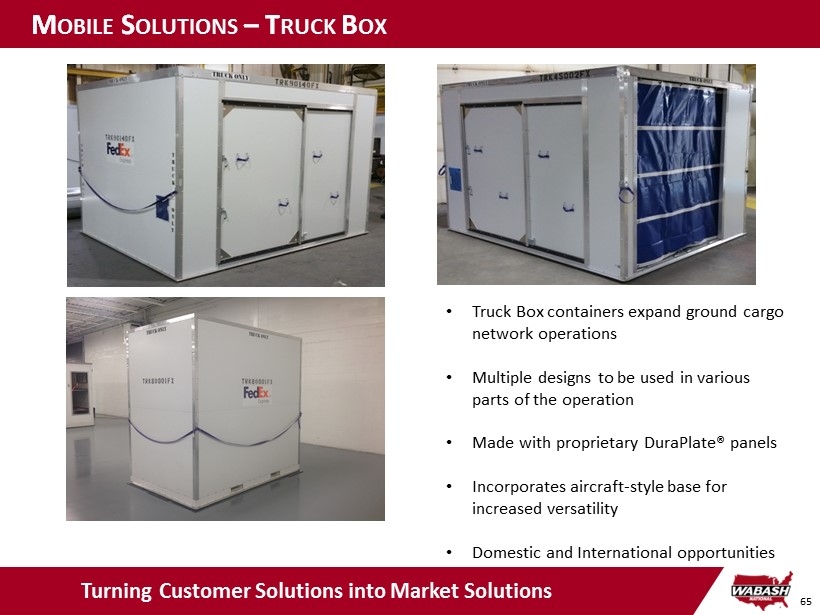
65 Turning Customer Solutions into Market Solutions • Truck Box containers expand ground cargo network operations • Multiple designs to be used in various parts of the operation • Made with proprietary DuraPlate ® panels • Incorporates aircraft - style base for increased versatility • Domestic and International opportunities M OBILE S OLUTIONS – T RUCK B OX
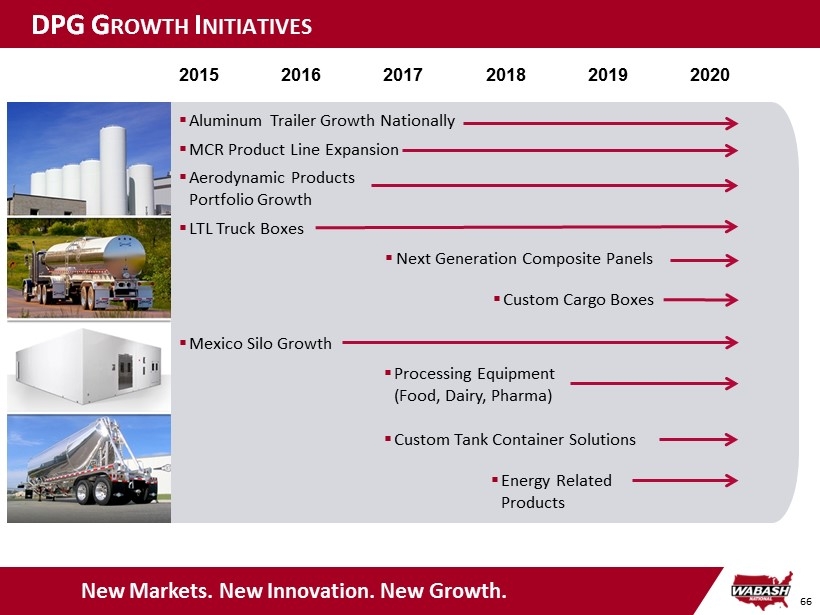
66 DPG G ROWTH I NITIATIVES New Markets. New Innovation. New Growth. 2015 2016 2017 2018 2019 2020 ▪ Aluminum Trailer Growth Nationally ▪ MCR Product Line Expansion ▪ Aerodynamic Products Portfolio Growth ▪ LTL Truck Boxes ▪ Mexico Silo Growth ▪ Custom Tank Container Solutions ▪ Energy Related Products ▪ Custom Cargo Boxes ▪ Processing Equipment (Food, Dairy, Pharma) ▪ Next Generation Composite Panels

2015 ANALYST/INVESTOR DAY Retail August 18, 2015 Rick Klein Vice President & General Manager – Retail

68 Company - Owned Retail Locations Financial Performance ▪ Dealership model, selling new and used trailers, aftermarket parts, and maintenance and repair services ▪ Integrated with OEM to deliver best practices and innovation in the aftermarket ▪ Expansion into new markets with mobile service and 3rd party maintenance ▪ Low CapEx and synergistic expansion in higher - margin tank parts and service S EGMENT P ROFILE : R ETAIL Segment Revenue and OI are prior to the elimination of intersegment sales. -2 0 2 4 6 - 50 100 150 200 2010 2011 2012 2013 2014 Operating Income ($M) Revenue ($M) Revenue ($M) Op Income ($M) Strategic Footprint Providing National Support

69 R ETAIL : M ISSION Tank Services Market Recognized Customer Value New Trailer Sales Used Trailer Sales Parts Service Geographic Locations Brand Strength Parts & Service Expertise 3 rd Party Service Capability Create a fully integrated, national dealership organization recognized for value - added service that is the #1 choice of customers in the geographic regions we serve. Service Response Paramount to the Future of Interstate Trucking
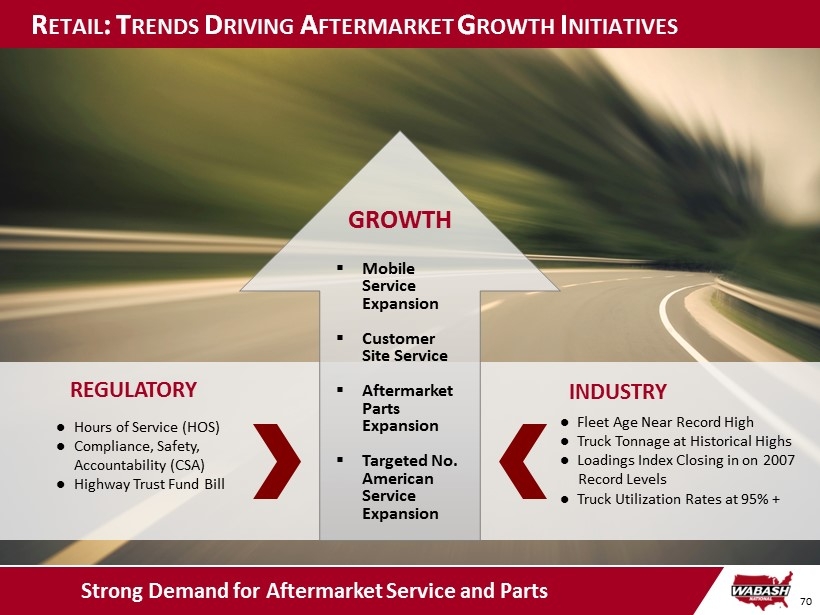
70 INDUSTRY Ɣ Fleet Age Near Record High Ɣ Truck Tonnage at Historical Highs Ɣ Loadings Index Closing in on 2007 Record Levels Ɣ Truck Utilization Rates at 95% + Strong Demand for Aftermarket Service and Parts R ETAIL : T RENDS D RIVING A FTERMARKET G ROWTH I NITIATIVES GROWTH Ɣ Hours of Service (HOS) Ɣ Compliance, Safety, Accountability (CSA) Ɣ Highway Trust Fund Bill REGULATORY ▪ Mobile Service Expansion ▪ Customer Site Service ▪ Aftermarket Parts Expansion ▪ Targeted No. American Service Expansion
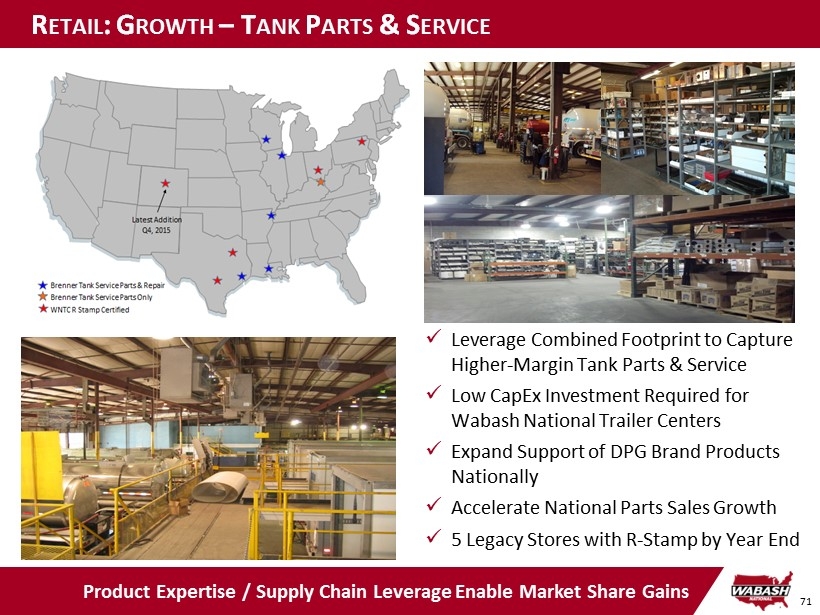
71 R ETAIL : G ROWTH – T ANK P ARTS & S ERVICE x Leverage Combined Footprint to Capture Higher - Margin Tank Parts & Service x Low CapEx Investment Required for Wabash National Trailer Centers x Expand Support of DPG Brand Products Nationally x Accelerate National Parts Sales Growth x 5 Legacy Stores with R - Stamp by Year End Product Expertise / Supply Chain Leverage Enable Market Share Gains

72 $10 $15 $20 $25 $30 $35 $40 Customer Site Service Revenue Growth A Repeatable Service Model for Future Growth R ETAIL : G ROWTH – C USTOMER S ITE S ERVICE x Full Service Capability – minor to major repairs, national parts pricing and supply, OEM trained technicians x Favorably impacts trailer fleet utilization by minimizing repair times x Eliminates the complexity of managing a service shop, non - core to carriers x Reduces elapsed “unit downtime” x Full inspection capabilities reduces risk of on - highway citations
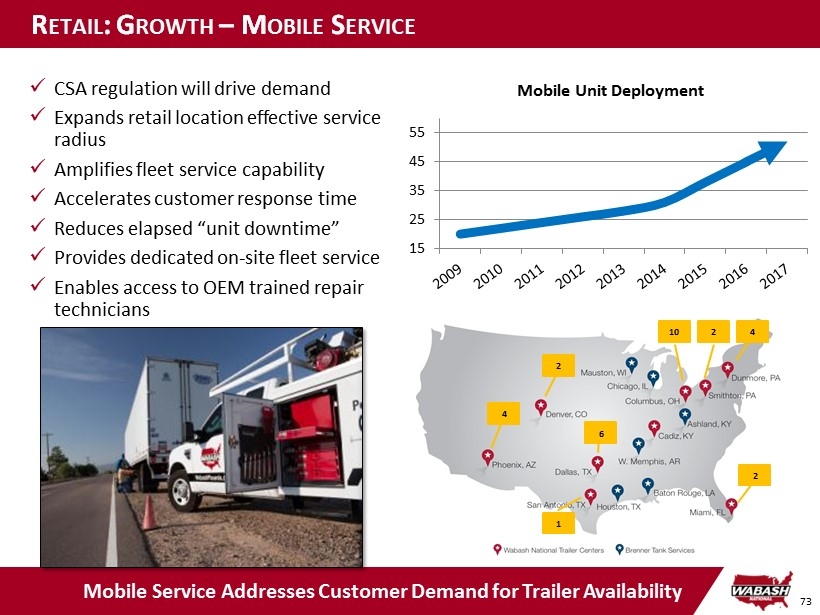
73 R ETAIL : G ROWTH – M OBILE S ERVICE 4 2 10 2 1 6 2 4 15 25 35 45 55 Mobile Unit Deployment x CSA regulation will drive demand x Expands retail location effective service radius x Amplifies fleet service capability x Accelerates customer response time x Reduces elapsed “unit downtime” x Provides dedicated on - site fleet service x Enables access to OEM trained repair technicians Mobile Service Addresses Customer Demand for Trailer Availability

74 R ETAIL G ROWTH I NITIATIVES New Markets. New Innovation. New Growth. ▪ Build Initial Customer Site Service Footprint ▪ Leverage Tank & Trailer Combined Footprint ▪ Expand Mobile Service Fleet ▪ Accelerate Tank Parts & Service Sales Growth ▪ Expand Customer Site Service Offering 2015 2016 2017 2018 2019 2020

2015 ANALYST/INVESTOR DAY Financial Overview August 18, 2015 Jeff Taylor Chief Financial Officer
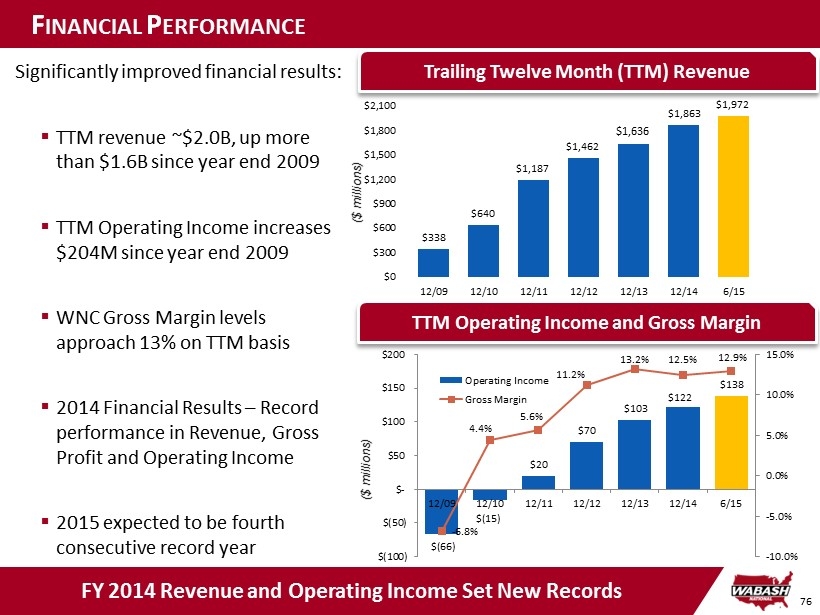
76 $338 $640 $1,187 $1,462 $1,636 $1,863 $1,972 $0 $300 $600 $900 $1,200 $1,500 $1,800 $2,100 12/09 12/10 12/11 12/12 12/13 12/14 6/15 ($ millions) F INANCIAL P ERFORMANCE Trailing Twelve Month (TTM) Revenue FY 2014 Revenue and Operating Income Set New Records ($ millions) Significantly improved financial results : ▪ TTM revenue ~$2.0B, up more than $ 1.6B since year end 2009 ▪ TTM Operating Income increases $204M since year end 2009 ▪ WNC Gross Margin levels approach 13% on TTM basis ▪ 2014 Financial Results – Record performance in Revenue, Gross Profit and Operating Income ▪ 2015 expected to be fourth consecutive record year TTM Operating Income and Gross Margin $(66) $(15) $20 $70 $103 $122 $138 - 6.8% 4.4% 5.6% 11.2% 13.2% 12.5% 12.9% -10.0% -5.0% 0.0% 5.0% 10.0% 15.0% $(100) $(50) $- $50 $100 $150 $200 12/09 12/10 12/11 12/12 12/13 12/14 6/15 Operating Income Gross Margin

77 F INANCIAL P ERFORMANCE TTM Operating EBITDA at $186M and Net Leverage of 1.1x Net Leverage Ratio Improved top - line and margins lead to: ▪ Record FY Operating EBITDA and year end liquidity in 2014 ▪ Cash generation leading to lower net debt leverage ($43) $5 $39 $119 $150 $169 $186 ($100) ($50) $0 $50 $100 $150 $200 12/09 12/10 12/11 12/12 12/13 12/14 6/15 ($millions) (1) See Appendix for reconciliation of non - GAAP financial information TTM Operating EBITDA (1) Target Liquidity ( 2) (2) Defined as cash on hand plus available borrowing capacity on our revolving credit facility $21 $60 $126 $224 $254 $290 $308 $- $50 $100 $150 $200 $250 $300 $350 12/09 12/10 12/11 12/12 12/13 12/14 6/15 ($ millions) 3.1 2.7 2.3 1.9 2.1 1.9 1.7 1.2 1.3 1.1 0 0.5 1 1.5 2 2.5 3 3.5 4 Q1 13 Q2 13 Q3 13 Q4 13 Q1 14 Q2 14 Q3 14 Q4 14 Q1 15 Q2 15 Leverage
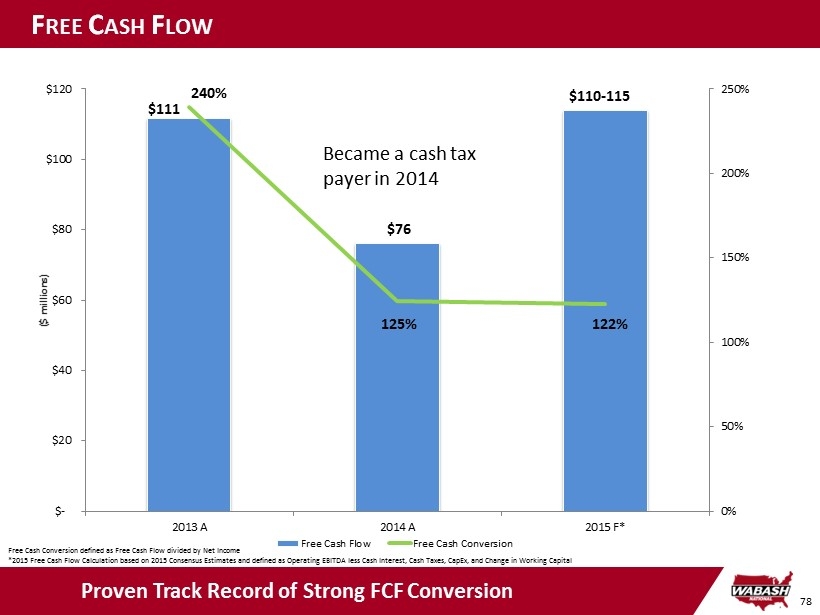
78 $111 $76 $114 240% 125% 122% 0% 50% 100% 150% 200% 250% $- $20 $40 $60 $80 $100 $120 2013 A 2014 A 2015 F* ($ millions) Free Cash Flow Free Cash Conversion $110 - 115 Became a cash tax payer in 2014 Proven Track Record of Strong FCF Conversion Free Cash Conversion defined as Free Cash Flow divided by Net Income *2015 Free Cash Flow Calculation based on 2015 Consensus Estimates and defined as Operating EBITDA less Cash Interest, Cash T axe s, CapEx , and Change in Working Capital F REE C ASH F LOW

79 • Share repurchases: $40M repurchased in 2015 YTD • $380M of acquisitions with Walker and Beall • Debt Profile: >$100M of debt reduction over past 3 years • Total Capital Expenditures: $78M Organic Growth Investment/ CapEX Debt Reduction Strategic Investment/ Acquisitions Liquidity C APITAL A LLOCATION : 2012 – 2015F Shareholder Return of Capital Share Repurchase/ Dividends

80 • Completed Walker strategic acquisition, transforming the company Financing: • $300M Term Loan B • $150M of Conv. Notes • Retired $56M Revolver balance and refinanced instrument • Refinance Term Loan B – reduced rate by 125 bps • Voluntary prepayment of $60M on the Term Loan B • Voluntary prepayment of $40M on the Term Loan B • Total reduction of indebtedness since Walker acquisition exceeds $160M • Refinanced Term Loan B – reduced rate 25 bps and extended maturity to 2022 • Refinanced Revolver; extended maturity to 2020 and reduced drawn and undrawn pricing Net Leverage Reduced from 4.1x to 1.1x in 3 years 2012 2013 2014 2015 I MPROVED D EBT P ROFILE – A CTIVE M ANAGEMENT OF THE B ALANCE S HEET
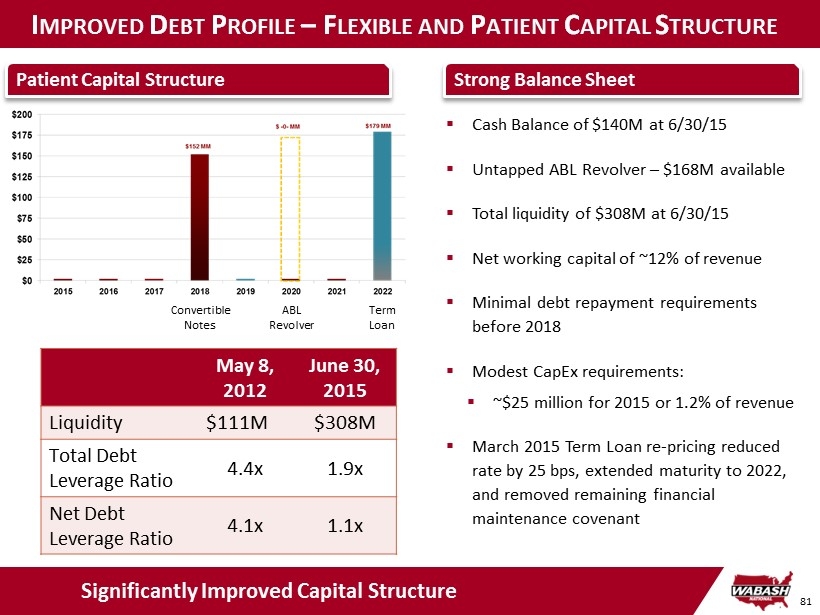
81 Strong Balance Sheet ▪ Cash Balance of $140M at 6/30/15 ▪ Untapped ABL Revolver – $168M available ▪ Total liquidity of $308M at 6/30/15 ▪ Net working capital of ~12% of revenue ▪ Minimal debt repayment requirements before 2018 ▪ Modest CapEx requirements: ▪ ~$25 million for 2015 or 1.2% of revenue ▪ March 2015 Term Loan re - pricing reduced rate by 25 bps, extended maturity to 2022, and removed remaining financial maintenance covenant Significantly Improved Capital Structure Term Loan May 8, 2012 June 30, 2015 Liquidity $111M $308M Total Debt Leverage Ratio 4.4x 1.9x Net Debt Leverage Ratio 4.1x 1.1x Patient Capital Structure Convertible Notes ABL Revolver Term Loan I MPROVED D EBT P ROFILE – F LEXIBLE AND P ATIENT C APITAL S TRUCTURE
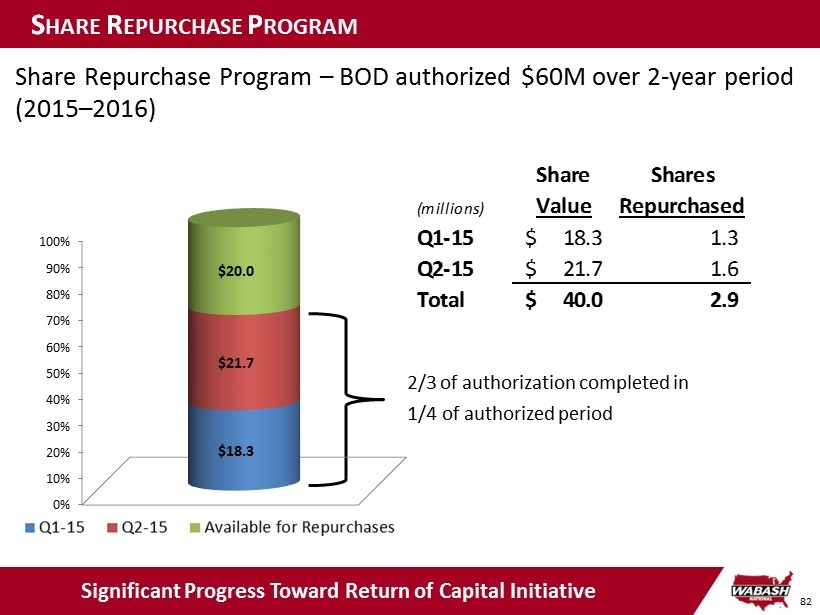
82 S HARE R EPURCHASE P ROGRAM Share Repurchase Program – BOD authorized $60M over 2 - year period ( 2015 – 2016 ) Significant Progress Toward Return of Capital Initiative 2/3 of authorization completed in 1/4 of authorized period Share Shares (millions) Value Repurchased Q1-15 18.3$ 1.3 Q2-15 21.7$ 1.6 Total 40.0$ 2.9 0% 10% 20% 30% 40% 50% 60% 70% 80% 90% 100% $18.3 $21.7 $20.0

83 S TRATEGIC A CQUISITIONS 1. Value - added, engineered products and services, where we can provide value - added customer solutions 2. Operating Margins > 10% 3. Strong management teams that are a cultural fit 4. Aligned with core competencies in purchasing, operations, distribution and product development 5. Diversified growth markets ( end markets or geographies) and less cyclical industries » Tank Trailers » Process Systems » Aviation & Truck Equipment Transformative Acquisition Platform Expanding Acquisition » Aluminum 406 » Dry Bulk Tanks 2012 & 2013 Future Investment Criteria Growth Through Acquisition Remains a Strategic Component
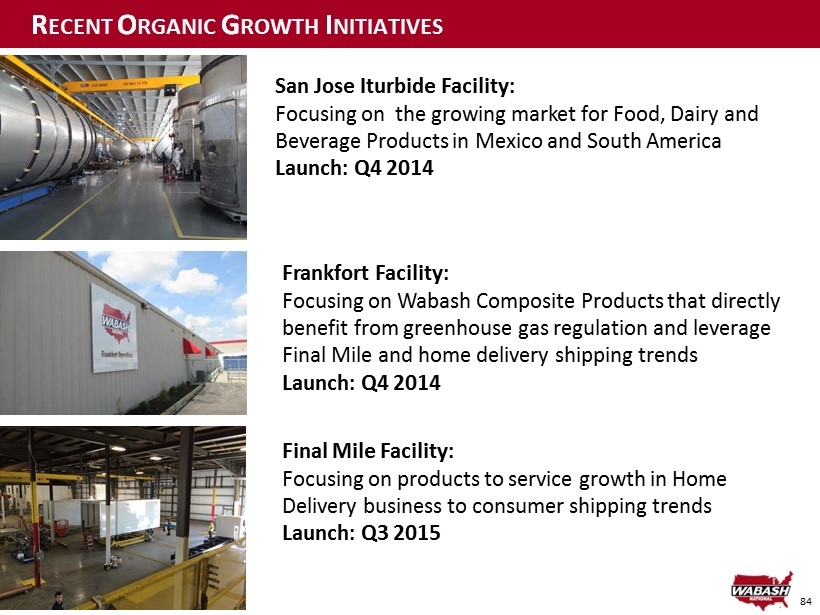
84 Final Mile Facility: Focusing on products to service growth in Home Delivery business to consumer shipping trends Launch: Q3 2015 R ECENT O RGANIC G ROWTH I NITIATIVES Frankfort Facility: Focusing on Wabash Composite Products that directly benefit from greenhouse gas regulation and leverage Final Mile and home delivery shipping trends Launch: Q4 2014 San Jose Iturbide Facility: Focusing on the growing market for Food, Dairy and Beverage Products in Mexico and South America Launch: Q4 2014

85 A Solid Foundation for Organic and Strategic Growth Wabash National’s corporate s trategy focused on organic and strategic g rowth coupled with a disciplined capital allocation plan and supported by strong business performance and a solid financial position A P LATFORM FOR F UTURE G ROWTH
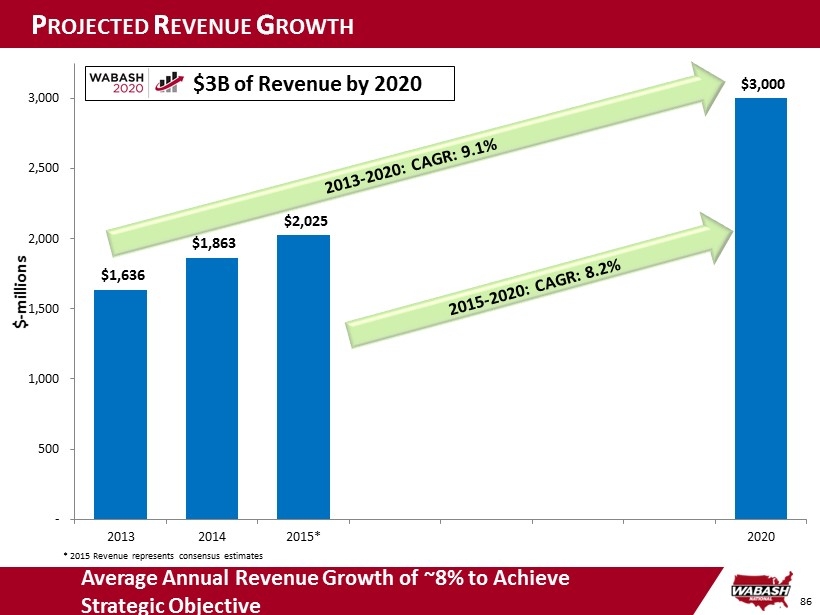
86 $1,636 $1,863 $2,025 $3,000 - 500 1,000 1,500 2,000 2,500 3,000 2013 2014 2015* 2020 $ - millions $3B of Revenue by 2020 Average Annual Revenue Growth of ~8% to Achieve Strategic Objective P ROJECTED R EVENUE G ROWTH * 2015 Revenue represents consensus estimates

87 P ROJECTED EPS G ROWTH $0.70 $0.89 $1.30 $2.50 $- $0.50 $1.00 $1.50 $2.00 $2.50 2013 2014 2015* 2020 Earnings Per Share * 2015 EPS represents the mid - point of communicated range Average Annual EPS Growth of ~14% to Achieve Strategic Objective $2.50 of EPS by 2020

88 Wabash National Transforms into a Diversified Industrial Top Line & Bottom Line Growth • ~8% Rev. CAGR • 10 - 15% EPS CAGR Significant Cash Generation • >$100M FCF in ’15 • >100% Cash Conversion Improved Operating Margins • >10% OM% Improved ROIC • >20% ROIC Industry: WNC Peer Group including: ACW, CVGI, FSS, MOD, MTOR, NAV, OSK, PCAR, SPAR, TECU, TOWR, TRS Industry = Average of companies excludes High & Low data point (1): P/E = Current Price/2015 Cons. EPS (2): EV/EBITDA = (Market Cap + Net Debt)/2015E Cons. EBITDA T HE P ATH TO V ALUE C REATION Enhanced Financial Fundamentals Leads to Superior Business Results and Multiple Expansion 10.5 12.6 9.0 9.5 10.0 10.5 11.0 11.5 12.0 12.5 13.0 WNC Industry Consensus P/E (1) 5.6 7.0 - 1.0 2.0 3.0 4.0 5.0 6.0 7.0 8.0 WNC Industry 2015E EV/EBITDA (2)

89 Questions? T HANK Y OU Panel Questions And Answers
WABASH NATIONAL CORPORATION Appendix
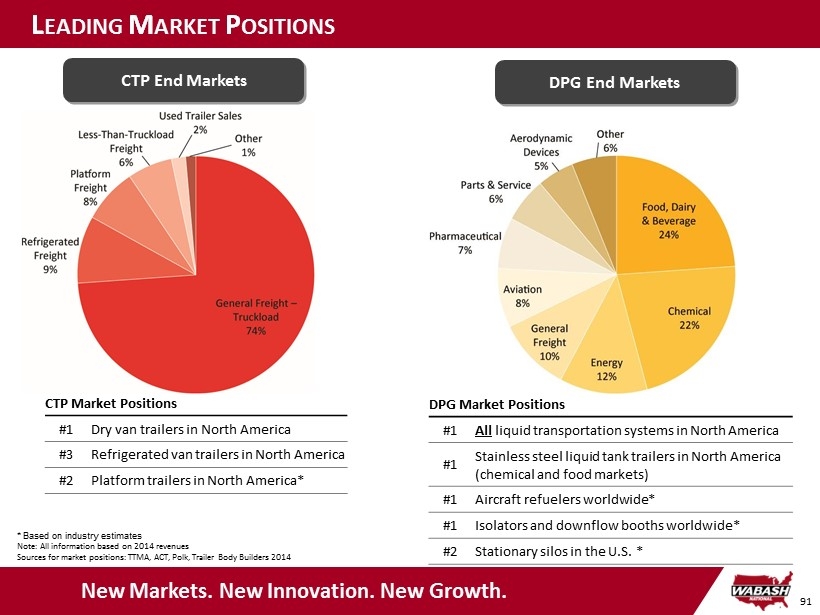
91 L EADING M ARKET P OSITIONS DPG End Markets CTP End Markets DPG Market Positions #1 All liquid transportation systems in North America #1 Stainless steel liquid tank trailers in North America (chemical and food markets) #1 Aircraft refuelers worldwide* #1 Isolators and downflow booths worldwide * #2 Stationary silos in the U.S. * * Based on industry estimates Note: All information based on 2014 revenues Sources for market positions: TTMA, ACT, Polk, Trailer Body Builders 2014 CTP Market Positions #1 Dry van trailers in North America #3 Refrigerated van trailers in North America #2 Platform trailers in North America* New Markets. New Innovation. New Growth.
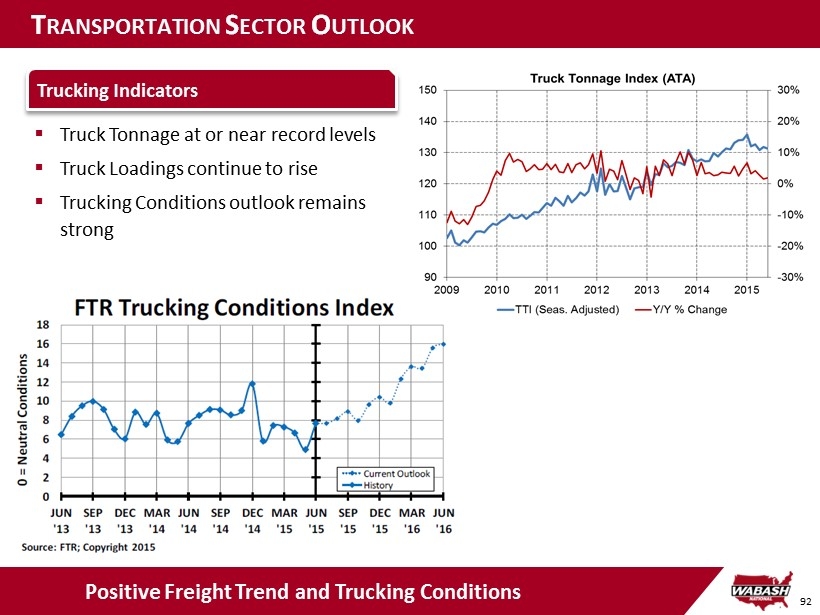
92 T RANSPORTATION S ECTOR O UTLOOK Strong demand above replacement levels ▪ Truck Tonnage at or near record levels ▪ Truck Loadings continue to rise ▪ Trucking Conditions outlook remains strong Positive Freight Trend and Trucking Conditions Trucking Indicators

93 ACT Forecast by Segment 2013 2014 2015 2016 2017 2018 2019 Dry Van 134,586 155,909 180,800 177,500 162,000 148,000 153,800 Refrigerated 35,879 38,616 43,500 40,000 37,500 38,000 40,000 Platform 22,122 25,749 33,300 32,000 27,200 24,000 23,000 Liquid Tanks 8,301 8,656 7,700 7,200 6,700 6,700 7,200 Dry Bulk Tanks 1,403 3,227 2,800 1,500 1,800 2,100 2,100 Other 34,436 36,589 38,800 38,600 38,500 39,200 37,900 Total 236,727 268,746 306,900 296,800 273,700 258,000 264,000 T RAILER S ECTOR O UTLOOK Strong demand above replacement levels Strong Demand Projected Throughout Forecast Period ▪ Strong demand above replacement levels forecast for next 5 years ▪ Fleet equipment dynamics and regulations key drivers of trailer demand ▪ ACT forecasts for 2016 – 2018 include anticipated federal regulations for 33' pups Trailer Forecasts
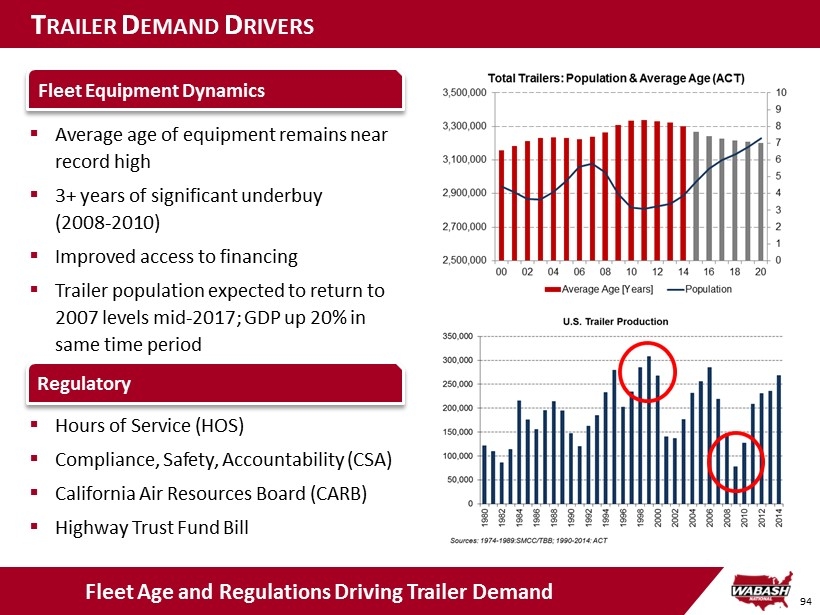
94 T RAILER D EMAND D RIVERS Strong demand above replacement levels Fleet Age and Regulations Driving Trailer D emand Fleet Equipment Dynamics ▪ Average age of equipment remains near record high ▪ 3 + years of significant underbuy (2008 - 2010) ▪ Improved access to financing ▪ Trailer population expected to return to 2007 levels mid - 2017; GDP up 20 % in same time period ▪ Hours of Service (HOS) ▪ Compliance, Safety, Accountability (CSA ) ▪ California Air Resources Board (CARB) ▪ Highway Trust Fund Bill Regulatory
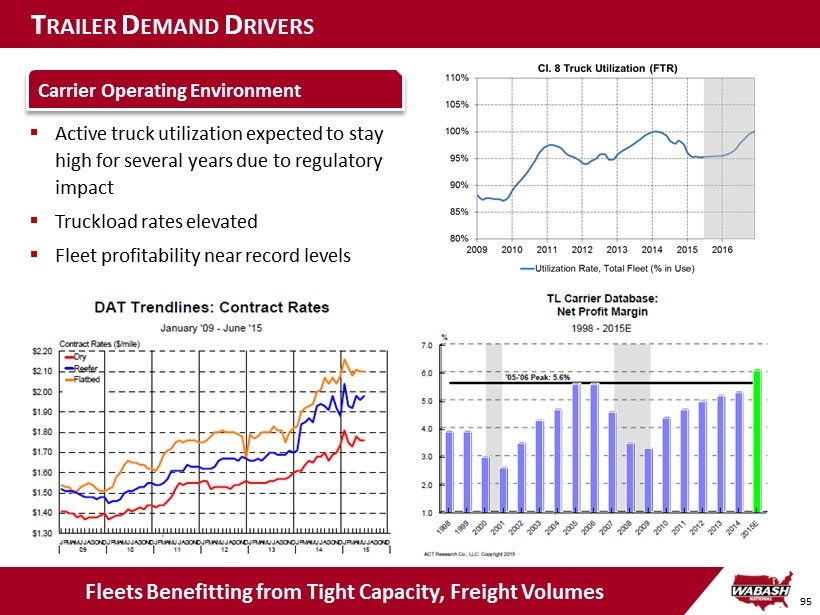
95 T RAILER D EMAND D RIVERS Fleets Benefitting from Tight Capacity, Freight Volumes ▪ Active truck utilization expected to stay high for several years due to regulatory impact ▪ Truckload rates elevated ▪ Fleet profitability near record levels Carrier Operating Environment

96 C OMMERCIAL T RAILER P RODUCTS T RUCKING T O R EMAIN D OMINANT T RANSPORTATION M ODE Long - Term Outlook for Trucking Positive Overall Freight Trends • Total tonnage projected to increase from 14.5B tons in 2014 to 19.2B tons in 2026 • Total freight revenue projected to increase from $872B in 2014 to $ 1,522B in 2026 Trucking Freight Trends • Truck mode share of total freight tonnage projected to decline slightly from 68.8% in 2014 (10.0 B tons) to 64.6% (12.4B tons) in 2026 as pipelines benefit from energy sector boom • Estimated Freight Increase ’15 ’17 - ’21 ’22 - ’26 Truckload (TL) 2.9%/yr 2.1%/yr 1.2%/yr Less - than - truckload ( LTL) 4.4%/yr 3.3%/yr 2.5%/yr Source: ATA
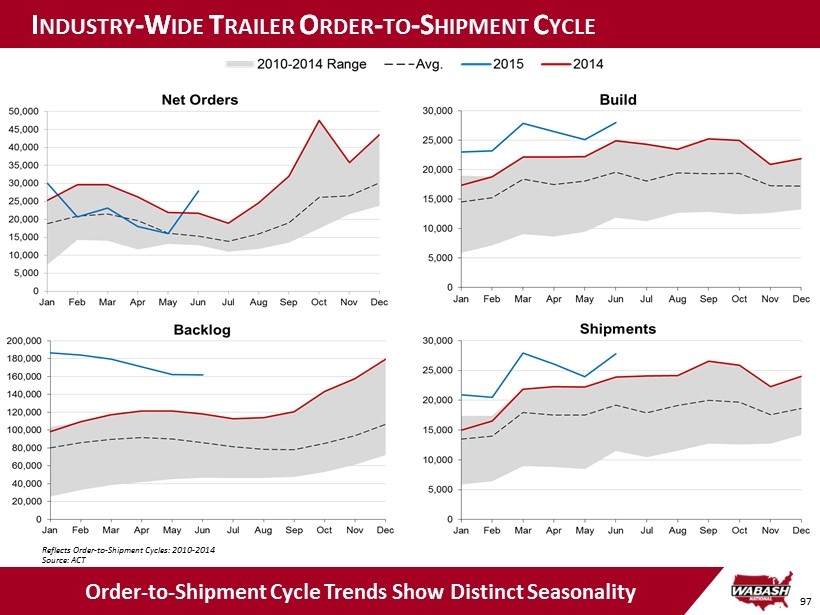
97 I NDUSTRY - W IDE T RAILER O RDER - TO - S HIPMENT C YCLE Order - to - Shipment Cycle Trends Show Distinct Seasonality Reflects Order - to - Shipment Cycles: 2010 - 2014 Source: ACT

98 M ARKET D EMAND D RIVERS ▪ Projected growth in Truck Body market drives DuraPlate® panel sales growth ▪ CARB compliance requirements continue to drive demand for aerodynamic products ▪ Housing starts support potential moving and storage growth and need for portable storage containers

99 S EGMENT O UTLOOK : D IVERSIFIED P RODUCTS ▪ Growing milk production supports demand for dairy silos, mixers and food - grade tank trailers ▪ Pharmaceutical R&D is expected to increase through 2018 ▪ Lower cost access to natural gas driving increased capital spending and output in the domestic chemical industry
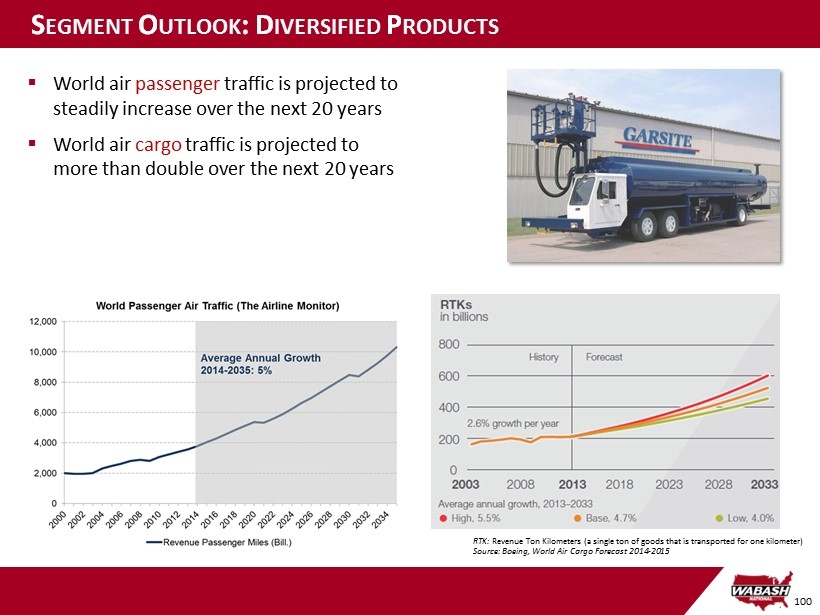
100 S EGMENT O UTLOOK : D IVERSIFIED P RODUCTS ▪ World air passenger traffic is projected to steadily increase over the next 20 years ▪ World air cargo traffic is projected to more than double over the next 20 years RTK: Revenue Ton Kilometers (a single ton of goods that is transported for one kilometer) Source : Boeing, World Air Cargo Forecast 2014 - 2015
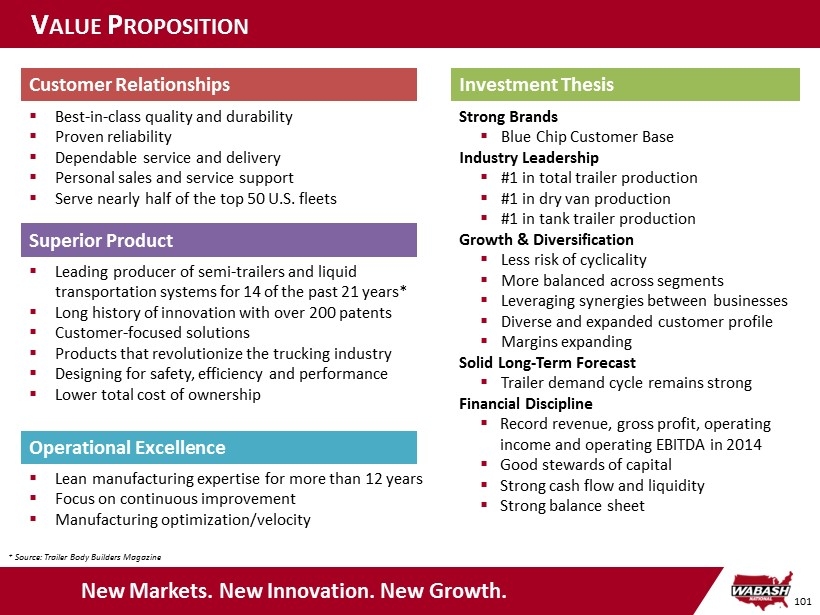
101 V ALUE P ROPOSITION New Markets. New Innovation. New Growth. Superior Product ▪ Leading producer of semi - trailers and liquid transportation systems for 14 of the past 21 years* ▪ Long history of innovation with over 200 patents ▪ Customer - focused solutions ▪ Products that revolutionize the trucking industry ▪ Designing for safety, efficiency and performance ▪ Lower total cost of ownership Operational Excellence ▪ Lean manufacturing expertise for more than 12 years ▪ Focus on continuous improvement ▪ Manufacturing optimization/velocity Customer Relationships ▪ Best - in - class quality and durability ▪ Proven reliability ▪ Dependable service and delivery ▪ Personal sales and service support ▪ Serve nearly half of the top 50 U.S. fleets Investment Thesis Strong Brands ▪ Blue Chip Customer Base Industry Leadership ▪ #1 in total trailer production ▪ #1 in dry van production ▪ #1 in tank trailer production Growth & Diversification ▪ Less risk of cyclicality ▪ More balanced across segments ▪ Leveraging synergies between businesses ▪ Diverse and expanded customer profile ▪ Margins expanding Solid Long - Term Forecast ▪ Trailer demand cycle remains strong Financial Discipline ▪ Record revenue, gross profit, operating income and operating EBITDA in 2014 ▪ Good stewards of capital ▪ Strong cash flow and liquidity ▪ Strong balance sheet * Source: Trailer Body Builders Magazine
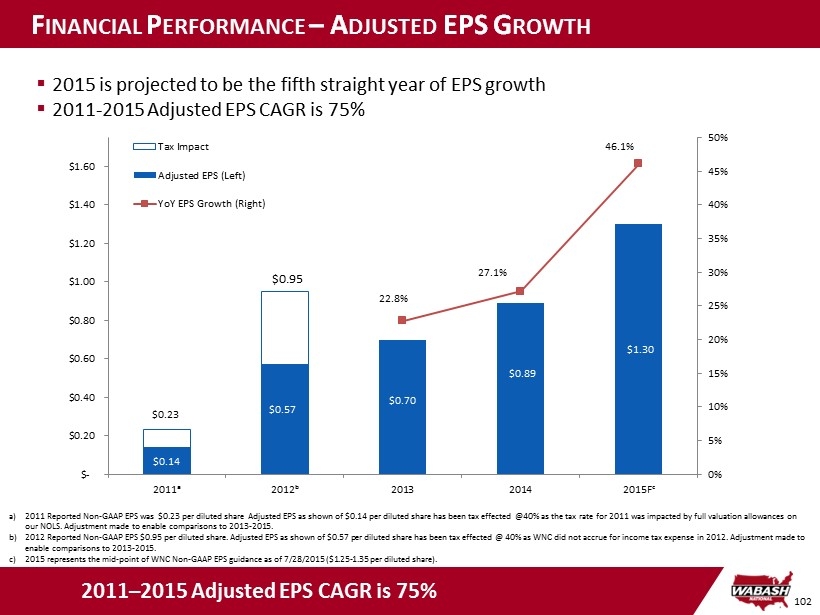
102 F INANCIAL P ERFORMANCE – A DJUSTED EPS G ROWTH 2011 – 2015 Adjusted EPS CAGR is 75% a) 2011 Reported Non - GAAP EPS was $0.23 per diluted share Adjusted EPS as shown of $ 0.14 per diluted share has been tax effected @40% as the tax rate for 2011 was impacted by full valuation allowances on our NOLS. Adjustment made to enable comparisons to 2013 - 2015. b) 2012 Reported Non - GAAP EPS $0.95 per diluted share. Adjusted EPS as shown of $0.57 per diluted share has been tax effected @ 40% as WNC did not accrue for income tax expense in 2012. Adjustment made to enable comparisons to 2013 - 2015. c) 2015 represents the mid - point of WNC Non - GAAP EPS guidance as of 7/28/2015 ($1.25 - 1.35 per diluted share). ▪ 2015 is projected to be the fifth straight year of EPS growth ▪ 2011 - 2015 Adjusted EPS CAGR is 75% $0.14 $0.57 $0.70 $0.89 $1.30 22.8% 27.1% 46.1% 0% 5% 10% 15% 20% 25% 30% 35% 40% 45% 50% $- $0.20 $0.40 $0.60 $0.80 $1.00 $1.20 $1.40 $1.60 2011ᵃ 2012ᵇ 2013 2014 2015F ᶜ Tax Impact Adjusted EPS (Left) YoY EPS Growth (Right) $0.95 $0.23
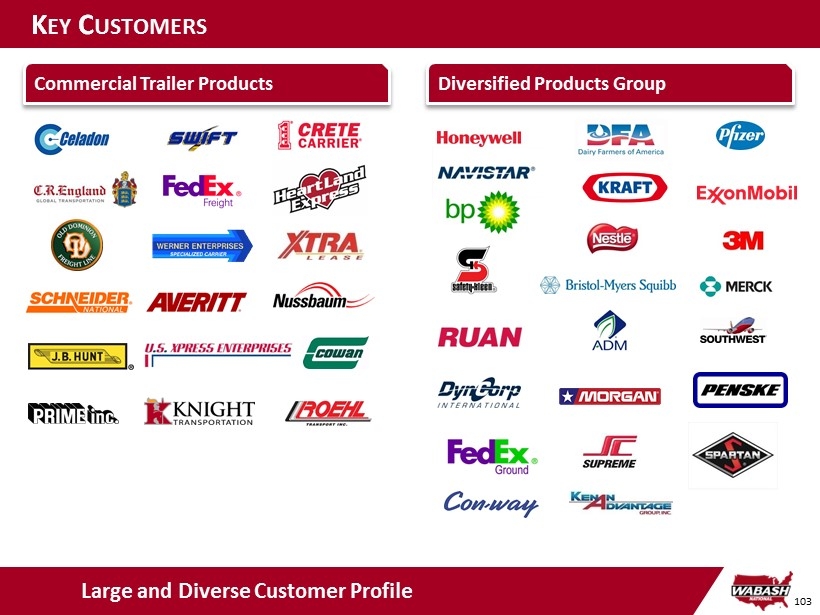
103 K EY C USTOMERS Large and Diverse Customer Profile Commercial Trailer Products Diversified Products Group
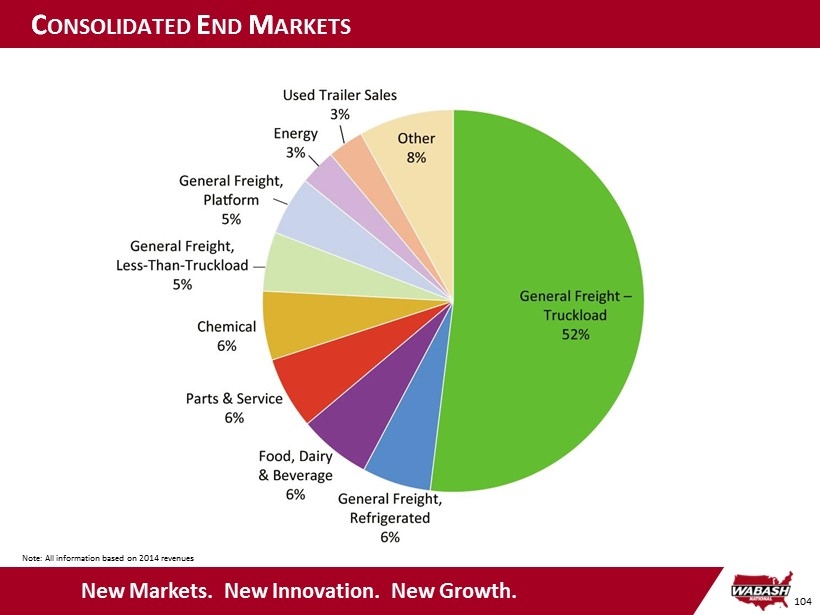
104 C ONSOLIDATED E ND M ARKETS Note: All information based on 2014 revenues New Markets. New Innovation. New Growth.
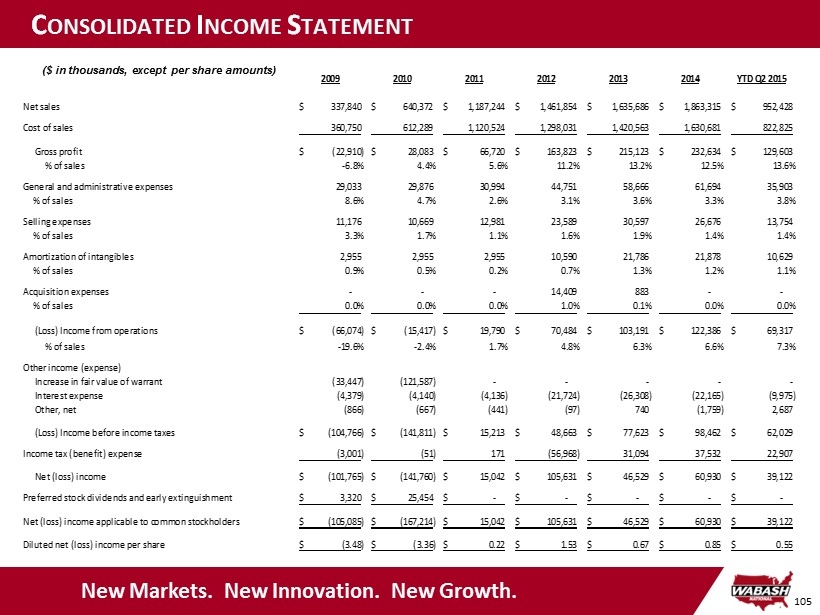
105 C ONSOLIDATED I NCOME S TATEMENT New Markets. New Innovation. New Growth. ($ in thousands, except per share amounts) 2009 2010 2011 2012 2013 2014 YTD Q2 2015 Net sales 337,840$ 640,372$ 1,187,244$ 1,461,854$ 1,635,686$ 1,863,315$ 952,428$ Cost of sales 360,750 612,289 1,120,524 1,298,031 1,420,563 1,630,681 822,825 Gross profit (22,910)$ 28,083$ 66,720$ 163,823$ 215,123$ 232,634$ 129,603$ % of sales -6.8% 4.4% 5.6% 11.2% 13.2% 12.5% 13.6% General and administrative expenses 29,033 29,876 30,994 44,751 58,666 61,694 35,903 % of sales 8.6% 4.7% 2.6% 3.1% 3.6% 3.3% 3.8% Selling expenses 11,176 10,669 12,981 23,589 30,597 26,676 13,754 % of sales 3.3% 1.7% 1.1% 1.6% 1.9% 1.4% 1.4% Amortization of intangibles 2,955 2,955 2,955 10,590 21,786 21,878 10,629 % of sales 0.9% 0.5% 0.2% 0.7% 1.3% 1.2% 1.1% Acquisition expenses - - - 14,409 883 - - % of sales 0.0% 0.0% 0.0% 1.0% 0.1% 0.0% 0.0% - - - - - - (Loss) Income from operations (66,074)$ (15,417)$ 19,790$ 70,484$ 103,191$ 122,386$ 69,317$ % of sales -19.6% -2.4% 1.7% 4.8% 6.3% 6.6% 7.3% Other income (expense) Increase in fair value of warrant (33,447) (121,587) - - - - - Interest expense (4,379) (4,140) (4,136) (21,724) (26,308) (22,165) (9,975) Other, net (866) (667) (441) (97) 740 (1,759) 2,687 (Loss) Income before income taxes (104,766)$ (141,811)$ 15,213$ 48,663$ 77,623$ 98,462$ 62,029$ Income tax (benefit) expense (3,001) (51) 171 (56,968) 31,094 37,532 22,907 Net (loss) income (101,765)$ (141,760)$ 15,042$ 105,631$ 46,529$ 60,930$ 39,122$ Preferred stock dividends and early extinguishment 3,320$ 25,454$ -$ -$ -$ -$ -$ Net (loss) income applicable to common stockholders (105,085)$ (167,214)$ 15,042$ 105,631$ 46,529$ 60,930$ 39,122$ Diluted net (loss) income per share (3.48)$ (3.36)$ 0.22$ 1.53$ 0.67$ 0.85$ 0.55$
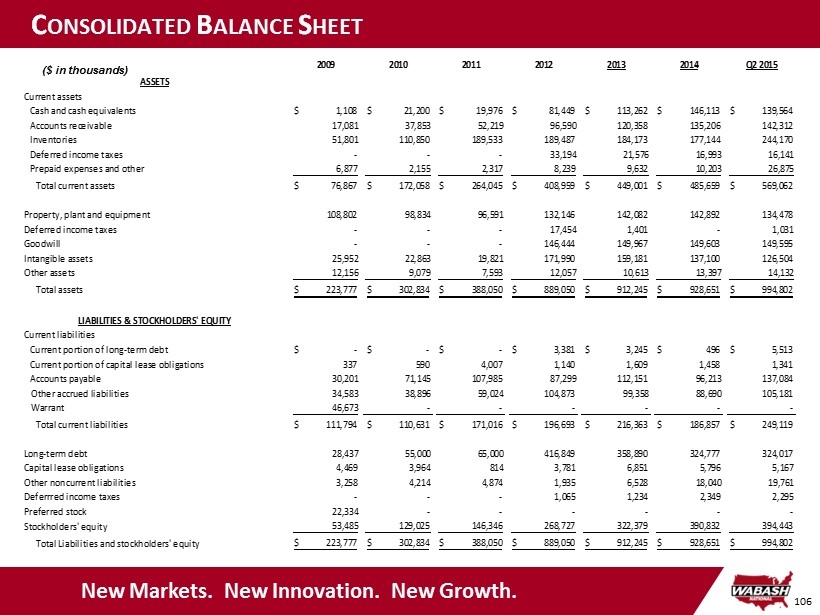
106 C ONSOLIDATED B ALANCE S HEET New Markets. New Innovation. New Growth. ($ in thousands) 2009 2010 2011 2012 2013 2014 Q2 2015 ASSETS Current assets Cash and cash equivalents 1,108$ 21,200$ 19,976$ 81,449$ 113,262$ 146,113$ 139,564$ Accounts receivable 17,081 37,853 52,219 96,590 120,358 135,206 142,312 Inventories 51,801 110,850 189,533 189,487 184,173 177,144 244,170 Deferred income taxes - - - 33,194 21,576 16,993 16,141 Prepaid expenses and other 6,877 2,155 2,317 8,239 9,632 10,203 26,875 Total current assets 76,867$ 172,058$ 264,045$ 408,959$ 449,001$ 485,659$ 569,062$ Property, plant and equipment 108,802 98,834 96,591 132,146 142,082 142,892 134,478 Deferred income taxes - - - 17,454 1,401 - 1,031 Goodwill - - - 146,444 149,967 149,603 149,595 Intangible assets 25,952 22,863 19,821 171,990 159,181 137,100 126,504 Other assets 12,156 9,079 7,593 12,057 10,613 13,397 14,132 Total assets 223,777$ 302,834$ 388,050$ 889,050$ 912,245$ 928,651$ 994,802$ LIABILITIES & STOCKHOLDERS' EQUITY Current liabilities Current portion of long-term debt -$ -$ -$ 3,381$ 3,245$ 496$ 5,513$ Current portion of capital lease obligations 337 590 4,007 1,140 1,609 1,458 1,341 Accounts payable 30,201 71,145 107,985 87,299 112,151 96,213 137,084 Other accrued liabilities 34,583 38,896 59,024 104,873 99,358 88,690 105,181 Warrant 46,673 - - - - - - Total current liabilities 111,794$ 110,631$ 171,016$ 196,693$ 216,363$ 186,857$ 249,119$ Long-term debt 28,437 55,000 65,000 416,849 358,890 324,777 324,017 Capital lease obligations 4,469 3,964 814 3,781 6,851 5,796 5,167 Other noncurrent liabilities 3,258 4,214 4,874 1,935 6,528 18,040 19,761 Deferrred income taxes - - - 1,065 1,234 2,349 2,295 Preferred stock 22,334 - - - - - - Stockholders' equity 53,485 129,025 146,346 268,727 322,379 390,832 394,443 Total Liabilities and stockholders' equity 223,777$ 302,834$ 388,050$ 889,050$ 912,245$ 928,651$ 994,802$
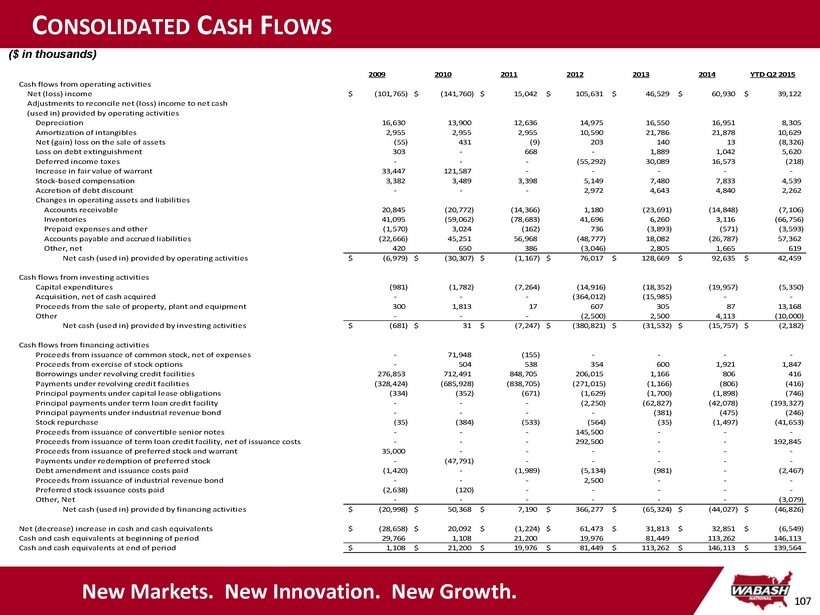
107 C ONSOLIDATED C ASH F LOWS New Markets. New Innovation. New Growth. ($ in thousands) 2009 2010 2011 2012 2013 2014 YTD Q2 2015 Cash flows from operating activities Net (loss) income (101,765)$ (141,760)$ 15,042$ 105,631$ 46,529$ 60,930$ 39,122$ Adjustments to reconcile net (loss) income to net cash (used in) provided by operating activities Depreciation 16,630 13,900 12,636 14,975 16,550 16,951 8,305 Amortization of intangibles 2,955 2,955 2,955 10,590 21,786 21,878 10,629 Net (gain) loss on the sale of assets (55) 431 (9) 203 140 13 (8,326) Loss on debt extinguishment 303 - 668 - 1,889 1,042 5,620 Deferred income taxes - - - (55,292) 30,089 16,573 (218) Increase in fair value of warrant 33,447 121,587 - - - - - Stock-based compensation 3,382 3,489 3,398 5,149 7,480 7,833 4,539 Accretion of debt discount - - - 2,972 4,643 4,840 2,262 Changes in operating assets and liabilities Accounts receivable 20,845 (20,772) (14,366) 1,180 (23,691) (14,848) (7,106) Inventories 41,095 (59,062) (78,683) 41,696 6,260 3,116 (66,756) Prepaid expenses and other (1,570) 3,024 (162) 736 (3,893) (571) (3,593) Accounts payable and accrued liabilities (22,666) 45,251 56,968 (48,777) 18,082 (26,787) 57,362 Other, net 420 650 386 (3,046) 2,805 1,665 619 Net cash (used in) provided by operating activities (6,979)$ (30,307)$ (1,167)$ 76,017$ 128,669$ 92,635$ 42,459$ Cash flows from investing activities Capital expenditures (981) (1,782) (7,264) (14,916) (18,352) (19,957) (5,350) Acquisition, net of cash acquired - - - (364,012) (15,985) - - Proceeds from the sale of property, plant and equipment 300 1,813 17 607 305 87 13,168 Other - - - (2,500) 2,500 4,113 (10,000) Net cash (used in) provided by investing activities (681)$ 31$ (7,247)$ (380,821)$ (31,532)$ (15,757)$ (2,182)$ Cash flows from financing activities Proceeds from issuance of common stock, net of expenses - 71,948 (155) - - - - Proceeds from exercise of stock options - 504 538 354 600 1,921 1,847 Borrowings under revolving credit facilities 276,853 712,491 848,705 206,015 1,166 806 416 Payments under revolving credit facilities (328,424) (685,928) (838,705) (271,015) (1,166) (806) (416) Principal payments under capital lease obligations (334) (352) (671) (1,629) (1,700) (1,898) (746) Principal payments under term loan credit facility - - - (2,250) (62,827) (42,078) (193,327) Principal payments under industrial revenue bond - - - - (381) (475) (246) Stock repurchase (35) (384) (533) (564) (35) (1,497) (41,653) Proceeds from issuance of convertible senior notes - - - 145,500 - - - Proceeds from issuance of term loan credit facility, net of issuance costs - - - 292,500 - - 192,845 Proceeds from issuance of preferred stock and warrant 35,000 - - - - - - Payments under redemption of preferred stock - (47,791) - - - - - (1,420) - (1,989) (5,134) (981) - (2,467) - - - 2,500 - - - (2,638) (120) - - - - - - - - - - - (3,079) Net cash (used in) provided by financing activities (20,998)$ 50,368$ 7,190$ 366,277$ (65,324)$ (44,027)$ (46,826)$ Net (decrease) increase in cash and cash equivalents (28,658)$ 20,092$ (1,224)$ 61,473$ 31,813$ 32,851$ (6,549)$ Cash and cash equivalents at beginning of period 29,766 1,108 21,200 19,976 81,449 113,262 146,113 Cash and cash equivalents at end of period 1,108$ 21,200$ 19,976$ 81,449$ 113,262$ 146,113$ 139,564$ Other, Net Preferred stock issuance costs paid Debt amendment and issuance costs paid Proceeds from issuance of industrial revenue bond

108 R ECONCILIATION OF N ON - GAAP M EASURES New Markets. New Innovation. New Growth. ($ in millions) Note: This table reconciles annual net income (loss) for the periods presented to the non - GAAP measure of Operating EBITDA. Di fferences may exist in the calculation of Operating EBITDA due to rounding. 2009 2010 2011 2012 2013 2014 YTD Q2 2015 Net (loss) income (101.8)$ (141.8)$ 15.0$ 105.6$ 46.5$ 60.9$ 39.1$ Income tax (benefit) expense (3.0) (0.1) 0.2 (57.1) 31.1 37.5 22.9 Increase in fair value of warrant 33.4 121.6 - - - - - Interest expense 4.4 4.1 4.1 21.7 26.3 22.2 10.0 Depreciation and amortization 19.6 16.9 15.6 25.6 38.3 38.8 18.9 Stock-based compensation 3.4 3.5 3.4 5.2 7.5 7.8 4.5 Acquisition expenses - - - 17.3 0.9 - - Other non-operating expense (income) 0.9 0.7 0.5 0.2 (0.7) 1.8 (2.6) Operating EBITDA (43.1)$ 4.9$ 38.8$ 118.5$ 149.9$ 169.0$ 92.8$ % of sales -12.8% 0.8% 3.3% 8.1% 9.2% 9.1% 9.7%
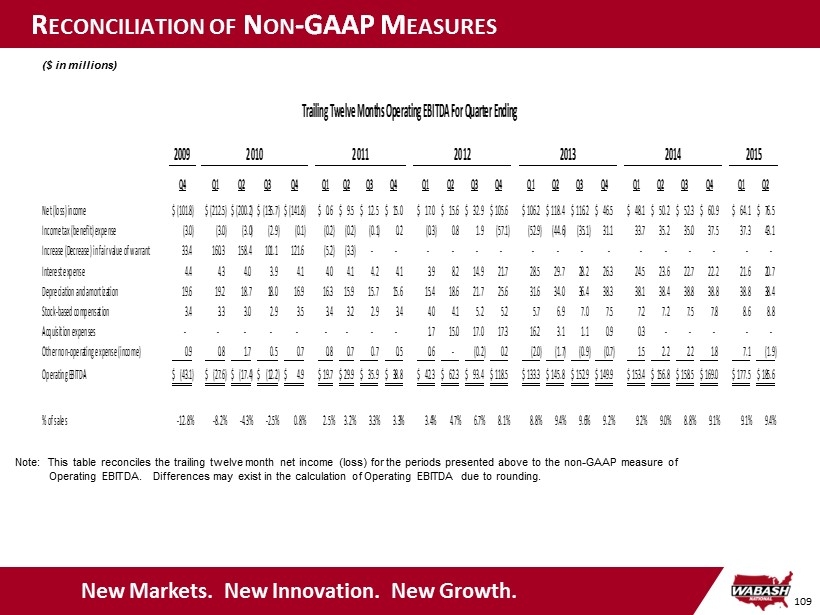
109 R ECONCILIATION OF N ON - GAAP M EASURES ($ in millions) Note: This table reconciles the trailing twelve month net income (loss) for the periods presented above to the non - GAAP measure of Operating EBITDA. Differences may exist in the calculation of Operating EBITDA due to rounding. New Markets. New Innovation. New Growth. Q4 Q1 Q2 Q3 Q4 Q1 Q2 Q3 Q4 Q1 Q2 Q3 Q4 Q1 Q2 Q3 Q4 Q1 Q2 Q3 Q4 Q1 Q2 Net (loss) income (101.8)$ (212.5)$ (200.2)$ (135.7)$ (141.8)$ 0.6$ 9.5$ 12.5$ 15.0$ 17.0$ 15.6$ 32.9$ 105.6$ 106.2$ 118.4$ 116.2$ 46.5$ 48.1$ 50.2$ 52.3$ 60.9$ 64.1$ 76.5$ Income tax (benefit) expense (3.0) (3.0) (3.0) (2.9) (0.1) (0.2) (0.2) (0.1) 0.2 (0.3) 0.8 1.9 (57.1) (52.9) (44.6) (35.1) 31.1 33.7 35.2 35.0 37.5 37.3 43.1 Increase (Decrease) in fair value of warrant 33.4 160.3 158.4 101.1 121.6 (5.2) (3.3) - - - - - - - - - - - - - - - - Interest expense 4.4 4.3 4.0 3.9 4.1 4.0 4.1 4.2 4.1 3.9 8.2 14.9 21.7 28.5 29.7 28.2 26.3 24.5 23.6 22.7 22.2 21.6 20.7 Depreciation and amortization 19.6 19.2 18.7 18.0 16.9 16.3 15.9 15.7 15.6 15.4 18.6 21.7 25.6 31.6 34.0 36.4 38.3 38.1 38.4 38.8 38.8 38.8 38.4 Stock-based compensation 3.4 3.3 3.0 2.9 3.5 3.4 3.2 2.9 3.4 4.0 4.1 5.2 5.2 5.7 6.9 7.0 7.5 7.2 7.2 7.5 7.8 8.6 8.8 Acquisition expenses - - - - - - - - - 1.7 15.0 17.0 17.3 16.2 3.1 1.1 0.9 0.3 - - - - - Other non-operating expense (income) 0.9 0.8 1.7 0.5 0.7 0.8 0.7 0.7 0.5 0.6 - (0.2) 0.2 (2.0) (1.7) (0.9) (0.7) 1.5 2.2 2.2 1.8 7.1 (1.9) Operating EBITDA (43.1)$ (27.6)$ (17.4)$ (12.2)$ 4.9$ 19.7$ 29.9$ 35.9$ 38.8$ 42.3$ 62.3$ 93.4$ 118.5$ 133.3$ 145.8$ 152.9$ 149.9$ 153.4$ 156.8$ 158.5$ 169.0$ 177.5$ 185.6$ % of sales -12.8% -8.2% -4.3% -2.5% 0.8% 2.5% 3.2% 3.3% 3.3% 3.4% 4.7% 6.7% 8.1% 8.8% 9.4% 9.6% 9.2% 9.2% 9.0% 8.8% 9.1% 9.1% 9.4% Trailing Twelve Months Operating EBITDA For Quarter Ending 201520142009 2010 2011 2012 2013

110 R ECONCILIATION OF N ON - GAAP M EASURES Note: This table reconciles annual net income for the periods presented to the non - GAAP measure of adjusted earnings and adjust ed earnings per share. Differences may exist in the calculation of adjusted earnings per share due to rounding. $ Per Share $ Per Share $ Per Share $ Per Share Net income 15,042$ 0.22$ 105,631$ 1.54$ 46,529$ 0.67$ 60,930$ 0.86$ Income tax benefit, net - - (58,991) (0.86) - - - - Loss on debt extinguishment, net of taxes 668 0.01 - - 1,132 0.02 645 0.01 Impact of acquired profit in inventories and short term intangible amortization - - 3,800 0.06 - - - - Revaluation of net deferred income tax assets due to changes in statutory tax rates - - - - - - 1,041 0.01 Acquisition expenses, net of taxes - - 14,409 0.21 529 0.01 - - Loss on transitioning Retail branch locations, net of tax - - - - - - 376 0.01 Adjusted Earnings and Adjusted Earnings Per Share 15,710$ 0.23$ 64,849$ 0.95$ 48,190$ 0.70$ 62,992$ 0.89$ WA shares outstanding 68,418 68,564 69,081 71,063 2011 2012 2013 2014 Twelve Months Ended December 31,

111 Hypothetical Quarterly Average Share Price (NYSE: WNC) (1) Potential Incremental Shares for Diluted EPS (in 000s shares) (2) 11.50$ - 12.00$ 316 12.50$ 816 13.00$ 1,277 13.50$ 1,704 14.00$ 2,101 14.50$ 2,471 15.00$ 2,816 15.50$ 3,138 16.00$ 3,441 16.50$ 3,725 17.00$ 3,992 17.50$ 4,244 18.00$ 4,482 18.50$ 4,707 19.00$ 4,921 19.50$ 5,123 20.00$ 5,316 20.50$ 5,499 21.00$ 5,673 21.50$ 5,839 22.00$ 5,997 22.50$ 6,149 23.00$ 6,294 23.50$ 6,433 24.00$ 6,566 P OTENTIAL D ILUTIVE I MPACT OF S ENIOR C ONVERTIBLE N OTES (UNAUDITED) Table below illustrates the potential dilutive shares that would be included in the calculation of the Company’s reported earnings per share in a future period assuming various hypothetical quarterly average market prices for the Company’s stock (NYSE: WNC). The table should only be considered for illustrative purposes and does not represent the Company’s estimates for future stock performances. Notes: (1) The share prices listed in this table are for illustrative purposes only. Dilution will continue beyond $24.00 per share. (2) This represents the number of shares to be used for calculating diluted earnings per share in accordance with generally accepted accounting principals. Background Information: » In April 2012, the Company issued Convertible Senior Notes due 2018 with a principal amount of $150 million principal and bear interest at a rate of 3.375% annually » Initial conversion rate of 85.4372 shares of common stock per $1,000 in principal amount which is equal to a conversion price of approximately $11.70 per share » The Senior Notes will have a dilutive effect on earnings per share to extent average quarterly share price exceeds the conversion price » The Company’s intent is to settle conversions through a net share settlement which involves repayment of cash for the principal amount and delivery of shares of common stock for any excess of conversion value over principal amount