United States
Securities and Exchange Commission
Washington, D.C. 20549
Form N-CSR
Certified Shareholder Report of Registered Management Investment Companies
811-6447
(Investment Company Act File Number)
Federated Fixed Income Securities, Inc.
(Exact Name of Registrant as Specified in Charter)
Federated Investors Funds
4000 Ericsson Drive
Warrendale, Pennsylvania 15086-7561
(Address of Principal Executive Offices)
(412) 288-1900
(Registrant's Telephone Number)
John W. McGonigle, Esquire
Federated Investors Tower
1001 Liberty Avenue
Pittsburgh, Pennsylvania 15222-3779
(Name and Address of Agent for Service)
(Notices should be sent to the Agent for Service)
Date of Fiscal Year End: 09/30/2010
Date of Reporting Period: 09/30/2010
Item 1. Reports to Stockholders
Federated Municipal Ultrashort FundEstablished 2000
A Portfolio of Federated Fixed Income Securities, Inc.
ANNUAL SHAREHOLDER REPORTSeptember 30, 2010
Class A Shares
FINANCIAL HIGHLIGHTS
SHAREHOLDER EXPENSE EXAMPLE
MANAGEMENT'S DISCUSSION OF FUND PERFORMANCE
PORTFOLIO OF INVESTMENTS SUMMARY TABLE
PORTFOLIO OF INVESTMENTS
STATEMENT OF ASSETS AND LIABILITIES
STATEMENT OF OPERATIONS
STATEMENT OF CHANGES IN NET ASSETS
NOTES TO FINANCIAL STATEMENTS
REPORT OF INDEPENDENT REGISTERED PUBLIC ACCOUNTING FIRM
BOARD OF DIRECTORS AND CORPORATION OFFICERS
EVALUATION AND APPROVAL OF ADVISORY CONTRACT
VOTING PROXIES ON FUND PORTFOLIO SECURITIES
QUARTERLY PORTFOLIO SCHEDULE
Financial Highlights - Class A Shares
(For a Share Outstanding Throughout Each Period)
| Year Ended September 30 | 20101 | 2009 | 2008 | 2007 | 2006 |
| Net Asset Value, Beginning of Period | $10.02 | $9.92 | $10.02 | $10.05 | $10.05 |
| Income From Investment Operations: | | | | | |
| Net investment income | 0.06 | 0.21 | 0.33 | 0.33 | 0.29 |
| Net realized and unrealized gain (loss) on investments | 0.02 | 0.10 | (0.11) | (0.03) | (0.00)2 |
| TOTAL FROM INVESTMENT OPERATIONS | 0.08 | 0.31 | 0.22 | 0.30 | 0.29 |
| Less Distributions: | | | | | |
| Distributions from net investment income | (0.06) | (0.21) | (0.32) | (0.33) | (0.29) |
| Net Asset Value, End of Period | $10.04 | $10.02 | $9.92 | $10.02 | $10.05 |
| Total Return3 | 0.81% | 3.21% | 2.27% | 3.01% | 2.89% |
| Ratios to Average Net Assets: | | | | | |
| Net expenses | 0.80% | 0.80%4 | 0.80%4 | 0.80% | 0.80% |
| Net investment income | 0.61% | 1.77% | 3.12% | 3.26% | 2.76% |
| Expense waiver/reimbursement5 | 0.42% | 0.44% | 0.45% | 0.50% | 0.49% |
| Supplemental Data: | | | | | |
| Net assets, end of period (000 omitted) | $1,982,542 | $2,543,523 | $566,536 | $67,502 | $81,366 |
| Portfolio turnover | 37% | 44% | 123% | 52% | 46% |
| 1 | Beginning with the year ended September 30, 2010, the Fund was audited by KPMG LLP. The previous years were audited by another independent registered public accounting firm. |
| 2 | Represents less than $0.01. |
| 3 | Based on net asset value, which does not reflect the sales charge, redemption fee or contingent deferred sales charge, if applicable. |
| 4 | The net expense ratio is calculated without reduction for expense offset arrangements. The net expense ratios are 0.80% and 0.80% for the years ended September 30, 2009 and 2008, respectively, after taking into account these expense reductions. |
| 5 | This expense decrease is reflected in both the net expense and the net investment income ratios shown above. |
See Notes which are an integral part of the Financial Statements
Annual Shareholder Report1
Shareholder Expense Example (unaudited)
As a shareholder of the Fund, you incur two types of costs: (1) transaction costs, including sales charges (loads) on purchase or redemption payments; and (2) ongoing costs, including management fees and to the extent applicable, distribution (12b-1) fees and/or shareholder services fees and other Fund expenses. This Example is intended to help you to understand your ongoing costs (in dollars) of investing in the Fund and to compare these costs with the ongoing costs of investing in other mutual funds. It is based on an investment of $1,000 invested at the beginning of the period and held for the entire period from April 1, 2010 to September 30, 2010.
ACTUAL EXPENSES
The first section of the table below provides information about actual account values and actual expenses. You may use the information in this section, together with the amount you invested, to estimate the expenses that you incurred over the period. Simply divide your account value by $1,000 (for example, an $8,600 account value divided by $1,000 = 8.6), then multiply the result by the number in the first section under the heading entitled “Expenses Paid During Period” to estimate the expenses attributable to your investment during this period.
HYPOTHETICAL EXAMPLE FOR COMPARISON PURPOSES
The second section of the table below provides information about hypothetical account values and hypothetical expenses based on the Fund's actual expense ratio and an assumed rate of return of 5% per year before expenses, which is not the Fund's actual return. Thus, you should not use the hypothetical account values and expenses to estimate the actual ending account balance or your expenses for the period. Rather, these figures are required to be provided to enable you to compare the ongoing costs of investing in the Fund with other funds. To do so, compare this 5% hypothetical example with the 5% hypothetical examples that appear in the shareholder reports of the other funds.
Annual Shareholder Report2
Please note that the expenses shown in the table are meant to highlight your ongoing costs only and do not reflect any transaction costs, such as sales charges (loads) on purchase or redemption payments. Therefore, the second section of the table is useful in comparing ongoing costs only, and will not help you determine the relative total costs of owning different funds. In addition, if these transaction costs were included, your costs would have been higher. | Beginning
Account Value
4/1/2010 | Ending
Account Value
9/30/2010 | Expenses Paid
During Period1 |
| Actual | $1,000 | $1,004.20 | $4.02 |
Hypothetical (assuming a 5% return
before expenses) | $1,000 | $1,021.06 | $4.05 |
| 1 | Expenses are equal to the Fund's annualized net expense ratio of 0.80%, multiplied by the average account value over the period, multiplied by 183/365 (to reflect the one-half-year period). |
Annual Shareholder Report3
Performance data quoted represents past performance which is no guarantee of future results. Investment return and principal value will fluctuate so that an investor's shares, when redeemed, may be worth more or less than their original cost. Mutual fund performance changes over time and current performance may be lower or higher than what is stated. For current to the most recent month-end performance and after-tax returns, visit FederatedInvestors.com or call 1-800-341-7400.
Management's Discussion of Fund
Performance (unaudited)
The Fund's total return, based on net asset value, for the 12-month reporting period was 0.81% for the Fund's Class A Shares.1 The total return of the Barclays Capital 1-Year Municipal Bond Index (BC1MB)2 the Fund's benchmark, was 1.77% and the total return of the Lipper Tax-Exempt Money Market Funds Classification Average (LTEMMFCA)3 a performance benchmark for the Fund, was 0.03% during the same period. The Fund's total return for the most recently completed fiscal year reflected actual cashflows, transaction costs and other expenses that were not reflected in the total return of the BC1MB.
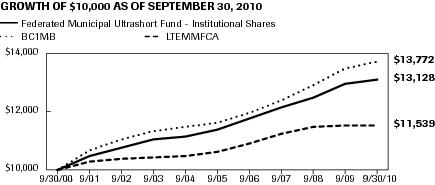
| 1 | The Fund offers another class of shares, Institutional Shares. The Fund's total return, based on net asset value, for the 12-month reporting period was 1.26% for the Institutional Shares. A separate Annual Shareholder Report has been prepared for the Fund's Institutional Shares and it is available free of charge by visiting FederatedInvestors.com or calling 1-800-341-7400. |
| 2 | The BC1MB is the one-year (1-2) component of the Barclays Capital Municipal Bond Index, an unmanaged market value-weighted index for the tax-exempt bond market. To be included in the index, bonds must have a minimum credit rating of Baa3 or BBB-, an outstanding par value of at least $7 million and be issued as part of a transaction of at least $75 million. The bonds must be fixed rate, have an issue date after December 31, 1990 and must be at least one but not more than two years from their maturity date. The BC1MB includes both zero coupon bonds and bonds subject to the alternative minimum tax. The BC1MB is not adjusted to reflect sales charges, expenses and other fees that the Securities and Exchange Commission (SEC) requires to be reflected in the Fund's performance. The Fund is not a money market fund and is not subject to the special regulatory requirements (including maturity and credit quality constraints) designed to enable money market funds to maintain a stable share price. The BC1MB is unmanaged and, unlike the Fund, is not affected by cashflows. It is not possible to invest directly in an index. |
| 3 | Lipper figures represent the average of the total returns reported by all the mutual funds designated by Lipper, Inc. as falling into the respective categories indicated. They do not reflect sales charges. |
Annual Shareholder Report4
During the reporting period, the Fund's investment strategy focused on: (a) the effective duration4 of its portfolio (which indicates the portfolio's price sensitivity to interest rates);5 (b) the selection of securities with different maturities (expressed by a yield curve showing the relative yield of securities with different maturities); (c) the allocation of the portfolio among securities of similar issuers (referred to as sectors); and (d) the credit quality and ratings of the portfolio securities (which indicates the risk that securities may default). These were the most significant factors affecting the Fund's performance relative to the BC1MB.The Fund's 0.81% total return for the reporting period consisted of 0.61% of tax-exempt dividend income and 0.20% of price appreciation as the net asset value of the Fund increased by two cents to $10.04 during the reporting period.6
MARKET OVERVIEW
During the first six months of the 12-month reporting period, incoming data suggested that economic growth was strengthening, that payroll reductions were slowing and that downside risks to economic growth were diminishing somewhat. Although economic recovery was continuing, employment growth was rather anemic relative to past recoveries from deep recessions mostly due to the effects of the financial crisis as well as institutional and consumer debt deleveraging. The housing sector initially showed signs of improvement but leveled out. Several factors continued to restrain the expansion in economic activity. The commercial real estate market continued to deteriorate, bank credit contracted further, and a concern remained about the economy's ability to generate a self-sustaining recovery without significant government support. However, financial market conditions showed signs of stabilizing as equity prices rose, credit spreads narrowed and markets in general functioned significantly better than in 2008. Substantial resource slack (or underutilized production capacity) continued to restrain longer-term inflation expectations, subduing inflation pressures.
| 4 | Duration is a measure of a security's price sensitivity to changes in interest rates. Securities with longer durations are more sensitive to changes in interest rates than securities with shorter durations. |
| 5 | Bond prices are sensitive to changes in interest rates and a rise in interest rates can cause a decline in their prices. |
| 6 | Income may be subject to the federal alternative minimum tax, as well as state and local taxes. |
Annual Shareholder Report5
However, in the final six months of the 12-month reporting period, housing starts once again returned to depressed levels. In addition, concerns regarding high sovereign indebtedness among certain Euro zone countries (i.e., European countries that have adopted the Euro as their sole legal tender) and signs of a deterioration in the U.S. economic recovery caused equities and Treasury yields to decline sharply during the spring and summer months while expectations of Federal Reserve Board (the “Fed”) tightening faded. To help support economic recovery, the Fed maintained its holdings of securities at the current levels by reinvesting principal payments from agency debt and mortgage-backed securities in longer term Treasury securities and rolling over its holdings of Treasury debt as it matured. The Fed maintained the range for the federal funds target rate between 0.0% and 0.25% during the entire reporting period and signaled that federal funds rates will likely remain at low levels for an extended period. The combined fiscal and monetary stimuli drove an impressive rebound in the valuation of risky assets. In the tax-exempt municipal market, yield ratios of two-year AAA-rated municipal yields to two-year Treasury note yields averaged 78% during the reporting period but reached a high of 115% at the end of the reporting period. Tax-exempt municipal credit spreads also declined significantly during the reporting period for mid quality A and BBB debt.This extensive normalization of the tax-exempt municipal market from the market disruptions in 2008 resulted from several positive technical factors. Significant federal financial support programs for state governments were put in place to stimulate local economies and boost confidence. The Build America Bonds program reduced the supply of tax-exempt municipal bonds issued helping to create a shortage of tax-exempt bonds available in the market. Ongoing strong demand for yield from investors as money market rates remained very low, the expectations of higher marginal tax rates and strong mutual fund flows led to solid demand for tax-exempt debt. These factors helped to create the supply and demand imbalance that enabled the tax-exempt municipal market to recover and provide positive returns during the period. However, the underlying credit fundamentals of state and local governmental entities showed continued deterioration in such credit factors as pension funding requirements, real estate values and revenue growth.
During the reporting period, the two-year Treasury note yield moved from 0.95% to 0.45%. The AAA-rated, two-year, tax-exempt municipal bond yield reacted with less daily volatility than the two-year Treasury note as yields moved from 0.75% to 0.49% during the period. The tax-exempt municipal yield curve remained positively sloped but flattened during the 12-month period with short-term interest rates (maturities less than three years) declining 10-30 basis points while intermediate term interest rates (maturities from 5-10 years) declined 40-50 basis points. A flattening of the yield curve means that as security maturity gets longer the incremental income from an increase in maturity decreases. Because of flattening, tax-exempt intermediate municipal bonds outperformed short-term Annual Shareholder Report6
bonds during the reporting period as the price impact per unit of duration was greater for intermediate-term bonds, and interest rates declined more for intermediate-term bonds than for short-term bonds. DURATION
Because the Fund is an ultrashort tax-exempt municipal bond fund and pursues a low volatility strategy, the Fund's typical dollar-weighted average duration has generally ranged from 0.5 to one year. As determined at the end of the 12-month reporting period, the Fund's dollar-weighted average duration was 0.75 years, and the Fund's average dollar-weighted average duration during the reporting period was approximately 0.70 years. The duration of the BC1MB (which contains only bonds with maturities from one to two years) was 1.41 years at the end of the reporting period. The shorter a fund's duration relative to an index, the less its net asset value will react as interest rates change.
Because the Fund has a structural duration range and prospectus limit that is always shorter than the duration of the BC1MB, when interest rates decline, the Fund's net asset value will benefit less than the BC1MB. The duration of the Fund relative to BC1MB detracted from Fund performance during the period, but helped the Fund relative to the LTEMMFCA.
MATURITY/YIELD CURVE
During the 12-month reporting period, the yield curve flattened and bonds with short-intermediate maturities (three to seven years) had more yield decline and better total return performance than those bonds with maturities from one to two years and zero to one year. Because the Fund attempts to pursue a low volatility ultra-short duration strategy, and in order to provide a high degree of liquidity, the Fund was managed with a concentration on maintaining a barbell structure consisting of: a) a 40% to 50% weighting in very short-term maturities such as tax-exempt 7-day municipal variable rate demand notes (MVRDNs), 7-day municipal floating rate notes and 7-day municipal auction rate securities (MARS) combined with; b) a 50% to 60% weighting in tax-exempt municipal bonds with maturities from zero to four years.
The BC1MB contains only bonds with maturities from one to two years and does not contain any bonds with less than one year remaining to maturity nor does it include any MVRDNs or MARS. The Fund's portfolio weighting in liquid MVRDNs and MARS of 40% to 50% slightly detracted from Fund performance relative to BC1MB, as these instruments slightly underperformed the positive price performance and total return of bonds contained in the BC1MB. Many of these instruments provided above-average tax-exempt income but none of the price gain of the fixed-rate bonds in the BC1MB.6 The Fund also had significant weightings in tax-exempt, municipal bonds maturing from one to two years and two to four years and this decision helped Fund performance.
Annual Shareholder Report7
SECTOR ALLOCATIONDuring the 12-month reporting period, as compared to the BC1MB, the Fund allocated more of its portfolio to (i.e., was overweight in) securities backed by hospitals, public power, electric and gas, industrial development/pollution control projects and transportation. Revenue debt generally outperformed general obligation debt during the period as states and local government budgets remained under pressure. The Fund allocated less of the portfolio to (i.e. was underweight in) general obligation bonds and pre-refunded bonds compared to the BC1MB. These allocations helped the Fund's performance due to narrowing of credit spreads within several of the overweight revenue sectors and the demand by investors for incremental yield during the reporting period. As the credit markets recovered, pre-refunded bonds lagged the overall BC1MB return, so the Fund's underweight allocation helped performance.
CREDIT QUALITY
With significant new cash inflows into the Fund, the overall credit quality and liquidity of the Fund remained high during the 12-month reporting period. Risk-aversion by investors subsided as the financial markets stabilized and a preference for yield resulted in the outperformance of bonds rated A and BBB relative to bonds rated in the higher rating categories. With the decrease in credit spreads during the reporting period and the narrowing of credit spreads to a greater extent for A and BBB-rated (or comparable quality) debt, the Fund's overweight, relative to the BC1MB, in A and BBB-rated fixed coupon debt or its non-rated equivalent during the reporting period helped the Fund's performance as the yield on A- and BBB-rated debt declined to a greater extent than for other investment-grade securities. For the variable rate portion of the portfolio, the Fund's income and total return was helped by significant weightings in MVRDNs with credit/liquidity enhancement from split-rated banks (A-2, P-2 and/or F-2 rated). Overall, the shift to a more constructive credit view by market participants helped the Fund's performance during the period.
Annual Shareholder Report8
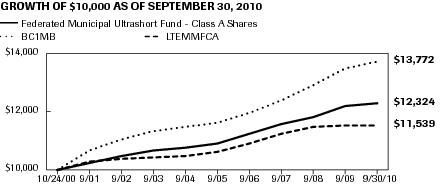
GROWTH OF A $10,000 INVESTMENT - Class a Shares
The graph below illustrates the hypothetical investment of $10,0001 in Federated Municipal Ultrashort Fund (Class A Shares) (the “Fund”) from October 24, 2000 (start of performance) to September 30, 2010, compared to the Barclays Capital 1-Year Municipal Bond Index (BC1MB)2 and the Lipper Tax-Exempt Money Market Funds Classification Average (LTEMMFCA).2
| Average Annual Total Returns3 for the Period Ended 9/30/2010 | |
| 1 Year | -1.16% |
| 5 Years | 2.01% |
| Start of Performance (10/24/2000) | 2.13% |
Performance data quoted represents past performance which is no guarantee of future results. Investment return and principal value will fluctuate so that an investor's shares, when redeemed, may be worth more or less than their original cost. Mutual fund performance changes over time and current performance may be lower or higher than what is stated. For current to the most recent month-end performance and after-tax returns, visit FederatedInvestors.com or call 1-800-341-7400. Returns shown do not reflect the deduction of taxes that a shareholder would pay on Fund distributions or the redemption of Fund shares. Mutual funds are not obligations of or guaranteed by any bank and are not federally insured. Total returns shown include the maximum sales charge of 2.00%.
Annual Shareholder Report9
1Represents a hypothetical investment of $10,000. Effective February 14, 2003, a maximum sales charge of 2.00% for newly purchased Class A Shares was implemented. The Fund's performance assumes the reinvestment of all dividends and distributions. The BC1MB and the LTEMMFCA have been adjusted to reflect reinvestment of dividends on securities in the index and the average.| 2 | The BC1MB is the one-year (1-2) component of the Barclays Capital Municipal Bond Index. The Barclays Capital Municipal Bond Index is an unmanaged index of tax-exempt municipal bonds issued after December 31, 1990, with a minimum credit rating of at least Baa3 or BBB-, which have been issued as part of a deal of at least $75 million, have a minimum maturity value of at least $7 million and mature in at least one, but not more than two years. The BC1MB also includes both zero coupon bonds and bonds subject to the alternative minimum tax (AMT). The BC1MB is not adjusted to reflect sales charges, expenses or other fees that the Securities and Exchange Commission requires to be reflected in the Fund's performance. The Fund is not a money market fund and is not subject to the special regulatory requirements (including maturity and credit quality constraints) designed to enable money market funds to maintain a stable share price. The BC1MB is unmanaged, and unlike the Fund, is not affected by cash flows. It is not possible to invest directly in the BC1MB. Lipper figures represent the average of the total returns reported by all the mutual funds designated by Lipper, Inc. as falling into the respective categories indicated. They do not reflect sales charges. |
| 3 | Total returns quoted reflect all applicable sales charges. |
Annual Shareholder Report10
Portfolio of Investments Summary Table (unaudited)
At September 30, 2010, the Fund's sector composition1 was as follows:
| Sector Composition | Percentage of
Total Net Assets |
| Hospital | 16.8% |
| General Obligation — Local | 15.2% |
| General Obligation — State | 14.3% |
| Industrial Development Bond/Pollution Control Revenue | 14.2% |
| Electric and Gas | 13.3% |
| Transportation | 5.3% |
| Public Power | 4.1% |
| Education | 3.6% |
| Special Tax | 2.9% |
| Multi-Family Housing | 2.0% |
| Other2 | 7.9% |
| Other Assets and Liabilities — Net3 | 0.4% |
| Total | 100.0% |
| 1 | Sector classifications, and the assignment of holdings to such sectors, are based upon the economic sector and/or revenue source of the underlying obligor, as determined by the Fund's Adviser. For securities that have been enhanced by a third party, including bond insurers and banks, sector classifications are based upon the economic sector and/or revenue source of the underlying obligor as determined by the Fund's Adviser. |
| 2 | For purposes of this table, sector classifications constitute 91.7% of the Fund's total net assets. Remaining sectors have been aggregated under the designation “Other.” |
| 3 | Assets, other than investments in securities, less liabilities. See Statement of Assets and Liabilities. |
Annual Shareholder Report11
Portfolio of Investments
September 30, 2010
Principal
Amount | | | Value |
| | MUNICIPAL BONDS – 62.5% | |
| | Alabama – 2.4% | |
| $2,035,000 | | Alabama Special Care Facilities Financing Authority of Birmingham, Revenue Bonds (Series 2005A), 5.00% (Ascension Health Subordinate Credit Group), 6/1/2012 | 2,166,461 |
| 1,510,000 | | Alabama Special Care Facilities Financing Authority of Birmingham, Revenue Bonds (Series 2005A), 5.00% (Ascension Health Subordinate Credit Group), 6/1/2012 | 1,600,811 |
| 2,500,000 | | Alabama State Public School & College Authority, Capital Improvement Refunding Bonds (Series 2009A), 5.00% (United States Treasury COL), 5/1/2012 | 2,674,475 |
| 6,000,000 | | Alabama State Public School & College Authority, Capital Improvement Refunding Bonds (Series 2009A), 5.00% (United States Treasury COL), 5/1/2013 | 6,646,440 |
| 3,920,000 | | Alabama State Public School & College Authority, Capital Improvement Refunding Bonds (Series 2009A), 5.00% (United States Treasury COL), 5/1/2014 | 4,464,998 |
| 4,095,000 | | Alabama State Public School & College Authority, Capital Improvement Refunding Bonds (Series 2009B), 5.00%, 5/1/2012 | 4,380,790 |
| 3,485,000 | | Alabama State Public School & College Authority, Capital Improvement Refunding Bonds (Series 2009B), 5.00%, 5/1/2013 | 3,860,474 |
| 2,025,000 | | Baldwin County, AL, (Series 2010), 3.00%, 1/1/2012 | 2,088,909 |
| 4,510,000 | | Birmingham, AL Water Works Board, Subordinate Water Revenue Bonds (Series 2009), 3.00%, 7/1/2011 | 4,572,148 |
| 3,515,000 | | Birmingham, AL Water Works Board, Subordinate Water Revenue Bonds (Series 2009), 3.00%, 7/1/2013 | 3,646,953 |
| 2,440,000 | | Birmingham, AL Water Works Board, Subordinate Water Revenue Bonds (Series 2009), 4.00%, 7/1/2012 | 2,549,214 |
| 24,750,000 | | Health Care Authority for Baptist Health, AL, Affiliate of UAB Health (Montgomery)/(Series B) ARS (Assured Guaranty Corp. INS), 0.800%, 10/1/2010 | 24,750,000 |
| 1,300,000 | | Huntsville, AL, UT GO Bonds (Series 2009A), 5.00%, 9/1/2011 | 1,355,809 |
| 1,500,000 | | Huntsville, AL, UT GO Bonds (Series 2009B), 3.00%, 9/1/2011 | 1,536,870 |
| 4,000,000 | | Mobile, AL IDB, PCRBs (Series 2007A), 4.75% TOBs (Alabama Power Co.), Mandatory Tender 3/19/2012 | 4,207,040 |
| 2,160,000 | | Tuscaloosa, AL, GO Warrants (Series 2010-B), 4.00%, 2/15/2012 | 2,261,866 |
| 2,250,000 | | Tuscaloosa, AL, GO Warrants (Series 2010-B), 4.00%, 2/15/2013 | 2,423,452 |
| | TOTAL | 75,186,710 |
| | Arizona – 1.2% | |
| 2,000,000 | | Arizona Health Facilities Authority, Revenue Bonds (Series 2008D), 5.00% (Banner Health), 1/1/2011 | 2,022,060 |
Annual Shareholder Report12
Principal
Amount | | | Value |
| $8,000,000 | | Arizona Health Facilities Authority, Variable Rate Health Facility Revenue Bonds (Series 2009E), 5.00% TOBs (Catholic Healthcare West), Mandatory Tender 7/2/2012 | 8,394,720 |
| 1,000,000 | | Arizona State, COP (Series 2010A), 5.00% (Assured Guaranty Corp. INS), 10/1/2012 | 1,078,640 |
| 5,000,000 | | Arizona State, COP (Series 2010A), 5.00% (Assured Guaranty Corp. INS), 10/1/2014 | 5,664,300 |
| 1,000,000 | | Arizona Transportation Board, Transportation Excise Tax Revenue Bonds (Series 2009), 5.00% (Maricopa County, AZ Regional Area Road Fund), 7/1/2011 | 1,035,150 |
| 1,840,000 | | Arizona Transportation Board, Transportation Excise Tax Revenue Bonds (Series 2009), 5.00% (Maricopa County, AZ Regional Area Road Fund), 7/1/2012 | 1,982,949 |
| 1,000,000 | | Arizona Water Infrastructure Finance Authority, Water Quality Revenue Bonds (Series 2009A), 4.00%, 10/1/2011 | 1,037,120 |
| 1,000,000 | | Arizona Water Infrastructure Finance Authority, Water Quality Revenue Bonds (Series 2009A), 4.00%, 10/1/2012 | 1,070,390 |
| 2,135,000 | | Arizona Water Infrastructure Finance Authority, Water Quality Refunding Revenue Bonds (Series 2009A), 4.00%, 10/1/2012 | 2,285,283 |
| 1,100,000 | | Arizona Water Infrastructure Finance Authority, Water Quality Refunding Revenue Bonds (Series 2009A), 4.00%, 10/1/2011 | 1,140,832 |
| 10,000,000 | | Coconino County, AZ Pollution Control Corp., PCRBs (Series 1994A), 3.625% TOBs (Arizona Public Service Co.), Mandatory Tender 7/13/2013 | 10,096,100 |
| 2,500,000 | | Maricopa County, AZ, IDA, Health Facility Revenue Bonds (Series 2009A), 5.00% (Catholic Healthcare West), 7/1/2012 | 2,648,950 |
| | TOTAL | 38,456,494 |
| | Arkansas – 0.6% | |
| 15,000,000 | | Arkansas State, Federal Highway Grant Anticipation & Tax Refunding Revenue Bonds (GO)(Series 2010), 4.00%, 8/1/2012 | 15,955,950 |
| 2,295,000 | | Beaver Water District of Benton and Washington Counties, AR, Refunding Revenue Bonds (Series 2010), 3.00%, 11/15/2013 | 2,434,765 |
| 775,000 | | Jefferson County, AR, PCR Refunding Bonds (Series 2006), 4.60% (Entergy Arkansas, Inc.), 10/1/2017 | 783,045 |
| | TOTAL | 19,173,760 |
| | California – 5.6% | |
| 10,900,000 | | California Educational Facilities Authority, Variable Rate Refunding Revenue Bonds (Series 2010B), 1.07% (Loyola Marymount University), 10/6/2010 | 10,900,000 |
| 1,000,000 | | California Health Facilities Financing Authority, 5.00% (Adventist Health System/West), 3/1/2011 | 1,013,860 |
| 1,500,000 | | California Health Facilities Financing Authority, 5.00% (Adventist Health System/West), 3/1/2012 | 1,568,175 |
Annual Shareholder Report13
Principal
Amount | | | Value |
| $880,000 | | California Health Facilities Financing Authority, INS Revenue Bonds (Series 2006), 4.25% (California-Nevada Methodist Homes)/(GTD by California Mortgage Insurance), 7/1/2011 | 881,936 |
| 7,000,000 | | California Health Facilities Financing Authority, Refunding Revenue Bonds, 3.45% TOBs (Stanford Hospital & Clinics), Mandatory Tender 6/15/2011 | 7,142,450 |
| 1,145,000 | | California Health Facilities Financing Authority, Revenue Bonds (Series 2008A), 5.00% (Sutter Health), 8/15/2011 | 1,183,255 |
| 2,650,000 | | California Health Facilities Financing Authority, Revenue Bonds (Series 2009B), 4.00% (St. Joseph Health System), 7/1/2012 | 2,777,810 |
| 3,865,000 | | California Health Facilities Financing Authority, Revenue Bonds (Series 2009B), 4.50% (St. Joseph Health System), 7/1/2013 | 4,175,360 |
| 3,800,000 | | California Health Facilities Financing Authority, Revenue Bonds (Series 2009B), 5.00% (St. Joseph Health System), 7/1/2014 | 4,236,316 |
| 6,000,000 | | California Health Facilities Financing Authority, Variable Rate Health Facility Revenue Bonds (Series 2009C), 5.00% TOBs (Catholic Healthcare West), Mandatory Tender 7/2/2012 | 6,337,680 |
| 11,290,000 | | California Health Facilities Financing Authority, Variable Rate Health Facility Revenue Bonds (Series 2009G), 5.00% TOBs (Catholic Healthcare West), Mandatory Tender 7/2/2012 | 11,925,401 |
| 10,000,000 | | California Health Facilities Financing Authority, Variable Rate Refunding Revenue Bonds (Series 2009C), 5.00% TOBs (St. Joseph Health System), Mandatory Tender 10/16/2014 | 11,181,400 |
| 6,500,000 | | California Infrastructure & Economic Development Bank, Refunding Revenue Bonds (Series 2007 A-4), 1.65% TOBs (J Paul Getty Trust), Mandatory Tender 4/1/2011 | 6,537,180 |
| 28,000,000 | | California Municipal Finance Authority, Revenue Bonds, 1.20% TOBs (Republic Services, Inc.), Mandatory Tender 10/1/2010 | 28,000,000 |
| 13,000,000 | | California Municipal Finance Authority, Revenue Bonds, 1.20% TOBs (Republic Services, Inc.), Mandatory Tender 10/1/2010 | 13,000,000 |
| 4,100,000 | | California PCFA, Solid Waste Disposal Refunding Revenue Bonds (Series 1998B), 1.75% TOBs (Waste Management, Inc.), Mandatory Tender 6/1/2011 | 4,108,364 |
| 30,000,000 | | California PCFA, Solid Waste Refunding Revenue Bonds (Series 2010A), 1.30% TOBs (Republic Services, Inc.), Optional Tender 11/1/2010 | 29,998,800 |
| 7,500,000 | | California State Department of Water Resources Power Supply Program, Power Supply Revenue Bonds (Series 2010L), 5.00%, 5/1/2012 | 8,021,325 |
| 1,000,000 | | California State, Economic Recovery Bonds (Series 2008A), 5.00% (California State Fiscal Recovery Fund), 1/1/2011 | 1,011,450 |
| 3,895,000 | | California State, Economic Recovery UT GO Bonds (Series 2004A), 5.25% (California State Fiscal Recovery Fund)/(United States Treasury COL), 1/1/2011 | 3,943,064 |
Annual Shareholder Report14
Principal
Amount | | | Value |
| $480,000 | | California State, Economic Recovery UT GO Bonds (Series 2004A), 5.25% (California State Fiscal Recovery Fund)/(National Public Finance Guarantee Corporation INS), 1/1/2011 | 485,798 |
| 2,625,000 | | California State, Refunding Economic Recovery Bonds (Series 2009B), 5.00% TOBs (California State Fiscal Recovery Fund), Mandatory Tender 7/1/2014 | 2,971,316 |
| 1,000,000 | | Golden State Tobacco Securitization Corp., CA, Tobacco Settlement Asset-Backed Bonds (Series 2007A-1), 5.00%, 6/1/2011 | 1,013,850 |
| 4,000,000 | | Long Beach CCD, CA, Bond Anticipation Notes (Series 2010A), 9.85%, 1/15/2013 | 4,787,640 |
| 4,200,000 | | San Bernardino County, CA Transportation Authority, Sales Tax Revenue Notes (Series 2009A), 4.00%, 5/1/2012 | 4,406,178 |
| 2,000,000 | | San Diego, CA Public Facilities Authority, Senior Sewer Refunding Revenue Bonds (Series 2009B), 5.00% (San Diego, CA Wastewater System), 5/15/2012 | 2,141,540 |
| 2,755,000 | | San Joaquin County, CA Transportation Authority, Measure K Senior Sales Tax Revenue Notes, (Series 2008), 5.00%, 4/1/2011 | 2,818,723 |
| | TOTAL | 176,568,871 |
| | Colorado – 1.1% | |
| 110,000 | | Beacon Point, CO Metropolitan District, Revenue Bonds (Series 2005B), 4.375% (Compass Bank, Birmingham LOC)/(Original Issue Yield: 4.50%), 12/1/2015 | 109,631 |
| 1,000,000 | | Colorado Health Facilities Authority, Revenue Bonds (Series 2008C-6), 3.95% TOBs (Catholic Health Initiatives), Mandatory Tender 11/10/2010 | 1,003,600 |
| 4,100,000 | | Colorado Health Facilities Authority, Revenue Bonds (Series 2009B), 5.00% TOBs (Catholic Health Initiatives), Mandatory Tender 11/11/2014 | 4,634,804 |
| 25,000,000 | | Colorado Health Facilities Authority, Revenue Bonds (Series 2009B), 5.00% TOBs (Catholic Health Initiatives), Mandatory Tender 11/8/2012 | 26,982,250 |
| 3,105,000 | | Colorado State Higher Education Capital Construction Lease Purchase Financing Program, COP (Series 2008), 5.00% (United States Treasury COL), 11/1/2010 | 3,116,954 |
| | TOTAL | 35,847,239 |
| | Connecticut – 0.4% | |
| 7,800,000 | | Connecticut Development Authority, PCR Revenue Bonds (Series 1996A), 1.40% TOBs (Connecticut Light & Power Co.), Mandatory Tender 4/1/2011 | 7,803,276 |
| 1,000,000 | | Connecticut State Development Authority, PCR Refunding Bonds (Series 1996), 5.75% TOBs (United Illuminating Co.), Mandatory Tender 2/1/2012 | 1,041,980 |
| 4,020,000 | | Connecticut State, Economic Recovery UT GO Notes, 5.00%, 1/1/2014 | 4,548,509 |
| | TOTAL | 13,393,765 |
Annual Shareholder Report15
Principal
Amount | | | Value |
| | Delaware – 0.1% | |
| $3,000,000 | | University of Delaware, Variable Rate Revenue Bonds (Series 2009A), 2.00% TOBs, Mandatory Tender 6/1/2011 | 3,021,090 |
| | District of Columbia – 0.6% | |
| 12,250,000 | | District of Columbia Income Tax Revenue, Income Tax Secured Refunding Revenue Bonds (Series 2010C), 0.45%, 12/1/2011 | 12,194,017 |
| 2,550,000 | | District of Columbia Revenue, University Refunding Revenue Bonds (Series 2009A), 5.00% (Georgetown University), 4/1/2012 | 2,688,516 |
| 3,000,000 | | District of Columbia Revenue, University Refunding Revenue Bonds (Series 2009A), 5.00% (Georgetown University), 4/1/2013 | 3,255,420 |
| 1,000,000 | | Washington Metropolitan Area Transit Authority, Gross Revenue Transit Bonds (Series 2009A), 5.00%, 7/1/2011 | 1,034,300 |
| | TOTAL | 19,172,253 |
| | Florida – 4.5% | |
| 5,800,000 | | Broward County, FL, UT GO Bonds, 5.00%, 1/1/2011 | 5,868,034 |
| 54,610 | 1 | Capital Trust Agency, FL, Housing Revenue Notes, 5.95% (Atlantic Housing Foundation Properties), 1/15/2039 | 21,841 |
| 60,000,000 | | Citizens Property Insurance Corp. FL, (Series A2), 2.00%, 4/21/2011 | 60,284,400 |
| 1,000,000 | | Florida State Board of Education Lottery, Revenue Bonds (Series 2010A), 5.00%, 7/1/2011 | 1,034,460 |
| 4,000,000 | | Florida State Board of Education Lottery, Refunding Revenue Bonds (Series 2010C), 2.00%, 7/1/2011 | 4,047,760 |
| 1,365,000 | | Florida State Board of Education Lottery, Refunding Revenue Bonds (Series 2010C), 3.00%, 7/1/2011 | 1,391,536 |
| 3,375,000 | | Florida State Board of Education, UT GO Capital Outlay Bonds (Series 2006E), 5.00%, 6/1/2011 | 3,476,655 |
| 2,410,000 | | Florida State Department of Environmental Protection, Refunding Revenue Bonds (Series 2008A), 5.00% (Assured Guaranty Corp. INS), 7/1/2011 | 2,490,422 |
| 6,105,000 | | Florida State Turnpike Authority, Refunding Turnpike Revenue Bonds (Series 2008A), 5.00%, 7/1/2011 | 6,311,593 |
| 2,275,000 | | JEA, FL Electric System, Electric System Subordinated Revenue Bonds (Series 2009B), 5.00%, 10/1/2011 | 2,373,098 |
| 5,000,000 | | JEA, FL Electric System, Subordinated Revenue Bonds (Series 2009D), 5.00%, 10/1/2011 | 5,215,600 |
| 7,000,000 | | JEA, FL Electric System, Subordinated Revenue Bonds (Series 2009D), 5.00%, 10/1/2012 | 7,573,790 |
| 12,000,000 | | Lakeland, FL Energy Systems, Variable Rate Energy System Refunding Bonds (Series 2009), 1.02%, 10/1/2012 | 11,967,480 |
| 5,000,000 | | Lakeland, FL Energy Systems, Variable Rate Energy System Refunding Bonds (Series 2009), 1.37%, 10/1/2014 | 4,948,450 |
| 6,400,000 | | Miami-Dade County, FL IDA, Solid Waste Disposal Revenue Bonds (Series 2004), 1.75% TOBs (Waste Management, Inc.), Mandatory Tender 6/1/2011 | 6,413,056 |
Annual Shareholder Report16
Principal
Amount | | | Value |
| $5,000,000 | | Miami-Dade County, FL IDA, Solid Waste Disposal Revenue Bonds (Series 2007), 1.80% TOBs (Waste Management, Inc.), Mandatory Tender 11/1/2010 | 4,999,800 |
| 2,000,000 | | Orange County, FL, Health Facilities Authority, Hospital Revenue Bonds (Series 2009), 5.00% (Orlando Health, Inc.), 10/1/2013 | 2,166,100 |
| 6,025,000 | | Pasco County, FL School Board, (Series B) ARS (AMBAC INS), 0.600%, 10/1/2010 | 6,025,000 |
| 7,475,000 | | St. Petersburg, FL HFA, (Series B) ARS (All Children's Hospital)/(AMBAC INS), 0.750%, 10/1/2010 | 7,475,000 |
| | TOTAL | 144,084,075 |
| | Georgia – 2.4% | |
| 2,250,000 | | Atlanta, GA Water & Wastewater, Revenue Bonds (Series 2009A), 4.00%, 11/1/2011 | 2,321,348 |
| 3,000,000 | | Atlanta, GA Water & Wastewater, Revenue Bonds (Series 2009A), 4.00%, 11/1/2012 | 3,171,570 |
| 4,100,000 | | Burke County, GA Development Authority, PCRBs (First Series 2008), 4.95% TOBs (Georgia Power Co.), Mandatory Tender 4/1/2011 | 4,181,221 |
| 2,100,000 | | Burke County, GA Development Authority, PCRBs (Series 2007E), 4.75% TOBs (Oglethorpe Power Corp.)/(National Public Finance Guarantee Corporation INS), Mandatory Tender 4/1/2011 | 2,139,501 |
| 4,000,000 | | Burke County, GA Development Authority, PCRBs (Series 1995), 2.30% TOBs (Georgia Power Co.), Mandatory Tender 4/1/2014 | 4,047,160 |
| 1,000,000 | | Cobb County, GA Development Authority, (Series A), 1.40% TOBs (Waste Management, Inc.), Mandatory Tender 10/3/2011 | 1,000,310 |
| 4,165,000 | | Decatur County-Bainbridge, GA IDA, Revenue Bonds, 4.55% TOBs (John B. Sanifilippo & Son)/(Bank of America N.A. LOC), Mandatory Tender 6/1/2011 | 4,237,263 |
| 8,000,000 | | East Point, GA, 3.00% TANs, 12/31/2010 | 8,029,920 |
| 2,850,000 | | Floyd County, GA School District, GO Sales Tax Bonds (Series 2009), 3.00% (GTD by Georgia State), 8/1/2011 | 2,911,247 |
| 2,500,000 | | Fulton County, GA Facilities Corp., COP (Series 2009), 3.00%, 11/1/2011 | 2,552,450 |
| 1,000,000 | | Georgia State Road and Tollway Authority, Federal Highway Grant Anticipation Revenue Bonds (Series 2009-A), 4.00%, 6/1/2011 | 1,024,400 |
| 4,000,000 | | Georgia State Road and Tollway Authority, Federal Highway Grant Anticipation Revenue Bonds (Series 2009-A), 5.00%, 6/1/2012 | 4,298,280 |
| 8,120,000 | | Georgia State, UT GO Bonds (Series 2003D), 5.25%, 12/1/2011 | 8,589,498 |
| 8,000,000 | | Georgia State, UT GO Bonds (Series 2006G), 5.00%, 10/1/2011 | 8,377,840 |
| 5,850,000 | | Gwinnett County, GA Water and Sewer Authority, Revenue Bonds, 5.00% (United States Treasury PRF 8/1/2012@100)/(Original Issue Yield: 5.10%), 8/1/2020 | 6,337,597 |
| 700,000 | | Medical Center Hospital Authority, GA, Refunding Revenue Bonds (Series 2007), 5.00% (Spring Harbor at Green Island), 7/1/2012 | 709,443 |
Annual Shareholder Report17
Principal
Amount | | | Value |
| $5,000,000 | | Monroe County, GA Development Authority, PCRBs (Series 1992A), 6.80% (Oglethorpe Power Corp.), 1/1/2011 | 5,062,750 |
| 2,000,000 | | Monroe County, GA Development Authority, PCRBs (First Series 1995), 4.50% TOBs (Georgia Power Co.), Mandatory Tender 4/1/2011 | 2,036,340 |
| 1,000,000 | | Private Colleges & Universities Facilities of GA, Revenue Bonds (Series 2008B), 5.00% (Emory University), 9/1/2011 | 1,043,090 |
| 1,500,000 | | Public Gas Partners, Inc., GA, Gas Project Revenue Bonds (Gas Supply Pool No. 1 Series 2009A), 5.00%, 10/1/2011 | 1,559,670 |
| 2,300,000 | | Public Gas Partners, Inc., GA, Gas Project Revenue Bonds (Gas Supply Pool No. 1 Series 2009A), 5.00%, 10/1/2012 | 2,473,719 |
| 1,400,000 | | Public Gas Partners, Inc., GA, Gas Project Revenue Bonds (Gas Supply Pool No. 1 Series 2009A), 5.00%, 10/1/2013 | 1,544,648 |
| | TOTAL | 77,649,265 |
| | Illinois – 3.4% | |
| 2,000,000 | | Chicago, IL Water Revenue, Second Lien Water Refunding Revenue Bonds (Series 2008), 5.00% (Assured Guaranty Municipal Corp. INS), 11/1/2011 | 2,093,620 |
| 8,825,000 | | Chicago, IL, Refunding UT GO Bonds (2005A), 5.00% (Assured Guaranty Municipal Corp. INS), 1/1/2013 | 9,574,154 |
| 3,500,000 | | Illinois Finance Authority — Solid Waste, 1.45% TOBs (Waste Management, Inc.), Mandatory Tender 10/3/2011 | 3,501,085 |
| 4,000,000 | | Illinois Finance Authority, Gas Supply Refunding Revenue Bonds (Series 2010), 2.125% TOBs (Peoples Gas Light & Coke Co.), Mandatory Tender 7/1/2014 | 4,035,320 |
| 10,000,000 | | Illinois Finance Authority, Revenue Bonds (Series 2010B), 3.00% (Art Institute of Chicago), 7/1/2013 | 10,163,200 |
| 5,130,000 | | Illinois Finance Authority, Revenue Bonds (Series 2010D), 2.00% (Advocate Health Care Network), 4/1/2011 | 5,153,854 |
| 4,530,000 | | Illinois State Sales Tax, Sales Tax Revenue Bonds (Junior Obligation Series June 2010), 5.00%, 6/15/2013 | 4,962,570 |
| 32,000,000 | | Illinois State, GO Certificates of July, 2010, 3.00% TRANs, 5/20/2011 | 32,341,120 |
| 3,650,000 | | Illinois State, GO Refunding Bonds (Series February 2010), 5.00%, 1/1/2012 | 3,798,592 |
| 4,010,000 | | Illinois State, GO Refunding Bonds (Series February 2010), 5.00%, 1/1/2013 | 4,290,098 |
| 16,000,000 | | Illinois State, UT GO, 3.00% TRANs, 4/15/2011 | 16,136,800 |
| 12,600,000 | | Will & Kendall Counties, IL Community Consolidated School District No. 202, 2.00%, 1/1/2011 | 12,621,672 |
| | TOTAL | 108,672,085 |
| | Indiana – 0.3% | |
| 2,750,000 | | Indiana Health Facility Financing Authority, Revenue Bonds (Series 2005A-4), 5.00% (Ascension Health Subordinate Credit Group), 6/1/2012 | 2,901,250 |
Annual Shareholder Report18
Principal
Amount | | | Value |
| $1,000,000 | | Indiana State Finance Authority, Hospital Revenue Bonds (Series 2009A), 5.00% (Parkview Health System Obligated Group), 5/1/2011 | 1,021,640 |
| 2,000,000 | | Indiana State Finance Authority, Hospital Revenue Bonds (Series 2009A), 5.00% (Parkview Health System Obligated Group), 5/1/2012 | 2,106,480 |
| 1,000,000 | | Purdue University, IN, Student Fee Bonds (Series 2010Y), 2.00%, 7/1/2011 | 1,012,700 |
| 1,500,000 | | St. Joseph County, IN, Variable Rate Educational Facilities Revenue Bonds (Series 2005), 3.875% TOBs (University of Notre Dame), Mandatory Tender 3/1/2012 | 1,552,785 |
| | TOTAL | 8,594,855 |
| | Iowa – 0.5% | |
| 1,500,000 | | Iowa Finance Authority, Variable Rate Demand Health Facilities Revenue Bonds (Series 2005A), 5.00% (Iowa Health System)/(Assured Guaranty Corp. INS), 2/15/2012 | 1,577,265 |
| 5,000,000 | | Iowa Finance Authority, Variable Rate Demand Health Facilities Revenue Bonds (Series 2009F), 5.00% TOBs (Iowa Health System), Mandatory Tender 8/15/2012 | 5,355,800 |
| 7,050,000 | | Tobacco Settlement Authority, IA, Tobacco Settlement Asset-Backed Revenue Bonds (Series 2001B), 5.60% (United States Treasury PRF 6/1/2011@101)/(Original Issue Yield: 5.75%), 6/1/2035 | 7,364,289 |
| | TOTAL | 14,297,354 |
| | Kansas – 0.2% | |
| 450,000 | | Kansas State Development Finance Authority, Hospital Revenue Bonds (Series 2009D), 3.00% (Adventist Health System/Sunbelt Obligated Group), 11/15/2011 | 461,889 |
| 180,000 | | Kansas State Development Finance Authority, Hospital Revenue Bonds (Series 2009D), 3.50% (Adventist Health System/Sunbelt Obligated Group), 11/15/2012 | 188,923 |
| 200,000 | | Kansas State Development Finance Authority, Hospital Revenue Bonds (Series 2009D), 5.00% (Adventist Health System/Sunbelt Obligated Group), 11/15/2013 | 223,010 |
| 520,000 | | Wichita, KS, Hospital Facilities Refunding & Improvement Revenue Bonds (Series IIIA-2009), 2.00% (Via Christi Health System, Inc.), 11/15/2010 | 520,613 |
| 500,000 | | Wichita, KS, Hospital Facilities Refunding & Improvement Revenue Bonds (Series IIIA-2009), 3.00% (Via Christi Health System, Inc.), 11/15/2011 | 509,965 |
| 1,000,000 | | Wichita, KS, Hospital Facilities Refunding & Improvement Revenue Bonds (Series IIIA-2009), 4.50% (Via Christi Health System, Inc.), 11/15/2012 | 1,062,020 |
Annual Shareholder Report19
Principal
Amount | | | Value |
| $2,000,000 | | Wichita, KS, Hospital Facilities Refunding & Improvement Revenue Bonds (Series IIIA-2009), 5.00% (Via Christi Health System, Inc.), 11/15/2013 | 2,188,160 |
| | TOTAL | 5,154,580 |
| | Kentucky – 0.8% | |
| 1,000,000 | | Kentucky EDFA, Hospital Revenue Bonds (Series 2009A), 5.00% (Baptist Healthcare System), 8/15/2011 | 1,036,580 |
| 4,465,000 | | Louisville & Jefferson County, KY Metropolitan Sewer District, 5.00%, 5/15/2011 | 4,587,966 |
| 4,685,000 | | Louisville & Jefferson County, KY Metropolitan Sewer District, 5.00%, 5/15/2012 | 5,001,519 |
| 15,000,000 | | Owensboro, KY, GO BANs (Series 2009), 3.25%, 7/1/2012 | 15,165,000 |
| | TOTAL | 25,791,065 |
| | Louisiana – 0.6% | |
| 15,000,000 | | Louisiana State Gas & Fuels, Tax Second Lien Revenue Bonds (Series 2009A-1), 1.02%, 5/1/2043 | 14,992,500 |
| 3,250,000 | | Louisiana State Offshore Terminal Authority, Deepwater Port Revenue Bonds (Series 2007B-1A), 1.60% TOBs (Loop LLC), Mandatory Tender 10/1/2012 | 3,250,943 |
| | TOTAL | 18,243,443 |
| | Maryland – 0.3% | |
| 1,000,000 | | Maryland State Health & Higher Educational Facilities Authority, Revenue Bonds (Series 2008B), 5.00% TOBs (Johns Hopkins Hospital), Mandatory Tender 11/15/2011 | 1,042,360 |
| 2,955,000 | | Maryland State, UT GO Bonds (First Series 2006A), 5.00%, 3/1/2013 | 3,270,151 |
| 5,000,000 | | Maryland State, UT GO Bonds (Second Series 2008), 5.00%, 7/15/2011 | 5,186,800 |
| | TOTAL | 9,499,311 |
| | Massachusetts – 5.4% | |
| 10,600,000 | | Cape Cod, MA Regional Transportation Authority, 1.75% RANs, 7/29/2011 | 10,627,666 |
| 4,000,000 | | Commonwealth of Massachusetts, LT GO Construction Loan Bonds (Series C), 5.50% (Assured Guaranty Municipal Corp. INS), 11/1/2011 | 4,224,760 |
| 16,000,000 | | Commonwealth of Massachusetts, Refunding GO Bonds (SIFMA Index Bonds)/(Series 2010A), 0.65%, 2/1/2013 | 15,905,760 |
| 12,000,000 | | Commonwealth of Massachusetts, Refunding GO Bonds (SIFMA Index Bonds)/(Series 2010A), 0.51%, 2/1/2012 | 11,976,600 |
| 3,750,000 | | Commonwealth of Massachusetts, Refunding GO Bonds (SIFMA Index Bonds)/(Series 2010A), 0.80%, 2/1/2014 | 3,726,000 |
| 5,100,000 | | Greater Attleboro-Taunton, MA Regional Transportation Authority, 2.00% RANs, 8/19/2011 | 5,136,414 |
| 6,000,000 | | Massachusetts Department of Transportation, Metropolitan Highway System Revenue Bonds (Series 2010B), 5.00%, 1/1/2013 | 6,531,780 |
Annual Shareholder Report20
Principal
Amount | | | Value |
| $10,405,000 | | Massachusetts HEFA, (Series 2005F) ARS (Partners Healthcare Systems)/(Assured Guaranty Municipal Corp. INS), 0.340%, 10/1/2010 | 10,405,000 |
| 17,880,000 | | Massachusetts HEFA, (Series 2007G-2) ARS (Partners Healthcare Systems)/(Assured Guaranty Municipal Corp. INS), 0.500%, 10/7/2010 | 17,880,000 |
| 1,000,000 | | Massachusetts HEFA, Revenue Bonds (Series 2008 T-2), 4.10% TOBs (Northeastern University), Mandatory Tender 4/19/2012 | 1,041,670 |
| 1,370,000 | | Massachusetts HEFA, Revenue Bonds (Series 2008R), 5.00% (Northeastern University), 10/1/2010 | 1,370,164 |
| 1,465,000 | | Massachusetts HEFA, Revenue Bonds (Series 2008R), 5.00% (Northeastern University), 10/1/2011 | 1,524,670 |
| 1,000,000 | | Massachusetts HEFA, Revenue Bonds (Series 2008R), 5.00% (Northeastern University), 10/1/2012 | 1,074,360 |
| 3,250,000 | | Massachusetts HEFA, Revenue Bonds (Series 2008T-1), 4.125% TOBs (Northeastern University), Mandatory Tender 2/16/2012 | 3,353,090 |
| 2,000,000 | | Massachusetts State Development Finance Agency, Resource Recovery Revenue Bonds (Series 1999B), 3.40% TOBs (Waste Management, Inc.), Mandatory Tender 12/1/2012 | 2,032,940 |
| 6,945,000 | | Massachusetts State HFA, (Series 2009-B), 2.50%, 2/1/2011 | 6,992,851 |
| 10,500,000 | | Massachusetts State HFA, Construction Loan Notes (Series 2009D), 4.00%, 9/1/2011 | 10,793,685 |
| 9,000,000 | | Massachusetts State HFA, Construction Loan Notes (Series 2009D), 5.00%, 9/1/2012 | 9,585,900 |
| 6,500,000 | | Montachusett, MA Regional Transit Authority, 2.00% RANs, 8/12/2011 | 6,542,705 |
| 25,000,000 | | Pioneer Valley, MA Transit Authority, 2.00% RANs, 7/29/2011 | 25,157,750 |
| 6,575,000 | | Southeastern Massachusetts Regional Transportation Authority, 1.75% RANs, 9/2/2011 | 6,608,730 |
| 10,000,000 | | Wachesett, MA Regional School District, 1.50% RANs, 6/30/2011 | 10,037,000 |
| | TOTAL | 172,529,495 |
| | Michigan – 1.3% | |
| 9,500,000 | | Michigan State Hospital Finance Authority, Revenue Bonds (Series 1999 B-4), 3.75% TOBs (Ascension Health Credit Group), Mandatory Tender 3/15/2012 | 9,910,400 |
| 2,000,000 | | Michigan State Hospital Finance Authority, Revenue Bonds (Series 2010B), 5.00% (Ascension Health Credit Group), 11/15/2015 | 2,303,480 |
| 6,665,000 | | Michigan State Hospital Finance Authority, Variable Rate Revenue Bonds (Series 1999B-3), 2.00% TOBs (Ascension Health Credit Group), Mandatory Tender 8/1/2014 | 6,724,052 |
| 8,250,000 | | Michigan State Strategic Fund, Revenue Bonds, 3.20% TOBs (Waste Management, Inc.), Mandatory Tender 8/1/2013 | 8,276,482 |
| 14,770,000 | | Michigan Strategic Fund, Variable Rate LO Refunding Revenue Bonds (Series 2009CT), 3.05% TOBs (Detroit Edison Co.), Mandatory Tender 12/3/2012 | 15,133,490 |
| | TOTAL | 42,347,904 |
Annual Shareholder Report21
Principal
Amount | | | Value |
| | Minnesota – 1.0% | |
| $12,000,000 | | Bemidji, MN, Temporary Sales Tax UT GO Bonds, 4.50%, 2/1/2012 | 12,153,240 |
| 2,040,000 | | Chaska, MN ISD No.112, UT GO Bonds, 3.00% (GTD by Minnesota State), 2/1/2011 | 2,058,809 |
| 2,485,000 | | Chaska, MN ISD No.112, UT GO Bonds, 3.00% (GTD by Minnesota State), 2/1/2012 | 2,570,260 |
| 2,965,000 | | Chaska, MN ISD No.112, UT GO Bonds, 3.50% (GTD by Minnesota State), 2/1/2013 | 3,166,027 |
| 3,020,000 | | Chaska, MN ISD No.112, UT GO Bonds, 3.50% (GTD by Minnesota State), 2/1/2014 | 3,284,854 |
| 3,000,000 | | Columbia Heights, MN ISD No. 013, (Series A), 2.00% TANs (GTD by Minnesota State), 8/8/2011 | 3,037,230 |
| 1,000,000 | | Minnesota Agricultural and Economic Development Board, Health Care Facilities Revenue Bonds (Series 2008), 4.00% (Essentia Health Obligated Group)/(Assured Guaranty Corp. INS), 2/15/2012 | 1,038,200 |
| 2,900,000 | | Minnesota State, UT GO Highway Bonds, 3.00%, 12/1/2011 | 2,990,886 |
| 2,500,000 | | Stillwater, MN ISD No. 834, UT GO Bonds, 4.00% (GTD by Minnesota State), 2/1/2011 | 2,531,200 |
| | TOTAL | 32,830,706 |
| | Mississippi – 0.5% | |
| 3,240,000 | | Mississippi Development Bank, Marshall County Correctional Facility Refunding Bonds (Series 2008C), 5.00% (Mississippi State Department of Corrections)/(United States Treasury PRF), 8/1/2012 | 3,505,680 |
| 1,200,000 | | Mississippi Development Bank, Wilkinson County Correctional Facility Refunding Bonds (Series 2008D), 5.00% (Mississippi State Department of Corrections)/(United States Treasury COL), 8/1/2012 | 1,298,400 |
| 10,000,000 | | Mississippi State, Refunding UT GO Bonds, 5.50%, 9/1/2012 | 10,947,000 |
| | TOTAL | 15,751,080 |
| | Missouri – 0.2% | |
| 4,000,000 | | Kirkwood, MO IDA, Tax-Exempt Mandatory Paydown Securities-50 (Series 2010C-3), 6.50% (Aberdeen Heights Project), 5/15/2015 | 4,023,560 |
| 1,665,000 | | Missouri State Environmental Improvement & Energy Resources Authority, PCR Refunding Bonds (Series 2008), 4.375% TOBs (Associated Electric Cooperative, Inc.), Mandatory Tender 3/1/2011 | 1,688,660 |
| | TOTAL | 5,712,220 |
| | Nebraska – 0.1% | |
| 1,170,000 | | Nebraska Public Power District, General Revenue Bonds (Series 2008B), 5.00%, 1/1/2012 | 1,231,565 |
| 1,750,000 | | Omaha, NE, UT GO Bonds, 4.00%, 10/15/2011 | 1,817,235 |
| 1,250,000 | | Omaha, NE, UT GO Bonds, 5.00%, 10/15/2010 | 1,252,463 |
| | TOTAL | 4,301,263 |
Annual Shareholder Report22
Principal
Amount | | | Value |
| | Nevada – 0.2% | |
| $2,350,000 | | Clark County, NV, IDRBs (Series 2003C), 5.45% TOBs (Southwest Gas Corp.), Mandatory Tender 3/1/2013 | 2,466,208 |
| 720,000 | | Clark County, NV, Special Assessment Revenue Bonds (Series 2005), 4.20% (Summerlin-Mesa SID No. 151), 8/1/2011 | 708,674 |
| 1,475,000 | | Henderson, NV, LID No. T-16 LT Obligation Improvement Bonds, 4.50% (Falls at Lake Las Vegas LID No. T-16), 3/1/2011 | 1,437,358 |
| | TOTAL | 4,612,240 |
| | New Hampshire – 0.2% | |
| 5,000,000 | | New Hampshire Business Finance Authority, PCR Refunding Bonds (Series 2010A), 4.50% TOBs (United Illuminating Co.), Mandatory Tender 7/1/2015 | 5,232,550 |
| | New Jersey – 2.8% | |
| 2,250,000 | | Atlantic County Utilities Authority, NJ, Sewer Refunding Revenue Bonds (Series 2009), 4.00% (Assured Guaranty Corp. INS), 1/15/2011 | 2,271,015 |
| 1,500,000 | | Atlantic County Utilities Authority, NJ, Sewer Refunding Revenue Bonds (Series 2009), 5.00% (Assured Guaranty Corp. INS), 1/15/2012 | 1,577,130 |
| 4,625,000 | | Gloucester County, NJ Improvement Authority, Resource Recovery Refunding Revenue Bonds (Series 1999A), 2.625% TOBs (Waste Management, Inc.), Mandatory Tender 12/3/2012 | 4,674,811 |
| 1,000,000 | | Gloucester County, NJ Improvement Authority, Resource Recovery Refunding Revenue Bonds (Series 1999A), 3.375% TOBs (Waste Management, Inc.), Mandatory Tender 12/3/2012 | 1,015,940 |
| 8,000,000 | | Jersey City, NJ, (Series 2010C), 1.75% BANs, 11/30/2010 | 8,004,400 |
| 9,000,000 | | New Brunswick, NJ Parking Authority, Subordinate Project Notes GTD by City of New Brunswick, NJ (Series 2010), 2.00% BANs, 3/1/2011 | 9,030,240 |
| 22,000,000 | | New Brunswick, NJ Parking Authority, Subordinate Project Notes GTD by City of New Brunswick, NJ, 3.00% BANs, 12/15/2010 | 22,051,040 |
| 1,000,000 | | New Jersey EDA, School Facilities Construction Refunding Revenue Bonds (Series 2008W), 5.00% (New Jersey State)/(United States Treasury COL), 3/1/2011 | 1,019,640 |
| 16,500,000 | | Salem County, NJ PCFA, PCR Refunding Bonds (Series 2003B-1), 0.95% TOBs (Public Service Electric & Gas Co.), Mandatory Tender 11/1/2011 | 16,501,650 |
| 16,500,000 | | Salem County, NJ PCFA, PCR Refunding Bonds (Series 2003B-2), 0.95% TOBs (Public Service Electric & Gas Co.), Mandatory Tender 11/1/2011 | 16,501,650 |
| 2,745,050 | | Seaside Heights Borough, NJ, 1.50% BANs, 2/4/2011 | 2,750,046 |
| 2,882,500 | | Trenton, NJ, General Improvement Notes, 3.50% BANs, 12/10/2010 | 2,887,516 |
| | TOTAL | 88,285,078 |
| | New Mexico – 0.2% | |
| 2,000,000 | | Farmington, NM, Refunding Revenue Bonds (Series 2002A), 4.00% TOBs (El Paso Electric Co.)/(FGIC INS), Mandatory Tender 8/1/2012 | 2,007,280 |
Annual Shareholder Report23
Principal
Amount | | | Value |
| $4,000,000 | | New Mexico State Finance Authority, State Transportation Refunding Revenue Bonds (Series 2009A), 5.00%, 6/15/2011 | 4,132,400 |
| | TOTAL | 6,139,680 |
| | New York – 4.4% | |
| 600,000 | | Erie County, NY IDA, School Facility Revenue Bonds (Series 2009A), 5.00% (Buffalo, NY City School District), 5/1/2011 | 615,696 |
| 2,000,000 | | Erie County, NY IDA, School Facility Revenue Bonds (Series 2009A), 5.00% (Buffalo, NY City School District), 5/1/2012 | 2,133,980 |
| 2,000,000 | | Erie County, NY IDA, School Facility Revenue Bonds (Series 2009A), 5.00% (Buffalo, NY City School District), 5/1/2013 | 2,208,040 |
| 1,500,000 | | Erie County, NY IDA, School Facility Revenue Bonds (Series 2009A), 5.00% (Buffalo, NY City School District), 5/1/2014 | 1,696,140 |
| 4,395,000 | | Evans, NY, 2.50% BANs, 10/7/2010 | 4,395,791 |
| 8,520,000 | | Gilbertsville-Mount Upton, NY CSD, 2.25% BANs, 6/30/2011 | 8,607,926 |
| 3,000,000 | | Monroe County, NY, Public Improvement Bonds (Series 2009A), 3.75% (Assured Guaranty Corp. INS), 6/1/2011 | 3,062,940 |
| 4,000,000 | | Nassau County, NY, Refunding UT GO Bonds (Series 2009E), 4.00%, 6/1/2011 | 4,096,640 |
| 1,500,000 | | Nassau County, NY, Refunding UT GO Bonds (Series 2009E), 4.00%, 6/1/2012 | 1,583,415 |
| 9,500,000 | | New York City, NY, (Series C-4) ARS (Assured Guaranty Corp. INS), 0.450%, 10/1/2010 | 9,500,000 |
| 5,000,000 | | New York City, NY, UT GO Bonds (Series 2009H-1), 5.00%, 3/1/2013 | 5,501,400 |
| 6,355,000 | | New York State Dormitory Authority, Revenue Bonds (Series 2009C), 4.00% (School District Financing Program), 10/1/2011 | 6,579,459 |
| 10,000,000 | | New York State Dormitory Authority, Third General Resolution Revenue Bonds (Series 2002B), 5.25% TOBs (State University of New York), Mandatory Tender 5/15/2012 | 10,687,900 |
| 5,000,000 | | New York State Environmental Facilities Corp., Solid Waste Disposal Revenue Bonds (Series 2004A), 2.50% TOBs (Waste Management, Inc.), Mandatory Tender 1/2/2013 | 5,043,300 |
| 17,000,000 | | New York State Thruway Authority, General Revenue Bond Anticipation Notes (Series 2009A), 4.00%, 7/15/2011 | 17,489,430 |
| 20,000,000 | | New York State Urban Development Corp., Service Contract Refunding Revenue Bonds (Series 2010B), 5.00%, 1/1/2013 | 21,800,800 |
| 1,445,000 | | Newburgh, NY, 5.15% BANs, 8/30/2011 | 1,462,976 |
| 4,000,000 | | Newburgh, NY, 5.15% BANs, 8/30/2011 | 4,049,760 |
| 12,552,000 | | South Jefferson, NY CSD, 2.00% BANs, 6/24/2011 | 12,629,195 |
| 2,000,000 | | Triborough Bridge & Tunnel Authority, NY, General Revenue Bonds (Series 2008C), 4.00%, 11/15/2011 | 2,079,340 |
| 2,000,000 | | Triborough Bridge & Tunnel Authority, NY, General Revenue Bonds (Series 2008C), 5.00%, 11/15/2010 | 2,011,800 |
Annual Shareholder Report24
Principal
Amount | | | Value |
| $13,125,000 | | Worcester, NY CSD, 2.00% BANs, 6/24/2011 | 13,140,356 |
| | TOTAL | 140,376,284 |
| | North Carolina – 0.8% | |
| 2,500,000 | | Charlotte, NC, UT GO Bonds, 5.00%, 8/1/2011 | 2,598,625 |
| 1,000,000 | | Mecklenburg County, NC, Refunding UT GO Bonds (Series 2009A), 4.00%, 8/1/2011 | 1,031,100 |
| 500,000 | | New Hanover County, NC, GO Refunding Bonds (Series 2009A), 3.00%, 12/1/2011 | 515,670 |
| 2,000,000 | | New Hanover County, NC, GO Refunding Bonds (Series 2009A), 5.00%, 12/1/2012 | 2,195,180 |
| 1,000,000 | | North Carolina Eastern Municipal Power Agency, Power System Revenue Bonds (Series 2009A), 5.00%, 1/1/2012 | 1,047,990 |
| 1,200,000 | | North Carolina Eastern Municipal Power Agency, Power System Revenue Bonds (Series 2009A), 5.00%, 1/1/2013 | 1,298,796 |
| 2,855,000 | | North Carolina Eastern Municipal Power Agency, Power System Revenue Bonds (Series 2010A), 5.00%, 1/1/2015 | 3,226,093 |
| 2,000,000 | | North Carolina Eastern Municipal Power Agency, Power System Revenue Bonds, 5.00% (Assured Guaranty Corp. INS), 1/1/2013 | 2,175,860 |
| 1,000,000 | | North Carolina Medical Care Commission, Hospital Revenue Refunding Bonds (Series 2010), 5.00% (North Carolina Baptist), 6/1/2013 | 1,098,410 |
| 1,500,000 | | North Carolina Municipal Power Agency No. 1, Revenue Bonds (Series 2008C), 5.00% (United States Treasury COL), 1/1/2011 | 1,517,835 |
| 3,265,000 | | North Carolina State University at Raleigh, General Revenue Bonds (Series 2008B), 5.00%, 10/1/2010 | 3,265,424 |
| 2,000,000 | | North Carolina State, Public Improvement UT GO Bonds (Series 2005A), 5.50%, 3/1/2011 | 2,043,820 |
| 2,000,000 | | North Carolina State, Refunding UT GO Bonds (Series 2003E), 5.00%, 2/1/2012 | 2,122,600 |
| 2,000,000 | | North Carolina State, UT GO Refunding Bonds (Series E), 5.00%, 2/1/2013 | 2,206,080 |
| | TOTAL | 26,343,483 |
| | Ohio – 3.0% | |
| 1,000,000 | | Buckeye Tobacco Settlement Financing Authority, OH, Tobacco Settlement Asset-Backed Bonds (Series 2007A-1), 5.00%, 6/1/2012 | 1,032,770 |
| 5,000,000 | | Cleveland, OH Public Power System, Revenue Refunding Bonds (Series 2010), 5.00%, 11/15/2014 | 5,656,450 |
| 2,085,000 | | Lucas County, OH, Adjustable Rate Demand Health Care Facilities Revenue Bonds (Series 2002), 3.75% TOBs (Franciscan Care Center), Optional Tender 3/1/2011 | 2,090,108 |
| 8,000,000 | | Ohio State Air Quality Development Authority, Air Quality Revenue Refunding Bonds (Series 2009A), 3.875% TOBs (Columbus Southern Power Company), Mandatory Tender 6/1/2014 | 8,376,560 |
Annual Shareholder Report25
Principal
Amount | | | Value |
| $25,890,000 | | Ohio State Air Quality Development Authority, PCR Refunding Bonds (Series 2006A), 2.25% TOBs (FirstEnergy Solutions Corp.), Mandatory Tender 6/3/2013 | 25,912,265 |
| 6,000,000 | | Ohio State Air Quality Development Authority, PCR Refunding Bonds (Series 2009-B), 5.25% TOBs (FirstEnergy Solutions Corp.), Mandatory Tender 3/1/2011 | 6,097,620 |
| 12,150,000 | | Ohio State Air Quality Development Authority, PCR Refunding Bonds (Series 2009-D), 4.75% TOBs (FirstEnergy Solutions Corp.), Mandatory Tender 8/1/2012 | 12,720,321 |
| 2,900,000 | | Ohio State Air Quality Development Authority, PCR Revenue Refunding Bonds (Series 2008B), 3.00% TOBs (FirstEnergy Solutions Corp.), Mandatory Tender 4/2/2012 | 2,940,368 |
| 3,000,000 | | Ohio State Higher Educational Facility Commission, Higher Educational Facility Revenue Bonds (Series 2009), 5.00% (Oberlin College), 10/1/2014 | 3,455,040 |
| 3,000,000 | | Ohio State Water Development Authority, 1.50% TOBs (Waste Management, Inc.), Mandatory Tender 12/1/2010 | 3,001,530 |
| 1,200,000 | | Ohio State, Hospital Revenue Bonds (Series 2008A), 4.00% (Cleveland Clinic), 1/1/2012 | 1,245,612 |
| 1,750,000 | | Ohio State, Hospital Revenue Bonds (Series 2008A), 4.00% (Cleveland Clinic), 1/1/2013 | 1,857,748 |
| 5,500,000 | | Ohio Water Development Authority, PCR Revenue Refunding Bonds (Series 2008B), 3.00% TOBs (FirstEnergy Solutions Corp.), Mandatory Tender 4/2/2012 | 5,559,400 |
| 3,000,000 | | Ohio Water Development Authority, Solid Waste Revenue Bonds (Series 2004), 2.625% TOBs (Waste Management, Inc.), Mandatory Tender 1/2/2013 | 3,020,280 |
| 12,230,000 | | Richland County, OH, 3.50% BANs, 1/11/2011 | 12,271,093 |
| | TOTAL | 95,237,165 |
| | Oklahoma – 0.8% | |
| 1,000,000 | | Oklahoma County, OK Finance Authority, Educational Facilities Lease Revenue Bonds (Series 2010), 3.00% (Putnam City Public Schools), 3/1/2011 | 1,007,930 |
| 3,825,000 | | Oklahoma County, OK Finance Authority, Educational Facilities Lease Revenue Bonds (Series 2010), 3.50% (Putnam City Public Schools), 3/1/2012 | 3,931,373 |
| 1,000,000 | | Oklahoma County, OK Finance Authority, Educational Facilities Lease Revenue Bonds (Series 2010), 4.00% (Putnam City Public Schools), 3/1/2013 | 1,056,260 |
| 18,000,000 | | Oklahoma State Municipal Power Authority, Power Supply System Revenue Refunding Bonds (Series 2005A), 1.05%, 1/1/2023 | 17,855,640 |
| | TOTAL | 23,851,203 |
| | Pennsylvania – 5.8% | |
| 13,200,000 | | Allegheny County, PA HDA, Adjustable Rate Hospital Revenue Bonds (Series 2010F), 1.32% (UPMC Health System), 5/15/2038 | 13,069,320 |
Annual Shareholder Report26
Principal
Amount | | | Value |
| $2,040,000 | | Allegheny County, PA HDA, Hospital Revenue Bonds (Series 2008B), 5.00% (UPMC Health System), 6/15/2011 | 2,101,690 |
| 5,000,000 | | Allegheny County, PA HDA, Revenue Bonds (Series 2008A), 5.00% (UPMC Health System), 9/1/2011 | 5,194,800 |
| 3,000,000 | | Allegheny County, PA HDA, Revenue Bonds (Series 2010A), 3.00% (UPMC Health System), 5/15/2011 | 3,043,050 |
| 5,000,000 | | Allegheny County, PA HDA, Revenue Bonds (Series 2010A), 4.00% (UPMC Health System), 5/15/2012 | 5,223,850 |
| 10,000,000 | | Allegheny County, PA HDA, Revenue Bonds (Series 2010A), 5.00% (UPMC Health System), 5/15/2013 | 10,943,500 |
| 4,125,000 | | Allegheny County, PA HDA, Revenue Bonds (Series 2010A), 5.00% (UPMC Health System), 5/15/2015 | 4,677,379 |
| 2,180,000 | | Allegheny County, PA, GO Bonds (Series C-63), 3.00%, 11/1/2011 | 2,232,298 |
| 6,970,000 | | Allegheny County, PA, GO Bonds (Series C-63), 5.00%, 11/1/2012 | 7,515,472 |
| 7,000,000 | | Beaver County, PA IDA, PCR Refunding Bonds (Series 2008B), 3.00% TOBs (FirstEnergy Solutions Corp.), Mandatory Tender 4/2/2012 | 7,075,600 |
| 10,900,000 | | Bucks County, PA IDA, Solid Waste Revenue Bonds, 2.875% TOBs (Waste Management, Inc.), Mandatory Tender 2/1/2013 | 11,009,327 |
| 7,000,000 | | Pennsylvania EDFA, (Series B), 0.90% TOBs (Republic Services, Inc.), Mandatory Tender 1/3/2011 | 7,000,000 |
| 3,500,000 | | Pennsylvania EDFA, Exempt Facilities Revenue Bonds (Series 2002A), 1.50% TOBs (FirstEnergy Solutions Corp.), Mandatory Tender 6/1/2011 | 3,499,195 |
| 3,000,000 | | Pennsylvania EDFA, Exempt Facilities Revenue Refunding Bonds (Series 2009A), 3.00% TOBs (PPL Energy Supply, LLC), Mandatory Tender 9/1/2015 | 3,025,980 |
| 8,350,000 | | Pennsylvania EDFA, Exempt Facilities Revenue Refunding Bonds (Series 2009A), 5.00% TOBs (Exelon Generation Co. LLC), Mandatory Tender 6/1/2012 | 8,804,407 |
| 1,500,000 | | Pennsylvania EDFA, Exempt Facilities Revenue Refunding Bonds (Series 2009B), 3.00% TOBs (PPL Energy Supply, LLC), Mandatory Tender 9/1/2015 | 1,512,990 |
| 6,000,000 | | Pennsylvania EDFA, PCR Refunding Bonds (Series 2008), 4.85% TOBs (PPL Electric Utilities Corp.), Mandatory Tender 10/1/2010 | 6,000,360 |
| 19,955,000 | | Pennsylvania EDFA, Solid Waste Disposal Revenue Bonds, 2.625% TOBs (Waste Management, Inc.), Mandatory Tender 12/3/2012 | 20,137,189 |
| 3,035,000 | | Pennsylvania EDFA, Solid Waste Disposal Revenue Bonds (Series 2006), 2.75% (Waste Management, Inc.), 9/1/2013 | 3,072,725 |
| 1,000,000 | | Pennsylvania State Higher Education Facilities Authority, Revenue Bonds (Series 2008B), 5.00% (University of Pennsylvania Health System), 8/15/2013 | 1,109,610 |
| 4,170,000 | | Pennsylvania State Higher Education Facilities Authority, Revenue Bonds (Series 2010E), 3.00% (UPMC Health System), 5/15/2011 | 4,229,840 |
| 3,000,000 | | Pennsylvania State Higher Education Facilities Authority, Revenue Bonds (Series 2010E), 3.50% (UPMC Health System), 5/15/2012 | 3,110,250 |
Annual Shareholder Report27
Principal
Amount | | | Value |
| $7,905,000 | | Pennsylvania State Higher Education Facilities Authority, Revenue Bonds (Series 2010E), 3.50% (UPMC Health System), 5/15/2013 | 8,346,020 |
| 12,070,000 | | Pennsylvania State Turnpike Commission, Variable Rate Turnpike Revenue Bonds (Series 2009C), 1.32%, 12/1/2014 | 11,951,955 |
| 25,000,000 | | Philadelphia, PA School District, LT GO Notes (Series A of 2010-2011), 2.50% TRANs, 6/30/2011 | 25,278,000 |
| 2,410,000 | | Sayre, PA, Health Care Facilities Authority, Revenue Bonds, 0.849% (Guthrie Healthcare System, PA), 12/1/2017 | 2,215,224 |
| 2,100,000 | | University of Pittsburgh, University Refunding Bonds (Series 2009A), 5.00%, 9/15/2011 | 2,194,059 |
| | TOTAL | 183,574,090 |
| | South Carolina – 0.5% | |
| 3,000,000 | | Jasper County, SC, Special Source Revenue (Series 2010), 2.35% BANs, 2/11/2011 | 3,000,570 |
| 5,950,000 | | South Carolina Jobs-EDA, Hospital Revenue Bonds (Floating Rate Notes), 1.02% TOBs (Palmetto Health Alliance) Mandatory Tender, 8/1/2013 | 5,643,159 |
| 5,285,000 | | South Carolina State Public Service Authority (Santee Cooper), Refunding Revenue Obligations (Series 2009A), 5.00%, 1/1/2012 | 5,582,968 |
| | TOTAL | 14,226,697 |
| | Tennessee – 0.3% | |
| 4,500,000 | | Lewisburg, TN IDB, Solid Waste Disposal Revenue Bonds (Series 2006), 2.50% (Waste Management, Inc.), 7/1/2012 | 4,511,835 |
| 62,520 | 2 | Sumner County, TN Health, Educational & Housing Facilities Board, Hospital Revenue & Refunding Improvement Bonds (Series 2007A), 5.25% (Sumner Regional Health Systems, Inc.), 11/1/2011 | 3,139 |
| 57,518 | 2 | Sumner County, TN Health, Educational & Housing Facilities Board, Hospital Revenue & Refunding Improvement Bonds (Series 2007A), 5.25% (Sumner Regional Health Systems, Inc.), 11/1/2012 | 2,887 |
| 125,040 | 2 | Sumner County, TN Health, Educational & Housing Facilities Board, Hospital Revenue & Refunding Improvement Bonds (Series 2007A), 5.25% (Sumner Regional Health Systems, Inc.), 11/1/2013 | 6,277 |
| 5,585,000 | | Tennessee State, GO Bonds (Series 2009A), 4.00%, 5/1/2012 | 5,901,669 |
| | TOTAL | 10,425,807 |
| | Texas – 3.9% | |
| 1,500,000 | | Austin, TX, Water and Wastewater System Refunding Revenue Bonds (Series 2008A), 3.00%, 11/15/2011 | 1,544,415 |
| 6,500,000 | | Dallas, TX ISD, UT GO Refunding Bonds (Series 2009), 4.00%, 2/15/2011 | 6,588,465 |
| 2,000,000 | | Dallas-Fort Worth, TX International Airport, Joint Revenue Refunding Bonds (Series 2009A), 4.00%, 11/1/2011 | 2,072,400 |
| 2,000,000 | | Dallas-Fort Worth, TX International Airport, Joint Refunding Revenue Bonds (Series 2009A), 4.00%, 11/1/2012 | 2,124,060 |
Annual Shareholder Report28
Principal
Amount | | | Value |
| $1,855,000 | | Grapevine, TX, Combination Tax & Tax Increment Reinvestment Zone Number One Refunding Revenue Bonds (Series 2009A), 3.00%, 2/15/2011 | 1,872,808 |
| 1,540,000 | | Grapevine, TX, Combination Tax & Tax Increment Reinvestment Zone Number One Refunding Revenue Bonds (Series 2009A), 4.25%, 2/15/2012 | 1,614,998 |
| 3,170,000 | | Grapevine, TX, Refunding LT GO Bonds (Series 2009), 3.00%, 2/15/2011 | 3,200,432 |
| 4,345,000 | | Grapevine, TX, Refunding LT GO Bonds (Series 2009), 5.00%, 2/15/2012 | 4,601,094 |
| 1,000,000 | | Gulf Coast, TX Waste Disposal Authority, Solid Waste Disposal Revenue Bonds (Series 2003D), 4.55% (Waste Management, Inc.), 4/1/2012 | 1,026,890 |
| 2,300,000 | | Harris County, TX Cultural Education Facilities Finance Corp., Revenue Bonds (Series 2008B), 5.25% (Methodist Hospital, Harris County, TX), 12/1/2012 | 2,490,831 |
| 3,400,000 | | Harris County, TX HFDC, (Series A-3) ARS (Christus Health System)/(Assured Guaranty Municipal Corp. INS), 0.938%, 10/7/2010 | 3,400,000 |
| 4,700,000 | | Harris County, TX HFDC, (Series A-4) ARS (Christus Health System)/(Assured Guaranty Municipal Corp. INS), 0.938%, 10/7/2010 | 4,700,000 |
| 4,450,000 | | Harris County, TX HFDC, (Series A-5) ARS (Christus Health System)/(Assured Guaranty Municipal Corp. INS), 1.000%, 10/7/2010 | 4,450,000 |
| 17,500,000 | | Harris County, TX HFDC, (Series A-6) ARS (Christus Health System)/(Assured Guaranty Municipal Corp. INS), 1.000%, 10/7/2010 | 17,500,000 |
| 1,000,000 | | Harris County, TX, Permanent Improvement Refunding LT GO Bonds (Series 2008B), 4.00%, 10/1/2010 | 1,000,100 |
| 750,000 | | Harris County, TX, Permanent Improvement Refunding LT GO Bonds (Series 2008B), 5.00% (United States Treasury PRF), 10/1/2011 | 784,800 |
| 500,000 | | Harris County, TX, Permanent Improvement Refunding LT GO Bonds (Series 2008B), 5.00%, 10/1/2011 | 523,355 |
| 3,500,000 | | Houston, TX Combined Utility System, First Lien Refunding Revenue Bonds (Series 2004C-2B), 5.00% TOBs (AMBAC INS), Mandatory Tender 5/15/2011 | 3,593,660 |
| 500,000 | | Lower Colorado River Authority, TX, Refunding Revenue Bonds (Series 20008), 5.00% (LCRA Transmission Services Corp.), 5/15/2011 | 513,925 |
| 500,000 | | Lower Colorado River Authority, TX, Refunding Revenue Bonds (Series 2008), 5.00% (LCRA Transmission Services Corp.)/(Berkshire Hathaway Assurance Corp. INS), 5/15/2011 | 514,325 |
| 6,825,000 | | Lubbock, TX HFDC, Variable Rate Refunding Revenue Bonds (Series 2008A), 3.05% TOBs (St. Joseph Health System), Mandatory Tender 10/16/2012 | 6,961,091 |
| 7,000,000 | | Mission, TX Economic Development Corp., Revenue Bonds, 1.30% TOBs (Republic Services, Inc.), Mandatory Tender 10/1/2010 | 7,000,000 |
| 1,000,000 | | San Antonio, TX Water System, Junior Lien Refunding Revenue Bonds (Series 2010), 3.00%, 5/15/2012 | 1,039,160 |
Annual Shareholder Report29
Principal
Amount | | | Value |
| $1,000,000 | | Tarrant County, TX Cultural Education Facilities Finance Corp., Retirement Facilities Revenue Bonds (Series 2007), 5.25% (Buckingham Senior Living Community), 11/15/2010 | 999,740 |
| 5,000,000 | | Texas State Public Finance Authority, Refunding UT GO Bonds (Series 2009A), 4.00% (Texas State), 10/1/2011 | 5,184,600 |
| 6,415,000 | | Texas State Public Finance Authority, Refunding UT GO Bonds (Series 2009A), 5.00% (Texas State), 10/1/2012 | 6,991,580 |
| 7,250,000 | | Texas State Public Finance Authority, UT GO Bonds (Series 2008A), 5.00% (Texas State), 10/1/2010 | 7,250,943 |
| 7,150,000 | | Texas State Public Finance Authority, UT GO Refunding Bonds (Series 2010A), 5.00% (Texas State), 10/1/2013 | 8,064,270 |
| 14,060,000 | | Texas State Public Finance Authority, UT GO Refunding Bonds (Series 2010B), 5.00% (Texas State), 10/1/2013 | 15,857,852 |
| 1,500,000 | | Texas State Transportation Commission, First Tier Revenue Bonds, 5.00%, 4/1/2011 | 1,535,550 |
| | TOTAL | 125,001,344 |
| | Utah – 1.0% | |
| 3,300,000 | | Box Elder County, UT, PCRBs (Series 1984), 1.90% TOBs (Nucor Corp.), Optional Tender 10/1/2010 | 3,309,042 |
| 3,000,000 | | Intermountain Power Agency, UT, Subordinated Power Supply Refunding Revenue Bonds (Series 2008A), 5.25%, 7/1/2011 | 3,107,130 |
| 2,765,000 | | Intermountain Power Agency, UT, Subordinated Supply Refunding Revenue Bonds (Series 2009A), 5.00%, 7/1/2011 | 2,858,568 |
| 3,000,000 | | Intermountain Power Agency, UT, Subordinated Supply Refunding Revenue Bonds (Series 2009A), 5.00%, 7/1/2012 | 3,219,120 |
| 1,400,000 | | Riverton, UT Hospital Revenue Authority, Hospital Revenue Bonds (Series 2009), 5.00% (IHC Health Services, Inc.), 8/15/2013 | 1,549,254 |
| 5,320,000 | | Utah State, GO Bonds (Series 2009C), 3.00%, 7/1/2012 | 5,559,400 |
| 10,600,000 | | Utah State, UT GO Bonds (Series 2003A), 5.00%, 7/1/2012 | 11,446,834 |
| | TOTAL | 31,049,348 |
| | Virginia – 2.3% | |
| 2,540,000 | | Fairfax County, VA Sewer Revenue, Revenue Bonds (Series 2009), 5.00%, 7/15/2012 | 2,747,264 |
| 4,275,000 | | Hopewell, VA, Sewer System Revenue Bonds (Series 2009), 4.00%, 11/15/2012 | 4,421,162 |
| 3,000,000 | | Louisa, VA IDA, PCR Refunding Bonds (Series 2008C), 5.00% TOBs (Virginia Electric & Power Co.), Mandatory Tender 12/1/2011 | 3,124,950 |
| 7,000,000 | | Louisa, VA IDA, Solid Waste & Sewage Disposal Revenue Bonds (Series 2000A), 1.375% TOBs (Virginia Electric & Power Co.), Mandatory Tender 4/1/2011 | 7,004,340 |
| 37,690,000 | | Norfolk, VA, (Series C), 1.50% BANs, 4/1/2011 | 37,888,626 |
| 1,650,000 | | Virginia College Building Authority, Educational Facilities Revenue Bonds (Series 2009A), 5.00%, 2/1/2012 | 1,750,073 |
Annual Shareholder Report30
Principal
Amount | | | Value |
| $4,000,000 | | Virginia Peninsula Port Authority, Refunding Revenue Bonds (Series 2003), 5.00% TOBs (Dominion Terminal Associates)/(GTD by Dominion Resources, Inc.), Mandatory Tender 10/1/2011 | 4,107,880 |
| 2,825,000 | | Virginia State Public Building Authority, Public Facilities Revenue Bonds (Series 2006B), 5.00%, 8/1/2012 | 3,059,644 |
| 3,290,000 | | Virginia State Public Building Authority, Public Facilities Revenue Bonds (Series 2009B), 5.00%, 8/1/2011 | 3,419,396 |
| 3,000,000 | | Virginia State Public School Authority, School Financing Bonds (Series 2009C), 4.00%, 8/1/2012 | 3,194,400 |
| 3,570,000 | | York County, VA EDA, PCR Refunding Bonds (Series 2009A), 4.05% TOBs (Virginia Electric & Power Co.), Mandatory Tender 5/1/2014 | 3,807,191 |
| | TOTAL | 74,524,926 |
| | Washington – 1.3% | |
| 2,165,000 | | Chelan County, WA Public Utility District No. 1, Consolidated System Subordinate Revenue Notes (Series 2008A), 5.00%, 7/1/2013 | 2,402,024 |
| 1,000,000 | | Clark County, WA Public Utility District No. 001, Electric System Revenue & Refunding Bonds (Series 2009), 5.00%, 1/1/2011 | 1,010,880 |
| 2,155,000 | | Clark County, WA Public Utility District No. 001, Electric System Revenue & Refunding Bonds (Series 2009), 5.00%, 1/1/2012 | 2,265,077 |
| 3,000,000 | | Energy Northwest, WA, Project 1 Electric Refunding Revenue Bonds (Series 2008D), 5.00%, 7/1/2011 | 3,105,930 |
| 7,000,000 | 3 | Washington State EDFA, Solid Waste Disposal Revenue Bonds (Series 2005D), 1.75% TOBs (Waste Management, Inc.), Optional Tender 9/1/2011 | 6,994,820 |
| 8,000,000 | 3 | Washington State EDFA, Solid Waste Disposal Revenue Bonds (Series 2008), 1.75% TOBs (Waste Management, Inc.), Optional Tender 9/1/2011 | 7,994,080 |
| 8,520,000 | | Washington State Health Care Facilities Authority, Revenue Bonds (Series 2010A), 3.00% (Multicare Health System), 8/15/2011 | 8,644,818 |
| 9,335,000 | | Washington State, Motor Vehicle Fuel Tax GO Bonds (Series 2010B), 5.00%, 8/1/2012 | 10,101,404 |
| | TOTAL | 42,519,033 |
| | West Virginia – 0.5% | |
| 5,000,000 | | West Virginia EDA, PCR Refunding Revenue Bonds (Series 2008D), 4.85% TOBs (Appalachian Power Co.), Mandatory Tender 9/4/2013 | 5,351,300 |
| 10,000,000 | | West Virginia EDA, Solid Waste Disposal Facilities Revenue Bonds (Series 2010A), 3.125% TOBs (Ohio Power Co.), Mandatory Tender 4/1/2015 | 10,162,000 |
| | TOTAL | 15,513,300 |
| | Wisconsin – 0.9% | |
| 3,750,000 | | Oak Creek, WI Waterworks System, BANs (Series 2009), 4.00%, 4/1/2011 | 3,794,437 |
Annual Shareholder Report31
Principal
Amount | | | Value |
| $12,000,000 | | Wisconsin Health & Educational Facilities Authority, Revenue Bonds (Series 2009B), 4.75% TOBs (Aurora Health Care, Inc.), Mandatory Tender 8/15/2014 | 12,896,640 |
| 2,840,000 | | Wisconsin Public Power System, Power Supply System Revenue Bonds (Series 2008A), 4.00%, 7/1/2011 | 2,903,162 |
| 4,000,000 | | Wisconsin State Petroleum Inspection Fee, Refunding Revenue Bonds (2009 Series 1), 5.00%, 7/1/2013 | 4,442,560 |
| 2,000,000 | | Wisconsin State Transportation, Revenue Bonds (Series 2009A), 3.50%, 7/1/2013 | 2,147,860 |
| 2,420,000 | | Wisconsin State Transportation, Revenue Bonds (Series 2009A), 3.50%, 7/1/2014 | 2,636,663 |
| 750,000 | | Wisconsin State Transportation, Revenue Bonds (Series 2009A), 4.00%, 7/1/2012 | 794,932 |
| | TOTAL | 29,616,254 |
| | Wyoming – 0.1% | |
| 4,200,000 | | Albany County, WY, PCRBs (Series 1985), 2.50% TOBs (Union Pacific Railroad Co.)/(GTD by Union Pacific Corp.), Optional Tender 12/1/2010 | 4,210,710 |
| | TOTAL MUNICIPAL BONDS
(IDENTIFIED COST $1,966,715,783) | 1,987,018,075 |
| | SHORT-TERM MUNICIPALS – 37.1%;5 | |
| | Alabama – 3.3% | |
| 49,000,000 | | Birmingham, AL Medical Clinic Board, (Series 1991) Weekly VRDNs (University of Alabama Health System)/(SunTrust Bank LOC), 0.620%, 10/6/2010 | 49,000,000 |
| 6,260,000 | | Gulf Shores, AL Medical Clinic Board, (Series 2007) Weekly VRDNs (Colonial Pinnacle MOB, LLC)/(Regions Bank, Alabama LOC), 1.080%, 10/7/2010 | 6,260,000 |
| 15,500,000 | | Health Care Authority for Baptist Health, AL, (Series 2008-A) Weekly VRDNs (Regions Bank, Alabama LOC), 1.080%, 10/7/2010 | 15,500,000 |
| 2,280,000 | | Marshall County, AL, Special Obligation School Refunding Warrant (Series 1994) Weekly VRDNs (Marshall County, AL Board of Education)/(Regions Bank, Alabama LOC), 1.130%, 10/7/2010 | 2,280,000 |
| 6,070,000 | | Mobile, AL Downtown Redevelopment Authority, (Series 2007) Weekly VRDNs (Lafayette Plaza Hotel)/(Regions Bank, Alabama LOC), 1.080%, 10/7/2010 | 6,070,000 |
| 14,500,000 | | Mobile, AL Spring Hill College Educational Building Authority, (Series 2007) Weekly VRDNs (Spring Hill College, AL)/(Regions Bank, Alabama LOC), 1.210%, 10/6/2010 | 14,500,000 |
| 10,000,000 | | Washington County, AL IDA, (Series 2007: Gulf Opportunity Zone Bonds) Weekly VRDNs (Bay Gas Storage Company, Ltd.)/(Regions Bank, Alabama LOC), 1.000%, 10/6/2010 | 10,000,000 |
| | TOTAL | 103,610,000 |
Annual Shareholder Report32
Principal
Amount | | | Value |
| | Alaska – 0.3% | |
| $8,300,000 | | Valdez, AK Marine Terminal, (Series 2003B) Daily VRDNs (BP Pipelines (Alaska) Inc.)/(GTD by BP PLC), 0.330%, 10/1/2010 | 8,300,000 |
| | Arizona – 0.5% | |
| 15,000,000 | | Ak-Chin Indian Community, AZ, (Series 2008) Weekly VRDNs (Bank of America N.A. LOC), 0.320%, 10/7/2010 | 15,000,000 |
| | Arkansas – 0.3% | |
| 6,425,000 | | Arkansas Development Finance Authority, (Series 2001D) Weekly VRDNs (ChapelRidge of Cabot Housing Associates)/(Regions Bank, Alabama LOC), 1.280%, 10/7/2010 | 6,425,000 |
| 2,055,000 | | Pulaski County, AR Public Facilities Board, (Series 2002: Waterford and Bowman Heights Apartments) Weekly VRDNs (Bailey Properties, LLC)/(Regions Bank, Alabama LOC), 1.280%, 10/7/2010 | 2,055,000 |
| | TOTAL | 8,480,000 |
| | California – 1.6% | |
| 10,900,000 | | ABAG Finance Authority for Non-Profit Corporations, CA, Oshman Family JCC (Series 2007) Daily VRDNs (Albert L. Schultz Jewish Community Center)/(Bank of America N.A. LOC), 0.320%, 10/1/2010 | 10,900,000 |
| 28,600,000 | | California State, GO Tax Exempt Notes, 0.38% CP (CALPERS (California Public Employees Retirement System), CALSTRS (California State Teachers' Retirement System), Credit Agricole Corporate and Investment Bank, Dexia Credit Local, Landesbank Hessen-Thuringen, Royal Bank of Canada, Montreal and Wells Fargo Bank, N.A. LOCs), Mandatory Tender 10/7/2010 | 28,600,000 |
| 11,495,000 | 3,4 | San Diego, CA USD, (Series 2008-066) Weekly VRDNs (Dexia Credit Local LIQ)/(Dexia Credit Local LOC), 0.460%, 10/7/2010 | 11,495,000 |
| | TOTAL | 50,995,000 |
| | Florida – 1.9% | |
| 1,110,000 | | Collier County, FL Educational Facilities Authority, (Series 2004) Weekly VRDNs (International College, Inc.)/(Fifth Third Bank, Cincinnati LOC), 0.440%, 10/1/2010 | 1,110,000 |
| 2,000,000 | | Florida Higher Educational Facilities Financing Authority, (Series 2008) Weekly VRDNs (Ringling College of Art and Design, Inc.)/(SunTrust Bank LOC), 0.620%, 10/6/2010 | 2,000,000 |
| 32,440,000 | 3,4 | Hillsborough County, FL IDA, (Series MT-008) Weekly VRDNs (University Community Hospital)/(GTD by Bank of America N.A.)/(Merrill Lynch & Co., Inc. LIQ), 0.490%, 10/7/2010 | 32,440,000 |
| 19,070,000 | | New College of Florida Development Corp., (Series 2006) Weekly VRDNs (SunTrust Bank LOC), 0.620%, 10/6/2010 | 19,070,000 |
| 7,000,000 | | UCF Health Facilities Corp., Capital Improvement Revenue Bonds (Series 2007) Weekly VRDNs (UCF Health Sciences Campus at Lake Nona)/(Fifth Third Bank, Cincinnati LOC), 0.440%, 10/1/2010 | 7,000,000 |
| | TOTAL | 61,620,000 |
Annual Shareholder Report33
Principal
Amount | | | Value |
| | Georgia – 1.6% | |
| $14,615,000 | | Albany-Dougherty County, GA Hospital Authority, (Series 2008B) Daily VRDNs (Phoebe Putney Memorial Hospital)/(Regions Bank, Alabama LOC), 0.750%, 10/1/2010 | 14,615,000 |
| 16,000,000 | | DeKalb County, GA MFH Authority, (Series 2001) Weekly VRDNs (Signature Station Apartments)/(Regions Bank, Alabama LOC), 1.280%, 10/7/2010 | 16,000,000 |
| 19,225,000 | | Walker, Dade & Catoosa Counties, GA Hospital Authority, (Series 2008) Weekly VRDNs (Hutcheson Medical Center, Inc.)/(Regions Bank, Alabama LOC), 1.080%, 10/7/2010 | 19,225,000 |
| | TOTAL | 49,840,000 |
| | Illinois – 1.0% | |
| 8,800,000 | | Illinois Finance Authority, (Series 2006) Weekly VRDNs (Reliable Materials Lyons LLC)/(Marshall & Ilsley Bank, Milwaukee LOC), 2.510%, 10/6/2010 | 8,800,000 |
| 11,865,000 | 3,4 | Illinois State, (PT-3523) Weekly VRDNs (Dexia Credit Local LIQ), 0.470%, 10/7/2010 | 11,865,000 |
| 10,375,000 | 3,4 | Illinois State, (PT-3524) Weekly VRDNs (Dexia Credit Local LIQ), 0.470%, 10/7/2010 | 10,375,000 |
| | TOTAL | 31,040,000 |
| | Kentucky – 0.8% | |
| 8,500,000 | | Boyd County, KY, (Series 2003) Weekly VRDNs (Air Products & Chemicals, Inc.), 0.530%, 10/6/2010 | 8,500,000 |
| 9,860,000 | | Carroll County, KY, (Series 2001) Weekly VRDNs (North American Stainless, LP)/(Fifth Third Bank, Cincinnati LOC), 0.520%, 10/1/2010 | 9,860,000 |
| 8,000,000 | | Glasgow, KY, (Series 1990) Weekly VRDNs (ACK Controls)/(Bank of Tokyo-Mitsubishi UFJ Ltd. LOC), 0.430%, 10/6/2010 | 8,000,000 |
| | TOTAL | 26,360,000 |
| | Louisiana – 2.4% | |
| 9,900,000 | | Louisiana Public Facilities Authority Weekly VRDNs (Grigsby Properties, LLC)/(Regions Bank, Alabama LOC), 1.080%, 10/7/2010 | 9,900,000 |
| 17,500,000 | | Louisiana Public Facilities Authority, (Series 2007) Daily VRDNs (Air Products & Chemicals, Inc.), 0.450%, 10/1/2010 | 17,500,000 |
| 24,700,000 | | Louisiana Public Facilities Authority, (Series 2008A) Daily VRDNs (Air Products & Chemicals, Inc.), 0.460%, 10/1/2010 | 24,700,000 |
| 6,000,000 | | Louisiana Public Facilities Authority, (Series 2008C) Daily VRDNs (Air Products & Chemicals, Inc.), 0.450%, 10/1/2010 | 6,000,000 |
| 20,000,000 | | St. Tammany Parish Development District, LA, (Series 2008A) Weekly VRDNs (Slidell Development Company, LLC)/(Regions Bank, Alabama LOC), 1.080%, 10/7/2010 | 20,000,000 |
| | TOTAL | 78,100,000 |
| | Massachusetts – 2.3% | |
| 1,500,000 | | Commonwealth of Massachusetts, (Series 2000A) Daily VRDNs (GTD by Landesbank Baden-Wurttemberg LIQ), 0.330%, 10/1/2010 | 1,500,000 |
Annual Shareholder Report34
Principal
Amount | | | Value |
| $2,400,000 | | Commonwealth of Massachusetts, Consolidated Loan (Series 2006A) Daily VRDNs (Dexia Credit Local LIQ), 0.340%, 10/1/2010 | 2,400,000 |
| 10,000,000 | | Massachusetts Development Finance Agency, (Series 2004), 0.95% CP (Nantucket Electric Co.)/(GTD by Massachusetts Electric Co.), Mandatory Tender 11/8/2010 | 10,000,000 |
| 1,755,000 | | Massachusetts Development Finance Agency, (Series 2004), 1.00% CP (Nantucket Electric Co.)/(GTD by Massachusetts Electric Co.), Mandatory Tender 11/8/2010 | 1,755,000 |
| 45,550,000 | | Massachusetts IFA, (Series 1992B), 0.90% CP (New England Power Co.), Mandatory Tender 11/8/2010 | 45,550,000 |
| 11,600,000 | 3,4 | Massachusetts State Special Obligation, (PT-3612) Weekly VRDNs (Dexia Credit Local LIQ)/(Dexia Credit Local LOC), 0.470%, 10/7/2010 | 11,600,000 |
| | TOTAL | 72,805,000 |
| | Michigan – 2.6% | |
| 82,240,000 | 3,4 | Detroit, MI City School District, (PT-3480) Weekly VRDNs (Assured Guaranty Municipal Corp. INS)/(Dexia Credit Local LIQ), 0.400%, 10/14/2010 | 82,240,000 |
| | Mississippi – 3.2% | |
| 17,700,000 | | Mississippi Business Finance Corp., (Series 2007) Weekly VRDNs (DDR Gulfport Promenade LLC)/(Regions Bank, Alabama LOC), 1.080%, 10/7/2010 | 17,700,000 |
| 12,750,000 | | Mississippi Business Finance Corp., (Series 2007) Weekly VRDNs (Gulf Ship, LLC)/(Regions Bank, Alabama LOC), 1.080%, 10/7/2010 | 12,750,000 |
| 66,050,000 | | Mississippi Business Finance Corp., (Series 2008) Weekly VRDNs (200 Renaissance, LLC)/(Regions Bank, Alabama LOC), 1.080%, 10/7/2010 | 66,050,000 |
| 6,415,000 | | Mississippi Business Finance Corp., (Series A) Weekly VRDNs (Mississippi College)/(Regions Bank, Alabama LOC), 1.080%, 10/7/2010 | 6,415,000 |
| | TOTAL | 102,915,000 |
| | Missouri – 0.3% | |
| 10,350,000 | 3,4 | St. Louis, MO, (PT-3584) Weekly VRDNs (Lambert-St. Louis International Airport)/(Dexia Credit Local LIQ)/(Dexia Credit Local LOC), 0.470%, 10/7/2010 | 10,350,000 |
| | New Hampshire – 1.9% | |
| 25,000,000 | | New Hampshire Business Finance Authority, PCRBs (1990 Series A), 0.90% CP (New England Power Co.), Mandatory Tender 10/5/2010 | 25,000,000 |
| 34,350,000 | | New Hampshire Business Finance Authority, PCRBs (1990 Series A), 0.95% CP (New England Power Co.), Mandatory Tender 11/8/2010 | 34,350,000 |
| 2,000,000 | | New Hampshire Business Finance Authority, PCRBs (1990 Series A), 1.00% CP (New England Power Co.), Mandatory Tender 10/21/2010 | 2,000,000 |
| | TOTAL | 61,350,000 |
Annual Shareholder Report35
Principal
Amount | | | Value |
| | New Jersey – 3.8% | |
| $50,705,000 | 3,4 | New Jersey EDA, (PT-3824) Weekly VRDNs (GTD by Dexia Credit Local)/(Dexia Credit Local LIQ), 0.460%, 10/7/2010 | 50,705,000 |
| 10,880,000 | 3,4 | New Jersey State Transportation Trust Fund Authority, (PT-2572) Weekly VRDNs (Dexia Credit Local LIQ)/(Dexia Credit Local LOC), 0.460%, 10/7/2010 | 10,880,000 |
| 10,780,000 | 3,4 | New Jersey State Transportation Trust Fund Authority, (PT-3535) Weekly VRDNs (Dexia Credit Local LIQ)/(Dexia Credit Local LOC), 0.460%, 10/7/2010 | 10,780,000 |
| 31,740,000 | 3,4 | New Jersey State Transportation Trust Fund Authority, (PT-3859) Weekly VRDNs (Dexia Credit Local LIQ)/(Dexia Credit Local LOC), 0.460%, 10/7/2010 | 31,740,000 |
| 4,000,000 | 3,4 | New Jersey Turnpike Authority, (PT-2493) Weekly VRDNs (GTD by Dexia Credit Local)/(Dexia Credit Local LIQ), 0.460%, 10/7/2010 | 4,000,000 |
| 11,675,000 | 3,4 | Washington Township, NJ Board of Education (Mercer County), (PT-2808) Weekly VRDNs (Dexia Credit Local LIQ)/(Dexia Credit Local LOC), 0.460%, 10/7/2010 | 11,675,000 |
| | TOTAL | 119,780,000 |
| | New York – 0.6% | |
| 4,780,000 | | Nassau County, NY IDA, (Series 2007) Weekly VRDNs (Jade Corp.)/(Wilmington Trust Co. LOC), 2.750%, 10/7/2010 | 4,780,000 |
| 14,740,000 | | New York City, NY Transitional Finance Authority, New York City Recovery Bonds (2003 Subseries 2-A) Daily VRDNs (Dexia Credit Local LIQ), 0.300%, 10/1/2010 | 14,740,000 |
| | TOTAL | 19,520,000 |
| | North Carolina – 0.8% | |
| 2,900,000 | | Chatham, NC Industrial Facilities & Pollution Control Funding Authority, (Series 2001) Weekly VRDNs (Townsends, Inc.)/(Wilmington Trust Co. LOC), 2.740%, 10/7/2010 | 2,900,000 |
| 14,335,000 | 3,4 | North Carolina Eastern Municipal Power Agency, (PT-4112) Weekly VRDNs (Dexia Credit Local LIQ)/(Dexia Credit Local LOC), 0.470%, 10/7/2010 | 14,335,000 |
| 8,180,000 | | North Carolina Medical Care Commission, (Series 2007) Daily VRDNs (Randolph Hospital)/(Bank of America N.A. LOC), 0.320%, 10/1/2010 | 8,180,000 |
| | TOTAL | 25,415,000 |
| | Ohio – 0.4% | |
| 9,000,000 | | Clinton County, OH Hospital Authority, (Series 2005) Weekly VRDNs (Clinton Memorial Hospital)/(Fifth Third Bank, Cincinnati LOC), 0.440%, 10/1/2010 | 9,000,000 |
| 4,385,000 | | Evendale, OH, Tax Increment Revenue Bonds (Series 2009) Weekly VRDNs (Evendale Commons Ltd.)/(Fifth Third Bank, Cincinnati LOC), 0.420%, 10/7/2010 | 4,385,000 |
| | TOTAL | 13,385,000 |
Annual Shareholder Report36
Principal
Amount | | | Value |
| | Oklahoma – 0.0% | |
| $1,000,000 | | Garfield County, OK Industrial Authority Pollution Control, (Series 1995-A) Weekly VRDNs (Oklahoma Gas and Electric Co.), 0.430%, 10/6/2010 | 1,000,000 |
| | Pennsylvania – 0.4% | |
| 5,105,000 | 3,4 | Allegheny County, PA Airport Authority, (PT-4304) Weekly VRDNs (Dexia Credit Local LIQ)/(Dexia Credit Local LOC), 0.540%, 10/7/2010 | 5,105,000 |
| 2,170,000 | | Chester County, PA IDA, (Series A of 2000) Weekly VRDNs (Devault Packing Co., Inc.)/(Wilmington Trust Co. LOC), 2.780%, 10/7/2010 | 2,170,000 |
| 6,305,000 | | Pennsylvania State Higher Education Facilities Authority, (Series 2007B) Weekly VRDNs (La Salle University)/(Citizens Bank of Pennsylvania LOC), 0.450%, 10/6/2010 | 6,305,000 |
| | TOTAL | 13,580,000 |
| | Puerto Rico – 0.7% | |
| 15,945,000 | 3,4 | Puerto Rico Highway and Transportation Authority, (PT-3189) Weekly VRDNs (Dexia Credit Local LIQ)/(Dexia Credit Local LOC), 0.460%, 10/7/2010 | 15,945,000 |
| 5,320,000 | 3,4 | Puerto Rico Municipal Finance Agency, (PT-3326) Weekly VRDNs (Dexia Credit Local LIQ)/(Dexia Credit Local LOC), 0.460%, 10/7/2010 | 5,320,000 |
| | TOTAL | 21,265,000 |
| | South Carolina – 0.2% | |
| 7,080,000 | | Hampton County, SC, (Series 2007) Weekly VRDNs (Carolina Soya LLC)/(Wells Fargo Bank, N.A. LOC), 0.420%, 10/7/2010 | 7,080,000 |
| | Tennessee – 0.8% | |
| 6,400,000 | | Dickson County, TN IDB, (Series 1997) Weekly VRDNs (Jackson Foundation)/(SunTrust Bank LOC), 0.670%, 10/6/2010 | 6,400,000 |
| 2,000,000 | | Jackson, TN IDB, (Series 1999) Weekly VRDNs (Bobrick Washroom Equipment)/(Regions Bank, Alabama LOC), 1.130%, 10/7/2010 | 2,000,000 |
| 4,870,000 | | Metropolitan Government Nashville & Davidson County, TN HEFA, (Series 2009) Weekly VRDNs (Meharry Medical College)/(Fifth Third Bank, Cincinnati LOC), 0.440%, 10/1/2010 | 4,870,000 |
| 6,070,000 | | Metropolitan Nashville, TN Airport Authority, (Series 2003) Weekly VRDNs (SunTrust Bank LOC), 0.670%, 10/6/2010 | 6,070,000 |
| 4,855,000 | | Springfield, TN Health & Educational Facilities Board, (Series 2008) Weekly VRDNs (NorthCrest Medical Center)/(Regions Bank, Alabama LOC), 1.080%, 10/7/2010 | 4,855,000 |
| | TOTAL | 24,195,000 |
| | Texas – 3.7% | |
| 20,000,000 | | Gulf Coast, TX Waste Disposal Authority, Pollution Control Refunding Revenue Bonds (Series 1992) Daily VRDNs (BP Products North America, Inc.)/(GTD by BP PLC), 0.350%, 10/1/2010 | 20,000,000 |
| 8,000,000 | | Gulf Coast, TX Waste Disposal Authority, Solid Waste Disposal Revenue Bonds (Series 1999) Weekly VRDNs (Air Products & Chemicals, Inc.), 0.530%, 10/6/2010 | 8,000,000 |
Annual Shareholder Report37
Principal
Amount | | | Value |
| $11,000,000 | | Harris County, TX Education Facilities Finance Corp., (Series 2008E) Daily VRDNs (Young Men's Christian Association of the Greater Houston Area)/(Regions Bank, Alabama LOC), 1.050%, 10/1/2010 | 11,000,000 |
| 57,500,000 | | Oakbend, TX HFDC, (Series 2008) Daily VRDNs (Oakbend Medical Center)/(Regions Bank, Alabama LOC), 0.760%, 10/1/2010 | 57,500,000 |
| 5,000,000 | | Port Arthur Navigation District, TX IDC, (Series 2000) Weekly VRDNs (Air Products & Chemicals, Inc.), 0.530%, 10/6/2010 | 5,000,000 |
| 15,000,000 | | Port Arthur Navigation District, TX IDC, (Series 2001) Weekly VRDNs (Air Products & Chemicals, Inc.), 0.530%, 10/6/2010 | 15,000,000 |
| | TOTAL | 116,500,000 |
| | Utah – 0.5% | |
| 15,500,000 | | Salt Lake County, UT Solid Waste Disposal, (Series A) Weekly VRDNs (Kennecott Utah Copper Corp.)/(GTD by Rio Tinto PLC), 1.500%, 10/6/2010 | 15,500,000 |
| | Virginia – 0.7% | |
| 23,000,000 | | Halifax, VA IDA, MMMs, PCR (Series 1992), 1.45% CP (Virginia Electric & Power Co.), Mandatory Tender 10/4/2010 | 23,000,000 |
| | West Virginia – 0.4% | |
| 14,500,000 | | Grant County, WV County Commission, PCRB (Series 1994), 1.00% CP (Virginia Electric & Power Co.), Mandatory Tender 10/21/2010 | 14,500,000 |
| | Wisconsin – 0.1% | |
| 1,630,000 | | Wisconsin State HEFA, (Series 2006A) Weekly VRDNs (Amery Regional Medical Center)/(Fifth Third Bank, Cincinnati LOC), 0.420%, 10/6/2010 | 1,630,000 |
| | TOTAL SHORT-TERM MUNICIPALS
(IDENTIFIED COST $1,179,355,000) | 1,179,355,000 |
| | TOTAL INVESTMENTS — 99.6%
(IDENTIFIED COST $3,146,070,783)6 | 3,166,373,075 |
| | OTHER ASSETS AND LIABILITIES - NET — 0.4%7 | 12,047,130 |
| | TOTAL NET ASSETS — 100% | $3,178,420,205 |
Securities that are subject to the federal alternative minimum tax (AMT) represent 9.7% of the portfolio as calculated based upon total market value (percentage is unaudited).
| 1 | Non-income producing security. |
| 2 | Obligor had filed for bankruptcy. On September 3, 2010, a Notice of Sale and Initial Distribution to Bondholders was received and a portion of the bond was redeemed upon subsequent receipt of the proceeds. The market value of the remaining par was adjusted to reflect the expected value of future cash flows. |
| 3 | Denotes a restricted security that either: (a) cannot be offered for public sale without first being registered, or being able to take advantage of an exemption from registration, under the Securities Act of 1933; or (b) is subject to a contractual restriction on public sales. At September 30, 2010, these restricted securities amounted to $345,838,900, which represented 10.9% of total net assets. |
Annual Shareholder Report38
| 4 | Denotes a restricted security that may be resold without restriction to “qualified institutional buyers” as defined in Rule 144A under the Securities Act of 1933 and that the Fund has determined to be liquid under criteria established by the Fund's Board of Directors (the “Directors”). At September 30, 2010, these liquid restricted securities amounted to $330,850,000, which represented 10.4% of total net assets. |
| 5 | Current rate and next reset date shown for Variable Rate Demand Notes. |
| 6 | The cost of investments for federal tax purposes amounts to $3,146,063,389. |
| 7 | Assets, other than investments in securities, less liabilities. See Statement of Assets and Liabilities. |
Note: The categories of investments are shown as a percentage of total net assets at September 30, 2010.
Various inputs are used in determining the value of the Fund's investments. These inputs are summarized in the three broad levels listed below:
Level 1 — quoted prices in active markets for identical securities
Level 2 — other significant observable inputs (including quoted prices for similar securities, interest rates, prepayment speeds, credit risk, etc.)
Level 3 — significant unobservable inputs (including the Fund's own assumptions in determining the fair value of investments)
The inputs or methodology used for valuing securities are not an indication of the risk associated with investing in those securities.
As of September 30, 2010, all investments of the Fund utilized Level 2 inputs in valuing the Fund's assets carried at fair value.
Annual Shareholder Report39
The following acronyms are used throughout this portfolio:| AMBAC | — American Municipal Bond Assurance Corporation |
| ARS | — Auction Rate Securities |
| BANs | — Bond Anticipation Notes |
| CCD | — Community College District |
| COL | — Collateralized |
| COP | — Certificates of Participation |
| CP | — Commercial Paper |
| CSD | — Central School District |
| EDA | — Economic Development Authority |
| EDFA | — Economic Development Finance Authority |
| FGIC | — Financial Guaranty Insurance Company |
| GO | — General Obligation |
| GTD | — Guaranteed |
| HDA | — Hospital Development Authority |
| HEFA | — Health and Education Facilities Authority |
| HFA | — Housing Finance Authority |
| HFDC | — Health Facility Development Corporation |
| IDA | — Industrial Development Authority |
| IDB | — Industrial Development Bond |
| IDC | — Industrial Development Corporation |
| IDRBs | — Industrial Development Revenue Bonds |
| IFA | — Industrial Finance Authority |
| INS | — Insured |
| ISD | — Independent School District |
| LID | — Local Improvement District |
| LIQ | — Liquidity Agreement |
| LOC(s) | — Letter(s) of Credit |
| LO | — Limited Obligation |
| LT | — Limited Tax |
| MFH | — Multi-Family Housing |
| MMMs | — Money Market Municipals |
| PCFA | — Pollution Control Finance Authority |
| PCR | — Pollution Control Revenue |
| PCRBs | — Pollution Control Revenue Bonds |
| PRF | — Prerefunded |
| RANs | — Revenue Anticipation Notes |
| SID | — Special Improvement District |
| TANs | — Tax Anticipation Notes |
| TOBs | — Tender Option Bonds |
| TRANs | — Tax and Revenue Anticipation Notes |
| USD | — Unified School District |
| UT | — Unlimited Tax |
| VRDNs | — Variable Rate Demand Notes |
See Notes which are an integral part of the Financial Statements
Annual Shareholder Report40
Statement of Assets and Liabilities
September 30, 2010
| Assets: | | |
| Total investments in securities, at value (identified cost $3,146,070,783) | | $3,166,373,075 |
| Cash | | 100,743 |
| Income receivable | | 18,748,952 |
| Receivable for investments sold | | 33,556,233 |
| Receivable for shares sold | | 38,263,563 |
| TOTAL ASSETS | | 3,257,042,566 |
| Liabilities: | | |
| Payable for investments purchased | $64,539,800 | |
| Payable for shares redeemed | 12,256,919 | |
| Income distribution payable | 742,226 | |
| Payable for Directors'/Trustees' fees | 1,357 | |
| Payable for distribution services fee (Note 5) | 321,687 | |
| Payable for shareholder services fee (Note 5) | 415,162 | |
| Accrued expenses | 345,210 | |
| TOTAL LIABILITIES | | 78,622,361 |
| Net assets for 316,432,340 shares outstanding | | $3,178,420,205 |
| Net Assets Consist of: | | |
| Paid-in capital | | $3,163,811,828 |
| Net unrealized appreciation of investments | | 20,302,292 |
| Accumulated net realized loss on investments | | (5,693,946) |
| Undistributed net investment income | | 31 |
| TOTAL NET ASSETS | | $3,178,420,205 |
| Net Asset Value, Offering Price and Redemption Proceeds Per Share | | |
| Institutional Shares: | | |
| $1,195,878,423 ÷ 119,057,910 shares outstanding, $0.001 par value, 500,000,000 shares authorized | | $10.04 |
| Offering price per share | | $10.04 |
| Redemption proceeds per share | | $10.04 |
| Class A Shares: | | |
| $1,982,541,782 ÷ 197,374,430 shares outstanding, $0.001 par value, 500,000,000 shares authorized | | $10.04 |
| Offering price per share (100/98.00 of $10.04) | | $10.24 |
| Redemption proceeds per share | | $10.04 |
See Notes which are an integral part of the Financial Statements
Annual Shareholder Report41
Statement of Operations
Year Ended September 30, 2010
| Investment Income: | | | |
| Interest | | | $47,235,638 |
| Expenses: | | | |
| Investment adviser fee (Note 5) | | $20,077,479 | |
| Administrative personnel and services fee (Note 5) | | 2,609,387 | |
| Custodian fees | | 113,764 | |
| Transfer and dividend disbursing agent fees and expenses | | 271,374 | |
| Directors'/Trustees' fees | | 31,298 | |
| Auditing fees | | 23,530 | |
| Legal fees | | 6,881 | |
| Portfolio accounting fees | | 237,597 | |
| Distribution services fee — Class A Shares (Note 5) | | 5,778,602 | |
| Shareholder services fee — Class A Shares (Note 5) | | 5,769,720 | |
| Account administration fee — Class A Shares | | 8,882 | |
| Share registration costs | | 371,506 | |
| Printing and postage | | 69,574 | |
| Insurance premiums | | 14,891 | |
| Taxes | | 282,222 | |
| Miscellaneous | | 11,729 | |
| TOTAL EXPENSES | | 35,678,436 | |
| Waivers (Note 5): | | | |
| Waiver of investment adviser fee | $(12,182,582) | | |
| Waiver of administrative personnel and services fee | (62,893) | | |
| Waiver of distribution services fee — Class A Shares | (1,155,720) | | |
| TOTAL WAIVERS | | (13,401,195) | |
| Net expenses | | | 22,277,241 |
| Net investment income | | | 24,958,397 |
| Realized and Unrealized Gain on Investments: | | | |
| Net realized gain on investments | | | 37,764 |
| Net change in unrealized appreciation of investments | | | 8,273,291 |
| Net realized and unrealized gain on investments | | | 8,311,055 |
| Change in net assets resulting from operations | | | $33,269,452 |
See Notes which are an integral part of the Financial Statements
Annual Shareholder Report42
Statement of Changes in Net Assets
| Year Ended September 30 | 2010 | 2009 |
| Increase (Decrease) in Net Assets | | |
| Operations: | | |
| Net investment income | $24,958,397 | $28,412,243 |
| Net realized gain (loss) on investments | 37,764 | (1,405,085) |
| Net change in unrealized appreciation/depreciation of investments | 8,273,291 | 15,979,467 |
| CHANGE IN NET ASSETS RESULTING FROM OPERATIONS | 33,269,452 | 42,986,625 |
| Distributions to Shareholders: | | |
| Distributions from net investment income | | |
| Institutional Shares | (10,976,066) | (8,320,726) |
| Class A Shares | (13,980,363) | (20,089,793) |
| CHANGE IN NET ASSETS RESULTING FROM DISTRIBUTIONS TO SHAREHOLDERS | (24,956,429) | (28,410,519) |
| Share Transactions: | | |
| Proceeds from sale of shares | 2,866,869,326 | 3,823,621,229 |
| Net asset value of shares issued to shareholders in payment of distributions declared | 18,269,508 | 21,677,679 |
| Cost of shares redeemed | (3,133,789,732) | (1,202,373,304) |
| CHANGE IN NET ASSETS RESULTING FROM SHARE TRANSACTIONS | (248,650,898) | 2,642,925,604 |
| Change in net assets | (240,337,875) | 2,657,501,710 |
| Net Assets: | | |
| Beginning of period | 3,418,758,080 | 761,256,370 |
| End of period (including undistributed net investment income of $31 and $1,027, respectively) | $3,178,420,205 | $3,418,758,080 |
See Notes which are an integral part of the Financial Statements
Annual Shareholder Report43
Notes to Financial Statements
September 30, 2010
1. ORGANIZATION
Federated Fixed Income Securities, Inc. (the “Corporation”) is registered under the Investment Company Act of 1940, as amended (the “Act”), as an open-end management investment company. The Corporation consists of two portfolios. The financial statements included herein are only those of Federated Municipal Ultrashort Fund (the “Fund”), a diversified portfolio. The financial statements of the other portfolios are presented separately. The assets of each portfolio are segregated and a shareholder's interest is limited to the portfolio in which shares are held. Each portfolio pays its own expenses. The Fund offers two classes of shares: Institutional Shares and Class A Shares. All shares of the Fund have equal rights with respect to voting, except on class-specific matters. The financial highlights of the Institutional Shares are presented separately. The investment objective of the Fund is to provide current income exempt from federal regular income tax. Interest income from the Fund's investments may be subject to the federal AMT for individuals and corporations and state and local taxes.
2. SIGNIFICANT ACCOUNTING POLICIES
The following is a summary of significant accounting policies consistently followed by the Fund in the preparation of its financial statements. These policies are in conformity with U.S. generally accepted accounting principles (GAAP).
Investment Valuation
In calculating its net asset value (NAV), the Fund generally values investments as follows:
- Fixed-income securities acquired with remaining maturities greater than 60 days are fair valued using price evaluations provided by a pricing service approved by the Directors.
- Fixed-income securities acquired with remaining maturities of 60 days or less are valued at their cost (adjusted for the accretion of any discount or amortization of any premium).
- Shares of other mutual funds are valued based upon their reported NAVs.
- Derivative contracts listed on exchanges are valued at their reported settlement or closing price.
- Over-the-counter (OTC) derivative contracts are fair valued using price evaluations provided by a pricing service approved by the Directors.
If the Fund cannot obtain a price or price evaluation from a pricing service for an investment, the Fund may attempt to value the investment based upon the mean of bid and asked quotations or fair value the investment based on price evaluations, from one or more dealers. If any price, quotation, price evaluation or other pricing source is not readily available when the NAV is calculated, the Fund uses the fair value of the investment determined in accordance with the procedures described below. There can be no assurance that the Fund could purchase or sell an investment at the price used to calculate the Fund's NAV.
Fair Valuation and Significant Events Procedures
The Directors have authorized the use of pricing services to provide evaluations of the current fair value of certain investments for purposes of calculating the NAV. Factors considered by pricing services in evaluating an investment include the yields or prices of investments of comparable quality, coupon, maturity, call rights and other potential prepayments, terms and type, reported transactions, indications as to values from dealers and general market conditions. Some pricing services provide a single price evaluation reflecting the bid-side of the market for an investment (a “bid” evaluation). Other pricing services offer both bid Annual Shareholder Report44
evaluations and price evaluations indicative of a price between the prices bid and asked for the investment (a “mid” evaluation). The Fund normally uses bid evaluations for U.S. Treasury and Agency securities and municipal securities. The Fund normally uses mid evaluations for other types of fixed-income securities and OTC derivative contracts. In the event that market quotations and price evaluations are not available for an investment, the fair value of the investment is determined in accordance with procedures adopted by the Directors.The Directors also have adopted procedures requiring an investment to be priced at its fair value whenever the Adviser determines that a significant event affecting the value of the investment has occurred between the time as of which the price of the investment would otherwise be determined and the time as of which the NAV is computed. An event is considered significant if there is both an affirmative expectation that the investment's value will change in response to the event and a reasonable basis for quantifying the resulting change in value. Examples of significant events that may occur after the close of the principal market on which a security is traded, or after the time of a price evaluation provided by a pricing service or a dealer, include:
- With respect to price evaluations of fixed-income securities determined before the close of regular trading on the NYSE, actions by the Federal Reserve Open Market Committee and other significant trends in U.S. fixed-income markets;
- Political or other developments affecting the economy or markets in which an issuer conducts its operations or its securities are traded; and
- Announcements concerning matters such as acquisitions, recapitalizations, litigation developments, a natural disaster affecting the issuer's operations or regulatory changes or market developments affecting the issuer's industry.
The Fund may seek to obtain more current quotations or price evaluations from alternative pricing sources. If a reliable alternative pricing source is not available, the Fund will determine the fair value of the investment using another method approved by the Directors.
Investment Income, Gains and Losses, Expenses and Distributions
Investment transactions are accounted for on a trade-date basis. Realized gains and losses from investment transactions are recorded on an identified-cost basis. Interest income and expenses are accrued daily. Distributions to shareholders are recorded on the ex-dividend date. Distributions of net investment income are declared daily and paid monthly. Non-cash dividends included in dividend income, if any, are recorded at fair value. Investment income, realized and unrealized gains and losses and certain fund-level expenses are allocated to each class based on relative average daily net assets, except that each class may bear certain expenses unique to that class such as account administration, distribution services and shareholder services fees. Dividends are declared separately for each class. No class has preferential dividend rights; differences in per share dividend rates are generally due to differences in separate class expenses.
Premium and Discount Amortization
All premiums and discounts on fixed-income securities are amortized/accreted for financial statement purposes.
Federal Taxes
It is the Fund's policy to comply with the Subchapter M provision of the Internal Revenue Code (the “Code”) and to distribute to shareholders each year substantially all of its income. Accordingly, no provision for federal income tax is necessary. As of and during the year ended September 30, 2010, the Fund did not have a liability for any uncertain tax positions. The Fund Annual Shareholder Report45
recognizes interest and penalties, if any, related to tax liabilities as income tax expense in the Statement of Operations. As of September 30, 2010, tax years 2007 through 2010 remain subject to examination by the Fund's major tax jurisdictions, which include the United States of America, the state of Maryland and the Commonwealth of Pennsylvania.Other Taxes
As an open-end management investment company incorporated in the state of Maryland but domiciled in the Commonwealth of Pennsylvania, the Fund is subject to the Pennsylvania Franchise Tax. This franchise tax is assessed annually on the value of the Fund, as represented by average net assets for the tax year.
When-Issued and Delayed Delivery Transactions
The Fund may engage in when-issued or delayed delivery transactions. The Fund records when-issued securities on the trade date and maintains security positions such that sufficient liquid assets will be available to make payment for the securities purchased. Securities purchased on a when-issued or delayed delivery basis are marked to market daily and begin earning interest on the settlement date. Losses may occur on these transactions due to changes in market conditions or the failure of counterparties to perform under the contract.
Restricted Securities
The Fund may purchase securities which are considered restricted. Restricted securities are securities that either: (a) cannot be offered for public sale without first being registered, or being able to take advantage of an exemption from registration, under the Securities Act of 1933; or (b) are subject to contractual restrictions on public sales. In some cases, when a security cannot be offered for public sale without first being registered, the issuer of the restricted security has agreed to register such securities for resale, at the issuer's expense, either upon demand by the Fund or in connection with another registered offering of the securities. Many such restricted securities may be resold in the secondary market in transactions exempt from registration. Restricted securities may be determined to be liquid under criteria established by the Directors. The Fund will not incur any registration costs upon such resales. The Fund's restricted securities are valued at the price provided by dealers in the secondary market or, if no market prices are available, at the fair value as determined in accordance with procedures established by and under the general supervision of the Directors.
Additional information on restricted securities, excluding securities purchased under Rule 144A, if applicable, that have been deemed liquid by the Directors, held at September 30, 2010, is as follows:
| Security | Acquisition
Date | Acquisition
Cost | Market
Value |
| Washington State EDFA, Solid Waste Disposal Revenue Bonds (Series 2005D), 1.75% TOBs (Waste Management, Inc.), Optional Tender 9/1/2011 | 2/25/2010 | $7,000,000 | $6,994,820 |
| Washington State EDFA, Solid Waste Disposal Revenue Bonds (Series 2008), 1.75% TOBs (Waste Management, Inc.), Optional Tender 9/1/2011 | 2/25/2010 | $8,000,000 | $7,994,080 |
Annual Shareholder Report46
Other
The preparation of financial statements in conformity with GAAP requires management to make estimates and assumptions that affect the amounts of assets, liabilities, expenses and revenues reported in the financial statements. Actual results could differ from those estimated.
3. CAPITAL STOCK
The following tables summarize capital stock activity:
| Year Ended September 30 | 2010 | 2009 |
| Institutional Shares: | Shares | Amount | Shares | Amount |
| Shares sold | 123,000,173 | $1,234,135,918 | 93,260,398 | $931,780,305 |
| Shares issued to shareholders in payment of distributions declared | 568,441 | 5,704,567 | 427,808 | 4,269,296 |
| Shares redeemed | (91,860,343) | (921,660,066) | (25,973,055) | (259,253,515) |
NET CHANGE RESULTING
FROM INSTITUTIONAL SHARE TRANSACTIONS | 31,708,271 | $318,180,419 | 67,715,151 | $676,796,086 |
| Year Ended September 30 | 2010 | 2009 |
| Class A Shares: | Shares | Amount | Shares | Amount |
| Shares sold | 162,773,864 | $1,632,733,408 | 289,473,031 | $2,891,840,924 |
| Shares issued to shareholders in payment of distributions declared | 1,252,180 | 12,564,941 | 1,744,983 | 17,408,383 |
| Shares redeemed | (220,498,732) | (2,212,129,666) | (94,495,438) | (943,119,789) |
NET CHANGE RESULTING
FROM CLASS A SHARE TRANSACTIONS | (56,472,688) | $(566,831,317) | 196,722,576 | $1,966,129,518 |
NET CHANGE RESULTING
FROM TOTAL FUND SHARE TRANSACTIONS | (24,764,417) | $(248,650,898) | 264,437,727 | $2,642,925,604 |
4. FEDERAL TAX INFORMATION
The timing and character of income and capital gain distributions are determined in accordance with income tax regulations, which may differ from GAAP. These differences are due to differing treatments for expiration of capital loss carryforwards and discount accretion/premium amortization on debt securities.
For the year ended September 30, 2010, permanent differences identified and reclassified among the components of net assets were as follows:
| Increase (Decrease) |
| Paid-In Capital | Undistributed
Net Investment
Income (Loss) | Accumulated
Net Realized
Gain (Loss) |
| $(541) | $(2,964) | $3,505 |
Net investment income (loss), net realized gains (losses), and net assets were not affected by this reclassification.
Annual Shareholder Report47
The tax character of distributions as reported on the Statement of Changes in Net Assets for the years ended September 30, 2010 and 2009, was as follows: | 2010 | 2009 |
| Tax-exempt income | $24,956,429 | $28,392,419 |
| Ordinary income | $ — | $18,100 |
As of September 30, 2010, the components of distributable earnings on a tax basis were as follows:
| Undistributed tax-exempt income | $31 |
| Net unrealized appreciation | $20,309,686 |
| Capital loss carryforwards and deferrals | $(5,701,340) |
The difference between book-basis and tax-basis net unrealized appreciation/depreciation is attributable to differing treatments for discount accretion/premium amortization on debt securities.
At September 30, 2010, the cost of investments for federal tax purposes was $3,146,063,389. The net unrealized appreciation of investments for federal tax purposes was $20,309,686. This consists of net unrealized appreciation from investments for those securities having an excess of value over cost of $21,869,562 and net unrealized depreciation from investments for those securities having an excess of cost over value of $1,559,876.
At September 30, 2010, the Fund had a capital loss carryforward of $5,605,005 which will reduce the Fund's taxable income arising from future net realized gains on investments, if any, to the extent permitted by the Code and thus will reduce the amount of distributions to shareholders which would otherwise be necessary to relieve the Fund of any liability for federal income tax. Pursuant to the Code, such capital loss carryforward will expire as follows:
| Expiration Year | Expiration Amount |
| 2011 | $353,600 |
| 2012 | $59,924 |
| 2013 | $884,421 |
| 2014 | $978,739 |
| 2015 | $631,311 |
| 2016 | $148,172 |
| 2017 | $1,306,058 |
| 2018 | $1,242,780 |
Capital loss carryforwards of $541 expired during the year ended September 30, 2010.
Under current tax regulations, capital losses realized after October 31 may be deferred and treated as occurring on the first day of the following fiscal year. As of September 30, 2010, for federal income tax purposes, post-October losses of $96,335 were deferred to October 1, 2010.
Annual Shareholder Report48
5. INVESTMENT ADVISER FEE AND OTHER TRANSACTIONS WITH AFFILIATESInvestment Adviser Fee
Federated Investment Management Company is the Fund's investment adviser (the “Adviser”). The advisory agreement between the Fund and the Adviser provides for an annual fee equal to 0.60% of the Fund's average daily net assets. Subject to the terms described in the Expense Limitation note, the Adviser may voluntarily choose to waive any portion of its fee. For the year ended September 30, 2010, the Adviser voluntarily waived $12,182,582 of its fee.
Administrative Fee
Federated Administrative Services (FAS), under the Administrative Services Agreement, provides the Fund with administrative personnel and services. The fee paid to FAS is based on the average aggregate daily net assets of certain Federated funds as specified below:
| Administrative Fee | Average Aggregate Daily Net Assets
of the Federated Funds |
| 0.150% | on the first $5 billion |
| 0.125% | on the next $5 billion |
| 0.100% | on the next $10 billion |
| 0.075% | on assets in excess of $20 billion |
The administrative fee received during any fiscal year shall be at least $150,000 per portfolio and $40,000 per each additional class of Shares. Subject to the terms described in the Expense Limitation note, FAS may voluntarily choose to waive any portion of its fee. For the year ended September 30, 2010, the net fee paid to FAS was 0.076% of average daily net assets of the Fund. FAS waived $62,893 of its fee.
Distribution Services Fee
The Fund has adopted a Distribution Plan (the “Plan”) pursuant to Rule 12b-1 under the Act. Under the terms of the Plan, the Fund will compensate Federated Securities Corp. (FSC), the principal distributor, from the daily net assets of the Fund's Class A Shares to finance activities intended to result in the sale of these shares. The Plan provides that the Fund may incur distribution expenses at 0.25% of average daily net assets, annually, to compensate FSC. Subject to the terms described in the Expense Limitation note, FSC may voluntarily choose to waive any portion of its fee. For the year ended September 30, 2010, FSC voluntarily waived $1,155,720 of its fee. When FSC receives fees, it may pay some or all of them to financial intermediaries whose customers purchase shares. For the year ended September 30, 2010, FSC retained $2,333,975 of fees paid by the Fund.
Sales Charges
Front-end sales charges and contingent deferred sales charges (CDSC) do not represent expenses of the Fund. They are deducted from the proceeds of sales of Fund shares prior to investment or from redemption proceeds prior to remittance, as applicable. For the year ended September 30, 2010, FSC did not retain any sales charges from the sale of Class A Shares.
Annual Shareholder Report49
Shareholder Services FeeThe Fund may pay fees (“Service Fees”) up to 0.25% of the average daily net assets of the Fund's Class A Shares to financial intermediaries or to Federated Shareholder Services Company (FSSC) for providing services to shareholders and maintaining shareholder accounts. Subject to the terms described in the Expense Limitation note, FSSC may voluntarily reimburse the Fund for Service Fees. For the year ended September 30, 2010, FSSC received $4,276 of fees paid by the Fund.
Interfund Transactions
During the year ended September 30, 2010, the Fund engaged in purchase and sale transactions with funds that have a common investment adviser (or affiliated investment advisers), common Directors/Trustees and/or common Officers. These purchase and sale transactions complied with Rule 17a-7 under the Act and amounted to $1,474,640,000 and $1,985,590,000, respectively.
Expense Limitation
The Adviser and its affiliates (which may include FSC, FAS and FSSC) have voluntarily agreed to waive their fees and/or reimburse expenses so that the total annual fund operating expenses (as shown in the financial highlights) paid by the Fund's Institutional Shares and Class A Shares (after the voluntary waivers and reimbursements) will not exceed 0.35% and 0.80% (the “Fee Limit”), respectively, through the later of (the “Termination Date”): (a) November 30, 2011; or (b) the date of the Fund's next effective Prospectus. While the Adviser and its affiliates currently do not anticipate terminating or increasing these arrangements prior to the Termination Date, these arrangements may only be terminated or the Fee Limit increased prior to the Termination Date with the agreement of the Directors.
General
Certain Officers and Directors of the Fund are Officers and Directors or Trustees of the above companies.
6. Investment TRANSACTIONS
Purchases and sales of investments, excluding long-term U.S. government securities and short-term obligations, for the year ended September 30, 2010, were as follows:
| Purchases | $1,336,412,965 |
| Sales | $635,242,957 |
7. LINE OF CREDIT
The Fund participates in a $100,000,000 unsecured, uncommitted revolving line of credit (LOC) agreement with PNC Bank. The LOC was made available for extraordinary or emergency purposes, primarily for financing redemption payments. Borrowings are charged interest at a rate offered to the Fund by PNC Bank at the time of the borrowing. As of September 30, 2010, there were no outstanding loans. During the year ended September 30, 2010, the Fund did not utilize the LOC.
Annual Shareholder Report50
8. INTERFUND LENDINGPursuant to an Exemptive Order issued by the Securities and Exchange Commission, the Fund, along with other funds advised by subsidiaries of Federated Investors, Inc., may participate in an interfund lending program. This program provides an alternative credit facility allowing the Fund to borrow from other participating affiliated funds. As of September 30, 2010, there were no outstanding loans. During the year ended September 30, 2010, the program was not utilized.
9. Legal Proceedings
Since February 2004, Federated Investors, Inc. and related entities (collectively, “Federated”), have been named as defendants in several lawsuits that are now pending in the United States District Court for the Western District of Pennsylvania. The lawsuits have been consolidated into a single action alleging excessive advisory fees involving one of the Federated-sponsored mutual funds (“Federated Funds”). Federated and its counsel have been defending this litigation. Additional lawsuits based upon similar allegations may be filed in the future. The potential impact of these lawsuits, all of which seek monetary damages, attorneys' fees and expenses, and future potential similar suits is uncertain. Although we do not believe that these lawsuits will have a material adverse effect on the Federated Funds, there can be no assurance that these suits, ongoing adverse publicity and/or other developments resulting from the allegations in these matters will not result in increased redemptions, or reduced sales, of shares of the Federated Funds or other adverse consequences for the Federated Funds.
10. CHANGE IN INDEPENDENT REGISTERED pUBLIC ACCOUNTING FIRM
On May 14, 2010, the Fund's Directors, upon the recommendation of the Audit Committee, appointed KPMG LLP (KPMG) as the Fund's independent registered public accounting firm. On the same date, the Fund's previous independent registered public accounting firm, Ernst & Young LLP (E&Y) resigned. The previous reports issued by E&Y on the Fund's financial statements for the fiscal years ended September 30, 2008 and September 30, 2009, contained no adverse opinion or disclaimer of opinion nor were they qualified or modified as to uncertainty, audit scope or accounting principles. During the Fund's fiscal years ended September 30, 2008 and September 30, 2009, and the interim period commencing October 1, 2009 and ending May 14, 2010: (i) there were no disagreements with E&Y on any matter of accounting principles or practices, financial statement disclosure or auditing scope or procedure, which disagreements, if not resolved to the satisfaction of E&Y, would have caused it to make reference to the subject matter of the disagreements in connection with its reports on the financial statements for such years; and (ii) there were no reportable events of the kind described in Item 304(a) (1) (v) of Regulation S-K under the Securities Exchange Act of 1934, as amended.
As indicated above, the Fund has appointed KPMG as the independent registered public accounting firm to audit the Fund's financial statements for the fiscal year ending September 30, 2010. During the Fund's fiscal years ended September 30, 2008 and September 30, 2009 and the interim period commencing October 1, 2009 and ending May 14, 2010, neither the Fund nor anyone on its behalf has consulted KPMG on items which: (i) concerned the application of accounting principles to a specified transaction, either completed or proposed, or the type of audit opinion that might be rendered on the Fund's financial statements; or (ii) concerned the subject of a disagreement (as defined in paragraph (a) (1) (iv) of Item 304 of Regulation S-K) or reportable events (as described in paragraph (a) (1) (v) of said Item 304).
Annual Shareholder Report51
11. Subsequent eventsManagement has evaluated subsequent events through the date the financial statements were issued, and determined that no events have occurred that require additional disclosure.
12. FEDERAL TAX INFORMATION (UNAUDITED)
For the year ended September 30, 2010, 100.0% of the distributions from net investment income is exempt from federal income tax, other than the federal AMT.
Annual Shareholder Report52
Report of Independent Registered Public Accounting Firm
TO THE BOARD OF TRUSTEES OF THE FEDERATED FIXED INCOME series, inc., AND SHAREHOLDERS OF Federated MunicipAl ultrashort fund:
We have audited the accompanying statement of assets and liabilities, including the portfolio of investments, of the Federated Municipal Ultrashort Fund (the “Fund”), a portfolio of Federated Fixed Income Series, Inc., as of September 30, 2010, and the related statement of operations, the statements of changes in net assets, and the financial highlights for the year then ended. These financial statements and financial highlights are the responsibility of the Fund's management. Our responsibility is to express an opinion on these financial statements and financial highlights based on our audit. The statement of changes in net assets for the year ended September 30, 2009 and the financial highlights for the periods presented prior to October 1, 2009, were audited by other independent registered public accountants whose report thereon dated November 24, 2009, expressed an unqualified opinion on those statements.
We conducted our audit in accordance with the standards of the Public Company Accounting Oversight Board (United States). Those standards require that we plan and perform the audit to obtain reasonable assurance about whether the financial statements and financial highlights are free of material misstatement. An audit includes examining, on a test basis, evidence supporting the amounts and disclosures in the financial statements. Our procedures included confirmation of securities owned as of September 30, 2010 by correspondence with the custodian, transfer agent and brokers or by other appropriate auditing procedures. An audit also includes assessing the accounting principles used and significant estimates made by management, as well as evaluating the overall financial statement presentation. We believe that our audit provides a reasonable basis for our opinion.
In our opinion, the financial statements and financial highlights referred to above present fairly, in all material respects, the financial position of the Federated Municipal Ultrashort Fund, as of September 30, 2010, and the results of its operations, the changes in net assets and the financial highlights for the year then ended, in conformity with U.S. generally accepted accounting principles.
Boston, Massachusetts
November 22, 2010
Annual Shareholder Report53
Board of Directors and Corporation Officers
The Board of Directors is responsible for managing the Corporation business affairs and for exercising all the Corporation powers except those reserved for the shareholders. The following tables give information about each Director and the senior officers of the Fund. Where required, the tables separately list Directors who are “interested persons” of the Fund (i.e., “Interested” Directors) and those who are not (i.e., “Independent” Directors). Unless otherwise noted, the address of each person listed is Federated Investors Tower, 1001 Liberty Avenue, Pittsburgh, PA 15222. The address of all Independent Directors listed is 4000 Ericsson Drive, Warrendale, PA 15086-7561; Attention: Mutual Fund Board. As of December 31, 2009, the Corporation comprised two portfolio(s), and the Federated Fund Family consisted of 43 investment companies (comprising 145 portfolios). Unless otherwise noted, each Officer is elected annually. Unless otherwise noted, each Director oversees all portfolios in the Federated Fund Family and serves for an indefinite term. The Fund's Statement of Additional Information includes additional information about Corporation Directors and is available, without charge and upon request, by calling 1-800-341-7400.
Interested DIRECTORS Background
Name
Birth Date
Positions Held with Corporation
Date Service Began | Principal Occupation(s) for Past Five Years,
Other Directorships Held and Previous Position(s) |
John F. Donahue*
Birth Date: July 28, 1924
Director
Began serving: October 1991 | Principal Occupations: Director or Trustee of the Federated Fund Family; Chairman and Director, Federated Investors, Inc.; Chairman of the Federated Fund Family's Executive Committee.
Previous Positions: Chairman of the Federated Fund Family; Trustee, Federated Investment Management Company; Chairman and Director, Federated Investment Counseling. |
J. Christopher Donahue*
Birth Date: April 11, 1949
PRESIDENT AND Director
Began serving: January 2000 | Principal Occupations: Principal Executive Officer and President of the Federated Fund Family; Director or Trustee of some of the Funds in the Federated Fund Family; President, Chief Executive Officer and Director, Federated Investors, Inc.; Chairman and Trustee, Federated Investment Management Company; Trustee, Federated Investment Counseling; Chairman and Director, Federated Global Investment Management Corp.; Chairman, Federated Equity Management Company of Pennsylvania and Passport Research, Ltd. (investment advisory subsidiary of Federated); Trustee, Federated Shareholder Services Company; Director, Federated Services Company.
Previous Positions: President, Federated Investment Counseling; President and Chief Executive Officer, Federated Investment Management Company, Federated Global Investment Management Corp. and Passport Research, Ltd. |
| * | Family relationships and reasons for “interested” status: John F. Donahue is the father of J. Christopher Donahue; both are “interested” due to their beneficial ownership of shares of Federated Investors, Inc. and the positions they hold with Federated and its subsidiaries. |
Annual Shareholder Report54
INDEPENDENT DIRECTORS Background
Name
Birth Date
Positions Held with Corporation
Date Service Began | Principal Occupation(s) for Past Five Years,
Other Directorships Held, Previous Position(s) and Qualifications |
John T. Conroy, Jr., Ph.D.
Birth Date: June 23, 1937
Director
Began serving: October 1991 | Principal Occupations: Director or Trustee of the Federated Fund Family; Chairman of the Board, Investment Properties Corporation; Partner or Trustee in private real estate ventures in Southwest Florida; Assistant Professor in Theology, Blessed Edmund Rice School for Pastoral Ministry.
Previous Positions: President, Investment Properties Corporation; Senior Vice President, John R. Wood and Associates, Inc., Realtors; President, Naples Property Management, Inc. and Northgate Village Development Corporation.
Qualifications: Business management and director experience. |
Nicholas P. Constantakis, CPA
Birth Date: September 3, 1939
Director
Began serving: February 1998 | Principal Occupation: Director or Trustee of the Federated Fund Family.
Other Directorship Held: Director and Chairman of the Audit Committee, Michael Baker Corporation (architecture, engineering and construction services).
Previous Position: Partner, Andersen Worldwide SC.
Qualifications: Public accounting and director experience. |
John F. Cunningham
Birth Date: March 5, 1943
Director
Began serving: January 1999 | Principal Occupation: Director or Trustee of the Federated Fund Family.
Other Directorships Held: Chairman, President and Chief Executive Officer, Cunningham & Co., Inc. (strategic business consulting); Trustee Associate, Boston College.
Previous Positions: Director, Redgate Communications and EMC Corporation (computer storage systems); Chairman of the Board and Chief Executive Officer, Computer Consoles, Inc.; President and Chief Operating Officer, Wang Laboratories; Director, First National Bank of Boston; Director, Apollo Computer, Inc.
Qualifications: Business management and director experience. |
Maureen Lally-Green
Birth Date: July 5, 1949
Director
Began serving: August 2009 | Principal Occupations: Director or Trustee of the Federated Fund Family; Director, Office of Church Relations, Diocese of Pittsburgh; Adjunct Professor of Law, Duquesne University School of Law.
Other Directorships Held: Trustee, St. Francis University; Director, Ireland Institute of Pittsburgh; Director, UPMC Mercy Hospital; Regent, St. Vincent Seminary; Director, Epilepsy Foundation of Western and Central Pennsylvania; Director, Saint Thomas More Society, Allegheny County; Director, Carlow University.
Previous Position: Pennsylvania Superior Court Judge.
Qualifications: Legal and director experience. |
Annual Shareholder Report55
Name
Birth Date
Positions Held with Corporation
Date Service Began | Principal Occupation(s) for Past Five Years,
Other Directorships Held, Previous Position(s) and Qualifications |
Peter E. Madden
Birth Date: March 16, 1942
Director
Began serving: October 1991 | Principal Occupation: Director or Trustee, and Chairman of the Board of Directors or Trustees, of the Federated Fund Family.
Other Directorship Held: Board of Overseers, Babson College.
Previous Positions: Representative, Commonwealth of Massachusetts General Court; President, Chief Operating Officer and Director, State Street Bank and Trust Company and State Street Corporation (retired); Director, VISA USA and VISA International; Chairman and Director, Massachusetts Bankers Association; Director, Depository Trust Corporation; Director, The Boston Stock Exchange.
Qualifications: Business management, mutual fund services and director experience. |
Charles F. Mansfield, Jr.
Birth Date: April 10, 1945
Director
Began serving: January 1999 | Principal Occupations: Director or Trustee and Chairman of the Audit Committee of the Federated Fund Family; Management Consultant.
Previous Positions: Chief Executive Officer, PBTC International Bank; Partner, Arthur Young & Company (now Ernst & Young LLP); Chief Financial Officer of Retail Banking Sector, Chase Manhattan Bank; Senior Vice President, HSBC Bank USA (formerly, Marine Midland Bank); Vice President, Citibank; Assistant Professor of Banking and Finance, Frank G. Zarb School of Business, Hofstra University; Executive Vice President, DVC Group, Inc. (marketing, communications and technology).
Qualifications: Banking, business management, public accounting and director experience. |
R. James Nicholson
Birth Date: February 4, 1938
Director
Began serving: November 2007 | Principal Occupations: Director or Trustee of the Federated Fund Family; Senior Counsel, Brownstein Hyatt Farber Schrek, P.C.; Former Secretary of the U.S. Dept. of Veterans Affairs; Former U.S. Ambassador to the Holy See; Former Chairman of the Republican National Committee.
Other Directorships Held: Director, Horatio Alger Association; Director, The Daniels Fund.
Previous Positions: Colonel, U.S. Army Reserve; Partner, Calkins, Kramer, Grimshaw and Harring, P.C.; General Counsel, Colorado Association of Housing and Building; Chairman and CEO, Nicholson Enterprises, Inc. (real estate holding company); Chairman and CEO, Renaissance Homes of Colorado.
Qualifications: Legal, government, business management and mutual fund director experience. |
Annual Shareholder Report56
Name
Birth Date
Positions Held with Corporation
Date Service Began | Principal Occupation(s) for Past Five Years,
Other Directorships Held, Previous Position(s) and Qualifications |
Thomas M. O'Neill
Birth Date: June 14, 1951
Director
Began serving: October 2006 | Principal Occupations: Director or Trustee of the Federated Fund Family; Sole Proprietor, Navigator Management Company (investment and strategic consulting).
Other Directorships Held: Board of Overseers, Children's Hospital of Boston; Visiting Committee on Athletics, Harvard College.
Previous Positions: Chief Executive Officer and President, Managing Director and Chief Investment Officer, Fleet Investment Advisors; President and Chief Executive Officer, Aeltus Investment Management, Inc.; General Partner, Hellman, Jordan Management Co., Boston, MA; Chief Investment Officer, The Putnam Companies, Boston, MA; Credit Analyst and Lending Officer, Fleet Bank; Director and Consultant, EZE Castle Software (investment order management software); Director, Midway Pacific (lumber).
Qualifications: Business management, mutual fund, director and investment experience. |
John S. Walsh
Birth Date: November 28, 1957
Director
Began serving: January 1999 | Principal Occupations: Director or Trustee of the Federated Fund Family; President and Director, Heat Wagon, Inc. (manufacturer of construction temporary heaters); President and Director, Manufacturers Products, Inc. (distributor of portable construction heaters); President, Portable Heater Parts, a division of Manufacturers Products, Inc.
Previous Position: Vice President, Walsh & Kelly, Inc.
Qualifications: Business management and director experience. |
James F. Will
Birth Date: October 12, 1938
Director
Began serving: April 2006 | Principal Occupations: Director or Trustee of the Federated Fund Family; formerly, Vice Chancellor and President, Saint Vincent College.
Other Directorships Held: Trustee, Saint Vincent College; Director, Alleghany Corporation; Trustee, Wheeling Jesuit University; Director, Liberty Tire Recycling.
Previous Positions: Chairman, President and Chief Executive Officer, Armco, Inc.; President and Chief Executive Officer, Cyclops Industries; President and Chief Operating Officer, Kaiser Steel Corporation.
Qualifications: Business management, education and director experience. |
Annual Shareholder Report57
OFFICERS
Name
Birth Date
Positions Held with Corporation
Date Service Began | Principal Occupation(s) for Past Five Years
and Previous Position(s) |
John W. McGonigle
Birth Date: October 26, 1938
EXECUTIVE VICE PRESIDENT AND SECRETARY
Began serving: November 1991 | Principal Occupations: Executive Vice President and Secretary of the Federated Fund Family; Vice Chairman, Executive Vice President, Secretary and Director, Federated Investors, Inc.
Previous Positions: Trustee, Federated Investment Management Company and Federated Investment Counseling; Director, Federated Global Investment Management Corp., Federated Services Company and Federated Securities Corp. |
Richard A. Novak
Birth Date: December 25, 1963
TREASURER
Began serving: January 2006 | Principal Occupations: Principal Financial Officer and Treasurer of the Federated Fund Family; Senior Vice President, Federated Administrative Services; Financial and Operations Principal for Federated Securities Corp., Edgewood Services, Inc. and Southpointe Distribution Services, Inc.
Previous Positions: Controller of Federated Investors, Inc.; Vice President, Finance of Federated Services Company; held various financial management positions within The Mercy Hospital of Pittsburgh; Auditor, Arthur Andersen & Co. |
Richard B. Fisher
Birth Date: May 17, 1923
VICE PRESIDENT
Began serving: August 2002 | Principal Occupations: Vice Chairman or Vice President of some of the Funds in the Federated Fund Family; Vice Chairman, Federated Investors, Inc.; Chairman, Federated Securities Corp.
Previous Positions: President and Director or Trustee of some of the Funds in the Federated Fund Family; Executive Vice President, Federated Investors, Inc.; Director and Chief Executive Officer, Federated Securities Corp. |
Brian P. Bouda
Birth Date: February 28, 1947
CHIEF COMPLIANCE OFFICER AND SENIOR VICE PRESIDENT
Began serving: August 2004 | Principal Occupations: Senior Vice President and Chief Compliance Officer of the Federated Fund Family; Vice President and Chief Compliance Officer of Federated Investors, Inc. and Chief Compliance Officer of its subsidiaries. Mr. Bouda joined Federated in 1999 and is a member of the American Bar Association and the State Bar Association of Wisconsin. |
Robert J. Ostrowski
Birth Date: April 26, 1963
CHIEF INVESTMENT OFFICER
Began serving: May 2004 | Principal Occupations: Robert J. Ostrowski joined Federated in 1987 as an Investment Analyst and became a Portfolio Manager in 1990. He was named Chief Investment Officer of taxable fixed-income products in 2004 and also serves as a Senior Portfolio Manager. He has been a Senior Vice President of the Fund's Adviser since 1997. Mr. Ostrowski has received the Chartered Financial Analyst designation. He received his M.S. in Industrial Administration from Carnegie Mellon University. |
Mary Jo Ochson
Birth Date: September 12, 1953
CHIEF INVESTMENT OFFICER
Began serving: May 2004 | Principal Occupations: Mary Jo Ochson was named Chief Investment Officer of tax-exempt, fixed-income products in 2004 and Chief Investment Officer of Tax-Free Money Markets in 2010. She joined Federated in 1982 and has been a Senior Portfolio Manager and a Senior Vice President of the Fund's Adviser since 1996. Ms. Ochson has received the Chartered Financial Analyst designation and holds an M.B.A. in Finance from the University of Pittsburgh. |
Annual Shareholder Report58
Name
Birth Date
Positions Held with Corporation
Date Service Began | Principal Occupation(s) for Past Five Years
and Previous Position(s) |
Joseph M. Balestrino
Birth Date: November 3, 1954
VICE PRESIDENT
Began serving: November 1998 | Principal Occupations: Joseph M. Balestrino is Vice President of the Corporation. Mr. Balestrino joined Federated in 1986 and has been a Senior Portfolio Manager and Senior Vice President of the Fund's Adviser since 1998. He was a Portfolio Manager and a Vice President of the Fund's Adviser from 1995 to 1998. Mr. Balestrino served as a Portfolio Manager and an Assistant Vice President of the Adviser from 1993 to 1995. Mr. Balestrino has received the Chartered Financial Analyst designation and holds a Master's Degree in Urban and Regional Planning from the University of Pittsburgh. |
Jeff A. Kozemchak
Birth Date: January 15, 1960
VICE PRESIDENT
Began serving: November 1998 | Principal Occupations: Jeff A. Kozemchak has been the Fund's Portfolio Manager since October 2000. He is Vice President of the Corporation. Mr. Kozemchak joined Federated in 1987 and has been a Senior Portfolio Manager since 1996 and a Senior Vice President of the Fund's Adviser since 1999. He was a Portfolio Manager until 1996 and a Vice President of the Fund's Adviser from 1993 to 1998. Mr. Kozemchak has received the Chartered Financial Analyst designation and holds an M.S. in Industrial Administration from Carnegie Mellon University in 1987. |
Annual Shareholder Report59
Evaluation and Approval of Advisory Contract - May 2010
Federated Municipal Ultrashort Fund (the “Fund”)
The Fund's Board reviewed the Fund's investment advisory contract at meetings held in May 2010. The Board's decision regarding the contract reflects the exercise of its business judgment on whether to continue the existing arrangements.
In this connection, the Federated funds' Board had previously appointed a Senior Officer, whose duties include specified responsibilities relating to the process by which advisory fees are to be charged to a Federated fund. The Senior Officer has the authority to retain consultants, experts, or staff as may be reasonably necessary to assist in the performance of his duties, reports directly to the Board, and may be terminated only with the approval of a majority of the independent members of the Board. The Senior Officer prepared and furnished to the Board an independent, written evaluation that covered topics discussed below. The Board considered that evaluation, along with other information, in deciding to approve the advisory contract.
During its review of the contract, the Board considered compensation and benefits received by the Adviser. This included the fees received for services provided to the Fund by other entities in the Federated organization and research services (if any) received by the Adviser from brokers that execute Federated fund trades, as well as advisory fees. The Board is also familiar with and considered judicial decisions concerning allegedly excessive investment advisory fees, which have indicated that the following factors may be relevant to an Adviser's fiduciary duty with respect to its receipt of compensation from a fund: the nature and quality of the services provided by the Adviser, including the performance of the fund; the Adviser's cost of providing the services; the extent to which the Adviser may realize “economies of scale” as a fund grows larger; any indirect benefits that may accrue to the Adviser and its affiliates as a result of the Adviser's relationship with a fund; performance and expenses of comparable funds; and the extent to which the independent Board members are fully informed about all facts the Board deems relevant bearing on the Adviser's services and fees. The Board further considered management fees (including any components thereof) charged to institutional and other clients of the Adviser for what might be viewed as like services, and the cost to the Adviser and its affiliates of supplying services pursuant to the management fee agreements, excluding any intra-corporate profit and profit margins of the Adviser and its affiliates for supplying such services. The Board was aware of these factors and was guided by them in its review of the Fund's advisory contract to the extent it considered them to be appropriate and relevant, as discussed further below.
Annual Shareholder Report60
The Board considered and weighed these circumstances in light of its substantial accumulated experience in governing the Fund and working with Federated on matters relating to the Federated funds, and was assisted in its deliberations by independent legal counsel. Throughout the year, the Board has requested and received substantial and detailed information about the Fund and the Federated organization that was in addition to the extensive materials that comprise and accompany the Senior Officer's evaluation. Federated provided much of this information at each regular meeting of the Board, and furnished additional reports in connection with the particular meeting at which the Board's formal review of the advisory contract occurred. Between regularly scheduled meetings, the Board also received information on particular matters as the need arose. Thus, the Board's consideration of the advisory contract included review of the Senior Officer's evaluation, accompanying data and additional reports covering such matters as: the Adviser's investment philosophy, revenue, profitability, personnel and processes; investment and operating strategies; the Fund's short- and long-term performance (in absolute terms, both on a gross basis and net of expenses, as well as in relationship to its particular investment program and certain competitor or “peer group” funds and/or other benchmarks, as appropriate), and comments on the reasons for performance; the Fund's investment objectives; the Fund's expenses (including the advisory fee itself and the overall expense structure of the Fund, both in absolute terms and relative to similar and/or competing funds, with due regard for contractual or voluntary expense limitations); the use and allocation of brokerage commissions derived from trading the Fund's portfolio securities (if any); and the nature, quality and extent of the advisory and other services provided to the Fund by the Adviser and its affiliates. The Board also considered the preferences and expectations of Fund shareholders and their relative sophistication; the continuing state of competition in the mutual fund industry and market practices; the range of comparable fees for similar funds in the mutual fund industry; the Fund's relationship to the Federated family of funds which include a comprehensive array of funds with different investment objectives, policies and strategies which are available for exchange without the incurrence of additional sales charges; compliance and audit reports concerning the Federated funds and the Federated companies that service them (including communications from regulatory agencies), as well as Federated's responses to any issues raised therein; and relevant developments in the mutual fund industry and how the Federated funds and/or Federated are responding to them. The Board's evaluation process is evolutionary. The criteria considered and the emphasis placed on relevant criteria change in recognition of changing circumstances in the mutual fund marketplace. With respect to the Fund's performance and expenses in particular, the Board has found the use of comparisons to other mutual funds with comparable investment programs to be relevant, given the high degree of competition in the mutual fund business. The Board focused on comparisons with other similar Annual Shareholder Report61
mutual funds more heavily than non-mutual fund products or services because it is believed that they are more relevant. For example, other mutual funds are the products most like the Fund, they are readily available to Fund shareholders as alternative investment vehicles, and they are the type of investment vehicle in fact chosen and maintained by the Fund's investors. The range of their fees and expenses therefore appears to be a generally reliable indication of what consumers have found to be reasonable in the precise marketplace in which the Fund competes. The Fund's ability to deliver competitive performance when compared to its peer group was a useful indicator of how the Adviser is executing the Fund's investment program, which in turn assisted the Board in reaching a conclusion that the nature, extent, and quality of the Adviser's investment management services were such as to warrant continuation of the advisory contract. In this regard, the Senior Officer has reviewed Federated's fees for providing advisory services to products outside the Federated family of funds (e.g., institutional and separate accounts). He concluded that mutual funds and institutional accounts are inherently different products. Those differences include, but are not limited to, different types of targeted investors; being subject to different laws and regulations; different legal structures; different average account sizes; different associated costs; different portfolio management techniques made necessary by different cash flows; and portfolio manager time spent in review of securities pricing. The Senior Officer did not consider these fee schedules to be determinative in judging the appropriateness of mutual fund advisory contracts.The Senior Officer reviewed reports compiled by Federated, using data supplied by independent fund ranking organizations, regarding the performance of, and fees charged by, other mutual funds, noting his view that comparisons to fund peer groups are relevant in judging the reasonableness of proposed fees.
The Fund's performance fell below the median of the relevant peer group for the one-year, three-year and five-year periods covered by the report. The Board discussed the Fund's performance with the Adviser and recognized the efforts being undertaken by the Adviser. The Board will continue to monitor these efforts and the performance of the Fund.
The Board also received financial information about Federated, including reports on the compensation and benefits Federated derived from its relationships with the Federated funds. These reports covered not only the fees under the advisory contracts, but also fees received by Federated's subsidiaries for providing other services to the Federated funds under separate contracts (e.g., for serving as the Federated funds' administrator). The reports also discussed any indirect benefit Federated may derive from its receipt of research services from brokers who execute Federated fund trades. In addition, the Board considered the fact that, in order for a fund to be competitive in the marketplace, Federated and its affiliates frequently waived fees and/or Annual Shareholder Report62
reimbursed expenses and have disclosed to fund investors and/or indicated to the Board their intention to do so in the future, where appropriate. Moreover, the Board receives regular reports regarding the institution or elimination of these voluntary waivers.Federated furnished reports, requested by the Senior Officer, that reported revenues on a fund-by-fund basis and made estimates of the allocation of expenses on a fund-by-fund basis, using allocation methodologies specified by the Senior Officer. The Senior Officer noted that, although they may apply consistent allocation processes, the inherent difficulties in allocating costs (and the unavoidable arbitrary aspects of that exercise) and the lack of consensus on how to allocate those costs may render such allocation reports unreliable. The allocation reports were considered in the analysis by the Board but were determined to be of limited use.
The Board and the Senior Officer also reviewed a report compiled by Federated comparing profitability information for Federated to other publicly held fund management companies. In this regard, the Senior Officer noted the limited availability of such information, but nonetheless concluded that Federated's profit margins did not appear to be excessive and the Board agreed.
The Senior Officer's evaluation also discussed the notion of possible realization of “economies of scale” as a fund grows larger. The Board considered in this regard that the Adviser has made significant and long-term investments in areas that support all of the Federated funds, such as personnel and processes for the portfolio management, compliance, and risk management functions; and systems technology; and that the benefits of these efforts (as well as any economies, should they exist) were likely to be enjoyed by the fund complex as a whole. Finally, the Board also noted the absence of any applicable regulatory or industry guidelines on this subject, which (as discussed in the Senior Officer's evaluation) is compounded by the lack of any common industry practice or general pattern with respect to structuring fund advisory fees with “breakpoints” that serve to reduce the fee as the fund attains a certain size. The Senior Officer did not recommend institution of breakpoints in pricing Federated's fund advisory services at this time.
It was noted in the materials for the Board meeting that for the period covered by the report, the Fund's investment advisory fee, after waivers and expense reimbursements, if any, was below the median of the relevant peer group. The Board reviewed the fees and other expenses of the Fund with the Adviser and was satisfied that the overall expense structure of the Fund remained competitive.
The Senior Officer's evaluation noted his belief that the information and observations contained in his evaluation supported a finding that the proposed management fees are reasonable, and that Federated appeared to provide appropriate administrative services to the Fund for the fees paid. Under these Annual Shareholder Report63
circumstances, no changes were recommended to, and no objection was raised to, the continuation of the Fund's advisory contract. The Board concluded that the nature, quality and scope of services provided the Fund by the Adviser and its affiliates were satisfactory.In its decision to continue an existing investment advisory contract, the Board was mindful of the potential disruptions of the Fund's operations and various risks, uncertainties and other effects that could occur as a result of a decision to terminate or not renew an advisory contract. In particular, the Board recognized that many shareholders have invested in the Fund on the strength of the Adviser's industry standing and reputation and with the expectation that the Adviser will have a continuing role in providing advisory services to the Fund. Thus, the Board's approval of the advisory contract reflected the fact that it is the shareholders who have effectively selected the Adviser by virtue of having invested in the Fund.
The Board based its decision to approve the advisory contract on the totality of the circumstances and relevant factors and with a view to past and future long-term considerations. Not all of the factors and considerations identified above were necessarily relevant to the Fund, nor did the Board consider any one of them to be determinative. With respect to the factors that were relevant, the Board's decision to approve the contract reflects its determination that Federated's performance and actions provided a satisfactory basis to support the decision to continue the existing arrangements.
Annual Shareholder Report64
Voting Proxies on Fund Portfolio Securities
A description of the policies and procedures that the Fund uses to determine how to vote proxies, if any, relating to securities held in the Fund's portfolio is available, without charge and upon request, by calling 1-800-341-7400. A report on “Form N-PX” of how the Fund voted any such proxies during the most recent 12-month period ended June 30 is available from Federated's website at FederatedInvestors.com. To access this information from the “Products” section of the website, click on the “Prospectuses and Regulatory Reports” link under “Related Information,” then select the appropriate link opposite the name of the Fund; or select the name of the Fund and from the Fund's page, click on the “Prospectuses and Regulatory Reports” link. Form N-PX filings are also available at the SEC's website at www.sec.gov.
Quarterly Portfolio Schedule
The Fund files with the SEC a complete schedule of its portfolio holdings, as of the close of the first and third quarters of its fiscal year, on “Form N-Q.” These filings are available on the SEC's website at www.sec.gov and may be reviewed and copied at the SEC's Public Reference Room in Washington, DC. (Call 1-800-SEC-0330 for information on the operation of the Public Reference Room.) You may also access this information from the “Products” section of Federated's website at FederatedInvestors.com by clicking on “Portfolio Holdings” under “Related Information,” then selecting the appropriate link opposite the name of the Fund; or select the name of the Fund and from the Fund's page, click on the “Portfolio Holdings” link.
Annual Shareholder Report65
Mutual funds are not bank deposits or obligations, are not guaranteed by any bank and are not insured or guaranteed by the U.S. government, the Federal Deposit Insurance Corporation, the Federal Reserve Board or any other government agency. Investment in mutual funds involves investment risk, including the possible loss of principal.
This Report is authorized for distribution to prospective investors only when preceded or accompanied by the Fund's Prospectus, which contains facts concerning its objective and policies, management fees, expenses and other information.
Federated Municipal Ultrashort Fund
Federated Investors Funds
4000 Ericsson Drive
Warrendale, PA 15086-7561
Contact us at FederatedInvestors.com
or call 1-800-341-7400.
Federated Securities Corp., Distributor
Cusip 31417P866
29303 (11/10)
Federated is a registered mark of Federated Investors, Inc.
2010 © Federated Investors, Inc.
Federated Municipal Ultrashort Fund
A Portfolio of Federated Fixed Income Securities, Inc.
ANNUAL SHAREHOLDER REPORTSeptember 30, 2010
Institutional Shares
FINANCIAL HIGHLIGHTS
SHAREHOLDER EXPENSE EXAMPLE
MANAGEMENT'S DISCUSSION OF FUND PERFORMANCE
PORTFOLIO OF INVESTMENTS SUMMARY TABLE
PORTFOLIO OF INVESTMENTS
STATEMENT OF ASSETS AND LIABILITIES
STATEMENT OF OPERATIONS
STATEMENT OF CHANGES IN NET ASSETS
NOTES TO FINANCIAL STATEMENTS
REPORT OF INDEPENDENT REGISTERED PUBLIC ACCOUNTING FIRM
BOARD OF DIRECTORS AND CORPORATION OFFICERS
EVALUATION AND APPROVAL OF ADVISORY CONTRACT
VOTING PROXIES ON FUND PORTFOLIO SECURITIES
QUARTERLY PORTFOLIO SCHEDULE
Financial Highlights - Institutional Shares
(For a Share Outstanding Throughout Each Period)
| Year Ended September 30 | 20101 | 2009 | 2008 | 2007 | 2006 |
| Net Asset Value, Beginning of Period | $10.02 | $9.92 | $10.02 | $10.05 | $10.05 |
| Income From Investment Operations: | | | | | |
| Net investment income | 0.11 | 0.26 | 0.37 | 0.37 | 0.33 |
| Net realized and unrealized gain (loss) on investments | 0.02 | 0.10 | (0.10) | (0.03) | (0.00)2 |
| TOTAL FROM INVESTMENT OPERATIONS | 0.13 | 0.36 | 0.27 | 0.34 | 0.33 |
| Less Distributions: | | | | | |
| Distributions from net investment income | (0.11) | (0.26) | (0.37) | (0.37) | (0.33) |
| Net Asset Value, End of Period | $10.04 | $10.02 | $9.92 | $10.02 | $10.05 |
| Total Return3 | 1.26% | 3.67% | 2.73% | 3.47% | 3.36% |
| Ratios to Average Net Assets: | | | | | |
| Net expenses | 0.35% | 0.35%4 | 0.35%4 | 0.35% | 0.35% |
| Net investment income | 1.06% | 2.25% | 3.64% | 3.71% | 3.26% |
| Expense waiver/reimbursement5 | 0.37% | 0.39% | 0.40% | 0.45% | 0.44% |
| Supplemental Data: | | | | | |
| Net assets, end of period (000 omitted) | $1,195,878 | $875,235 | $194,720 | $144,092 | $159,072 |
| Portfolio turnover | 37% | 44% | 123% | 52% | 46% |
| 1 | Beginning with the year ended September 30, 2010, the Fund was audited by KPMG LLP. The previous years were audited by another independent registered public accounting firm. |
| 2 | Represents less than $0.01. |
| 3 | Based on net asset value. |
| 4 | The net expense ratio is calculated without reduction for expense offset arrangements. The net expense ratios are 0.35% and 0.35% for the years ended September 30, 2009 and 2008, respectively, after taking into account these expense reductions. |
| 5 | This expense decrease is reflected in both the net expense and the net investment income ratios shown above. |
See Notes which are an integral part of the Financial Statements
Annual Shareholder Report1
Shareholder Expense Example (unaudited)
As a shareholder of the Fund, you incur ongoing costs, including management fees and to the extent applicable, distribution (12b-1) fees and/or shareholder services fees and other Fund expenses. This Example is intended to help you to understand your ongoing costs (in dollars) of investing in the Fund and to compare these costs with the ongoing costs of investing in other mutual funds. It is based on an investment of $1,000 invested at the beginning of the period and held for the entire period from April 1, 2010 to September 30, 2010.
ACTUAL EXPENSES
The first section of the table below provides information about actual account values and actual expenses. You may use the information in this section, together with the amount you invested, to estimate the expenses that you incurred over the period. Simply divide your account value by $1,000 (for example, an $8,600 account value divided by $1,000 = 8.6), then multiply the result by the number in the first section under the heading entitled “Expenses Paid During Period” to estimate the expenses attributable to your investment during this period.
HYPOTHETICAL EXAMPLE FOR COMPARISON PURPOSES
The second section of the table below provides information about hypothetical account values and hypothetical expenses based on the Fund's actual expense ratio and an assumed rate of return of 5% per year before expenses, which is not the Fund's actual return. Thus, you should not use the hypothetical account values and expenses to estimate the actual ending account balance or your expenses for the period. Rather, these figures are required to be provided to enable you to compare the ongoing costs of investing in the Fund with other funds. To do so, compare this 5% hypothetical example with the 5% hypothetical examples that appear in the shareholder reports of the other funds.
Annual Shareholder Report2
Please note that the expenses shown in the table are meant to highlight your ongoing costs only. Therefore, the second section of the table is useful in comparing ongoing costs only, and will not help you determine the relative total costs of owning different funds. | Beginning
Account Value
4/1/2010 | Ending
Account Value
9/30/2010 | Expenses Paid
During Period1 |
| Actual | $1,000 | $1,006.50 | $1.76 |
Hypothetical (assuming a 5% return
before expenses) | $1,000 | $1,023.31 | $1.78 |
| 1 | Expenses are equal to the Fund's annualized net expense ratio of 0.35%, multiplied by the average account value over the period, multiplied by 183/365 (to reflect the one-half-year period). |
Annual Shareholder Report3
Performance data quoted represents past performance which is no guarantee of future results. Investment return and principal value will fluctuate so that an investor's shares, when redeemed, may be worth more or less than their original cost. Mutual fund performance changes over time and current performance may be lower or higher than what is stated. For current to the most recent month-end performance and after-tax returns, visit FederatedInvestors.com or call 1-800-341-7400.
Management's Discussion of Fund
Performance (unaudited)
The Fund's total return, based on net asset value, for the 12-month reporting period was 1.26% for the Fund's Institutional Shares.1 The total return of the Barclays Capital 1-Year Municipal Bond Index (BC1MB),2 the Fund's benchmark index, was 1.77% and the total return of the Lipper Tax-Exempt Money Market Funds Classification Average (LTEMMFCA),3 a performance benchmark for the Fund, was 0.03% during the same period. The Fund's total return for the most recently completed fiscal year reflected actual cashflows, transaction costs and other expenses that were not reflected in the total return of the BC1MB.
| 1 | The Fund offers another class of shares, Class A Shares. The Fund's total return, based on net asset value, for the 12-month reporting period was 0.81% for the A Shares. A separate Annual Shareholder Report has been prepared for the Fund's Class A Shares and it is available free of charge by visiting FederatedInvestors.com or calling 1-800-341-7400. |
| 2 | The BC1MB is the one-year (1-2) component of the Barclays Capital Municipal Bond Index, an unmanaged market value-weighted index for the tax-exempt bond market. To be included in the index, bonds must have a minimum credit rating of Baa3 or BBB-, an outstanding par value of at least $7 million and be issued as part of a transaction of at least $75 million. The bonds must be fixed rate, have an issue date after December 31, 1990 and must be at least one but not more than two years from their maturity date. The BC1MB includes both zero coupon bonds and bonds subject to the alternative minimum tax. The BC1MB is not adjusted to reflect sales charges, expenses and other fees that the Securities and Exchange Commission (SEC) requires to be reflected in the Fund's performance. The Fund is not a money market fund and is not subject to the special regulatory requirements (including maturity and credit quality constraints) designed to enable money market funds to maintain a stable share price. The BC1MB is unmanaged and, unlike the Fund, is not affected by cashflows. It is not possible to invest directly in an index. |
| 3 | Lipper figures represent the average of the total returns reported by all the mutual funds designated by Lipper, Inc. as falling into the respective categories indicated. They do not reflect sales charges. |
Annual Shareholder Report4
During the reporting period, the Fund's investment strategy focused on: (a) the effective duration4 of its portfolio (which indicates the portfolio's price sensitivity to interest rates);5 (b) the selection of securities with different maturities (expressed by a yield curve showing the relative yield of securities with different maturities); (c) the allocation of the portfolio among securities of similar issuers (referred to as sectors); and (d) the credit quality and ratings of the portfolio securities (which indicates the risk that securities may default). These were the most significant factors affecting the Fund's performance relative to the BC1MB.The Fund's 1.26% total return for the reporting period consisted of 1.06% of tax-exempt dividend income and 0.20% of price appreciation as the net asset value of the Fund increased by two cents to $10.04 during the reporting period.6
MARKET OVERVIEW
During the first six months of the 12-month reporting period, incoming data suggested that economic growth was strengthening, that payroll reductions were slowing and that downside risks to economic growth were diminishing somewhat. Although economic recovery was continuing, employment growth was rather anemic relative to past recoveries from deep recessions mostly due to the effects of the financial crisis as well as institutional and consumer debt deleveraging. The housing sector initially showed signs of improvement but leveled out. Several factors continued to restrain the expansion in economic activity. The commercial real estate market continued to deteriorate, bank credit contracted further, and a concern remained about the economy's ability to generate a self-sustaining recovery without significant government support. However, financial market conditions showed signs of stabilizing as equity prices rose, credit spreads narrowed and markets in general functioned significantly better than in 2008. Substantial resource slack (or underutilized production capacity) continued to restrain longer-term inflation expectations, subduing inflation pressures.
| 4 | Duration is a measure of a security's price sensitivity to changes in interest rates. Securities with longer durations are more sensitive to changes in interest rates than securities with shorter durations. |
| 5 | Bond prices are sensitive to changes in interest rates and a rise in interest rates can cause a decline in their prices. |
| 6 | Income may be subject to the federal alternative minimum tax, as well as state and local taxes. |
Annual Shareholder Report5
However, in the final six months of the 12-month reporting period, housing starts once again returned to depressed levels. In addition, concerns regarding high sovereign indebtedness among certain Euro zone countries (i.e., European countries that have adopted the Euro as their sole legal tender) and signs of a deterioration in the U.S. economic recovery caused equities and Treasury yields to decline sharply during the spring and summer months while expectations of Federal Reserve Board (the “Fed”) tightening faded. To help support economic recovery, the Fed maintained its holdings of securities at the current levels by reinvesting principal payments from agency debt and mortgage-backed securities in longer-term Treasury securities and rolling over its holdings of Treasury debt as it matured. The Fed maintained the range for the federal funds target rate between 0.0% and 0.25% during the entire reporting period and signaled that federal funds rates will likely remain at low levels for an extended period. The combined fiscal and monetary stimuli drove an impressive rebound in the valuation of risky assets. In the tax-exempt municipal market, yield ratios of two-year, AAA-rated municipal yields to two-year Treasury note yields averaged 78% during the reporting period but reached a high of 115% at the end of the reporting period. Tax-exempt municipal credit spreads also declined significantly during the reporting period for mid-quality A- and BBB- debt.This extensive normalization of the tax-exempt municipal market from the market disruptions in 2008 resulted from several positive technical factors. Significant federal financial support programs for state governments were put in place to stimulate local economies and boost confidence. The Build America Bonds program reduced the supply of tax-exempt municipal bonds issued helping to create a shortage of tax-exempt bonds available in the market. Ongoing strong demand for yield from investors as money market rates remained very low, the expectations of higher marginal tax rates and strong mutual fund flows led to solid demand for tax-exempt debt. These factors helped to create the supply and demand imbalance that enabled the tax-exempt municipal market to recover and provide positive returns during the period. However, the underlying credit fundamentals of state and local governmental entities showed continued deterioration in such credit factors as pension funding requirements, real estate values and revenue growth.
During the reporting period, the two-year Treasury note yield moved from 0.95% to 0.45%. The AAA-rated, two-year, tax-exempt municipal bond yield reacted with less daily volatility than the two-year Treasury note as yields moved from 0.75% to 0.49% during the period. The tax-exempt municipal yield curve remained positively sloped but flattened during the 12-month period with short-term interest rates (maturities less than three years) declining 10-30 basis points while intermediate-term interest rates (maturities from 5-10 years) declined 40-50 basis points. A flattening of the yield curve means that as security maturity gets longer the incremental income from an increase in maturity decreases. Because of flattening, tax-exempt intermediate municipal bonds outperformed short-term Annual Shareholder Report6
bonds during the reporting period as the price impact per unit of duration was greater for intermediate-term bonds, and interest rates declined more for intermediate-term bonds than for short-term bonds. DURATION
Because the Fund is an ultrashort tax-exempt municipal bond fund and pursues a low volatility strategy, the Fund's typical dollar-weighted average duration has generally ranged from 0.5 to one year. As determined at the end of the 12-month reporting period, the Fund's dollar-weighted average duration was 0.75 years, and the Fund's average dollar-weighted average duration during the reporting period was approximately 0.70 years. The duration of the BC1MB (which contains only bonds with maturities from one to two years) was 1.41 years at the end of the reporting period. The shorter a fund's duration relative to an index, the less its net asset value will react as interest rates change.
Because the Fund has a structural duration range and prospectus limit that is always shorter than the duration of the BC1MB, when interest rates decline, the Fund's net asset value will benefit less than the BC1MB. The duration of the Fund relative to BC1MB detracted from Fund performance during the period, but helped the Fund relative to the LTEMMFCA.
MATURITY/YIELD CURVE
During the 12-month reporting period, the yield curve flattened and bonds with short-intermediate maturities (three to seven years) had more yield decline and better total return performance than those bonds with maturities from one to two years and zero to one year. Because the Fund attempts to pursue a low volatility ultra-short duration strategy, and in order to provide a high degree of liquidity, the Fund was managed with a concentration on maintaining a barbell structure consisting of: a) a 40% to 50% weighting in very short-term maturities such as tax-exempt 7-day municipal variable rate demand notes (MVRDNs), 7-day municipal floating rate notes and 7-day municipal auction rate securities (MARS) combined with; b) a 50% to 60% weighting in tax-exempt, municipal bonds with maturities from zero to four years.
The BC1MB contains only bonds with maturities from one to two years and does not contain any bonds with less than one year remaining to maturity nor does it include any MVRDNs or MARS. The Fund's portfolio weighting in liquid MVRDNs and MARS of 40% to 50% slightly detracted from Fund performance relative to BC1MB, as these instruments slightly underperformed the positive price performance and total return of bonds contained in the BC1MB. Many of these instruments provided above-average tax-exempt income but none of the price gain of the fixed-rate bonds in the BC1MB.6 The Fund also had significant weightings in tax-exempt, municipal bonds maturing from one to two years and two to four years and this decision helped Fund performance.
Annual Shareholder Report7
SECTOR ALLOCATIONDuring the 12-month reporting period, as compared to the BC1MB, the Fund allocated more of its portfolio to (i.e., was overweight in) securities backed by hospitals, public power, electric and gas, industrial development/pollution control projects and transportation. Revenue debt generally outperformed general obligation debt during the period as states and local government budgets remained under pressure. The Fund allocated less of the portfolio to (i.e., was underweight in) general obligation bonds and pre-refunded bonds compared to the BC1MB. These allocations helped the Fund's performance due to narrowing of credit spreads within several of the overweight revenue sectors and the demand by investors for incremental yield during the reporting period. As the credit markets recovered, pre-refunded bonds lagged the overall BC1MB return, so the Fund's underweight allocation helped performance.
CREDIT QUALITY
With significant new cash inflows into the Fund, the overall credit quality and liquidity of the Fund remained high during the 12-month reporting period. Risk-aversion by investors subsided as the financial markets stabilized and a preference for yield resulted in the outperformance of bonds rated A and BBB relative to bonds rated in the higher rating categories. With the decrease in credit spreads during the reporting period and the narrowing of credit spreads to a greater extent for A- and BBB-rated (or comparable quality) debt, the Fund's overweight, relative to the BC1MB, in A- and BBB-rated fixed coupon debt or its non-rated equivalent during the reporting period helped the Fund's performance as the yield on A and BBB-rated debt declined to a greater extent than for other investment-grade securities. For the variable rate portion of the portfolio, the Fund's income and total return was helped by significant weightings in MVRDNs with credit/liquidity enhancement from split-rated banks (A-2, P-2 and/or F-2 rated). Overall, the shift to a more constructive credit view by market participants helped the Fund's performance during the period.
Annual Shareholder Report8
GROWTH OF A $10,000 INVESTMENT - Institutional Shares
The graph below illustrates the hypothetical investment of $10,0001 in Federated Municipal Ultrashort Fund (Institutional Shares) (the “Fund”) from October 24, 2000 (start of performance) to September 30, 2010, compared to the Barclays Capital 1-Year Municipal Bond Index (BC1MB)2 and the Lipper Tax-Exempt Money Market Funds Classification Average (LTEMMFCA).2
| Average Annual Total Returns for the Period Ended 9/30/2010 | |
| 1 Year | 1.26% |
| 5 Years | 2.90% |
| Start of Performance (10/24/2000) | 2.78% |
Performance data quoted represents past performance which is no guarantee of future results. Investment return and principal value will fluctuate so that an investor's shares, when redeemed, may be worth more or less than their original cost. Mutual fund performance changes over time and current performance may be lower or higher than what is stated. For current to the most recent month-end performance and after-tax returns, visit FederatedInvestors.com or call 1-800-341-7400. Returns shown do not reflect the deduction of taxes that a shareholder would pay on Fund distributions or the redemption of Fund shares. Mutual funds are not obligations of or guaranteed by any bank and are not federally insured.
Annual Shareholder Report9
1Represents a hypothetical investment of $10,000. The Fund's performance assumes the reinvestment of all dividends and distributions. The BC1MB and the LTEMMFCA have been adjusted to reflect reinvestment of dividends on securities in the index and the average.| 2 | The BC1MB is the one-year (1-2) component of the Barclays Capital Municipal Bond Index. The Barclays Capital Municipal Bond Index is an unmanaged index of tax-exempt municipal bonds issued after December 31, 1990, with a minimum credit rating of at least Baa3 or BBB-, which have been issued as part of a deal of at least $75 million, have a minimum maturity value of at least $7 million, and mature in at least one, but not more than two, years. The BC1MB also includes both zero coupon bonds and bonds subject to the alternative minimum tax (AMT). The BC1MB is not adjusted to reflect sales charges, expenses or other fees that the Securities and Exchange Commission requires to be reflected in the Fund's performance. The Fund is not a money market fund and is not subject to the special regulatory requirements (including maturity and credit quality constraints) designed to enable money market funds to maintain a stable share price. The BC1MB is unmanaged, and unlike the Fund, is not affected by cash flows. It is not possible to invest directly in the BC1MB. Lipper figures represent the average of the total returns reported by all the mutual funds designated by Lipper, Inc. as falling into the respective categories indicated. They do not reflect sales charges. |
Annual Shareholder Report10
Portfolio of Investments Summary Table (unaudited)
At September 30, 2010, the Fund's sector composition1 was as follows:
| Sector Composition | Percentage of
Total Net Assets |
| Hospital | 16.8% |
| General Obligation — Local | 15.2% |
| General Obligation — State | 14.3% |
| Industrial Development Bond/Pollution Control Revenue | 14.2% |
| Electric and Gas | 13.3% |
| Transportation | 5.3% |
| Public Power | 4.1% |
| Education | 3.6% |
| Special Tax | 2.9% |
| Multi-Family Housing | 2.0% |
| Other2 | 7.9% |
| Other Assets and Liabilities — Net3 | 0.4% |
| Total | 100.0% |
| 1 | Sector classifications, and the assignment of holdings to such sectors, are based upon the economic sector and/or revenue source of the underlying obligor, as determined by the Fund's Adviser. For securities that have been enhanced by a third party, including bond insurers and banks, sector classifications are based upon the economic sector and/or revenue source of the underlying obligor as determined by the Fund's Adviser. |
| 2 | For purposes of this table, sector classifications constitute 91.7% of the Fund's total net assets. Remaining sectors have been aggregated under the designation “Other.” |
| 3 | Assets, other than investments in securities, less liabilities. See Statement of Assets and Liabilities. |
Annual Shareholder Report11
Portfolio of Investments
September 30, 2010
Principal
Amount | | | Value |
| | MUNICIPAL BONDS – 62.5% | |
| | Alabama – 2.4% | |
| $2,035,000 | | Alabama Special Care Facilities Financing Authority of Birmingham, Revenue Bonds (Series 2005A), 5.00% (Ascension Health Subordinate Credit Group), 6/1/2012 | 2,166,461 |
| 1,510,000 | | Alabama Special Care Facilities Financing Authority of Birmingham, Revenue Bonds (Series 2005A), 5.00% (Ascension Health Subordinate Credit Group), 6/1/2012 | 1,600,811 |
| 2,500,000 | | Alabama State Public School & College Authority, Capital Improvement Refunding Bonds (Series 2009A), 5.00% (United States Treasury COL), 5/1/2012 | 2,674,475 |
| 6,000,000 | | Alabama State Public School & College Authority, Capital Improvement Refunding Bonds (Series 2009A), 5.00% (United States Treasury COL), 5/1/2013 | 6,646,440 |
| 3,920,000 | | Alabama State Public School & College Authority, Capital Improvement Refunding Bonds (Series 2009A), 5.00% (United States Treasury COL), 5/1/2014 | 4,464,998 |
| 4,095,000 | | Alabama State Public School & College Authority, Capital Improvement Refunding Bonds (Series 2009B), 5.00%, 5/1/2012 | 4,380,790 |
| 3,485,000 | | Alabama State Public School & College Authority, Capital Improvement Refunding Bonds (Series 2009B), 5.00%, 5/1/2013 | 3,860,474 |
| 2,025,000 | | Baldwin County, AL, (Series 2010), 3.00%, 1/1/2012 | 2,088,909 |
| 4,510,000 | | Birmingham, AL Water Works Board, Subordinate Water Revenue Bonds (Series 2009), 3.00%, 7/1/2011 | 4,572,148 |
| 3,515,000 | | Birmingham, AL Water Works Board, Subordinate Water Revenue Bonds (Series 2009), 3.00%, 7/1/2013 | 3,646,953 |
| 2,440,000 | | Birmingham, AL Water Works Board, Subordinate Water Revenue Bonds (Series 2009), 4.00%, 7/1/2012 | 2,549,214 |
| 24,750,000 | | Health Care Authority for Baptist Health, AL, Affiliate of UAB Health (Montgomery)/(Series B) ARS (Assured Guaranty Corp. INS), 0.800%, 10/1/2010 | 24,750,000 |
| 1,300,000 | | Huntsville, AL, UT GO Bonds (Series 2009A), 5.00%, 9/1/2011 | 1,355,809 |
| 1,500,000 | | Huntsville, AL, UT GO Bonds (Series 2009B), 3.00%, 9/1/2011 | 1,536,870 |
| 4,000,000 | | Mobile, AL IDB, PCRBs (Series 2007A), 4.75% TOBs (Alabama Power Co.), Mandatory Tender 3/19/2012 | 4,207,040 |
| 2,160,000 | | Tuscaloosa, AL, GO Warrants (Series 2010-B), 4.00%, 2/15/2012 | 2,261,866 |
| 2,250,000 | | Tuscaloosa, AL, GO Warrants (Series 2010-B), 4.00%, 2/15/2013 | 2,423,452 |
| | TOTAL | 75,186,710 |
| | Arizona – 1.2% | |
| 2,000,000 | | Arizona Health Facilities Authority, Revenue Bonds (Series 2008D), 5.00% (Banner Health), 1/1/2011 | 2,022,060 |
Annual Shareholder Report12
Principal
Amount | | | Value |
| $8,000,000 | | Arizona Health Facilities Authority, Variable Rate Health Facility Revenue Bonds (Series 2009E), 5.00% TOBs (Catholic Healthcare West), Mandatory Tender 7/2/2012 | 8,394,720 |
| 1,000,000 | | Arizona State, COP (Series 2010A), 5.00% (Assured Guaranty Corp. INS), 10/1/2012 | 1,078,640 |
| 5,000,000 | | Arizona State, COP (Series 2010A), 5.00% (Assured Guaranty Corp. INS), 10/1/2014 | 5,664,300 |
| 1,000,000 | | Arizona Transportation Board, Transportation Excise Tax Revenue Bonds (Series 2009), 5.00% (Maricopa County, AZ Regional Area Road Fund), 7/1/2011 | 1,035,150 |
| 1,840,000 | | Arizona Transportation Board, Transportation Excise Tax Revenue Bonds (Series 2009), 5.00% (Maricopa County, AZ Regional Area Road Fund), 7/1/2012 | 1,982,949 |
| 1,000,000 | | Arizona Water Infrastructure Finance Authority, Water Quality Revenue Bonds (Series 2009A), 4.00%, 10/1/2011 | 1,037,120 |
| 1,000,000 | | Arizona Water Infrastructure Finance Authority, Water Quality Revenue Bonds (Series 2009A), 4.00%, 10/1/2012 | 1,070,390 |
| 2,135,000 | | Arizona Water Infrastructure Finance Authority, Water Quality Refunding Revenue Bonds (Series 2009A), 4.00%, 10/1/2012 | 2,285,283 |
| 1,100,000 | | Arizona Water Infrastructure Finance Authority, Water Quality Refunding Revenue Bonds (Series 2009A), 4.00%, 10/1/2011 | 1,140,832 |
| 10,000,000 | | Coconino County, AZ Pollution Control Corp., PCRBs (Series 1994A), 3.625% TOBs (Arizona Public Service Co.), Mandatory Tender 7/13/2013 | 10,096,100 |
| 2,500,000 | | Maricopa County, AZ, IDA, Health Facility Revenue Bonds (Series 2009A), 5.00% (Catholic Healthcare West), 7/1/2012 | 2,648,950 |
| | TOTAL | 38,456,494 |
| | Arkansas – 0.6% | |
| 15,000,000 | | Arkansas State, Federal Highway Grant Anticipation & Tax Refunding Revenue Bonds (GO)(Series 2010), 4.00%, 8/1/2012 | 15,955,950 |
| 2,295,000 | | Beaver Water District of Benton and Washington Counties, AR, Refunding Revenue Bonds (Series 2010), 3.00%, 11/15/2013 | 2,434,765 |
| 775,000 | | Jefferson County, AR, PCR Refunding Bonds (Series 2006), 4.60% (Entergy Arkansas, Inc.), 10/1/2017 | 783,045 |
| | TOTAL | 19,173,760 |
| | California – 5.6% | |
| 10,900,000 | | California Educational Facilities Authority, Variable Rate Refunding Revenue Bonds (Series 2010B), 1.07% (Loyola Marymount University), 10/6/2010 | 10,900,000 |
| 1,000,000 | | California Health Facilities Financing Authority, 5.00% (Adventist Health System/West), 3/1/2011 | 1,013,860 |
| 1,500,000 | | California Health Facilities Financing Authority, 5.00% (Adventist Health System/West), 3/1/2012 | 1,568,175 |
Annual Shareholder Report13
Principal
Amount | | | Value |
| $880,000 | | California Health Facilities Financing Authority, INS Revenue Bonds (Series 2006), 4.25% (California-Nevada Methodist Homes)/(GTD by California Mortgage Insurance), 7/1/2011 | 881,936 |
| 7,000,000 | | California Health Facilities Financing Authority, Refunding Revenue Bonds, 3.45% TOBs (Stanford Hospital & Clinics), Mandatory Tender 6/15/2011 | 7,142,450 |
| 1,145,000 | | California Health Facilities Financing Authority, Revenue Bonds (Series 2008A), 5.00% (Sutter Health), 8/15/2011 | 1,183,255 |
| 2,650,000 | | California Health Facilities Financing Authority, Revenue Bonds (Series 2009B), 4.00% (St. Joseph Health System), 7/1/2012 | 2,777,810 |
| 3,865,000 | | California Health Facilities Financing Authority, Revenue Bonds (Series 2009B), 4.50% (St. Joseph Health System), 7/1/2013 | 4,175,360 |
| 3,800,000 | | California Health Facilities Financing Authority, Revenue Bonds (Series 2009B), 5.00% (St. Joseph Health System), 7/1/2014 | 4,236,316 |
| 6,000,000 | | California Health Facilities Financing Authority, Variable Rate Health Facility Revenue Bonds (Series 2009C), 5.00% TOBs (Catholic Healthcare West), Mandatory Tender 7/2/2012 | 6,337,680 |
| 11,290,000 | | California Health Facilities Financing Authority, Variable Rate Health Facility Revenue Bonds (Series 2009G), 5.00% TOBs (Catholic Healthcare West), Mandatory Tender 7/2/2012 | 11,925,401 |
| 10,000,000 | | California Health Facilities Financing Authority, Variable Rate Refunding Revenue Bonds (Series 2009C), 5.00% TOBs (St. Joseph Health System), Mandatory Tender 10/16/2014 | 11,181,400 |
| 6,500,000 | | California Infrastructure & Economic Development Bank, Refunding Revenue Bonds (Series 2007 A-4), 1.65% TOBs (J Paul Getty Trust), Mandatory Tender 4/1/2011 | 6,537,180 |
| 28,000,000 | | California Municipal Finance Authority, Revenue Bonds, 1.20% TOBs (Republic Services, Inc.), Mandatory Tender 10/1/2010 | 28,000,000 |
| 13,000,000 | | California Municipal Finance Authority, Revenue Bonds, 1.20% TOBs (Republic Services, Inc.), Mandatory Tender 10/1/2010 | 13,000,000 |
| 4,100,000 | | California PCFA, Solid Waste Disposal Refunding Revenue Bonds (Series 1998B), 1.75% TOBs (Waste Management, Inc.), Mandatory Tender 6/1/2011 | 4,108,364 |
| 30,000,000 | | California PCFA, Solid Waste Refunding Revenue Bonds (Series 2010A), 1.30% TOBs (Republic Services, Inc.), Optional Tender 11/1/2010 | 29,998,800 |
| 7,500,000 | | California State Department of Water Resources Power Supply Program, Power Supply Revenue Bonds (Series 2010L), 5.00%, 5/1/2012 | 8,021,325 |
| 1,000,000 | | California State, Economic Recovery Bonds (Series 2008A), 5.00% (California State Fiscal Recovery Fund), 1/1/2011 | 1,011,450 |
| 3,895,000 | | California State, Economic Recovery UT GO Bonds (Series 2004A), 5.25% (California State Fiscal Recovery Fund)/(United States Treasury COL), 1/1/2011 | 3,943,064 |
Annual Shareholder Report14
Principal
Amount | | | Value |
| $480,000 | | California State, Economic Recovery UT GO Bonds (Series 2004A), 5.25% (California State Fiscal Recovery Fund)/(National Public Finance Guarantee Corporation INS), 1/1/2011 | 485,798 |
| 2,625,000 | | California State, Refunding Economic Recovery Bonds (Series 2009B), 5.00% TOBs (California State Fiscal Recovery Fund), Mandatory Tender 7/1/2014 | 2,971,316 |
| 1,000,000 | | Golden State Tobacco Securitization Corp., CA, Tobacco Settlement Asset-Backed Bonds (Series 2007A-1), 5.00%, 6/1/2011 | 1,013,850 |
| 4,000,000 | | Long Beach CCD, CA, Bond Anticipation Notes (Series 2010A), 9.85%, 1/15/2013 | 4,787,640 |
| 4,200,000 | | San Bernardino County, CA Transportation Authority, Sales Tax Revenue Notes (Series 2009A), 4.00%, 5/1/2012 | 4,406,178 |
| 2,000,000 | | San Diego, CA Public Facilities Authority, Senior Sewer Refunding Revenue Bonds (Series 2009B), 5.00% (San Diego, CA Wastewater System), 5/15/2012 | 2,141,540 |
| 2,755,000 | | San Joaquin County, CA Transportation Authority, Measure K Senior Sales Tax Revenue Notes, (Series 2008), 5.00%, 4/1/2011 | 2,818,723 |
| | TOTAL | 176,568,871 |
| | Colorado – 1.1% | |
| 110,000 | | Beacon Point, CO Metropolitan District, Revenue Bonds (Series 2005B), 4.375% (Compass Bank, Birmingham LOC)/(Original Issue Yield: 4.50%), 12/1/2015 | 109,631 |
| 1,000,000 | | Colorado Health Facilities Authority, Revenue Bonds (Series 2008C-6), 3.95% TOBs (Catholic Health Initiatives), Mandatory Tender 11/10/2010 | 1,003,600 |
| 4,100,000 | | Colorado Health Facilities Authority, Revenue Bonds (Series 2009B), 5.00% TOBs (Catholic Health Initiatives), Mandatory Tender 11/11/2014 | 4,634,804 |
| 25,000,000 | | Colorado Health Facilities Authority, Revenue Bonds (Series 2009B), 5.00% TOBs (Catholic Health Initiatives), Mandatory Tender 11/8/2012 | 26,982,250 |
| 3,105,000 | | Colorado State Higher Education Capital Construction Lease Purchase Financing Program, COP (Series 2008), 5.00% (United States Treasury COL), 11/1/2010 | 3,116,954 |
| | TOTAL | 35,847,239 |
| | Connecticut – 0.4% | |
| 7,800,000 | | Connecticut Development Authority, PCR Revenue Bonds (Series 1996A), 1.40% TOBs (Connecticut Light & Power Co.), Mandatory Tender 4/1/2011 | 7,803,276 |
| 1,000,000 | | Connecticut State Development Authority, PCR Refunding Bonds (Series 1996), 5.75% TOBs (United Illuminating Co.), Mandatory Tender 2/1/2012 | 1,041,980 |
| 4,020,000 | | Connecticut State, Economic Recovery UT GO Notes, 5.00%, 1/1/2014 | 4,548,509 |
| | TOTAL | 13,393,765 |
Annual Shareholder Report15
Principal
Amount | | | Value |
| | Delaware – 0.1% | |
| $3,000,000 | | University of Delaware, Variable Rate Revenue Bonds (Series 2009A), 2.00% TOBs, Mandatory Tender 6/1/2011 | 3,021,090 |
| | District of Columbia – 0.6% | |
| 12,250,000 | | District of Columbia Income Tax Revenue, Income Tax Secured Refunding Revenue Bonds (Series 2010C), 0.45%, 12/1/2011 | 12,194,017 |
| 2,550,000 | | District of Columbia Revenue, University Refunding Revenue Bonds (Series 2009A), 5.00% (Georgetown University), 4/1/2012 | 2,688,516 |
| 3,000,000 | | District of Columbia Revenue, University Refunding Revenue Bonds (Series 2009A), 5.00% (Georgetown University), 4/1/2013 | 3,255,420 |
| 1,000,000 | | Washington Metropolitan Area Transit Authority, Gross Revenue Transit Bonds (Series 2009A), 5.00%, 7/1/2011 | 1,034,300 |
| | TOTAL | 19,172,253 |
| | Florida – 4.5% | |
| 5,800,000 | | Broward County, FL, UT GO Bonds, 5.00%, 1/1/2011 | 5,868,034 |
| 54,610 | 1 | Capital Trust Agency, FL, Housing Revenue Notes, 5.95% (Atlantic Housing Foundation Properties), 1/15/2039 | 21,841 |
| 60,000,000 | | Citizens Property Insurance Corp. FL, (Series A2), 2.00%, 4/21/2011 | 60,284,400 |
| 1,000,000 | | Florida State Board of Education Lottery, Revenue Bonds (Series 2010A), 5.00%, 7/1/2011 | 1,034,460 |
| 4,000,000 | | Florida State Board of Education Lottery, Refunding Revenue Bonds (Series 2010C), 2.00%, 7/1/2011 | 4,047,760 |
| 1,365,000 | | Florida State Board of Education Lottery, Refunding Revenue Bonds (Series 2010C), 3.00%, 7/1/2011 | 1,391,536 |
| 3,375,000 | | Florida State Board of Education, UT GO Capital Outlay Bonds (Series 2006E), 5.00%, 6/1/2011 | 3,476,655 |
| 2,410,000 | | Florida State Department of Environmental Protection, Refunding Revenue Bonds (Series 2008A), 5.00% (Assured Guaranty Corp. INS), 7/1/2011 | 2,490,422 |
| 6,105,000 | | Florida State Turnpike Authority, Refunding Turnpike Revenue Bonds (Series 2008A), 5.00%, 7/1/2011 | 6,311,593 |
| 2,275,000 | | JEA, FL Electric System, Electric System Subordinated Revenue Bonds (Series 2009B), 5.00%, 10/1/2011 | 2,373,098 |
| 5,000,000 | | JEA, FL Electric System, Subordinated Revenue Bonds (Series 2009D), 5.00%, 10/1/2011 | 5,215,600 |
| 7,000,000 | | JEA, FL Electric System, Subordinated Revenue Bonds (Series 2009D), 5.00%, 10/1/2012 | 7,573,790 |
| 12,000,000 | | Lakeland, FL Energy Systems, Variable Rate Energy System Refunding Bonds (Series 2009), 1.02%, 10/1/2012 | 11,967,480 |
| 5,000,000 | | Lakeland, FL Energy Systems, Variable Rate Energy System Refunding Bonds (Series 2009), 1.37%, 10/1/2014 | 4,948,450 |
| 6,400,000 | | Miami-Dade County, FL IDA, Solid Waste Disposal Revenue Bonds (Series 2004), 1.75% TOBs (Waste Management, Inc.), Mandatory Tender 6/1/2011 | 6,413,056 |
Annual Shareholder Report16
Principal
Amount | | | Value |
| $5,000,000 | | Miami-Dade County, FL IDA, Solid Waste Disposal Revenue Bonds (Series 2007), 1.80% TOBs (Waste Management, Inc.), Mandatory Tender 11/1/2010 | 4,999,800 |
| 2,000,000 | | Orange County, FL, Health Facilities Authority, Hospital Revenue Bonds (Series 2009), 5.00% (Orlando Health, Inc.), 10/1/2013 | 2,166,100 |
| 6,025,000 | | Pasco County, FL School Board, (Series B) ARS (AMBAC INS), 0.600%, 10/1/2010 | 6,025,000 |
| 7,475,000 | | St. Petersburg, FL HFA, (Series B) ARS (All Children's Hospital)/(AMBAC INS), 0.750%, 10/1/2010 | 7,475,000 |
| | TOTAL | 144,084,075 |
| | Georgia – 2.4% | |
| 2,250,000 | | Atlanta, GA Water & Wastewater, Revenue Bonds (Series 2009A), 4.00%, 11/1/2011 | 2,321,348 |
| 3,000,000 | | Atlanta, GA Water & Wastewater, Revenue Bonds (Series 2009A), 4.00%, 11/1/2012 | 3,171,570 |
| 4,100,000 | | Burke County, GA Development Authority, PCRBs (First Series 2008), 4.95% TOBs (Georgia Power Co.), Mandatory Tender 4/1/2011 | 4,181,221 |
| 2,100,000 | | Burke County, GA Development Authority, PCRBs (Series 2007E), 4.75% TOBs (Oglethorpe Power Corp.)/(National Public Finance Guarantee Corporation INS), Mandatory Tender 4/1/2011 | 2,139,501 |
| 4,000,000 | | Burke County, GA Development Authority, PCRBs (Series 1995), 2.30% TOBs (Georgia Power Co.), Mandatory Tender 4/1/2014 | 4,047,160 |
| 1,000,000 | | Cobb County, GA Development Authority, (Series A), 1.40% TOBs (Waste Management, Inc.), Mandatory Tender 10/3/2011 | 1,000,310 |
| 4,165,000 | | Decatur County-Bainbridge, GA IDA, Revenue Bonds, 4.55% TOBs (John B. Sanifilippo & Son)/(Bank of America N.A. LOC), Mandatory Tender 6/1/2011 | 4,237,263 |
| 8,000,000 | | East Point, GA, 3.00% TANs, 12/31/2010 | 8,029,920 |
| 2,850,000 | | Floyd County, GA School District, GO Sales Tax Bonds (Series 2009), 3.00% (GTD by Georgia State), 8/1/2011 | 2,911,247 |
| 2,500,000 | | Fulton County, GA Facilities Corp., COP (Series 2009), 3.00%, 11/1/2011 | 2,552,450 |
| 1,000,000 | | Georgia State Road and Tollway Authority, Federal Highway Grant Anticipation Revenue Bonds (Series 2009-A), 4.00%, 6/1/2011 | 1,024,400 |
| 4,000,000 | | Georgia State Road and Tollway Authority, Federal Highway Grant Anticipation Revenue Bonds (Series 2009-A), 5.00%, 6/1/2012 | 4,298,280 |
| 8,120,000 | | Georgia State, UT GO Bonds (Series 2003D), 5.25%, 12/1/2011 | 8,589,498 |
| 8,000,000 | | Georgia State, UT GO Bonds (Series 2006G), 5.00%, 10/1/2011 | 8,377,840 |
| 5,850,000 | | Gwinnett County, GA Water and Sewer Authority, Revenue Bonds, 5.00% (United States Treasury PRF 8/1/2012@100)/(Original Issue Yield: 5.10%), 8/1/2020 | 6,337,597 |
| 700,000 | | Medical Center Hospital Authority, GA, Refunding Revenue Bonds (Series 2007), 5.00% (Spring Harbor at Green Island), 7/1/2012 | 709,443 |
Annual Shareholder Report17
Principal
Amount | | | Value |
| $5,000,000 | | Monroe County, GA Development Authority, PCRBs (Series 1992A), 6.80% (Oglethorpe Power Corp.), 1/1/2011 | 5,062,750 |
| 2,000,000 | | Monroe County, GA Development Authority, PCRBs (First Series 1995), 4.50% TOBs (Georgia Power Co.), Mandatory Tender 4/1/2011 | 2,036,340 |
| 1,000,000 | | Private Colleges & Universities Facilities of GA, Revenue Bonds (Series 2008B), 5.00% (Emory University), 9/1/2011 | 1,043,090 |
| 1,500,000 | | Public Gas Partners, Inc., GA, Gas Project Revenue Bonds (Gas Supply Pool No. 1 Series 2009A), 5.00%, 10/1/2011 | 1,559,670 |
| 2,300,000 | | Public Gas Partners, Inc., GA, Gas Project Revenue Bonds (Gas Supply Pool No. 1 Series 2009A), 5.00%, 10/1/2012 | 2,473,719 |
| 1,400,000 | | Public Gas Partners, Inc., GA, Gas Project Revenue Bonds (Gas Supply Pool No. 1 Series 2009A), 5.00%, 10/1/2013 | 1,544,648 |
| | TOTAL | 77,649,265 |
| | Illinois – 3.4% | |
| 2,000,000 | | Chicago, IL Water Revenue, Second Lien Water Refunding Revenue Bonds (Series 2008), 5.00% (Assured Guaranty Municipal Corp. INS), 11/1/2011 | 2,093,620 |
| 8,825,000 | | Chicago, IL, Refunding UT GO Bonds (2005A), 5.00% (Assured Guaranty Municipal Corp. INS), 1/1/2013 | 9,574,154 |
| 3,500,000 | | Illinois Finance Authority — Solid Waste, 1.45% TOBs (Waste Management, Inc.), Mandatory Tender 10/3/2011 | 3,501,085 |
| 4,000,000 | | Illinois Finance Authority, Gas Supply Refunding Revenue Bonds (Series 2010), 2.125% TOBs (Peoples Gas Light & Coke Co.), Mandatory Tender 7/1/2014 | 4,035,320 |
| 10,000,000 | | Illinois Finance Authority, Revenue Bonds (Series 2010B), 3.00% (Art Institute of Chicago), 7/1/2013 | 10,163,200 |
| 5,130,000 | | Illinois Finance Authority, Revenue Bonds (Series 2010D), 2.00% (Advocate Health Care Network), 4/1/2011 | 5,153,854 |
| 4,530,000 | | Illinois State Sales Tax, Sales Tax Revenue Bonds (Junior Obligation Series June 2010), 5.00%, 6/15/2013 | 4,962,570 |
| 32,000,000 | | Illinois State, GO Certificates of July, 2010, 3.00% TRANs, 5/20/2011 | 32,341,120 |
| 3,650,000 | | Illinois State, GO Refunding Bonds (Series February 2010), 5.00%, 1/1/2012 | 3,798,592 |
| 4,010,000 | | Illinois State, GO Refunding Bonds (Series February 2010), 5.00%, 1/1/2013 | 4,290,098 |
| 16,000,000 | | Illinois State, UT GO, 3.00% TRANs, 4/15/2011 | 16,136,800 |
| 12,600,000 | | Will & Kendall Counties, IL Community Consolidated School District No. 202, 2.00%, 1/1/2011 | 12,621,672 |
| | TOTAL | 108,672,085 |
| | Indiana – 0.3% | |
| 2,750,000 | | Indiana Health Facility Financing Authority, Revenue Bonds (Series 2005A-4), 5.00% (Ascension Health Subordinate Credit Group), 6/1/2012 | 2,901,250 |
Annual Shareholder Report18
Principal
Amount | | | Value |
| $1,000,000 | | Indiana State Finance Authority, Hospital Revenue Bonds (Series 2009A), 5.00% (Parkview Health System Obligated Group), 5/1/2011 | 1,021,640 |
| 2,000,000 | | Indiana State Finance Authority, Hospital Revenue Bonds (Series 2009A), 5.00% (Parkview Health System Obligated Group), 5/1/2012 | 2,106,480 |
| 1,000,000 | | Purdue University, IN, Student Fee Bonds (Series 2010Y), 2.00%, 7/1/2011 | 1,012,700 |
| 1,500,000 | | St. Joseph County, IN, Variable Rate Educational Facilities Revenue Bonds (Series 2005), 3.875% TOBs (University of Notre Dame), Mandatory Tender 3/1/2012 | 1,552,785 |
| | TOTAL | 8,594,855 |
| | Iowa – 0.5% | |
| 1,500,000 | | Iowa Finance Authority, Variable Rate Demand Health Facilities Revenue Bonds (Series 2005A), 5.00% (Iowa Health System)/(Assured Guaranty Corp. INS), 2/15/2012 | 1,577,265 |
| 5,000,000 | | Iowa Finance Authority, Variable Rate Demand Health Facilities Revenue Bonds (Series 2009F), 5.00% TOBs (Iowa Health System), Mandatory Tender 8/15/2012 | 5,355,800 |
| 7,050,000 | | Tobacco Settlement Authority, IA, Tobacco Settlement Asset-Backed Revenue Bonds (Series 2001B), 5.60% (United States Treasury PRF 6/1/2011@101)/(Original Issue Yield: 5.75%), 6/1/2035 | 7,364,289 |
| | TOTAL | 14,297,354 |
| | Kansas – 0.2% | |
| 450,000 | | Kansas State Development Finance Authority, Hospital Revenue Bonds (Series 2009D), 3.00% (Adventist Health System/Sunbelt Obligated Group), 11/15/2011 | 461,889 |
| 180,000 | | Kansas State Development Finance Authority, Hospital Revenue Bonds (Series 2009D), 3.50% (Adventist Health System/Sunbelt Obligated Group), 11/15/2012 | 188,923 |
| 200,000 | | Kansas State Development Finance Authority, Hospital Revenue Bonds (Series 2009D), 5.00% (Adventist Health System/Sunbelt Obligated Group), 11/15/2013 | 223,010 |
| 520,000 | | Wichita, KS, Hospital Facilities Refunding & Improvement Revenue Bonds (Series IIIA-2009), 2.00% (Via Christi Health System, Inc.), 11/15/2010 | 520,613 |
| 500,000 | | Wichita, KS, Hospital Facilities Refunding & Improvement Revenue Bonds (Series IIIA-2009), 3.00% (Via Christi Health System, Inc.), 11/15/2011 | 509,965 |
| 1,000,000 | | Wichita, KS, Hospital Facilities Refunding & Improvement Revenue Bonds (Series IIIA-2009), 4.50% (Via Christi Health System, Inc.), 11/15/2012 | 1,062,020 |
Annual Shareholder Report19
Principal
Amount | | | Value |
| $2,000,000 | | Wichita, KS, Hospital Facilities Refunding & Improvement Revenue Bonds (Series IIIA-2009), 5.00% (Via Christi Health System, Inc.), 11/15/2013 | 2,188,160 |
| | TOTAL | 5,154,580 |
| | Kentucky – 0.8% | |
| 1,000,000 | | Kentucky EDFA, Hospital Revenue Bonds (Series 2009A), 5.00% (Baptist Healthcare System), 8/15/2011 | 1,036,580 |
| 4,465,000 | | Louisville & Jefferson County, KY Metropolitan Sewer District, 5.00%, 5/15/2011 | 4,587,966 |
| 4,685,000 | | Louisville & Jefferson County, KY Metropolitan Sewer District, 5.00%, 5/15/2012 | 5,001,519 |
| 15,000,000 | | Owensboro, KY, GO BANs (Series 2009), 3.25%, 7/1/2012 | 15,165,000 |
| | TOTAL | 25,791,065 |
| | Louisiana – 0.6% | |
| 15,000,000 | | Louisiana State Gas & Fuels, Tax Second Lien Revenue Bonds (Series 2009A-1), 1.02%, 5/1/2043 | 14,992,500 |
| 3,250,000 | | Louisiana State Offshore Terminal Authority, Deepwater Port Revenue Bonds (Series 2007B-1A), 1.60% TOBs (Loop LLC), Mandatory Tender 10/1/2012 | 3,250,943 |
| | TOTAL | 18,243,443 |
| | Maryland – 0.3% | |
| 1,000,000 | | Maryland State Health & Higher Educational Facilities Authority, Revenue Bonds (Series 2008B), 5.00% TOBs (Johns Hopkins Hospital), Mandatory Tender 11/15/2011 | 1,042,360 |
| 2,955,000 | | Maryland State, UT GO Bonds (First Series 2006A), 5.00%, 3/1/2013 | 3,270,151 |
| 5,000,000 | | Maryland State, UT GO Bonds (Second Series 2008), 5.00%, 7/15/2011 | 5,186,800 |
| | TOTAL | 9,499,311 |
| | Massachusetts – 5.4% | |
| 10,600,000 | | Cape Cod, MA Regional Transportation Authority, 1.75% RANs, 7/29/2011 | 10,627,666 |
| 4,000,000 | | Commonwealth of Massachusetts, LT GO Construction Loan Bonds (Series C), 5.50% (Assured Guaranty Municipal Corp. INS), 11/1/2011 | 4,224,760 |
| 16,000,000 | | Commonwealth of Massachusetts, Refunding GO Bonds (SIFMA Index Bonds)/(Series 2010A), 0.65%, 2/1/2013 | 15,905,760 |
| 12,000,000 | | Commonwealth of Massachusetts, Refunding GO Bonds (SIFMA Index Bonds)/(Series 2010A), 0.51%, 2/1/2012 | 11,976,600 |
| 3,750,000 | | Commonwealth of Massachusetts, Refunding GO Bonds (SIFMA Index Bonds)/(Series 2010A), 0.80%, 2/1/2014 | 3,726,000 |
| 5,100,000 | | Greater Attleboro-Taunton, MA Regional Transportation Authority, 2.00% RANs, 8/19/2011 | 5,136,414 |
| 6,000,000 | | Massachusetts Department of Transportation, Metropolitan Highway System Revenue Bonds (Series 2010B), 5.00%, 1/1/2013 | 6,531,780 |
Annual Shareholder Report20
Principal
Amount | | | Value |
| $10,405,000 | | Massachusetts HEFA, (Series 2005F) ARS (Partners Healthcare Systems)/(Assured Guaranty Municipal Corp. INS), 0.340%, 10/1/2010 | 10,405,000 |
| 17,880,000 | | Massachusetts HEFA, (Series 2007G-2) ARS (Partners Healthcare Systems)/(Assured Guaranty Municipal Corp. INS), 0.500%, 10/7/2010 | 17,880,000 |
| 1,000,000 | | Massachusetts HEFA, Revenue Bonds (Series 2008 T-2), 4.10% TOBs (Northeastern University), Mandatory Tender 4/19/2012 | 1,041,670 |
| 1,370,000 | | Massachusetts HEFA, Revenue Bonds (Series 2008R), 5.00% (Northeastern University), 10/1/2010 | 1,370,164 |
| 1,465,000 | | Massachusetts HEFA, Revenue Bonds (Series 2008R), 5.00% (Northeastern University), 10/1/2011 | 1,524,670 |
| 1,000,000 | | Massachusetts HEFA, Revenue Bonds (Series 2008R), 5.00% (Northeastern University), 10/1/2012 | 1,074,360 |
| 3,250,000 | | Massachusetts HEFA, Revenue Bonds (Series 2008T-1), 4.125% TOBs (Northeastern University), Mandatory Tender 2/16/2012 | 3,353,090 |
| 2,000,000 | | Massachusetts State Development Finance Agency, Resource Recovery Revenue Bonds (Series 1999B), 3.40% TOBs (Waste Management, Inc.), Mandatory Tender 12/1/2012 | 2,032,940 |
| 6,945,000 | | Massachusetts State HFA, (Series 2009-B), 2.50%, 2/1/2011 | 6,992,851 |
| 10,500,000 | | Massachusetts State HFA, Construction Loan Notes (Series 2009D), 4.00%, 9/1/2011 | 10,793,685 |
| 9,000,000 | | Massachusetts State HFA, Construction Loan Notes (Series 2009D), 5.00%, 9/1/2012 | 9,585,900 |
| 6,500,000 | | Montachusett, MA Regional Transit Authority, 2.00% RANs, 8/12/2011 | 6,542,705 |
| 25,000,000 | | Pioneer Valley, MA Transit Authority, 2.00% RANs, 7/29/2011 | 25,157,750 |
| 6,575,000 | | Southeastern Massachusetts Regional Transportation Authority, 1.75% RANs, 9/2/2011 | 6,608,730 |
| 10,000,000 | | Wachesett, MA Regional School District, 1.50% RANs, 6/30/2011 | 10,037,000 |
| | TOTAL | 172,529,495 |
| | Michigan – 1.3% | |
| 9,500,000 | | Michigan State Hospital Finance Authority, Revenue Bonds (Series 1999 B-4), 3.75% TOBs (Ascension Health Credit Group), Mandatory Tender 3/15/2012 | 9,910,400 |
| 2,000,000 | | Michigan State Hospital Finance Authority, Revenue Bonds (Series 2010B), 5.00% (Ascension Health Credit Group), 11/15/2015 | 2,303,480 |
| 6,665,000 | | Michigan State Hospital Finance Authority, Variable Rate Revenue Bonds (Series 1999B-3), 2.00% TOBs (Ascension Health Credit Group), Mandatory Tender 8/1/2014 | 6,724,052 |
| 8,250,000 | | Michigan State Strategic Fund, Revenue Bonds, 3.20% TOBs (Waste Management, Inc.), Mandatory Tender 8/1/2013 | 8,276,482 |
| 14,770,000 | | Michigan Strategic Fund, Variable Rate LO Refunding Revenue Bonds (Series 2009CT), 3.05% TOBs (Detroit Edison Co.), Mandatory Tender 12/3/2012 | 15,133,490 |
| | TOTAL | 42,347,904 |
Annual Shareholder Report21
Principal
Amount | | | Value |
| | Minnesota – 1.0% | |
| $12,000,000 | | Bemidji, MN, Temporary Sales Tax UT GO Bonds, 4.50%, 2/1/2012 | 12,153,240 |
| 2,040,000 | | Chaska, MN ISD No.112, UT GO Bonds, 3.00% (GTD by Minnesota State), 2/1/2011 | 2,058,809 |
| 2,485,000 | | Chaska, MN ISD No.112, UT GO Bonds, 3.00% (GTD by Minnesota State), 2/1/2012 | 2,570,260 |
| 2,965,000 | | Chaska, MN ISD No.112, UT GO Bonds, 3.50% (GTD by Minnesota State), 2/1/2013 | 3,166,027 |
| 3,020,000 | | Chaska, MN ISD No.112, UT GO Bonds, 3.50% (GTD by Minnesota State), 2/1/2014 | 3,284,854 |
| 3,000,000 | | Columbia Heights, MN ISD No. 013, (Series A), 2.00% TANs (GTD by Minnesota State), 8/8/2011 | 3,037,230 |
| 1,000,000 | | Minnesota Agricultural and Economic Development Board, Health Care Facilities Revenue Bonds (Series 2008), 4.00% (Essentia Health Obligated Group)/(Assured Guaranty Corp. INS), 2/15/2012 | 1,038,200 |
| 2,900,000 | | Minnesota State, UT GO Highway Bonds, 3.00%, 12/1/2011 | 2,990,886 |
| 2,500,000 | | Stillwater, MN ISD No. 834, UT GO Bonds, 4.00% (GTD by Minnesota State), 2/1/2011 | 2,531,200 |
| | TOTAL | 32,830,706 |
| | Mississippi – 0.5% | |
| 3,240,000 | | Mississippi Development Bank, Marshall County Correctional Facility Refunding Bonds (Series 2008C), 5.00% (Mississippi State Department of Corrections)/(United States Treasury PRF), 8/1/2012 | 3,505,680 |
| 1,200,000 | | Mississippi Development Bank, Wilkinson County Correctional Facility Refunding Bonds (Series 2008D), 5.00% (Mississippi State Department of Corrections)/(United States Treasury COL), 8/1/2012 | 1,298,400 |
| 10,000,000 | | Mississippi State, Refunding UT GO Bonds, 5.50%, 9/1/2012 | 10,947,000 |
| | TOTAL | 15,751,080 |
| | Missouri – 0.2% | |
| 4,000,000 | | Kirkwood, MO IDA, Tax-Exempt Mandatory Paydown Securities-50 (Series 2010C-3), 6.50% (Aberdeen Heights Project), 5/15/2015 | 4,023,560 |
| 1,665,000 | | Missouri State Environmental Improvement & Energy Resources Authority, PCR Refunding Bonds (Series 2008), 4.375% TOBs (Associated Electric Cooperative, Inc.), Mandatory Tender 3/1/2011 | 1,688,660 |
| | TOTAL | 5,712,220 |
| | Nebraska – 0.1% | |
| 1,170,000 | | Nebraska Public Power District, General Revenue Bonds (Series 2008B), 5.00%, 1/1/2012 | 1,231,565 |
| 1,750,000 | | Omaha, NE, UT GO Bonds, 4.00%, 10/15/2011 | 1,817,235 |
| 1,250,000 | | Omaha, NE, UT GO Bonds, 5.00%, 10/15/2010 | 1,252,463 |
| | TOTAL | 4,301,263 |
Annual Shareholder Report22
Principal
Amount | | | Value |
| | Nevada – 0.2% | |
| $2,350,000 | | Clark County, NV, IDRBs (Series 2003C), 5.45% TOBs (Southwest Gas Corp.), Mandatory Tender 3/1/2013 | 2,466,208 |
| 720,000 | | Clark County, NV, Special Assessment Revenue Bonds (Series 2005), 4.20% (Summerlin-Mesa SID No. 151), 8/1/2011 | 708,674 |
| 1,475,000 | | Henderson, NV, LID No. T-16 LT Obligation Improvement Bonds, 4.50% (Falls at Lake Las Vegas LID No. T-16), 3/1/2011 | 1,437,358 |
| | TOTAL | 4,612,240 |
| | New Hampshire – 0.2% | |
| 5,000,000 | | New Hampshire Business Finance Authority, PCR Refunding Bonds (Series 2010A), 4.50% TOBs (United Illuminating Co.), Mandatory Tender 7/1/2015 | 5,232,550 |
| | New Jersey – 2.8% | |
| 2,250,000 | | Atlantic County Utilities Authority, NJ, Sewer Refunding Revenue Bonds (Series 2009), 4.00% (Assured Guaranty Corp. INS), 1/15/2011 | 2,271,015 |
| 1,500,000 | | Atlantic County Utilities Authority, NJ, Sewer Refunding Revenue Bonds (Series 2009), 5.00% (Assured Guaranty Corp. INS), 1/15/2012 | 1,577,130 |
| 4,625,000 | | Gloucester County, NJ Improvement Authority, Resource Recovery Refunding Revenue Bonds (Series 1999A), 2.625% TOBs (Waste Management, Inc.), Mandatory Tender 12/3/2012 | 4,674,811 |
| 1,000,000 | | Gloucester County, NJ Improvement Authority, Resource Recovery Refunding Revenue Bonds (Series 1999A), 3.375% TOBs (Waste Management, Inc.), Mandatory Tender 12/3/2012 | 1,015,940 |
| 8,000,000 | | Jersey City, NJ, (Series 2010C), 1.75% BANs, 11/30/2010 | 8,004,400 |
| 9,000,000 | | New Brunswick, NJ Parking Authority, Subordinate Project Notes GTD by City of New Brunswick, NJ (Series 2010), 2.00% BANs, 3/1/2011 | 9,030,240 |
| 22,000,000 | | New Brunswick, NJ Parking Authority, Subordinate Project Notes GTD by City of New Brunswick, NJ, 3.00% BANs, 12/15/2010 | 22,051,040 |
| 1,000,000 | | New Jersey EDA, School Facilities Construction Refunding Revenue Bonds (Series 2008W), 5.00% (New Jersey State)/(United States Treasury COL), 3/1/2011 | 1,019,640 |
| 16,500,000 | | Salem County, NJ PCFA, PCR Refunding Bonds (Series 2003B-1), 0.95% TOBs (Public Service Electric & Gas Co.), Mandatory Tender 11/1/2011 | 16,501,650 |
| 16,500,000 | | Salem County, NJ PCFA, PCR Refunding Bonds (Series 2003B-2), 0.95% TOBs (Public Service Electric & Gas Co.), Mandatory Tender 11/1/2011 | 16,501,650 |
| 2,745,050 | | Seaside Heights Borough, NJ, 1.50% BANs, 2/4/2011 | 2,750,046 |
| 2,882,500 | | Trenton, NJ, General Improvement Notes, 3.50% BANs, 12/10/2010 | 2,887,516 |
| | TOTAL | 88,285,078 |
| | New Mexico – 0.2% | |
| 2,000,000 | | Farmington, NM, Refunding Revenue Bonds (Series 2002A), 4.00% TOBs (El Paso Electric Co.)/(FGIC INS), Mandatory Tender 8/1/2012 | 2,007,280 |
Annual Shareholder Report23
Principal
Amount | | | Value |
| $4,000,000 | | New Mexico State Finance Authority, State Transportation Refunding Revenue Bonds (Series 2009A), 5.00%, 6/15/2011 | 4,132,400 |
| | TOTAL | 6,139,680 |
| | New York – 4.4% | |
| 600,000 | | Erie County, NY IDA, School Facility Revenue Bonds (Series 2009A), 5.00% (Buffalo, NY City School District), 5/1/2011 | 615,696 |
| 2,000,000 | | Erie County, NY IDA, School Facility Revenue Bonds (Series 2009A), 5.00% (Buffalo, NY City School District), 5/1/2012 | 2,133,980 |
| 2,000,000 | | Erie County, NY IDA, School Facility Revenue Bonds (Series 2009A), 5.00% (Buffalo, NY City School District), 5/1/2013 | 2,208,040 |
| 1,500,000 | | Erie County, NY IDA, School Facility Revenue Bonds (Series 2009A), 5.00% (Buffalo, NY City School District), 5/1/2014 | 1,696,140 |
| 4,395,000 | | Evans, NY, 2.50% BANs, 10/7/2010 | 4,395,791 |
| 8,520,000 | | Gilbertsville-Mount Upton, NY CSD, 2.25% BANs, 6/30/2011 | 8,607,926 |
| 3,000,000 | | Monroe County, NY, Public Improvement Bonds (Series 2009A), 3.75% (Assured Guaranty Corp. INS), 6/1/2011 | 3,062,940 |
| 4,000,000 | | Nassau County, NY, Refunding UT GO Bonds (Series 2009E), 4.00%, 6/1/2011 | 4,096,640 |
| 1,500,000 | | Nassau County, NY, Refunding UT GO Bonds (Series 2009E), 4.00%, 6/1/2012 | 1,583,415 |
| 9,500,000 | | New York City, NY, (Series C-4) ARS (Assured Guaranty Corp. INS), 0.450%, 10/1/2010 | 9,500,000 |
| 5,000,000 | | New York City, NY, UT GO Bonds (Series 2009H-1), 5.00%, 3/1/2013 | 5,501,400 |
| 6,355,000 | | New York State Dormitory Authority, Revenue Bonds (Series 2009C), 4.00% (School District Financing Program), 10/1/2011 | 6,579,459 |
| 10,000,000 | | New York State Dormitory Authority, Third General Resolution Revenue Bonds (Series 2002B), 5.25% TOBs (State University of New York), Mandatory Tender 5/15/2012 | 10,687,900 |
| 5,000,000 | | New York State Environmental Facilities Corp., Solid Waste Disposal Revenue Bonds (Series 2004A), 2.50% TOBs (Waste Management, Inc.), Mandatory Tender 1/2/2013 | 5,043,300 |
| 17,000,000 | | New York State Thruway Authority, General Revenue Bond Anticipation Notes (Series 2009A), 4.00%, 7/15/2011 | 17,489,430 |
| 20,000,000 | | New York State Urban Development Corp., Service Contract Refunding Revenue Bonds (Series 2010B), 5.00%, 1/1/2013 | 21,800,800 |
| 1,445,000 | | Newburgh, NY, 5.15% BANs, 8/30/2011 | 1,462,976 |
| 4,000,000 | | Newburgh, NY, 5.15% BANs, 8/30/2011 | 4,049,760 |
| 12,552,000 | | South Jefferson, NY CSD, 2.00% BANs, 6/24/2011 | 12,629,195 |
| 2,000,000 | | Triborough Bridge & Tunnel Authority, NY, General Revenue Bonds (Series 2008C), 4.00%, 11/15/2011 | 2,079,340 |
| 2,000,000 | | Triborough Bridge & Tunnel Authority, NY, General Revenue Bonds (Series 2008C), 5.00%, 11/15/2010 | 2,011,800 |
Annual Shareholder Report24
Principal
Amount | | | Value |
| $13,125,000 | | Worcester, NY CSD, 2.00% BANs, 6/24/2011 | 13,140,356 |
| | TOTAL | 140,376,284 |
| | North Carolina – 0.8% | |
| 2,500,000 | | Charlotte, NC, UT GO Bonds, 5.00%, 8/1/2011 | 2,598,625 |
| 1,000,000 | | Mecklenburg County, NC, Refunding UT GO Bonds (Series 2009A), 4.00%, 8/1/2011 | 1,031,100 |
| 500,000 | | New Hanover County, NC, GO Refunding Bonds (Series 2009A), 3.00%, 12/1/2011 | 515,670 |
| 2,000,000 | | New Hanover County, NC, GO Refunding Bonds (Series 2009A), 5.00%, 12/1/2012 | 2,195,180 |
| 1,000,000 | | North Carolina Eastern Municipal Power Agency, Power System Revenue Bonds (Series 2009A), 5.00%, 1/1/2012 | 1,047,990 |
| 1,200,000 | | North Carolina Eastern Municipal Power Agency, Power System Revenue Bonds (Series 2009A), 5.00%, 1/1/2013 | 1,298,796 |
| 2,855,000 | | North Carolina Eastern Municipal Power Agency, Power System Revenue Bonds (Series 2010A), 5.00%, 1/1/2015 | 3,226,093 |
| 2,000,000 | | North Carolina Eastern Municipal Power Agency, Power System Revenue Bonds, 5.00% (Assured Guaranty Corp. INS), 1/1/2013 | 2,175,860 |
| 1,000,000 | | North Carolina Medical Care Commission, Hospital Revenue Refunding Bonds (Series 2010), 5.00% (North Carolina Baptist), 6/1/2013 | 1,098,410 |
| 1,500,000 | | North Carolina Municipal Power Agency No. 1, Revenue Bonds (Series 2008C), 5.00% (United States Treasury COL), 1/1/2011 | 1,517,835 |
| 3,265,000 | | North Carolina State University at Raleigh, General Revenue Bonds (Series 2008B), 5.00%, 10/1/2010 | 3,265,424 |
| 2,000,000 | | North Carolina State, Public Improvement UT GO Bonds (Series 2005A), 5.50%, 3/1/2011 | 2,043,820 |
| 2,000,000 | | North Carolina State, Refunding UT GO Bonds (Series 2003E), 5.00%, 2/1/2012 | 2,122,600 |
| 2,000,000 | | North Carolina State, UT GO Refunding Bonds (Series E), 5.00%, 2/1/2013 | 2,206,080 |
| | TOTAL | 26,343,483 |
| | Ohio – 3.0% | |
| 1,000,000 | | Buckeye Tobacco Settlement Financing Authority, OH, Tobacco Settlement Asset-Backed Bonds (Series 2007A-1), 5.00%, 6/1/2012 | 1,032,770 |
| 5,000,000 | | Cleveland, OH Public Power System, Revenue Refunding Bonds (Series 2010), 5.00%, 11/15/2014 | 5,656,450 |
| 2,085,000 | | Lucas County, OH, Adjustable Rate Demand Health Care Facilities Revenue Bonds (Series 2002), 3.75% TOBs (Franciscan Care Center), Optional Tender 3/1/2011 | 2,090,108 |
| 8,000,000 | | Ohio State Air Quality Development Authority, Air Quality Revenue Refunding Bonds (Series 2009A), 3.875% TOBs (Columbus Southern Power Company), Mandatory Tender 6/1/2014 | 8,376,560 |
Annual Shareholder Report25
Principal
Amount | | | Value |
| $25,890,000 | | Ohio State Air Quality Development Authority, PCR Refunding Bonds (Series 2006A), 2.25% TOBs (FirstEnergy Solutions Corp.), Mandatory Tender 6/3/2013 | 25,912,265 |
| 6,000,000 | | Ohio State Air Quality Development Authority, PCR Refunding Bonds (Series 2009-B), 5.25% TOBs (FirstEnergy Solutions Corp.), Mandatory Tender 3/1/2011 | 6,097,620 |
| 12,150,000 | | Ohio State Air Quality Development Authority, PCR Refunding Bonds (Series 2009-D), 4.75% TOBs (FirstEnergy Solutions Corp.), Mandatory Tender 8/1/2012 | 12,720,321 |
| 2,900,000 | | Ohio State Air Quality Development Authority, PCR Revenue Refunding Bonds (Series 2008B), 3.00% TOBs (FirstEnergy Solutions Corp.), Mandatory Tender 4/2/2012 | 2,940,368 |
| 3,000,000 | | Ohio State Higher Educational Facility Commission, Higher Educational Facility Revenue Bonds (Series 2009), 5.00% (Oberlin College), 10/1/2014 | 3,455,040 |
| 3,000,000 | | Ohio State Water Development Authority, 1.50% TOBs (Waste Management, Inc.), Mandatory Tender 12/1/2010 | 3,001,530 |
| 1,200,000 | | Ohio State, Hospital Revenue Bonds (Series 2008A), 4.00% (Cleveland Clinic), 1/1/2012 | 1,245,612 |
| 1,750,000 | | Ohio State, Hospital Revenue Bonds (Series 2008A), 4.00% (Cleveland Clinic), 1/1/2013 | 1,857,748 |
| 5,500,000 | | Ohio Water Development Authority, PCR Revenue Refunding Bonds (Series 2008B), 3.00% TOBs (FirstEnergy Solutions Corp.), Mandatory Tender 4/2/2012 | 5,559,400 |
| 3,000,000 | | Ohio Water Development Authority, Solid Waste Revenue Bonds (Series 2004), 2.625% TOBs (Waste Management, Inc.), Mandatory Tender 1/2/2013 | 3,020,280 |
| 12,230,000 | | Richland County, OH, 3.50% BANs, 1/11/2011 | 12,271,093 |
| | TOTAL | 95,237,165 |
| | Oklahoma – 0.8% | |
| 1,000,000 | | Oklahoma County, OK Finance Authority, Educational Facilities Lease Revenue Bonds (Series 2010), 3.00% (Putnam City Public Schools), 3/1/2011 | 1,007,930 |
| 3,825,000 | | Oklahoma County, OK Finance Authority, Educational Facilities Lease Revenue Bonds (Series 2010), 3.50% (Putnam City Public Schools), 3/1/2012 | 3,931,373 |
| 1,000,000 | | Oklahoma County, OK Finance Authority, Educational Facilities Lease Revenue Bonds (Series 2010), 4.00% (Putnam City Public Schools), 3/1/2013 | 1,056,260 |
| 18,000,000 | | Oklahoma State Municipal Power Authority, Power Supply System Revenue Refunding Bonds (Series 2005A), 1.05%, 1/1/2023 | 17,855,640 |
| | TOTAL | 23,851,203 |
| | Pennsylvania – 5.8% | |
| 13,200,000 | | Allegheny County, PA HDA, Adjustable Rate Hospital Revenue Bonds (Series 2010F), 1.32% (UPMC Health System), 5/15/2038 | 13,069,320 |
Annual Shareholder Report26
Principal
Amount | | | Value |
| $2,040,000 | | Allegheny County, PA HDA, Hospital Revenue Bonds (Series 2008B), 5.00% (UPMC Health System), 6/15/2011 | 2,101,690 |
| 5,000,000 | | Allegheny County, PA HDA, Revenue Bonds (Series 2008A), 5.00% (UPMC Health System), 9/1/2011 | 5,194,800 |
| 3,000,000 | | Allegheny County, PA HDA, Revenue Bonds (Series 2010A), 3.00% (UPMC Health System), 5/15/2011 | 3,043,050 |
| 5,000,000 | | Allegheny County, PA HDA, Revenue Bonds (Series 2010A), 4.00% (UPMC Health System), 5/15/2012 | 5,223,850 |
| 10,000,000 | | Allegheny County, PA HDA, Revenue Bonds (Series 2010A), 5.00% (UPMC Health System), 5/15/2013 | 10,943,500 |
| 4,125,000 | | Allegheny County, PA HDA, Revenue Bonds (Series 2010A), 5.00% (UPMC Health System), 5/15/2015 | 4,677,379 |
| 2,180,000 | | Allegheny County, PA, GO Bonds (Series C-63), 3.00%, 11/1/2011 | 2,232,298 |
| 6,970,000 | | Allegheny County, PA, GO Bonds (Series C-63), 5.00%, 11/1/2012 | 7,515,472 |
| 7,000,000 | | Beaver County, PA IDA, PCR Refunding Bonds (Series 2008B), 3.00% TOBs (FirstEnergy Solutions Corp.), Mandatory Tender 4/2/2012 | 7,075,600 |
| 10,900,000 | | Bucks County, PA IDA, Solid Waste Revenue Bonds, 2.875% TOBs (Waste Management, Inc.), Mandatory Tender 2/1/2013 | 11,009,327 |
| 7,000,000 | | Pennsylvania EDFA, (Series B), 0.90% TOBs (Republic Services, Inc.), Mandatory Tender 1/3/2011 | 7,000,000 |
| 3,500,000 | | Pennsylvania EDFA, Exempt Facilities Revenue Bonds (Series 2002A), 1.50% TOBs (FirstEnergy Solutions Corp.), Mandatory Tender 6/1/2011 | 3,499,195 |
| 3,000,000 | | Pennsylvania EDFA, Exempt Facilities Revenue Refunding Bonds (Series 2009A), 3.00% TOBs (PPL Energy Supply, LLC), Mandatory Tender 9/1/2015 | 3,025,980 |
| 8,350,000 | | Pennsylvania EDFA, Exempt Facilities Revenue Refunding Bonds (Series 2009A), 5.00% TOBs (Exelon Generation Co. LLC), Mandatory Tender 6/1/2012 | 8,804,407 |
| 1,500,000 | | Pennsylvania EDFA, Exempt Facilities Revenue Refunding Bonds (Series 2009B), 3.00% TOBs (PPL Energy Supply, LLC), Mandatory Tender 9/1/2015 | 1,512,990 |
| 6,000,000 | | Pennsylvania EDFA, PCR Refunding Bonds (Series 2008), 4.85% TOBs (PPL Electric Utilities Corp.), Mandatory Tender 10/1/2010 | 6,000,360 |
| 19,955,000 | | Pennsylvania EDFA, Solid Waste Disposal Revenue Bonds, 2.625% TOBs (Waste Management, Inc.), Mandatory Tender 12/3/2012 | 20,137,189 |
| 3,035,000 | | Pennsylvania EDFA, Solid Waste Disposal Revenue Bonds (Series 2006), 2.75% (Waste Management, Inc.), 9/1/2013 | 3,072,725 |
| 1,000,000 | | Pennsylvania State Higher Education Facilities Authority, Revenue Bonds (Series 2008B), 5.00% (University of Pennsylvania Health System), 8/15/2013 | 1,109,610 |
| 4,170,000 | | Pennsylvania State Higher Education Facilities Authority, Revenue Bonds (Series 2010E), 3.00% (UPMC Health System), 5/15/2011 | 4,229,840 |
| 3,000,000 | | Pennsylvania State Higher Education Facilities Authority, Revenue Bonds (Series 2010E), 3.50% (UPMC Health System), 5/15/2012 | 3,110,250 |
Annual Shareholder Report27
Principal
Amount | | | Value |
| $7,905,000 | | Pennsylvania State Higher Education Facilities Authority, Revenue Bonds (Series 2010E), 3.50% (UPMC Health System), 5/15/2013 | 8,346,020 |
| 12,070,000 | | Pennsylvania State Turnpike Commission, Variable Rate Turnpike Revenue Bonds (Series 2009C), 1.32%, 12/1/2014 | 11,951,955 |
| 25,000,000 | | Philadelphia, PA School District, LT GO Notes (Series A of 2010-2011), 2.50% TRANs, 6/30/2011 | 25,278,000 |
| 2,410,000 | | Sayre, PA, Health Care Facilities Authority, Revenue Bonds, 0.849% (Guthrie Healthcare System, PA), 12/1/2017 | 2,215,224 |
| 2,100,000 | | University of Pittsburgh, University Refunding Bonds (Series 2009A), 5.00%, 9/15/2011 | 2,194,059 |
| | TOTAL | 183,574,090 |
| | South Carolina – 0.5% | |
| 3,000,000 | | Jasper County, SC, Special Source Revenue (Series 2010), 2.35% BANs, 2/11/2011 | 3,000,570 |
| 5,950,000 | | South Carolina Jobs-EDA, Hospital Revenue Bonds (Floating Rate Notes), 1.02% TOBs (Palmetto Health Alliance) Mandatory Tender, 8/1/2013 | 5,643,159 |
| 5,285,000 | | South Carolina State Public Service Authority (Santee Cooper), Refunding Revenue Obligations (Series 2009A), 5.00%, 1/1/2012 | 5,582,968 |
| | TOTAL | 14,226,697 |
| | Tennessee – 0.3% | |
| 4,500,000 | | Lewisburg, TN IDB, Solid Waste Disposal Revenue Bonds (Series 2006), 2.50% (Waste Management, Inc.), 7/1/2012 | 4,511,835 |
| 62,520 | 2 | Sumner County, TN Health, Educational & Housing Facilities Board, Hospital Revenue & Refunding Improvement Bonds (Series 2007A), 5.25% (Sumner Regional Health Systems, Inc.), 11/1/2011 | 3,139 |
| 57,518 | 2 | Sumner County, TN Health, Educational & Housing Facilities Board, Hospital Revenue & Refunding Improvement Bonds (Series 2007A), 5.25% (Sumner Regional Health Systems, Inc.), 11/1/2012 | 2,887 |
| 125,040 | 2 | Sumner County, TN Health, Educational & Housing Facilities Board, Hospital Revenue & Refunding Improvement Bonds (Series 2007A), 5.25% (Sumner Regional Health Systems, Inc.), 11/1/2013 | 6,277 |
| 5,585,000 | | Tennessee State, GO Bonds (Series 2009A), 4.00%, 5/1/2012 | 5,901,669 |
| | TOTAL | 10,425,807 |
| | Texas – 3.9% | |
| 1,500,000 | | Austin, TX, Water and Wastewater System Refunding Revenue Bonds (Series 2008A), 3.00%, 11/15/2011 | 1,544,415 |
| 6,500,000 | | Dallas, TX ISD, UT GO Refunding Bonds (Series 2009), 4.00%, 2/15/2011 | 6,588,465 |
| 2,000,000 | | Dallas-Fort Worth, TX International Airport, Joint Revenue Refunding Bonds (Series 2009A), 4.00%, 11/1/2011 | 2,072,400 |
| 2,000,000 | | Dallas-Fort Worth, TX International Airport, Joint Refunding Revenue Bonds (Series 2009A), 4.00%, 11/1/2012 | 2,124,060 |
Annual Shareholder Report28
Principal
Amount | | | Value |
| $1,855,000 | | Grapevine, TX, Combination Tax & Tax Increment Reinvestment Zone Number One Refunding Revenue Bonds (Series 2009A), 3.00%, 2/15/2011 | 1,872,808 |
| 1,540,000 | | Grapevine, TX, Combination Tax & Tax Increment Reinvestment Zone Number One Refunding Revenue Bonds (Series 2009A), 4.25%, 2/15/2012 | 1,614,998 |
| 3,170,000 | | Grapevine, TX, Refunding LT GO Bonds (Series 2009), 3.00%, 2/15/2011 | 3,200,432 |
| 4,345,000 | | Grapevine, TX, Refunding LT GO Bonds (Series 2009), 5.00%, 2/15/2012 | 4,601,094 |
| 1,000,000 | | Gulf Coast, TX Waste Disposal Authority, Solid Waste Disposal Revenue Bonds (Series 2003D), 4.55% (Waste Management, Inc.), 4/1/2012 | 1,026,890 |
| 2,300,000 | | Harris County, TX Cultural Education Facilities Finance Corp., Revenue Bonds (Series 2008B), 5.25% (Methodist Hospital, Harris County, TX), 12/1/2012 | 2,490,831 |
| 3,400,000 | | Harris County, TX HFDC, (Series A-3) ARS (Christus Health System)/(Assured Guaranty Municipal Corp. INS), 0.938%, 10/7/2010 | 3,400,000 |
| 4,700,000 | | Harris County, TX HFDC, (Series A-4) ARS (Christus Health System)/(Assured Guaranty Municipal Corp. INS), 0.938%, 10/7/2010 | 4,700,000 |
| 4,450,000 | | Harris County, TX HFDC, (Series A-5) ARS (Christus Health System)/(Assured Guaranty Municipal Corp. INS), 1.000%, 10/7/2010 | 4,450,000 |
| 17,500,000 | | Harris County, TX HFDC, (Series A-6) ARS (Christus Health System)/(Assured Guaranty Municipal Corp. INS), 1.000%, 10/7/2010 | 17,500,000 |
| 1,000,000 | | Harris County, TX, Permanent Improvement Refunding LT GO Bonds (Series 2008B), 4.00%, 10/1/2010 | 1,000,100 |
| 750,000 | | Harris County, TX, Permanent Improvement Refunding LT GO Bonds (Series 2008B), 5.00% (United States Treasury PRF), 10/1/2011 | 784,800 |
| 500,000 | | Harris County, TX, Permanent Improvement Refunding LT GO Bonds (Series 2008B), 5.00%, 10/1/2011 | 523,355 |
| 3,500,000 | | Houston, TX Combined Utility System, First Lien Refunding Revenue Bonds (Series 2004C-2B), 5.00% TOBs (AMBAC INS), Mandatory Tender 5/15/2011 | 3,593,660 |
| 500,000 | | Lower Colorado River Authority, TX, Refunding Revenue Bonds (Series 20008), 5.00% (LCRA Transmission Services Corp.), 5/15/2011 | 513,925 |
| 500,000 | | Lower Colorado River Authority, TX, Refunding Revenue Bonds (Series 2008), 5.00% (LCRA Transmission Services Corp.)/(Berkshire Hathaway Assurance Corp. INS), 5/15/2011 | 514,325 |
| 6,825,000 | | Lubbock, TX HFDC, Variable Rate Refunding Revenue Bonds (Series 2008A), 3.05% TOBs (St. Joseph Health System), Mandatory Tender 10/16/2012 | 6,961,091 |
| 7,000,000 | | Mission, TX Economic Development Corp., Revenue Bonds, 1.30% TOBs (Republic Services, Inc.), Mandatory Tender 10/1/2010 | 7,000,000 |
| 1,000,000 | | San Antonio, TX Water System, Junior Lien Refunding Revenue Bonds (Series 2010), 3.00%, 5/15/2012 | 1,039,160 |
Annual Shareholder Report29
Principal
Amount | | | Value |
| $1,000,000 | | Tarrant County, TX Cultural Education Facilities Finance Corp., Retirement Facilities Revenue Bonds (Series 2007), 5.25% (Buckingham Senior Living Community), 11/15/2010 | 999,740 |
| 5,000,000 | | Texas State Public Finance Authority, Refunding UT GO Bonds (Series 2009A), 4.00% (Texas State), 10/1/2011 | 5,184,600 |
| 6,415,000 | | Texas State Public Finance Authority, Refunding UT GO Bonds (Series 2009A), 5.00% (Texas State), 10/1/2012 | 6,991,580 |
| 7,250,000 | | Texas State Public Finance Authority, UT GO Bonds (Series 2008A), 5.00% (Texas State), 10/1/2010 | 7,250,943 |
| 7,150,000 | | Texas State Public Finance Authority, UT GO Refunding Bonds (Series 2010A), 5.00% (Texas State), 10/1/2013 | 8,064,270 |
| 14,060,000 | | Texas State Public Finance Authority, UT GO Refunding Bonds (Series 2010B), 5.00% (Texas State), 10/1/2013 | 15,857,852 |
| 1,500,000 | | Texas State Transportation Commission, First Tier Revenue Bonds, 5.00%, 4/1/2011 | 1,535,550 |
| | TOTAL | 125,001,344 |
| | Utah – 1.0% | |
| 3,300,000 | | Box Elder County, UT, PCRBs (Series 1984), 1.90% TOBs (Nucor Corp.), Optional Tender 10/1/2010 | 3,309,042 |
| 3,000,000 | | Intermountain Power Agency, UT, Subordinated Power Supply Refunding Revenue Bonds (Series 2008A), 5.25%, 7/1/2011 | 3,107,130 |
| 2,765,000 | | Intermountain Power Agency, UT, Subordinated Supply Refunding Revenue Bonds (Series 2009A), 5.00%, 7/1/2011 | 2,858,568 |
| 3,000,000 | | Intermountain Power Agency, UT, Subordinated Supply Refunding Revenue Bonds (Series 2009A), 5.00%, 7/1/2012 | 3,219,120 |
| 1,400,000 | | Riverton, UT Hospital Revenue Authority, Hospital Revenue Bonds (Series 2009), 5.00% (IHC Health Services, Inc.), 8/15/2013 | 1,549,254 |
| 5,320,000 | | Utah State, GO Bonds (Series 2009C), 3.00%, 7/1/2012 | 5,559,400 |
| 10,600,000 | | Utah State, UT GO Bonds (Series 2003A), 5.00%, 7/1/2012 | 11,446,834 |
| | TOTAL | 31,049,348 |
| | Virginia – 2.3% | |
| 2,540,000 | | Fairfax County, VA Sewer Revenue, Revenue Bonds (Series 2009), 5.00%, 7/15/2012 | 2,747,264 |
| 4,275,000 | | Hopewell, VA, Sewer System Revenue Bonds (Series 2009), 4.00%, 11/15/2012 | 4,421,162 |
| 3,000,000 | | Louisa, VA IDA, PCR Refunding Bonds (Series 2008C), 5.00% TOBs (Virginia Electric & Power Co.), Mandatory Tender 12/1/2011 | 3,124,950 |
| 7,000,000 | | Louisa, VA IDA, Solid Waste & Sewage Disposal Revenue Bonds (Series 2000A), 1.375% TOBs (Virginia Electric & Power Co.), Mandatory Tender 4/1/2011 | 7,004,340 |
| 37,690,000 | | Norfolk, VA, (Series C), 1.50% BANs, 4/1/2011 | 37,888,626 |
| 1,650,000 | | Virginia College Building Authority, Educational Facilities Revenue Bonds (Series 2009A), 5.00%, 2/1/2012 | 1,750,073 |
Annual Shareholder Report30
Principal
Amount | | | Value |
| $4,000,000 | | Virginia Peninsula Port Authority, Refunding Revenue Bonds (Series 2003), 5.00% TOBs (Dominion Terminal Associates)/(GTD by Dominion Resources, Inc.), Mandatory Tender 10/1/2011 | 4,107,880 |
| 2,825,000 | | Virginia State Public Building Authority, Public Facilities Revenue Bonds (Series 2006B), 5.00%, 8/1/2012 | 3,059,644 |
| 3,290,000 | | Virginia State Public Building Authority, Public Facilities Revenue Bonds (Series 2009B), 5.00%, 8/1/2011 | 3,419,396 |
| 3,000,000 | | Virginia State Public School Authority, School Financing Bonds (Series 2009C), 4.00%, 8/1/2012 | 3,194,400 |
| 3,570,000 | | York County, VA EDA, PCR Refunding Bonds (Series 2009A), 4.05% TOBs (Virginia Electric & Power Co.), Mandatory Tender 5/1/2014 | 3,807,191 |
| | TOTAL | 74,524,926 |
| | Washington – 1.3% | |
| 2,165,000 | | Chelan County, WA Public Utility District No. 1, Consolidated System Subordinate Revenue Notes (Series 2008A), 5.00%, 7/1/2013 | 2,402,024 |
| 1,000,000 | | Clark County, WA Public Utility District No. 001, Electric System Revenue & Refunding Bonds (Series 2009), 5.00%, 1/1/2011 | 1,010,880 |
| 2,155,000 | | Clark County, WA Public Utility District No. 001, Electric System Revenue & Refunding Bonds (Series 2009), 5.00%, 1/1/2012 | 2,265,077 |
| 3,000,000 | | Energy Northwest, WA, Project 1 Electric Refunding Revenue Bonds (Series 2008D), 5.00%, 7/1/2011 | 3,105,930 |
| 7,000,000 | 3 | Washington State EDFA, Solid Waste Disposal Revenue Bonds (Series 2005D), 1.75% TOBs (Waste Management, Inc.), Optional Tender 9/1/2011 | 6,994,820 |
| 8,000,000 | 3 | Washington State EDFA, Solid Waste Disposal Revenue Bonds (Series 2008), 1.75% TOBs (Waste Management, Inc.), Optional Tender 9/1/2011 | 7,994,080 |
| 8,520,000 | | Washington State Health Care Facilities Authority, Revenue Bonds (Series 2010A), 3.00% (Multicare Health System), 8/15/2011 | 8,644,818 |
| 9,335,000 | | Washington State, Motor Vehicle Fuel Tax GO Bonds (Series 2010B), 5.00%, 8/1/2012 | 10,101,404 |
| | TOTAL | 42,519,033 |
| | West Virginia – 0.5% | |
| 5,000,000 | | West Virginia EDA, PCR Refunding Revenue Bonds (Series 2008D), 4.85% TOBs (Appalachian Power Co.), Mandatory Tender 9/4/2013 | 5,351,300 |
| 10,000,000 | | West Virginia EDA, Solid Waste Disposal Facilities Revenue Bonds (Series 2010A), 3.125% TOBs (Ohio Power Co.), Mandatory Tender 4/1/2015 | 10,162,000 |
| | TOTAL | 15,513,300 |
| | Wisconsin – 0.9% | |
| 3,750,000 | | Oak Creek, WI Waterworks System, BANs (Series 2009), 4.00%, 4/1/2011 | 3,794,437 |
Annual Shareholder Report31
Principal
Amount | | | Value |
| $12,000,000 | | Wisconsin Health & Educational Facilities Authority, Revenue Bonds (Series 2009B), 4.75% TOBs (Aurora Health Care, Inc.), Mandatory Tender 8/15/2014 | 12,896,640 |
| 2,840,000 | | Wisconsin Public Power System, Power Supply System Revenue Bonds (Series 2008A), 4.00%, 7/1/2011 | 2,903,162 |
| 4,000,000 | | Wisconsin State Petroleum Inspection Fee, Refunding Revenue Bonds (2009 Series 1), 5.00%, 7/1/2013 | 4,442,560 |
| 2,000,000 | | Wisconsin State Transportation, Revenue Bonds (Series 2009A), 3.50%, 7/1/2013 | 2,147,860 |
| 2,420,000 | | Wisconsin State Transportation, Revenue Bonds (Series 2009A), 3.50%, 7/1/2014 | 2,636,663 |
| 750,000 | | Wisconsin State Transportation, Revenue Bonds (Series 2009A), 4.00%, 7/1/2012 | 794,932 |
| | TOTAL | 29,616,254 |
| | Wyoming – 0.1% | |
| 4,200,000 | | Albany County, WY, PCRBs (Series 1985), 2.50% TOBs (Union Pacific Railroad Co.)/(GTD by Union Pacific Corp.), Optional Tender 12/1/2010 | 4,210,710 |
| | TOTAL MUNICIPAL BONDS
(IDENTIFIED COST $1,966,715,783) | 1,987,018,075 |
| | SHORT-TERM MUNICIPALS – 37.1%;5 | |
| | Alabama – 3.3% | |
| 49,000,000 | | Birmingham, AL Medical Clinic Board, (Series 1991) Weekly VRDNs (University of Alabama Health System)/(SunTrust Bank LOC), 0.620%, 10/6/2010 | 49,000,000 |
| 6,260,000 | | Gulf Shores, AL Medical Clinic Board, (Series 2007) Weekly VRDNs (Colonial Pinnacle MOB, LLC)/(Regions Bank, Alabama LOC), 1.080%, 10/7/2010 | 6,260,000 |
| 15,500,000 | | Health Care Authority for Baptist Health, AL, (Series 2008-A) Weekly VRDNs (Regions Bank, Alabama LOC), 1.080%, 10/7/2010 | 15,500,000 |
| 2,280,000 | | Marshall County, AL, Special Obligation School Refunding Warrant (Series 1994) Weekly VRDNs (Marshall County, AL Board of Education)/(Regions Bank, Alabama LOC), 1.130%, 10/7/2010 | 2,280,000 |
| 6,070,000 | | Mobile, AL Downtown Redevelopment Authority, (Series 2007) Weekly VRDNs (Lafayette Plaza Hotel)/(Regions Bank, Alabama LOC), 1.080%, 10/7/2010 | 6,070,000 |
| 14,500,000 | | Mobile, AL Spring Hill College Educational Building Authority, (Series 2007) Weekly VRDNs (Spring Hill College, AL)/(Regions Bank, Alabama LOC), 1.210%, 10/6/2010 | 14,500,000 |
| 10,000,000 | | Washington County, AL IDA, (Series 2007: Gulf Opportunity Zone Bonds) Weekly VRDNs (Bay Gas Storage Company, Ltd.)/(Regions Bank, Alabama LOC), 1.000%, 10/6/2010 | 10,000,000 |
| | TOTAL | 103,610,000 |
Annual Shareholder Report32
Principal
Amount | | | Value |
| | Alaska – 0.3% | |
| $8,300,000 | | Valdez, AK Marine Terminal, (Series 2003B) Daily VRDNs (BP Pipelines (Alaska) Inc.)/(GTD by BP PLC), 0.330%, 10/1/2010 | 8,300,000 |
| | Arizona – 0.5% | |
| 15,000,000 | | Ak-Chin Indian Community, AZ, (Series 2008) Weekly VRDNs (Bank of America N.A. LOC), 0.320%, 10/7/2010 | 15,000,000 |
| | Arkansas – 0.3% | |
| 6,425,000 | | Arkansas Development Finance Authority, (Series 2001D) Weekly VRDNs (ChapelRidge of Cabot Housing Associates)/(Regions Bank, Alabama LOC), 1.280%, 10/7/2010 | 6,425,000 |
| 2,055,000 | | Pulaski County, AR Public Facilities Board, (Series 2002: Waterford and Bowman Heights Apartments) Weekly VRDNs (Bailey Properties, LLC)/(Regions Bank, Alabama LOC), 1.280%, 10/7/2010 | 2,055,000 |
| | TOTAL | 8,480,000 |
| | California – 1.6% | |
| 10,900,000 | | ABAG Finance Authority for Non-Profit Corporations, CA, Oshman Family JCC (Series 2007) Daily VRDNs (Albert L. Schultz Jewish Community Center)/(Bank of America N.A. LOC), 0.320%, 10/1/2010 | 10,900,000 |
| 28,600,000 | | California State, GO Tax Exempt Notes, 0.38% CP (CALPERS (California Public Employees Retirement System), CALSTRS (California State Teachers' Retirement System), Credit Agricole Corporate and Investment Bank, Dexia Credit Local, Landesbank Hessen-Thuringen, Royal Bank of Canada, Montreal and Wells Fargo Bank, N.A. LOCs), Mandatory Tender 10/7/2010 | 28,600,000 |
| 11,495,000 | 3,4 | San Diego, CA USD, (Series 2008-066) Weekly VRDNs (Dexia Credit Local LIQ)/(Dexia Credit Local LOC), 0.460%, 10/7/2010 | 11,495,000 |
| | TOTAL | 50,995,000 |
| | Florida – 1.9% | |
| 1,110,000 | | Collier County, FL Educational Facilities Authority, (Series 2004) Weekly VRDNs (International College, Inc.)/(Fifth Third Bank, Cincinnati LOC), 0.440%, 10/1/2010 | 1,110,000 |
| 2,000,000 | | Florida Higher Educational Facilities Financing Authority, (Series 2008) Weekly VRDNs (Ringling College of Art and Design, Inc.)/(SunTrust Bank LOC), 0.620%, 10/6/2010 | 2,000,000 |
| 32,440,000 | 3,4 | Hillsborough County, FL IDA, (Series MT-008) Weekly VRDNs (University Community Hospital)/(GTD by Bank of America N.A.)/(Merrill Lynch & Co., Inc. LIQ), 0.490%, 10/7/2010 | 32,440,000 |
| 19,070,000 | | New College of Florida Development Corp., (Series 2006) Weekly VRDNs (SunTrust Bank LOC), 0.620%, 10/6/2010 | 19,070,000 |
| 7,000,000 | | UCF Health Facilities Corp., Capital Improvement Revenue Bonds (Series 2007) Weekly VRDNs (UCF Health Sciences Campus at Lake Nona)/(Fifth Third Bank, Cincinnati LOC), 0.440%, 10/1/2010 | 7,000,000 |
| | TOTAL | 61,620,000 |
Annual Shareholder Report33
Principal
Amount | | | Value |
| | Georgia – 1.6% | |
| $14,615,000 | | Albany-Dougherty County, GA Hospital Authority, (Series 2008B) Daily VRDNs (Phoebe Putney Memorial Hospital)/(Regions Bank, Alabama LOC), 0.750%, 10/1/2010 | 14,615,000 |
| 16,000,000 | | DeKalb County, GA MFH Authority, (Series 2001) Weekly VRDNs (Signature Station Apartments)/(Regions Bank, Alabama LOC), 1.280%, 10/7/2010 | 16,000,000 |
| 19,225,000 | | Walker, Dade & Catoosa Counties, GA Hospital Authority, (Series 2008) Weekly VRDNs (Hutcheson Medical Center, Inc.)/(Regions Bank, Alabama LOC), 1.080%, 10/7/2010 | 19,225,000 |
| | TOTAL | 49,840,000 |
| | Illinois – 1.0% | |
| 8,800,000 | | Illinois Finance Authority, (Series 2006) Weekly VRDNs (Reliable Materials Lyons LLC)/(Marshall & Ilsley Bank, Milwaukee LOC), 2.510%, 10/6/2010 | 8,800,000 |
| 11,865,000 | 3,4 | Illinois State, (PT-3523) Weekly VRDNs (Dexia Credit Local LIQ), 0.470%, 10/7/2010 | 11,865,000 |
| 10,375,000 | 3,4 | Illinois State, (PT-3524) Weekly VRDNs (Dexia Credit Local LIQ), 0.470%, 10/7/2010 | 10,375,000 |
| | TOTAL | 31,040,000 |
| | Kentucky – 0.8% | |
| 8,500,000 | | Boyd County, KY, (Series 2003) Weekly VRDNs (Air Products & Chemicals, Inc.), 0.530%, 10/6/2010 | 8,500,000 |
| 9,860,000 | | Carroll County, KY, (Series 2001) Weekly VRDNs (North American Stainless, LP)/(Fifth Third Bank, Cincinnati LOC), 0.520%, 10/1/2010 | 9,860,000 |
| 8,000,000 | | Glasgow, KY, (Series 1990) Weekly VRDNs (ACK Controls)/(Bank of Tokyo-Mitsubishi UFJ Ltd. LOC), 0.430%, 10/6/2010 | 8,000,000 |
| | TOTAL | 26,360,000 |
| | Louisiana – 2.4% | |
| 9,900,000 | | Louisiana Public Facilities Authority Weekly VRDNs (Grigsby Properties, LLC)/(Regions Bank, Alabama LOC), 1.080%, 10/7/2010 | 9,900,000 |
| 17,500,000 | | Louisiana Public Facilities Authority, (Series 2007) Daily VRDNs (Air Products & Chemicals, Inc.), 0.450%, 10/1/2010 | 17,500,000 |
| 24,700,000 | | Louisiana Public Facilities Authority, (Series 2008A) Daily VRDNs (Air Products & Chemicals, Inc.), 0.460%, 10/1/2010 | 24,700,000 |
| 6,000,000 | | Louisiana Public Facilities Authority, (Series 2008C) Daily VRDNs (Air Products & Chemicals, Inc.), 0.450%, 10/1/2010 | 6,000,000 |
| 20,000,000 | | St. Tammany Parish Development District, LA, (Series 2008A) Weekly VRDNs (Slidell Development Company, LLC)/(Regions Bank, Alabama LOC), 1.080%, 10/7/2010 | 20,000,000 |
| | TOTAL | 78,100,000 |
| | Massachusetts – 2.3% | |
| 1,500,000 | | Commonwealth of Massachusetts, (Series 2000A) Daily VRDNs (GTD by Landesbank Baden-Wurttemberg LIQ), 0.330%, 10/1/2010 | 1,500,000 |
Annual Shareholder Report34
Principal
Amount | | | Value |
| $2,400,000 | | Commonwealth of Massachusetts, Consolidated Loan (Series 2006A) Daily VRDNs (Dexia Credit Local LIQ), 0.340%, 10/1/2010 | 2,400,000 |
| 10,000,000 | | Massachusetts Development Finance Agency, (Series 2004), 0.95% CP (Nantucket Electric Co.)/(GTD by Massachusetts Electric Co.), Mandatory Tender 11/8/2010 | 10,000,000 |
| 1,755,000 | | Massachusetts Development Finance Agency, (Series 2004), 1.00% CP (Nantucket Electric Co.)/(GTD by Massachusetts Electric Co.), Mandatory Tender 11/8/2010 | 1,755,000 |
| 45,550,000 | | Massachusetts IFA, (Series 1992B), 0.90% CP (New England Power Co.), Mandatory Tender 11/8/2010 | 45,550,000 |
| 11,600,000 | 3,4 | Massachusetts State Special Obligation, (PT-3612) Weekly VRDNs (Dexia Credit Local LIQ)/(Dexia Credit Local LOC), 0.470%, 10/7/2010 | 11,600,000 |
| | TOTAL | 72,805,000 |
| | Michigan – 2.6% | |
| 82,240,000 | 3,4 | Detroit, MI City School District, (PT-3480) Weekly VRDNs (Assured Guaranty Municipal Corp. INS)/(Dexia Credit Local LIQ), 0.400%, 10/14/2010 | 82,240,000 |
| | Mississippi – 3.2% | |
| 17,700,000 | | Mississippi Business Finance Corp., (Series 2007) Weekly VRDNs (DDR Gulfport Promenade LLC)/(Regions Bank, Alabama LOC), 1.080%, 10/7/2010 | 17,700,000 |
| 12,750,000 | | Mississippi Business Finance Corp., (Series 2007) Weekly VRDNs (Gulf Ship, LLC)/(Regions Bank, Alabama LOC), 1.080%, 10/7/2010 | 12,750,000 |
| 66,050,000 | | Mississippi Business Finance Corp., (Series 2008) Weekly VRDNs (200 Renaissance, LLC)/(Regions Bank, Alabama LOC), 1.080%, 10/7/2010 | 66,050,000 |
| 6,415,000 | | Mississippi Business Finance Corp., (Series A) Weekly VRDNs (Mississippi College)/(Regions Bank, Alabama LOC), 1.080%, 10/7/2010 | 6,415,000 |
| | TOTAL | 102,915,000 |
| | Missouri – 0.3% | |
| 10,350,000 | 3,4 | St. Louis, MO, (PT-3584) Weekly VRDNs (Lambert-St. Louis International Airport)/(Dexia Credit Local LIQ)/(Dexia Credit Local LOC), 0.470%, 10/7/2010 | 10,350,000 |
| | New Hampshire – 1.9% | |
| 25,000,000 | | New Hampshire Business Finance Authority, PCRBs (1990 Series A), 0.90% CP (New England Power Co.), Mandatory Tender 10/5/2010 | 25,000,000 |
| 34,350,000 | | New Hampshire Business Finance Authority, PCRBs (1990 Series A), 0.95% CP (New England Power Co.), Mandatory Tender 11/8/2010 | 34,350,000 |
| 2,000,000 | | New Hampshire Business Finance Authority, PCRBs (1990 Series A), 1.00% CP (New England Power Co.), Mandatory Tender 10/21/2010 | 2,000,000 |
| | TOTAL | 61,350,000 |
Annual Shareholder Report35
Principal
Amount | | | Value |
| | New Jersey – 3.8% | |
| $50,705,000 | 3,4 | New Jersey EDA, (PT-3824) Weekly VRDNs (GTD by Dexia Credit Local)/(Dexia Credit Local LIQ), 0.460%, 10/7/2010 | 50,705,000 |
| 10,880,000 | 3,4 | New Jersey State Transportation Trust Fund Authority, (PT-2572) Weekly VRDNs (Dexia Credit Local LIQ)/(Dexia Credit Local LOC), 0.460%, 10/7/2010 | 10,880,000 |
| 10,780,000 | 3,4 | New Jersey State Transportation Trust Fund Authority, (PT-3535) Weekly VRDNs (Dexia Credit Local LIQ)/(Dexia Credit Local LOC), 0.460%, 10/7/2010 | 10,780,000 |
| 31,740,000 | 3,4 | New Jersey State Transportation Trust Fund Authority, (PT-3859) Weekly VRDNs (Dexia Credit Local LIQ)/(Dexia Credit Local LOC), 0.460%, 10/7/2010 | 31,740,000 |
| 4,000,000 | 3,4 | New Jersey Turnpike Authority, (PT-2493) Weekly VRDNs (GTD by Dexia Credit Local)/(Dexia Credit Local LIQ), 0.460%, 10/7/2010 | 4,000,000 |
| 11,675,000 | 3,4 | Washington Township, NJ Board of Education (Mercer County), (PT-2808) Weekly VRDNs (Dexia Credit Local LIQ)/(Dexia Credit Local LOC), 0.460%, 10/7/2010 | 11,675,000 |
| | TOTAL | 119,780,000 |
| | New York – 0.6% | |
| 4,780,000 | | Nassau County, NY IDA, (Series 2007) Weekly VRDNs (Jade Corp.)/(Wilmington Trust Co. LOC), 2.750%, 10/7/2010 | 4,780,000 |
| 14,740,000 | | New York City, NY Transitional Finance Authority, New York City Recovery Bonds (2003 Subseries 2-A) Daily VRDNs (Dexia Credit Local LIQ), 0.300%, 10/1/2010 | 14,740,000 |
| | TOTAL | 19,520,000 |
| | North Carolina – 0.8% | |
| 2,900,000 | | Chatham, NC Industrial Facilities & Pollution Control Funding Authority, (Series 2001) Weekly VRDNs (Townsends, Inc.)/(Wilmington Trust Co. LOC), 2.740%, 10/7/2010 | 2,900,000 |
| 14,335,000 | 3,4 | North Carolina Eastern Municipal Power Agency, (PT-4112) Weekly VRDNs (Dexia Credit Local LIQ)/(Dexia Credit Local LOC), 0.470%, 10/7/2010 | 14,335,000 |
| 8,180,000 | | North Carolina Medical Care Commission, (Series 2007) Daily VRDNs (Randolph Hospital)/(Bank of America N.A. LOC), 0.320%, 10/1/2010 | 8,180,000 |
| | TOTAL | 25,415,000 |
| | Ohio – 0.4% | |
| 9,000,000 | | Clinton County, OH Hospital Authority, (Series 2005) Weekly VRDNs (Clinton Memorial Hospital)/(Fifth Third Bank, Cincinnati LOC), 0.440%, 10/1/2010 | 9,000,000 |
| 4,385,000 | | Evendale, OH, Tax Increment Revenue Bonds (Series 2009) Weekly VRDNs (Evendale Commons Ltd.)/(Fifth Third Bank, Cincinnati LOC), 0.420%, 10/7/2010 | 4,385,000 |
| | TOTAL | 13,385,000 |
Annual Shareholder Report36
Principal
Amount | | | Value |
| | Oklahoma – 0.0% | |
| $1,000,000 | | Garfield County, OK Industrial Authority Pollution Control, (Series 1995-A) Weekly VRDNs (Oklahoma Gas and Electric Co.), 0.430%, 10/6/2010 | 1,000,000 |
| | Pennsylvania – 0.4% | |
| 5,105,000 | 3,4 | Allegheny County, PA Airport Authority, (PT-4304) Weekly VRDNs (Dexia Credit Local LIQ)/(Dexia Credit Local LOC), 0.540%, 10/7/2010 | 5,105,000 |
| 2,170,000 | | Chester County, PA IDA, (Series A of 2000) Weekly VRDNs (Devault Packing Co., Inc.)/(Wilmington Trust Co. LOC), 2.780%, 10/7/2010 | 2,170,000 |
| 6,305,000 | | Pennsylvania State Higher Education Facilities Authority, (Series 2007B) Weekly VRDNs (La Salle University)/(Citizens Bank of Pennsylvania LOC), 0.450%, 10/6/2010 | 6,305,000 |
| | TOTAL | 13,580,000 |
| | Puerto Rico – 0.7% | |
| 15,945,000 | 3,4 | Puerto Rico Highway and Transportation Authority, (PT-3189) Weekly VRDNs (Dexia Credit Local LIQ)/(Dexia Credit Local LOC), 0.460%, 10/7/2010 | 15,945,000 |
| 5,320,000 | 3,4 | Puerto Rico Municipal Finance Agency, (PT-3326) Weekly VRDNs (Dexia Credit Local LIQ)/(Dexia Credit Local LOC), 0.460%, 10/7/2010 | 5,320,000 |
| | TOTAL | 21,265,000 |
| | South Carolina – 0.2% | |
| 7,080,000 | | Hampton County, SC, (Series 2007) Weekly VRDNs (Carolina Soya LLC)/(Wells Fargo Bank, N.A. LOC), 0.420%, 10/7/2010 | 7,080,000 |
| | Tennessee – 0.8% | |
| 6,400,000 | | Dickson County, TN IDB, (Series 1997) Weekly VRDNs (Jackson Foundation)/(SunTrust Bank LOC), 0.670%, 10/6/2010 | 6,400,000 |
| 2,000,000 | | Jackson, TN IDB, (Series 1999) Weekly VRDNs (Bobrick Washroom Equipment)/(Regions Bank, Alabama LOC), 1.130%, 10/7/2010 | 2,000,000 |
| 4,870,000 | | Metropolitan Government Nashville & Davidson County, TN HEFA, (Series 2009) Weekly VRDNs (Meharry Medical College)/(Fifth Third Bank, Cincinnati LOC), 0.440%, 10/1/2010 | 4,870,000 |
| 6,070,000 | | Metropolitan Nashville, TN Airport Authority, (Series 2003) Weekly VRDNs (SunTrust Bank LOC), 0.670%, 10/6/2010 | 6,070,000 |
| 4,855,000 | | Springfield, TN Health & Educational Facilities Board, (Series 2008) Weekly VRDNs (NorthCrest Medical Center)/(Regions Bank, Alabama LOC), 1.080%, 10/7/2010 | 4,855,000 |
| | TOTAL | 24,195,000 |
| | Texas – 3.7% | |
| 20,000,000 | | Gulf Coast, TX Waste Disposal Authority, Pollution Control Refunding Revenue Bonds (Series 1992) Daily VRDNs (BP Products North America, Inc.)/(GTD by BP PLC), 0.350%, 10/1/2010 | 20,000,000 |
| 8,000,000 | | Gulf Coast, TX Waste Disposal Authority, Solid Waste Disposal Revenue Bonds (Series 1999) Weekly VRDNs (Air Products & Chemicals, Inc.), 0.530%, 10/6/2010 | 8,000,000 |
Annual Shareholder Report37
Principal
Amount | | | Value |
| $11,000,000 | | Harris County, TX Education Facilities Finance Corp., (Series 2008E) Daily VRDNs (Young Men's Christian Association of the Greater Houston Area)/(Regions Bank, Alabama LOC), 1.050%, 10/1/2010 | 11,000,000 |
| 57,500,000 | | Oakbend, TX HFDC, (Series 2008) Daily VRDNs (Oakbend Medical Center)/(Regions Bank, Alabama LOC), 0.760%, 10/1/2010 | 57,500,000 |
| 5,000,000 | | Port Arthur Navigation District, TX IDC, (Series 2000) Weekly VRDNs (Air Products & Chemicals, Inc.), 0.530%, 10/6/2010 | 5,000,000 |
| 15,000,000 | | Port Arthur Navigation District, TX IDC, (Series 2001) Weekly VRDNs (Air Products & Chemicals, Inc.), 0.530%, 10/6/2010 | 15,000,000 |
| | TOTAL | 116,500,000 |
| | Utah – 0.5% | |
| 15,500,000 | | Salt Lake County, UT Solid Waste Disposal, (Series A) Weekly VRDNs (Kennecott Utah Copper Corp.)/(GTD by Rio Tinto PLC), 1.500%, 10/6/2010 | 15,500,000 |
| | Virginia – 0.7% | |
| 23,000,000 | | Halifax, VA IDA, MMMs, PCR (Series 1992), 1.45% CP (Virginia Electric & Power Co.), Mandatory Tender 10/4/2010 | 23,000,000 |
| | West Virginia – 0.4% | |
| 14,500,000 | | Grant County, WV County Commission, PCRB (Series 1994), 1.00% CP (Virginia Electric & Power Co.), Mandatory Tender 10/21/2010 | 14,500,000 |
| | Wisconsin – 0.1% | |
| 1,630,000 | | Wisconsin State HEFA, (Series 2006A) Weekly VRDNs (Amery Regional Medical Center)/(Fifth Third Bank, Cincinnati LOC), 0.420%, 10/6/2010 | 1,630,000 |
| | TOTAL SHORT-TERM MUNICIPALS
(IDENTIFIED COST $1,179,355,000) | 1,179,355,000 |
| | TOTAL INVESTMENTS — 99.6%
(IDENTIFIED COST $3,146,070,783)6 | 3,166,373,075 |
| | OTHER ASSETS AND LIABILITIES - NET — 0.4%7 | 12,047,130 |
| | TOTAL NET ASSETS — 100% | $3,178,420,205 |
Securities that are subject to the federal alternative minimum tax (AMT) represent 9.7% of the portfolio as calculated based upon total market value (percentage is unaudited).
| 1 | Non-income producing security. |
| 2 | Obligor had filed for bankruptcy. On September 3, 2010, a Notice of Sale and Initial Distribution to Bondholders was received and a portion of the bond was redeemed upon subsequent receipt of the proceeds. The market value of the remaining par was adjusted to reflect the expected value of future cash flows. |
| 3 | Denotes a restricted security that either: (a) cannot be offered for public sale without first being registered, or being able to take advantage of an exemption from registration, under the Securities Act of 1933; or (b) is subject to a contractual restriction on public sales. At September 30, 2010, these restricted securities amounted to $345,838,900, which represented 10.9% of total net assets. |
Annual Shareholder Report38
| 4 | Denotes a restricted security that may be resold without restriction to “qualified institutional buyers” as defined in Rule 144A under the Securities Act of 1933 and that the Fund has determined to be liquid under criteria established by the Fund's Board of Directors (the “Directors”). At September 30, 2010, these liquid restricted securities amounted to $330,850,000, which represented 10.4% of total net assets. |
| 5 | Current rate and next reset date shown for Variable Rate Demand Notes. |
| 6 | The cost of investments for federal tax purposes amounts to $3,146,063,389. |
| 7 | Assets, other than investments in securities, less liabilities. See Statement of Assets and Liabilities. |
Note: The categories of investments are shown as a percentage of total net assets at September 30, 2010.
Various inputs are used in determining the value of the Fund's investments. These inputs are summarized in the three broad levels listed below:
Level 1 — quoted prices in active markets for identical securities
Level 2 — other significant observable inputs (including quoted prices for similar securities, interest rates, prepayment speeds, credit risk, etc.)
Level 3 — significant unobservable inputs (including the Fund's own assumptions in determining the fair value of investments)
The inputs or methodology used for valuing securities are not an indication of the risk associated with investing in those securities.
As of September 30, 2010, all investments of the Fund utilized Level 2 inputs in valuing the Fund's assets carried at fair value.
Annual Shareholder Report39
The following acronyms are used throughout this portfolio:| AMBAC | — American Municipal Bond Assurance Corporation |
| ARS | — Auction Rate Securities |
| BANs | — Bond Anticipation Notes |
| CCD | — Community College District |
| COL | — Collateralized |
| COP | — Certificates of Participation |
| CP | — Commercial Paper |
| CSD | — Central School District |
| EDA | — Economic Development Authority |
| EDFA | — Economic Development Finance Authority |
| FGIC | — Financial Guaranty Insurance Company |
| GO | — General Obligation |
| GTD | — Guaranteed |
| HDA | — Hospital Development Authority |
| HEFA | — Health and Education Facilities Authority |
| HFA | — Housing Finance Authority |
| HFDC | — Health Facility Development Corporation |
| IDA | — Industrial Development Authority |
| IDB | — Industrial Development Bond |
| IDC | — Industrial Development Corporation |
| IDRBs | — Industrial Development Revenue Bonds |
| IFA | — Industrial Finance Authority |
| INS | — Insured |
| ISD | — Independent School District |
| LID | — Local Improvement District |
| LIQ | — Liquidity Agreement |
| LOC(s) | — Letter(s) of Credit |
| LO | — Limited Obligation |
| LT | — Limited Tax |
| MFH | — Multi-Family Housing |
| MMMs | — Money Market Municipals |
| PCFA | — Pollution Control Finance Authority |
| PCR | — Pollution Control Revenue |
| PCRBs | — Pollution Control Revenue Bonds |
| PRF | — Prerefunded |
| RANs | — Revenue Anticipation Notes |
| SID | — Special Improvement District |
| TANs | — Tax Anticipation Notes |
| TOBs | — Tender Option Bonds |
| TRANs | — Tax and Revenue Anticipation Notes |
| USD | — Unified School District |
| UT | — Unlimited Tax |
| VRDNs | — Variable Rate Demand Notes |
See Notes which are an integral part of the Financial Statements
Annual Shareholder Report40
Statement of Assets and Liabilities
September 30, 2010
| Assets: | | |
| Total investments in securities, at value (identified cost $3,146,070,783) | | $3,166,373,075 |
| Cash | | 100,743 |
| Income receivable | | 18,748,952 |
| Receivable for investments sold | | 33,556,233 |
| Receivable for shares sold | | 38,263,563 |
| TOTAL ASSETS | | 3,257,042,566 |
| Liabilities: | | |
| Payable for investments purchased | $64,539,800 | |
| Payable for shares redeemed | 12,256,919 | |
| Income distribution payable | 742,226 | |
| Payable for Directors'/Trustees' fees | 1,357 | |
| Payable for distribution services fee (Note 5) | 321,687 | |
| Payable for shareholder services fee (Note 5) | 415,162 | |
| Accrued expenses | 345,210 | |
| TOTAL LIABILITIES | | 78,622,361 |
| Net assets for 316,432,340 shares outstanding | | $3,178,420,205 |
| Net Assets Consist of: | | |
| Paid-in capital | | $3,163,811,828 |
| Net unrealized appreciation of investments | | 20,302,292 |
| Accumulated net realized loss on investments | | (5,693,946) |
| Undistributed net investment income | | 31 |
| TOTAL NET ASSETS | | $3,178,420,205 |
| Net Asset Value, Offering Price and Redemption Proceeds Per Share | | |
| Institutional Shares: | | |
| $1,195,878,423 ÷ 119,057,910 shares outstanding, $0.001 par value, 500,000,000 shares authorized | | $10.04 |
| Offering price per share | | $10.04 |
| Redemption proceeds per share | | $10.04 |
| Class A Shares: | | |
| $1,982,541,782 ÷ 197,374,430 shares outstanding, $0.001 par value, 500,000,000 shares authorized | | $10.04 |
| Offering price per share (100/98.00 of $10.04) | | $10.24 |
| Redemption proceeds per share | | $10.04 |
See Notes which are an integral part of the Financial Statements
Annual Shareholder Report41
Statement of Operations
Year Ended September 30, 2010
| Investment Income: | | | |
| Interest | | | $47,235,638 |
| Expenses: | | | |
| Investment adviser fee (Note 5) | | $20,077,479 | |
| Administrative personnel and services fee (Note 5) | | 2,609,387 | |
| Custodian fees | | 113,764 | |
| Transfer and dividend disbursing agent fees and expenses | | 271,374 | |
| Directors'/Trustees' fees | | 31,298 | |
| Auditing fees | | 23,530 | |
| Legal fees | | 6,881 | |
| Portfolio accounting fees | | 237,597 | |
| Distribution services fee — Class A Shares (Note 5) | | 5,778,602 | |
| Shareholder services fee — Class A Shares (Note 5) | | 5,769,720 | |
| Account administration fee — Class A Shares | | 8,882 | |
| Share registration costs | | 371,506 | |
| Printing and postage | | 69,574 | |
| Insurance premiums | | 14,891 | |
| Taxes | | 282,222 | |
| Miscellaneous | | 11,729 | |
| TOTAL EXPENSES | | 35,678,436 | |
| Waivers (Note 5): | | | |
| Waiver of investment adviser fee | $(12,182,582) | | |
| Waiver of administrative personnel and services fee | (62,893) | | |
| Waiver of distribution services fee — Class A Shares | (1,155,720) | | |
| TOTAL WAIVERS | | (13,401,195) | |
| Net expenses | | | 22,277,241 |
| Net investment income | | | 24,958,397 |
| Realized and Unrealized Gain on Investments: | | | |
| Net realized gain on investments | | | 37,764 |
| Net change in unrealized appreciation of investments | | | 8,273,291 |
| Net realized and unrealized gain on investments | | | 8,311,055 |
| Change in net assets resulting from operations | | | $33,269,452 |
See Notes which are an integral part of the Financial Statements
Annual Shareholder Report42
Statement of Changes in Net Assets
| Year Ended September 30 | 2010 | 2009 |
| Increase (Decrease) in Net Assets | | |
| Operations: | | |
| Net investment income | $24,958,397 | $28,412,243 |
| Net realized gain (loss) on investments | 37,764 | (1,405,085) |
| Net change in unrealized appreciation/depreciation of investments | 8,273,291 | 15,979,467 |
| CHANGE IN NET ASSETS RESULTING FROM OPERATIONS | 33,269,452 | 42,986,625 |
| Distributions to Shareholders: | | |
| Distributions from net investment income | | |
| Institutional Shares | (10,976,066) | (8,320,726) |
| Class A Shares | (13,980,363) | (20,089,793) |
| CHANGE IN NET ASSETS RESULTING FROM DISTRIBUTIONS TO SHAREHOLDERS | (24,956,429) | (28,410,519) |
| Share Transactions: | | |
| Proceeds from sale of shares | 2,866,869,326 | 3,823,621,229 |
| Net asset value of shares issued to shareholders in payment of distributions declared | 18,269,508 | 21,677,679 |
| Cost of shares redeemed | (3,133,789,732) | (1,202,373,304) |
| CHANGE IN NET ASSETS RESULTING FROM SHARE TRANSACTIONS | (248,650,898) | 2,642,925,604 |
| Change in net assets | (240,337,875) | 2,657,501,710 |
| Net Assets: | | |
| Beginning of period | 3,418,758,080 | 761,256,370 |
| End of period (including undistributed net investment income of $31 and $1,027, respectively) | $3,178,420,205 | $3,418,758,080 |
See Notes which are an integral part of the Financial Statements
Annual Shareholder Report43
Notes to Financial Statements
September 30, 2010
1. ORGANIZATION
Federated Fixed Income Securities, Inc. (the “Corporation”) is registered under the Investment Company Act of 1940, as amended (the “Act”), as an open-end management investment company. The Corporation consists of two portfolios. The financial statements included herein are only those of Federated Municipal Ultrashort Fund (the “Fund”), a diversified portfolio. The financial statements of the other portfolio are presented separately. The assets of each portfolio are segregated and a shareholder's interest is limited to the portfolio in which shares are held. Each portfolio pays its own expenses. The Fund offers two classes of shares: Institutional Shares and Class A Shares. All shares of the Fund have equal rights with respect to voting, except on class-specific matters. The financial highlights of the Class A Shares are presented separately. The investment objective of the Fund is to provide current income exempt from federal regular income tax. Interest income from the Fund's investments may be subject to the federal AMT for individuals and corporations and state and local taxes.
2. SIGNIFICANT ACCOUNTING POLICIES
The following is a summary of significant accounting policies consistently followed by the Fund in the preparation of its financial statements. These policies are in conformity with U.S. generally accepted accounting principles (GAAP).
Investment Valuation
In calculating its net asset value (NAV), the Fund generally values investments as follows:
- Fixed-income securities acquired with remaining maturities greater than 60 days are fair valued using price evaluations provided by a pricing service approved by the Directors.
- Fixed-income securities acquired with remaining maturities of 60 days or less are valued at their cost (adjusted for the accretion of any discount or amortization of any premium).
- Shares of other mutual funds are valued based upon their reported NAVs.
- Derivative contracts listed on exchanges are valued at their reported settlement or closing price.
- Over-the-counter (OTC) derivative contracts are fair valued using price evaluations provided by a pricing service approved by the Directors.
If the Fund cannot obtain a price or price evaluation from a pricing service for an investment, the Fund may attempt to value the investment based upon the mean of bid and asked quotations or fair value the investment based on price evaluations, from one or more dealers. If any price, quotation, price evaluation or other pricing source is not readily available when the NAV is calculated, the Fund uses the fair value of the investment determined in accordance with the procedures described below. There can be no assurance that the Fund could purchase or sell an investment at the price used to calculate the Fund's NAV.
Fair Valuation and Significant Events Procedures
The Directors have authorized the use of pricing services to provide evaluations of the current fair value of certain investments for purposes of calculating the NAV. Factors considered by pricing services in evaluating an investment include the yields or prices of investments of comparable quality, coupon, maturity, call rights and other potential prepayments, terms and type, reported transactions, indications as to values from dealers and general market conditions. Some pricing services provide a single price evaluation reflecting the bid-side of the market for an investment (a “bid” evaluation). Other pricing services offer both bid Annual Shareholder Report44
evaluations and price evaluations indicative of a price between the prices bid and asked for the investment (a “mid” evaluation). The Fund normally uses bid evaluations for U.S. Treasury and Agency securities and municipal securities. The Fund normally uses mid evaluations for other types of fixed-income securities and OTC derivative contracts. In the event that market quotations and price evaluations are not available for an investment, the fair value of the investment is determined in accordance with procedures adopted by the Directors.The Directors also have adopted procedures requiring an investment to be priced at its fair value whenever the Adviser determines that a significant event affecting the value of the investment has occurred between the time as of which the price of the investment would otherwise be determined and the time as of which the NAV is computed. An event is considered significant if there is both an affirmative expectation that the investment's value will change in response to the event and a reasonable basis for quantifying the resulting change in value. Examples of significant events that may occur after the close of the principal market on which a security is traded, or after the time of a price evaluation provided by a pricing service or a dealer, include:
- With respect to price evaluations of fixed-income securities determined before the close of regular trading on the NYSE, actions by the Federal Reserve Open Market Committee and other significant trends in U.S. fixed-income markets;
- Political or other developments affecting the economy or markets in which an issuer conducts its operations or its securities are traded; and
- Announcements concerning matters such as acquisitions, recapitalizations, litigation developments, a natural disaster affecting the issuer's operations or regulatory changes or market developments affecting the issuer's industry.
The Fund may seek to obtain more current quotations or price evaluations from alternative pricing sources. If a reliable alternative pricing source is not available, the Fund will determine the fair value of the investment using another method approved by the Directors.
Investment Income, Gains and Losses, Expenses and Distributions
Investment transactions are accounted for on a trade-date basis. Realized gains and losses from investment transactions are recorded on an identified-cost basis. Interest income and expenses are accrued daily. Distributions to shareholders are recorded on the ex-dividend date. Distributions of net investment income are declared daily and paid monthly. Non-cash dividends included in dividend income, if any, are recorded at fair value. Investment income, realized and unrealized gains and losses and certain fund-level expenses are allocated to each class based on relative average daily net assets, except that each class may bear certain expenses unique to that class such as account administration, distribution services and shareholder services fees. Dividends are declared separately for each class. No class has preferential dividend rights; differences in per share dividend rates are generally due to differences in separate class expenses.
Premium and Discount Amortization
All premiums and discounts on fixed-income securities are amortized/accreted for financial statement purposes.
Federal Taxes
It is the Fund's policy to comply with the Subchapter M provision of the Internal Revenue Code (the “Code”) and to distribute to shareholders each year substantially all of its income. Accordingly, no provision for federal income tax is necessary. As of and during the year ended September 30, 2010, the Fund did not have a liability for any uncertain tax positions. The Fund Annual Shareholder Report45
recognizes interest and penalties, if any, related to tax liabilities as income tax expense in the Statement of Operations. As of September 30, 2010, tax years 2007 through 2010 remain subject to examination by the Fund's major tax jurisdictions, which include the United States of America, the state of Maryland and the Commonwealth of Pennsylvania.Other Taxes
As an open-end management investment company incorporated in the state of Maryland but domiciled in the Commonwealth of Pennsylvania, the Fund is subject to the Pennsylvania Franchise Tax. This franchise tax is assessed annually on the value of the Fund, as represented by average net assets for the tax year.
When-Issued and Delayed Delivery Transactions
The Fund may engage in when-issued or delayed delivery transactions. The Fund records when-issued securities on the trade date and maintains security positions such that sufficient liquid assets will be available to make payment for the securities purchased. Securities purchased on a when-issued or delayed delivery basis are marked to market daily and begin earning interest on the settlement date. Losses may occur on these transactions due to changes in market conditions or the failure of counterparties to perform under the contract.
Restricted Securities
The Fund may purchase securities which are considered restricted. Restricted securities are securities that either: (a) cannot be offered for public sale without first being registered, or being able to take advantage of an exemption from registration, under the Securities Act of 1933; or (b) are subject to contractual restrictions on public sales. In some cases, when a security cannot be offered for public sale without first being registered, the issuer of the restricted security has agreed to register such securities for resale, at the issuer's expense, either upon demand by the Fund or in connection with another registered offering of the securities. Many such restricted securities may be resold in the secondary market in transactions exempt from registration. Restricted securities may be determined to be liquid under criteria established by the Directors. The Fund will not incur any registration costs upon such resales. The Fund's restricted securities are valued at the price provided by dealers in the secondary market or, if no market prices are available, at the fair value as determined in accordance with procedures established by and under the general supervision of the Directors.
Additional information on restricted securities, excluding securities purchased under Rule 144A, if applicable, that have been deemed liquid by the Directors, held at September 30, 2010, is as follows:
| Security | Acquisition
Date | Acquisition
Cost | Market
Value |
| Washington State EDFA, Solid Waste Disposal Revenue Bonds (Series 2005D), 1.75% TOBs (Waste Management, Inc.), Optional Tender 9/1/2011 | 2/25/2010 | $7,000,000 | $6,994,820 |
| Washington State EDFA, Solid Waste Disposal Revenue Bonds (Series 2008), 1.75% TOBs (Waste Management, Inc.), Optional Tender 9/1/2011 | 2/25/2010 | $8,000,000 | $7,994,080 |
Annual Shareholder Report46
Other
The preparation of financial statements in conformity with GAAP requires management to make estimates and assumptions that affect the amounts of assets, liabilities, expenses and revenues reported in the financial statements. Actual results could differ from those estimated.
3. CAPITAL STOCK
The following tables summarize capital stock activity:
| Year Ended September 30 | 2010 | 2009 |
| Institutional Shares: | Shares | Amount | Shares | Amount |
| Shares sold | 123,000,173 | $1,234,135,918 | 93,260,398 | $931,780,305 |
| Shares issued to shareholders in payment of distributions declared | 568,441 | 5,704,567 | 427,808 | 4,269,296 |
| Shares redeemed | (91,860,343) | (921,660,066) | (25,973,055) | (259,253,515) |
NET CHANGE RESULTING
FROM INSTITUTIONAL SHARE TRANSACTIONS | 31,708,271 | $318,180,419 | 67,715,151 | $676,796,086 |
| Year Ended September 30 | 2010 | 2009 |
| Class A Shares: | Shares | Amount | Shares | Amount |
| Shares sold | 162,773,864 | $1,632,733,408 | 289,473,031 | $2,891,840,924 |
| Shares issued to shareholders in payment of distributions declared | 1,252,180 | 12,564,941 | 1,744,983 | 17,408,383 |
| Shares redeemed | (220,498,732) | (2,212,129,666) | (94,495,438) | (943,119,789) |
NET CHANGE RESULTING
FROM CLASS A SHARE TRANSACTIONS | (56,472,688) | $(566,831,317) | 196,722,576 | $1,966,129,518 |
NET CHANGE RESULTING
FROM TOTAL FUND SHARE TRANSACTIONS | (24,764,417) | $(248,650,898) | 264,437,727 | $2,642,925,604 |
4. FEDERAL TAX INFORMATION
The timing and character of income and capital gain distributions are determined in accordance with income tax regulations, which may differ from GAAP. These differences are due to differing treatments for expiration of capital loss carryforwards and discount accretion/premium amortization on debt securities.
For the year ended September 30, 2010, permanent differences identified and reclassified among the components of net assets were as follows:
| Increase (Decrease) |
| Paid-In Capital | Undistributed
Net Investment
Income (Loss) | Accumulated
Net Realized
Gain (Loss) |
| $(541) | $(2,964) | $3,505 |
Net investment income (loss), net realized gains (losses), and net assets were not affected by this reclassification.
Annual Shareholder Report47
The tax character of distributions as reported on the Statement of Changes in Net Assets for the years ended September 30, 2010 and 2009, was as follows: | 2010 | 2009 |
| Tax-exempt income | $24,956,429 | $28,392,419 |
| Ordinary income | $ — | $18,100 |
As of September 30, 2010, the components of distributable earnings on a tax basis were as follows:
| Undistributed tax-exempt income | $31 |
| Net unrealized appreciation | $20,309,686 |
| Capital loss carryforwards and deferrals | $(5,701,340) |
The difference between book-basis and tax-basis net unrealized appreciation/depreciation is attributable to differing treatments for discount accretion/premium amortization on debt securities.
At September 30, 2010, the cost of investments for federal tax purposes was $3,146,063,389. The net unrealized appreciation of investments for federal tax purposes was $20,309,686. This consists of net unrealized appreciation from investments for those securities having an excess of value over cost of $21,869,562 and net unrealized depreciation from investments for those securities having an excess of cost over value of $1,559,876.
At September 30, 2010, the Fund had a capital loss carryforward of $5,605,005 which will reduce the Fund's taxable income arising from future net realized gains on investments, if any, to the extent permitted by the Code and thus will reduce the amount of distributions to shareholders which would otherwise be necessary to relieve the Fund of any liability for federal income tax. Pursuant to the Code, such capital loss carryforward will expire as follows:
| Expiration Year | Expiration Amount |
| 2011 | $353,600 |
| 2012 | $59,924 |
| 2013 | $884,421 |
| 2014 | $978,739 |
| 2015 | $631,311 |
| 2016 | $148,172 |
| 2017 | $1,306,058 |
| 2018 | $1,242,780 |
Capital loss carryforwards of $541 expired during the year ended September 30, 2010.
Under current tax regulations, capital losses realized after October 31 may be deferred and treated as occurring on the first day of the following fiscal year. As of September 30, 2010, for federal income tax purposes, post-October losses of $96,335 were deferred to October 1, 2010.
Annual Shareholder Report48
5. INVESTMENT ADVISER FEE AND OTHER TRANSACTIONS WITH AFFILIATESInvestment Adviser Fee
Federated Investment Management Company is the Fund's investment adviser (the “Adviser”). The advisory agreement between the Fund and the Adviser provides for an annual fee equal to 0.60% of the Fund's average daily net assets. Subject to the terms described in the Expense Limitation note, the Adviser may voluntarily choose to waive any portion of its fee. For the year ended September 30, 2010, the Adviser voluntarily waived $12,182,582 of its fee.
Administrative Fee
Federated Administrative Services (FAS), under the Administrative Services Agreement, provides the Fund with administrative personnel and services. The fee paid to FAS is based on the average aggregate daily net assets of certain Federated funds as specified below:
| Administrative Fee | Average Aggregate Daily Net Assets
of the Federated Funds |
| 0.150% | on the first $5 billion |
| 0.125% | on the next $5 billion |
| 0.100% | on the next $10 billion |
| 0.075% | on assets in excess of $20 billion |
The administrative fee received during any fiscal year shall be at least $150,000 per portfolio and $40,000 per each additional class of Shares. Subject to the terms described in the Expense Limitation note, FAS may voluntarily choose to waive any portion of its fee. For the year ended September 30, 2010, the net fee paid to FAS was 0.076% of average daily net assets of the Fund. FAS waived $62,893 of its fee.
Distribution Services Fee
The Fund has adopted a Distribution Plan (the “Plan”) pursuant to Rule 12b-1 under the Act. Under the terms of the Plan, the Fund will compensate Federated Securities Corp. (FSC), the principal distributor, from the daily net assets of the Fund's Class A Shares to finance activities intended to result in the sale of these shares. The Plan provides that the Fund may incur distribution expenses at 0.25% of average daily net assets, annually, to compensate FSC. Subject to the terms described in the Expense Limitation note, FSC may voluntarily choose to waive any portion of its fee. For the year ended September 30, 2010, FSC voluntarily waived $1,155,720 of its fee. When FSC receives fees, it may pay some or all of them to financial intermediaries whose customers purchase shares. For the year ended September 30, 2010, FSC retained $2,333,975 of fees paid by the Fund.
Sales Charges
Front-end sales charges and contingent deferred sales charges (CDSC) do not represent expenses of the Fund. They are deducted from the proceeds of sales of Fund shares prior to investment or from redemption proceeds prior to remittance, as applicable. For the year ended September 30, 2010, FSC did not retain any sales charges from the sale of Class A Shares.
Annual Shareholder Report49
Shareholder Services FeeThe Fund may pay fees (“Service Fees”) up to 0.25% of the average daily net assets of the Fund's Class A Shares to financial intermediaries or to Federated Shareholder Services Company (FSSC) for providing services to shareholders and maintaining shareholder accounts. Subject to the terms described in the Expense Limitation note, FSSC may voluntarily reimburse the Fund for Service Fees. For the year ended September 30, 2010, FSSC received $4,276 of fees paid by the Fund.
Interfund Transactions
During the year ended September 30, 2010, the Fund engaged in purchase and sale transactions with funds that have a common investment adviser (or affiliated investment advisers), common Directors/Trustees and/or common Officers. These purchase and sale transactions complied with Rule 17a-7 under the Act and amounted to $1,474,640,000 and $1,985,590,000, respectively.
Expense Limitation
The Adviser and its affiliates (which may include FSC, FAS and FSSC) have voluntarily agreed to waive their fees and/or reimburse expenses so that the total annual fund operating expenses (as shown in the financial highlights) paid by the Fund's Institutional Shares and Class A Shares (after the voluntary waivers and reimbursements) will not exceed 0.35% and 0.80% (the “Fee Limit”), respectively, through the later of (the “Termination Date”): (a) November 30, 2011; or (b) the date of the Fund's next effective Prospectus. While the Adviser and its affiliates currently do not anticipate terminating or increasing these arrangements prior to the Termination Date, these arrangements may only be terminated or the Fee Limit increased prior to the Termination Date with the agreement of the Directors.
General
Certain Officers and Directors of the Fund are Officers and Directors or Trustees of the above companies.
6. Investment TRANSACTIONS
Purchases and sales of investments, excluding long-term U.S. government securities and short-term obligations, for the year ended September 30, 2010, were as follows:
| Purchases | $1,336,412,965 |
| Sales | $635,242,957 |
7. LINE OF CREDIT
The Fund participates in a $100,000,000 unsecured, uncommitted revolving line of credit (LOC) agreement with PNC Bank. The LOC was made available for extraordinary or emergency purposes, primarily for financing redemption payments. Borrowings are charged interest at a rate offered to the Fund by PNC Bank at the time of the borrowing. As of September 30, 2010, there were no outstanding loans. During the year ended September 30, 2010, the Fund did not utilize the LOC.
Annual Shareholder Report50
8. INTERFUND LENDINGPursuant to an Exemptive Order issued by the Securities and Exchange Commission, the Fund, along with other funds advised by subsidiaries of Federated Investors, Inc., may participate in an interfund lending program. This program provides an alternative credit facility allowing the Fund to borrow from other participating affiliated funds. As of September 30, 2010, there were no outstanding loans. During the year ended September 30, 2010, the program was not utilized.
9. Legal Proceedings
Since February 2004, Federated Investors, Inc. and related entities (collectively, “Federated”), have been named as defendants in several lawsuits that are now pending in the United States District Court for the Western District of Pennsylvania. The lawsuits have been consolidated into a single action alleging excessive advisory fees involving one of the Federated-sponsored mutual funds (“Federated Funds”). Federated and its counsel have been defending this litigation. Additional lawsuits based upon similar allegations may be filed in the future. The potential impact of these lawsuits, all of which seek monetary damages, attorneys' fees and expenses, and future potential similar suits is uncertain. Although we do not believe that these lawsuits will have a material adverse effect on the Federated Funds, there can be no assurance that these suits, ongoing adverse publicity and/or other developments resulting from the allegations in these matters will not result in increased redemptions, or reduced sales, of shares of the Federated Funds or other adverse consequences for the Federated Funds.
10. CHANGE IN INDEPENDENT REGISTERED pUBLIC ACCOUNTING FIRM
On May 14, 2010, the Fund's Directors, upon the recommendation of the Audit Committee, appointed KPMG LLP (KPMG) as the Fund's independent registered public accounting firm. On the same date, the Fund's previous independent registered public accounting firm, Ernst & Young LLP (E&Y) resigned. The previous reports issued by E&Y on the Fund's financial statements for the fiscal years ended September 30, 2008 and September 30, 2009, contained no adverse opinion or disclaimer of opinion nor were they qualified or modified as to uncertainty, audit scope or accounting principles. During the Fund's fiscal years ended September 30, 2008 and September 30, 2009, and the interim period commencing October 1, 2009 and ending May 14, 2010: (i) there were no disagreements with E&Y on any matter of accounting principles or practices, financial statement disclosure or auditing scope or procedure, which disagreements, if not resolved to the satisfaction of E&Y, would have caused it to make reference to the subject matter of the disagreements in connection with its reports on the financial statements for such years; and (ii) there were no reportable events of the kind described in Item 304(a) (1) (v) of Regulation S-K under the Securities Exchange Act of 1934, as amended.
As indicated above, the Fund has appointed KPMG as the independent registered public accounting firm to audit the Fund's financial statements for the fiscal year ending September 30, 2010. During the Fund's fiscal years ended September 30, 2008 and September 30, 2009 and the interim period commencing October 1, 2009 and ending May 14, 2010, neither the Fund nor anyone on its behalf has consulted KPMG on items which: (i) concerned the application of accounting principles to a specified transaction, either completed or proposed, or the type of audit opinion that might be rendered on the Fund's financial statements; or (ii) concerned the subject of a disagreement (as defined in paragraph (a) (1) (iv) of Item 304 of Regulation S-K) or reportable events (as described in paragraph (a) (1) (v) of said Item 304).
Annual Shareholder Report51
11. Subsequent eventsManagement has evaluated subsequent events through the date the financial statements were issued, and determined that no events have occurred that require additional disclosure.
12. FEDERAL TAX INFORMATION (UNAUDITED)
For the year ended September 30, 2010, 100.0% of the distributions from net investment income is exempt from federal income tax, other than the federal AMT.
Annual Shareholder Report52
Report of Independent Registered Public Accounting Firm
TO THE BOARD OF TRUSTEES OF THE FEDERATED FIXED INCOME series, inc., AND SHAREHOLDERS OF Federated MunicipAl ultrashort fund:
We have audited the accompanying statement of assets and liabilities, including the portfolio of investments, of the Federated Municipal Ultrashort Fund (the “Fund”), a portfolio of Federated Fixed Income Series, Inc., as of September 30, 2010, and the related statement of operations, the statements of changes in net assets, and the financial highlights for the year then ended. These financial statements and financial highlights are the responsibility of the Fund's management. Our responsibility is to express an opinion on these financial statements and financial highlights based on our audit. The statement of changes in net assets for the year ended September 30, 2009 and the financial highlights for the periods presented prior to October 1, 2009, were audited by other independent registered public accountants whose report thereon dated November 24, 2009, expressed an unqualified opinion on those statements.
We conducted our audit in accordance with the standards of the Public Company Accounting Oversight Board (United States). Those standards require that we plan and perform the audit to obtain reasonable assurance about whether the financial statements and financial highlights are free of material misstatement. An audit includes examining, on a test basis, evidence supporting the amounts and disclosures in the financial statements. Our procedures included confirmation of securities owned as of September 30, 2010 by correspondence with the custodian, transfer agent and brokers or by other appropriate auditing procedures. An audit also includes assessing the accounting principles used and significant estimates made by management, as well as evaluating the overall financial statement presentation. We believe that our audit provides a reasonable basis for our opinion.
In our opinion, the financial statements and financial highlights referred to above present fairly, in all material respects, the financial position of the Federated Municipal Ultrashort Fund, as of September 30, 2010, and the results of its operations, the changes in net assets and the financial highlights for the year then ended, in conformity with U.S. generally accepted accounting principles.
Boston, Massachusetts
November 22, 2010
Annual Shareholder Report53
Board of Directors and Corporation Officers
The Board of Directors is responsible for managing the Corporation business affairs and for exercising all the Corporation powers except those reserved for the shareholders. The following tables give information about each Director and the senior officers of the Fund. Where required, the tables separately list Directors who are “interested persons” of the Fund (i.e., “Interested” Directors) and those who are not (i.e., “Independent” Directors). Unless otherwise noted, the address of each person listed is Federated Investors Tower, 1001 Liberty Avenue, Pittsburgh, PA 15222. The address of all Independent Directors listed is 4000 Ericsson Drive, Warrendale, PA 15086-7561; Attention: Mutual Fund Board. As of December 31, 2009, the Corporation comprised two portfolio(s), and the Federated Fund Family consisted of 43 investment companies (comprising 145 portfolios). Unless otherwise noted, each Officer is elected annually. Unless otherwise noted, each Director oversees all portfolios in the Federated Fund Family and serves for an indefinite term. The Fund's Statement of Additional Information includes additional information about Corporation Directors and is available, without charge and upon request, by calling 1-800-341-7400.
Interested DIRECTORS Background
Name
Birth Date
Positions Held with Corporation
Date Service Began | Principal Occupation(s) for Past Five Years,
Other Directorships Held and Previous Position(s) |
John F. Donahue*
Birth Date: July 28, 1924
Director
Began serving: October 1991 | Principal Occupations: Director or Trustee of the Federated Fund Family; Chairman and Director, Federated Investors, Inc.; Chairman of the Federated Fund Family's Executive Committee.
Previous Positions: Chairman of the Federated Fund Family; Trustee, Federated Investment Management Company; Chairman and Director, Federated Investment Counseling. |
J. Christopher Donahue*
Birth Date: April 11, 1949
President and Director
Began serving: January 2000 | Principal Occupations: Principal Executive Officer and President of the Federated Fund Family; Director or Trustee of some of the Funds in the Federated Fund Family; President, Chief Executive Officer and Director, Federated Investors, Inc.; Chairman and Trustee, Federated Investment Management Company; Trustee, Federated Investment Counseling; Chairman and Director, Federated Global Investment Management Corp.; Chairman, Federated Equity Management Company of Pennsylvania and Passport Research, Ltd. (investment advisory subsidiary of Federated); Trustee, Federated Shareholder Services Company; Director, Federated Services Company.
Previous Positions: President, Federated Investment Counseling; President and Chief Executive Officer, Federated Investment Management Company, Federated Global Investment Management Corp. and Passport Research, Ltd. |
| * | Family relationships and reasons for “interested” status: John F. Donahue is the father of J. Christopher Donahue; both are “interested” due to their beneficial ownership of shares of Federated Investors, Inc. and the positions they hold with Federated and its subsidiaries. |
Annual Shareholder Report54
INDEPENDENT DIRECTORS Background
Name
Birth Date
Positions Held with Corporation
Date Service Began | Principal Occupation(s) for Past Five Years,
Other Directorships Held, Previous Position(s) and Qualifications |
John T. Conroy, Jr., Ph.D.
Birth Date: June 23, 1937
Director
Began serving: October 1991 | Principal Occupations: Director or Trustee of the Federated Fund Family; Chairman of the Board, Investment Properties Corporation; Partner or Trustee in private real estate ventures in Southwest Florida; Assistant Professor in Theology, Blessed Edmund Rice School for Pastoral Ministry.
Previous Positions: President, Investment Properties Corporation; Senior Vice President, John R. Wood and Associates, Inc., Realtors; President, Naples Property Management, Inc. and Northgate Village Development Corporation.
Qualifications: Business management and director experience. |
Nicholas P. Constantakis, CPA
Birth Date: September 3, 1939
Director
Began serving: February 1998 | Principal Occupation: Director or Trustee of the Federated Fund Family.
Other Directorship Held: Director and Chairman of the Audit Committee, Michael Baker Corporation (architecture, engineering and construction services).
Previous Position: Partner, Andersen Worldwide SC.
Qualifications: Public accounting and director experience. |
John F. Cunningham
Birth Date: March 5, 1943
Director
Began serving: January 1999 | Principal Occupation: Director or Trustee of the Federated Fund Family.
Other Directorships Held: Chairman, President and Chief Executive Officer, Cunningham & Co., Inc. (strategic business consulting); Trustee Associate, Boston College.
Previous Positions: Director, Redgate Communications and EMC Corporation (computer storage systems); Chairman of the Board and Chief Executive Officer, Computer Consoles, Inc.; President and Chief Operating Officer, Wang Laboratories; Director, First National Bank of Boston; Director, Apollo Computer, Inc.
Qualifications: Business management and director experience. |
Maureen Lally-Green
Birth Date: July 5, 1949
Director
Began serving: August 2009 | Principal Occupations: Director or Trustee of the Federated Fund Family; Director, Office of Church Relations, Diocese of Pittsburgh; Adjunct Professor of Law, Duquesne University School of Law.
Other Directorships Held: Trustee, St. Francis University; Director, Ireland Institute of Pittsburgh; Director, UPMC Mercy Hospital; Regent, St. Vincent Seminary; Director, Epilepsy Foundation of Western and Central Pennsylvania; Director, Saint Thomas More Society, Allegheny County; Director, Carlow University.
Previous Position: Pennsylvania Superior Court Judge.
Qualifications: Legal and director experience. |
Annual Shareholder Report55
Name
Birth Date
Positions Held with Corporation
Date Service Began | Principal Occupation(s) for Past Five Years,
Other Directorships Held, Previous Position(s) and Qualifications |
Peter E. Madden
Birth Date: March 16, 1942
Director
Began serving: October 1991 | Principal Occupation: Director or Trustee, and Chairman of the Board of Directors or Trustees, of the Federated Fund Family.
Other Directorship Held: Board of Overseers, Babson College.
Previous Positions: Representative, Commonwealth of Massachusetts General Court; President, Chief Operating Officer and Director, State Street Bank and Trust Company and State Street Corporation (retired); Director, VISA USA and VISA International; Chairman and Director, Massachusetts Bankers Association; Director, Depository Trust Corporation; Director, The Boston Stock Exchange.
Qualifications: Business management, mutual fund services and director experience. |
Charles F. Mansfield, Jr.
Birth Date: April 10, 1945
Director
Began serving: January 1999 | Principal Occupations: Director or Trustee and Chairman of the Audit Committee of the Federated Fund Family; Management Consultant.
Previous Positions: Chief Executive Officer, PBTC International Bank; Partner, Arthur Young & Company (now Ernst & Young LLP); Chief Financial Officer of Retail Banking Sector, Chase Manhattan Bank; Senior Vice President, HSBC Bank USA (formerly, Marine Midland Bank); Vice President, Citibank; Assistant Professor of Banking and Finance, Frank G. Zarb School of Business, Hofstra University; Executive Vice President, DVC Group, Inc. (marketing, communications and technology).
Qualifications: Banking, business management, public accounting and director experience. |
R. James Nicholson
Birth Date: February 4, 1938
Director
Began serving: November 2007 | Principal Occupations: Director or Trustee of the Federated Fund Family; Senior Counsel, Brownstein Hyatt Farber Schrek, P.C.; Former Secretary of the U.S. Dept. of Veterans Affairs; Former U.S. Ambassador to the Holy See; Former Chairman of the Republican National Committee.
Other Directorships Held: Director, Horatio Alger Association; Director, The Daniels Fund.
Previous Positions: Colonel, U.S. Army Reserve; Partner, Calkins, Kramer, Grimshaw and Harring, P.C.; General Counsel, Colorado Association of Housing and Building; Chairman and CEO, Nicholson Enterprises, Inc. (real estate holding company); Chairman and CEO, Renaissance Homes of Colorado.
Qualifications: Legal, government, business management and mutual fund director experience. |
Annual Shareholder Report56
Name
Birth Date
Positions Held with Corporation
Date Service Began | Principal Occupation(s) for Past Five Years,
Other Directorships Held, Previous Position(s) and Qualifications |
Thomas M. O'Neill
Birth Date: June 14, 1951
Director
Began serving: October 2006 | Principal Occupations: Director or Trustee of the Federated Fund Family; Sole Proprietor, Navigator Management Company (investment and strategic consulting).
Other Directorships Held: Board of Overseers, Children's Hospital of Boston; Visiting Committee on Athletics, Harvard College.
Previous Positions: Chief Executive Officer and President, Managing Director and Chief Investment Officer, Fleet Investment Advisors; President and Chief Executive Officer, Aeltus Investment Management, Inc.; General Partner, Hellman, Jordan Management Co., Boston, MA; Chief Investment Officer, The Putnam Companies, Boston, MA; Credit Analyst and Lending Officer, Fleet Bank; Director and Consultant, EZE Castle Software (investment order management software); Director, Midway Pacific (lumber).
Qualifications: Business management, mutual fund, director and investment experience. |
John S. Walsh
Birth Date: November 28, 1957
Director
Began serving: January 1999 | Principal Occupations: Director or Trustee of the Federated Fund Family; President and Director, Heat Wagon, Inc. (manufacturer of construction temporary heaters); President and Director, Manufacturers Products, Inc. (distributor of portable construction heaters); President, Portable Heater Parts, a division of Manufacturers Products, Inc.
Previous Position: Vice President, Walsh & Kelly, Inc.
Qualifications: Business management and director experience. |
James F. Will
Birth Date: October 12, 1938
Director
Began serving: April 2006 | Principal Occupations: Director or Trustee of the Federated Fund Family; formerly, Vice Chancellor and President, Saint Vincent College.
Other Directorships Held: Trustee, Saint Vincent College; Director, Alleghany Corporation; Trustee, Wheeling Jesuit University; Director, Liberty Tire Recycling.
Previous Positions: Chairman, President and Chief Executive Officer, Armco, Inc.; President and Chief Executive Officer, Cyclops Industries; President and Chief Operating Officer, Kaiser Steel Corporation.
Qualifications: Business management, education and director experience. |
Annual Shareholder Report57
OFFICERS
Name
Birth Date
Positions Held with Corporation
Date Service Began | Principal Occupation(s) for Past Five Years
and Previous Position(s) |
John W. McGonigle
Birth Date: October 26, 1938
EXECUTIVE VICE PRESIDENT AND SECRETARY
Began serving: November 1991 | Principal Occupations: Executive Vice President and Secretary of the Federated Fund Family; Vice Chairman, Executive Vice President, Secretary and Director, Federated Investors, Inc.
Previous Positions: Trustee, Federated Investment Management Company and Federated Investment Counseling; Director, Federated Global Investment Management Corp., Federated Services Company and Federated Securities Corp. |
Richard A. Novak
Birth Date: December 25, 1963
TREASURER
Began serving: January 2006 | Principal Occupations: Principal Financial Officer and Treasurer of the Federated Fund Family; Senior Vice President, Federated Administrative Services; Financial and Operations Principal for Federated Securities Corp., Edgewood Services, Inc. and Southpointe Distribution Services, Inc.
Previous Positions: Controller of Federated Investors, Inc.; Vice President, Finance of Federated Services Company; held various financial management positions within The Mercy Hospital of Pittsburgh; Auditor, Arthur Andersen & Co. |
Richard B. Fisher
Birth Date: May 17, 1923
VICE PRESIDENT
Began serving: August 2002 | Principal Occupations: Vice Chairman or Vice President of some of the Funds in the Federated Fund Family; Vice Chairman, Federated Investors, Inc.; Chairman, Federated Securities Corp.
Previous Positions: President and Director or Trustee of some of the Funds in the Federated Fund Family; Executive Vice President, Federated Investors, Inc.; Director and Chief Executive Officer, Federated Securities Corp. |
Brian P. Bouda
Birth Date: February 28, 1947
CHIEF COMPLIANCE OFFICER AND SENIOR VICE PRESIDENT
Began serving: August 2004 | Principal Occupations: Senior Vice President and Chief Compliance Officer of the Federated Fund Family; Vice President and Chief Compliance Officer of Federated Investors, Inc. and Chief Compliance Officer of its subsidiaries. Mr. Bouda joined Federated in 1999 and is a member of the American Bar Association and the State Bar Association of Wisconsin. |
Robert J. Ostrowski
Birth Date: April 26, 1963
CHIEF INVESTMENT OFFICER
Began serving: May 2004 | Principal Occupations: Robert J. Ostrowski joined Federated in 1987 as an Investment Analyst and became a Portfolio Manager in 1990. He was named Chief Investment Officer of taxable fixed-income products in 2004 and also serves as a Senior Portfolio Manager. He has been a Senior Vice President of the Fund's Adviser since 1997. Mr. Ostrowski has received the Chartered Financial Analyst designation. He received his M.S. in Industrial Administration from Carnegie Mellon University. |
Mary Jo Ochson
Birth Date: September 12, 1953
Chief Investment Officer
Began serving: May 2004 | Principal Occupations: Mary Jo Ochson was named Chief Investment Officer of tax-exempt, fixed-income products in 2004 and Chief Investment Officer of Tax-Free Money Markets in 2010. She joined Federated in 1982 and has been a Senior Portfolio Manager and a Senior Vice President of the Fund's Adviser since 1996. Ms. Ochson has received the Chartered Financial Analyst designation and holds an M.B.A. in Finance from the University of Pittsburgh. |
Annual Shareholder Report58
Name
Birth Date
Positions Held with Corporation
Date Service Began | Principal Occupation(s) for Past Five Years
and Previous Position(s) |
Joseph M. Balestrino
Birth Date: November 3, 1954
Vice President
Began serving: November 1998 | Principal Occupations: Joseph M. Balestrino is Vice President of the Corporation. Mr. Balestrino joined Federated in 1986 and has been a Senior Portfolio Manager and Senior Vice President of the Fund's Adviser since 1998. He was a Portfolio Manager and a Vice President of the Fund's Adviser from 1995 to 1998. Mr. Balestrino served as a Portfolio Manager and an Assistant Vice President of the Adviser from 1993 to 1995. Mr. Balestrino has received the Chartered Financial Analyst designation and holds a Master's Degree in Urban and Regional Planning from the University of Pittsburgh. |
Jeff A. Kozemchak
Birth Date: January 15, 1960
Vice President
Began serving: November 1998 | Principal Occupations: Jeff A. Kozemchak has been the Fund's Portfolio Manager since October 2000. He is Vice President of the Corporation. Mr. Kozemchak joined Federated in 1987 and has been a Senior Portfolio Manager since 1996 and a Senior Vice President of the Fund's Adviser since 1999. He was a Portfolio Manager until 1996 and a Vice President of the Fund's Adviser from 1993 to 1998. Mr. Kozemchak has received the Chartered Financial Analyst designation and holds an M.S. in Industrial Administration from Carnegie Mellon University in 1987. |
Annual Shareholder Report59
Evaluation and Approval of Advisory Contract - May 2010
Federated Municipal Ultrashort Fund (the “Fund”)
The Fund's Board reviewed the Fund's investment advisory contract at meetings held in May 2010. The Board's decision regarding the contract reflects the exercise of its business judgment on whether to continue the existing arrangements.
In this connection, the Federated funds' Board had previously appointed a Senior Officer, whose duties include specified responsibilities relating to the process by which advisory fees are to be charged to a Federated fund. The Senior Officer has the authority to retain consultants, experts, or staff as may be reasonably necessary to assist in the performance of his duties, reports directly to the Board, and may be terminated only with the approval of a majority of the independent members of the Board. The Senior Officer prepared and furnished to the Board an independent, written evaluation that covered topics discussed below. The Board considered that evaluation, along with other information, in deciding to approve the advisory contract.
During its review of the contract, the Board considered compensation and benefits received by the Adviser. This included the fees received for services provided to the Fund by other entities in the Federated organization and research services (if any) received by the Adviser from brokers that execute Federated fund trades, as well as advisory fees. The Board is also familiar with and considered judicial decisions concerning allegedly excessive investment advisory fees, which have indicated that the following factors may be relevant to an Adviser's fiduciary duty with respect to its receipt of compensation from a fund: the nature and quality of the services provided by the Adviser, including the performance of the fund; the Adviser's cost of providing the services; the extent to which the Adviser may realize “economies of scale” as a fund grows larger; any indirect benefits that may accrue to the Adviser and its affiliates as a result of the Adviser's relationship with a fund; performance and expenses of comparable funds; and the extent to which the independent Board members are fully informed about all facts the Board deems relevant bearing on the Adviser's services and fees. The Board further considered management fees (including any components thereof) charged to institutional and other clients of the Adviser for what might be viewed as like services, and the cost to the Adviser and its affiliates of supplying services pursuant to the management fee agreements, excluding any intra-corporate profit and profit margins of the Adviser and its affiliates for supplying such services. The Board was aware of these factors and was guided by them in its review of the Fund's advisory contract to the extent it considered them to be appropriate and relevant, as discussed further below.
Annual Shareholder Report60
The Board considered and weighed these circumstances in light of its substantial accumulated experience in governing the Fund and working with Federated on matters relating to the Federated funds, and was assisted in its deliberations by independent legal counsel. Throughout the year, the Board has requested and received substantial and detailed information about the Fund and the Federated organization that was in addition to the extensive materials that comprise and accompany the Senior Officer's evaluation. Federated provided much of this information at each regular meeting of the Board, and furnished additional reports in connection with the particular meeting at which the Board's formal review of the advisory contract occurred. Between regularly scheduled meetings, the Board also received information on particular matters as the need arose. Thus, the Board's consideration of the advisory contract included review of the Senior Officer's evaluation, accompanying data and additional reports covering such matters as: the Adviser's investment philosophy, revenue, profitability, personnel and processes; investment and operating strategies; the Fund's short- and long-term performance (in absolute terms, both on a gross basis and net of expenses, as well as in relationship to its particular investment program and certain competitor or “peer group” funds and/or other benchmarks, as appropriate), and comments on the reasons for performance; the Fund's investment objectives; the Fund's expenses (including the advisory fee itself and the overall expense structure of the Fund, both in absolute terms and relative to similar and/or competing funds, with due regard for contractual or voluntary expense limitations); the use and allocation of brokerage commissions derived from trading the Fund's portfolio securities (if any); and the nature, quality and extent of the advisory and other services provided to the Fund by the Adviser and its affiliates. The Board also considered the preferences and expectations of Fund shareholders and their relative sophistication; the continuing state of competition in the mutual fund industry and market practices; the range of comparable fees for similar funds in the mutual fund industry; the Fund's relationship to the Federated family of funds which include a comprehensive array of funds with different investment objectives, policies and strategies which are available for exchange without the incurrence of additional sales charges; compliance and audit reports concerning the Federated funds and the Federated companies that service them (including communications from regulatory agencies), as well as Federated's responses to any issues raised therein; and relevant developments in the mutual fund industry and how the Federated funds and/or Federated are responding to them. The Board's evaluation process is evolutionary. The criteria considered and the emphasis placed on relevant criteria change in recognition of changing circumstances in the mutual fund marketplace. With respect to the Fund's performance and expenses in particular, the Board has found the use of comparisons to other mutual funds with comparable investment programs to be relevant, given the high degree of competition in the mutual fund business. The Board focused on comparisons with other similar Annual Shareholder Report61
mutual funds more heavily than non-mutual fund products or services because it is believed that they are more relevant. For example, other mutual funds are the products most like the Fund, they are readily available to Fund shareholders as alternative investment vehicles, and they are the type of investment vehicle in fact chosen and maintained by the Fund's investors. The range of their fees and expenses therefore appears to be a generally reliable indication of what consumers have found to be reasonable in the precise marketplace in which the Fund competes. The Fund's ability to deliver competitive performance when compared to its peer group was a useful indicator of how the Adviser is executing the Fund's investment program, which in turn assisted the Board in reaching a conclusion that the nature, extent, and quality of the Adviser's investment management services were such as to warrant continuation of the advisory contract. In this regard, the Senior Officer has reviewed Federated's fees for providing advisory services to products outside the Federated family of funds (e.g., institutional and separate accounts). He concluded that mutual funds and institutional accounts are inherently different products. Those differences include, but are not limited to, different types of targeted investors; being subject to different laws and regulations; different legal structures; different average account sizes; different associated costs; different portfolio management techniques made necessary by different cash flows; and portfolio manager time spent in review of securities pricing. The Senior Officer did not consider these fee schedules to be determinative in judging the appropriateness of mutual fund advisory contracts.The Senior Officer reviewed reports compiled by Federated, using data supplied by independent fund ranking organizations, regarding the performance of, and fees charged by, other mutual funds, noting his view that comparisons to fund peer groups are relevant in judging the reasonableness of proposed fees.
The Fund's performance fell below the median of the relevant peer group for the one-year, three-year and five-year periods covered by the report. The Board discussed the Fund's performance with the Adviser and recognized the efforts being undertaken by the Adviser. The Board will continue to monitor these efforts and the performance of the Fund.
The Board also received financial information about Federated, including reports on the compensation and benefits Federated derived from its relationships with the Federated funds. These reports covered not only the fees under the advisory contracts, but also fees received by Federated's subsidiaries for providing other services to the Federated funds under separate contracts (e.g., for serving as the Federated funds' administrator). The reports also discussed any indirect benefit Federated may derive from its receipt of research services from brokers who execute Federated fund trades. In addition, the Board considered the fact that, in order for a fund to be competitive in the marketplace, Federated and its affiliates frequently waived fees and/or Annual Shareholder Report62
reimbursed expenses and have disclosed to fund investors and/or indicated to the Board their intention to do so in the future, where appropriate. Moreover, the Board receives regular reports regarding the institution or elimination of these voluntary waivers.Federated furnished reports, requested by the Senior Officer, that reported revenues on a fund-by-fund basis and made estimates of the allocation of expenses on a fund-by-fund basis, using allocation methodologies specified by the Senior Officer. The Senior Officer noted that, although they may apply consistent allocation processes, the inherent difficulties in allocating costs (and the unavoidable arbitrary aspects of that exercise) and the lack of consensus on how to allocate those costs may render such allocation reports unreliable. The allocation reports were considered in the analysis by the Board but were determined to be of limited use.
The Board and the Senior Officer also reviewed a report compiled by Federated comparing profitability information for Federated to other publicly held fund management companies. In this regard, the Senior Officer noted the limited availability of such information, but nonetheless concluded that Federated's profit margins did not appear to be excessive and the Board agreed.
The Senior Officer's evaluation also discussed the notion of possible realization of “economies of scale” as a fund grows larger. The Board considered in this regard that the Adviser has made significant and long-term investments in areas that support all of the Federated funds, such as personnel and processes for the portfolio management, compliance, and risk management functions; and systems technology; and that the benefits of these efforts (as well as any economies, should they exist) were likely to be enjoyed by the fund complex as a whole. Finally, the Board also noted the absence of any applicable regulatory or industry guidelines on this subject, which (as discussed in the Senior Officer's evaluation) is compounded by the lack of any common industry practice or general pattern with respect to structuring fund advisory fees with “breakpoints” that serve to reduce the fee as the fund attains a certain size. The Senior Officer did not recommend institution of breakpoints in pricing Federated's fund advisory services at this time.
It was noted in the materials for the Board meeting that for the period covered by the report, the Fund's investment advisory fee, after waivers and expense reimbursements, if any, was below the median of the relevant peer group. The Board reviewed the fees and other expenses of the Fund with the Adviser and was satisfied that the overall expense structure of the Fund remained competitive.
The Senior Officer's evaluation noted his belief that the information and observations contained in his evaluation supported a finding that the proposed management fees are reasonable, and that Federated appeared to provide appropriate administrative services to the Fund for the fees paid. Under these Annual Shareholder Report63
circumstances, no changes were recommended to, and no objection was raised to, the continuation of the Fund's advisory contract. The Board concluded that the nature, quality and scope of services provided the Fund by the Adviser and its affiliates were satisfactory.In its decision to continue an existing investment advisory contract, the Board was mindful of the potential disruptions of the Fund's operations and various risks, uncertainties and other effects that could occur as a result of a decision to terminate or not renew an advisory contract. In particular, the Board recognized that many shareholders have invested in the Fund on the strength of the Adviser's industry standing and reputation and with the expectation that the Adviser will have a continuing role in providing advisory services to the Fund. Thus, the Board's approval of the advisory contract reflected the fact that it is the shareholders who have effectively selected the Adviser by virtue of having invested in the Fund.
The Board based its decision to approve the advisory contract on the totality of the circumstances and relevant factors and with a view to past and future long-term considerations. Not all of the factors and considerations identified above were necessarily relevant to the Fund, nor did the Board consider any one of them to be determinative. With respect to the factors that were relevant, the Board's decision to approve the contract reflects its determination that Federated's performance and actions provided a satisfactory basis to support the decision to continue the existing arrangements.
Annual Shareholder Report64
Voting Proxies on Fund Portfolio Securities
A description of the policies and procedures that the Fund uses to determine how to vote proxies, if any, relating to securities held in the Fund's portfolio is available, without charge and upon request, by calling 1-800-341-7400. A report on “Form N-PX” of how the Fund voted any such proxies during the most recent 12-month period ended June 30 is available from Federated's website at FederatedInvestors.com. To access this information from the “Products” section of the website, click on the “Prospectuses and Regulatory Reports” link under “Related Information,” then select the appropriate link opposite the name of the Fund; or select the name of the Fund and from the Fund's page, click on the “Prospectuses and Regulatory Reports” link. Form N-PX filings are also available at the SEC's website at www.sec.gov.
Quarterly Portfolio Schedule
The Fund files with the SEC a complete schedule of its portfolio holdings, as of the close of the first and third quarters of its fiscal year, on “Form N-Q.” These filings are available on the SEC's website at www.sec.gov and may be reviewed and copied at the SEC's Public Reference Room in Washington, DC. (Call 1-800-SEC-0330 for information on the operation of the Public Reference Room.) You may also access this information from the “Products” section of Federated's website at FederatedInvestors.com by clicking on “Portfolio Holdings” under “Related Information,” then selecting the appropriate link opposite the name of the Fund; or select the name of the Fund and from the Fund's page, click on the “Portfolio Holdings” link.
Annual Shareholder Report65
Mutual funds are not bank deposits or obligations, are not guaranteed by any bank and are not insured or guaranteed by the U.S. government, the Federal Deposit Insurance Corporation, the Federal Reserve Board or any other government agency. Investment in mutual funds involves investment risk, including the possible loss of principal.
This Report is authorized for distribution to prospective investors only when preceded or accompanied by the Fund's Prospectus, which contains facts concerning its objective and policies, management fees, expenses and other information.
Federated Municipal Ultrashort Fund
Federated Investors Funds
4000 Ericsson Drive
Warrendale, PA 15086-7561
Contact us at FederatedInvestors.com
or call 1-800-341-7400.
Federated Securities Corp., Distributor
Cusip 31417P858
29363 (11/10)
Federated is a registered mark of Federated Investors, Inc.
2010 © Federated Investors, Inc.
Item 2. Code of Ethics
(a) As of the end of the period covered by this report, the registrant has adopted a code of ethics (the "Section 406 Standards for Investment Companies - Ethical Standards for Principal Executive and Financial Officers") that applies to the registrant's Principal Executive Officer and Principal Financial Officer; the registrant's Principal Financial Officer also serves as the Principal Accounting Officer.
(c) Not Applicable
(d) Not Applicable
(e) Not Applicable
(f)(3) The registrant hereby undertakes to provide any person, without charge, upon request, a copy of the code of ethics. To request a copy of the code of ethics, contact the registrant at 1-800-341-7400, and ask for a copy of the Section 406 Standards for Investment Companies - Ethical Standards for Principal Executive and Financial Officers.
Item 3. Audit Committee Financial Expert
The registrant's Board has determined that each of the following members of the Board's Audit Committee is an “audit committee financial expert,” and is "independent," for purposes of this Item: Nicholas P. Constantakis, Charles F. Mansfield, Jr. and Thomas M. O’Neill.
Item 4. Principal Accountant Fees and Services
(a) Audit Fees billed to the registrant for the two most recent fiscal years:
Fiscal year ended 2010 - $48,400
Fiscal year ended 2009 - $48,900
(b) Audit-Related Fees billed to the registrant for the two most recent fiscal years:
Fiscal year ended 2010 - $62
Fiscal year ended 2009 - $0
Audit Committee Meeting.
Amount requiring approval of the registrant’s audit committee pursuant to paragraph (c)(7)(ii) of Rule 2-01 of Regulation S-X, $0 and $0 respectively.
(c) Tax Fees billed to the registrant for the two most recent fiscal years:
Fiscal year ended 2010 - $0
Fiscal year ended 2009 - $0
Amount requiring approval of the registrant’s audit committee pursuant to paragraph (c)(7)(ii) of Rule 2-01 of Regulation S-X, $0 and $0 respectively.
(d) All Other Fees billed to the registrant for the two most recent fiscal years:
Fiscal year ended 2010 - $0
Fiscal year ended 2009 - $0
Amount requiring approval of the registrant’s audit committee pursuant to paragraph (c)(7)(ii) of Rule 2-01 of Regulation S-X, $0 and $0 respectively.
(e)(1) Audit Committee Policies regarding Pre-approval of Services.
The Audit Committee is required to pre-approve audit and non-audit services performed by the independent auditor in order to assure that the provision of such services do not impair the auditor’s independence. Unless a type of service to be provided by the independent auditor has received general pre-approval, it will require specific pre-approval by the Audit Committee. Any proposed services exceeding pre-approved cost levels will require specific pre-approval by the Audit Committee.
Certain services have the general pre-approval of the Audit Committee. The term of the general pre-approval is 12 months from the date of pre-approval, unless the Audit Committee specifically provides for a different period. The Audit Committee will annually review the services that may be provided by the independent auditor without obtaining specific pre-approval from the Audit Committee and may grant general pre-approval for such services. The Audit Committee will revise the list of general pre-approved services from time to time, based on subsequent determinations. The Audit Committee will not delegate its responsibilities to pre-approve services performed by the independent auditor to management.
The Audit Committee has delegated pre-approval authority to its Chairman. The Chairman will report any pre-approval decisions to the Audit Committee at its next scheduled meeting. The Committee will designate another member with such pre-approval authority when the Chairman is unavailable.
AUDIT SERVICES
The annual Audit services engagement terms and fees will be subject to the specific pre-approval of the Audit Committee. The Audit Committee must approve any changes in terms, conditions and fees resulting from changes in audit scope, registered investment company (RIC) structure or other matters.
In addition to the annual Audit services engagement specifically approved by the Audit Committee, the Audit Committee may grant general pre-approval for other Audit Services, which are those services that only the independent auditor reasonably can provide. The Audit Committee has pre-approved certain Audit services, all other Audit services must be specifically pre-approved by the Audit Committee.
AUDIT-RELATED SERVICES
Audit-related services are assurance and related services that are reasonably related to the performance of the audit or review of the Company’s financial statements or that are traditionally performed by the independent auditor. The Audit Committee believes that the provision of Audit-related services does not impair the independence of the auditor, and has pre-approved certain Audit-related services, all other Audit-related services must be specifically pre-approved by the Audit Committee.
TAX SERVICES
The Audit Committee believes that the independent auditor can provide Tax services to the Company such as tax compliance, tax planning and tax advice without impairing the auditor’s independence. However, the Audit Committee will not permit the retention of the independent auditor in connection with a transaction initially recommended by the independent auditor, the purpose of which may be tax avoidance and the tax treatment of which may not be supported in the Internal Revenue Code and related regulations. The Audit Committee has pre-approved certain Tax services, all Tax services involving large and complex transactions must be specifically pre-approved by the Audit Committee.
ALL OTHER SERVICES
With respect to the provision of services other than audit, review or attest services the pre-approval requirement is waived if:
| (1) | The aggregate amount of all such services provided constitutes no more than five percent of the total amount of revenues paid by the registrant, the registrant’s adviser (not including any sub-adviser whose role is primarily portfolio management and is subcontracted with or overseen by another investment adviser), and any entity controlling, controlled by, or under common control with the investment adviser that provides ongoing services to the registrant to its accountant during the fiscal year in which the services are provided; |
| (2) | Such services were not recognized by the registrant, the registrant’s adviser (not including any sub-adviser whose role is primarily portfolio management and is subcontracted with or overseen by another investment adviser), and any entity controlling, controlled by, or under common control with the investment adviser that provides ongoing services to the registrant at the time of the engagement to be non-audit services; and |
| (3) | Such services are promptly brought to the attention of the Audit Committee of the issuer and approved prior to the completion of the audit by the Audit Committee or by one or more members of the Audit Committee who are members of the board of directors to whom authority to grant such approvals has been delegated by the Audit Committee. |
The Audit Committee may grant general pre-approval to those permissible non-audit services classified as All Other services that it believes are routine and recurring services, and would not impair the independence of the auditor.
The SEC’s rules and relevant guidance should be consulted to determine the precise definitions of prohibited non-audit services and the applicability of exceptions to certain of the prohibitions.
PRE-APPROVAL FEE LEVELS
Pre-approval fee levels for all services to be provided by the independent auditor will be established annually by the Audit Committee. Any proposed services exceeding these levels will require specific pre-approval by the Audit Committee.
PROCEDURES
Requests or applications to provide services that require specific approval by the Audit Committee will be submitted to the Audit Committee by both the independent auditor and the Principal Accounting Officer and/or Internal Auditor, and must include a joint statement as to whether, in their view, the request or application is consistent with the SEC’s rules on auditor independence.
(e)(2) Percentage of services identified in items 4(b) through 4(d) that were approved by the registrants audit committee pursuant to paragraph (c)(7)(i)(C) of Rule 2-01 of Regulation S-X:
4(b)
Fiscal year ended 2010 – 0%
Fiscal year ended 2009 - 0%
Percentage of services provided to the registrants investment adviser and any entity controlling, controlled by, or under common control with the investment adviser that provides ongoing services to the registrant that were approved by the registrants audit committee pursuant to paragraph (c)(7)(i)(C) of Rule 2-01 of Regulation S-X, 0% and 0% respectively.
4(c)
Fiscal year ended 2010 – 0%
Fiscal year ended 2009 – 0%
Percentage of services provided to the registrants investment adviser and any entity controlling, controlled by, or under common control with the investment adviser that provides ongoing services to the registrant that were approved by the registrants audit committee pursuant to paragraph (c)(7)(i)(C) of Rule 2-01 of Regulation S-X, 0% and 0% respectively.
4(d)
Fiscal year ended 2010 – 0%
Fiscal year ended 2009 – 0%
Percentage of services provided to the registrants investment adviser and any entity controlling, controlled by, or under common control with the investment adviser that provides ongoing services to the registrant that were approved by the registrants audit committee pursuant to paragraph (c)(7)(i)(C) of Rule 2-01 of Regulation S-X, 0% and 0% respectively.
| (g) | Non-Audit Fees billed to the registrant, the registrant’s investment adviser, and certain entities controlling, controlled by or under common control with the investment adviser: |
Fiscal year ended 2010 - $417,921
Fiscal year ended 2009 - $112,380
(h) The registrant’s Audit Committee has considered that the provision of non-audit services that were rendered to the registrant’s adviser (not including any sub-adviser whose role is primarily portfolio management and is subcontracted with or overseen by another investment adviser), and any entity controlling, controlled by, or under common control with the investment adviser that provides ongoing services to the registrant that were not pre-approved pursuant to paragraph (c)(7)(ii) of Rule 2-01 of Regulation S-X is compatible with maintaining the principal accountant’s independence.
Item 5. Audit Committee of Listed Registrants
Not Applicable
Item 6. Schedule of Investments
Not Applicable
| Item 7. | Disclosure of Proxy Voting Policies and Procedures for Closed-End Management Investment Companies |
| Item 8. | Portfolio Managers of Closed-End Management Investment Companies |
| Item 9. | Purchases of Equity Securities by Closed-End Management Investment Company and Affiliated Purchasers |
Item 10. Submission of Matters to a Vote of Security Holders
Not Applicable
Item 11. Controls and Procedures
(a) The registrant’s President and Treasurer have concluded that the
registrant’s disclosure controls and procedures (as defined in rule 30a-3(c) under the Act) are effective in design and operation and are sufficient to form the basis of the certifications required by Rule 30a-(2) under the Act, based on their evaluation of these disclosure controls and procedures within 90 days of the filing date of this report on Form N-CSR.
(b) There were no changes in the registrant’s internal control over financial reporting (as defined in rule 30a-3(d) under the Act) during the last fiscal quarter that have materially affected, or are reasonably likely to materially affect, the registrant’s internal control over financial reporting.
Item 12. Exhibits
SIGNATURES
Pursuant to the requirements of the Securities Exchange Act of 1934 and the Investment Company Act of 1940, the registrant has duly caused this report to be signed on its behalf by the undersigned, thereunto duly authorized.
| Registrant | Federated Fixed Income Securities, Inc. |
| | |
| By | /S/ Richard A. Novak |
| | Richard A. Novak, Principal Financial Officer |
| Date | November 18, 2010 |
| | |
| | |
| Pursuant to the requirements of the Securities Exchange Act of 1934 and the Investment Company Act of 1940, this report has been signed below by the following persons on behalf of the registrant and in the capacities and on the dates indicated. |
| | |
| | |
| By | /S/ J. Christopher Donahue |
| | J. Christopher Donahue, Principal Executive Officer |
| Date | November 18, 2010 |
| | |
| | |
| By | /S/ Richard A. Novak |
| | Richard A. Novak, Principal Financial Officer |
| Date | November 18, 2010 |