United States Securities and Exchange Commission
Washington, D.C. 20549
Form N-CSRS
Certified Shareholder Report of Registered Management Investment Companies
811-6447
(Investment Company Act File Number)
Federated Hermes Fixed Income Securities, Inc.
(Exact Name of Registrant as Specified in Charter)
Federated Hermes Funds
4000 Ericsson Drive
Warrendale, PA 15086-7561
(Address of Principal Executive Offices)
(412) 288-1900
(Registrant’s Telephone Number)
Peter J. Germain, Esquire
1001 Liberty Avenue
Pittsburgh, Pennsylvania 15222-3779
(Name and Address of Agent for Service)
(Notices should be sent to the Agent for Service)
Date of Fiscal Year End: 2024-11-30
Date of Reporting Period: Six months ended 2024-05-31
| Item 1. | Reports to Stockholders |
Federated Hermes Strategic Income Fund

Class R6 Shares STILX
Semi-Annual Shareholder Report - May 31, 2024
This semi-annual shareholder report contains important information about the Federated Hermes Strategic Income Fund (the "Fund") for the period of December 1, 2023 to May 31, 2024. You can find additional information at www.FederatedHermes.com/us/FundInformation. You can also request this information by contacting us at 1-800-341-7400, Option 4, or your financial advisor.
What were the Fund costs for the last six months?
(based on a hypothetical $10,000 investment)
| Class Name | Cost of a $10,000 investment | Costs paid as a percentage of a $10,000 investment |
|---|---|---|
| Class R6 Shares | $31 | 0.60% |
Key Fund Statistics
| Net Assets | $589,130,809 |
| Number of Investments | 271 |
| Portfolio Turnover | 9% |
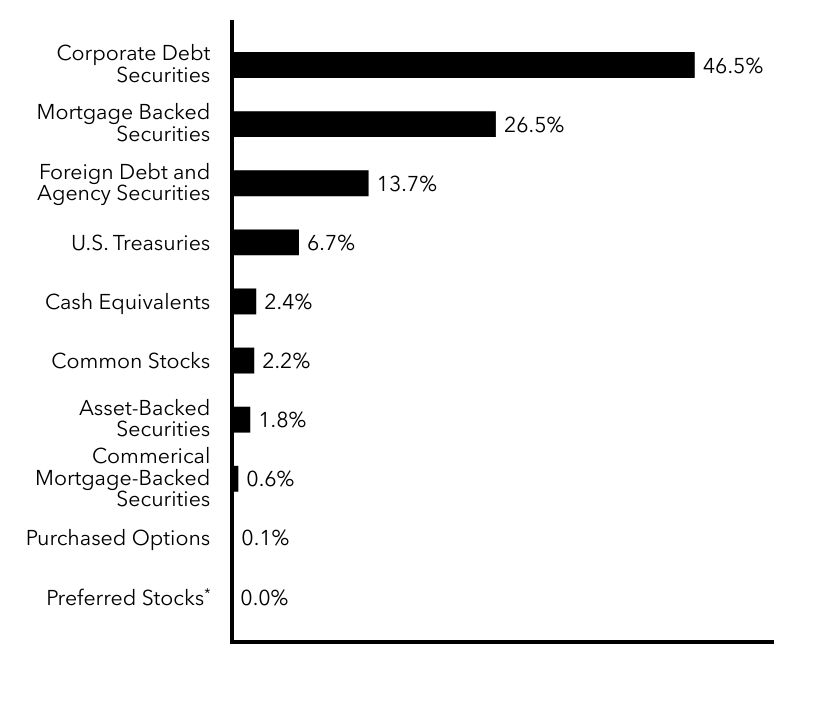
Fund Holdings
Top Security Types (% of Net Assets)

| Value | Value |
|---|---|
Preferred StocksFootnote Reference* | 0.0%Footnote Reference* |
| Purchased Options | 0.1% |
| Commerical Mortgage-Backed Securities | 0.6% |
| Asset-Backed Securities | 1.8% |
| Common Stocks | 2.2% |
| Cash Equivalents | 2.4% |
| U.S. Treasuries | 6.7% |
| Foreign Debt and Agency Securities | 13.7% |
| Mortgage Backed Securities | 26.5% |
| Corporate Debt Securities | 46.5% |
| Footnote | Description |
Footnote* | Represents less than 0.1%. |
Semi-Annual Shareholder Report
Federated Hermes Strategic Income Fund
Additional Information about the Fund
Additional information is available on the Fund’s website at www.FederatedHermes.com/us/FundInformation, including its:
• prospectus • financial information • holdings • proxy voting information
CUSIP 31417P833
G00324-01-E (07/24)
Federated Securities Corp., Distributor
www.federatedhermes.com/us
© 2024 Federated Hermes, Inc.
Federated Hermes Strategic Income Fund

Class A Shares STIAX
Semi-Annual Shareholder Report - May 31, 2024
This semi-annual shareholder report contains important information about the Federated Hermes Strategic Income Fund (the "Fund") for the period of December 1, 2023 to May 31, 2024. You can find additional information at www.FederatedHermes.com/us/FundInformation. You can also request this information by contacting us at 1-800-341-7400, Option 4, or your financial advisor.
What were the Fund costs for the last six months?
(based on a hypothetical $10,000 investment)
| Class Name | Cost of a $10,000 investment | Costs paid as a percentage of a $10,000 investment |
|---|---|---|
| Class A Shares | $48 | 0.93% |
Key Fund Statistics
| Net Assets | $589,130,809 |
| Number of Investments | 271 |
| Portfolio Turnover | 9% |
Fund Holdings
Top Security Types (% of Net Assets)

| Value | Value |
|---|---|
Preferred StocksFootnote Reference* | 0.0%Footnote Reference* |
| Purchased Options | 0.1% |
| Commerical Mortgage-Backed Securities | 0.6% |
| Asset-Backed Securities | 1.8% |
| Common Stocks | 2.2% |
| Cash Equivalents | 2.4% |
| U.S. Treasuries | 6.7% |
| Foreign Debt and Agency Securities | 13.7% |
| Mortgage Backed Securities | 26.5% |
| Corporate Debt Securities | 46.5% |
| Footnote | Description |
Footnote* | Represents less than 0.1%. |
Semi-Annual Shareholder Report
Federated Hermes Strategic Income Fund
Additional Information about the Fund
Additional information is available on the Fund’s website at www.FederatedHermes.com/us/FundInformation, including its:
• prospectus • financial information • holdings • proxy voting information
CUSIP 31417P502
G00324-01-A (07/24)
Federated Securities Corp., Distributor
www.federatedhermes.com/us
© 2024 Federated Hermes, Inc.
Federated Hermes Strategic Income Fund

Class C Shares SINCX
Semi-Annual Shareholder Report - May 31, 2024
This semi-annual shareholder report contains important information about the Federated Hermes Strategic Income Fund (the "Fund") for the period of December 1, 2023 to May 31, 2024. You can find additional information at www.FederatedHermes.com/us/FundInformation. You can also request this information by contacting us at 1-800-341-7400, Option 4, or your financial advisor.
What were the Fund costs for the last six months?
(based on a hypothetical $10,000 investment)
| Class Name | Cost of a $10,000 investment | Costs paid as a percentage of a $10,000 investment |
|---|---|---|
| Class C Shares | $87 | 1.70% |
Key Fund Statistics
| Net Assets | $589,130,809 |
| Number of Investments | 271 |
| Portfolio Turnover | 9% |
Fund Holdings
Top Security Types (% of Net Assets)

| Value | Value |
|---|---|
Preferred StocksFootnote Reference* | 0.0%Footnote Reference* |
| Purchased Options | 0.1% |
| Commerical Mortgage-Backed Securities | 0.6% |
| Asset-Backed Securities | 1.8% |
| Common Stocks | 2.2% |
| Cash Equivalents | 2.4% |
| U.S. Treasuries | 6.7% |
| Foreign Debt and Agency Securities | 13.7% |
| Mortgage Backed Securities | 26.5% |
| Corporate Debt Securities | 46.5% |
| Footnote | Description |
Footnote* | Represents less than 0.1%. |
Semi-Annual Shareholder Report
Federated Hermes Strategic Income Fund
Additional Information about the Fund
Additional information is available on the Fund’s website at www.FederatedHermes.com/us/FundInformation, including its:
• prospectus • financial information • holdings • proxy voting information
CUSIP 31417P700
G00324-01-B (07/24)
Federated Securities Corp., Distributor
www.federatedhermes.com/us
© 2024 Federated Hermes, Inc.
Federated Hermes Strategic Income Fund

Class F Shares STFSX
Semi-Annual Shareholder Report - May 31, 2024
This semi-annual shareholder report contains important information about the Federated Hermes Strategic Income Fund (the "Fund") for the period of December 1, 2023 to May 31, 2024. You can find additional information at www.FederatedHermes.com/us/FundInformation. You can also request this information by contacting us at 1-800-341-7400, Option 4, or your financial advisor.
What were the Fund costs for the last six months?
(based on a hypothetical $10,000 investment)
| Class Name | Cost of a $10,000 investment | Costs paid as a percentage of a $10,000 investment |
|---|---|---|
| Class F Shares | $48 | 0.93% |
Key Fund Statistics
| Net Assets | $589,130,809 |
| Number of Investments | 271 |
| Portfolio Turnover | 9% |
Fund Holdings
Top Security Types (% of Net Assets)
| Value | Value |
|---|---|
Preferred StocksFootnote Reference* | 0.0%Footnote Reference* |
| Purchased Options | 0.1% |
| Commerical Mortgage-Backed Securities | 0.6% |
| Asset-Backed Securities | 1.8% |
| Common Stocks | 2.2% |
| Cash Equivalents | 2.4% |
| U.S. Treasuries | 6.7% |
| Foreign Debt and Agency Securities | 13.7% |
| Mortgage Backed Securities | 26.5% |
| Corporate Debt Securities | 46.5% |
| Footnote | Description |
Footnote* | Represents less than 0.1%. |
Semi-Annual Shareholder Report
Federated Hermes Strategic Income Fund
Additional Information about the Fund
Additional information is available on the Fund’s website at www.FederatedHermes.com/us/FundInformation, including its:
• prospectus • financial information • holdings • proxy voting information
CUSIP 31417P809
G00324-01-C (07/24)
Federated Securities Corp., Distributor
www.federatedhermes.com/us
© 2024 Federated Hermes, Inc.
Federated Hermes Strategic Income Fund

Institutional Shares STISX
Semi-Annual Shareholder Report - May 31, 2024
This semi-annual shareholder report contains important information about the Federated Hermes Strategic Income Fund (the "Fund") for the period of December 1, 2023 to May 31, 2024. You can find additional information at www.FederatedHermes.com/us/FundInformation. You can also request this information by contacting us at 1-800-341-7400, Option 4, or your financial advisor.
What were the Fund costs for the last six months?
(based on a hypothetical $10,000 investment)
| Class Name | Cost of a $10,000 investment | Costs paid as a percentage of a $10,000 investment |
|---|---|---|
| Institutional Shares | $31 | 0.61% |
Key Fund Statistics
| Net Assets | $589,130,809 |
| Number of Investments | 271 |
| Portfolio Turnover | 9% |
Fund Holdings
Top Security Types (% of Net Assets)

| Value | Value |
|---|---|
Preferred StocksFootnote Reference* | 0.0%Footnote Reference* |
| Purchased Options | 0.1% |
| Commerical Mortgage-Backed Securities | 0.6% |
| Asset-Backed Securities | 1.8% |
| Common Stocks | 2.2% |
| Cash Equivalents | 2.4% |
| U.S. Treasuries | 6.7% |
| Foreign Debt and Agency Securities | 13.7% |
| Mortgage Backed Securities | 26.5% |
| Corporate Debt Securities | 46.5% |
| Footnote | Description |
Footnote* | Represents less than 0.1%. |
Semi-Annual Shareholder Report
Federated Hermes Strategic Income Fund
Additional Information about the Fund
Additional information is available on the Fund’s website at www.FederatedHermes.com/us/FundInformation, including its:
• prospectus • financial information • holdings • proxy voting information
CUSIP 31417P841
G00324-01-D (07/24)
Federated Securities Corp., Distributor
www.federatedhermes.com/us
© 2024 Federated Hermes, Inc.
| Item 2. | Code of Ethics |
Not Applicable
| Item 3. | Audit Committee Financial Expert |
Not Applicable
| Item 4. | Principal Accountant Fees and Services |
Not Applicable
| Item 5. | Audit Committee of Listed Registrants |
Not Applicable
| Item 6. | Schedule of Investments |
(a) The registrant’s Schedule of Investments is included as part of the Financial Statements filed under Item 7 of this form.
(b) Not Applicable.
| Item 7. | Financial Statements and Financial Highlights for Open-End Management Companies |
and Additional Information

Share Class | Ticker | A | STIAX | C | SINCX | F | STFSX |
Institutional | STISX | R6 | STILX |
Federated Hermes Strategic Income Fund
A Portfolio of Federated Hermes Fixed Income Securities, Inc.
Principal Amount, Shares or Contracts | Value | ||
U.S. TREASURIES—6.7% | |||
U.S. Treasury Bonds—1.6% | |||
$10,275,000 | United States Treasury Bond, 4.250%, 2/15/2054 | $ 9,631,207 | |
U.S. Treasury Notes—5.1% | |||
8,000,000 | United States Treasury Note, 4.250%, 1/31/2026 | 7,908,584 | |
10,000,000 | United States Treasury Note, 4.500%, 7/15/2026 | 9,930,783 | |
12,000,000 | United States Treasury Note, 4.875%, 4/30/2026 | 11,996,255 | |
TOTAL | 29,835,622 | ||
TOTAL U.S. TREASURIES (IDENTIFIED COST $39,591,731) | 39,466,829 | ||
MORTGAGE-BACKED SECURITIES—4.8% | |||
Agency—4.8% | |||
8,169,253 | FHLMC Pool SD8225, 3.000%, 7/1/2052 | 6,875,242 | |
7,898,020 | FHLMC Pool SD8243, 3.500%, 9/1/2052 | 6,928,156 | |
9,516,421 | FNMA Pool FBT224, 3.000%, 3/1/2052 | 8,009,018 | |
7,360,152 | FNMA Pool MA4732, 4.000%, 9/1/2052 | 6,681,282 | |
TOTAL MORTGAGE-BACKED SECURITIES (IDENTIFIED COST $29,785,474) | 28,493,698 | ||
CORPORATE BONDS—3.6% | |||
Basic Industry - Chemicals—0.0% | |||
90,000 | Albemarle Corp., Sr. Unsecd. Note, 5.450%, 12/1/2044 | 82,178 | |
Basic Industry - Metals & Mining—0.1% | |||
200,000 | Anglo American Capital PLC, Sr. Unsecd. Note, 144A, 3.625%, 9/11/2024 | 198,626 | |
50,000 | Glencore Funding LLC, Sr. Unsecd. Note, 144A, 1.625%, 4/27/2026 | 46,554 | |
55,000 | Glencore Funding LLC, Sr. Unsecd. Note, 144A, 3.375%, 9/23/2051 | 36,320 | |
135,000 | Southern Copper Corp., Sr. Unsecd. Note, 6.750%, 4/16/2040 | 147,423 | |
TOTAL | 428,923 | ||
Capital Goods - Aerospace & Defense—0.1% | |||
55,000 | BAE Systems Holdings, Inc., Sr. Unsecd. Note, 144A, 3.850%, 12/15/2025 | 53,605 | |
135,000 | Boeing Co., Sr. Unsecd. Note, 3.625%, 2/1/2031 | 117,461 | |
30,000 | Boeing Co., Sr. Unsecd. Note, 3.950%, 8/1/2059 | 18,856 | |
30,000 | Boeing Co., Sr. Unsecd. Note, 144A, 6.528%, 5/1/2034 | 30,432 | |
50,000 | Boeing Co., Sr. Unsecd. Note, 144A, 6.858%, 5/1/2054 | 50,743 | |
110,000 | Huntington Ingalls Industries, Inc., Sr. Unsecd. Note, 3.483%, 12/1/2027 | 103,094 | |
65,000 | Leidos, Inc., Sr. Unsecd. Note, Series WI, 2.300%, 2/15/2031 | 53,331 | |
100,000 | Leidos, Inc., Sr. Unsecd. Note, Series WI, 4.375%, 5/15/2030 | 94,221 | |
55,000 | Northrop Grumman Corp., Sr. Unsecd. Note, 3.250%, 1/15/2028 | 51,714 | |
75,000 | RTX Corp, Sr. Unsecd. Note, 5.150%, 2/27/2033 | 73,812 | |
TOTAL | 647,269 | ||
Capital Goods - Building Materials—0.0% | |||
20,000 | Allegion PLC, Sr. Unsecd. Note, 3.500%, 10/1/2029 | 18,347 | |
50,000 | Allegion US Holdings Co., Inc., Sr. Unsecd. Note, 3.200%, 10/1/2024 | 49,555 | |
TOTAL | 67,902 | ||
Capital Goods - Construction Machinery—0.5% | |||
3,390,000 | Ashtead Capital, Inc., Sr. Unsecd. Note, 144A, 2.450%, 8/12/2031 | 2,729,524 | |
120,000 | CNH Industrial NV, Sr. Unsecd. Note, Series MTN, 3.850%, 11/15/2027 | 114,952 | |
15,000 | Ingersoll-Rand, Inc., Sr. Unsecd. Note, 5.450%, 6/15/2034 | 15,039 | |
15,000 | Ingersoll-Rand, Inc., Sr. Unsecd. Note, 5.700%, 6/15/2054 | 15,187 | |
45,000 | John Deere Capital Corp., Sr. Unsecd. Note, Series MTN, 2.800%, 7/18/2029 | 40,659 | |
20,000 | John Deere Capital Corp., Sr. Unsecd. Note, Series MTN, 3.450%, 3/7/2029 | 18,783 | |
TOTAL | 2,934,144 | ||
Capital Goods - Diversified Manufacturing—0.0% | |||
60,000 | Lennox International, Inc., Sr. Unsecd. Note, 1.350%, 8/1/2025 | 57,053 |
Principal Amount, Shares or Contracts | Value | ||
CORPORATE BONDS—continued | |||
Capital Goods - Diversified Manufacturing—continued | |||
$ 40,000 | Valmont Industries, Inc., Sr. Unsecd. Note, 5.000%, 10/1/2044 | $ 35,324 | |
80,000 | Valmont Industries, Inc., Sr. Unsecd. Note, 5.250%, 10/1/2054 | 69,985 | |
35,000 | Vontier Corp., Sr. Unsecd. Note, Series WI, 1.800%, 4/1/2026 | 32,532 | |
25,000 | Vontier Corp., Sr. Unsecd. Note, Series WI, 2.950%, 4/1/2031 | 20,567 | |
40,000 | Xylem, Inc., Sr. Unsecd. Note, 2.250%, 1/30/2031 | 33,306 | |
TOTAL | 248,767 | ||
Communications - Cable & Satellite—0.1% | |||
25,000 | Charter Communications Operating, LLC, 5.375%, 5/1/2047 | 20,111 | |
50,000 | Charter Communications Operating, LLC/Charter Communications Operating Capital Corp., Sec. Fac. Bond, 3.850%, 4/1/2061 | 29,464 | |
75,000 | Charter Communications Operating, LLC/Charter Communications Operating Capital Corp., Sec. Fac. Bond, 6.550%, 6/1/2034 | 75,180 | |
200,000 | Comcast Corp., Sr. Unsecd. Note, 3.150%, 2/15/2028 | 187,221 | |
30,000 | Comcast Corp., Sr. Unsecd. Note, 3.450%, 2/1/2050 | 21,185 | |
70,000 | Comcast Corp., Sr. Unsecd. Note, 3.950%, 10/15/2025 | 68,762 | |
TOTAL | 401,923 | ||
Communications - Media & Entertainment—0.0% | |||
50,000 | Warnermedia Holdings, Inc., Sr. Unsecd. Note, 4.279%, 3/15/2032 | 43,780 | |
65,000 | Warnermedia Holdings, Inc., Sr. Unsecd. Note, 5.050%, 3/15/2042 | 53,748 | |
60,000 | Warnermedia Holdings, Inc., Sr. Unsecd. Note, 6.412%, 3/15/2026 | 60,002 | |
TOTAL | 157,530 | ||
Communications - Telecom Wireless—0.1% | |||
90,000 | Crown Castle, Inc., Sr. Unsecd. Note, 5.200%, 2/15/2049 | 81,929 | |
60,000 | T-Mobile USA, Inc., 3.300%, 2/15/2051 | 40,429 | |
65,000 | T-Mobile USA, Inc., Series WI, 2.700%, 3/15/2032 | 54,065 | |
55,000 | T-Mobile USA, Inc., Sr. Unsecd. Note, 5.650%, 1/15/2053 | 54,153 | |
65,000 | Vodafone Group PLC, Sr. Unsecd. Note, 5.625%, 2/10/2053 | 62,752 | |
TOTAL | 293,328 | ||
Communications - Telecom Wirelines—0.1% | |||
65,000 | AT&T, Inc., Sr. Unsecd. Note, 1.700%, 3/25/2026 | 60,869 | |
175,000 | AT&T, Inc., Sr. Unsecd. Note, 2.550%, 12/1/2033 | 138,106 | |
40,000 | AT&T, Inc., Sr. Unsecd. Note, 3.850%, 6/1/2060 | 27,968 | |
45,000 | AT&T, Inc., Sr. Unsecd. Note, Series WI, 5.300%, 8/15/2058 | 39,560 | |
100,000 | Rogers Communications, Inc., Sr. Unsecd. Note, 4.500%, 3/15/2042 | 84,571 | |
30,000 | Verizon Communications, Inc., Sr. Unsecd. Note, 3.000%, 3/22/2027 | 28,348 | |
45,000 | Verizon Communications, Inc., Sr. Unsecd. Note, 3.550%, 3/22/2051 | 32,225 | |
TOTAL | 411,647 | ||
Consumer Cyclical - Automotive—0.1% | |||
75,000 | American Honda Finance Corp., Sr. Unsecd. Note, Series GMTN, 5.800%, 10/3/2025 | 75,460 | |
150,000 | Daimler Trucks Financial NA, Sr. Unsecd. Note, 144A, 2.375%, 12/14/2028 | 132,678 | |
200,000 | Ford Motor Credit Co. LLC, Sr. Unsecd. Note, 7.122%, 11/7/2033 | 211,048 | |
100,000 | General Motors Co., Sr. Unsecd. Note, 5.200%, 4/1/2045 | 88,020 | |
150,000 | Mercedes-Benz Finance N.A., LLC, Unsecd. Note, 144A, 4.800%, 3/30/2026 | 148,832 | |
TOTAL | 656,038 | ||
Consumer Cyclical - Retailers—0.0% | |||
100,000 | Alimentation Couche-Tard, Inc., Sr. Unsecd. Note, 144A, 3.800%, 1/25/2050 | 74,598 | |
120,000 | Home Depot, Inc., Sr. Unsecd. Note, 2.950%, 6/15/2029 | 109,351 | |
TOTAL | 183,949 | ||
Consumer Cyclical - Services—0.0% | |||
50,000 | Amazon.com, Inc., Sr. Unsecd. Note, 2.100%, 5/12/2031 | 41,829 | |
150,000 | Amazon.com, Inc., Sr. Unsecd. Note, 3.150%, 8/22/2027 | 142,213 | |
TOTAL | 184,042 | ||
Consumer Non-Cyclical - Food/Beverage—0.2% | |||
60,000 | Anheuser-Busch Cos., LLC / Anheuser-Busch InBev Worldwide, Inc., Sr. Unsecd. Note, 4.700%, 2/1/2036 | 56,681 |
Principal Amount, Shares or Contracts | Value | ||
CORPORATE BONDS—continued | |||
Consumer Non-Cyclical - Food/Beverage—continued | |||
$ 150,000 | Anheuser-Busch Cos. LLC / Anheuser-Busch InBev Worldwide, Inc., Sr. Unsecd. Note, 4.900%, 2/1/2046 | $ 137,824 | |
37,000 | Anheuser-Busch InBev Worldwide, Inc., Sr. Unsecd. Note, 4.600%, 4/15/2048 | 32,566 | |
150,000 | Coca-Cola Femsa S.A.B. de C.V., Sr. Unsecd. Note, 2.750%, 1/22/2030 | 132,137 | |
100,000 | Constellation Brands, Inc., Sr. Unsecd. Note, 5.250%, 11/15/2048 | 93,115 | |
35,000 | Flowers Foods, Inc., Sr. Unsecd. Note, 2.400%, 3/15/2031 | 28,893 | |
25,000 | Flowers Foods, Inc., Sr. Unsecd. Note, 3.500%, 10/1/2026 | 23,917 | |
50,000 | Kraft Heinz Foods Co., Sr. Unsecd. Note, 3.000%, 6/1/2026 | 47,864 | |
65,000 | Kraft Heinz Foods Co., Sr. Unsecd. Note, 4.375%, 6/1/2046 | 53,320 | |
60,000 | Smithfield Foods, Inc., Sr. Unsecd. Note, 144A, 3.000%, 10/15/2030 | 50,770 | |
105,000 | Sysco Corp., Sr. Unsecd. Note, 3.300%, 7/15/2026 | 100,800 | |
50,000 | Sysco Corp., Sr. Unsecd. Note, 4.450%, 3/15/2048 | 41,493 | |
100,000 | Tyson Foods, Inc., Sr. Unsecd. Note, 5.700%, 3/15/2034 | 99,450 | |
TOTAL | 898,830 | ||
Consumer Non-Cyclical - Health Care—0.0% | |||
30,000 | Agilent Technologies, Inc., Sr. Unsecd. Note, 2.100%, 6/4/2030 | 25,142 | |
125,000 | CVS Health Corp., Sr. Unsecd. Note, 5.050%, 3/25/2048 | 107,823 | |
30,000 | DH Europe Finance II S.a.r.l., Sr. Unsecd. Note, 2.600%, 11/15/2029 | 26,566 | |
100,000 | HCA, Inc., Sec. Fac. Bond, 3.500%, 7/15/2051 | 66,787 | |
TOTAL | 226,318 | ||
Consumer Non-Cyclical - Pharmaceuticals—0.1% | |||
150,000 | AbbVie, Inc., Sr. Unsecd. Note, 2.950%, 11/21/2026 | 142,501 | |
60,000 | AbbVie, Inc., Sr. Unsecd. Note, 3.200%, 11/21/2029 | 54,719 | |
80,000 | Amgen, Inc., Sr. Unsecd. Note, 5.250%, 3/2/2033 | 79,424 | |
80,000 | Amgen, Inc., Sr. Unsecd. Note, 5.650%, 3/2/2053 | 79,011 | |
125,000 | AstraZeneca PLC, Sr. Unsecd. Note, 4.000%, 1/17/2029 | 120,091 | |
60,000 | Biogen, Inc., Sr. Unsecd. Note, 2.250%, 5/1/2030 | 50,533 | |
55,000 | Bristol-Myers Squibb Co., Sr. Unsecd. Note, Series WI, 4.250%, 10/26/2049 | 44,967 | |
25,000 | Royalty Pharma PLC, Sr. Unsecd. Note, Series WI, 1.200%, 9/2/2025 | 23,676 | |
TOTAL | 594,922 | ||
Consumer Non-Cyclical - Supermarkets—0.0% | |||
50,000 | Kroger Co., Sr. Unsecd. Note, 4.450%, 2/1/2047 | 41,442 | |
Consumer Non-Cyclical - Tobacco—0.1% | |||
65,000 | Altria Group, Inc., Sr. Unsecd. Note, 3.700%, 2/4/2051 | 43,863 | |
30,000 | BAT Capital Corp., Sr. Unsecd. Note, 3.984%, 9/25/2050 | 21,299 | |
115,000 | Philip Morris International, Inc., Sr. Unsecd. Note, 5.750%, 11/17/2032 | 117,427 | |
65,000 | Reynolds American, Inc., Sr. Unsecd. Note, 7.000%, 8/4/2041 | 68,317 | |
TOTAL | 250,906 | ||
Energy - Independent—0.1% | |||
60,000 | Diamondback Energy, Inc., Sr. Unsecd. Note, 5.750%, 4/18/2054 | 57,886 | |
120,000 | Hess Corp., Sr. Unsecd. Note, 5.600%, 2/15/2041 | 119,779 | |
50,000 | Marathon Oil Corp., Sr. Unsecd. Note, 5.200%, 6/1/2045 | 46,237 | |
70,000 | Ovintiv, Inc., Sr. Unsecd. Note, 7.100%, 7/15/2053 | 77,850 | |
TOTAL | 301,752 | ||
Energy - Integrated—0.0% | |||
50,000 | Cenovus Energy, Inc., Sr. Unsecd. Note, 4.250%, 4/15/2027 | 48,592 | |
45,000 | Shell International Finance B.V., Sr. Unsecd. Note, 4.000%, 5/10/2046 | 36,208 | |
TOTAL | 84,800 | ||
Energy - Midstream—0.2% | |||
45,000 | Boardwalk Pipeline Partners LP, Sr. Unsecd. Note, 4.800%, 5/3/2029 | 43,847 | |
45,000 | Eastern Gas Transmission & Storage, Inc., Sr. Unsecd. Note, 3.900%, 11/15/2049 | 31,997 | |
100,000 | Enbridge, Inc., Sr. Unsecd. Note, 5.950%, 4/5/2054 | 99,601 | |
50,000 | Energy Transfer LP, Sr. Unsecd. Note, 5.550%, 5/15/2034 | 49,195 | |
65,000 | Kinder Morgan Energy Partners LP, Sr. Unsecd. Note, 6.375%, 3/1/2041 | 66,066 | |
100,000 | MPLX LP, Sr. Unsecd. Note, 4.950%, 3/14/2052 | 85,211 |
Principal Amount, Shares or Contracts | Value | ||
CORPORATE BONDS—continued | |||
Energy - Midstream—continued | |||
$ 30,000 | National Fuel Gas Co., Sr. Unsecd. Note, 2.950%, 3/1/2031 | $ 25,044 | |
50,000 | National Fuel Gas Co., Sr. Unsecd. Note, 5.500%, 1/15/2026 | 49,808 | |
65,000 | ONEOK, Inc., Sr. Unsecd. Note, 4.550%, 7/15/2028 | 63,130 | |
30,000 | ONEOK, Inc., Sr. Unsecd. Note, 5.200%, 7/15/2048 | 26,580 | |
120,000 | Southern Natural Gas, Sr. Unsecd. Note, 144A, 4.800%, 3/15/2047 | 98,570 | |
30,000 | Targa Resources, Inc., Sr. Unsecd. Note, 4.200%, 2/1/2033 | 26,936 | |
80,000 | TC Pipelines, LP, Sr. Unsecd. Note, 3.900%, 5/25/2027 | 76,519 | |
100,000 | Williams Cos., Inc., Sr. Unsecd. Note, 5.150%, 3/15/2034 | 97,109 | |
TOTAL | 839,613 | ||
Energy - Refining—0.0% | |||
110,000 | Valero Energy Corp., Sr. Unsecd. Note, 4.000%, 4/1/2029 | 104,200 | |
Financial Institution - Banking—0.7% | |||
150,000 | Associated Banc-Corp., Sub. Note, 4.250%, 1/15/2025 | 148,073 | |
90,000 | Bank of America Corp., Sr. Unsecd. Note, 2.299%, 7/21/2032 | 73,267 | |
100,000 | Bank of America Corp., Sr. Unsecd. Note, 2.572%, 10/20/2032 | 82,522 | |
140,000 | Bank of America Corp., Sr. Unsecd. Note, 2.687%, 4/22/2032 | 117,710 | |
50,000 | Bank of America Corp., Sr. Unsecd. Note, 5.468%, 1/23/2035 | 49,690 | |
100,000 | Bank of America Corp., Sr. Unsecd. Note, Series MTN, 2.884%, 10/22/2030 | 88,389 | |
200,000 | Bank of New York Mellon Corp., Sr. Unsecd. Note, Series MTN, 3.992%, 6/13/2028 | 193,269 | |
175,000 | Citigroup, Inc., Sr. Unsecd. Note, 2.561%, 5/1/2032 | 145,550 | |
170,000 | Citigroup, Inc., Sr. Unsecd. Note, 3.400%, 5/1/2026 | 163,913 | |
100,000 | Citigroup, Inc., Sub., 5.827%, 2/13/2035 | 99,019 | |
170,000 | Citizens Financial Group, Inc., Sub. Note, 2.638%, 9/30/2032 | 129,507 | |
60,000 | Comerica, Inc., Sr. Unsecd. Note, 5.982%, 1/30/2030 | 59,171 | |
200,000 | Compass Bank, Birmingham, Sub. Note, Series BKNT, 3.875%, 4/10/2025 | 196,911 | |
65,000 | Fifth Third Bancorp, Sr. Unsecd. Note, 3.950%, 3/14/2028 | 61,744 | |
60,000 | FNB Corp. (PA), Sr. Unsecd. Note, 5.150%, 8/25/2025 | 59,403 | |
100,000 | Goldman Sachs Group, Inc., Sr. Unsecd. Note, 2.615%, 4/22/2032 | 83,505 | |
100,000 | Goldman Sachs Group, Inc., Sr. Unsecd. Note, 3.102%, 2/24/2033 | 84,909 | |
165,000 | Goldman Sachs Group, Inc., Sr. Unsecd. Note, 3.814%, 4/23/2029 | 155,870 | |
100,000 | Huntington Bancshares, Inc., Sr. Unsecd. Note, 5.709%, 2/2/2035 | 98,311 | |
55,000 | JPMorgan Chase & Co., Sr. Unsecd. Note, 0.824%, 6/1/2025 | 55,000 | |
300,000 | JPMorgan Chase & Co., Sr. Unsecd. Note, 2.580%, 4/22/2032 | 251,915 | |
100,000 | JPMorgan Chase & Co., Sr. Unsecd. Note, 2.963%, 1/25/2033 | 84,757 | |
55,000 | JPMorgan Chase & Co., Sr. Unsecd. Note, 5.336%, 1/23/2035 | 54,403 | |
50,000 | JPMorgan Chase & Co., Sr. Unsecd. Note, 5.350%, 6/1/2034 | 49,618 | |
100,000 | KeyCorp, Sr. Unsecd. Note, 6.401%, 3/6/2035 | 100,723 | |
45,000 | M&T Bank Corp., Sr. Unsecd. Note, 6.082%, 3/13/2032 | 44,655 | |
65,000 | M&T Bank Corp., Sr. Unsecd. Note, 7.413%, 10/30/2029 | 68,361 | |
90,000 | Morgan Stanley, Sr. Unsecd. Note, 1.593%, 5/4/2027 | 83,519 | |
130,000 | Morgan Stanley, Sr. Unsecd. Note, 3.625%, 1/20/2027 | 125,089 | |
60,000 | Morgan Stanley, Sr. Unsecd. Note, 4.889%, 7/20/2033 | 57,512 | |
20,000 | Morgan Stanley, Sr. Unsecd. Note, 5.466%, 1/18/2035 | 19,864 | |
100,000 | Morgan Stanley, Sr. Unsecd. Note, Series GMTN, 2.239%, 7/21/2032 | 81,122 | |
100,000 | Morgan Stanley, Sr. Unsecd. Note, Series MTN, 1.928%, 4/28/2032 | 79,921 | |
75,000 | Northern Trust Corp., Sub. Note, 6.125%, 11/2/2032 | 77,851 | |
65,000 | PNC Financial Services Group, Inc., Sr. Unsecd. Note, 5.676%, 1/22/2035 | 65,026 | |
52,143 | 1 | Regional Diversified Funding, 144A, 9.250%, 3/15/2030 | 21,900 |
200,000 | Truist Bank, Sub. Note, Series BKNT, 3.300%, 5/15/2026 | 191,627 | |
65,000 | US Bancorp, Sr. Unsecd. Note, Series MTN, 1.375%, 7/22/2030 | 52,014 | |
150,000 | Wells Fargo & Co., Sr. Unsecd. Note, 3.000%, 10/23/2026 | 142,288 | |
100,000 | Wells Fargo & Co., Sr. Unsecd. Note, 5.499%, 1/23/2035 | 99,170 | |
275,000 | Wells Fargo & Co., Sr. Unsecd. Note, Series MTN, 2.879%, 10/30/2030 | 242,358 | |
TOTAL | 4,139,426 |
Principal Amount, Shares or Contracts | Value | ||
CORPORATE BONDS—continued | |||
Financial Institution - Broker/Asset Mgr/Exchange—0.0% | |||
$ 45,000 | Jefferies Group LLC, Sr. Unsecd. Note, 2.750%, 10/15/2032 | $ 35,697 | |
Financial Institution - Finance Companies—0.0% | |||
150,000 | AerCap Ireland Capital Ltd. / AerCap Global Aviation Trust, Sr. Unsecd. Note, 5.300%, 1/19/2034 | 146,159 | |
55,000 | Ally Financial, Inc., Sr. Unsecd. Note, 6.848%, 1/3/2030 | 56,454 | |
TOTAL | 202,613 | ||
Financial Institution - Insurance - Life—0.1% | |||
150,000 | Massachusetts Mutual Life Insurance Co., Sub. Note, 144A, 4.900%, 4/1/2077 | 123,450 | |
120,000 | Pacific Life Insurance Co., Sub. Note, 144A, 4.300%, 10/24/2067 | 91,853 | |
50,000 | Principal Financial Group, Inc., Sr. Unsecd. Note, 2.125%, 6/15/2030 | 41,529 | |
TOTAL | 256,832 | ||
Financial Institution - Insurance - P&C—0.0% | |||
100,000 | Aon North America, Inc., 5.750%, 3/1/2054 | 98,419 | |
Financial Institution - REIT - Apartment—0.0% | |||
120,000 | Avalonbay Communities, Inc., Sr. Unsecd. Note, Series MTN, 3.350%, 5/15/2027 | 114,200 | |
110,000 | UDR, Inc., Sr. Unsecd. Note, 3.100%, 11/1/2034 | 88,240 | |
TOTAL | 202,440 | ||
Financial Institution - REIT - Healthcare—0.6% | |||
110,000 | Physicians Realty Trust, Sr. Unsecd. Note, 4.300%, 3/15/2027 | 107,225 | |
75,000 | Welltower, Inc., Sr. Unsecd. Note, 2.750%, 1/15/2031 | 64,172 | |
4,000,000 | Welltower, Inc., Sr. Unsecd. Note, 2.750%, 1/15/2032 | 3,342,902 | |
TOTAL | 3,514,299 | ||
Financial Institution - REIT - Office—0.0% | |||
25,000 | Alexandria Real Estate Equities, Inc., Sr. Unsecd. Note, 3.950%, 1/15/2027 | 24,077 | |
110,000 | Alexandria Real Estate Equities, Inc., Sr. Unsecd. Note, 3.950%, 1/15/2028 | 105,161 | |
75,000 | Boston Properties LP, Sr. Unsecd. Note, 4.500%, 12/1/2028 | 70,609 | |
40,000 | Piedmont Operating Partnership, LP, Sr. Unsecd. Note, 2.750%, 4/1/2032 | 28,839 | |
TOTAL | 228,686 | ||
Financial Institution - REIT - Other—0.0% | |||
35,000 | Host Hotels & Resorts LP, Sr. Unsecd. Note, 5.700%, 7/1/2034 | 34,321 | |
Financial Institution - REIT - Retail—0.0% | |||
80,000 | Regency Centers LP, Sr. Unsecd. Note, 4.125%, 3/15/2028 | 76,766 | |
Technology—0.2% | |||
35,000 | Alphabet, Inc., Sr. Unsecd. Note, 2.050%, 8/15/2050 | 19,900 | |
50,000 | Apple, Inc., Sr. Unsecd. Note, 3.000%, 11/13/2027 | 47,320 | |
50,000 | Apple, Inc., Sr. Unsecd. Note, 4.450%, 5/6/2044 | 46,076 | |
27,000 | Broadcom, Inc., Sr. Unsecd. Note, 4.150%, 11/15/2030 | 25,293 | |
3,000 | Broadcom, Inc., Sr. Unsecd. Note, 144A, 3.187%, 11/15/2036 | 2,356 | |
60,000 | Broadcom, Inc., Sr. Unsecd. Note, 144A, 3.469%, 4/15/2034 | 50,595 | |
105,000 | CDW LLC / CDW Finance, Sr. Unsecd. Note, 2.670%, 12/1/2026 | 97,693 | |
85,000 | Equifax, Inc., Sr. Unsecd. Note, 2.600%, 12/1/2024 | 83,722 | |
200,000 | Experian Finance PLC., Sr. Unsecd. Note, 144A, 4.250%, 2/1/2029 | 192,042 | |
75,000 | Fiserv, Inc., Sr. Unsecd. Note, 3.500%, 7/1/2029 | 69,252 | |
75,000 | Lam Research Corp., Sr. Unsecd. Note, 4.000%, 3/15/2029 | 71,870 | |
50,000 | Microchip Technology, Inc., Sr. Unsecd. Note, 5.050%, 3/15/2029 | 49,578 | |
75,000 | Oracle Corp., Sr. Unsecd. Note, 3.600%, 4/1/2050 | 52,213 | |
75,000 | Oracle Corp., Sr. Unsecd. Note, 6.900%, 11/9/2052 | 83,957 | |
65,000 | Roper Technologies, Inc., Sr. Unsecd. Note, 1.750%, 2/15/2031 | 52,043 | |
55,000 | Total System Services, Inc., Sr. Unsecd. Note, 4.800%, 4/1/2026 | 54,192 | |
30,000 | Verisign, Inc., Sr. Unsecd. Note, 2.700%, 6/15/2031 | 24,915 | |
80,000 | Visa, Inc., Sr. Unsecd. Note, 2.750%, 9/15/2027 | 74,932 | |
45,000 | VMware, Inc., Sr. Unsecd. Note, 2.200%, 8/15/2031 | 36,148 | |
TOTAL | 1,134,097 | ||
Transportation - Railroads—0.0% | |||
60,000 | Canadian Pacific Railway Co., Sr. Unsecd. Note, 1.750%, 12/2/2026 | 55,104 |
Principal Amount, Shares or Contracts | Value | ||
CORPORATE BONDS—continued | |||
Transportation - Railroads—continued | |||
$ 40,000 | Union Pacific Corp., Sr. Unsecd. Note, 2.400%, 2/5/2030 | $ 34,794 | |
TOTAL | 89,898 | ||
Transportation - Services—0.0% | |||
100,000 | Enterprise Rent-A-Car USA Finance Co., Sr. Unsecd. Note, 144A, 5.200%, 10/30/2034 | 98,412 | |
50,000 | Penske Truck Leasing Co. LP & PTL Finance Corp., Sr. Unsecd. Note, 144A, 3.400%, 11/15/2026 | 47,613 | |
TOTAL | 146,025 | ||
Utility - Electric—0.2% | |||
40,000 | Ameren Corp., Sr. Unsecd. Note, 1.950%, 3/15/2027 | 36,589 | |
55,000 | American Electric Power Co., Inc., Sr. Unsecd. Note, 5.625%, 3/1/2033 | 54,676 | |
25,000 | Black Hills Corp., Sr. Unsecd. Note, 2.500%, 6/15/2030 | 20,828 | |
25,000 | Black Hills Corp., Sr. Unsecd. Note, 3.875%, 10/15/2049 | 17,713 | |
115,000 | CenterPoint Energy, Inc., Sr. Unsecd. Note, 2.650%, 6/1/2031 | 96,796 | |
65,000 | Constellation Energy Generation LLC, Sr. Unsecd. Note, 5.800%, 3/1/2033 | 66,067 | |
75,000 | Dominion Energy, Inc., Sr. Unsecd. Note, Series A, 1.450%, 4/15/2026 | 69,684 | |
130,000 | Duke Energy Corp., Sr. Unsecd. Note, 2.450%, 6/1/2030 | 110,943 | |
55,000 | Duke Energy Corp., Sr. Unsecd. Note, 3.950%, 8/15/2047 | 41,318 | |
90,000 | Evergy Metro, Inc., Sr. Unsecd. Note, 4.200%, 3/15/2048 | 72,045 | |
30,000 | Exelon Corp., Sr. Unsecd. Note, 4.100%, 3/15/2052 | 23,103 | |
25,000 | FirstEnergy Transmission LLC, Sr. Unsecd. Note, 144A, 4.550%, 4/1/2049 | 20,467 | |
65,000 | NextEra Energy Capital Holdings, Inc., Sr. Unsecd. Note, 5.050%, 2/28/2033 | 63,291 | |
65,000 | NiSource Finance Corp., Sr. Unsecd. Note, 4.375%, 5/15/2047 | 53,074 | |
120,000 | Southern Co., Jr. Sub. Note, Series B, 4.000%, 1/15/2051 | 115,873 | |
120,000 | Virginia Electric & Power Co., Sr. Unsecd. Note, Series A, 3.500%, 3/15/2027 | 114,872 | |
TOTAL | 977,339 | ||
TOTAL CORPORATE BONDS (IDENTIFIED COST $24,138,173) | 21,177,281 | ||
COLLATERALIZED MORTGAGE OBLIGATIONS—3.5% | |||
Commercial Mortgage—0.7% | |||
500,000 | 2 | Bank 2018-BN15, Class A4, 4.407% (12-month USLIBOR +0.000%), 11/15/2061 | 479,523 |
345,000 | Bank 2022-BNK40, Class A4, 3.393%, 3/15/2064 | 300,804 | |
675,000 | Benchmark Mortgage Trust 2019-B11, Class A5, 3.542%, 5/15/2052 | 605,653 | |
520,000 | Benchmark Mortgage Trust 2021-B26, Class A2, 1.957%, 6/15/2054 | 484,962 | |
1,000,000 | Commercial Mortgage Trust 2015-DC1, Class AM, 3.724%, 2/10/2048 | 965,293 | |
1,000,000 | Fontainebleau Miami Beach Trust, Class B, 3.447%, 12/10/2036 | 979,644 | |
TOTAL | 3,815,879 | ||
Federal Home Loan Mortgage Corporation—0.2% | |||
800,000 | FHLMC REMIC, Series K070, Class A2, 3.303%, 11/25/2027 | 757,298 | |
662,072 | FHLMC REMIC, Series K105, Class A1, 1.536%, 9/25/2029 | 594,655 | |
TOTAL | 1,351,953 | ||
Non-Agency Mortgage-Backed Securities—2.6% | |||
1,099,222 | GS Mortgage-Backed Securities 2023-PJ5, Class A16, 6.500%, 2/25/2054 | 1,099,320 | |
3,466,363 | GS Mortgage-Backed Securities Trust 2022-PJ3, Class A4, 2.500%, 8/25/2052 | 2,718,658 | |
6,449,076 | JP Morgan Mortgage Trust 2022-1, Class A2, 3.000%, 7/25/2052 | 5,275,395 | |
4,354,352 | JP Morgan Mortgage Trust 2022-2, Class A3, 2.500%, 8/25/2052 | 3,415,105 | |
3,419,428 | JP Morgan Mortgage Trust 2022-3, Class A3, 2.500%, 8/25/2052 | 2,681,846 | |
TOTAL | 15,190,324 | ||
TOTAL COLLATERALIZED MORTGAGE OBLIGATIONS (IDENTIFIED COST $23,708,538) | 20,358,156 | ||
COMMON STOCKS—2.1% | |||
Automotive—0.1% | |||
30,398 | 3 | American Axle & Manufacturing Holdings, Inc. | 232,241 |
1,830 | Lear Corp. | 229,390 | |
TOTAL | 461,631 |
Principal Amount, Shares or Contracts | Value | ||
COMMON STOCKS—continued | |||
Chemicals—0.1% | |||
10,750 | Koppers Holdings, Inc. | $ 476,548 | |
33,330 | 3 | PQ Group Holdings, Inc. | 309,969 |
TOTAL | 786,517 | ||
Commercial Services & Supplies—0.1% | |||
30,185 | Interface, Inc. | 486,280 | |
Consumer Cyclical Services—0.1% | |||
6,395 | Brinks Co. (The) | 660,220 | |
Containers & Packaging—0.3% | |||
77,295 | Ardagh Metal Packaging | 305,315 | |
24,643 | Graphic Packaging Holding Co. | 697,890 | |
30,501 | 3 | O-I Glass, Inc. | 387,057 |
6,648 | WestRock Co. | 356,599 | |
TOTAL | 1,746,861 | ||
Electric Utilities—0.1% | |||
5,765 | NRG Energy, Inc. | 466,965 | |
Food & Beverage—0.1% | |||
10,905 | 3 | US Foods Holding Corp. | 576,111 |
Food Products—0.1% | |||
3,660 | 3 | Post Holdings, Inc. | 390,046 |
Hotels Restaurants & Leisure—0.2% | |||
5,680 | Boyd Gaming Corp. | 302,858 | |
15,765 | 3 | Caesars Entertainment Corp. | 560,603 |
8,255 | Red Rock Resorts, Inc. | 423,069 | |
TOTAL | 1,286,530 | ||
Media Entertainment—0.1% | |||
116,925 | 3 | Stagwell, Inc. | 810,290 |
Midstream—0.1% | |||
32,111 | Suburban Propane Partners LP | 652,817 | |
Oil Field Services—0.0% | |||
3,970 | 3 | Nabors Industries Ltd. | 296,797 |
Oil Gas & Consumable Fuels—0.1% | |||
6,068 | Devon Energy Corp. | 297,818 | |
Personal Products—0.1% | |||
14,460 | Energizer Holdings, Inc. | 413,845 | |
Technology—0.1% | |||
4,450 | Science Applications International Corp. | 599,193 | |
Technology Hardware Storage & Peripherals—0.1% | |||
4,345 | Dell Technologies, Inc. | 606,388 | |
Trading Companies & Distributors—0.1% | |||
4,235 | 3 | GMS, Inc. | 397,921 |
2,695 | 3 | WESCO International, Inc. | 483,725 |
TOTAL | 881,646 | ||
Utility - Electric—0.2% | |||
9,515 | Vistra Corp. | 942,746 | |
TOTAL COMMON STOCKS (IDENTIFIED COST $11,589,325) | 12,362,701 | ||
ASSET-BACKED SECURITIES—1.4% | |||
Auto Receivables—0.6% | |||
$ 3,000,000 | Ford Credit Auto Lease Trust 2022-A, Class D, 4.660%, 12/15/2026 | 2,952,560 | |
635,377 | Santander Bank Auto Credit-Linked Notes 2022-A, Class B, 5.281%, 5/15/2032 | 632,255 | |
TOTAL | 3,584,815 | ||
Other—0.4% | |||
2,189,091 | Home Partners of America Trust 2022-1, Class B, 4.330%, 4/17/2039 | 2,081,073 |
Principal Amount, Shares or Contracts | Value | ||
ASSET-BACKED SECURITIES—continued | |||
Student Loans—0.4% | |||
$ 1,383,493 | Navient Student Loan Trust 2021-GA, Class A, 1.580%, 4/15/2070 | $ 1,209,438 | |
1,185,307 | SMB Private Education Loan Trust 2021-E, Class A1A, 1.680%, 2/15/2051 | 1,078,593 | |
TOTAL | 2,288,031 | ||
TOTAL ASSET-BACKED SECURITIES (IDENTIFIED COST $8,367,657) | 7,953,919 | ||
FOREIGN GOVERNMENTS/AGENCY—0.5% | |||
Sovereign—0.5% | |||
20,000,000 | 4 | Letra Tesouro Nacional, Sr. Unsecd. Note, Series LTN, 0.000%, 7/1/2027 (IDENTIFIED COST $2,978,082) | 2,742,597 |
AGENCY RISK TRANSFER SECURITY—0.2% | |||
1,250,000 | 2 | FNMA - CAS 2023-R05, Class 1M2, 8.423% (30-DAY AVERAGE SOFR +3.100%), 6/25/2043 (IDENTIFIED COST $1,250,000) | 1,318,421 |
PREFERRED STOCK—0.0% | |||
Financials—0.0% | |||
40,000 | 1,3,5 | Lehman Brothers Holdings, Inc., Pfd., 5.670% (IDENTIFIED COST $3,400) | 400 |
PURCHASED CALL OPTIONS—0.1% | |||
15,000 | Russell 2000 Index, Exercise Price $2,100, Notional Amount $31,051,950, Expiration Date 6/21/2024 | 362,250 | |
6,000,000 | Toronto Dominion USD CALL/MXN PUT, Exercise Price $17, Notional Amount $335,520,000, Expiration Date 8/20/2024 | 143,634 | |
150 | United States Treasury, 0.000%, Exercise Price $106, Notional Amount $15,816,000, Expiration Date 7/27/2024 | 84,375 | |
TOTAL PURCHASED CALL OPTIONS (IDENTIFIED COST $580,415) | 590,259 | ||
PURCHASED PUT OPTION—0.0% | |||
5,000,000 | UBS USD PUT/BRL CALL, Exercise Price $5.1, Notional Amount $159,400,000, Expiration Date 8/2/2024 (IDENTIFIED COST $82,000) | 22,840 | |
INVESTMENT COMPANIES—76.8% | |||
15,901,653 | Emerging Markets Core Fund | 134,050,930 | |
4,642,275 | Federated Hermes Government Obligations Fund, Premier Shares, 5.23%6 | 4,642,275 | |
37,291,092 | 7 | High Yield Bond Core Fund | 205,101,008 |
13,447,346 | Mortgage Core Fund | 108,923,502 | |
TOTAL INVESTMENT COMPANIES (IDENTIFIED COST $534,876,625) | 452,717,715 | ||
TOTAL INVESTMENT IN SECURITIES—99.7% (IDENTIFIED COST $676,951,420)8 | 587,204,816 | ||
OTHER ASSETS AND LIABILITIES - NET—0.3%9 | 1,925,993 | ||
TOTAL NET ASSETS—100% | $589,130,809 |
Description | Number of Contracts | Notional Value | Expiration Date | Value and Unrealized Appreciation (Depreciation) |
Long Futures: | ||||
United States Treasury Notes 2-Year Long Futures | 40 | $8,148,125 | September 2024 | $125 |
United States Treasury Notes 5-Year Long Futures | 85 | $8,992,734 | September 2024 | $(520) |
United States Treasury Notes 10-Year Long Futures | 10 | $1,087,969 | September 2024 | $(1,818) |
Short Futures: | ||||
United States Treasury Notes 10-Year Ultra Short Futures | 10 | $1,120,312 | September 2024 | $4,259 |
United States Treasury Ultra Bond Short Futures | 30 | $3,673,125 | September 2024 | $(12,304) |
NET UNREALIZED DEPRECIATION ON FUTURES CONTRACTS | $(10,258) | |||
Settlement Date | Counterparty | Foreign Currency Units to Deliver/Receive | In Exchange For | Net Unrealized (Depreciation) | |
Contracts Purchased: | |||||
6/4/2024 | UBS | 52,000,000 | BRL | $10,000,000 | $(96,936) |
NET UNREALIZED DEPRECIATION ON FOREIGN EXCHANGE CONTRACTS | $(96,936) | ||||
Counterparty | Description | Number of Contracts | Notional Amount | Expiration Date | Exercise Price | Value |
Call Options: | ||||||
Morgan Stanley | USD CALL/MXN PUT | (10,000,000) | $978,400,000 | August 2024 | $17.50 | $(139,500) |
Morgan Stanley | USD CALL/ZAR PUT | (10,000,000) | $978,400,000 | August 2024 | $19.20 | $(220,640) |
Toronto Dominion | GBP CALL/USD PUT | (10,000,000) | $559,200,000 | July 2024 | $1.27 | $(135,350) |
UBS | AUD CALL/ USD PUT | (10,000,000) | $318,800,000 | July 2024 | $0.66 | $(166,930) |
UBS | NZD CALL/USD PUT | (10,000,000) | $318,800,000 | July 2024 | $0.62 | $(111,590) |
UBS | USD CALL/BRL PUT | (10,000,000) | $318,800,000 | August 2024 | $5.50 | $(61,600) |
UBS | USD CALL/MXN PUT | (10,000,000) | $318,800,000 | July 2024 | $18.00 | $(36,960) |
UBS | USD CALL/NOK PUT | (10,000,000) | $318,800,000 | July 2024 | $11.30 | $(5,230) |
United States Treasury | United States Treasury, 106.25%, 6/22/2024 | (150) | $15,816,000 | June 2024 | $106.25 | $(36,328) |
Put Options: | ||||||
Bank of America Merril Lynch | NZD PUT/USD CALL | (10,000,000) | $309,900,000 | July 2024 | $0.59 | $(9,600) |
J.P. Morgan | Russell 2000 Index | (200) | $4,052,600 | June 2024 | $2,025.00 | $(315,000) |
Morgan Stanley | AUD PUT/USD CALL | (10,000,000) | $978,400,000 | July 2024 | $0.64 | $(15,970) |
Toronto Dominion | USD PUT/MXN CALL | (6,000,000) | $335,520,000 | August 2024 | $16.40 | $(17,430) |
UBS | USD PUT/ZAR CALL | (10,000,000) | $318,800,000 | July 2024 | $18.30 | $(96,110) |
UBS | USD PUT/MXN CALL | (4,000,000) | $127,520,000 | July 2024 | $16.70 | $(18,768) |
UBS | USD PUT/NOK CALL | (10,000,000) | $318,800,000 | July 2024 | $10.50 | $(142,970) |
UBS | USD PUT/BRL CALL | (10,000,000) | $318,800,000 | August 2024 | $4.90 | $(5,720) |
United States Treasury | United States Treasury, 105.75%, 6/22/2024 | (300) | $31,632,000 | June 2024 | $105.75 | $(119,531) |
United States Treasury | United States Treasury, 114.00%, 6/22/2024 | (125) | $13,180,000 | June 2024 | $114.00 | $(54,688) |
(Premium Received $1,711,633) | $(1,709,915) | |||||
Affiliates | Value as of 11/30/2023 | Purchases at Cost | Proceeds from Sales | Change in Unrealized Appreciation/ Depreciation | Net Realized Gain/ (Loss) | Value as of 5/31/2024 | Shares Held as of 5/31/2024 | Dividend Income |
Emerging Markets Core Fund | $147,106,964 | $5,992,192 | $(27,000,000) | $10,647,257 | $(2,695,483) | $134,050,930 | 15,901,653 | $5,992,020 |
Federated Hermes Government Obliga- tions Fund, Premier Shares* | $134,394 | $23,269,153 | $(18,761,272) | $— | $— | $4,642,275 | 4,642,275 | $2,445 |
Federated Hermes Institutional Prime Value Obligations Fund, Institutional Shares | $8,045,886 | $62,177,940 | $(70,222,764) | $ | $(1,062) | $— | — | $— |
High Yield Bond Core Fund | $233,570,932 | $— | $(32,350,000) | $8,944,889 | $(5,064,813) | $205,101,008 | 37,291,092 | $7,257,772 |
Mortgage Core Fund | $104,723,818 | $7,500,000 | $(3,000,000) | $(318,476) | $18,160 | $108,923,502 | 13,447,346 | $2,614,888 |
TOTAL OF AFFILIATED TRANSAC- TIONS | $493,581,994 | $98,939,285 | $(151,334,036) | $19,273,670 | $(7,743,198) | $452,717,715 | 71,282,366 | $15,867,125 |
* | All or a portion of the balance/activity for the fund relates to cash collateral received on securities lending transactions. |
1 | Market quotations and price valuations are not available. Fair value determined using significant unobservable inputs in accordance with procedures established by and under the supervision of the Fund’s Adviser acting through its Valuation Committee. |
2 | Floating/variable note with current rate and current maturity or next reset date shown. |
3 | Non-income-producing security. |
4 | Zero coupon bond. |
5 | Issuer in default. |
6 | 7-day net yield. |
7 | The High Yield Bond Core Fund is a diversified portfolio of below investment grade bonds. |
8 | The cost of investments for federal tax purposes amounts to $676,813,732. |
9 | Assets, other than investments in securities, less liabilities. See Statement of Assets and Liabilities. |
The following is a summary of the inputs used, as of May 31, 2024, in valuing the Fund’s assets carried at fair value:
Valuation Inputs | ||||
Level 1— Quoted Prices | Level 2— Other Significant Observable Inputs | Level 3— Significant Unobservable Inputs | Total | |
Debt Securities: | ||||
U.S. Treasuries | $— | $39,466,829 | $— | $39,466,829 |
Mortgage-Backed Securities | — | 28,493,698 | — | 28,493,698 |
Corporate Bonds | — | 21,155,381 | 21,900 | 21,177,281 |
Collateralized Mortgage Obligations | — | 20,358,156 | — | 20,358,156 |
Asset-Backed Securities | — | 7,953,919 | — | 7,953,919 |
Foreign Governments/Agency | — | 2,742,597 | — | 2,742,597 |
Agency Risk Transfer Security | — | 1,318,421 | — | 1,318,421 |
Purchased Call Options | — | 590,259 | — | 590,259 |
Purchased Put Option | — | 22,840 | — | 22,840 |
Equity Securities: | ||||
Common Stocks | ||||
Domestic | 11,760,589 | — | — | 11,760,589 |
International | 602,112 | — | — | 602,112 |
Preferred Stock | ||||
Domestic | — | — | 400 | 400 |
Investment Companies | 452,717,715 | — | — | 452,717,715 |
TOTAL SECURITIES | $465,080,416 | $122,102,100 | $22,300 | $587,204,816 |
Other Financial Instruments: | ||||
Assets | ||||
Futures Contracts | $4,384 | $— | $— | $4,384 |
Liabilities | ||||
Futures Contracts | (14,642) | — | — | (14,642) |
Foreign Exchange Contracts | — | (96,936) | — | (96,936) |
Written Options Contracts | — | (1,709,915) | — | (1,709,915) |
TOTAL OTHER FINANCIAL INSTRUMENTS | $(10,258) | $(1,806,851) | $— | $(1,817,109) |
The following acronym(s) are used throughout this portfolio: | ||
AUD | —Australian Dollar | |
BKNT | —Bank Notes | |
BRL | —Brazilian Real | |
CAS | —Connecticut Avenue Securities | |
FHLMC | —Federal Home Loan Mortgage Corporation | |
FNMA | —Federal National Mortgage Association | |
GBP | —British Pound | |
GMTN | —Global Medium Term Note | |
MTN | —Medium Term Note | |
MXN | —Mexican Peso | |
NOK | —Norwegian Krone | |
NZD | —New Zealand Dollar | |
REIT | —Real Estate Investment Trust | |
REMIC | —Real Estate Mortgage Investment Conduit | |
SOFR | —Secured Overnight Financing Rate | |
USD | —United States Dollar | |
USLIBOR | —United States London Interbank Offered Rate | |
ZAR | —South African Rand | |
Six Months Ended (unaudited) 5/31/2024 | Year Ended November 30, | |||||
2023 | 2022 | 2021 | 2020 | 2019 | ||
Net Asset Value, Beginning of Period | $7.86 | $7.86 | $9.30 | $9.29 | $9.09 | $8.60 |
Income From Investment Operations: | ||||||
Net investment income (loss)1 | 0.20 | 0.38 | 0.35 | 0.34 | 0.32 | 0.36 |
Net realized and unrealized gain (loss) | 0.21 | (0.01) | (1.44) | 0.01 | 0.17 | 0.47 |
Total From Investment Operations | 0.41 | 0.37 | (1.09) | 0.35 | 0.49 | 0.83 |
Less Distributions: | ||||||
Distributions from net investment income | (0.21) | (0.37) | (0.35) | (0.34) | (0.29) | (0.34) |
Net Asset Value, End of Period | $8.06 | $7.86 | $7.86 | $9.30 | $9.29 | $9.09 |
Total Return2 | 5.25% | 4.87% | (11.88)% | 3.74% | 5.56% | 9.87% |
Ratios to Average Net Assets: | ||||||
Net expenses3 | 0.93%4 | 0.93% | 0.93% | 0.93% | 0.93% | 0.94% |
Net investment income | 5.08%4 | 4.81% | 4.17% | 3.61% | 3.55% | 3.99% |
Expense waiver/reimbursement5 | 0.13%4 | 0.13% | 0.10% | 0.10% | 0.13% | 0.12% |
Supplemental Data: | ||||||
Net assets, end of period (000 omitted) | $195,788 | $198,920 | $222,213 | $297,673 | $292,259 | $307,049 |
Portfolio turnover6 | 9% | 69% | 77% | 50% | 70% | 58% |
1 | Per share numbers have been calculated using the average shares method. |
2 | Based on net asset value, which does not reflect the sales charge, redemption fee or contingent deferred sales charge, if applicable. Total returns for periods of less than one year are not annualized. |
3 | Amount does not reflect net expenses incurred by investment companies in which the Fund may invest. |
4 | Computed on an annualized basis. |
5 | This expense decrease is reflected in both the net expense and the net investment income ratios shown above. Amount does not reflect expense waiver/ reimbursement recorded by investment companies in which the Fund may invest. |
6 | Securities that mature are considered sales for purposes of this calculation. |
Six Months Ended (unaudited) 5/31/2024 | Year Ended November 30, | |||||
2023 | 2022 | 2021 | 2020 | 2019 | ||
Net Asset Value, Beginning of Period | $7.85 | $7.86 | $9.30 | $9.28 | $9.09 | $8.59 |
Income From Investment Operations: | ||||||
Net investment income (loss)1 | 0.17 | 0.32 | 0.29 | 0.27 | 0.25 | 0.29 |
Net realized and unrealized gain (loss) | 0.22 | (0.02) | (1.44) | 0.02 | 0.16 | 0.48 |
Total From Investment Operations | 0.39 | 0.30 | (1.15) | 0.29 | 0.41 | 0.77 |
Less Distributions: | ||||||
Distributions from net investment income | (0.18) | (0.31) | (0.29) | (0.27) | (0.22) | (0.27) |
Net Asset Value, End of Period | $8.06 | $7.85 | $7.86 | $9.30 | $9.28 | $9.09 |
Total Return2 | 4.99% | 3.96% | (12.54)% | 3.07% | 4.65% | 9.19% |
Ratios to Average Net Assets: | ||||||
Net expenses3 | 1.70%4 | 1.68% | 1.69% | 1.68% | 1.69% | 1.68% |
Net investment income | 4.33%4 | 4.05% | 3.40% | 2.90% | 2.80% | 3.28% |
Expense waiver/reimbursement5 | 0.12%4 | 0.12% | 0.10% | 0.10% | 0.12% | 0.12% |
Supplemental Data: | ||||||
Net assets, end of period (000 omitted) | $16,334 | $18,737 | $23,226 | $35,536 | $45,955 | $58,296 |
Portfolio turnover6 | 9% | 69% | 77% | 50% | 70% | 58% |
1 | Per share numbers have been calculated using the average shares method. |
2 | Based on net asset value, which does not reflect the sales charge, redemption fee or contingent deferred sales charge, if applicable. Total returns for periods of less than one year are not annualized. |
3 | Amount does not reflect net expenses incurred by investment companies in which the Fund may invest. |
4 | Computed on an annualized basis. |
5 | This expense decrease is reflected in both the net expense and the net investment income ratios shown above. Amount does not reflect expense waiver/ reimbursement recorded by investment companies in which the Fund may invest. |
6 | Securities that mature are considered sales for purposes of this calculation. |
Six Months Ended (unaudited) 5/31/2024 | Year Ended November 30, | |||||
2023 | 2022 | 2021 | 2020 | 2019 | ||
Net Asset Value, Beginning of Period | $7.79 | $7.80 | $9.23 | $9.22 | $9.03 | $8.54 |
Income From Investment Operations: | ||||||
Net investment income (loss)1 | 0.20 | 0.37 | 0.35 | 0.34 | 0.31 | 0.35 |
Net realized and unrealized gain (loss) | 0.21 | (0.01) | (1.43) | 0.01 | 0.17 | 0.48 |
Total From Investment Operations | 0.41 | 0.36 | (1.08) | 0.35 | 0.48 | 0.83 |
Less Distributions: | ||||||
Distributions from net investment income | (0.21) | (0.37) | (0.35) | (0.34) | (0.29) | (0.34) |
Net Asset Value, End of Period | $7.99 | $7.79 | $7.80 | $9.23 | $9.22 | $9.03 |
Total Return2 | 5.30% | 4.78% | (11.86)% | 3.77% | 5.49% | 9.95% |
Ratios to Average Net Assets: | ||||||
Net expenses3 | 0.93%4 | 0.93% | 0.93% | 0.93% | 0.93% | 0.94% |
Net investment income | 5.08%4 | 4.81% | 4.17% | 3.62% | 3.56% | 3.99% |
Expense waiver/reimbursement5 | 0.12%4 | 0.13% | 0.10% | 0.10% | 0.12% | 0.12% |
Supplemental Data: | ||||||
Net assets, end of period (000 omitted) | $28,181 | $29,665 | $35,464 | $51,221 | $51,426 | $53,136 |
Portfolio turnover6 | 9% | 69% | 77% | 50% | 70% | 58% |
1 | Per share numbers have been calculated using the average shares method. |
2 | Based on net asset value, which does not reflect the sales charge, redemption fee or contingent deferred sales charge, if applicable. Total returns for periods of less than one year are not annualized. |
3 | Amount does not reflect net expenses incurred by investment companies in which the Fund may invest. |
4 | Computed on an annualized basis. |
5 | This expense decrease is reflected in both the net expense and the net investment income ratios shown above. Amount does not reflect expense waiver/ reimbursement recorded by investment companies in which the Fund may invest. |
6 | Securities that mature are considered sales for purposes of this calculation. |
Six Months Ended (unaudited) 5/31/2024 | Year Ended November 30, | |||||
2023 | 2022 | 2021 | 2020 | 2019 | ||
Net Asset Value, Beginning of Period | $7.80 | $7.81 | $9.24 | $9.23 | $9.04 | $8.55 |
Income From Investment Operations: | ||||||
Net investment income (loss)1 | 0.22 | 0.40 | 0.38 | 0.36 | 0.34 | 0.38 |
Net realized and unrealized gain (loss) | 0.20 | (0.01) | (1.43) | 0.02 | 0.17 | 0.48 |
Total From Investment Operations | 0.42 | 0.39 | (1.05) | 0.38 | 0.51 | 0.86 |
Less Distributions: | ||||||
Distributions from net investment income | (0.22) | (0.40) | (0.38) | (0.37) | (0.32) | (0.37) |
Net Asset Value, End of Period | $8.00 | $7.80 | $7.81 | $9.24 | $9.23 | $9.04 |
Total Return2 | 5.46% | 5.11% | (11.56)% | 4.09% | 5.83% | 10.28% |
Ratios to Average Net Assets: | ||||||
Net expenses3 | 0.61%4 | 0.61% | 0.61% | 0.61% | 0.61% | 0.62% |
Net investment income | 5.40%4 | 5.11% | 4.49% | 3.82% | 3.87% | 4.23% |
Expense waiver/reimbursement5 | 0.20%4 | 0.21% | 0.19% | 0.15% | 0.20% | 0.19% |
Supplemental Data: | ||||||
Net assets, end of period (000 omitted) | $337,960 | $353,987 | $547,135 | $783,512 | $246,898 | $275,189 |
Portfolio turnover6 | 9% | 69% | 77% | 50% | 70% | 58% |
1 | Per share numbers have been calculated using the average shares method. |
2 | Based on net asset value. Total returns for periods of less than one year are not annualized. |
3 | Amount does not reflect net expenses incurred by investment companies in which the Fund may invest. |
4 | Computed on an annualized basis. |
5 | This expense decrease is reflected in both the net expense and the net investment income ratios shown above. Amount does not reflect expense waiver/ reimbursement recorded by investment companies in which the Fund may invest. |
6 | Securities that mature are considered sales for purposes of this calculation. |
Six Months Ended (unaudited) 5/31/2024 | Year Ended November 30, | |||||
2023 | 2022 | 2021 | 2020 | 2019 | ||
Net Asset Value, Beginning of Period | $7.86 | $7.86 | $9.30 | $9.29 | $9.10 | $8.60 |
Income From Investment Operations: | ||||||
Net investment income (loss)1 | 0.22 | 0.42 | 0.38 | 0.37 | 0.35 | 0.38 |
Net realized and unrealized gain (loss) | 0.21 | (0.02) | (1.44) | 0.01 | 0.16 | 0.49 |
Total From Investment Operations | 0.43 | 0.40 | (1.06) | 0.38 | 0.51 | 0.87 |
Less Distributions: | ||||||
Distributions from net investment income | (0.22) | (0.40) | (0.38) | (0.37) | (0.32) | (0.37) |
Net Asset Value, End of Period | $8.07 | $7.86 | $7.86 | $9.30 | $9.29 | $9.10 |
Total Return2 | 5.56% | 5.21% | (11.59)% | 4.08% | 5.80% | 10.35% |
Ratios to Average Net Assets: | ||||||
Net expenses3 | 0.60%4 | 0.60% | 0.60% | 0.60% | 0.60% | 0.61% |
Net investment income | 5.40%4 | 5.36% | 4.52% | 3.88% | 3.88% | 4.30% |
Expense waiver/reimbursement5 | 0.12%4 | 0.12% | 0.10% | 0.10% | 0.12% | 0.12% |
Supplemental Data: | ||||||
Net assets, end of period (000 omitted) | $10,868 | $11,005 | $9,974 | $11,157 | $5,468 | $4,390 |
Portfolio turnover6 | 9% | 69% | 77% | 50% | 70% | 58% |
1 | Per share numbers have been calculated using the average shares method. |
2 | Based on net asset value. Total returns for periods of less than one year are not annualized. |
3 | Amount does not reflect net expenses incurred by investment companies in which the Fund may invest. |
4 | Computed on an annualized basis. |
5 | This expense decrease is reflected in both the net expense and the net investment income ratios shown above. Amount does not reflect expense waiver/ reimbursement recorded by investment companies in which the Fund may invest. |
6 | Securities that mature are considered sales for purposes of this calculation. |
Assets: | |
Investment in securities, at value including and $452,717,715 of investments in affiliated holdings* (identified cost $676,951,420, including $534,876,625 of identified cost in affiliated holdings) | $587,204,816 |
Due from broker (Note 2) | 1,492,848 |
Income receivable | 871,606 |
Income receivable from affiliated holdings | 2,371,399 |
Receivable for investments sold | 394,121 |
Receivable for shares sold | 196,911 |
Receivable for variation margin on futures contracts | 86,142 |
Total Assets | 592,617,843 |
Liabilities: | |
Payable for investments purchased | 792,382 |
Payable for shares redeemed | 595,054 |
Written options outstanding, at value (premium received $1,711,633) | 1,709,915 |
Unrealized depreciation on foreign exchange contracts | 96,936 |
Payable to bank | 383 |
Payable for investment adviser fee (Note 5) | 6,975 |
Payable for administrative fee (Note 5) | 1,245 |
Payable for transfer agent fees (Note 2) | 104,081 |
Payable for distribution services fee (Note 5) | 10,397 |
Payable for other service fees (Notes 2 and 5) | 44,643 |
Accrued expenses (Note 5) | 125,023 |
Total Liabilities | 3,487,034 |
Net assets for 73,421,792 shares outstanding | $589,130,809 |
Net Assets Consist of: | |
Paid-in capital | $868,324,959 |
Total distributable earnings (loss) | (279,194,150) |
Total Net Assets | $589,130,809 |
Net Asset Value, Offering Price and Redemption Proceeds Per Share: | |
Class A Shares: | |
Net asset value per share ($195,787,992 ÷ 24,285,703 shares outstanding), $0.001 par value, 1,000,000,000 shares authorized | $8.06 |
Offering price per share (100/95.50 of $8.06) | $8.44 |
Redemption proceeds per share | $8.06 |
Class C Shares: | |
Net asset value per share ($16,334,006 ÷ 2,027,493 shares outstanding), $0.001 par value, 1,000,000,000 shares authorized | $8.06 |
Offering price per share | $8.06 |
Redemption proceeds per share (99.00/100 of $8.06) | $7.98 |
Class F Shares: | |
Net asset value per share ($28,180,755 ÷ 3,525,050 shares outstanding), $0.001 par value, 1,000,000,000 shares authorized | $7.99 |
Offering price per share (100/99.00 of $7.99) | $8.07 |
Redemption proceeds per share (99.00/100 of $7.99) | $7.91 |
Institutional Shares: | |
Net asset value per share ($337,960,485 ÷ 42,236,085 shares outstanding), $0.001 par value, 1,000,000,000 shares authorized | $8.00 |
Offering price per share | $8.00 |
Redemption proceeds per share | $8.00 |
Class R6 Shares: | |
Net asset value per share ($10,867,571 ÷ 1,347,461 shares outstanding), $0.001 par value, 1,000,000,000 shares authorized | $8.07 |
Offering price per share | $8.07 |
Redemption proceeds per share | $8.07 |
* | See information listed after the Fund’s Portfolio of Investments. |
Investment Income: | |
Dividends (including $15,867,125 received from affiliated holdings* and net of foreign taxes withheld of $2,319) | $16,138,115 |
Interest | 2,264,848 |
Net income on securities loaned (Note 2) | 1,217 |
TOTAL INCOME | 18,404,180 |
Expenses: | |
Investment adviser fee (Note 5) | 1,683,368 |
Administrative fee (Note 5) | 240,674 |
Custodian fees | 27,379 |
Transfer agent fees (Note 2) | 329,599 |
Directors’/Trustees’ fees (Note 5) | 2,971 |
Auditing fees | 18,553 |
Legal fees | 5,605 |
Portfolio accounting fees | 91,742 |
Distribution services fee (Note 5) | 65,951 |
Other service fees (Notes 2 and 5) | 308,877 |
Share registration costs | 43,703 |
Printing and postage | 23,434 |
Miscellaneous (Note 5) | 17,952 |
TOTAL EXPENSES | 2,859,808 |
Waiver and Reimbursements: | |
Waiver/reimbursement of investment adviser fee (Note 5) | (361,909) |
Waiver/reimbursements of other operating expenses (Notes 2 and 5) | (151,360) |
TOTAL WAIVER AND REIMBURSEMENTS | (513,269) |
Net expenses | 2,346,539 |
Net investment income | 16,057,641 |
Realized and Unrealized Gain (Loss) on Investments, Foreign Currency Transactions, Foreign Exchange Contracts, Futures Contracts, Written Options and Swap Contracts: | |
Net realized loss on investments (including net realized loss of $(7,743,198) on sales of investments in affiliated holdings*) | (9,023,992) |
Net realized loss on foreign currency transactions | (590,311) |
Net realized gain on foreign exchange contracts | 109,442 |
Net realized loss on futures contracts | (454,781) |
Net realized gain on written options | 3,031,820 |
Net realized loss on swap contracts | (205,163) |
Net change in unrealized depreciation of investments (including net change in unrealized depreciation of $19,273,670 on investments in affiliated holdings*) | 23,686,357 |
Net change in unrealized appreciation of translation of assets and liabilities in foreign currency | 17,565 |
Net change in unrealized appreciation of foreign exchange contracts | (166,082) |
Net change in unrealized appreciation of futures contracts | (35,346) |
Net change in unrealized depreciation of written options | 72,929 |
Net realized and unrealized gain (loss) on investments, foreign currency transactions, foreign exchange contracts, futures contracts, written options and swap contracts | 16,442,438 |
Change in net assets resulting from operations | $32,500,079 |
* | See information listed after the Fund’s Portfolio of Investments. |
Six Months Ended (unaudited) 5/31/2024 | Year Ended 11/30/2023 | |
Increase (Decrease) in Net Assets | ||
Operations: | ||
Net investment income | $16,057,641 | $35,308,572 |
Net realized gain (loss) | (7,132,985) | (42,094,307) |
Net change in unrealized appreciation/depreciation | 23,575,423 | 39,893,009 |
CHANGE IN NET ASSETS RESULTING FROM OPERATIONS | 32,500,079 | 33,107,274 |
Distributions to Shareholders: | ||
Class A Shares | (5,244,088) | (9,922,754) |
Class B Shares1 | — | (12,908) |
Class C Shares | (399,438) | (863,189) |
Class F Shares | (777,762) | (1,579,504) |
Institutional Shares | (9,915,403) | (22,338,927) |
Class R6 Shares | (314,511) | (480,196) |
CHANGE IN NET ASSETS RESULTING FROM DISTRIBUTIONS TO SHAREHOLDERS | (16,651,202) | (35,197,478) |
Share Transactions: | ||
Proceeds from sale of shares | 59,376,791 | 151,902,218 |
Net asset value of shares issued to shareholders in payment of distributions declared | 16,282,466 | 34,482,961 |
Cost of shares redeemed | (114,690,719) | (411,549,590) |
CHANGE IN NET ASSETS RESULTING FROM SHARE TRANSACTIONS | (39,031,462) | (225,164,411) |
Change in net assets | (23,182,585) | (227,254,615) |
Net Assets: | ||
Beginning of period | 612,313,394 | 839,568,009 |
End of period | $589,130,809 | $612,313,394 |
1 | On February 3, 2023, Class B Shares were converted into Class A Shares. |
Transfer Agent Fees Incurred | Transfer Agent Fees Reimbursed | |
Class A Shares | $109,186 | $(9,065) |
Class C Shares | 9,922 | (18) |
Class F Shares | 15,357 | (572) |
Institutional Shares | 194,020 | (141,705) |
Class R6 Shares | 1,114 | — |
TOTAL | $329,599 | $(151,360) |
Other Service Fees Incurred | |
Class A Shares | $250,255 |
Class C Shares | 21,984 |
Class F Shares | 36,638 |
TOTAL | $308,877 |
Fair Value of Derivative Instruments | ||||
Assets | Liabilities | |||
Statement of Assets and Liabilities Location | Fair Value | Statement of Assets and Liabilities Location | Fair Value | |
Derivatives not accounted for as hedging instruments under ASC Topic 815 | ||||
Interest rate contracts | Receivable for variation margin on futures contracts | $(10,258)* | $— | |
Interest rate contracts | Purchased options, within Investment in securities, at value | 84,375 | — | |
Interest rate contracts | — | Written options outstanding, at value | 210,547 | |
Equity contracts | — | Written options outstanding, at value | 315,000 | |
Equity contracts | Purchased options, within Investment in securities, at value | 362,250 | — | |
Foreign exchange contracts | — | Unrealized depreciation on foreign exchange contracts | 96,936 | |
Foreign exchange contracts | — | Written options outstanding, at value | 1,184,368 | |
Foreign exchange contracts | Purchased options, within Investment in securities, at value | 166,474 | — | |
Total derivatives not accounted for as hedging instruments under ASC Topic 815 | $602,841 | $1,806,851 | ||
* | Includes cumulative net depreciation of futures contracts as reported in the footnotes to the Portfolio of Investments. Only the current day’s variation margin is reported within the Statement of Assets and Liabilities. |
Amount of Realized Gain or (Loss) on Derivatives Recognized in Income | ||||||
OTC Swaps | Futures Contracts | Foreign Exchange Contracts | Purchased Options Contracts1 | Written Options Contracts | Total | |
Interest rate contracts | $— | $(684,980) | $— | $(377,246) | $256,404 | $(805,822) |
Equity contracts | — | 230,199 | — | 459,892 | 554,440 | 1,244,531 |
Foreign exchange contracts | — | — | 109,442 | (175,358) | 2,220,976 | 2,155,060 |
Credit contracts | (205,163) | — | — | — | — | (205,163) |
TOTAL | $(205,163) | $(454,781) | $109,442 | $(92,712) | $3,031,820 | $2,388,606 |
1 | The net realized loss on Purchased Options Contracts is found within the Net realized loss on investments on the Statement of Operations. |
Change in Unrealized Appreciation or (Depreciation) on Derivatives Recognized in Income | |||||
Futures Contracts | Foreign Exchange Contracts | Purchased Options Contracts1 | Written Options Contracts | Total | |
Interest rate contracts | $(35,346) | $— | $9,012 | $9,546 | $(16,788) |
Equity contracts | — | — | (71,794) | (49,808) | (121,602) |
Foreign exchange contracts | — | (166,082) | 38,432 | 113,191 | (14,459) |
TOTAL | $(35,346) | $(166,082) | $(24,350) | $72,929 | $(152,849) |
1 | The net change in unrealized depreciation of Purchased Options Contracts is found within the Net change in unrealized depreciation of investments on the Statement of Operations. |
Gross Amounts Not Offset In the Statement of Assets and Liabilities | ||||||||
Transaction | Gross Asset Derivatives Presented In Statement of Assets and Liabilities | Financial Instrument | Collateral Received | Net Amount | ||||
Purchased Option Contracts | $613,099 | $(565,849) | $— | $47,250 | ||||
TOTAL | $613,099 | $(565,849) | $— | $47,250 | ||||
Transaction | Gross Liability Derivatives Presented In Statement of Assets and Liabilities | Financial Instrument | Collateral Received | Net Amount |
Foreign Exchange Contracts | $96,936 | $— | $— | $96,936 |
Written Option Contracts | 1,709,915 | (565,849) | — | 1,144,066 |
TOTAL | $1,806,851 | $(565,849) | $— | $1,241,002 |
Six Months Ended 5/31/2024 | Year Ended 11/30/2023 | |||
Class A Shares: | Shares | Amount | Shares | Amount |
Shares sold | 589,608 | $4,740,745 | 1,296,435 | $10,150,145 |
Shares issued to shareholders in payment of distributions declared | 613,294 | 4,936,653 | 1,194,661 | 9,322,310 |
Conversion of Class B Shares to Class A Shares1 | — | — | 165,549 | 1,344,260 |
Shares redeemed | (2,235,174) | (17,995,142) | (5,606,326) | (43,885,877) |
NET CHANGE RESULTING FROM CLASS A SHARE TRANSACTIONS | (1,032,272) | $(8,317,744) | (2,949,681) | $(23,069,162) |
Six Months Ended 5/31/2024 | Year Ended 11/30/2023 | |||
Class B Shares: | Shares | Amount | Shares | Amount |
Shares sold | — | $— | 93 | $734 |
Shares issued to shareholders in payment of distributions declared | — | — | 1,526 | 11,961 |
Conversion of Class B Shares to Class A Shares1 | — | — | (165,829) | (1,344,260) |
Shares redeemed | — | — | (34,114) | (268,267) |
NET CHANGE RESULTING FROM CLASS B SHARE TRANSACTIONS | — | $— | (198,324) | $(1,599,832) |
Six Months Ended 5/31/2024 | Year Ended 11/30/2023 | |||
Class C Shares: | Shares | Amount | Shares | Amount |
Shares sold | 126,785 | $1,018,975 | 561,060 | $4,397,173 |
Shares issued to shareholders in payment of distributions declared | 49,374 | 397,425 | 110,168 | 859,714 |
Shares redeemed | (534,986) | (4,296,701) | (1,241,343) | (9,694,992) |
NET CHANGE RESULTING FROM CLASS C SHARE TRANSACTIONS | (358,827) | $(2,880,301) | (570,115) | $(4,438,105) |
Six Months Ended 5/31/2024 | Year Ended 11/30/2023 | |||
Class F Shares: | Shares | Amount | Shares | Amount |
Shares sold | 78,792 | $626,198 | 90,517 | $708,673 |
Shares issued to shareholders in payment of distributions declared | 95,445 | 761,986 | 199,457 | 1,544,718 |
Shares redeemed | (455,899) | (3,637,767) | (1,030,100) | (7,963,164) |
NET CHANGE RESULTING FROM CLASS F SHARE TRANSACTIONS | (281,662) | $(2,249,583) | (740,126) | $(5,709,773) |
Six Months Ended 5/31/2024 | Year Ended 11/30/2023 | |||
Institutional Shares: | Shares | Amount | Shares | Amount |
Shares sold | 6,356,887 | $50,753,191 | 16,713,026 | $130,114,640 |
Shares issued to shareholders in payment of distributions declared | 1,236,270 | 9,876,437 | 2,871,670 | 22,271,242 |
Shares redeemed | (10,741,152) | (85,788,441) | (44,285,865) | (343,699,075) |
NET CHANGE RESULTING FROM INSTITUTIONAL SHARE TRANSACTIONS | (3,147,995) | $(25,158,813) | (24,701,169) | $(191,313,193) |
Six Months Ended 5/31/2024 | Year Ended 11/30/2023 | |||
Class R6 Shares: | Shares | Amount | Shares | Amount |
Shares sold | 278,195 | $2,237,682 | 670,560 | $5,186,593 |
Shares issued to shareholders in payment of distributions declared | 38,500 | 309,965 | 60,685 | 473,016 |
Shares redeemed | (369,275) | (2,972,668) | (599,547) | (4,693,955) |
NET CHANGE RESULTING FROM R6 SHARE TRANSACTIONS | (52,580) | $(425,021) | 131,698 | $965,654 |
NET CHANGE RESULTING FROM TOTAL FUND SHARE TRANSACTIONS | (4,873,336) | $(39,031,462) | (29,027,717) | $(225,164,411) |
1 | On February 3, 2023, Class B Shares were converted into Class A Shares. Within the Statement of Changes in Net Assets, the conversion from Class B Shares is within the Cost of shares redeemed and the conversion to Class A Shares is within Proceeds from sale of shares. |
Short-Term | Long-Term | Total |
$40,799,092 | $132,821,067 | $173,620,159 |
Administrative Fee | Average Daily Net Assets of the Investment Complex |
0.100% | on assets up to $50 billion |
0.075% | on assets over $50 billion |
Percentage of Average Daily Net Assets of Class | |
Class C Shares | 0.75% |
Class F Shares | 0.05% |
Distribution Services Fees Incurred | |
Class C Shares | $65,951 |
Purchases | $24,139,142 |
Sales | $71,802,671 |

Federated Hermes Funds
4000 Ericsson Drive
Warrendale, PA 15086-7561
or call 1-800-341-7400.
CUSIP 31417P700
CUSIP 31417P809
CUSIP 31417P841
CUSIP 31417P833
| Item 8. | Changes in and Disagreements with Accountants for Open-End Management Investment Companies |
Federated Hermes Strategic Income Fund: Not Applicable.
| Item 9. | Proxy Disclosures for Open-End Management Investment Companies. |
Federated Hermes Strategic Income Fund: Not Applicable.
| Item 10. | Remuneration Paid to Directors, Officers, and Others of Open-End Management Investment Companies. |
Federated Hermes Strategic Income Fund: The Fund’s disclosure of remuneration items is included as part of the Financial Statements filed under Item 7 of this form.
| Item 11. | Statement Regarding Basis for Approval of Investment Advisory Contract. |
Federated Hermes Strategic Income Fund: The Fund’s Evaluation and Approval of Advisory Contract summary by fund appear in the Financial Statements filed under Item 7 of this form.
| Item 12. | Disclosure of Proxy Voting Policies and Procedures for Closed-End Management Investment Companies |
Not Applicable
| Item 13. | Portfolio Managers of Closed-End Management Investment Companies. |
Not Applicable
| Item 14. | Purchases of Equity Securities by Closed-End Management Investment Company and Affiliated Purchasers. |
Not Applicable
| Item 15. | Submission of Matters to a Vote of Security Holders. |
Not Changes to Report
| Item 16. | Controls and Procedures. |
(a) The registrant’s Principal Executive Officer and Principal Financial Officer have concluded that the registrant’s disclosure controls and procedures (as defined in Rule 30a-3(c) under the Act) are effective in design and operation and are sufficient to form the basis of the certifications required by Rule 30a-(2) under the Act, based on their evaluation of these disclosure controls and procedures as of a date within 90 days of this report on Form N-CSR.
(b) There were no changes in the registrant’s internal control over financial reporting (as defined in Rule 30a-3(d) under the Act) during the period covered by this report that have materially affected, or are reasonably likely to materially affect, the registrant’s internal control over financial reporting.
| Item 17. | Disclosure of Securities Lending Activities for Closed-End Management Investment Companies. |
Not Applicable
| Item 18. | Recovery of Erroneously Awarded Compensation |
(a) Not Applicable
(b) Not Applicable
| Item 19. | Exhibits |
| (a)(1) | Not Applicable. |
| (a)(2) | Certifications of Principal Executive Officer and Principal Financial Officer. |
| (a)(3) | Not Applicable. |
| (a)(4) | Not Applicable. |
| (b) | Certifications pursuant to 18 U.S.C. Section 1350. |
SIGNATURES
Pursuant to the requirements of the Securities Exchange Act of 1934 and the Investment Company Act of 1940, the registrant has duly caused this report to be signed on its behalf by the undersigned, thereunto duly authorized.
Registrant: Federated Hermes Fixed Income Securities, Inc.
By: /s/ Jeremy D. Boughton
Jeremy D. Boughton, Principal Financial Officer
Date: July 23, 2024
Pursuant to the requirements of the Securities Exchange Act of 1934 and the Investment Company Act of 1940, this report has been signed below by the following persons on behalf of the registrant and in the capacities and on the dates indicated.
By: /s/ J. Christopher Donahue
J. Christopher Donahue, Principal Executive Officer
Date: July 23, 2024
By: /s/ Jeremy D. Boughton
Jeremy D. Boughton, Principal Financial Officer
Date: July 23, 2024