EXHIBIT 13

2007 ANNUAL REPORT
|
FINANCIAL HIGHLIGHTS
| |||||
TABLE OF CONTENTS: | PAGE | |
FINANCIAL HIGHLIGHTS | 2 | |
UNAUDITED GRAPHS OF FINANCIAL DATA | 3 | |
REPORT OF INDEPENDENT REGISTERED PUBLIC ACCOUNTING FIRM | 4 | |
CONSOLIDATED BALANCE SHEET | 5 | |
CONSOLIDATED STATEMENT OF INCOME | 6 | |
CONSOLIDATED STATEMENT OF STOCKHOLDERS’ EQUITY | 7 | |
CONSOLIDATED STATEMENT OF CASH FLOWS | 8-9 | |
NOTES TO CONSOLIDATED FINANCIAL STATEMENTS | 10-25 | |
MANAGEMENT’S DISCUSSION AND ANALYSIS | 26-41 | |
DIRECTORS, OFFICERS AND ADVISORY BOARD MEMBERS | 42-43 | |
LOCATIONS | 44 | |
| MID PENN BANCORP, INC. | FINANCIAL HIGHLIGHTS |
AS OF AND FOR YEARS ENDED DECEMBER 31, 2007 AND 2006
| (Dollars in thousands, except per share data.) | 2007 | 2006 | Percent Change | ||||
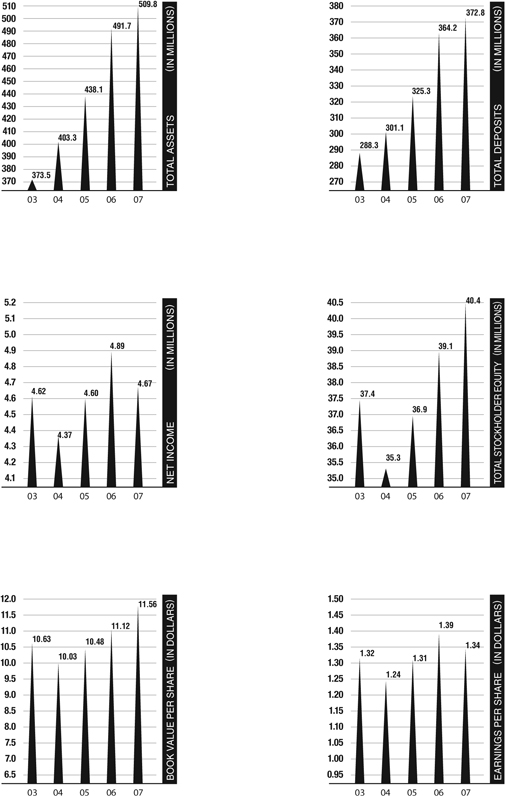
Total Assets | $ | 509,757 | 491,694 | +3.67% | |||
Total Deposits | 372,817 | 364,226 | +2.35% | ||||
Net Loans and Leases | 372,338 | 354,386 | +5.06% | ||||
Total Investments and Interest Bearing Balances | 100,902 | 104,182 | -3.14% | ||||
Stockholders’ Equity | 40,444 | 39,085 | +3.48% | ||||
Net Income | 4,671 | 4,888 | -4.44% | ||||
Earnings Per Share | 1.34 | 1.39 | -3.60% | ||||
Cash Dividend Per Share, historical | .80 | .80 | 0.00% | ||||
Book Value Per Share | 11.56 | 11.12 | +3.96% | ||||
Return on Average Stockholders’ Equity | 11.84% | 12.93% | -8.04% | ||||
Return on Average Assets | 0.94% | 1.08% | -12.96% | ||||
Net Interest Margin | 3.68% | 3.82% | -3.66% | ||||
Nonperforming Assets to Total Assets | 1.44% | 0.50% | +188.00% | ||||
Mid Penn Bancorp, Inc.
Stockholders’ Information
| 2007 | 2006 | |||||||||
| High | Low | High | Low | Quarter | ||||||
Market Value Per Share | $ 25.45 | 23.15 | 27.20 | 25.00 | 1st | |||||
| 26.86 | 22.00 | 26.60 | .24.30 | 2nd | ||||||
| 26.50 | 23.70 | 25.50 | 23.00 | 3rd | ||||||
| 27.10 | 23.75 | 26.08 | 23.90 | 4th | ||||||
Market Value Information: The market share information was provided by the American Stock Exchange, New York, NY. Mid Penn Bancorp, Inc. common stock trades on the American Stock Exchange under the symbol: MBP.
Transfer Agent: Registrar and Transfer Company, 10 Commerce Drive, Cranford, NJ 07016. Phone: 1-800-368-5948.
Number of Stockholders: At December 31, 2007, there were 1,065 registered stockholders.
Dividends: A dividend of $.20 per share was paid during each quarter of 2006 and 2007. Mid Penn Bancorp, Inc. plans to continue a quarterly dividend payable in February, May, August and November. Additionally, a 5% stock dividend was paid in both February of 2006 and in May of 2007.
Dividend Reinvestment and Stock Purchases: Stockholders of Mid Penn Bancorp, Inc. may acquire additional shares of common stock by reinvesting their cash dividends under the Dividend Reinvestment Plan without paying a brokerage fee. Voluntary cash contributions may also be made under the Plan. For additional information about the Plan, contact the Transfer Agent.
Form 10-K: A Copy of Mid Penn Bancorp, Inc.’s Annual Report on Form 10-K, as filed with the Securities and Exchange Commission, will be provided to stockholders without charge upon written request to: Secretary, Mid Penn Bancorp, Inc., 349 Union Street, Millersburg, PA 17061.
Annual Meeting: The Annual Meeting of the Stockholders of Mid Penn Bancorp, Inc. will be held at 10:00 a.m. on Tuesday, April 22, 2008, at 349 Union Street, Millersburg, Pennsylvania.
Accounting, Auditing and Internal Control Complaints: Information on how to report a complaint regarding accounting, internal accounting controls or auditing matters is available at Mid Penn Bank’s website: www.midpennbank.com
2
| MID PENN BANCORP, INC. | UNAUDITED GRAPHS OF FINANCIAL DATA |
3
| MID PENN BANCORP, INC. | REPORT OF INDEPENDENT REGISTERED PUBLIC ACCOUNTING FIRM |

Board of Directors and Stockholders
Mid Penn Bancorp, Inc.:
We have audited the accompanying consolidated balance sheet of Mid Penn Bancorp, Inc. and subsidiaries (collectively, the “Corporation”) as of December 31, 2007 and 2006, and the related consolidated statements of income, stockholders’ equity, and cash flows for each of the years in the three-year period ended December 31, 2007. The Corporation’s management is responsible for these financial statements. Our responsibility is to express an opinion on these financial statements based on our audits.
We conducted our audits in accordance with the standards of the Public Company Accounting Oversight Board (United States). Those standards require that we plan and perform the audit to obtain reasonable assurance about whether the financial statements are free of material misstatement. An audit includes examining, on a test basis, evidence supporting the amounts and disclosures in the financial statements. An audit also includes assessing the accounting principles used and significant estimates made by management, as well as evaluating the overall financial statement presentation. We believe that our audits provide a reasonable basis for our opinion.
In our opinion, the consolidated financial statements referred to above present fairly, in all material respects, the financial position of Mid Penn Bancorp, Inc. and subsidiaries as of December 31, 2007 and 2006, and the results of their operations and their cash flows for each of the years in the three-year period ended December 31, 2007 in conformity with accounting principles generally accepted in the United States of America.
We have also audited, in accordance with the standards of the Public Company Accounting Oversight Board (United States), the effectiveness of the Corporation’s internal control over financial reporting as of December 31, 2007, based on criteria established in Internal Control - Integrated Framework issued by the Committee of Sponsoring Organizations of the Treadway Commission (COSO), and our report dated February 29, 2008 expressed an unqualified opinion.

PARENTE RANDOLPH, LLC
Williamsport, Pennsylvania
February 29, 2008
4
| MID PENN BANCORP, INC. | CONSOLIDATED BALANCE SHEET |
DECEMBER 31, 2007 AND 2006
| (Dollars in thousands, except share data) | 2007 | 2006 | |||||||||
ASSETS | |||||||||||
Cash and due from banks | $ | 10,599 | 9,498 | ||||||||
Interest-bearing balances with other financial institutions | 46,830 | 46,921 | |||||||||
Available-for-sale investment securities | 54,072 | 57,261 | |||||||||
Loans and leases | 378,741 | 360,336 | |||||||||
Less: | |||||||||||
Unearned income | (1,613 | ) | (1,763 | ) | |||||||
Allowance for loan and lease losses | (4,790 | ) | (4,187 | ) | |||||||
Net loans and leases | 372,338 | 354,386 | |||||||||
Bank premises and equipment, net | 10,638 | 9,562 | |||||||||
Foreclosed assets held for sale | 529 | 146 | |||||||||
Accrued interest receivable | 2,818 | 2,822 | |||||||||
Deferred income taxes | 2,053 | 1,610 | |||||||||
Goodwill | 1,016 | 1,016 | |||||||||
Core deposit intangible, net | 362 | 428 | |||||||||
Cash surrender value of life insurance | 6,961 | 7,154 | |||||||||
Other assets | 1,541 | 890 | |||||||||
Total Assets | $ | 509,757 | 491,694 | ||||||||
LIABILITIES AND STOCKHOLDERS’ EQUITY | |||||||||||
Deposits: | |||||||||||
Noninterest-bearing demand | $ | 46,478 | 44,097 | ||||||||
Interest-bearing demand | 36,627 | 32,978 | |||||||||
Money market | 62,596 | 59,640 | |||||||||
Savings | 24,844 | 25,397 | |||||||||
Time | 202,272 | 202,114 | |||||||||
Total Deposits | 372,817 | 364,226 | |||||||||
Short-term borrowings | 37,349 | 24,275 | |||||||||
Accrued interest payable | 1,990 | 1,912 | |||||||||
Other liabilities | 2,576 | 2,483 | |||||||||
Long-term debt | 54,581 | 59,713 | |||||||||
Total Liabilities | 469,313 | 452,609 | |||||||||
Stockholders’ Equity: | |||||||||||
Common stock, par value $1 per share; authorized 10,000,000 shares; 3,533,340 shares and 3,367,119 shares issued in 2007 and 2006, respectively | 3,533 | 3,367 | |||||||||
Additional paid-in capital | 31,107 | 27,452 | |||||||||
Retained earnings | 6,660 | 8,583 | |||||||||
Accumulated other comprehensive income | 284 | 317 | |||||||||
Treasury stock, at cost (43,706 and 23,038 shares at December 31, 2007 and 2006, respectively) | (1,140 | ) | (634 | ) | |||||||
Stockholders’ Equity, Net | 40,444 | 39,085 | |||||||||
Total Liabilities and Stockholders’ Equity | $ | 509,757 | 491,694 | ||||||||
The accompanying notes are an integral part of these consolidated financial statements.
5
| MID PENN BANCORP, INC. | CONSOLIDATED STATEMENT OF INCOME |
FOR YEARS ENDED DECEMBER 31, 2007, 2006 AND 2005
| (Dollars in thousands, except share data) | 2007 | 2006 | 2005 | ||||
INTEREST INCOME | |||||||
Interest and fees on loans | $ | 26,357 | 23,455 | 19,251 | |||
Interest on interest-bearing balances | 2,546 | 2,225 | 2,067 | ||||
Interest and dividends on investment securities: | |||||||
U.S. Treasury and government agencies | 944 | 1,032 | 801 | ||||
State and political subdivision obligations, tax-exempt | 1,361 | 1,287 | 1,030 | ||||
Other securities | 203 | 186 | 92 | ||||
Interest on federal funds sold and securities purchased under agreement to resell | 33 | 29 | 53 | ||||
Total Interest Income | 31,444 | 28,214 | 23,294 | ||||
INTEREST EXPENSE | |||||||
Interest on deposits | 11,430 | 8,868 | 6,521 | ||||
Interest on short-term borrowings | 1,049 | 686 | 203 | ||||
Interest on long-term debt | 2,860 | 3,178 | 2,833 | ||||
Total Interest Expense | 15,339 | 12,732 | 9,557 | ||||
Net Interest Income | 16,105 | 15,482 | 13,737 | ||||
PROVISION FOR LOAN AND LEASE LOSSES | 925 | 735 | 225 | ||||
Net Interest Income After Provision for Loan and Lease Losses | 15,180 | 14,747 | 13,512 | ||||
NONINTEREST INCOME | |||||||
Trust department income | 319 | 258 | 312 | ||||
Service charges on deposits | 1,499 | 1,376 | 1,348 | ||||
Investment securities gains, net | 0 | 33 | 1 | ||||
Gain on sale of loans | 21 | 0 | 19 | ||||
Income on cash surrender value of life insurance | 271 | 219 | 222 | ||||
Fee income from investment services | 155 | 112 | 70 | ||||
Fee income from debit card transactions | 524 | 428 | 347 | ||||
Gain on sale of other real estate | 0 | 104 | 56 | ||||
Death benefit on bank owned life insurance | 180 | 0 | 0 | ||||
Other income | 512 | 498 | 578 | ||||
Total Noninterest Income | 3,481 | 3,028 | 2,953 | ||||
NONINTEREST EXPENSE | |||||||
Salaries and employee benefits | 6,582 | 6,023 | 5,662 | ||||
Occupancy expense, net | 868 | 622 | 594 | ||||
Equipment expense | 1,064 | 838 | 734 | ||||
Pennsylvania bank shares tax expense | 329 | 286 | 259 | ||||
Legal and professional expense | 705 | 733 | 540 | ||||
Early withdrawal penalty on investment CDs | 0 | 191 | 0 | ||||
Marketing and advertising | 403 | 255 | 298 | ||||
ATM and debit card processing expense | 199 | 148 | 196 | ||||
Director fees and benefits expense | 294 | 241 | 221 | ||||
Computer expense | 434 | 378 | 308 | ||||
Stationery and supplies expense | 255 | 231 | 222 | ||||
Loss on sale of other real estate | 9 | 0 | 0 | ||||
Other expenses | 1,454 | 1,317 | 1,228 | ||||
Total Noninterest Expense | 12,596 | 11,263 | 10,262 | ||||
INCOME BEFORE PROVISION FOR INCOME TAXES | 6,065 | 6,512 | 6,203 | ||||
Provision for income taxes | 1,394 | 1,624 | 1,600 | ||||
NET INCOME | $ | 4,671 | 4,888 | 4,603 | |||
EARNINGS PER SHARE | $ | 1.34 | 1.39 | 1.31 | |||
Weighted Average Number of Shares Outstanding | 3,497,806 | 3,514,820 | 3,515,714 | ||||
Earnings per share information has been restated to reflect the retroactive effect of a five percent stock dividend issued in the second quarter of 2007 and a five percent stock dividend in the first quarter of 2006.
The accompanying notes are an integral part of these consolidated financial statements.
6
| MID PENN BANCORP, INC. | CONSOLIDATED STATEMENT OF STOCKHOLDERS’ EQUITY |
FOR YEARS ENDED DECEMBER 31, 2007, 2006 AND 2005
(Dollars in thousands, except share data)
| | Common Stock | Additional Paid-in Capital | Retained Earnings | | Accumulated Other Comprehensive Income (Loss) | | Treasury Stock | | Total | ||||||||
Balance, December 31, 2004 | 3,208 | 23,472 | 8,435 | 693 | (536 | ) | 35,272 | ||||||||||
Comprehensive income: | |||||||||||||||||
Net income | 0 | 0 | 4,603 | 0 | 0 | 4,603 | |||||||||||
Change in net unrealized gain (loss) on securities available for sale, net of reclassification adjustment and tax effects | 0 | 0 | 0 | (462 | ) | 0 | (462 | ) | |||||||||
Total comprehensive income | 4,141 | ||||||||||||||||
Cash dividends ($ .80 per share) | 0 | 0 | (2,552 | ) | 0 | 0 | (2,552 | ) | |||||||||
Balance, December 31, 2005 | 3,208 | 23,472 | 10,486 | 231 | (536 | ) | 36,861 | ||||||||||
Comprehensive income: | |||||||||||||||||
Net income | 0 | 0 | 4,888 | 0 | 0 | 4,888 | |||||||||||
Change in net unrealized gain (loss) on securities available for sale, net of reclassification adjustment and tax effects | 0 | 0 | 0 | 60 | 0 | 60 | |||||||||||
Adjustments to initially apply FASB Statement No. 158, net of tax | |||||||||||||||||
Net transition obligation | 0 | 0 | 0 | (58 | ) | 0 | (58 | ) | |||||||||
Net gain | 0 | 0 | 0 | 84 | 0 | 84 | |||||||||||
Total comprehensive income | 4,974 | ||||||||||||||||
Cash dividends ($ .80 per share) | 0 | 0 | (2,652 | ) | 0 | 0 | (2,652 | ) | |||||||||
Stock dividend 5% issued February 2006 | 159 | 3,980 | (4,139 | ) | 0 | 0 | 0 | ||||||||||
Purchase of treasury stock (3,982 shares) | 0 | 0 | 0 | 0 | (98 | ) | (98 | ) | |||||||||
Balance, December 31, 2006 | 3,367 | 27,452 | 8,583 | 317 | (634 | ) | 39,085 | ||||||||||
Comprehensive income: | |||||||||||||||||
Net income | 0 | 0 | 4,671 | 0 | 0 | 4,671 | |||||||||||
Change in net unrealized gain (loss) on securities available for sale, net of reclassification adjustment and tax effects | 0 | 0 | 0 | 143 | 0 | 143 | |||||||||||
Defined benefit plans, net of tax effects: | |||||||||||||||||
Net prior service cost | 0 | 0 | 0 | (199 | ) | 0 | (199 | ) | |||||||||
Net gain | 0 | 0 | 0 | 13 | 0 | 13 | |||||||||||
Net transition obligation | 0 | 0 | 0 | 10 | 0 | 10 | |||||||||||
Total comprehensive income | 4,638 | ||||||||||||||||
Cash dividends ($0.80 per share) | 0 | 0 | (2,773 | ) | 0 | 0 | (2,773 | ) | |||||||||
Stock dividend 5% issued May 2007 | 166 | 3,655 | (3,821 | ) | 0 | 0 | 0 | ||||||||||
Purchase of treasury stock (20,668 shares) | 0 | 0 | 0 | 0 | (506 | ) | (506 | ) | |||||||||
Balance, December 31, 2007 | $ | 3,533 | 31,107 | 6,660 | 284 | (1,140 | ) | 40,444 | |||||||||
| The accompanying notes are an integral part of these consolidated financial statements. | 7 |
| MID PENN BANCORP, INC. | CONSOLIDATED STATEMENT OF CASH FLOWS |
FOR YEARS ENDED DECEMBER 31, 2007, 2006 AND 2005
(Dollars in thousands)
| 2007 | 2006 | 2005 | ||||||||||
Operating Activities: | ||||||||||||
Net income | $ | 4,671 | 4,888 | 4,603 | ||||||||
Adjustments to reconcile net income to net cash provided by operating activities: | ||||||||||||
Provision for loan and lease losses | 925 | 735 | 225 | |||||||||
Depreciation | 809 | 638 | 579 | |||||||||
Amortization of core deposit intangible | 66 | 39 | 36 | |||||||||
Decrease (increase) in cash surrender value of life insurance | 194 | (219 | ) | (222 | ) | |||||||
Investment securities gains, net | 0 | (33 | ) | (1 | ) | |||||||
(Gain) loss on sale of other real estate | 9 | (104 | ) | (66 | ) | |||||||
(Gain) on sale of loans | (21 | ) | 0 | (19 | ) | |||||||
(Gain) loss on disposal of bank premises and equipment | 0 | (9 | ) | 2 | ||||||||
Deferred income taxes | (427 | ) | (262 | ) | (173 | ) | ||||||
Change in accrued interest receivable | 4 | (464 | ) | (394 | ) | |||||||
Change in other assets | (651 | ) | (25 | ) | (143 | ) | ||||||
Change in accrued interest payable | 78 | 266 | 343 | |||||||||
Change in other liabilities | (172 | ) | 241 | 370 | ||||||||
Net Cash Provided By Operating Activities | 5,485 | 5,691 | 5,140 | |||||||||
Investing Activities: | ||||||||||||
Net decrease in interest-bearing balances | 91 | 7,628 | 5,858 | |||||||||
Proceeds from the maturity of investment securities | 10,074 | 5,546 | 4,798 | |||||||||
Proceeds from the sale of investment securities | 0 | 1,923 | 535 | |||||||||
Purchases of investment securities | (6,670 | ) | (13,728 | ) | (12,297 | ) | ||||||
Purchase of life insurance | 0 | (533 | ) | 0 | ||||||||
Cash received from business combination | 0 | 7,100 | 0 | |||||||||
Proceeds from sale of loans | 0 | 0 | 348 | |||||||||
Net increase in loans | (19,385 | ) | (31,011 | ) | (33,241 | ) | ||||||
Proceeds from sale of bank premises and equipment | 0 | 13 | 40 | |||||||||
Purchases of bank premises and equipment | (1,885 | ) | (1,044 | ) | (2,081 | ) | ||||||
Proceeds from the sale of foreclosed assets | 137 | 746 | 571 | |||||||||
Net Cash Used In Investing Activities | (17,638 | ) | (23,360 | ) | (35,469 | ) | ||||||
Financing Activities: | ||||||||||||
Net increase in deposits | 8,591 | 11,759 | 24,130 | |||||||||
Net increase (decrease) in short-term borrowings | 13,074 | 11,933 | (1,459 | ) | ||||||||
Cash dividends paid | (2,773 | ) | (2,652 | ) | (2,552 | ) | ||||||
Long-term debt repayment | (5,132 | ) | (10,125 | ) | (119 | ) | ||||||
Purchase of treasury stock | (506 | ) | (98 | ) | 0 | |||||||
Long-term borrowings | 0 | 10,000 | 10,000 | |||||||||
Net Cash Provided By Financing Activities | 13,254 | 20,817 | 30,000 | |||||||||
Net increase (decrease) in cash and due from banks | 1,101 | 3,148 | (329 | ) | ||||||||
Cash and due from banks at beginning of year | 9,498 | 6,350 | 6,679 | |||||||||
Cash and due from banks at end of year | $ | 10,599 | 9,498 | 6,350 | ||||||||
Supplemental Disclosures of Cash Flow Information: | ||||||||||||
Interest paid | $ | 15,261 | 12,355 | 9,214 | ||||||||
Income taxes paid | $ | 1,930 | 1,910 | 1,876 | ||||||||
Supplemental Noncash Disclosures: | ||||||||||||
Loan charge-offs | $ | 460 | 309 | 199 | ||||||||
Transfers to foreclosed assets held for sale | $ | 529 | 330 | 458 | ||||||||
8
| MID PENN BANCORP, INC. | CONSOLIDATED STATEMENT OF CASH FLOWS |
2006 Business Combination:
(Dollars in thousands)
| 2006 | ||||
Investing Activities: | ||||
Cash received from business combination | $ | 7,100 | ||
Supplemental Noncash Disclosures: | ||||
Noncash Assets Received and Liabilities | ||||
Assumed from Acquisition of Branches | ||||
Assets received: | ||||
Loans | $ | 16,307 | ||
Accrued Interest receivable | 89 | |||
Bank premises and equipment | 2,826 | |||
Intangible asset - core deposit intangible | 232 | |||
Intangible asset - goodwill | 757 | |||
Other assets | 14 | |||
Total noncash assets received | $ | 20,225 | ||
Liabilities assumed: | ||||
Deposits | 27,193 | |||
Accrued interest payable | 111 | |||
Other liabilities | 21 | |||
Total noncash liabilities assumed | $ | 27,325 | ||
The accompanying notes are an integral part of these consolidated financial statements.
9
| MID PENN BANCORP, INC. | NOTES TO CONSOLIDATED FINANCIAL STATEMENTS |
| (1) | Basis of Presentation |
The accompanying consolidated financial statements include the accounts of Mid Penn Bancorp, Inc. and its wholly-owned subsidiaries Mid Penn Bank (“Bank”), Mid Penn Investment Corporation and Mid Penn Insurance Services, LLC, (collectively, “MPB”). All significant intercompany balances and transactions have been eliminated in consolidation.
| (2) | Nature of Business |
The Bank engages in a full-service commercial banking and trust business, making available to the community a wide range of financial services, including, but not limited to, installment loans, mortgage and home equity loans, secured and unsecured commercial and consumer loans, lines of credit, construction financing, farm loans, community development loans, loans to non-profit entities and local government loans and various types of time and demand deposits, including but not limited to, checking accounts, savings accounts, clubs, money market deposit accounts, certificates of deposit and IRAs. In addition, the Bank provides a full range of trust services through its Trust Department. Deposits are insured by the Federal Deposit Insurance Corporation (FDIC) to the extent provided by law.
The financial services are provided to individuals, partnerships, non-profit organizations, and corporations through its fifteen offices located in Dauphin County, the southern portion of Northumberland County, the western portion of Schuylkill County and Hampden Township and the borough of Camp Hill in Cumberland County.
Mid Penn Investment Corporation is engaged in investing activities.
Mid Penn Insurance Services, LLC provides a range of personal and investment insurance products.
| (3) | Summary of Significant Accounting Policies |
The accounting and reporting policies of MPB conform with accounting principles generally accepted in the United States of America and to general practice within the financial industry. The following is a description of the more significant accounting policies.
| (a) | Use of Estimates |
The preparation of financial statements requires management to make estimates and assumptions that affect the reported amounts of assets and liabilities and disclosure of contingent assets and liabilities at the date of the financial statements and the reported amounts of revenues and expenses during the reporting periods. Actual results could differ from those estimates.
A material estimate that is particularly susceptible to significant change relates to the determination of the allowance for loan and lease losses.
While management uses available information to recognize losses on loans and leases, future additions to the allowance may be necessary based on changes in local economic conditions. In addition, regulatory agencies, as an integral part of their examination process, periodically review the Bank’s allowance for loan and lease losses. Such agencies may require the Bank to recognize changes to the allowance based on their judgments about information available to them at the time of their examination. Because of these factors, it is reasonably possible that the allowance for loan and lease losses may change materially in the near term.
| (b) | Investment Securities |
Available-for-Sale Securities - includes debt and restricted equity securities. Debt securities are reported at fair value, with unrealized holding gains and losses excluded from earnings and reported, net of deferred income taxes, as a component of accumulated other comprehensive income (loss) within stockholders’ equity. Realized gains and losses on sales of investment securities are computed on the basis of specific identification of the cost of each security. Restricted equity securities are generally carried at cost due to the lack of available market data, and are evaluated for impairment. MPB had no trading securities or held-to-maturity securities in 2007 or 2006.
| (c) | Loans |
Interest on loans is recognized on a method which approximates a level yield basis over the life of the loans. The accrual of interest on loans, including impaired loans, is generally discontinued when principal or interest has consistently been in default for a period of 90 days or more, or because of a deterioration in the financial condition of the borrower, payment in full of principal or interest is not expected. Interest income is subsequently recognized only to the extent cash payments are received. The placement of a loan on the nonaccrual basis for revenue recognition does not necessarily imply a potential charge-off of loan principal. Loan origination fees and certain direct origination costs are capitalized and recognized as an adjustment of the yield on the related loan.
| (d) | Allowance for Loan and Lease Losses |
The Bank’s methodology for determining the allowance for loan and lease losses establishes both a specific and a general component. The specific portion of the allowance represents the results of analysis of leases and individual “watch list” loans (commercial, residential and consumer loans). The individual commercial loans are risk rated with specific attention to estimated loss exposure. Historical loan loss rates are applied to “problem” consumer credits, adjusted to reflect current conditions.
Specific regular reviews of credits exceeding $500,000 are performed to monitor the major portfolio risk. The Bank analyzes all commercial loans in excess of $10,000 that are rated as watch list credits. Potential credit problems are monitored to determine whether specific loans are impaired, with impairment normally measured by reference to borrowers’ collateral values and estimated cash flows.
The general portion of the allowance for loan and lease losses represents the results of measuring potential losses inherent in the portfolio that are not identified in the specific allowance analysis. This general portion is determined using historical loan and lease loss experience adjusted by assessing changes in the Bank’s underwriting criteria, growth and/or changes in the mix of loans originated, industry concentrations and evaluations, lending management changes, comparisons of certain factors to peer group banks and changes in economic conditions.
10
| MID PENN BANCORP, INC. | NOTES TO CONSOLIDATED FINANCIAL STATEMENTS |
Management believes the allowance for loan and lease losses is adequate. Identification of specific losses is an ongoing process using available information. Specifically, quarterly management meetings to review “problem” loans and leases are utilized to determine a plan for collection and, if necessary, a recommendation to the Board for charge off. Future additions to the allowance for loan and lease losses through a provision for loan and lease losses will be made based on identified changes in the above factors coupled with loss experience.
Various regulatory agencies, as an integral part of their examination process, periodically review the Bank’s allowance for loan and lease losses. These agencies may require the Bank to recognize changes to the allowance based on their judgment about information available to them at the time of their examinations.
| (e) | Bank Premises and Equipment |
Bank premises and equipment are stated at cost less accumulated depreciation. Depreciation is provided on the straight-line basis over the estimated useful lives of the assets. Maintenance and repairs are charged to expense when incurred, while major additions and improvements are capitalized. Gains and losses on disposals are reflected in current operations.
| (f) | Foreclosed Assets Held for Sale |
Foreclosed assets held for sale consist primarily of real estate acquired through, or in lieu of, foreclosure in settlement of debt and are recorded at fair value at the date of transfer. Any valuation adjustments required at the date of transfer are charged to the allowance for loan losses. Subsequent to acquisition, foreclosed assets are carried at the lower of cost or fair value less costs of disposal, based upon periodic evaluations that consider changes in market conditions and development and disposal costs. Operating results from assets acquired in satisfaction of debt, including rental income less operating costs and gains or losses on the sale of, or the periodic evaluation of foreclosed assets, are recorded in noninterest expense.
| (g) | Income Taxes |
Certain items of income and expense are recognized in different accounting periods for financial reporting purposes than for income tax purposes. Deferred income tax assets and liabilities are provided in recognition of these temporary differences at currently enacted income tax rates. As changes in tax laws or rates are enacted, deferred income tax assets and liabilities are adjusted through the provision for income taxes.
| (h) | Core Deposit Intangible |
Core deposit intangible is a measure of the value of consumer demand and savings deposits acquired in business combinations accounted for as purchases. The core deposit intangible is being amortized over an 8 year life on a straight-line basis. The core deposit intangible is subject to impairment testing whenever events or changes in circumstances indicate its carrying amount may not be recoverable.
| (i) | Goodwill |
Goodwill is the excess of the purchase price over the fair value of assets acquired in connection with 2004 and 2006 business acquisitions accounted for as purchases. Statement of Financial Accounting Standards No. 142, “Goodwill and Other Intangible Assets,” requires a two-step process for testing the impairment of goodwill on at least an annual basis. No impairment of goodwill was recognized in 2007, 2006 or 2005.
| (j) | Marketing and Advertising Costs |
Marketing and advertising costs are expensed as incurred and were $403,000 in 2007, $255,000 in 2006, and $298,000 in 2005.
| (k) | Postretirement Benefit Plans |
MPB has adopted Statement of Financial Accounting Standards No. 132 (revised 2003), “Employers’ Disclosures about Postretirement Benefits” (“Revised SFAS No. 132”). Revised SFAS No. 132 requires additional disclosures about defined benefit pension plans and other postretirement defined benefit plans. It does not change the measurement or recognition of those plans.
| (l) | Other Benefit Plan |
A funded contributory defined-contribution plan is maintained for substantially all employees. The cost of the MPB defined contribution plan is charged to current operating expenses and is funded annually.
| (m) | Trust Assets and Income |
Assets held by the Bank in a fiduciary or agency capacity for customers of the Trust Department are not included in the consolidated financial statements since such items are not assets of the Bank. Trust income is recognized on the cash basis which is not materially different than if it were reported on the accrual basis.
| (n) | Earnings Per Share |
Earnings per share is computed by dividing net income by the weighted average number of common shares outstanding during each of the years presented giving retroactive effect to stock dividends and stock splits. MPB’s basic and diluted earnings per share are the same since there are no potentially dilutive securities outstanding.
| (o) | Statement of Cash Flows |
For purposes of cash flows, MPB considers cash and due from banks to be cash equivalents.
| (p) | Reclassifications |
Certain prior year amounts have been reclassified to conform to the current year’s classifications.
11
| MID PENN BANCORP, INC. | NOTES TO CONSOLIDATED FINANCIAL STATEMENTS |
| (4) | Comprehensive Income |
The components of other comprehensive income (loss) and related tax effects are as follows:
| (Dollars in thousands) | Years Ended December 31, | |||||||||
| 2007 | 2006 | 2005 | ||||||||
Change in unrealized holding gains (losses) on available-for-sale securities | $ | 217 | 123 | (699 | ) | |||||
Less reclassification adjustment for gains realized in income | 0 | (33 | ) | (1 | ) | |||||
Net unrealized (losses) gains | 217 | 90 | (700 | ) | ||||||
Defined benefit plans: | ||||||||||
Net prior service cost | (301 | ) | 0 | 0 | ||||||
Net gain | 20 | 128 | 0 | |||||||
Net transition obligation | 15 | (88 | ) | 0 | ||||||
| (266 | ) | 40 | 0 | |||||||
Other comprehensive income | (49 | ) | 130 | (700 | ) | |||||
Income tax benefit (expense) | 16 | (44 | ) | (238 | ) | |||||
Net | $ | (33 | ) | 86 | (462 | ) | ||||
| (5) | Restrictions on Cash and Due from Bank Accounts |
The Bank is required to maintain reserve balances with the Federal Reserve Bank of Philadelphia. The amounts of those required balances were $533,000 at December 31, 2007 and $512,000 at December 31, 2006.
| (6) | Investment Securities |
At December 31, 2007 and 2006, amortized cost, fair value, and unrealized gains and losses on investment securities are as follows:
(Dollars in Thousands) | |||||||||||
| December 31, 2007 | Amortized Cost | Unrealized Gains | Unrealized Losses | Fair Value | |||||||
Available-for-sale securities: | |||||||||||
U.S. Treasury and U.S. government agencies | $ | 12,044 | 31 | 12 | 12,063 | ||||||
Mortgage-backed U.S. government agencies | 6,862 | 26 | 30 | 6,858 | |||||||
State and political subdivision obligations | 30,437 | 719 | 68 | 31,088 | |||||||
Restricted equity securities | 4,072 | 0 | 9 | 4,063 | |||||||
| $ | 53,415 | 776 | 119 | 54,072 | |||||||
(Dollars in Thousands) | |||||||||||
| December 31, 2006 | Amortized Cost | Unrealized Gains | Unrealized Losses | Fair Value | |||||||
Available-for-sale securities: | |||||||||||
U.S. Treasury and U.S. government agencies | $ | 15,015 | 15 | 194 | 14,836 | ||||||
Mortgage-backed U.S. government agencies | 9,041 | 28 | 95 | 8,974 | |||||||
State and political subdivision obligations | 29,050 | 711 | 14 | 29,747 | |||||||
Restricted equity securities | 3,713 | 0 | 9 | 3,704 | |||||||
| $ | 56,819 | 754 | 312 | 57,261 | |||||||
Estimated fair values of debt securities are based on quoted market prices, where applicable. If quoted market prices are not available, fair values are based on quoted market prices of comparable instruments, adjusted for differences between the quoted instruments and the instruments being valued.
Restricted equity securities consist of stock in the Federal Home Loan Bank of Pittsburgh and Atlantic Central Bankers Bank which do not have a readily determinable fair value because their ownership is restricted and they lack a market. Also included in restricted equity securities is an investment in Access Capital Strategies, an equity fund that invests in low to moderate income financing projects. This investment was purchased in 2004 to help fulfill the Bank’s regulatory requirement of the Community Reinvestment Act and at December 31, 2006 and December 31, 2007, is reported at fair value.
12
| MID PENN BANCORP, INC. | NOTES TO CONSOLIDATED FINANCIAL STATEMENTS |
Investment securities having a fair value of $38,771,000 at December 31, 2007 and $44,913,000 at December 31, 2006, were pledged to secure public deposits and other borrowings.
Gains from sales of investment securities amounted to $33,000 in 2006 and $1,000 in 2005. The proceeds from sales of investment securities were $1,923,000 in 2006 and $535,000 in 2005. There were no sales of investment securities in 2007.
The following table presents gross unrealized losses and fair value of investments aggregated by investment category and length of time that individual securities have been in a continuous unrealized loss position at December 31, 2007 and 2006.
| (Dollars in thousands) | Less Than 12 Months | 12 Months or More | Total | ||||||||||||
| December 31, 2007 | Fair Value | Unrealized Losses | Fair Value | Unrealized Losses | Fair Value | Unrealized Losses | |||||||||
Available-for-sale securities: | |||||||||||||||
U.S. Treasury and U.S. government agencies | $ | 0 | 0 | 5,488 | 12 | 5,488 | 12 | ||||||||
Mortgage-backed U.S. government agencies | 0 | 0 | 3,827 | 30 | 3,827 | 30 | |||||||||
State and political subdivision obligations | 1,473 | 58 | 1,336 | 10 | 2,809 | 68 | |||||||||
Restricted equity securities | 0 | 0 | 241 | 9 | 241 | 9 | |||||||||
Total temporarily impaired available-for-sale securities | $ | 1,473 | 58 | 10,892 | 61 | 12,365 | 119 | ||||||||
| (Dollars in thousands) | Less Than 12 Months | 12 Months or More | Total | ||||||||||||
| December 31, 2006 | Fair Value | Unrealized Losses | Fair Value | Unrealized Losses | Fair Value | Unrealized Losses | |||||||||
Available-for-sale securities: | |||||||||||||||
U.S. Treasury and U.S. government agencies | $ | 0 | 0 | 13,806 | 194 | 13,806 | 194 | ||||||||
Mortgage-backed U.S. government agencies | 0 | 0 | 5,822 | 95 | 5,822 | 95 | |||||||||
State and political subdivision obligations | 1,954 | 5 | 1,293 | 9 | 3,247 | 14 | |||||||||
Restricted equity securities | 0 | 0 | 241 | 9 | 241 | 9 | |||||||||
Total temporarily impaired available-for-sale securities | $ | 1,954 | 5 | 21,162 | 307 | 23,116 | 312 | ||||||||
Management evaluates securities for other-than-temporary impairment at least on a quarterly basis; and more frequently when economic or market concerns warrant such evaluation. Consideration is given to (1) the length of time and the extent to which the fair value has been less than cost, (2) the financial condition and near term prospects of the issuer, and (3) the intent and ability of MPB to retain its investment in the issuer for a period of time sufficient to allow for any anticipated recovery in fair value.
At December 31, 2007, the 19 debt securities with unrealized losses have depreciated 0.95% from its amortized cost basis. These securities are issued by either the U.S. Government or other governmental agencies. These unrealized losses relate principally to current interest rates for similar types of securities. In analyzing an issuer's financial condition, management considers whether the securities are issued by the federal government or its agencies, whether downgrades by bond rating agencies have occurred, and the results of reviews of the issuer's financial condition. As management has the ability to hold debt securities until maturity, or for the foreseeable future if classified as available-for-sale, no declines are deemed to be other-than-temporary.
The following is a schedule of the maturity distribution of investment securities at amortized cost and fair value at December 31, 2007:
| December 31, 2007 | December 31, 2006 | ||||||||||
| (Dollars in thousands) | Amortized Cost | Fair Value | Amortized Cost | Fair Value | |||||||
Due in 1 year or less | $ | 3,895 | 3,899 | 2,455 | 2,451 | ||||||
Due after 1 year but within 5 years | 7,347 | 7,469 | 10,722 | 10,702 | |||||||
Due after 5 years but within 10 years | 18,075 | 18,402 | 17,323 | 17,623 | |||||||
Due after 10 years | 13,164 | 13,382 | 13,566 | 13,807 | |||||||
| 42,481 | 43,152 | 44,066 | 44,583 | ||||||||
Mortgage-backed securities (avg. life 1.8 years) | 6,862 | 6,857 | 9,041 | 8,974 | |||||||
Restricted equity securities | 4,072 | 4,063 | 3,713 | 3,704 | |||||||
| $ | 53,415 | 54,072 | 56,820 | 57,261 | |||||||
13
| MID PENN BANCORP, INC. | NOTES TO CONSOLIDATED FINANCIAL STATEMENTS |
(7) Loans A summary of loans at December 31, 2007 and 2006 is as follows:
| ||||||||||||
| (Dollars in thousands) | 2007 | 2006 | ||||||||||
Commercial real estate, construction and land development | $ | 229,766 | 226,663 | |||||||||
Commercial, industrial and agricultural | 59,702 | 48,785 | ||||||||||
Real estate - residential | 70,872 | 63,141 | ||||||||||
Consumer | 18,401 | 21,747 | ||||||||||
| $ | 378,741 | 360,336 | ||||||||||
Net unamortized loan fees and costs of $330,000 in 2007 and $346,000 in 2006 were deducted from loans.
Loans and available credit to Bank executive officers, directors, and corporations in which such executive officers and directors have beneficial interests as stockholders, executive officers, or directors aggregated approximately $6,304,000 at December 31, 2007 and $6,058,000 at December 31, 2006. New loans extended were $320,000 in 2007 and $199,000 in 2006. Net payments on these loans equalled $74,000 during 2007 and $152,000 during 2006. These loans were made on substantially the same basis, including interest rates and collateral as those prevailing for comparable transactions with other borrowers at the same time.
(8) Allowance for Loan and Lease Losses Changes in the allowance for loan and lease losses for the years 2007, 2006 and 2005 are summarized as follows: | ||||||||||||
(Dollars in thousands) | 2007 | 2006 | 2005 | |||||||||
Balance, January 1 | $ | 4,187 | 3,704 | 3,643 | ||||||||
Provision for loan and lease losses | 925 | 735 | 225 | |||||||||
Loans and leases charged off | (460 | ) | (309) | (199) | ||||||||
Recoveries on loans and leases charged off | 138 | 57 | 35 | |||||||||
Balance, December 31 | $ | 4,790 | 4,187 | 3,704 | ||||||||
The recorded investment in loans and leases that are considered impaired amounted to $4,317,000 on December 31, 2007, and $1,126,000 on both December 31, 2006 and December 31, 2005. By definition, impairment of a loan or lease is considered when, based on current information and events, it is probable that all amounts due will not be collected according to the contractual terms of the loan or lease agreement. The allowance for loan and lease losses related to loans and leases classified as impaired amounted to $429,000 at December 31, 2007 and $163,000 at December 31, 2006. All impaired loans and leases at the end of 2007 and 2006 had related allowances. The average balances of these loans and leases amounted to $2,504,000, $1,739,000 and $1,404,000 for the years 2007, 2006 and 2005, respectively. The Bank recognizes interest income on impaired loans and leases on a cash basis. The following is a summary of cash receipts on these loans and leases and how they were applied in 2007, 2006, and 2005.
| ||||||||||||
(Dollars in thousands) | 2007 | 2006 | 2005 | |||||||||
Cash receipts applied to reduce principal balance | $ | 1,112 | 563 | 23 | ||||||||
Cash receipts recognized as interest income | 17 | 2 | 15 | |||||||||
Total cash receipts | $ | 1,129 | 565 | 38 | ||||||||
Loans and leases which were past due 90 days or more for which interest continued to be accrued amounted to $2,439,000 at December 31, 2007 and $900,000 at December 31, 2006. Total nonaccrual loans and leases amounted to $4,317,000 at December 31, 2007 and $1,235,000 at December 31, 2006. The Bank has no commitments to lend additional funds to borrowers with impaired or nonaccrual loans.
(9) Bank Premises and Equipment At December 31, 2007 and 2006, bank premises and equipment are as follows:
| ||||||||||||
(Dollars in thousands) | 2007 | 2006 | ||||||||||
Land | $ | 2,946 | 2,466 | |||||||||
Buildings | 8,765 | 7,169 | ||||||||||
Furniture and fixtures | 6,916 | 6,368 | ||||||||||
Leasehold improvements | 133 | 133 | ||||||||||
Construction in progress | 0 | 739 | ||||||||||
| 18,760 | 16,875 | |||||||||||
Less accumulated depreciation | (8,122 | ) | (7,313) | |||||||||
| $ | 10,638 | 9,562 | ||||||||||
| Depreciation expense was $809,000 in 2007, $638,000 in 2006 and $579,000 in 2005. | ||||||||||||
14
| MID PENN BANCORP, INC. | NOTES TO CONSOLIDATED FINANCIAL STATEMENTS |
| (10) | Deposits |
At December 31, 2007 and 2006, time deposits in denominations of $100,000 or more amounted to $43,941,000 and $33,985,000, respectively. Interest expense on such certificates of deposit amounted to $2,142,000, $1,549,000 and $1,036,000 for the years ended December 31, 2007, 2006 and 2005, respectively. These larger time deposits at December 31, 2007, mature as follows (in thousands): 2008, $28,488; 2009, $3,227; 2010, $3,800; 2011, $7,042; 2012, $915; thereafter, $469.
Brokered deposits, included in the deposit totals, equalled $49,757,000 at December 31, 2007 and $39,849,000 at December 31, 2006. Deposits and other funds from related parties held by MPB at December 31, 2007 and 2006 amounted to $6,184,000 and $5,736,000, respectively.
| (11) | Short-term Borrowings |
Short-term borrowings as of December 31, 2007 and 2006 consisted of:
| (Dollars in thousands) | 2007 | 2006 | |||||||
Federal funds purchased | $ | 29,600 | 14,500 | ||||||
Repurchase agreements | 7,156 | 9,175 | |||||||
Treasury, tax and loan notes | 593 | 600 | |||||||
| $ | 37,349 | 24,275 | |||||||
The weighted average interest rate on total short-term borrowings outstanding was 3.90% at December 31, 2007 and 4.91% at December 31, 2006.
Federal funds purchased represent overnight funds. Securities sold under repurchase agreements generally mature between one day and one year. Treasury, tax and loan notes are open-ended interest bearing notes payable to the U.S. Treasury upon call. All tax deposits accepted by the Bank are placed in the Treasury note account. The Bank also has unused lines of credit with several banks amounting to $24,280,000 at December 31, 2007.
| (12) | Long-term Debt |
The Bank is a member of the Federal Home Loan Bank of Pittsburgh (FHLB) and through its membership, the Bank can access a number of credit products which are utilized to provide various forms of liquidity. As of December 31, 2007 and 2006, the Bank had long-term debt in the amount of $54,581,000 and $59,713,000, respectively, consisting of:
| At December 31, | |||||||||
| (Dollars in thousands) | 2007 | 2006 | |||||||
Loans matured in 2007 at a rate of 3.71% | $ | 0 | 5,000 | ||||||
Loans maturing in 2008 with rates ranging from 3.08% to 3.80% | 15,000 | 15,000 | |||||||
Loans maturing in 2009 with rates ranging from 4.22% to 7.24% | 17,000 | 17,000 | |||||||
Loans maturing in 2010 with rates ranging from 6.28% to 6.71% | 10,000 | 10,000 | |||||||
Loans maturing in 2011 at a rate of 5.13% | 5,000 | 5,000 | |||||||
Loans maturing in 2013 with rates ranging from 4.08% to 4.75% | 3,500 | 3,500 | |||||||
Loans maturing in 2026 at a rate of 4.80% | 3,992 | 4,122 | |||||||
Loans maturing in 2027 at a rate of 6.71% | 89 | 91 | |||||||
Total Long-term Debt | $ | 54,581 | 59,713 | ||||||
The aggregate amounts due on long-term debt subsequent to December 31, 2007 are $15,138,000 (2008), $17,145,000 (2009), $10,152,000 (2010), $5,159,000 (2011), $167,000 (2012), $6,820,000 thereafter. $3,110,553 of the Bank’s investments, and the bank’s mortgage loan portfolio are pledged to secure FHLB borrowings.
| (13) | Postretirement Benefit Plans |
MPB has an unfunded noncontributory defined benefit plan for directors. The plan provides defined benefits based on years of service.
MPB also has other postretirement benefit plans covering full-time employees. These health care and life insurance plans are noncontributory.
The significant aspects of each plan are as follows:
| (a) | Health Insurance |
For full-time employees who retire after at least 20 years of service, MPB will pay premiums for major medical insurance (as provided to active employees) for a period ending on the earlier of the date the participant obtains other employment where major medical coverage is available or the date of the participant’s death; however, in all cases payment of medical premiums by MPB will not exceed five years. If the retiree becomes eligible for Medicare within the five year period beginning on his/her retirement date, the Bank may pay, at its discretion, premiums for 65 Special coverage or a similar supplemental coverage. After the five year period has expired, all MPB paid benefits cease; however, the retiree may continue coverage through the Bank at his/her own expense.
15
| MID PENN BANCORP, INC. | NOTES TO CONSOLIDATED FINANCIAL STATEMENTS |
| (b) | Life Insurance |
For full-time employees who retire after at least 20 years of service, MPB will provide term life insurance. The amount of coverage prior to age 65 will be three times the participant's annual salary at retirement or $50,000, whichever is less. After age 65, the life insurance coverage amount will decrease by 10% per year, subject to a minimum amount of $2,000.
| (c) | Directors’ Retirement Plan |
MPB has an unfunded defined benefit retirement plan for directors with benefits based on years of service. The adoption of this plan generated unrecognized prior service cost of $274,000, which is being amortized based on the expected future years of service of active directors. The unamortized balance at December 31, 2007, was $222,000.
Health and Life
The following tables provide a reconciliation of the changes in the plan’s health and life insurance benefit obligations and fair value of plan assets for the years ended December 31, 2007 and 2006, and a statement of the funded status at December 31, 2007 and 2006:
| December 31, | ||||||||||||
(Dollars in thousands) | 2007 | 2006 | ||||||||||
Change in benefit obligations: | ||||||||||||
Benefit obligations, January 1 | $ | 624 | 720 | |||||||||
Service cost | 41 | 39 | ||||||||||
Interest cost | 31 | 30 | ||||||||||
Actuarial loss (gain) | (48 | ) | (146 | ) | ||||||||
Benefit payments | (23 | ) | (19 | ) | ||||||||
Benefit obligations, December 31 | $ | 625 | 624 | |||||||||
Change in fair value of plan assets: | ||||||||||||
Fair value of plan assets, January 1 | $ | 0 | 0 | |||||||||
Employer contributions | 23 | 19 | ||||||||||
Benefit payments | (23 | ) | (19 | ) | ||||||||
Fair value of plan assets, December 31 | $ | 0 | 0 | |||||||||
Funded status at year end | $ | (625 | ) | (624 | ) | |||||||
Amount recognized in the consolidated balance sheet at December 31, 2007 and 2006, is as follows: | ||||||||||||
(Dollars in thousands) | 2007 | 2006 | ||||||||||
Accrued benefit liability | $ | (625 | ) | (624 | ) | |||||||
Amounts recognized in accumulated other comprehensive income consist of: | December 31, | |||||||||||
| 2007 | 2006 | |||||||||||
Net transition obligation, net of tax effects | $ | 49 | 58 | |||||||||
Net gain, net of tax effects | (109 | ) | (81 | ) | ||||||||
| The accumulated benefit obligation for health and life insurance plans was $625,000 and $624,000 at December 31, 2007 and 2006, respectively. | ||||||||||||
| The estimated net actuarial gain and transition assets that will be amortized from accumulated other comprehensive income (loss) into net periodic benefit cost during 2008 are $5,100 and $14,727. | ||||||||||||
| The components of net periodic postretirement benefit cost for 2007, 2006 and 2005 are as follows: | ||||||||||||
(Dollars in thousands) | 2007 | 2006 | 2005 | |||||||||
Service cost | $ | 41 | 39 | 43 | ||||||||
Interest cost | 31 | 30 | 36 | |||||||||
Amortization of transition obligation | 15 | 15 | 15 | |||||||||
Amortization of net (gain) | (7 | ) | (4 | ) | 0 | |||||||
Net periodic postretirement benefit cost | $ | 80 | 80 | 94 | ||||||||
16
| MID PENN BANCORP, INC. | NOTES TO CONSOLIDATED FINANCIAL STATEMENTS |
| Assumptions used in the measurement of MPB’s benefit obligations at December 31, 2007 and 2006 are as follows: | ||||||
Weighted-average assumptions: | 2007 | 2006 | ||||
Discount rate | 6.00% | 5.75% | ||||
Rate of compensation increase | 5.00% | 5.00% | ||||
| Assumptions used in the measurement of MPB’s net periodic benefit cost for the years ended December 31, 2007, 2006 and 2005 are as follows: | ||||||
| 2007 | 2006 | 2005 | ||||
Weighted-average assumptions: | ||||||
Discount rate | 5.75% | 5.50% | 5.75% | |||
Rate of compensation increase | 5.00% | 5.00% | 5.00% | |||
| Assumed health care cost trend rates at December 31, 2007, 2006 and 2005 are as follows: | ||||||
| 2007 | 2006 | 2005 | ||||
Health care cost trend rate assumed for next year | 9.00% | 9.00% | 9.00% | |||
Rate to which the cost trend rate is assumed to decline (the ultimate trend rate) | 5.00% | 5.00% | 5.00% | |||
Year that the rate reaches the ultimate trend rate | 2011 | 2010 | 2009 | |||
| Assumed health care cost trend rates have a significant effect on the amounts reported for the health care plans. A one-percentage-point change in assumed health care cost trend rates would have the following effects: | ||||||
| | One-Percentage Point | |||||||||
(Dollars in thousands) | Increase | Decrease | ||||||||
Effect on total of service and interest cost | $ 12 | 10 | ||||||||
Effect on accumulated postretirement benefit obligation | 73 | 62 | ||||||||
| MPB expects to contribute $25,940 to its life and health benefit plans in 2008. | ||||||||||
Estimated Future Benefit Payments | ||||||||||
1/1/2008 to 12/31/2008 | $ | 25,940 | ||||||||
1/1/2009 to 12/31/2009 | 31,242 | |||||||||
1/1/2010 to 12/31/2010 | 26,781 | |||||||||
1/1/2011 to 12/31/2011 | 31,918 | |||||||||
1/1/2012 to 12/31/2012 | 22,279 | |||||||||
1/1/2013 to 12/31/2017 | 220,485 | |||||||||
Benefit obligations were measured as of December 31, 2007, for the postretirement benefit plan. | ||||||||||
Retirement Plan | ||||||||||
The following tables provide a reconciliation of the changes in the directors’ defined benefit plan’s benefit obligations and fair value of plan assets for the years ended December 31, 2007 and 2006 and a statement of the status at December 31, 2007 and 2006. This plan is unfunded: | ||||||||||
(Dollars in thousands) | December 31, | ||||||||||
| 2007 | 2006 | ||||||||||
Change in benefit obligations: | |||||||||||
Benefit obligations, January 1 | $ | 716 | 716 | ||||||||
Service cost | 26 | 19 | |||||||||
Interest cost | 60 | 37 | |||||||||
Actuarial (gain) loss | 27 | (10 | ) | ||||||||
Plan amendment | 324 | 0 | |||||||||
Change in assumptions | (6 | ) | (11 | ) | |||||||
Benefit payments | (49 | ) | (35 | ) | |||||||
Benefit obligations, December 31 | $ | 1,098 | 716 | ||||||||
17
| MID PENN BANCORP, INC. | NOTES TO CONSOLIDATED FINANCIAL STATEMENTS |
(Dollars in thousands) | |||||||||||
Change in fair value of plan assets: | 2007 | 2006 | |||||||||
Fair value of plan assets, January 1 | $ | 0 | 0 | ||||||||
Employer contributions | 49 | 35 | |||||||||
Benefit payments | (49 | ) | (35 | ) | |||||||
Fair value of plan assets, December 31 | $ | 0 | 0 | ||||||||
Funded status at year end | $ | (1,098 | ) | (716 | ) | ||||||
Amounts recognized in the consolidated balance sheet at December 31, 2007 and 2006 are as follows: | |||||||||||
(Dollars in thousands) | 2007 | 2006 | |||||||||
Accrued benefit liability | $ | (1,098 | ) | (716 | ) | ||||||
Amounts recognized in accumulated other comprehensive income consist of: | |||||||||||
| 2007 | 2006 | ||||||||||
Net prior service cost, net of tax effect | $ | 196 | 0 | ||||||||
Net loss (gain), net of tax effect | 11 | (3 | ) | ||||||||
The accumulated benefit obligation for the retirement plan was $785,000 at December 31, 2007 and $716,000 at December 31, 2006. | |||||||||||
| The estimated net actuarial gain and prior service costs that will be amortized from accumulated other comprehensive income (loss) into net periodic benefit cost during 2008 are $0 and $26,984. | |||||||||||
The components of net periodic retirement cost for 2007, 2006 and 2005 are as follows: | |||||||||||
(Dollars in thousands) | 2007 | 2006 | 2005 | ||||||||
Service cost | $ | 26 | 20 | 26 | |||||||
Interest cost | 59 | 37 | 41 | ||||||||
Amortization of prior-service cost | 27 | 0 | 26 | ||||||||
Net periodic retirement cost | $ | 112 | 57 | 93 | |||||||
Assumptions used in the measurement of MPB’s benefit obligations at December 31, 2007 and 2006 are as follows: | |||||||||||
Weighted-average assumptions: | 2007 | 2006 | |||||||||
Discount rate | 6.00% | 5.75% | |||||||||
Change in consumer price index | 3.50% | 3.25% | |||||||||
Assumptions used in the measurement of MPB’s net periodic benefit cost for the years ended December 31, 2007, 2006 and 2005 are as follows: | |||||||||||
| 2007 | 2006 | 2005 | |||||||||
Weighted-average assumptions: | |||||||||||
Discount rate | 5.75% | 5.50% | 5.75% | ||||||||
Change in consumer price index | 3.25% | 3.25% | 3.00% | ||||||||
MPB expects to contribute $69,905 to its retirement plan in 2008. | |||||||||||
Estimated Future Benefit Payments | |||||||||||
1/1/2008 to 12/31/2008 | $ | 62,905 | |||||||||
1/1/2009 to 12/31/2009 | 63,605 | ||||||||||
1/1/2010 to 12/31/2010 | 64,152 | ||||||||||
1/1/2011 to 12/31/2011 | 64,538 | ||||||||||
1/1/2012 to 12/31/2012 | 77,234 | ||||||||||
1/1/2013 to 12/31/2017 | 378,785 | ||||||||||
Plan benefit obligations were measured as of December 31, 2007 for the directors’ defined benefit plan. | |||||||||||
The Bank is the owner and beneficiary of insurance policies on the lives of certain officers and directors which informally fund the retirement plan obligation. The aggregate cash surrender value of these policies was $2,882,000 and $2,942,000 at December 31, 2007 and 2006, respectively. | |||||||||||
18
| MID PENN BANCORP, INC. | NOTES TO CONSOLIDATED FINANCIAL STATEMENTS |
| (14) | Other Benefit Plans |
| (a) | Defined-Contribution Plan |
The Bank has a funded contributory defined-contribution plan covering substantially all employees. The Bank’s contribution to the plan was $241,000 for 2007, $251,000 for 2006 and $277,000 for 2005.
| (b) | Deferred Compensation Plans |
The Bank has an executive deferred compensation plan which allows an executive officer to defer bonus compensation for a specified period in order to provide future retirement income. At December 31, 2007 and 2006, the Bank had accrued a liability of approximately $146,000 and $140,000, respectively, for this plan.
The Bank also has a directors’ deferred compensation plan which allows directors to defer receipt of fees for a specified period in order to provide future retirement income. At December 31, 2007 and 2006, the Bank had accrued a liability of approximately $321,000 and $274,000, respectively, for this plan.
| (c) | Salary Continuation Agreement |
The Bank maintains a Salary Continuation Agreement (Agreement) for an executive officer. The Agreement provides the executive officer with a fixed annual benefit. The benefit is payable beginning at age 65 for a period of 15 years. If the executive officer terminates employment before the normal retirement date for reasons other than death, the annual benefit payable will be based on the vesting schedule as defined in the Agreement. Upon death or a change in control of the Bank, the executive officer or his beneficiary is entitled to the full fixed annual benefits. At December 31, 2007 and 2006, the Bank has accrued a liability of approximately $261,000 and $232,000, respectively, for the Agreement.
The expense related to the Agreement was $29,000 for 2007, $37,000 for 2006 and $34,000 for 2005.
The Bank is the owner and beneficiary of an insurance policy on the life of the participating executive officer which informally funds the benefit obligation. The aggregate cash surrender value of this policy was approximately $964,000 and $930,000 at December 31, 2007 and 2006, respectively.
| (d) | Employee Stock Ownership Plan |
MPB has an Employee Stock Ownership Plan (ESOP) covering substantially all employees. Contributions to the ESOP are made at the discretion of the Board of Directors. Total expense related to MPB’s contribution to the ESOP for 2007, 2006 and 2005 was $79,000, $94,000 and $139,000, respectively. The ESOP held 45,193 and 40,461 shares of MPB stock as of December 31, 2007 and December 31, 2006, respectively, all of which were allocated to plan participants. Shares held by the ESOP are considered outstanding for purposes of calculating earnings per share. Dividends paid on shares held by the ESOP are charged to retained earnings.
| (e) | Other |
At December 31, 2007 and 2006, the Bank had Split Dollar Life Insurance arrangements with one existing and one former executive for which the aggregate collateral assignment and cash surrender values are approximately $1,608,000 and $1,550,000, respectively.
| (15) | Federal Income Taxes |
The following temporary differences gave rise to the net deferred tax asset at December 31, 2007 and 2006:
| (Dollars in thousands) | 2007 | 2006 | |||||||
Deferred tax assets: | |||||||||
Allowance for loan losses | $ | 1,475 | 1,270 | ||||||
Benefit plans | 963 | 703 | |||||||
Nonaccrual interest | 132 | 110 | |||||||
Core deposit intangible | 47 | 15 | |||||||
Total | 2,617 | 2,098 | |||||||
Deferred tax liabilities: | |||||||||
Depreciation | (116) | (149) | |||||||
Loan fees | (134) | (117) | |||||||
Bond accretion | (58) | (42) | |||||||
Other items | (33) | (30) | |||||||
Unrealized gain on securities | (223) | (150) | |||||||
Total | (564) | (488) | |||||||
Deferred tax asset, net | $ | 2,053 | 1,610 | ||||||
19
| MID PENN BANCORP, INC. | NOTES TO CONSOLIDATED FINANCIAL STATEMENTS |
The provision for income taxes consists of the following:
(Dollars in thousands) | 2007 | 2006 | 2005 | |||||||||
Currently payable | $ | 1,821 | 1,886 | 1,773 | ||||||||
Deferred | (427 | ) | (262 | ) | (173 | ) | ||||||
Total provision for income taxes | $ | 1,394 | 1,624 | 1,600 | ||||||||
A reconciliation of income tax at the statutory rate to MPB’s effective rate is as follows: |
| |||||||||||
(Dollars in thousands) | 2007 | 2006 | 2005 | |||||||||
Provision at the expected statutory rate | $ | 2,001 | 2,214 | 2,109 | ||||||||
Effect of tax-exempt income | (601 | ) | (643 | ) | (533 | ) | ||||||
Nondeductible interest | 81 | 66 | 39 | |||||||||
Other items | (87 | ) | (13 | ) | (15 | ) | ||||||
Provision for income taxes | $ | 1,394 | 1,624 | 1,600 | ||||||||
| (16) | Business Combination |
On December 4, 2006, MPB consummated the purchase of assets and assumption of liabilities of the Middletown and Steelton offices of Omega Bank (“Omega Branches”). MPB approved this deal in order to increase market share in the Central Pennsylvania Area. The net receipt of cash from the Omega Branches was $7,100,000. The results of operations of these former Omega Branches from the date of acquisition have been included in the accompanying consolidated financial statements.
The following table summarizes the estimated fair values of the assets acquired and liabilities assumed at the date of acquisition.
(Dollars in thousands) | 2006 | |||||
Cash | $ 445 | |||||
Loans | 16,307 | |||||
Accrued interest receivable | 89 | |||||
Property, plant and equipment | 2,826 | |||||
Goodwill | 757 | |||||
Core deposit intangible | 232 | |||||
Other assets | 14 | |||||
Total Assets Acquired | $ 20,670 | |||||
Deposits | $ 27,193 | |||||
Accrued interest payable | 111 | |||||
Other liabilities | 21 | |||||
Total Liabilities Assumed | 27,325 | |||||
Net Liabilities Assumed | $ 6,655 | |||||
| (17) | Core Deposit Intangible |
A summary of core deposit intangible is as follows at December 31, 2007.
| (Dollars in thousands) | 2004 Acquisition | 2006 Acquisition | Total | |||||||||
Gross carrying amount | $ | 291 | 232 | 523 | ||||||||
Less accumulated amortization | (129 | ) | (31 | ) | (160 | ) | ||||||
Net carrying amount | $ | 162 | 201 | 363 | ||||||||
The core deposit intangibles for the acquisitions are being amortized over the weighted average useful life of 8 years, with no estimated residual value.
Amortization expense amounted to $66,000 in 2007 and $39,000 in 2006.
The estimated amortization expense of intangible assets for each of the five succeeding fiscal years is $65,000 per year.
| (18) | Regulatory Matters |
The Bank is subject to various regulatory capital requirements administered by the federal and state banking agencies. Failure to meet minimum capital requirements can initiate certain mandatory and possibly additional discretionary actions by regulators that, if undertaken, could have a direct material effect on the Bank’s financial statements. The regulations require the Bank to meet specific capital adequacy guidelines that involve quantitative measures of the Bank’s assets, liabilities, and certain off-balance sheet items as calculated under regulatory accounting practices. The Bank’s capital classification is also subject to qualitative judgments by the regulators about components, risk weightings and other factors.
20
| MID PENN BANCORP, INC. | NOTES TO CONSOLIDATED FINANCIAL STATEMENTS |
Quantitative measures established by regulation to ensure capital adequacy require the Bank to maintain minimum amounts and ratios (set forth in the table below) of Tier I capital (as defined in the regulations) to total average assets (as defined), and minimum ratios of Tier I and total capital (as defined) to risk-weighted assets (as defined). To be considered adequately capitalized (as defined) under the regulatory framework for prompt corrective action, the Bank must maintain minimum Tier I leverage, Tier I risk-based and total risk-based ratios as set forth in the table. The Bank’s actual capital amounts and ratios are also presented in the table.
| Capital Adequacy | ||||||||||||||
(Dollars in thousands) | Actual: | Minimum Capital Required: | To Be Well-Capitalized Under Prompt Corrective Action Provisions: | |||||||||||
As of December 31, 2007: | Amount | Ratio | Amount | Ratio | Amount | Ratio | ||||||||
Tier I Capital (to Average Assets) | $ | 38,591 | 7.6% | 20,115 | 4.0% | 25,144 | 5.0% | |||||||
Tier I Capital (to Risk Weighted Assets) | 38,591 | 9.4 | 16,303 | 4.0 | 24,454 | 6.0 | ||||||||
Total Capital (to Risk Weighted Assets) | 43,381 | 10.6 | 32,605 | 8.0 | 40,753 | 10.0 | ||||||||
As of December 31, 2006: | ||||||||||||||
Tier I Capital (to Average Assets) | $ | 36,833 | 7.9% | 18,677 | 4.0% | 23,346 | 5.0% | |||||||
Tier I Capital (to Risk Weighted Assets) | 36,833 | 9.4 | 15,610 | 4.0 | 23,414 | 6.0 | ||||||||
Total Capital (to Risk Weighted Assets) | 41,020 | 10.5 | 31,219 | 8.0 | 39,024 | 10.0 | ||||||||
As of December 31, 2007, the Bank’s capital ratios are in excess of the minimum and well-capitalized guidelines and MPB’s capital ratios are in excess of the Bank’s capital ratios.
| (19) | Concentration of Risk and Off-Balance Sheet Risk |
The Bank is a party to financial instruments with off-balance sheet risk in the normal course of business to meet the financing needs of its customers. These financial instruments include commitments to extend credit and financial standby letters of credit. Those instruments involve, to varying degrees, elements of credit and interest rate risk in excess of the amount recognized in the consolidated balance sheets.
The Bank evaluates each customer’s creditworthiness on a case-by-case basis. The amount of collateral obtained, if deemed necessary by the Bank upon extension of credit, is based on management’s credit evaluation of the borrower. Collateral held varies but may include accounts receivable, inventory, property, plant, and equipment, and income-producing commercial properties. The Bank’s exposure to credit loss in the event of nonperformance by the other party to the financial instrument for commitments to extend credit and financial standby letters of credit written is represented by the contractual amount of those instruments. The Bank uses the same credit policies in making commitments and conditional obligations as it does for direct, funded loans.
Commitments to extend credit are agreements to lend to a customer as long as there is no violation of any condition established in the contract. Commitments generally have fixed expiration dates or other termination clauses and may require payment of a fee. Since many of the commitments are expected to expire without being drawn upon, the total commitment amounts do not necessarily represent future cash requirements.
Financial standby letters of credit are conditional commitments issued by the Bank to guarantee the performance of a customer to a third party. The credit risk involved in issuing letters of credit is essentially the same as that involved in extending loan facilities to customers. The term of these financial standby letters of credit is generally one year or less.
As of December 31, 2007, commitments to extend credit amounted to $88,148,000 and financial standby letters of credit amounted to $11,480,000.
Significant concentration of credit risk may occur when obligations of the same parties engaged in similar activities occur and accumulate in significant amounts.
In analyzing the Bank’s exposure to significant concentration of credit risk, management set a parameter of 10% or more of the Bank’s total net loans outstanding as the threshold in determining whether the obligations of the same or affiliated parties would be classified as significant concentration of credit risk. Concentrations by industry, product line, type of collateral, etc., are also considered. U.S. Treasury securities, obligations of U.S. government agencies and corporations, and any assets collateralized by the same were excluded.
As of December 31, 2007, commercial real estate financing was the only similar activity that met the requirements to be classified as a significant concentration of credit risk. However, there is a geographical concentration in that most of the Bank’s business activity is with customers located in Central Pennsylvania, specifically within the Bank’s trading area made up of Dauphin County, lower Northumberland County, western Schuylkill County and Hampden Township in Cumberland County.
The Bank’s highest concentrations of credit are in the areas of apartment building financing and hotel/motel lodging financings. Outstanding credit to these sectors amounted to $34,839,000 or 9.3% and $30,634,000 or 8.2%, respectively, of net loans outstanding as of December 31, 2007.
21
| MID PENN BANCORP, INC. | NOTES TO CONSOLIDATED FINANCIAL STATEMENTS |
(20) Commitments and Contingencies Operating Lease: In April 2005, MPB entered into a non-cancelable operating lease agreement to lease approximately 2,500 square feet of office space in the downtown Harrisburg area, with the initial term extending through March 2010. MPB has the option to renew this lease for two additional five-year periods. MPB also has a lease on its Halifax office, which currently runs through January of 2009.
Minimum future rental payments under this operating lease as of December 31, 2007, for each of the next 3 years and in the aggregate are:
| |||||||||||
| 2008 | $ | 88,094 | |||||||||
| 2009 | 66,634 | ||||||||||
| 2010 | 23,100 | ||||||||||
| $ | 177,828 | ||||||||||
Litigation: MPB is subject to lawsuits and claims arising out of its business. In the opinion of management, after consultation with legal counsel, the ultimate disposition of these matters is not expected to have a material adverse effect on the consolidated financial condition of MPB.
(21) Parent Company Statements The condensed balance sheet, statement of income and statement of cash flows for Mid Penn Bancorp, Inc., parent only, are presented below:
| |||||||||||||
CONDENSED BALANCE SHEET December 31, 2007 and 2006 (Dollars in thousands)
| 2007 | 2006 | |||||||||||
| ASSETS | |||||||||||||
Cash | $ | 152 | 277 | ||||||||||
Investment in Subsidiaries | 40,292 | 38,808 | |||||||||||
Total Assets | $ | 40,444 | 39,085 | ||||||||||
| LIABILITIES AND STOCKHOLDERS’ EQUITY | |||||||||||||
Stockholders’ Equity | $ | 41,584 | 39,719 | ||||||||||
Less Treasury Stock | (1,140 | ) | (634 | ) | |||||||||
Total Liabilities and Equity | $ | 40,444 | 39,085 | ||||||||||
| CONDENSED STATEMENT OF INCOME | |||||||||||||
For Years Ended December 31, 2007, 2006 and 2005 | |||||||||||||
(Dollars in thousands) | 2007 | 2006 | 2005 | ||||||||||
Dividends from Subsidiaries | $ | 3,224 | 2,864 | 2,643 | |||||||||
Other Income from Subsidiaries | 37 | 61 | 47 | ||||||||||
Undistributed Earnings of Subsidiaries | 1,517 | 2,134 | 2,051 | ||||||||||
Other Expenses | (107 | ) | (171 | ) | (138) | ||||||||
Net Income | $ | 4,671 | 4,888 | 4,603 | |||||||||
CONDENSED STATEMENT OF CASH FLOWS For Years Ended December 31, 2007, 2006 and 2005 (Dollars in thousands) | |||||||||||||
| 2007 | 2006 | 2005 | |||||||||||
| CASH FLOWS FROM OPERATING ACTIVITIES | |||||||||||||
Net Income | $ | 4,671 | 4,888 | 4,603 | |||||||||
Undistributed Earnings of Subsidiaries | (1,517 | ) | (2,134 | ) | (2,051) | ||||||||
Net Cash Provided By Operating Activities | 3,154 | 2,754 | 2,552 | ||||||||||
22
| MID PENN BANCORP, INC. | NOTES TO CONSOLIDATED FINANCIAL STATEMENTS |
CASH FLOWS FROM FINANCING ACTIVITIES | ||||||||||
Dividends Paid | (2,773 | ) | (2,652 | ) | (2,552 | ) | ||||
Purchase of Treasury Stock | (506 | ) | (98 | ) | 0 | |||||
Net Cash Used In Financing Activities | (3,279 | ) | (2,750 | ) | (2,552 | ) | ||||
Net (Decrease) Increase in Cash | (125 | ) | 4 | 0 | ||||||
Cash at Beginning of Period | 277 | 273 | 273 | |||||||
Cash at End of Period | $ | 152 | 277 | 273 | ||||||
| (22) | Fair Value of Financial Instruments |
SFAS No. 107, “Disclosures about Fair Value of Financial Instruments,” requires disclosures of fair value information about financial instruments, whether or not recognized in the consolidated balance sheet, for which it is practical to estimate that value. In cases where quoted market values are not available, fair values are based on estimates using present value or other valuation techniques. Those techniques are significantly affected by the assumptions used, including the discount rate and estimates of future cash flows. In that regard, the derived fair value estimates cannot be substantiated by comparison to independent markets, and in many cases, could not be realized in immediate settlement of the instrument. Accordingly, the aggregate fair value amounts presented do not represent the underlying value of MPB.
The following methodologies and assumptions were used to estimate the fair value of MPB’s financial instruments:
Cash and due from banks:
The carrying value of cash and due from banks is considered to be a reasonable estimate of fair value.
Interest-bearing balances with other financial institutions:
The estimate of fair value was determined by comparing the present value of quoted interest rates on like deposits with the weighted average yield and weighted average maturity of the balances.
Investment securities:
As indicated in Note 7, estimated fair values of investment securities are based on quoted market prices, where applicable. If quoted market prices are not available, fair values are based on quoted market prices for comparable instruments, adjusted for differences between the quoted instruments and the instruments being valued.
Loans:
The loan portfolio was segregated into pools of loans with similar economic characteristics and was further segregated into fixed rate and variable rate and each pool was treated as a single loan with the estimated fair value based on the discounted value of expected future cash flows. Fair value of loans with significant collectibility concerns (that is, problem loans and potential problem loans) was determined on an individual basis using an internal rating system and appraised values of each loan. Assumptions regarding problem loans are judgmentally determined using specific borrower information.
Deposits:
The fair value for demand deposits (e.g., interest and noninterest checking, savings and money market deposit accounts) are by definition, equal to the amount payable on demand at the reporting date (i.e. their carrying amounts). Fair value for fixed-rate certificates of deposit was estimated using a discounted cash flow calculation by combining all fixed-rate certificates into a pool with a weighted average yield and a weighted average maturity for the pool and comparing the pool with interest rates currently being offered on a similar maturity.
Short-term borrowings:
Because of time to maturity, the estimated fair value of short-term borrowings approximates the book value.
Long-term debt:
The estimated fair values of long-term debt were determined using discounted cash flow analysis, based on borrowing rates for similar types of borrowing arrangements.
Accrued interest:
The carrying amounts of accrued interest approximates their fair values. The following table summarizes the book value and fair value of financial instruments at December 31, 2007 and 2006.
23
| MID PENN BANCORP, INC. | NOTES TO CONSOLIDATED FINANCIAL STATEMENTS |
| (Dollars in thousands) | December 31, 2007 | December 31, 2006 | ||||||||
| Financial assets: | Book Value | Fair Value | Book Value | Fair Value | ||||||
Cash and due from banks | $ | 10,599 | 10,599 | 9,498 | 9,498 | |||||
Interest-bearing balances | 46,830 | 46,830 | 46,921 | 46,921 | ||||||
Investment securities | 54,072 | 54,072 | 57,261 | 57,261 | ||||||
Net loans | 372,338 | 382,254 | 354,386 | 355,155 | ||||||
| December 31, 2007 | December 31, 2006 | |||||||||
(Dollars in thousands) Financial liabilities: | Book Value | Fair Value | Book Value | Fair Value | ||||||
Deposits | $ | 372,817 | 377,919 | 364,226 | 364,110 | |||||
Short-term borrowings | 37,349 | 37,349 | 24,275 | 24,275 | ||||||
Accrued interest | 1,990 | 1,990 | 1,912 | 1,912 | ||||||
Long-term debt | 54,581 | 56,524 | 59,713 | 60,042 | ||||||
Off-balance sheet financial instruments: | ||||||||||
Commitments to extend credit | $ | 88,148 | 88,148 | 75,051 | 75,051 | |||||
Financial standby letters of credit | 11,480 | 11,480 | 11,163 | 11,163 | ||||||
| (23) | Common Stock |
MPB has reserved 50,000 of authorized, but unissued shares of its common stock for issuance under a Stock Bonus Plan (the “Plan”). Shares issued under the Plan are at the discretion of the board of directors.
Under MPB’s amended and restated dividend reinvestment plan, (DRIP), two hundred thousand shares of MPB’s authorized but unissued common stock are reserved for issuance. The DRIP also allows for voluntary cash payments within specified limits, for the purchase of additional shares.
In September of 2005, Mid Penn Bancorp’s Board of Directors approved a Stock Repurchase Program under which the Corporation could buy back up to 250,000 shares of Mid Penn Bancorp Common Stock. Through December 31, 2007, 24,650 shares have been repurchased at an average price of $24.44 per share.
| (24) | Summary of Quarterly Consolidated Financial Data (Unaudited) |
The following table presents summarized quarterly financial data for 2007, 2006 and 2005.
(Dollars in Thousands, Except Per Share Data) | 2007 Quarter Ended | |||||||||
| Mar. 31 | June 30 | Sept. 30 | Dec. 31 | |||||||
Interest Income | $ | 7,705 | 7,780 | 7,950 | 8,010 | |||||
Interest Expense | 3,727 | 3,766 | 3,892 | 3,954 | ||||||
Net Interest Income | 3,978 | 4,014 | 4,058 | 4,056 | ||||||
Provision for Loan Losses | 75 | 125 | 175 | 550 | ||||||
Net Interest Income After Provision for Loan Losses | 3,903 | 3,889 | 3,883 | 3,506 | ||||||
Other Income | 837 | 836 | 749 | 1,029 | ||||||
Securities Gains | 0 | 0 | 0 | 0 | ||||||
Gain on Sale of Loans | 0 | 21 | 0 | 0 | ||||||
Other Expenses | 3,291 | 3,190 | 3,050 | 3,057 | ||||||
Income Before Income Tax Provision | 1,449 | 1,556 | 1,582 | 1,478 | ||||||
Income Tax Provision | 365 | 377 | 372 | 280 | ||||||
Net Income | $ | 1,084 | 1,179 | 1,210 | 1,198 | |||||
Earnings Per Share | $ | .32 | .34 | .35 | .33 | |||||
24
| MID PENN BANCORP, INC. | NOTES TO CONSOLIDATED FINANCIAL STATEMENTS |
(Dollars in Thousands, Except Per Share Data) | 2006 Quarter Ended | ||||||||||||
| Mar. 31 | June 30 | Sept. 30 | Dec. 31 | ||||||||||
Interest Income | $ | 6,580 | 6,962 | 7,104 | 7,568 | ||||||||
Interest Expense | 2,807 | 3,071 | 3,290 | 3,564 | |||||||||
Net Interest Income | 3,773 | 3,891 | 3,814 | 4,004 | |||||||||
Provision for Loan Losses | 135 | 225 | 75 | 300 | |||||||||
Net Interest Income After Provision for Loan Losses | 3,638 | 3,666 | 3,739 | 3,704 | |||||||||
Other Income | 673 | 741 | 723 | 754 | |||||||||
Securities Gains | 0 | 0 | 33 | 0 | |||||||||
Gain (Loss) on Sale of Other Real Estate | 152 | 0 | (21 | ) | (27 | ) | |||||||
Other Expenses | 2,914 | 2,895 | 2,785 | 2,669 | |||||||||
Income Before Income Tax Provision | 1,549 | 1,512 | 1,689 | 1,762 | |||||||||
Income Tax Provision | 394 | 395 | 447 | 388 | |||||||||
Net Income | $ | 1,155 | 1,117 | 1,242 | 1,374 | ||||||||
Earnings Per Share | $ | .34 | .33 | .37 | .42 | ||||||||
(Dollars in Thousands, Except Per Share Data) | 2005 Quarter Ended | ||||||||||||
| Mar. 31 | June 30 | Sept. 30 | Dec. 31 | ||||||||||
Interest Income | $ | 5,348 | 5,663 | 5,982 | 6,301 | ||||||||
Interest Expense | 2,103 | 2,284 | 2,492 | 2,678 | |||||||||
Net Interest Income | 3,245 | 3,379 | 3,490 | 3,623 | |||||||||
Provision (Credit) for Loan Losses | 60 | 110 | 280 | (225 | ) | ||||||||
Net Interest Income After Provision (Credit) for Loan Losses | 3,185 | 3,269 | 3,210 | 3,848 | |||||||||
Other Income | 732 | 686 | 817 | 698 | |||||||||
Securities Gains | 0 | 1 | 0 | 0 | |||||||||
Gain on Sale of Loans | 0 | 0 | 19 | 0 | |||||||||
Other Expenses | 2,540 | 2,621 | 2,527 | 2,574 | |||||||||
Income Before Income Tax Provision | 1,377 | 1,335 | 1,519 | 1,972 | |||||||||
Income Tax Provision | 360 | 333 | 387 | 520 | |||||||||
Net Income | $ | 1,017 | 1,002 | 1,132 | 1,452 | ||||||||
Earnings Per Share | $ | .30 | .30 | .34 | .43 | ||||||||
| (25) | Recent Accounting Pronouncements |
In February 2007, the Financial Accounting Standards Board (“FASB”) issued Statement of Financial Accounting Standards No. 159, “The Fair Value Option for Financial Assets and Liabilities,” including an amendment of FASB Statement No. 115 (“SFAS 159”). SFAS 159 permits entities to choose to measure many financial instruments and certain other items at fair value that are not currently required to be measured at fair value. It also establishes presentation and disclosure requirements designed to facilitate comparisons between entities that choose different measurement attributes for similar types of assets and liabilities. SFAS 159 is effective as of the beginning of an entity’s first fiscal year that begins after November 15, 2007. The Corporation is currently evaluating the impact of the adoption of this pronouncement on its consolidated financial statements.
In March 2007, the FASB ratified Emerging Issues Task Force Issue No. 06-10 (“EITF 06-10”), Accounting for Collateral Assignment Split-Dollar Life Insurance Agreements. EITF 06-10 provides guidance for determining a liability for the postretirement benefit obligation as well as recognition and measurement of the associated asset on the basis of the terms of the collateral assignment agreement. EITF 06-10 is effective for fiscal years beginning after December 15, 2007. The Corporation is currently evaluating the impact that the adoption of the EITF will have on its financial statements.
In September 2006, the FASB issued SFAS No. 157, Fair Value Measurements (“SFAS 157”), to establish a consistent framework for measuring fair value measurements. The provisions of SFAS 157 are effective beginning in 2008 and are not expected to have a material effect on its financial statements.
25
| MID PENN BANCORP, INC. | MANAGEMENT’S DISCUSSION AND ANALYSIS |
The purpose of this discussion is to further detail the financial condition and results of operations of Mid Penn Bancorp, Inc. (MPB) or Company. MPB is not aware of any known trends, events, uncertainties or of any current recommendations by the regulatory authorities which, if they were to be implemented, would have a material effect on MPB’s liquidity, capital resources or operations. This discussion should be read along with the consolidated financial statements also appearing in this report.
Financial Summary
The consolidated earnings of MPB are derived primarily from the operations of its wholly-owned subsidiary, Mid Penn Bank.
MPB earned net income of $4,671,000 for the year 2007, compared to $4,888,000 in 2006, which was a decrease of $397,000 or 4.4%. This represents net income in 2007 of $1.34 per share compared to $1.39 per share in 2006 and $1.31 per share in 2005.
Total assets of MPB continued to grow in 2007, reaching the level of $509,757,000, an increase of $18,063,000 or 3.7% over $491,694,000 at year end 2006. The majority of growth came from increases in commercial real estate loans in the Capital Region. These increases were funded primarily through growth in deposits, along with increased short-term borrowings.
MPB continued to achieve a solid return on average shareholders’ equity, (ROE), a widely recognized performance indicator in the financial industry. The ROE was 11.84% in 2007, 12.93% in 2006 and 12.87% in 2005. Return on average assets (ROA), another performance indicator, was 0.94% in 2007, 1.08% in 2006 and 1.10% in 2005.
MPB maintained strong fundamental performance in 2007 despite intense local rate competition, general economic slowing and credit issues throughout the banking industry as a whole. Even though MPB spent more on marketing and business development in 2007 than in past years, growth in loans and deposits in its market was very difficult. Two direct competitors of the bank were being acquired through mergers and were offering very aggressive rates, particularly on deposits. Consequently, management decided not to pursue an aggressive growth strategy during the year and turned to wholesale funding and short-term borrowings to fund its slower asset growth. MPB did not participate in subprime lending and hence faired better than many banks in the industry who were faced with problems associated with these lending practices during 2007.
The Bank’s tier one capital (to risk weighted assets) of $38,591,000 or 9.4% and total capital (to risk weighted assets) of $43,381,000 or 10.6% at December 31, 2007, are above the regulatory requirement, which is 4% for tier one capital and 8% for total capital. Tier one capital consists primarily of the bank’s stockholders’ equity. Total capital includes qualifying subordinated debt, if any, and the allowance for loan and lease losses, within permitted limits. Risk-weighted assets are determined by assigning various levels of risk to different categories of assets and off-balance sheet activities.
In September 2007, MPB opened a new office located at 2101 Market Street in Camp Hill, Cumberland County.
Critical Accounting Policies
Management of the Company considers the accounting policy relating to the allowance for loan and lease losses to be a critical accounting policy given the uncertainty in evaluating the level of the allowance required to cover credit losses inherent in the loan and lease portfolio and the material effect that such judgments can have on the results of operations. While management’s current evaluation of the allowance indicates that the allowance is adequate, under adversely different conditions or assumptions, the allowance may need to be increased. For example, if historical loan loss experience significantly worsened or if current economic conditions significantly deteriorated, additional provisions for loan losses may be required to increase the allowance. In addition, the assumptions and estimates used in the internal reviews of the Company’s non-performing loans and potential problem loans have a significant impact on the overall analysis of the adequacy of the allowance. While management has concluded that the current evaluation of collateral values is reasonable under the circumstances, if collateral evaluations were significantly lowered, the Company’s allowance may also require additional provisions for loan and lease losses.
Net Interest Income
Net interest income, MPB’s primary source of revenue, represents the difference between interest income and interest expense. Net interest income is affected by changes in interest rates and changes in average balances (volume) in the various interest-sensitive assets and liabilities.
During 2007, net interest income increased $623,000 or 4.0% as compared to an increase of $1,745,000 or 12.7% in 2006. The average balances, effective interest differential, and interest yields for the years ended December 31, 2007, 2006, and 2005 and the components of net interest income, are presented in Table 1. A comparative presentation of the changes in net interest income for 2007 compared to 2006, and 2006 compared to 2005, is given in Table 2. This analysis indicates the changes in interest income and interest expense caused by the volume and rate components of interest earning assets and interest bearing liabilities.
The yield on earning assets increased to 6.99% in 2007 from 6.80% in 2006. The yield on earning assets for 2005 was 6.10%. The change in the yield on earning assets was due primarily to changes in market interest rates and extreme rate competition within our market. The average “prime rate” for 2007 was 8.06% as compared to 7.96% for 2006 and 6.19% for 2005.
26
| MID PENN BANCORP, INC. | MANAGEMENT’S DISCUSSION AND ANALYSIS |
Interest expense increased by $2,607,000 or 20.5% in 2007 as compared to $3,175,000 or 33.2% in 2006.
Net interest margin, on a tax equivalent basis, influenced by fluctuations in interest rates in 2007 was 3.68% compared to 3.82% in 2006 and 3.67% in 2005. Management continues to closely monitor the net interest margin.
TABLE 1: AVERAGE BALANCES, EFFECTIVE INTEREST DIFFERENTIAL AND INTEREST YIELDS
INCOME AND RATES ON A TAXABLE EQUIVALENT BASIS
FOR YEAR ENDED DECEMBER 31, 2007
(Dollars in thousands) | Average Balance | Interest Income/Expense | Average Rates Earned/Paid | |||||||||||||
ASSETS: | ||||||||||||||||
Interest Bearing Balances | $ | 46,900 | 2,546 | 5.43% | ||||||||||||
Investment Securities: | ||||||||||||||||
Taxable | 25,043 | 1,150 | 4.59% | |||||||||||||
Tax-Exempt | 29,726 | 2,062 | 6.94% | |||||||||||||
| Total Investment Securities | 54,769 | |||||||||||||||
Federal Funds Sold | 624 | 33 | 5.29% | |||||||||||||
Loans and Leases, Net | 361,324 | 26,592 | 7.36% | |||||||||||||
Total Earning Assets | 463,617 | 32,383 | 6.99% | |||||||||||||
Cash and Due from Banks | 7,559 | |||||||||||||||
Other Assets | 25,012 | |||||||||||||||
| Total Assets | $ | 496,188 | ||||||||||||||
LIABILITIES & STOCKHOLDERS’ EQUITY: | ||||||||||||||||
Interest Bearing Deposits: | ||||||||||||||||
NOW | $ | 35,048 | 144 | 0.41% | ||||||||||||
Money Market | 63,927 | 2,208 | 3.45% | |||||||||||||
Savings | 25,513 | 72 | 0.28% | |||||||||||||
Time | 203,671 | 9,006 | 4.42% | |||||||||||||
Short-term Borrowings | 22,528 | 1,049 | 4.66% | |||||||||||||
Long-term Debt | 56,908 | 2,860 | 5.03% | |||||||||||||
Total Interest Bearing Liabilities | 407,595 | 15,339 | 3.76% | |||||||||||||
Demand Deposits | 44,021 | |||||||||||||||
Other Liabilities | 5,734 | |||||||||||||||
Stockholders’ Equity | 38,838 | |||||||||||||||
| Total Liabilities and Stockholders’ Equity | $ | 496,188 | ||||||||||||||
Net Interest Income | $ | 17,044 | ||||||||||||||
Net Yield on Interest Earning Assets: | ||||||||||||||||
Total Yield on Earning Assets | 6.99% | |||||||||||||||
Rate on Supporting Liabilities | 3.31% | |||||||||||||||
Average Interest Spread | 3.22% | |||||||||||||||
Net Interest Margin | 3.68% | |||||||||||||||
27
| MID PENN BANCORP, INC. | MANAGEMENT’S DISCUSSION AND ANALYSIS |
TABLE 1: AVERAGE BALANCES, EFFECTIVE INTEREST DIFFERENTIAL AND INTEREST YIELDS (cont’d)
INCOME AND RATES ON A TAXABLE EQUIVALENT BASIS
FOR YEAR ENDED DECEMBER 31, 2006
(Dollars in thousands) | Average Balance | Interest Income/Expense | Average Rates Earned/Paid | |||||||||
ASSETS: | ||||||||||||
Interest Bearing Balances | $ | 46,038 | $ | 2,225 | 4.83% | |||||||
Investment Securities: | ||||||||||||
Taxable | 27,343 | 1,218 | 4.45% | |||||||||
Tax-Exempt | 28,402 | 1,950 | 6.87% | |||||||||
Total Investment Securities | 55,745 | |||||||||||
Federal Funds Sold | 564 | 29 | 5.14% | |||||||||
Loans and Leases, Net | 324,720 | 23,598 | 7.27% | |||||||||
Total Earning Assets | 427,067 | 29,020 | 6.80% | |||||||||
Cash and Due from Banks | 7,000 | |||||||||||
Other Assets | 19,100 | |||||||||||
Total Assets | $ | 453,167 | ||||||||||
LIABILITIES & STOCKHOLDERS’ EQUITY: | ||||||||||||
Interest Bearing Deposits: | ||||||||||||
NOW | $ | 31,877 | 90 | 0.28% | ||||||||
Money Market | 60,968 | 1,898 | 3.11% | |||||||||
Savings | 24,772 | 61 | 0.25% | |||||||||
Time | 172,792 | 6,819 | 3.95% | |||||||||
Short-term Borrowings | 14,937 | 686 | 4.59% | |||||||||
Long-term Debt | 63,329 | 3,178 | 5.02% | |||||||||
Total Interest Bearing Liabilities | 368,675 | 12,732 | 3.45% | |||||||||
Demand Deposits | 43,161 | |||||||||||
Other Liabilities | 3,527 | |||||||||||
Stockholders’ Equity | 37,804 | |||||||||||
Total Liabilities and Stockholders’ Equity | $ | 453,167 | ||||||||||
Net Interest Income | $ | 16,288 | ||||||||||
Net Yield on Interest Earning Assets: | ||||||||||||
Total Yield on Earning Assets | 6.80% | |||||||||||
Rate on Supporting Liabilities | 2.98% | |||||||||||
Average Interest Spread | 3.35% | |||||||||||
Net Interest Margin | 3.82% | |||||||||||
28
| MID PENN BANCORP, INC. | MANAGEMENT’S DISCUSSION AND ANALYSIS |
TABLE 1: AVERAGE BALANCES, EFFECTIVE INTEREST DIFFERENTIAL AND INTEREST YIELDS (cont’d)
INCOME AND RATES ON A TAXABLE EQUIVALENT BASIS
FOR YEAR ENDED DECEMBER 31, 2005
(Dollars in thousands) | Average Balance | Interest Income/Expense | Average Rates Earned/Paid | |||||||||
ASSETS: | ||||||||||||
Interest Bearing Balances | $ | 58,735 | $ | 2,067 | 3.52% | |||||||
Investment Securities: | ||||||||||||
Taxable | 23,081 | 893 | 3.87% | |||||||||
Tax-Exempt | 22,866 | 1,561 | 6.83% | |||||||||
Total Investment Securities | 45,947 | |||||||||||
Federal Funds Sold | 1,623 | 53 | 3.27% | |||||||||
Loans and Leases, Net | 287,185 | 19,427 | 6.76% | |||||||||
Total Earning Assets | 393,490 | 24,001 | 6.10% | |||||||||
Cash and Due from Banks | 6,940 | |||||||||||
Other Assets | 18,218 | |||||||||||
Total Assets | $ | 418,648 | ||||||||||
LIABILITIES & STOCKHOLDERS’ EQUITY: | ||||||||||||
Interest Bearing Deposits: | ||||||||||||
NOW | $ | 32,507 | 58 | 0.18% | ||||||||
Money Market | 50,913 | 1,073 | 2.11% | |||||||||
Savings | 28,179 | 69 | 0.24% | |||||||||
Time | 158,935 | 5,321 | 3.35% | |||||||||
Short-term Borrowings | 7,498 | 203 | 2.71% | |||||||||
Long-term Debt | 59,021 | 2,833 | 4.80% | |||||||||
Total Interest Bearing Liabilities | 337,053 | 9,557 | 2.84% | |||||||||
Demand Deposits | 41,484 | |||||||||||
Other Liabilities | 4,332 | |||||||||||
Stockholders’ Equity | 35,779 | |||||||||||
Total Liabilities and Stockholders’ Equity | $ | 418,648 | ||||||||||
Net Interest Income | $ | 14,444 | ||||||||||
Net Yield on Interest Earning Assets: | ||||||||||||
Total Yield on Earning Assets | 6.10% | |||||||||||
Rate on Supporting Liabilities | 2.43% | |||||||||||
Average Interest Spread | 3.26% | |||||||||||
Net Interest Margin | 3.67% | |||||||||||
Interest and average rates are presented on a fully taxable equivalent basis, using an effective tax rate of 34%. For purposes of calculating loan yields, average loan balances include nonaccrual loans.
Loan fees of $604,000, $748,000 and $492,000 are included with interest income in Table 1 for the years 2007, 2006 and 2005, respectively.
29
| MID PENN BANCORP, INC. | MANAGEMENT’S DISCUSSION AND ANALYSIS |
TABLE 2: VOLUME ANALYSIS OF CHANGES IN NET INTEREST INCOME
(Dollars in thousands)
| 2007 Compared to 2006 Increase (Decrease) Due to Change In: |
| 2006 Compared to 2005 Increase (Decrease) Due to Change In: |
| ||||||||||||||||||
Taxable Equivalent Basis | Volume | Rate | Net | Volume | Rate | Net | |||||||||||||||
INTEREST INCOME: | |||||||||||||||||||||
Interest Bearing Balances | $ | 42 | 279 | 321 | (447 | ) | 605 | 158 | |||||||||||||
Investment Securities: | |||||||||||||||||||||
Taxable | (102 | ) | 34 | (68 | ) | 165 | 160 | 325 | |||||||||||||
Tax-Exempt | 91 | 21 | 112 | 378 | 11 | 389 | |||||||||||||||
Total Investment Securities | (11 | ) | 55 | 44 | 543 | 171 | 714 | ||||||||||||||
Federal Funds Sold | 3 | 1 | 4 | (35 | ) | 11 | (24 | ) | |||||||||||||
Loans and Leases, Net | 2,661 | 333 | 2,994 | 2,537 | 1,634 | 4,171 | |||||||||||||||
Total Interest Income | 2,695 | 668 | 3,363 | 2,598 | 2,421 | 5,019 | |||||||||||||||
INTEREST EXPENSE: | |||||||||||||||||||||
Interest Bearing Deposits: | |||||||||||||||||||||
NOW | 9 | 45 | 54 | (1 | ) | 33 | 32 | ||||||||||||||
Money Market | 92 | 218 | 310 | 212 | 613 | 825 | |||||||||||||||
Savings | 2 | 9 | 11 | (8 | ) | 0 | (8 | ) | |||||||||||||
Time | 1,220 | 967 | 2,187 | 464 | 1,034 | 1,498 | |||||||||||||||
Total Interest Bearing Deposits | 1,323 | 1,239 | 2,562 | 667 | 1,680 | 2,347 | |||||||||||||||
Short-term Borrowings | 348 | 15 | 363 | 202 | 281 | 483 | |||||||||||||||
Long-term Debt | (322 | ) | 4 | (318 | ) | 207 | 138 | 345 | |||||||||||||
Total Interest Expense | 1,349 | 1,258 | 2,607 | 1,076 | 2,099 | 3,175 | |||||||||||||||
NET INTEREST INCOME | $ | 1,346 | (590 | ) | 756 | 1,522 | 322 | 1,844 | |||||||||||||
The effect of changing volume and rate has been allocated entirely to the rate column. Tax-exempt income is shown on a tax equivalent basis assuming a federal income tax rate of 34%.
Provision for Loan and Lease Losses
The provision for loan and lease losses charged to operating expense represents the amount deemed appropriate by management to maintain an adequate allowance for possible loan and lease losses. Following its model for loan and lease loss allowance adequacy, management made a $925,000 provision in 2007 as well as a provision of $735,000 in 2006 and $225,000 in 2005. The allowance for loan and lease losses as a percentage of total loans was 1.27% at December 31, 2007, compared to 1.17% at December 31, 2006 and 1.18% at December 31, 2005, which has been higher than that of peer financial institutions due to MPB’s higher level of loans to finance commercial real estate. The higher 2007 provision was due to downgrades in several commercial loan classifications and the reclassification of a large lease relationship into non-accrual status. The loans purchased through the Omega branch acquisition, currently $9.6 million in total, were recorded in December 2006 at fair value with no related allowance for loan losses. These loans were not included in the adequacy model in December of 2006. A summary of charge-offs and recoveries of loans and leases is presented in Table 3.
30
| MID PENN BANCORP, INC. | MANAGEMENT’S DISCUSSION AND ANALYSIS |
TABLE 3: ANALYSIS OF THE ALLOWANCE FOR LOAN AND LEASE LOSSES
(Dollars in thousands)
| Years ended December 31, | |||||||||||
| 2007 | 2006 | 2005 | 2004 | 2003 | |||||||
Balance, beginning of year | $ | 4,187 | 3,704 | 3,643 | 2,992 | 3,051 | |||||
Loans and leases charged-off: | |||||||||||
Commercial real estate, construction and land development | 0 | 17 | 32 | 25 | 171 | ||||||
Commercial, industrial and agricultural | 100 | 158 | 29 | 10 | 140 | ||||||
Real estate-residential | 0 | 0 | 0 | 8 | 0 | ||||||
Consumer | 231 | 134 | 138 | 78 | 98 | ||||||
Leases | 129 | 0 | 0 | 0 | 0 | ||||||
Total loans and leases charged-off | 460 | 309 | 199 | 121 | 409 | ||||||
Recoveries on loans and leases previously charged-off: | |||||||||||
Commercial real estate, construction and land development | 0 | 0 | 0 | 0 | 0 | ||||||
Commercial, industrial and agricultural | 5 | 3 | 12 | 8 | 14 | ||||||
Real estate-residential | 0 | 0 | 0 | 0 | 0 | ||||||
Consumer | 49 | 54 | 23 | 39 | 46 | ||||||
Leases | 84 | 0 | 0 | 0 | 0 | ||||||
Total loans and leases recovered | 138 | 57 | 35 | 47 | 60 | ||||||
Net charge-offs | 322 | 252 | 164 | 74 | 349 | ||||||
Provision for loan and lease losses | 925 | 735 | 225 | 725 | 290 | ||||||
Balance, end of year | $ | 4,790 | 4,187 | 3,704 | 3,643 | 2,992 | |||||
Ratio of net charge-offs during the year to average loans and leases outstanding during the year, net of unearned discount | .09% | .08% | .06% | .03% | .14% | ||||||
Allowance for loan and lease losses as a percentage of total loans and leases on 12/31/07 | 1.27% | 1.17% | 1.18% | 1.30% | 1.28% | ||||||
Noninterest Income
During 2007, MPB earned $3,481,000 in noninterest income, compared to $3,028,000 earned in 2006 and $2,953,000 earned in 2005.
Non-interest income in 2007 includes $180,000 of death benefit on bank owned life insurance (BOLI) recognized upon the death of a retired director who passed away late in 2007.
Service charges on deposit accounts amounted to $1,499,000 for 2007, an increase of $123,000 or 8.93% compared to $1,376,000 for 2006, which was an increase of $28,000 or 2.1% above 2005. The majority of this increase is attributed to the addition of three new branches in Middletown, Steelton, and Camp Hill.
MPB owns cash surrender value of life insurance policies on its directors. The income on these policies amounted to $271,000 during the year 2007, $219,000 in 2006 and $222,000 in 2005.
Trust department income for 2007 was $319,000, a $61,000 or 23.6% increase from $258,000 in 2006, which was a $54,000 or 17.3% decrease from $312,000 in 2005. Trust Department income can fluctuate from year to year, due to the number of estates being settled during the year.
MPB also earned $155,000 in 2007, $112,000 in 2006, and $70,000 in 2005 in fees from the third-party seller of investments whose services the Bank has contracted. Other income amounted to $512,000 in 2007, $498,000 in 2006 and $578,000 in 2005.
31
| MID PENN BANCORP, INC. | MANAGEMENT’S DISCUSSION AND ANALYSIS |
Noninterest Expense
A summary of the major components of noninterest expense for the years ended December 31, 2007, 2006 and 2005 is reflected in Table 4. Noninterest expense increased to $12,596,000 in 2007 from $11,263,000 in 2006 and $10,262,000 in 2005. The major component of noninterest expense is salaries and employee benefits. The number of full-time equivalent employees increased from 133 to 143 during 2007. Increases in the 2007 workforce included the purchase and addition of the two Omega Bank branches and the Camp Hill branch. Marketing and advertising expense increased from $255,000 in 2006 to $403,000 in 2007, which is attributed to the promotions for the three new offices as well as advertising and promotional activity aimed at attracting customers in light of the mergers of two direct competitors. Occupancy and equipment expenses also increased in 2007 due to the addition of the three new offices, and the relocation of our Elizabethville office. CDI expense is the amortization expense over 8 years of the core deposit intangible resulting from acquistions. With the 2006 Omega branch acquisition the CDI expense increased from $39,000 in 2006 to $131,000 in 2007.
Another significant expense in 2007 was the continuing cost of complying with Section 404 of the Sarbanes-Oxley Act.
TABLE 4: NONINTEREST EXPENSE
(Dollars in thousands)
| Years ended December 31, | ||||||||
| 2007 | 2006 | 2005 | ||||||
Salaries and employee benefits | $ | 6,582 | 6,023 | 5,662 | ||||
Occupancy expense, net | 868 | 622 | 594 | |||||
Equipment expense | 1,064 | 838 | 734 | |||||
Pennsylvania bank shares tax expense | 329 | 286 | 259 | |||||
Legal and professional expense | 705 | 733 | 540 | |||||
Early withdrawal penalty on investment CDs | 0 | 191 | 0 | |||||
Marketing and advertising expense | 403 | 255 | 298 | |||||
ATM and debit card processing expense | 199 | 148 | 196 | |||||
Director fees and benefits expense | 294 | 241 | 221 | |||||
Computer expense | 434 | 378 | 308 | |||||
Stationery and supplies expense | 255 | 231 | 222 | |||||
Trust department expense | 54 | 57 | 41 | |||||
Postage expense | 152 | 139 | 149 | |||||
Leasing department expense | 32 | 12 | 18 | |||||
Meals, travel, and lodging expense | 111 | 90 | 76 | |||||
Donation expense | 97 | 60 | 60 | |||||
Internet banking expense | 88 | 59 | 42 | |||||
Courier expense | 107 | 92 | 81 | |||||
Insurance expense | 59 | 65 | 57 | |||||
Telephone | 30 | 85 | 91 | |||||
CDI expense | 131 | 39 | 36 | |||||
Dues and subscriptions expense | 65 | 56 | 43 | |||||
Ongoing education expense | 80 | 72 | 39 | |||||
Service charge expense | 88 | 76 | 80 | |||||
Overdraft insurance losses | 44 | 37 | 40 | |||||
Credit report expense | 64 | 55 | 57 | |||||
Other | 261 | 323 | 318 | |||||
Total Noninterest Expense | $ | 12,596 | 11,263 | 10,262 | ||||
Investments
MPB’s investment portfolio is utilized to provide liquidity and managed to maximize return within reasonable risk parameters.
MPB’s entire portfolio of investment securities is considered available for sale. As such, the investments are recorded at fair value. Our investments: US Treasury, Agency and Municipal securities are valued at a market price relative to investments of the same type with similar maturity dates. As the interest rate environment of these securities changes, the value of securities changes accordingly.
As of December 31, 2007, SFAS No. 115 (the marking of securities to market value) resulted in an increase in shareholders’ equity of $434,000 (unrealized gain on securities of $657,000 less estimated income tax expense of $223,000). At December 31, 2006, SFAS No. 115 resulted in an increase in the unrealized gain included in other comprehensive income of $291,000 (unrealized gain on securities of $441,000 less estimated income tax expense of $150,000) compared to a December 31, 2005 increase in the unrealized gain included in other comprehensive income of $231,000 (unrealized gain on securities of $352,000, less estimated income tax expense of $121,000). MPB does not have any significant concentrations within investment securities.
32
| MID PENN BANCORP, INC. | MANAGEMENT’S DISCUSSION AND ANALYSIS |
Table 5 provides a history of the amortized cost of investment securities at December 31, for each of the past three years. The unrealized gains and losses on investment securities are shown in Note 6 to the Consolidated Financial Statements.
TABLE 5: AMORTIZED COST OF INVESTMENT SECURITIES
(Dollars in thousands) | December 31, | |||||||
| 2007 | 2006 | 2005 | ||||||
. S. Treasury and U.S. government agencies | $ | 12,044 | 15,015 | 14,999 | ||||
Mortgage-backed U.S. government agencies | 6,862 | 9,041 | 8,112 | |||||
State and political subdivision obligations | 30,437 | 29,050 | 24,162 | |||||
Restricted equity securities | 4,072 | 3,713 | 3,253 | |||||
Total | $ | 53,415 | 56,819 | 50,526 | ||||
Loans
At December 31, 2007, net loans totaled $372,338,000, a $17,952,000 or 5.0% increase from December 31, 2006. During 2007, MPB experienced a net increase in commercial real estate and commercial/industrial loans of approximately $14,020,000, the majority of which was generated in the greater Capital (Harrisburg) Region.
The current environment in lending was extremely competitive with financial institutions aggressively pursuing potential borrowers with very competitive rates. At December 31, 2007, loans, net of unearned income, represented 77.9% of earning assets as compared to 76.1% on December 31, 2006 and 73.7% on December 31, 2005.
The Bank’s loan portfolio is diversified among individuals, farmers, and small and medium-sized businesses generally located within the Bank’s trading area of Dauphin County, lower Northumberland County, western Schuylkill County and eastern Cumberland County. Commercial real estate, construction and land development loans are collateralized mainly by mortgages on the income-producing real estate or land involved. Commercial, industrial and agricultural loans are made to business entities and may be secured by business assets, including commercial real estate, or may be unsecured. Residential real estate loans are secured by liens on the residential property. Consumer loans include installment loans, lines of credit and home equity loans. The Bank has no concentration of credit to any one borrower or group of related borrowers. The only concentration is in loans secured by real estate.
A distribution of the Bank’s loan portfolio according to major loan classification is shown in Table 6
TABLE 6: LOAN PORTFOLIO
(Dollars in thousands) | December 31, | ||||||||||||||||||||||||||
| 2007 | 2006 | 2005 | 2004 | 2003 | |||||||||||||||||||||||
| Amount | Percent of Loans | Amount | Percent of Loans | Amount | Percent of Loans | Amount | Percent of Loans | Amount | Percent of Loans | ||||||||||||||||||
Commercial real estate, construction and land development | $ | 229,766 | 60.7% | 226,663 | 63.0% | 219,385 | 70.0% | 195,549 | 69.6% | 154,296 | 66.5% | ||||||||||||||||
Commercial, industrial and agricultural | 59,702 | 15.8 | 48,785 | 13.5 | 31,368 | 10.0 | 30,940 | 11.0 | 25,567 | 11.0 | |||||||||||||||||
Real estate-residential | 70,872 | 18.7 | 63,141 | 17.5 | 44,688 | 14.3 | 43,914 | 15.6 | 43,384 | 18.7 | |||||||||||||||||
Consumer | 18,401 | 4.8 | 21,747 | 6.0 | 17,982 | 5.7 | 10,680 | 3.8 | 10,380 | 3.8 | |||||||||||||||||
Total Loans | 378,741 | 100 | 360,336 | 100 | 313,423 | 100 | 281,083 | 100 | 233,627 | 100 | |||||||||||||||||
Unearned income | (1,613 | ) | (1,763 | ) | (1,586 | ) | (1,536 | ) | (1,549 | ) | |||||||||||||||||
Loans net of unearned discount | 377,128 | 358,573 | 311,837 | 279,547 | 232,078 | ||||||||||||||||||||||
Allowance for loan and lease losses | (4,790 | ) | (4,187 | ) | (3,704 | ) | (3,643 | ) | (2,992 | ) | |||||||||||||||||
Net Loans | $ | 372,338 | 354,386 | 308,133 | 275,904 | 229,086 | |||||||||||||||||||||
33
| MID PENN BANCORP, INC. | MANAGEMENT’S DISCUSSION AND ANALYSIS |
Allowance for Loan and Lease Losses
The allowance for loan and lease losses is maintained at a level believed adequate by Management to absorb potential losses in the loan and lease portfolio. MPB has a loan review department that is charged with establishing a “watch list” of potentially unsound loans, identifying unsound credit practices and suggesting corrective actions. A quarterly review and reporting process is in place for monitoring those loans that are on the “watch list.” Each credit on the “watch list” is evaluated to estimate potential losses. In addition, loss estimates for each category of credit are provided based on Management's judgment which considers past experience, current economic conditions and other factors. For installment, real estate mortgages and other consumer loans, specific reserve allocations are based on past loss experience adjusted for recent portfolio growth and economic trends.
Calculated amounts resulting from this analysis are “specific” allocations. The amounts not specifically provided for individual classes of loans are considered “general.” The general portion of the allowance is determined and based on judgments regarding economic lending conditions, management trends and other factors.
The 2007 provision of $925,000 is an increase of $190,000 over the $735,000 provision in 2006. The larger provision is reflective of the increase in non-performing and classified loans and leases, primarily due to deteriorating economic conditions and the continuing decline of the real estate market. In addition, of particular note, is the potential exposure in one leasing relationship. The 2005 provision of $225,000 reflected the removal from the “watch list” of a significant loan relationship, thus reducing overall provisions in 2005.
The allocation of the allowance for loan and lease losses among the major classifications is shown in Table 7 as of December 31 of each of the past five years. The allowance for loan and lease losses at December 31, 2007 was $4,790,000 or 1.27% of total loans less unearned discount as compared to $4,187,000 or 1.17% at December 31, 2006 and $3,704,000 or 1.19% at December 31, 2005.
TABLE 7: ALLOCATION OF THE ALLOWANCE FOR LOAN AND LEASE LOSSES
(Dollars in thousands)
| December 31,
| |||||||||||
| 2007 | 2006 | 2005 | 2004 | 2003 | ||||||||
Commercial real estate, construction and land development | $ | 2,908 | 2,462 | 2,037 | 2,368 | 1,938 | ||||||
Commercial, industrial and agricultural | 1,607 | 1,515 | 1,481 | 1,093 | 954 | |||||||
Real estate-residential | 75 | 54 | 52 | 65 | 20 | |||||||
Consumer | 148 | 124 | 110 | 83 | 65 | |||||||
General | 52 | 32 | 24 | 34 | 15 | |||||||
Total Loans and Leases | $ | 4,790 | 4,187 | 3,704 | 3,643 | 2,992 | ||||||
Nonperforming Assets
Nonperforming assets, other than consumer loans and 1-4 family residential mortgages, include impaired and nonaccrual loans, loans past due 90 days or more, restructured loans and other real estate (including residential property). Nonaccrual loans are loans on which we no longer recognize daily interest income. A loan is generally classified as nonaccrual when principal or interest has consistently been in default for a period of 90 days or more, or because of a deterioration in the financial condition of the borrower, payment in full of principal or interest is not expected. Loans past due 90 days or more and still accruing interest are loans that are generally well-secured and in the process of collection or repayment. Restructured loans are those loans whose terms have been modified to lower interest or principal payments because of borrower financial difficulties. Foreclosed assets held for sale include those assets that have been acquired through foreclosure for debts previously contracted, in settlement of debt.
Consumer loans are generally recommended for charge-off when they become 120 days delinquent. All 1-4 family residential mortgages 90 days or more past due are reviewed quarterly by Management, and collection decisions are made in light of the analysis of each individual loan. The amount of consumer and residential mortgage loans past due 90 days or more at year-end was $916,000, $586,000 and $892,000 in 2007, 2006 and 2005, respectively.
A presentation of nonperforming assets as of December 31 for each of the past five years is given in Table 8. Nonperforming assets at December 31, 2007, totaled $7,343,000 or 1.44% of total assets compared to $2,434,000 or 0.50% of total assets in 2006 and $3,317,000 or 0.76% of total assets in 2005. At December 31, 2007, there were three parcels of commercial real estate in Other Real Estate Owned and three lease repossessions in Other Assets-Repossessed Property. The foreclosed assets held for sale at December 31, 2006, consisted of two parcels of commercial real estate and one residential property.
34
| MID PENN BANCORP, INC. | MANAGEMENT’S DISCUSSION AND ANALYSIS |
TABLE 8: NONPERFORMING ASSETS
(Dollars in thousands)
| December 31, | |||||||||||
| 2007 | 2006 | 2005 | 2004 | 2003 | ||||||||
Nonaccrual loans | $ | 4,317 | 1,293 | 1,773 | 873 | 984 | ||||||
Past due 90 days or more | 2,439 | 995 | 1,086 | 397 | 666 | |||||||
Restructured loans | 0 | 0 | 0 | 0 | 0 | |||||||
Total nonperforming loans | 6,756 | 2,288 | 2,859 | 1,270 | 1,650 | |||||||
Foreclosed assets held for sale | 587 | 146 | 458 | 505 | 1,117 | |||||||
Total nonperforming assets | $ | 7,343 | 2,434 | 3,317 | 1,775 | 2,767 | ||||||
Percent of loans outstanding | 1.94% | 0.68% | 1.06% | 0.63% | 1.18% | |||||||
Percent of total assets | 1.44% | 0.50% | 0.76% | 0.44% | 0.74% | |||||||
There are no trends or uncertainties related to nonperforming assets, which Management expects will materially impact future operating results, liquidity or capital resources.
Deposits and Other Funding Sources
MPB’s primary source of funds is its deposits. Deposits at December 31, 2007, increased by $8,591,000 or 2.4% over December 31, 2006, which increased by $38,952,000 or 12.0% over December 31, 2005. Average balances and average interest rates applicable to the major classifications of deposits for the years ended December 31, 2007, 2006, and 2005 are presented in Table 9.
Average short-term borrowings for 2007 were $22,528,000 as compared to $14,937,000 in 2006. These borrowings included customer repurchase agreements, treasury tax and loan option borrowings and federal funds purchased. One five- million dollar long-term borrowing matured in 2007, while no new long-term borrowings were entered into during the year.
At December 31, 2007, the Bank held $49,757,000 in funds from brokered deposits. Due to the competitive local deposit environment, the Bank added a net of $10 million in brokered deposits in 2007 and $10 million in 2006.
TABLE 9: DEPOSITS BY MAJOR CLASSIFICATION
| (Dollars in thousands) | Years ended December 31,
| |||||||||||||
| 2007 | 2006 | 2005 | ||||||||||||
| Average Balance | Average Rate | Average Balance | Average Rate | Average Balance | Average Rate | |||||||||
Noninterest-bearing demand deposits | $ | 44,021 | 0.00% | 43,161 | 0.00% | 41,484 | 0.00% | |||||||
Interest-bearing demand deposits | 35,048 | 0.41% | 31,877 | 0.28% | 32,507 | 0.18% | ||||||||
Money market | 63,927 | 3.45% | 60,968 | 3.11% | 50,913 | 2.11% | ||||||||
Savings | 25,513 | 0.28% | 24,772 | 0.25% | 28,179 | 0.24% | ||||||||
Time | 203,671 | 4.42% | 172,792 | 3.95% | 158,935 | 3.35% | ||||||||
Total | $ | 372,180 | 3.07% | 333,570 | 2.66% | 312,018 | 2.09% | |||||||
Capital Resources
Stockholders’ equity, or capital, is evaluated in relation to total assets and the risk associated with those assets. The greater the capital resources, the more likely a corporation is to meet its cash obligations and absorb unforeseen losses. Too much capital, however, indicates that not enough of the company’s earnings have been paid to stockholders and the buildup makes it difficult for a company to offer a competitive return on the stockholders’ capital going forward. For these reasons capital adequacy has been, and will continue to be, of paramount importance.
Capital growth is achieved by retaining more in earnings than is paid out to our stockholders. Stockholders’ equity increased in 2007 by $1,359,000 or 3.5%, in 2006 by $2,224,000 or 6.0%, and by $1,589,000 or 4.5% in 2005.
MPB’s normal dividend payout allows for quarterly cash returns to its stockholders and provides earnings retention at a level sufficient to finance future growth. The dividend payout ratio, which represents the percentage of annual net income returned to the stockholders in the form of cash dividends, was 60% for 2007 compared to 55% for 2006 and 56% for 2005.
At December 31, 2007, 43,706 shares of MPB’s common stock have been purchased back by MPB, and are held as treasury stock.
35
| MID PENN BANCORP, INC. | MANAGEMENT’S DISCUSSION AND ANALYSIS |
Federal Income Taxes
Federal income tax expense for 2007 was $1,394,000 compared to $1,624,000 and $1,600,000 in 2006 and 2005, respectively. The effective tax rate was 23% for 2007, 25% for 2006 and 26% for 2005.
Liquidity
MPB’s asset-liability management policy addresses the management of MPB’s liquidity position and its ability to raise sufficient funds to meet deposit withdrawals, fund loan growth and meet other operational needs. MPB utilizes its investments as a source of liquidity, along with deposit growth and increases in repurchase agreements and borrowings. (See Deposits and Other Funding Sources which appears earlier in this discussion.) Liquidity from investments is provided primarily through investments and interest-bearing balances with maturities of one year or less. Funds are available to MPB through loans from the Federal Home Loan Bank and established federal funds (overnight) lines of credit. MPB's major source of funds is its core deposit base as well as its capital resources.
Major sources of cash in 2007 came from operations and a net increase in deposits of $8,591,000, as well as an increase in short-term borrowings of $13,074,000. Another major source of funds were proceeds from the maturity of investment securities of $9,864,000.
The major use of cash in 2007 was a net increase in loans of $18,936,000. Other major uses of cash included the purchase of investment securities of $6,430,000 and the purchase of bank premises and equipment of $1,885,000.
The major sources of cash in 2006 came from operations and a net increase in deposits of $11,795,000 (excluding the deposits of the purchased Omega offices), as well as an increase in short-term borrowings of $11,933,000. Other major sources of funds included a net decrease in interest-bearing balances (investment certificates of deposit of other banks), as well as the cash received of $7,100,000 through the Omega Branches purchase.
The major use of cash in 2006 was funding strong loan demand. Net loans increased $29,946,000, excluding the loans received as part of the Omega Branch acquisition. Another major use of funds was an increase in investment securities of $6,383,000, as funds were moved out of lower yielding interest-bearing balances.
Market Risk - Asset-Liability Management and Interest Rate Sensitivity
Interest rate sensitivity is a function of the repricing characteristics of MPB’s portfolio of assets and liabilities. Each asset and liability reprices either at maturity or during the life of the instrument. Interest rate sensitivity is measured as the difference between the volume of assets and liabilities that are subject to repricing in a future period of time. These differences are known as interest sensitivity gaps.
MPB manages the interest rate sensitivity of its assets and liabilities. The principal purpose of asset-liability management is to maximize net interest income while avoiding significant fluctuations in the net interest margin and maintaining adequate liquidity. Net interest income is increased by increasing the net interest margin and by volume growth.
MPB utilizes an asset-liability management model to measure the impact of interest rate movements on its interest rate sensitivity position. The traditional maturity gap analysis is also reviewed regularly by MPB’s management. MPB does not attempt to achieve an exact match between interest sensitive assets and liabilities because it believes that a controlled amount of interest rate risk is desirable.
The maturity distribution and weighted average yields of investments is presented in Table 10. The maturity distribution and repricing characteristics of MPB’s loan portfolio is shown in Table 11. Table 12 provides expected maturity information about MPB’s financial instruments that are sensitive to changes in interest rates. Except for the effects of prepayments on mortgage related assets, the table presents principal cash flows and related average interest rates on interest earning assets by contractual maturity. Residential loans are assumed to have annual payment rates between 12% and 18% of the portfolio.
MPB assumes that 75% of savings and NOW accounts are core deposits and are, therefore, expected to reprice after 5 years. Transaction accounts, excluding money market accounts, are assumed to reprice after five years. Money market accounts are assumed to be variable accounts and are reported as maturing within the first twelve months. No roll-off is applied to certificates of deposit. Fixed maturity deposits reprice at maturity. The maturity distribution of time deposits of $100,000 or more is shown in Table 13.
36
| MID PENN BANCORP, INC. | MANAGEMENT’S DISCUSSION AND ANALYSIS |
TABLE 10: INVESTMENT MATURITY AND YIELD
(Dollars in thousands)
| December 31, 2007 | |||||||||||
| One Year and Less | After One Year thru Five Years | After Five Years thru Ten Years | After Ten Years | Total | ||||||||
U.S. Treasury and U.S. government agencies | $ | 3,499 | 3,026 | 5,036 | 502 | 12,063 | ||||||
State and political subdivision obligations | 400 | 4,443 | 13,366 | 12,879 | 31,088 | |||||||
Mortgage-backed U.S. government agencies | 0 | 31 | 24 | 6,802 | 6,857 | |||||||
Equity securities | 0 | 0 | 0 | 4,064 | 4,064 | |||||||
Total | $ | 3,899 | 7,500 | 18,426 | 24,247 | 54,072 | ||||||
| One Year and Less | After One Year thru Five Years | After Five Years thru Ten Years | After Ten Years | Total | ||||||||
Weighted Average Yields | ||||||||||||
U.S. Treasury and U.S. government agencies | 4.65 | 4.47 | 4.17 | 5.00 | 4.42 | |||||||
State and political subdivision obligations (FTE) | 7.06 | 7.26 | 6.60 | 6.38 | 6.61 | |||||||
Mortgage-backed U.S. government agencies | 0 | 6.50 | 5.53 | 5.02 | 5.02 | |||||||
Equity securities | 0 | 0 | 0 | 5.91 | 5.91 | |||||||
Total | 4.90 | 6.13 | 5.93 | 5.89 | 5.86 | |||||||
TABLE 11: LOAN MATURITY AND INTEREST SENSITIVITY
| ||||||||||||
(Dollars in thousands)
| December 31, 2007
| |||||||||||
| One Year and Less | After One Year thru Five Years | After Five Years | Total | |||||||||
Commercial, real estate, construction and land development | $ | 71,017 | 136,692 | 22,057 | 229,766 | |||||||
Commercial, industrial and agricultural | 26,108 | 23,699 | 9,895 | 59,702 | ||||||||
Real estate-residential mortgages | 20,249 | 33,716 | 16,907 | 70,872 | ||||||||
Consumer | 9,130 | 6,267 | 1,391 | 16,788 | ||||||||
Total Loans | $ | 126,504 | 200,374 | 50,250 | 377,128 | |||||||
Rate Sensitivity | ||||||||||||
Predetermined rate | $ | 21,735 | 54,473 | 44,309 | 120,517 | |||||||
Floating or adjustable rate | 104,769 | 145,901 | 5,941 | 256,611 | ||||||||
Total | $ | 126,504 | 200,374 | 50,250 | 377,128 | |||||||
37
| MID PENN BANCORP, INC. | MANAGEMENT’S DISCUSSION AND ANALYSIS |
TABLE 12: INTEREST RATE SENSITIVITY GAP
| (Dollars in thousands) | |||||||||||||||||||||||
(Average rates in percentages) (As of December 31, 2007) | Expected Maturity Year Ended December 31, | ||||||||||||||||||||||
| 2008 | 2009 | 2010 | 2011 | 2012 | Thereafter | Total | Fair Value | ||||||||||||||||
Assets: | |||||||||||||||||||||||
Interest bearing balances | $ | 33,963 | 10,590 | 1,287 | 891 | 99 | 0 | 46,830 | 46,830 | ||||||||||||||
Average interest rate | 5.40 | 5.27 | 5.27 | 5.67 | 5.25 | 0 | 5.37 | ||||||||||||||||
Debt securities | 3,899 | 2,665 | 1,445 | 1,528 | 1,830 | 38,671 | 50,038 | 50,038 | |||||||||||||||
Average interest rate | 4.90 | 4.50 | 6.86 | 6.56 | 7.58 | 5.84 | 5.86 | ||||||||||||||||
Adjustable rate loans | 104,769 | 37,199 | 35,063 | 35,383 | 38,254 | 5,941 | 256,609 | 256,609 | |||||||||||||||
Average interest rate | 7.38 | 6.54 | 6.67 | 7.08 | 7.45 | 6.36 | 7.10 | ||||||||||||||||
Fixed rate loans | 21,735 | 16,128 | 12,356 | 13,116 | 12,873 | 44,309 | 120,517 | 130,435 | |||||||||||||||
Average interest rate | 6.86 | 6.72 | 7.35 | 6.12 | 7.33 | 7.02 | 7.00 | ||||||||||||||||
Total | $ | 164,366 | 66,582 | 50,151 | 50,918 | 53,056 | 88,921 | 473,994 | 483,912 | ||||||||||||||
Interest liabilities: | |||||||||||||||||||||||
Variable rate savings and transaction accounts | $ | 77,964 | 0 | 0 | 0 | 0 | 92,581 | 170,545 | 170,545 | ||||||||||||||
Average interest rate | 2.73 | - | - | - | - | 0.18 | 1.35 | ||||||||||||||||
Certificates of deposit and IRAs | 98,283 | 40,863 | 26,752 | 17,307 | 16,201 | 2,866 | 202,272 | 207,157 | |||||||||||||||
Average interest rate | 4.44 | 4.38 | 4.61 | 5.17 | 4.91 | 4.23 | 4.55 | ||||||||||||||||
Short term borrowings | 37,349 | 0 | 0 | 0 | 0 | 0 | 37,349 | 37,349 | |||||||||||||||
Average interest rate | 3.90 | - | - | - | - | - | 3.90 | ||||||||||||||||
Long term fixed rate borrowings | 15,138 | 17,145 | 10,152 | 5,159 | 167 | 6,820 | 54,581 | 55,931 | |||||||||||||||
Average interest rate | 3.56 | 4.64 | 6.50 | 5.13 | 4.61 | 4.61 | 4.78 | ||||||||||||||||
Total | $ | 228,734 | 58,008 | 36,904 | 22,466 | 16,368 | 102,267 | 464,747 | 470,982 | ||||||||||||||
Rate sensitive gap: | |||||||||||||||||||||||
Periodic gap | $ | (64,368 | ) | 8,574 | 13,247 | 28,452 | 36,688 | (13,346 | ) | ||||||||||||||
Cumulative gap | $ | (64,368 | ) | (55,794 | ) | (42,547 | ) | (14,095 | ) | 22,593 | 9,247 | ||||||||||||
Cumulative gap as a percentage of total assets | -12.6% | -10.9% | -8.3% | -2.8% | +4.4% | +1.8% | |||||||||||||||||
(Dollars in thousands) (As of December 31, 2006) | Expected Maturity Year Ended December 31, |
| |||||||||||||||||||||
| 2007 | 2008 | 2009 | 2010 | 2011 | Thereafter | Total | Fair Value | ||||||||||||||||
Assets: | |||||||||||||||||||||||
Interest bearing balances | $ | 31,197 | 9,788 | 4,748 | 297 | 891 | 0 | 46,921 | 46,921 | ||||||||||||||
Average interest rate | 5.41 | 5.39 | 5.39 | 5.35 | 5.67 | - | 5.41 | ||||||||||||||||
Debt securities | 2,451 | 3,869 | 2,719 | 2,592 | 1,522 | 44,108 | 57,261 | 57,261 | |||||||||||||||
Average interest rate | 4.47 | 4.38 | 4.58 | 6.15 | 6.10 | 5.63 | 5.64 | ||||||||||||||||
Adjustable rate loans | 90,866 | 31,003 | 38,069 | 34,321 | 28,320 | 2,870 | 225,449 | 225,449 | |||||||||||||||
Average interest rate | 8.19 | 6.26 | 6.50 | 6.50 | 7.13 | 6.03 | 7.22 | ||||||||||||||||
Fixed rate loans | 18,483 | 8,660 | 15,743 | 7,835 | 15,928 | 68,238 | 134,887 | 135,656 | |||||||||||||||
Average interest rate | 7.15 | 6.50 | 6.70 | 7.04 | 6.82 | 6.90 | 6.88 | ||||||||||||||||
Total | $ | 142,997 | 53,320 | 61,279 | 45,045 | 46,661 | 115,216 | 464,518 | 465,287 | ||||||||||||||
38
| MID PENN BANCORP, INC. | MANAGEMENT’S DISCUSSION AND ANALYSIS |
TABLE 12: INTEREST RATE SENSITIVITY GAP (cont’d)
(Dollars in thousands)
(As of December 31, 2006) | Expected Maturity Year Ended December 31, | |||||||||||||||||||||||
| 2007 | 2008 | 2009 | 2010 | 2011 | Thereafter | Total | Fair Value | |||||||||||||||||
Interest liabilities: | ||||||||||||||||||||||||
Variable rate savings and transaction accounts | $ | 74,236 | 0 | 0 | 0 | 0 | 87,876 | 162,112 | 162,599 | |||||||||||||||
Average interest rate | 2.81 | - | - | - | - | 0.10 | 1.34 | |||||||||||||||||
Certificates of deposit and IRAs | 102,971 | 42,810 | 18,464 | 18,378 | 16,326 | 3,165 | 202,114 | 201,997 | ||||||||||||||||
Average interest rate | 4.18 | 4.48 | 3.92 | 4.27 | 5.22 | 4.14 | 4.33 | |||||||||||||||||
Short term borrowings | 24,275 | 0 | 0 | 0 | 0 | 0 | 24,275 | 24,275 | ||||||||||||||||
Average interest rate | 4.91 | - | - | - | - | - | 4.91 | |||||||||||||||||
Long term fixed rate borrowings | 5,131 | 15,138 | 12,145 | 10,152 | 5,159 | 11,988 | 59,713 | 60,042 | ||||||||||||||||
Average interest rate | 3.71 | % | 3.56 | 4.64 | 6.50 | 5.13 | 4.61 | 4.69 | 9.99 | |||||||||||||||
Total | $ | 206,613 | 57,948 | 30,609 | 28,530 | 21,485 | 103,029 | 448,214 | 448,913 | |||||||||||||||
Rate sensitive gap: | ||||||||||||||||||||||||
Periodic gap | $ | (63,616 | ) | (4,628 | ) | 30,670 | 16,515 | 25,176 | 12,187 | |||||||||||||||
Cumulative gap | $ | (63,616 | ) | (68,244 | ) | (37,574 | ) | (21,059 | ) | 4,117 | 16,304 | |||||||||||||
Cumulative gap as a percentage of total assets | -12.9 | % | -13.9 | % | -7.6 | % | -4.3 | % | +0.8 | % | +3.3 | % | ||||||||||||
During 2007, Management analyzed interest rate risk using the Profit Star Asset-Liability Management Model. Using the computerized model, Management reviews interest rate risk on a monthly basis. This analysis includes an earnings scenario whereby interest rates are increased by 200 basis points and another whereby they are decreased by 200 basis points. These scenarios indicate that there would not be a significant variance in net interest income at the one-year time frame due to interest rate changes; however, actual results could vary significantly from the calculations prepared by Management. At December 31, 2007, all interest rate risk levels according to our model were within the tolerance limits of Board approved policy. The model noted above utilized by Management to create the reports used for Table 12 makes various assumptions and estimates. Actual results could differ significantly from these estimates which would result in significant differences in cash flows. In addition, the table does not take into consideration changes which Management would make to realign its portfolio in the event of a changing rate environment.
TABLE 13: MATURITY OF TIME DEPOSITS $100,000 OR MORE
(Dollars in thousands)
| December 31, | |||||||
| 2007 | 2006 | 2005 | ||||||
Three months or less | $ | 8,536 | 675 | 8,421 | ||||
Over three months to twelve months | 19,952 | 11,300 | 12,930 | |||||
Over twelve months | 15,453 | 22,010 | 12,868 | |||||
Total | $ | 43,941 | 33,985 | 34,219 | ||||
Effects of Inflation
A bank’s asset and liability structure is substantially different from that of an industrial company in that virtually all assets and liabilities of a bank are monetary in nature. Management believes the impact of inflation on its financial results depends principally upon MPB’s ability to react to changes in interest rates and, by such reaction, reduce the inflationary impact on performance. Interest rates do not necessarily move in the same direction or at the same magnitude as the prices of other goods and services. As discussed previously, Management seeks to manage the relationship between interest sensitive assets and liabilities in order to protect against wide interest rate fluctuations, including those resulting from inflation.
Information shown elsewhere in this Annual Report will assist in the understanding of how MPB is positioned to react to changing interest rates and inflationary trends. In particular, the summary of net liabilities, as well as the composition of loans, investments and deposits should be considered.
Off-Balance Sheet Items
MPB makes contractual commitments to extend credit and extends lines of credit which are subject to MPB's credit approval and monitoring procedures.
As of December 31, 2007, commitments to extend credit amounted to $88,148,000 as compared to $70,630,000 as of December 31, 2006.
MPB also issues financial standby letters of credit to its customers. The risk associated with financial standby letters of credit is essentially the same as the credit risk involved in loan extensions to customers. Financial standby letters of credit increased to $11,480,000 at December 31, 2007, from $11,163,000 at December 31, 2006.
39
| MID PENN BANCORP, INC. | MANAGEMENT’S DISCUSSION AND ANALYSIS |
Comprehensive Income
Comprehensive Income is a measure of all changes in equity of a corporation, excluding transactions with owners in their capacity as owners (such as proceeds from issuances of stock and dividends). The difference between Net Income and Comprehensive Income is termed “Other Comprehensive Income.” For MPB, Other Comprehensive Income consists primarily of unrealized gains and losses on available-for-sale securities, net of deferred income tax. Other Comprehensive Income also includes a pension component in accordance with FASB Statement No. 158. Comprehensive Income should not be construed to be a measure of net income. The effect of Other Comprehensive Income would only be reflected in the income statement if the entire portfolio of available-for-sale securities were sold on the statement date. The amount of unrealized gains or losses reflected in Comprehensive Income may vary widely at statement dates depending on the markets as a whole and how the portfolio of available-for-sale securities is affected by interest rate movements. Other Comprehensive Income (Loss) for the years ended December 31, 2007, 2006 and 2005 was $(33,000), $86,000 and $(462,000), respectively.
Summary of Selected Financial Data
(Dollars in thousands, except per share data)
| 2007 | 2006 | 2005 | 2004 | 2003 | ||||||||
INCOME: | ||||||||||||
Total Interest Income | $ | 31,444 | 28,214 | 23,294 | 20,077 | 19,984 | ||||||
Total Interest Expense | 15,339 | 12,732 | 9,557 | 8,005 | 8,434 | |||||||
Net Interest Income | 16,105 | 15,482 | 13,737 | 12,072 | 11,550 | |||||||
Provision for Possible Loan and Lease Losses | 925 | 735 | 225 | 725 | 290 | |||||||
Noninterest Income | 3,481 | 3,028 | 2,953 | 3,457 | 2,707 | |||||||
Noninterest Expense | 12,596 | 11,263 | 10,262 | 9,030 | 8,099 | |||||||
Income Before Income Taxes | 6,065 | 6,512 | 6,203 | 5,774 | 5,868 | |||||||
Provision for Income Taxes | 1,394 | 1,624 | 1,600 | 1,405 | 1,253 | |||||||
Net Income | 4,671 | 4,888 | 4,603 | 4,369 | 4,615 | |||||||
COMMON STOCK DATA PER SHARE: | ||||||||||||
Earnings Per Share | $ | 1.34 | 1.39 | 1.31 | 1.24 | 1.32 | ||||||
Cash Dividends Declared, historical | .80 | .80 | .80 | 1.80 | .80 | |||||||
Stockholders’ Equity | 11.56 | 11.12 | 10.48 | 10.03 | 10.63 | |||||||
AVERAGE SHARES OUTSTANDING | 3,497,806 | 3,514,820 | 3,515,714 | 3,515,726 | 3,515,325 | |||||||
AT YEAR-END: | ||||||||||||
Investments | $ | 46,830 | 46,921 | 54,549 | 44,613 | 54,093 | ||||||
Loans and Leases, Net of Unearned Discount | 377,128 | 358,612 | 311,837 | 279,547 | 232,078 | |||||||
Allowance for Loan and Lease Losses | 4,790 | 4,187 | 3,704 | 3,643 | 2,992 | |||||||
Total Assets | 509,757 | 491,694 | 438,110 | 403,256 | 373,466 | |||||||
Total Deposits | 372,817 | 364,226 | 325,274 | 301,144 | 288,338 | |||||||
Short-term Borrowings | 37,349 | 24,275 | 12,342 | 13,801 | 9,688 | |||||||
Long-term Debt | 54,581 | 59,713 | 59,838 | 49,957 | 35,684 | |||||||
Stockholders’ Equity | $ | 40,444 | 39,085 | 36,861 | 35,272 | 37,361 | ||||||
RATIOS: | ||||||||||||
Return on Average Assets | % | 0.94 | 1.08 | 1.10 | 1.12 | 1.25 | ||||||
Return on Average Stockholders’ Equity | 11.84 | 12.93 | 12.87 | 12.73 | 12.69 | |||||||
Cash Dividend Payout Ratio | 59.70 | 54.79 | 55.56 | 131.38 | 54.48 | |||||||
Allowance for Loan and Lease Losses to Loans and Leases | 1.27 | 1.17 | 1.19 | 1.30 | 1.29 | |||||||
Average Stockholders’ Equity to Average Assets | 7.82 | 8.34 | 8.55 | 8.75 | 9.97 | |||||||
40
| MID PENN BANCORP, INC. | MANAGEMENT’S DISCUSSION AND ANALYSIS |
Stock Performance Graph
| Period Ending | ||||||||||||
Index | 12/31/02 | 12/31/03 | 12/31/04 | 12/31/05 | 12/31/06 | 12/31/07 | ||||||
Mid Penn Bank | 100.00 | 118.60 | 146.12 | 138.52 | 150.18 | 171.61 | ||||||
NASDAQ Composite | 100.00 | 150.01 | 162.89 | 165.13 | 180.85 | 198.60 | ||||||
Mid-Atlantic Custom Peer Group | 100.00 | 153.01 | 167.55 | 165.85 | 173.43 | 159.74 | ||||||
Source: SNL Financial LC, Charlottesville, VA | ||||||||||||
© 2008 | ||||||||||||
41
| MID PENN BANCORP, INC. | LIST OF DIRECTORS AND OFFICERS AS OF 12/31/07 |
DIRECTORS Mid Penn Bancorp, Inc. Mid Penn Bank
Jere M. Coxon Executive Vice President Penn Wood Products, Inc.
Alan W. Dakey President and CEO Mid Penn Bank
Matthew G. DeSoto Eastern Division President MI Windows and Doors (effective 1/1/08)
A. James Durica CPA - Consultant
Robert C. Grubic President & CEO Herbert, Rowland and Grubic, Inc.
Gregory M. Kerwin Senior Partner Kerwin & Kerwin, Attorneys
Theodore W. Mowery Partner Gunn-Mowery, LLC
Donald E. Sauve Consultant Don’s Food Market, Inc.
Edwin D. Schlegel Retired Superintendent Millersburg Area School District
Guy J. Snyder, Jr. President Snyder Fuels, Inc.
William A. Specht, III President Seal Glove Mfg, Inc. ARK Safety, Inc.
DIRECTORS EMERITI Earl R. Etzweiler Harvey J. Hummel Warren A. Miller William G. Nelson Eugene F. Shaffer Anna C. Woodside | EXECUTIVE OFFICERS Mid Penn Bancorp, Inc.
Alan W. Dakey Chairman, President and CEO
Edwin D. Schlegel Vice Chairman and Lead Director
Kevin W. Laudenslager Treasurer
Cindy L. Wetzel Secretary
SENIOR MANAGEMENT Mid Penn Bank
Alan W. Dakey Chairman, President and CEO 34 Years Banking Experience
Kevin W. Laudenslager Executive Vice President and Chief Financial Officer 23 Years Banking Experience
Eric S. Williams Executive Vice President and Senior Commercial Loan Officer 29 Years Banking Experience
Randall L. Klinger Senior Vice President and Senior Credit Officer 34 Years Banking Experience
Leonard K. Beasom, Jr. Vice President and Commercial Loan Officer 36 Years Banking Experience
Donald J. Bonafede Vice President and Director of Equipment Leasing 25 Years Banking Experience
Kathy I. Bordner Vice President and Marketing Director 23 Years Banking Experience | Roberta A. Hoffman, PHR Vice President, Human Resources Officer and Asst. Secretary 31 Years Banking Experience
Ernest P. Kemper, Jr. Vice President and Chief Information Officer 27 Years Banking Experience
Michael T. Lehmer Vice President and Senior Trust Officer 17 Years Banking Experience
John F. Lydic Vice President and Retail Division Manager 26 Years Banking Experience
Robert E. McDonald Vice President and Commercial Lending Team Leader 24 Years Banking Experience
Eric D. Mummau Vice President and Commercial Loan Officer 28 Years Banking Experience
Brad N. Shaak Vice President, Consumer and Mortgage Lending Manager 21 Years Banking Experience
Steven S. Shuey Vice President and Loan Review Officer 34 Years Banking Experience
Dennis E. Spotts Vice President and Operations Officer 35 Years Banking Experience
Cindy L. Wetzel Vice President and Corporate Secretary 29 Years Banking Experience
Rick E. Witwer Vice President and Commercial Loan Officer 20 Years Banking Experience |
42
| MID PENN BANCORP, INC. | LIST OF ADVISORY BOARD MEMBERS AS OF 12/31/07 |
ADVISORY BOARD MEMBERS Mid Penn Bank
Capital Region:
Stanford D. Custer, Jr. Custer Homes, Inc.
Robert C. Grubic Herbert, Rowland & Grubic
Norman L. Houser Retired, Mid Penn Bank
Theodore W. Mowery Gunn-Mowery, LLC
Michael G. Musser II Steelton Borough Secretary/Treasurer
Robert M. Newbury RM Newbury & Co
Dale R. Schwan Environmental Interiors, Inc. |
Northern Region
Matthew G. DeSoto MI Windows and Doors
James S. Facinelli Restorations Unlimited, Inc.
Linda J. Faust Faust Real Estate
Dane P. Harman Harman Stove Co.
Robert E. Klinger Klinger Lumber Co, Inc.
Dixie L. Laudenslager Mahantongo Game Farms
Dr. David R. Russell Dr.David R.Russell, DMD, PC
Kent S. Smeltz Advanced Scientifics, Inc.
Carl E. Snyder Century 21- Carl Snyder
Thomas E. Troutman Keystone Insurers Group |
43
MID PENN BANCORP, INC.
| LOCATIONS
|
Locations
Millersburg
717.692.2133
Elizabethville
717.362.8147
Dalmatia
570.758.2711
Tower City
717.647.2157
Lykens
717.453.7185
Halifax
717.896.8258
Dauphin
717.921.8899
Derry Street, Harrisburg
717.558.2144
Front Street, Harrisburg
717.233.7380
Allentown Blvd, Harrisburg
717.920.1772
Second Street, Harrisburg
717.920.1980
Mechanicsburg
717.761.2480
Steelton
717.939.1966
Middletown
717.985.0100
Camp Hill
717.920.0224
44