Exhibit 99.1
OPERATING AND FINANCIAL REVIEW AND PROSPECTS
The terms "TotalEnergies", "TotalEnergies company" and "Company" in this exhibit are used to designate TotalEnergies SE and the consolidated entities directly or indirectly controlled by TotalEnergies SE.
The financial information on pages 1-30 of this exhibit concerning TotalEnergies with respect to the first quarter of 2023 has been derived from TotalEnergies’ unaudited consolidated balance sheets as of March 31, 2023, unaudited statements of income, comprehensive income, cash flow and business segment information for the first quarter of 2023 and unaudited consolidated statements of changes in shareholders’ equity for the quarter ended March 31, 2023 on pages 22 et seq. of this exhibit.
The following discussion should be read in conjunction with the aforementioned financial statements and with the information, including TotalEnergies’ audited consolidated financial statements and related notes, provided in TotalEnergies’ Annual Report on Form 20-F for the year ended December 31, 2022, filed with the Securities and Exchange Commission (“SEC”) on March 24, 2023.
| A. | KEY FIGURES |
| In millions of dollars, except effective tax rate, earnings per share and number of shares | 1Q23 | 4Q22 | 1Q23 vs 4Q22 | 1Q22 | 1Q23 vs 1Q22 |
| Sales | 62,603 | 68,582 | -9% | 68,606 | -9% |
| Adjusted EBITDA(1)(2) | 14,167 | 15,997 | -11% | 17,424 | -19% |
| Adjusted net operating income(3) from business segments | 6,993 | 8,238 | -15% | 9,458 | -26% |
| Exploration & Production | 2,653 | 3,528 | -25% | 5,015 | -47% |
| Integrated LNG | 2,072 | 2,408 | -14% | 3,133 | -34% |
| Integrated Power | 370 | 481 | -23% | (82) | ns |
| Refining & Chemicals | 1,618 | 1,487 | +9% | 1,120 | +44% |
| Marketing & Services | 280 | 334 | -16% | 272 | +3% |
| Net income (loss) from equity affiliates | 960 | (281) | ns | 43 | x22.3 |
| Fully-diluted earnings per share ($) | 2.21 | 1.26 | +75% | 1.85 | +18% |
| Fully-diluted weighted-average shares (millions) | 2,479 | 2,522 | -2% | 2,614 | -5% |
| Net income (TotalEnergies share) | 5,557 | 3,264 | +70% | 4,944 | +12% |
| Organic investments(4) | 3,433 | 3,935 | -13% | 1,981 | +73% |
| Net acquisitions(5) | 2,987 | (133) | ns | 922 | x3.2 |
| Net investments(6) | 6,420 | 3,802 | +69% | 2,903 | x2.2 |
| Cash flow from operating activities(7) | 5,133 | 5,618 | -9% | 7,617 | -33% |
| of which | |||||
| (increase) decrease in working capital | (3,419) | (3,791) | ns | (4,923) | ns |
| financial charges | (153) | (226) | ns | (369) | ns |
| (1) | Adjusted results are defined as income using replacement cost, adjusted for special items, excluding the impact of changes for fair value; adjustment items are on page 16. |
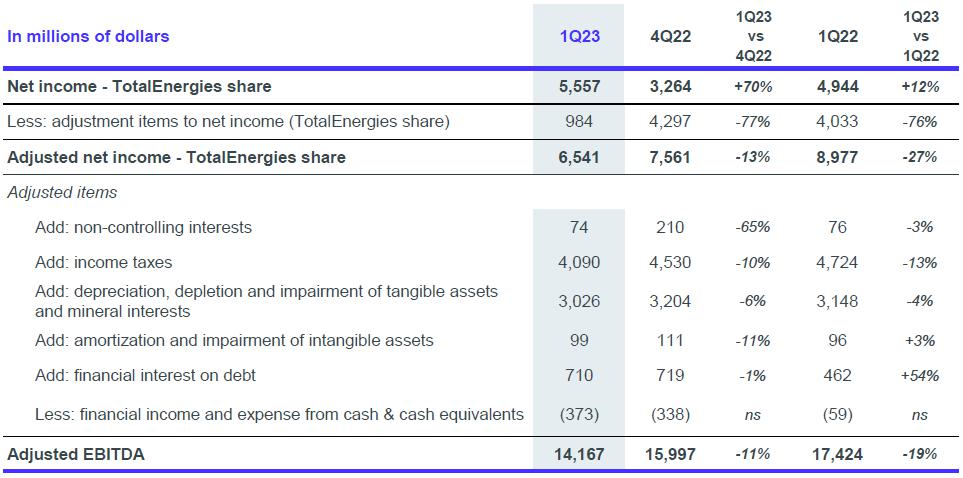
| (2) | Adjusted EBITDA (Earnings Before Interest, Tax, Depreciation and Amortization) corresponds to the adjusted earnings before depreciation, depletion and impairment of tangible and intangible assets and mineral interests, income tax expense and cost of net debt, i.e., all operating income and contribution of equity affiliates to net income. The reconciliation of net income (TotalEnergies share) to adjusted EBITDA is set forth under “Reconciliation Of Net Income (TotalEnergies Share) To Adjusted EBITDA” on page 17 of this exhibit. |
| (3) | Adjusted results are defined as income using replacement cost, adjusted for special items, excluding the impact of changes for fair value. |
| (4) | Organic investments = net investments excluding acquisitions, asset sales and other operations with non-controlling interests. |
| (5) | Net acquisitions = acquisitions - assets sales - other transactions with non-controlling interests (see page 17). |
| (6) | Net investments = organic investments + net acquisitions (see “Investments – Divestments’” on page 17). |
| (7) | See also “C. TotalEnergies results – Cash Flow”. The reconciliation table for different cash flow figures is set forth under “Cash Flow” on page 18 of this exhibit. |
1
Key figures of environment, greenhouse gas emissions (GHG) and production
Environment* – liquids and gas price realizations, refining margins
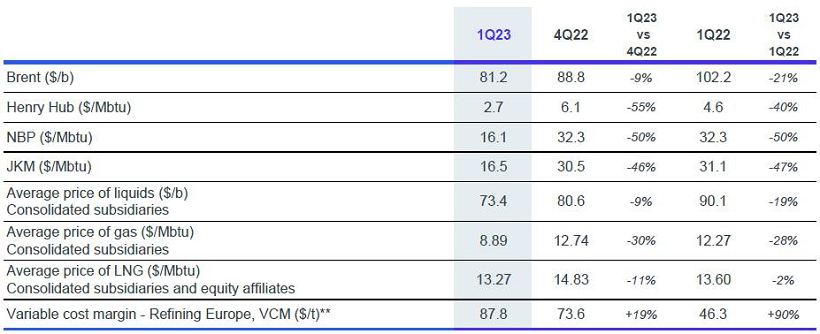
| * | The indicators are shown on page 19. |
| ** | This indicator represents TotalEnergies’ average margin on variable cost for refining in Europe (equal to the difference between TotalEnergies European refined product sales and crude oil purchases with associated variable costs divided by volumes refined in tons). |
| NBP (National Balancing Point) is a virtual natural gas trading point in the United Kingdom for transferring rights in respect of physical gas and which is widely used as a price benchmark for the natural gas markets in Europe. NBP is operated by National Grid Gas plc, the operator of the UK transmission network. |
| JKM (Japan-Korea Marker) measures the prices of spot LNG trades in Asia. It is based on prices reported in spot market trades and/or bids and offers collected after the close of the Asian trading day at 16:30 Singapore time. |
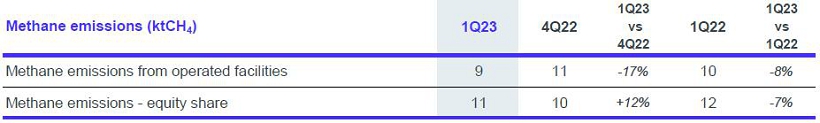
Greenhouse gas emissions (GHG)(1)
| GHG emissions (MtCO2e) | 1Q23 | 4Q22 | 1Q23 vs 4Q22 | 1Q22 | 1Q23 vs 1Q22 |
| Scope 1+2 from operated facilities(2) | 9.1 | 10.1 | -10% | 9.6 | -6% |
| of which Oil & Gas | 7.6 | 8.3 | -8% | 7.9 | -4% |
| of which CCGT | 1.5 | 1.8 | -17% | 1.7 | -15% |
| Scope 1+2 – equity share | 12.8 | 14.7 | -13% | 14.0 | -9% |
Estimated 1Q23 emissions.
Scope 1+2 emissions from operated installations were down in the first quarter 2023, as a result of the decrease in the use of gas-fired power plants in a context of lower demand in Europe and given the decline in flaring on Exploration & Production (E&P) facilities.
Estimated 1Q23 emissions.
| Scope 3 emissions (MtCO2e) | 1Q23 | 2022 |
| Scope 3 from Oil, Biofuels and Gas Worldwide(3) | est. 90 | 389 |
| (1) | The six greenhouse gases in the Kyoto protocol, namely CO2, CH4, N2O, HFCs, PFCs and SF6, with their respective GWP (Global Warming Potential) as described in the 2007 IPCC report. HFCs, PFCs and SF6 are virtually absent from the Company’s emissions or are considered as non-material and are therefore not counted. |
| (2) | Scope 1+2 GHG emissions of operated facilities are defined as the sum of direct emissions of greenhouse gases from sites or activities that are included in the scope of reporting (as defined in the Company’s 2022 annual report on Form 20-F filed on March 24, 2023) and indirect emissions attributable to brought-in energy (electricity, heat, steam), excluding purchased industrial gases (H2). |
| (3) | TotalEnergies reports Scope 3 GHG emissions, category 11, which correspond to indirect GHG emissions related to the use by customers of energy products, i.e., combustion of the products to obtain energy. The Company follows the oil & gas industry reporting guidelines published by IPIECA, which comply with the GHG Protocol methodologies. In order to avoid double counting, this methodology accounts for the largest volume in the oil, biofuels and gas value chains, i.e., the higher of the two production volumes or sales to end customers. The highest point for each value chain for 2023 will be evaluated considering realizations over the full year, TotalEnergies gradually providing quarterly estimates. |
2
Production*

| * | Company production = E&P production + Integrated LNG production. |
Hydrocarbon production was 2,524 thousand barrels of oil equivalent per day (kboe/d) in the first quarter of 2023, up 1% year-on-year (excluding Novatek), comprised of:
| · | +4% due to start-ups and ramp-ups, notably Mero 1 in Brazil and Ikike in Nigeria, |
| · | +1% due to the increase in OPEC+ production quotas, |
| · | -1% portfolio effect, notably related to the end of the Bongkot operating licenses in Thailand, the exit from Termokarstovoye and Kharyaga in Russia and the effective withdrawal from Myanmar, partially offset by the entry into the producing fields of Sépia and Atapu in Brazil and SARB / Umm Lulu in the United Arab Emirates, as well as the increased participation in the Waha concessions in Libya, |
| · | -3% due to the natural decline of the fields. |
Production was up 2% quarter-on-quarter (excluding Novatek), benefiting in particular from the start-up of gas production from Block 10 in Oman, the acquisition of an interest in the SARB / Umm Lulu oil fields in the United Arab Emirates, and the ramp-up of Johan Sverdrup Phase 2 project in Norway.
| B. | ANALYSIS OF BUSINESS SEGMENT RESULTS |
Financial information by business segment is reported in accordance with the internal reporting system and shows internal segment information that is used to manage and measure the performance of TotalEnergies and which is reviewed by the main operational decision-making body of TotalEnergies, namely the Executive Committee.
Due to their unusual nature or particular significance, certain transactions qualifying as “special items” are excluded from the business segment figures. In general, special items relate to transactions that are significant, infrequent or unusual. In certain instances, certain transactions such as restructuring costs or asset disposals, which are not considered to be representative of the normal course of business, may qualify as special items although they may have occurred in prior years or are likely to occur again in following years.
In accordance with IAS 2, TotalEnergies values inventories of petroleum products in its financial statements according to the First-In, First-Out (FIFO) method and other inventories using the weighted-average cost method. Under the FIFO method, the cost of inventory is based on the historic cost of acquisition or manufacture rather than the current replacement cost. In volatile energy markets, this can have a significant distorting effect on the reported income. Accordingly, the adjusted results of the Refining & Chemicals and Marketing & Services segments are presented according to the replacement cost method. This method is used to assess the segments’ performance and facilitate the comparability of the segments’ performance with those of its main competitors. In the replacement cost method, which approximates the Last-In, First-Out (LIFO) method, the variation of inventory values in the statement of income is, depending on the nature of the inventory, determined using either the month-end price differential between one period and another or the average prices of the period rather than the historical value. The inventory valuation effect is the difference between the results under the FIFO and replacement cost methods.
The effect of changes in fair value presented as an adjustment item reflects, for trading inventories and storage contracts, differences between internal measures of performance used by TotalEnergies’ Executive Committee and the accounting for these transactions under IFRS. IFRS requires that trading inventories be recorded at their fair value using period-end spot prices. In order to best reflect the management of economic exposure through derivative transactions, internal indicators used to measure performance include valuations of trading
3
inventories based on forward prices. TotalEnergies, in its trading activities, enters into storage contracts, the future effects of which are recorded at fair value in TotalEnergies’ internal economic performance. IFRS precludes recognition of this fair value effect. Furthermore, TotalEnergies enters into derivative instruments to risk manage certain operational contracts or assets. Under IFRS, these derivatives are recorded at fair value while the underlying operational transactions are recorded as they occur. Internal indicators defer the fair value on derivatives to match with the transaction occurrence.
The adjusted business segment results (adjusted operating income, adjusted net operating income, adjusted net income) are defined as replacement cost results, adjusted for special items, excluding the effect of changes in fair value. For further information on the adjustments affecting operating income on a segment-by-segment basis, and for a reconciliation of segment figures to figures reported in TotalEnergies’ interim consolidated financial statements, see pages 35 et seq. of this exhibit.
TotalEnergies measures performance at the segment level on the basis of adjusted net operating income. Net operating income comprises operating income of the relevant segment after deducting the amortization and the depreciation of intangible assets other than leasehold rights, translation adjustments and gains or losses on the sale of assets, as well as all other income and expenses related to capital employed (dividends from non-consolidated companies, income from equity affiliates and capitalized interest expenses) and after income taxes applicable to the above. The income and expenses not included in net operating income that are included in net income are interest expenses related to long-term liabilities net of interest earned on cash and cash equivalents, after applicable income taxes (net cost of net debt and non-controlling interests). Adjusted net operating income excludes the effect of the adjustments (special items and the inventory valuation effect) described above. Performance indicators excluding the adjustment items, such as adjusted incomes and ROACE are meant to facilitate the analysis of the financial performance and the comparison of income between periods.
The operational profit and assets are broken down by business segment prior to the consolidation and inter-segment adjustments.
Sales prices between business segments approximate market prices.
The profitable growth in the LNG and power integrated value chains are two of the key axes of TotalEnergies’ strategy.
In order to give more visibility to these businesses, the Board of Directors has decided that from the first quarter 2023, Integrated LNG and Integrated Power results, previously grouped in the Integrated Gas, Renewables & Power (iGRP) segment, would be reported separately as two segments.
A new reporting structure for the business segments’ financial information has been put in place, effective January 1, 2023. It is based on the following five business segments:
| - | An Integrated LNG segment covering LNG production and trading activities as well as biogas, hydrogen and gas trading activities; |
| - | An Integrated Power segment covering generation, storage, electricity trading and B2B-B2C distribution of gas and electricity; |
| - | An Exploration-Production segment; |
| - | A Refining & Chemicals segment constituting a major industrial hub comprising the activities of refining, petrochemicals and specialty chemicals. This segment also includes the activities of oil Supply, Trading and marine Shipping; |
| - | A Marketing & Services segment including the global activities of supply and marketing in the field of petroleum products; |
In addition, the Corporate segment includes holdings operating and financial activities.
This new segment reporting has been prepared in accordance with IFRS 8 and according to the same principles as the internal reporting followed by the TotalEnergies' Executive Committee.
For the Integrated LNG and Integrated Power segments, the principles for the preparation of this segment information are as follows:
- The management of balance sheet positions (including margin calls) related to to centralized markets access for LNG, gas and power activities since 2022 has been fully included in the Integrated LNG segment.
- Effects of changes in the fair value of gas and LNG positions are allocated to the operating income of Integrated LNG segment.
- Effects of changes in the fair value of power positions are allocated to the operating income of Integrated Power segment.
Due to the change in the Company's internal organizational structure affecting the composition of the business segments, the segment reporting data for the years 2021 and 2022 has been restated.
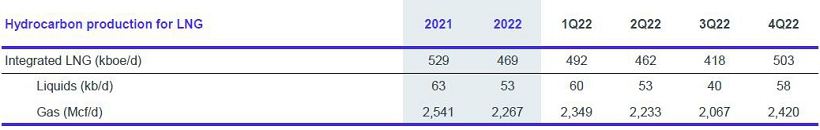
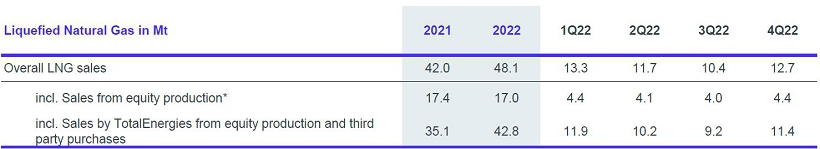
| B.1 | Integrated LNG |
1. Production

| * | The Company’s equity production may be sold by TotalEnergies or by the joint ventures. |
Hydrocarbon production for LNG was up 7% year-on-year (excluding Novatek), due to the restart of Snøhvit in Norway during the second quarter 2022.
Overall LNG sales in the first quarter of 2023 were down 17% year-on-year, mainly as a result of lower spot volumes, linked to lower demand for LNG in Europe due to the mild winter weather and high inventories.
4
2. Results
| In millions of dollars, except effective tax rate, earnings per share and number of shares | 1Q23 | 4Q22 | 1Q23 vs 4Q22 | 1Q22 | 1Q23 vs 1Q22 |
| External Sales | 4,872 | 4,628 | +5% | 5,507 | -12% |
| Operating Income | 1,138 | 1,645 | -31% | 1,841 | -38% |
| Net income (loss) from equity affiliates and other items | 804 | 1,150 | -30% | (2,495) | ns |
| Tax on net operating income | (205) | (269) | ns | (261) | ns |
| Net operating income | 1,737 | 2,526 | -31% | (915) | ns |
| Adjustments affecting net operating income | 335 | (118) | ns | 4,048 | -92% |
| Adjusted net operating income* | 2,072 | 2,408 | -14% | 3,133 | -34% |
| including income from equity affiliates | 786 | 1,213 | -35% | 1,404 | -44% |
| Organic investments | 396 | 195 | x2.0 | (61) | ns |
| Net acquisitions | 759 | 19 | x39.9 | (20) | ns |
| Net investments | 1,155 | 214 | x5.4 | (81) | ns |
| * | Detail of adjustment items shown in the business segment information starting on page 35 of this exhibit. |
Integrated LNG adjusted net operating income was $2,072 million in the first quarter 2023:
| · | down 10% quarter-on-quarter (excluding Novatek), mainly due to lower hydrocarbon prices; |
| · | down 25% year-on-year (excluding Novatek) due to lower LNG sales and prices, as well as exceptional trading results in the first quarter of 2022. |
Adjusted net operating income for the iLNG segment excludes special items and the impact of changes in fair value. In the first quarter 2023, the exclusion of special items had a positive impact of $335 million on the segment’s adjusted net operating income, compared to a positive impact of $4,048 million in the first quarter 2022.
The segment’s operating cash flow before working capital changes without financial charges (DACF)1 for Integrated LNG was $2,081 million in the first quarter 2023:
| · | down 23% quarter-on-quarter (excluding Novatek) from $2,688 million in the fourth quarter 2022, due to lower prices and a lag effect on dividend payments received from equity affiliates; |
| · | down 16% year-on-year (excluding Novatek) from $2,492 million in the first quarter 2022, due to lower prices. |
The segment’s cash flow from operating activities excluding financial charges, except those related to leases was $3,536 million for the first quarter 2023 and an increase of 59% year-on-year (excluding Novatek) from $2,219 million in the first quarter of 2022, linked to the positive impact on working capital of the decrease in margin calls and receivables, and 26.4 times greater quarter-to-quarter (excluding Novatek) from $134 million in the fourth quarter 2022.
1 DACF = debt adjusted cash flow. Operating cash flow before working capital changes without financial charge of the segment is defined as the cash flow from operating activities before changes in working capital at replacement cost, without financial charges except those related to leases, excluding the impact of contracts recognized at fair value. For information on the replacement cost method, refer to “B. Analysis of Business Segment Results”, above.
5
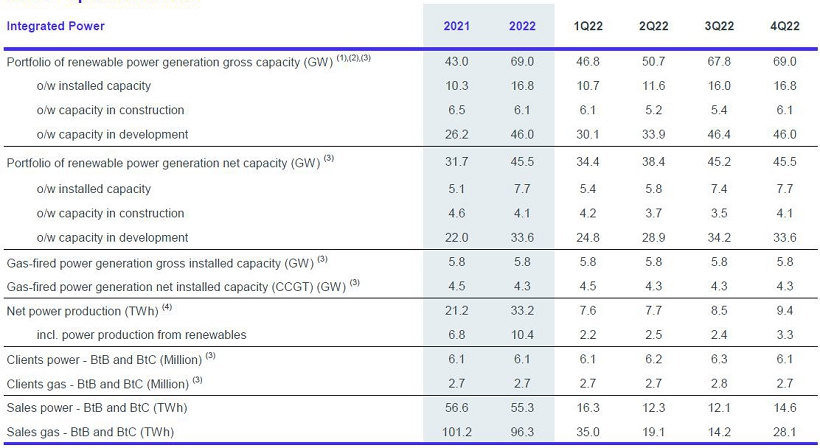
| B.2 | Integrated Power |
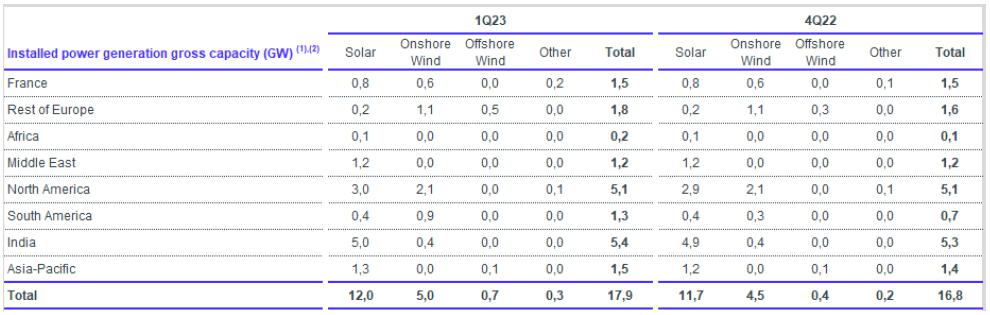
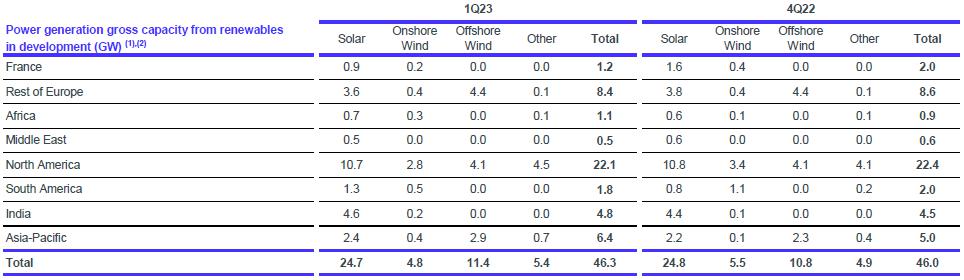
1. Capacities, productions, clients and sales
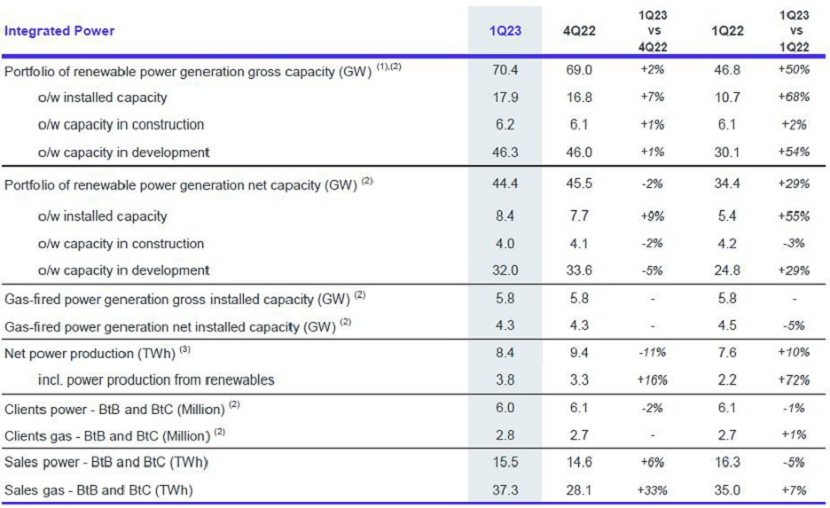
| (1) | Includes 20% of Adani Green Energy Ltd’s gross capacity effective first quarter 2021, 50% of Clearway Energy Group’s gross capacity effective third quarter 2022 and 49% of Casa dos Ventos’ gross capacity effective first quarter 2023. |
| (2) | End of period data. |
| (3) | Solar, wind, hydroelectric and combined-cycle gas turbine (CCGT) plants. |
Gross installed renewable power generation capacity was close to 18 GW at the end of the first quarter 2023, up by more than 1 GW quarter-on-quarter, including 0.6 GW from the acquisition of an interest in the Casa dos Ventos portfolio of renewable projects in Brazil and the connection of 0.3 GW from the Seagreen offshore wind project in the UK.
Net electricity generation was 8.4 TWh in the quarter:
| · | up 10% year-on-year, due to growing electricity generation from renewables, offsetting the lower generation from flexible capacity, |
| · | down 11% quarter-on-quarter due to lower flexible capacity generation in the context of lower demand, partially offset by growing renewable power generation. |
2. Results
| In millions of dollars, except effective tax rate, earnings per share and number of shares | 1Q23 | 4Q22 | 1Q23 vs 4Q22 | 1Q22 | 1Q23 vs 1Q22 |
| External Sales | 8,555 | 10,055 | -15% | 6,787 | +26% |
| Operating Income | 362 | 1,972 | -82% | (29) | ns |
| Net income (loss) from equity affiliates and other items | (70) | 103 | ns | (5) | ns |
| Tax on net operating income | (111) | (112) | ns | (33) | ns |
| Net operating income | 181 | 1,963 | -91% | (67) | ns |
| Adjustments affecting net operating income | 189 | (1,482) | ns | (15) | ns |
| Adjusted net operating income* | 370 | 481 | -23% | (82) | ns |
| including income from equity affiliates | 56 | 88 | -36% | 26 | x2.2 |
| Organic investments | 577 | 455 | +27% | 319 | +81% |
| Net acquisitions | 519 | (230) | ns | 661 | -21% |
| Net investments | 1,096 | 225 | x4.9 | 980 | +12% |
| * | Detail of adjustment items shown in the business segment information starting on page 35 of this exhibit. |
6
Integrated Power adjusted net operating income was $370 million in the first quarter 2023:
| · | up significantly year-on-year, due to the contribution from gas-fired power plants and the performance of power trading, which offset the impact of seasonality in the power marketing business, |
| · | down 23% quarter-on-quarter, notably due to the impact of seasonality in the power marketing business. |
Adjusted net operating income for the iP segment excludes special items and the impact of changes in fair value. In the first quarter 2023, the exclusion of special items had a positive impact of $189 million on the segment’s adjusted net operating income, compared to a negative impact of $15 million in the first quarter 2022.
The segment's operating cash flow from operations without financial charges (DACF)2 was $440 million in the first quarter 2023, 4.7 times greater than $93 million in the first quarter 2022, and $439 million in the fourth quarter 2022.
The segment’s cash flow from operating activities excluding financial charges, except those related to leases, excluding margin calls reported in the Integrated LNG segment since the implementation in 2022 of its centralized management was $(1,285) million in the first quarter 2023 compared to $(1,904) million in the first quarter 2022, mainly due to the negative impact on working capital of the seasonality of the power & gas marketing business (gap between a seasonal monthly cost of supply and a fixed monthly B2C clients payment estimated on the year-n-1 consumption) and $861 million in the fourth quarter 2022.
| B.3 | Exploration & Production |
1. Production

2. Results
| In millions of dollars, except effective tax rate, earnings per share and number of shares | 1Q23 | 4Q22 | 1Q23 vs 4Q22 | 1Q22 | 1Q23 vs 1Q22 |
| External Sales | 1,954 | 2,600 | -25% | 2,151 | -9% |
| Operating Income | 5,854 | 7,950 | -26% | 7,600 | -23% |
| Net income (loss) from equity affiliates and other items | 68 | (3,874) | ns | 242 | -72% |
| Effective tax rate* | 57.1% | 54.4% | - | 47.0% | - |
| Tax on net operating income | (3,398) | (4,635) | ns | (3,863) | ns |
| Net operating income | 2,524 | (559) | ns | 3,979 | -37% |
| Adjustments affecting net operating income | 129 | 4,087 | ns | 1,036 | ns |
| Adjusted net operating income** | 2,653 | 3,528 | -25% | 5,015 | -47% |
| including adjusted income from equity affiliates | 135 | 316 | -57% | 355 | -62% |
| Organic investments | 2,134 | 2,219 | -4% | 1,426 | +50% |
| Net acquisitions | 1,938 | 105 | x18.5 | 316 | x6.1 |
| Net investments | 4,072 | 2,324 | +75% | 1,742 | x2.3 |
| * | Effective tax rate = tax on adjusted net operating income / (adjusted net operating income - income from equity affiliates - dividends received from investments - impairment of goodwill + tax on adjusted net operating income). |
| ** | Detail of adjustment items shown in the business segment information starting on page 35 of this exhibit. |
Exploration & Production adjusted net operating income was $2,653 million in the first quarter 2023:
| · | down 22% quarter-on-quarter (excluding Novatek), due to lower oil and gas prices, |
| · | down 45% year-on-year (excluding Novatek) for the same reasons, as well as higher taxation, particularly in the UK. |
Adjusted net operating income for the Exploration & Production segment excludes special items. In the first quarter 2023, the exclusion of special items had a positive impact of $129 million on the segment’s adjusted net operating income, compared to a positive impact of $1,036 million in the first quarter 2022.
The segment’s operating cash flow before working capital changes without financial charges (DACF)3 in the first quarter 2023 was $4,907 million, down 2% quarter-on-quarter from $4,988 million and down 3% quarter-on-quarter (excluding Novatek), reflecting lower gas and oil prices in the first quarter 2023 and exceptional taxes during the fourth quarter 2022, notably taxes related to the European solidarity contribution.
The segment's operating cash flow from operations excluding financing charges, except those related to lease contracts, excluding the impact of contracts recognized at fair value was $4,536 million in the first quarter 2023, a decrease of 21% compared to $5,768 million in the first quarter 2022.
2 DACF = debt adjusted cash flow. Operating cash flow before working capital changes without financial charge of the segment is defined as the cash flow from operating activities before changes in working capital at replacement cost, without financial charges except those related to leases, excluding the impact of contracts recognized at fair value and including capital gains on the sale of renewable projects. For information on the replacement cost method, refer to “B. Analysis of Business Segment Results”, above.
3 DACF = debt adjusted cash flow. Operating cash flow before working capital changes without financial charge of the segment is defined as the cash flow from operating activities before changes in working capital at replacement cost, without financial charges except those related to leases. Operating cash flow before changes in working capital at replacement cost provides information on underlying cash flow without the short-term impacts of changes in inventory and other working capital elements at replacement cost. For information on the replacement cost method, refer to “B. Analysis of Business Segment Results”, above.
7
| B.4 | Downstream (Refining & Chemicals and Marketing & Services) |
1. Results
| In millions of dollars, except effective tax rate, earnings per share and number of shares | 1Q23 | 4Q22 | 1Q23 vs 4Q22 | 1Q22 | 1Q23 vs 1Q22 |
| External Sales | 47,214 | 51,287 | -8% | 54,157 | -13% |
| Operating Income | 1,708 | 947 | +80% | 2,997 | -43% |
| Net income (loss) from equity affiliates and other items | 295 | 99 | x2.0 | 114 | x3.0 |
| Tax on net operating income | (444) | (1,011) | ns | (750) | ns |
| Net operating income | 1,559 | 35 | x45 | 2,361 | -34% |
| Adjustments affecting net operating income | 339 | 1,786 | ns | (969) | ns |
| Adjusted net operating income* | 1,898 | 1,821 | +4% | 1,392 | +36% |
| Organic investments | 290 | 1,023 | -72% | 292 | -1% |
| Net acquisitions | (229) | (28) | ns | (34) | ns |
| Net investments | 61 | 995 | -94% | 258 | -76% |
| * | Detail of adjustment items shown in the business segment information starting on page 35 of this exhibit. |
The Downstream segment’s operating cash flow before working capital changes without financial charges (DACF)4 was $2,189 million in the first quarter 2023, an increase of 15% compared to $1,896 million in the first quarter 2022.
The Downstream segment’s cash flow from operating activities excluding financial charges, except those related to leases was $(1,524) million in the first quarter 2023, compared to $2,005 million in the first quarter 2022.
| B.5 | Refining & Chemicals |
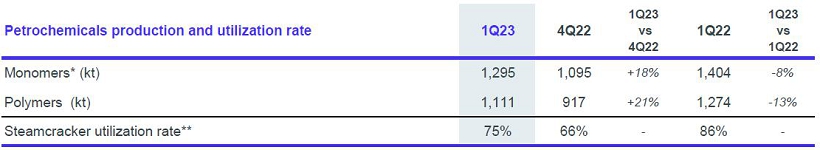
1. Refinery and petrochemicals throughput and utilization rates
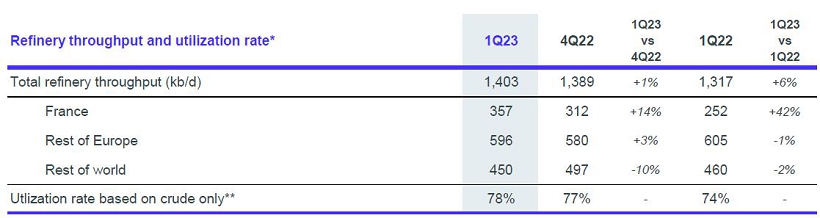
| * | Includes refineries in Africa reported in the Marketing & Services segment. |
| ** | Based on distillation capacity at the beginning of the year. |
| * | Olefins. |
| ** | Based on olefins production from steam crackers and their treatment capacity at the start of the year. |
Refined volumes were up 6% year-on-year, notably due to the restart of the Donges refinery in France in the second quarter 2022.
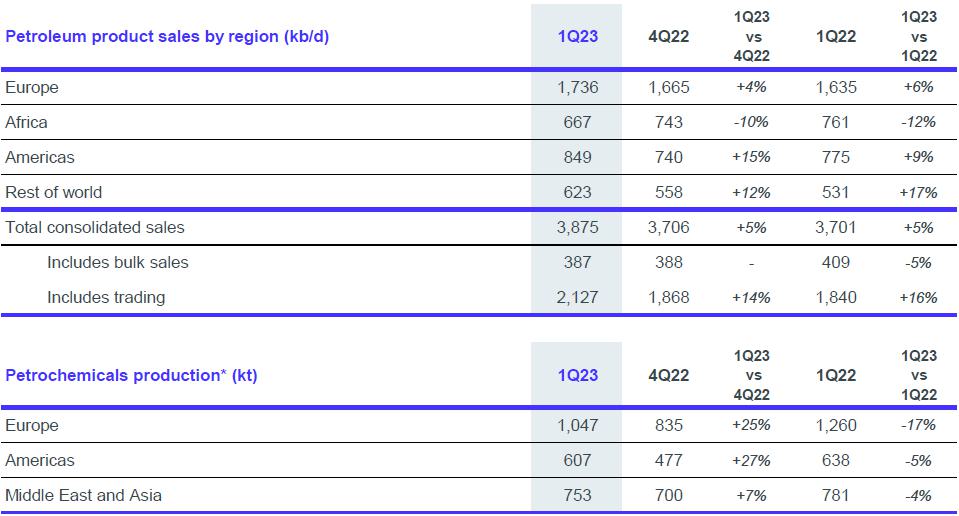
Petrochemical production was down 8% year-on-year for monomers and 13% for polymers, due to slowing global demand.
4 DACF= debt adjusted cash flow. Operating cash flow before working capital changes without financial charges of the segment is defined as cash flow from operating activities before changes in working capital at replacement cost, without financial charges except those related to leases. Operating cash flow before changes in working capital at replacement cost provides information on underlying cash flow without the short-term impacts of changes in inventory and other working capital elements at replacement cost. For information on the replacement cost method, refer to “B. Analysis of Business Segment Results”, above.
8
2. Results
| In millions of dollars, except effective tax rate, earnings per share and number of shares | 1Q23 | 4Q22 | 1Q23 vs 4Q22 | 1Q22 | 1Q23 vs 1Q22 |
| External Sales | 24,855 | 26,650 | -7% | 31,008 | -20% |
| Operating Income | 1,426 | 681 | x2.1 | 2,302 | -38% |
| Net income (loss) from equity affiliates and other items | 52 | 161 | -68% | 156 | -68% |
| Tax on net operating income | (325) | (898) | ns | (525) | ns |
| Net operating income | 1,153 | (56) | ns | 1,933 | ns |
| Adjustments affecting net operating income | 465 | 1,543 | -70% | (813) | ns |
| Adjusted net operating income* | 1,618 | 1,487 | +9% | 1,120 | +44% |
| Organic investments | 198 | 585 | -66% | 197 | +1% |
| Net acquisitions | 5 | (5) | ns | - | ns |
| Net investments | 203 | 580 | -65% | 197 | +3% |
| * | Detail of adjustment items shown in the business segment information starting on page 35 of this exhibit. |
Refining & Chemicals adjusted net operating income was $1,618 million in the first quarter 2023:
| · | up 9% quarter-on-quarter, due to strong margins, |
| · | up 44% year-on-year for the same reason as well as higher refined volumes. |
Adjusted net operating income for the Refining & Chemicals segment excludes any after-tax inventory valuation effect and special items. In the first quarter 2023, the exclusion of the inventory valuation effect had a positive impact of $327 million on the segment’s adjusted net operating income, compared to a negative impact of $845 million in the first quarter 2022. In the first quarter 2023, the exclusion of special items had a positive impact of $138 million on the segment’s adjusted net operating income, compared to a positive impact of $32 million in the first quarter 2022.
The segment’s operating cash flow before working capital changes without financial charges (DACF)5 was $1,733 million in the first quarter of 2023, up 51% quarter-on-quarter, taking into account the fourth quarter 2022 negative impact of the European solidarity contribution for refining activities of $0.7 billion.
The segment’s cash flow from operating activities excluding financial changes, except those related to leases was $(851) million in the first quarter of 2023 compared to $1,107 million in the first quarter 2022, due to the negative impact on working capital of an increase in inventories linked to strikes in France in March.
| B.6 | Marketing & Services |
1. Petroleum product sales

| * | Excludes trading and bulk refining sales. |
In the first quarter 2023, sales of petroleum products were down 6% quarter-on-quarter and year-on-year, due to lower industrial demand in Europe linked to higher prices for petroleum products, partially offset by the recovery in aviation activities.
5 DACF = debt adjusted cash flow. Operating cash flow before working capital changes without financial charge of the segment is defined as the cash flow from operating activities before changes in working capital at replacement cost, without financial charges except those related to leases. Operating cash flow before changes in working capital at replacement cost provides information on underlying cash flow without the short-term impacts of changes in inventory and other working capital elements at replacement cost. For information on the inventory effect and replacement cost method, refer to “B. Analysis of Business Segment Results”, above.
9
2. Results
| In millions of dollars, except effective tax rate, earnings per share and number of shares | 1Q23 | 4Q22 | 1Q23 vs 4Q22 | 1Q22 | 1Q23 vs 1Q22 |
| External Sales | 22,359 | 24,637 | -9% | 23,149 | -3% |
| Operating Income | 282 | 266 | +6% | 695 | -59% |
| Net income (loss) from equity affiliates and other items | 243 | (62) | ns | (42) | ns |
| Tax on net operating income | (119) | (113) | ns | (225) | ns |
| Net operating income | 406 | 91 | x4.5 | 428 | -5% |
| Adjustments affecting net operating income | (126) | 243 | ns | (156) | ns |
| Adjusted net operating income* | 280 | 334 | -16% | 272 | +3% |
| Organic investments | 92 | 438 | -79% | 95 | -3% |
| Net acquisitions | (234) | (23) | ns | (34) | ns |
| Net investments | (142) | 415 | ns | 61 | ns |
| * | Detail of adjustment items shown in the business segment information starting on page 35 of this exhibit. |
Marketing & Services adjusted net operating income was $280 million in the first quarter 2023, up 3% year-on-year, mainly thanks to the strong performance of the retail network activities.
Adjusted net operating income for the Marketing & Services segment excludes any after-tax inventory valuation effect and special items. In the first quarter 2023, the exclusion of the inventory valuation effect had a positive impact of $64 million on the segment’s adjusted net operating income, compared to a negative impact of $228 million in the first quarter 2022. In the first quarter 2023, the exclusion of special items had a negative impact of $190 million on the segment’s adjusted net operating income, compared to a positive impact of $72 million in the first quarter 2022.
The segment’s operating cash flow before working capital changes without financial charges (DACF)6 was $456 million in the first quarter of 2023, down 2% quarter-on-quarter.
The segment’s cash flow from operating activities excluding financial changes, except those related to leases was $(673) million in the first quarter of 2023 compared to $898 million in the first quarter of 2022, due to the negative impact of lower prices on working capital.
| C. | TOTALENERGIES RESULTS |
1. Net income (TotalEnergies share)
Net income (TotalEnergies share) was $5,557 million in the first quarter 2023, x1.1 times greater than $4,944 million in first quarter 2022. Adjusted net income (TotalEnergies share) was $6,541 million in the first quarter 2023 versus $8,977 million in the first quarter of 2022, mainly due to lower oil and gas prices.
Adjusted net income excludes the after-tax inventory effect, special items and the impact of changes in fair value(7).
Adjustments to net income(8) were $(984) million in the first quarter 2023, consisting mainly of:
| · | $(0.4) billion of inventory effect, | |
| · | $(0.4) billion effects of changes in fair value, | |
| · | $(0.2) billion related to the impacts of the European solidarity contribution and the inframarginal income contribution in France. |
6 DACF = debt adjusted cash flow. Operating cash flow before working capital changes without financial charge of the segment is defined as the cash flow from operating activities before changes in working capital at replacement cost, without financial charges except those related to leases. Operating cash flow before changes in working capital at replacement cost provides information on underlying cash flow without the short-term impacts of changes in inventory and other working capital elements at replacement cost. For information on the inventory effect and replacement cost method, refer to “B. Analysis of Business Segment Results”, above.
7 Details shown on page 16 of this exhibit.
8 Details shown on pages 16 and 25 et seq. of this exhibit.
10
2. Fully-diluted shares and share buybacks
As of March 31, 2023, the number of diluted shares was 2,468 million.
As part of its shareholder return policy, TotalEnergies repurchased 32.2 million shares for cancellation in the first quarter of 2023 for $2 billion.
3. Acquisitions - asset sales
Acquisitions were $3,256 million in the first quarter 2023, notably for:
| · | the acquisition of a 20% interest in the SARB/ Umm Lulu concession in the United Arab Emirates, |
| · | payments related to the acquisition of a 6.25% stake in the NFE LNG project in Qatar, |
| · | a 34% stake in a joint venture with Casa dos Ventos in Brazil. |
Divestments were $269 million in the first quarter 2023, mainly related to the sale of 50% of the Marketing & Services subsidiary in Egypt.
4. Cash flow
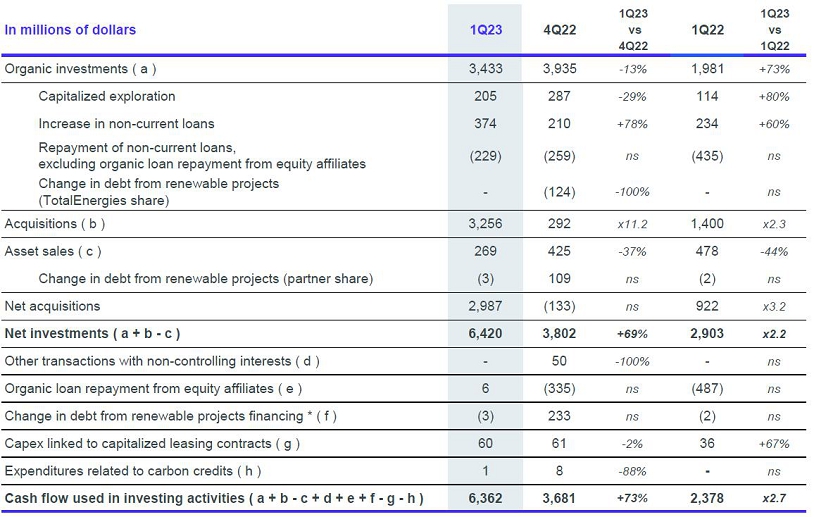
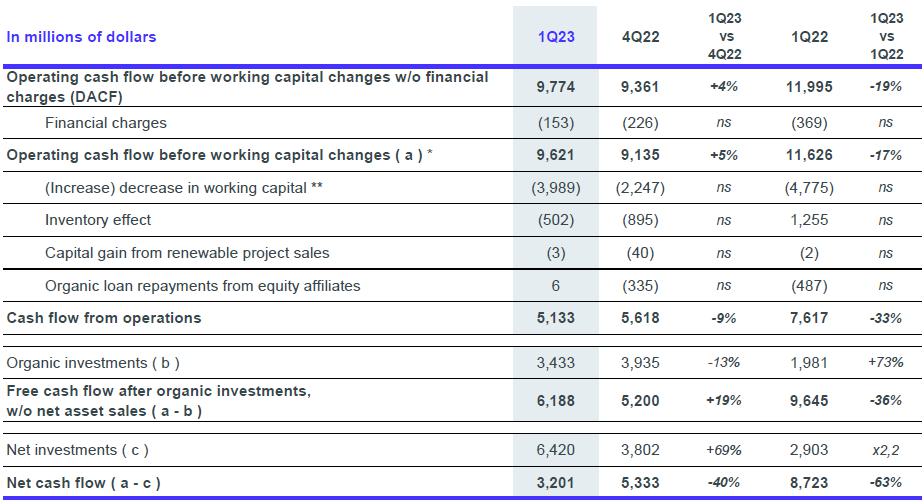
In the first quarter 2023, cash flow from operating activities was $5,133 million compared to $9,621 million of operating cash flow before working capital changes9, reflecting the $4.5 billion increase in working capital requirements, mainly due to the effects of lower prices on tax and trade payables due to lower prices, higher crude and petroleum product inventories notably due to the strikes in France, and the seasonality of the gas and power marketing business.
TotalEnergies’ cash flow from operating activities was $5,133 million in the first quarter 2023, a decrease of 33% compared to $7,617 million in the first quarter 2022.
The change in working capital as determined using the replacement cost method excluding the mark-to-market effect of Integrated LNG and Integrated Power’s contracts, including capital gain from renewable project sales (effective first quarter 2020) and including organic loan repayment from equity affiliates was an increase of $4,488 million in the first quarter 2023, compared to an increase of $4,009 million in the first quarter 2022.
In the first quarter 2023, the change in working capital was an increase of $3,419 million in accordance with IFRS. The difference of $1,069 million between IFRS and replacement cost method corresponds to the following adjustments: (i) the pre-tax inventory valuation effect of $502 million, (ii) plus the mark-to-market effect of Integrated LNG and Integrated Power’s contracts of $570 million, (iii) plus the capital gains from renewables project sale of $3 million and (iv) less the organic loan repayments from equity affiliates of $6 million.
Operating cash flow before working capital changes10 was $9,621 million in the first quarter 2023, down 17% compared to $11,626 million in the first quarter 2022.
Operating cash flow before working capital changes without financial charges (DACF)11 was $9,774 million in the first quarter 2023, down 19% compared to $11,995 million in the first quarter 2022.
TotalEnergies' net cash flow12 was $3,201 million in the first quarter 2023 compared to $8,723 million a year earlier, given the $2,005 million decrease in cash flow and the $3,517 million increase in net investments to $6,420 million this quarter.
| D. | PROFITABILITY |
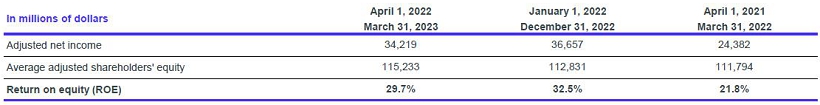
Return on equity was 29.7% for the twelve months ended March 31, 2023.
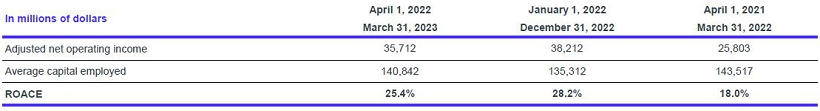
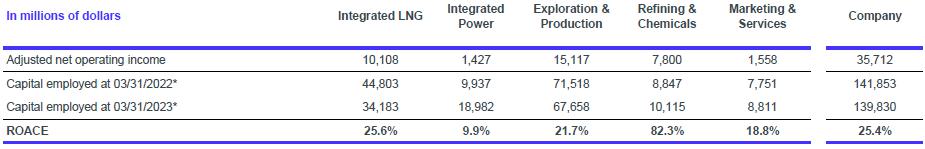
Return on average capital employed was 25.4% for the twelve months ended March 31, 2023.
9 Operating cash flow before working capital changes is defined as cash flow from operating activities before changes in working capital at replacement cost, excluding the mark-to-market effect of Integrated LNG and Integrated Power contracts and including capital gains from renewable projects sales. For information on the replacement cost method, refer to “B. Analysis of Business Segment Results”, above. The reconciliation table for different cash flow figures is set forth under “Cash Flow” on page 18 of this exhibit.
10 Operating cash flow before working capital changes, is defined as cash flow from operating activities before changes in working capital at replacement cost, excluding the mark-to-market effect of Integrated LNG and Integrated Power contracts and including capital gains from renewable projects sales. For information on the replacement cost method, refer to “B. Analysis of Business Segment Results”, above. The reconciliation table for different cash flow figures is set forth under “Cash Flow” on page 18 of this exhibit.
11 DACF = debt adjusted cash flow, is defined as cash flow from operating activities before changes in working capital at replacement cost, without financial charges.
12 Net cash flow = operating cash flow before working capital changes - net investments (including other transactions with non-controlling interests
11
| E. | Annual 2023 Sensitivities* |
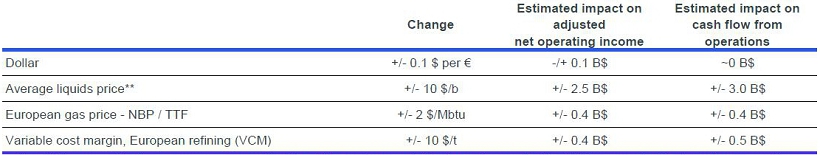
* Sensitivities are revised once per year upon publication of the previous year’s fourth quarter results. Sensitivities are estimates based on assumptions about TotalEnergies’ portfolio in 2023. Actual results could vary significantly from estimates based on the application of these sensitivities. The impact of the $-€ sensitivity on adjusted net operating income is essentially attributable to Refining & Chemicals.
** In a 80 $/b Brent environment.
| F. | SUMMARY AND OUTLOOK |
After briefly falling below $75/b in mid-March, oil prices rose above $80/b in April, notably due to the decision by some OPEC+ countries to reduce their production quotas to stabilize a market marked by fears of financial crisis and recession.
After several quarters of exceptionally high diesel cracks, European refining margins are easing down because of lower economic growth expectations and high products inventories fueled by Chinese exports and the quicker than anticipated reorganization of Russian flows following the European embargo. Demand for petroleum products could be supported in the coming weeks by the entry into the driving season in the US for gasoline, as well as the global recovery of air traffic for aviation fuel.
Given the evolution of oil and gas prices in recent months and the lag effect on price formulas, TotalEnergies anticipates that its average LNG selling price should be between $10-12/Mbtu in the second quarter 2023.
Given the high inventory levels at the end of winter, European and Asian gas prices are expected to remain stable in the second quarter before rebounding in the second half 2023, driven by restocking gas in Europe before winter and the demand recovery in China, in a context of limited LNG production growth. Futures markets anticipate prices in the range of $18/Mbtu for winter 2023-24.
For the second quarter 2023, TotalEnergies anticipates a hydrocarbon production around 2.5 Mboe/d, LNG sales that should benefit from the restart of Freeport LNG and a utilization rate in refineries up to more than 80% given the end of strikes in France.
The Company confirms its guidance for net investments between $16-18 billion in 2023, including $5 billion in low-carbon energies.
12
FORWARD-LOOKING STATEMENTS
This document may contain forward-looking statements within the meaning of the Private Securities Litigation Reform Act of 1995, notably with respect to the financial condition, results of operations, business activities and industrial strategy of TotalEnergies. This document may also contain statements regarding the perspectives, objectives, areas of improvement and goals of TotalEnergies, including with respect to climate change and carbon neutrality (net zero emissions). An ambition expresses an outcome desired by TotalEnergies, it being specified that the means to be deployed do not depend solely on TotalEnergies. These forward-looking statements may generally be identified by the use of the future or conditional tense or forward-looking words such as “envisions”, “intends”, “anticipates”, “believes”, “considers”, “plans”, “expects”, “thinks”, “targets”, “aims” or similar terminology. Such forward-looking statements included in this document are based on economic data, estimates and assumptions prepared in a given economic, competitive and regulatory environment and considered to be reasonable by TotalEnergies as of the date of this document.
These forward-looking statements are not historical data and should not be interpreted as assurances that the perspectives, objectives or goals announced will be achieved. They may prove to be inaccurate in the future, and may evolve or be modified with a significant difference between the actual results and those initially estimated, due to the uncertainties notably related to the economic, financial, competitive and regulatory environment, or due to the occurrence of risk factors, such as, notably, the price fluctuations in crude oil and natural gas, the evolution of the demand and price of petroleum products, the changes in production results and reserves estimates, the ability to achieve cost reductions and operating efficiencies without unduly disrupting business operations, changes in laws and regulations including those related to the environment and climate, currency fluctuations, as well as economic and political developments, changes in market conditions, loss of market share and changes in consumer preferences, or pandemics such as the COVID-19 pandemic. Additionally, certain financial information is based on estimates particularly in the assessment of the recoverable value of assets and potential impairments of assets relating thereto.
Except for its ongoing obligations to disclose material information as required by applicable securities laws, TotalEnergies does not have any intention or obligation to update forward-looking statements after the distribution of this document, even if new information, future events or other circumstances have made them incorrect or misleading.
For additional factors, you should read the information set forth under “Item 3. -3.1 Risk Factors”, “Item 4. Information on the Company”, “Item 5. Operating and Financial Review and Prospects” and “Item 11. Quantitative and Qualitative Disclosures about Market Risk” in TotalEnergies’ Form 20-F for the year ended December 31, 2022.
13
OPERATING INFORMATION BY SEGMENT
Company’s production (Exploration & Production + Integrated LNG)

14
Downstream (Refining & Chemicals and Marketing & Services)
| * | Olefins, polymers. |
INTEGRATED POWER
15

| (1) | Includes 20% of the gross capacities of Adani Green Energy Limited, 50% of Clearway Energy Group and, from 1Q23, 49% of Casa dos Ventos. |
| (2) | End-of-period data. |
ADJUSTMENT ITEMS TO NET INCOME (TOTALENERGIES SHARE)

16
RECONCILIATION OF NET INCOME (TOTALENERGIES SHARE) TO ADJUSTED EBITDA
INVESTMENTS – DIVESTMENTS
| * | Change in debt from renewable projects (TotalEnergies share and partner share). |
17
CASH FLOW
| * | Operating cash flow before working capital changes, is defined as cash flow from operating activities before changes in working capital at replacement cost, excluding the mark-to-market effect of Integrated LNG and Integrated Power sectors’ contracts and including capital gain from renewable projects sale. Historical data have been restated to cancel the impact of fair valuation of Integrated LNG and Integrated Power sectors’ contracts. |
| ** | Changes in working capital are presented excluding the mark-to-market effect of Integrated LNG and Integrated Power sectors’ contracts. |
GEARING RATIO

| (1) | Excludes leases receivables and leases debts. |
| (2) | Including initial margins held as part of the Company's activities on organized markets. |
18
RETURN ON AVERAGE CAPITAL EMPLOYED
Twelve months ended March 31, 2023
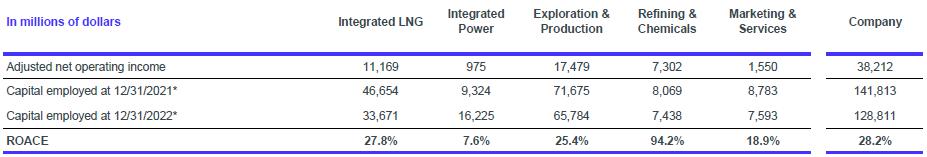
Full year 2022
| * | At replacement cost (excluding after-tax inventory effect). |
MAIN INDICATORS
| 1Q23 | 4Q22 | 3Q22 | 2Q22 | 1Q22 | |
| €/$ | 1.07 | 1.02 | 1.01 | 1.06 | 1.12 |
| Brent ($/b) | 81.2 | 88.8 | 100.8 | 113.9 | 102.2 |
| Average liquids price* ($/b) | 73.4 | 80.6 | 93.6 | 102.9 | 90.1 |
| Average gas price* (1) ($/Mbtu) | 8.89 | 12.74 | 16.83 | 11.01 | 12.27 |
| Average LNG price** (1) ($/Mbtu) | 13.27 | 14.83 | 21.51 | 13.96 | 13.60 |
| Variable Cost Margin, European refining*** ($/t) | 87.8 | 73.6 | 99.2 | 145.7 | 46.3 |
* Sales in $ / sales in volume for consolidated affiliates.
** Sales in $ / sales in volume for consolidated and equity affiliates.
(1) Does not take into account gas and LNG trading activities, which results are expected to be significantly higher compared to the third quarter 2021, capturing optimization opportunities generated by large LNG trading portfolio in the prevailing high gas spot price environment.
*** This indicator represents the average margin on variable costs realized by TotalEnergies’ European refining business (equal to the difference between the sales of refined products realized by TotalEnergies’ European refining and the crude purchases as well as associated variable costs, divided by refinery throughput in tons).
Disclaimer: Data is based on TotalEnergies’ reporting and is not audited.
19
| RESTATED KEY FIGURES FOR 2021 AND 2022 FOR INTEGRATED LNG AND INTEGRATED POWER SEGMENTS |
| 1. Integrated LNG |
| 1.1 Operational data |
* The Company's equity production may be sold by TotalEnergies or by the joint-ventures.
1.2 Restated key figures
| In millions of dollars | 2021 | 2022 | 1Q22 | 2Q22 | 3Q22 | 4Q22 |
| Adjusted net operating income | 5,591 | 11,169 | 3,133 | 2,215 | 3,413 | 2,408 |
| including adjusted income from equity affiliates | 2,659 | 5,637 | 1,404 | 1,192 | 1,828 | 1,213 |
| Organic investments | 2,061 | 519 | (61) | 171 | 213 | 195 |
| Net acquisitions | (910) | (47) | (20) | (36) | (10) | 19 |
| Net investments | 1,151 | 472 | (81) | 135 | 203 | 214 |
Including the centralized management of balance sheet positions (including margin calls) related to single market access for LNG, gas and power activities since 2022.
Effects of changes in fair value in gas and LNG positions are allocated to the operating income of Integrated LNG sector
Effects of changes in fair value in power positions are allocated to the operating income of Integrated Power sector.
The segment’s operating cash flow before working capital changes without financial charges (DACF)13 was $5,404 million in 2021, $9,784 million in 2022, $2,492 million in the first quarter of 2022, $2,112 million in second quarter of 2022, $2,492 million in third quarter of 2022 and $2,688 million in fourth quarter of 2022.
13 DACF = debt adjusted cash flow. Operating cash flow before working capital changes without financial charge of the segment is defined as the cash flow from operating activities before changes in working capital at replacement cost, without financial charges except those related to leases excluding the impact of contracts recognized at fair value for the sector.
20
The segment's operating cash flow from operations excluding financing charges, except those related to lease contracts was $(2,765) million in 2021, $9,604 million in 2022, $2,219 million in the first quarter of 2022, $3,802 million in second quarter of 2022, $3,449 million in the third quarter of 2022 and $134 million in the fourth quarter of 2022.
The segment’s capital employed end of period was: $46,654 million in 2021, $33,671 million in 2022, $44,803 million in the first quarter of 2022, $41,606 million in the second quarter of 2022, $37,742 million in the third quarter of 2022 and $33,671 million in the fourth quarter of 2022.
| 2 | Integrated Power |
| 2.1 | Operational data |
| (1) | Includes 20% of Adani Green Energy Ltd’s gross capacity effective first quarter 2021. |
| (2) | Includes 50% of Clearway Energy Group’s gross capacity effective third quarter 2022. |
| (3) | End of period data. |
| (4) | Solar, wind, hydroelectric and combined-cycle gas turbine (CCGT) plants. |
| 2.2 | Restated key figures |
| In millions of dollars | 2021 | 2022 | 1Q22 | 2Q22 | 3Q22 | 4Q22 |
| Adjusted net operating income | 652 | 975 | (82) | 340 | 236 | 481 |
| including adjusted income from equity affiliates | 37 | 201 | 26 | 27 | 60 | 88 |
| Organic investments | 1,280 | 1,385 | 319 | 170 | 440 | 455 |
| Net acquisitions | 2,075 | 2,136 | 661 | (22) | 1,728 | (230) |
| Net investments | 3,355 | 3,521 | 980 | 148 | 2,168 | 225 |
Excluding the centralized management of balance sheet positions (including margin calls) related to single market access for LNG, gas and power activities since 2022.
Effects of changes in fair value in gas and LNG positions are allocated to the operating income of Integrated LNG sector
Effects of changes in fair value in power positions are allocated to the operating income of Integrated Power sector.
The segment’s operating cash flow before working capital changes without financial charges (DACF)14 was $720 million in 2021, $970 million in 2022, $93 million in the first quarter of 2022, $248 million in the second quarter of 2022, $191 million in the third quarter of 2022 and $439 million in the fourth quarter of 2022.
The segment's operating cash flow from operations excluding financing charges, except those related to lease contracts was $3,592 million in 2021, $66 million in 2022, $(1,904) million in the first quarter of 2022, $168 million in the second quarter of 2022, $941 million in the third quarter of 2022 and $861 million in the fourth quarter of 2022.
The segment’s capital employed end of period was: $9,324 million in 2021, $16,225 million in 2022, $9,937 million in the first quarter of 2022, $12,568 million in the second quarter of 2022, $17,181 million in the third quarter of 2022 and $16,225 million in the fourth quarter of 2022.
14 DACF = debt adjusted cash flow. Operating cash flow before working capital changes without financial charge of the segment is defined as the cash flow from operating activities before changes in working capital at replacement cost, without financial charges except those related to leases excluding the impact of contracts recognized at fair value for the sector and including capital gains on the sale of renewable projects.
21
CONSOLIDATED STATEMENT OF INCOME
| TotalEnergies | ||||||
| (unaudited) | ||||||
| 1st quarter | 4th quarter | 1st quarter | ||||
| (M$)(a) | 2023 | 2022 | 2022 | |||
| Sales | 62,603 | 68,582 | 68,606 | |||
| Excise taxes | (4,370) | (4,629) | (4,656) | |||
| Revenues from sales | 58,233 | 63,953 | 63,950 | |||
| Purchases, net of inventory variation | (38,351) | (41,555) | (39,648) | |||
| Other operating expenses | (7,785) | (7,354) | (7,623) | |||
| Exploration costs | (92) | (250) | (861) | |||
| Depreciation, depletion and impairment of tangible assets and mineral interests | (3,062) | (2,505) | (3,679) | |||
| Other income | 341 | 584 | 143 | |||
| Other expense | (300) | (2,828) | (2,290) | |||
| Financial interest on debt | (710) | (719) | (462) | |||
| Financial income and expense from cash & cash equivalents | 393 | 357 | 214 | |||
| Cost of net debt | (317) | (362) | (248) | |||
| Other financial income | 258 | 266 | 203 | |||
| Other financial expense | (183) | (150) | (135) | |||
| Net income (loss) from equity affiliates | 960 | (281) | 43 | |||
| Income taxes | (4,071) | (6,077) | (4,804) | |||
| Consolidated net income | 5,631 | 3,441 | 5,051 | |||
| TotalEnergies share | 5,557 | 3,264 | 4,944 | |||
| Non-controlling interests | 74 | 177 | 107 | |||
| Earnings per share ($) | 2.23 | 1.27 | 1.87 | |||
| Fully-diluted earnings per share ($) | 2.21 | 1.26 | 1.85 | |||
| (a) Except for per share amounts. | ||||||
22
| CONSOLIDATED STATEMENT OF COMPREHENSIVE INCOME | |||||
| TotalEnergies | |||||
| (unaudited) | |||||
| 1st quarter | 4th quarter | 1st quarter | |||
| (M$) | 2023 | 2022 | 2022 | ||
| Consolidated net income | 5,631 | 3,441 | 5,051 | ||
| Other comprehensive income | |||||
| Actuarial gains and losses | 3 | 387 | - | ||
| Change in fair value of investments in equity instruments | 4 | (2) | 3 | ||
| Tax effect | (8) | (56) | 11 | ||
| Currency translation adjustment generated by the parent company | 1,466 | 6,800 | (1,750) | ||
| Items not potentially reclassifiable to profit and loss | 1,465 | 7,129 | (1,736) | ||
| Currency translation adjustment | (1,250) | (3,672) | 1,012 | ||
| Cash flow hedge | 1,202 | (9,669) | (263) | ||
| Variation of foreign currency basis spread | (3) | (14) | 49 | ||
| share of other comprehensive income of equity affiliates, net amount | (98) | 842 | (84) | ||
| Other | 3 | 3 | - | ||
| Tax effect | (336) | 2,932 | 53 | ||
| Items potentially reclassifiable to profit and loss | (482) | (9,578) | 767 | ||
| Total other comprehensive income (net amount) | 983 | (2,449) | (969) | ||
| Comprehensive income | 6,614 | 992 | 4,082 | ||
| TotalEnergies share | 6,550 | 792 | 3,953 | ||
| Non-controlling interests | 64 | 200 | 129 | ||
23
| CONSOLIDATED BALANCE SHEET | |||||
| TotalEnergies | |||||
| March 31, 2023 | December 31, 2022 | March 31, 2022 | |||
| (M$) | (unaudited) | (unaudited) | (unaudited) | ||
| ASSETS | |||||
| Non-current assets | |||||
| Intangible assets, net | 33,234 | 31,931 | 32,504 | ||
| Property, plant and equipment, net | 107,499 | 107,101 | 104,450 | ||
| Equity affiliates : investments and loans | 29,997 | 27,889 | 29,334 | ||
| Other investments | 1,209 | 1,051 | 1,490 | ||
| Non-current financial assets | 2,357 | 2,731 | 1,490 | ||
| Deferred income taxes | 4,772 | 5,049 | 5,299 | ||
| Other non-current assets | 2,709 | 2,388 | 3,033 | ||
| Total non-current assets | 181,777 | 178,140 | 177,600 | ||
| Current assets | |||||
| Inventories, net | 22,786 | 22,936 | 24,456 | ||
| Accounts receivable, net | 24,128 | 24,378 | 32,000 | ||
| Other current assets | 28,153 | 36,070 | 50,976 | ||
| Current financial assets | 7,535 | 8,746 | 7,415 | ||
| Cash and cash equivalents | 27,985 | 33,026 | 31,276 | ||
| Assets classified as held for sale | 668 | 568 | 856 | ||
| Total current assets | 111,255 | 125,724 | 146,979 | ||
| Total assets | 293,032 | 303,864 | 324,579 | ||
| LIABILITIES & SHAREHOLDERS' EQUITY | |||||
| Shareholders' equity | |||||
| Common shares | 7,828 | 8,163 | 8,137 | ||
| Paid-in surplus and retained earnings | 123,357 | 123,951 | 123,008 | ||
| Currency translation adjustment | (12,784) | (12,836) | (13,643) | ||
| Treasury shares | (2,820) | (7,554) | (1,022) | ||
| Total shareholders' equity - TotalEnergies Share | 115,581 | 111,724 | 116,480 | ||
| Non-controlling interests | 2,863 | 2,846 | 3,375 | ||
| Total shareholders' equity | 118,444 | 114,570 | 119,855 | ||
| Non-current liabilities | |||||
| Deferred income taxes | 11,300 | 11,021 | 11,281 | ||
| Employee benefits | 1,840 | 1,829 | 2,610 | ||
| Provisions and other non-current liabilities | 21,270 | 21,402 | 21,649 | ||
| Non-current financial debt | 42,915 | 45,264 | 46,546 | ||
| Total non-current liabilities | 77,325 | 79,516 | 82,086 | ||
| Current liabilities | |||||
| Accounts payable | 36,037 | 41,346 | 46,869 | ||
| Other creditors and accrued liabilities | 42,578 | 52,275 | 56,972 | ||
| Current borrowings | 17,884 | 15,502 | 18,252 | ||
| Other current financial liabilities | 597 | 488 | 502 | ||
| Liabilities directly associated with the assets classified as held for sale | 167 | 167 | 43 | ||
| Total current liabilities | 97,263 | 109,778 | 122,638 | ||
| Total liabilities & shareholders' equity | 293,032 | 303,864 | 324,579 |
24
| CONSOLIDATED STATEMENT OF CASH FLOW | |||||
| TotalEnergies | |||||
| (unaudited) | |||||
| 1st quarter | 4th quarter | 1st quarter | |||
| (M$) | 2023 | 2022 | 2022 | ||
| CASH FLOW FROM OPERATING ACTIVITIES | |||||
| Consolidated net income | 5,631 | 3,441 | 5,051 | ||
| Depreciation, depletion, amortization and impairment | 3,187 | 2,749 | 4,578 | ||
| Non-current liabilities, valuation allowances and deferred taxes | 314 | (75) | 2,538 | ||
| (Gains) losses on disposals of assets | (252) | 2,192 | (13) | ||
| Undistributed affiliates' equity earnings | (349) | 1,506 | 262 | ||
| (Increase) decrease in working capital | (3,419) | (3,791) | (4,923) | ||
| Other changes, net | 21 | (404) | 124 | ||
| Cash flow from operating activities | 5,133 | 5,618 | 7,617 | ||
| CASH FLOW USED IN INVESTING ACTIVITIES | |||||
| Intangible assets and property, plant and equipment additions | (4,968) | (4,097) | (3,457) | ||
| Acquisitions of subsidiaries, net of cash acquired | (136) | (4) | - | ||
| Investments in equity affiliates and other securities | (1,407) | (260) | (89) | ||
| Increase in non-current loans | (389) | (211) | (241) | ||
| Total expenditures | (6,900) | (4,572) | (3,787) | ||
| Proceeds from disposals of intangible assets and property, plant and equipment | 68 | 113 | 177 | ||
| Proceeds from disposals of subsidiaries, net of cash sold | 183 | 160 | 88 | ||
| Proceeds from disposals of non-current investments | 49 | 23 | 215 | ||
| Repayment of non-current loans | 238 | 595 | 929 | ||
| Total divestments | 538 | 891 | 1,409 | ||
| Cash flow used in investing activities | (6,362) | (3,681) | (2,378) | ||
| CASH FLOW USED IN FINANCING ACTIVITIES | |||||
| Issuance (repayment) of shares: | |||||
| - Parent company shareholders | - | - | - | ||
| - Treasury shares | (2,103) | (2,551) | (1,176) | ||
| Dividends paid: | |||||
| - Parent company shareholders | (1,844) | (4,356) | (1,928) | ||
| - Non-controlling interests | (21) | (12) | (22) | ||
| Net issuance (repayment) of perpetual subordinated notes | - | - | 1,958 | ||
| Payments on perpetual subordinated notes | (158) | (51) | (136) | ||
| Other transactions with non-controlling interests | (86) | (82) | 5 | ||
| Net issuance (repayment) of non-current debt | 118 | 425 | 34 | ||
| Increase (decrease) in current borrowings | (1,274) | (3,500) | 657 | ||
| Increase (decrease) in current financial assets and liabilities | 1,394 | 3,554 | 5,594 | ||
| Cash flow from (used in) financing activities | (3,974) | (6,573) | 4,986 | ||
| Net increase (decrease) in cash and cash equivalents | (5,203) | (4,636) | 10,225 | ||
| Effect of exchange rates | 162 | 1,721 | (291) | ||
| Cash and cash equivalents at the beginning of the period | 33,026 | 35,941 | 21,342 | ||
| Cash and cash equivalents at the end of the period | 27,985 | 33,026 | 31,276 | ||
25
| CONSOLIDATED STATEMENT OF CHANGES IN SHAREHOLDERS' EQUITY | ||||||||||||
| TotalEnergies | ||||||||||||
| (unaudited) | ||||||||||||
| Common shares issued | Paid-in | Currency | Treasury shares | Shareholders' | Non- | Total | ||||||
| (M$) | Number | Amount | surplus and retained earnings | translation adjustment | Number | Amount | equity - | controlling interests | shareholders' equity | |||
| As of January 1, 2022 | 2,640,429,329 | 8,224 | 117,849 | (12,671) | (33,841,104) | (1,666) | 111,736 | 3,263 | 114,999 | |||
| Net income of the first quarter 2022 | - | - | 4,944 | - | - | - | 4,944 | 107 | 5,051 | |||
| Other comprehensive income | - | - | (19) | (972) | - | - | (991) | 22 | (969) | |||
| Comprehensive Income | - | - | 4,925 | (972) | - | - | 3,953 | 129 | 4,082 | |||
| Dividend | - | - | - | - | - | - | - | (22) | (22) | |||
| Issuance of common shares | - | - | - | - | - | - | - | - | - | |||
| Purchase of treasury shares | - | - | - | - | (22,378,128) | (1,176) | (1,176) | - | (1,176) | |||
| Sale of treasury shares(a) | - | - | (315) | - | 6,168,047 | 315 | - | - | - | |||
| Share-based payments | - | - | 92 | - | - | - | 92 | - | 92 | |||
| Share cancellation | (30,665,526) | (87) | (1,418) | - | 30,665,526 | 1,505 | - | - | - | |||
| Net issuance (repayment) of perpetual subordinated notes | - | - | 1,958 | - | - | - | 1,958 | - | 1,958 | |||
| Payments on perpetual subordinated notes | - | - | (96) | - | - | - | (96) | - | (96) | |||
Other operations with non-controlling interests | - | - | (1) | - | - | - | (1) | 6 | 5 | |||
| Other items | - | - | 14 | - | - | - | 14 | (1) | 13 | |||
| As of March 31, 2022 | 2,609,763,803 | 8,137 | 123,008 | (13,643) | (19,385,659) | (1,022) | 116,480 | 3,375 | 119,855 | |||
| Net income from April 1 to December 31, 2022 | - | - | 15,582 | - | - | - | 15,582 | 411 | 15,993 | |||
| Other comprehensive income | - | - | (2,914) | 798 | - | - | (2,116) | (24) | (2,140) | |||
| Comprehensive Income | - | - | 12,668 | 798 | - | - | 13,466 | 387 | 13,853 | |||
| Dividend | - | - | (9,989) | - | - | - | (9,989) | (514) | (10,503) | |||
| Issuance of common shares | 9,367,482 | 26 | 344 | - | - | - | 370 | - | 370 | |||
| Purchase of treasury shares | - | - | - | - | (117,829,615) | (6,535) | (6,535) | - | (6,535) | |||
| Sale of treasury shares(a) | - | - | (3) | - | 27,607 | 3 | - | - | - | |||
| Share-based payments | - | - | 137 | - | - | - | 137 | - | 137 | |||
| Share cancellation | - | - | - | - | - | - | - | - | - | |||
| Net issuance (repayment) of perpetual subordinated notes | - | - | (2,002) | - | - | - | (2,002) | - | (2,002) | |||
| Payments on perpetual subordinated notes | - | - | (235) | - | - | - | (235) | - | (235) | |||
Other operations with non-controlling interests | - | - | 46 | 9 | - | - | 55 | 31 | 86 | |||
| Other items | - | - | (23) | - | - | - | (23) | (433) | (456) | |||
| As of December 31, 2022 | 2,619,131,285 | 8,163 | 123,951 | (12,836) | (137,187,667) | (7,554) | 111,724 | 2,846 | 114,570 | |||
| Net income of the first quarter 2023 | - | - | 5,557 | - | - | - | 5,557 | 74 | 5,631 | |||
| Other comprehensive income | - | - | 913 | 80 | - | - | 993 | (10) | 983 | |||
| Comprehensive Income | - | - | 6,470 | 80 | - | - | 6,550 | 64 | 6,614 | |||
| Dividend | - | - | - | - | - | - | - | (21) | (21) | |||
| Issuance of common shares | - | - | - | - | - | - | - | - | - | |||
| Purchase of treasury shares | - | - | - | - | (33,842,858) | (2,703) | (2,703) | - | (2,703) | |||
| Sale of treasury shares(a) | - | - | (395) | - | 6,446,384 | 395 | - | - | - | |||
| Share-based payments | - | - | 54 | - | - | - | 54 | - | 54 | |||
| Share cancellation | (128,869,261) | (335) | (6,707) | - | 128,869,261 | 7,042 | - | - | - | |||
| Net issuance (repayment) of perpetual subordinated notes | - | - | - | - | - | - | - | - | - | |||
| Payments on perpetual subordinated notes | - | - | (77) | - | - | - | (77) | - | (77) | |||
Other operations with non-controlling interests | - | - | 39 | (28) | - | - | 11 | (25) | (14) | |||
| Other items | - | - | 22 | - | - | - | 22 | (1) | 21 | |||
| As of March 31, 2023 | 2,490,262,024 | 7,828 | 123,357 | (12,784) | (35,714,880) | (2,820) | 115,581 | 2,863 | 118,444 | |||
| (a)Treasury shares related to the performance share grants. | ||||||||||||
26
| INFORMATION BY BUSINESS SEGMENT | |||||||
| TotalEnergies | |||||||
| (unaudited) | |||||||
1st quarter 2023
(M$) | Integrated LNG | Integrated Power | Exploration & Production | Refining & Chemicals | Marketing & Services | Corporate | Intercompany | Total |
| External sales | 4,872 | 8,555 | 1,954 | 24,855 | 22,359 | 8 | - | 62,603 |
| Intersegment sales | 5,999 | 1,685 | 10,728 | 9,061 | 120 | 57 | (27,650) | - |
| Excise taxes | - | - | - | (184) | (4,186) | - | - | (4,370) |
| Revenues from sales | 10,871 | 10,240 | 12,682 | 33,732 | 18,293 | 65 | (27,650) | 58,233 |
| Operating expenses | (9,445) | (9,831) | (4,762) | (31,892) | (17,787) | (161) | 27,650 | (46,228) |
| Depreciation, depletion and impairment of tangible assets and mineral interests | (288) | (47) | (2,066) | (414) | (224) | (23) | - | (3,062) |
| Operating income | 1,138 | 362 | 5,854 | 1,426 | 282 | (119) | - | 8,943 |
| Net income (loss) from equity affiliates and other items | 804 | (70) | 68 | 52 | 243 | (21) | - | 1,076 |
| Tax on net operating income | (205) | (111) | (3,398) | (325) | (119) | 63 | - | (4,095) |
| Net operating income | 1,737 | 181 | 2,524 | 1,153 | 406 | (77) | - | 5,924 |
| Net cost of net debt | (293) | |||||||
| Non-controlling interests | (74) | |||||||
| Net income - TotalEnergies share | 5,557 |
1st quarter 2023 (adjustments)(a)
(M$) | Integrated LNG | Integrated Power | Exploration & Production | Refining & Chemicals | Marketing & Services | Corporate | Intercompany | Total |
| External sales | (76) | - | - | - | - | - | - | (76) |
| Intersegment sales | - | - | - | - | - | - | - | - |
| Excise taxes | - | - | - | - | - | - | - | - |
| Revenues from sales | (76) | - | - | - | - | - | - | (76) |
| Operating expenses | (300) | (70) | (8) | (424) | (101) | - | - | (903) |
| Depreciation, depletion and impairment of tangible assets and mineral interests | - | - | - | (36) | - | - | - | (36) |
| Operating income (b) | (376) | (70) | (8) | (460) | (101) | - | - | (1,015) |
| Net income (loss) from equity affiliates and other items | (4) | (111) | (73) | (37) | 217 | - | - | (8) |
| Tax on net operating income | 45 | (8) | (48) | 32 | 10 | - | - | 31 |
| Net operating income (b) | (335) | (189) | (129) | (465) | 126 | - | - | (992) |
| Net cost of net debt | 8 | |||||||
| Non-controlling interests | - | |||||||
| Net income - TotalEnergies share | (984) | |||||||
| (a) Adjustments include special items, inventory valuation effect and the effect of changes in fair value. | ||||||||
| (b) Of which inventory valuation effect | ||||||||
| - On operating income | - | - | (415) | (87) | - | |||
| - On net operating income | - | - | (327) | (64) | - | |||
1st quarter 2023 (adjusted)
(M$) | Integrated LNG | Integrated Power | Exploration & Production | Refining & Chemicals | Marketing & Services | Corporate | Intercompany | Total |
| External sales | 4,948 | 8,555 | 1,954 | 24,855 | 22,359 | 8 | - | 62,679 |
| Intersegment sales | 5,999 | 1,685 | 10,728 | 9,061 | 120 | 57 | (27,650) | - |
| Excise taxes | - | - | - | (184) | (4,186) | - | - | (4,370) |
| Revenues from sales | 10,947 | 10,240 | 12,682 | 33,732 | 18,293 | 65 | (27,650) | 58,309 |
| Operating expenses | (9,145) | (9,761) | (4,754) | (31,468) | (17,686) | (161) | 27,650 | (45,325) |
| Depreciation, depletion and impairment of tangible assets and mineral interests | (288) | (47) | (2,066) | (378) | (224) | (23) | - | (3,026) |
| Adjusted operating income | 1,514 | 432 | 5,862 | 1,886 | 383 | (119) | - | 9,958 |
| Net income (loss) from equity affiliates and other items | 808 | 41 | 141 | 89 | 26 | (21) | - | 1,084 |
| Tax on net operating income | (250) | (103) | (3,350) | (357) | (129) | 63 | - | (4,126) |
| Adjusted net operating income | 2,072 | 370 | 2,653 | 1,618 | 280 | (77) | - | 6,916 |
| Net cost of net debt | (301) | |||||||
| Non-controlling interests | (74) | |||||||
| Adjusted net income - TotalEnergies share | 6,541 |
1st quarter 2023
(M$) | Integrated LNG | Integrated Power | Exploration & Production | Refining & Chemicals | Marketing & Services | Corporate | Intercompany | Total |
| Total expenditures | 1,195 | 1,234 | 4,052 | 225 | 159 | 35 | - | 6,900 |
| Total divestments | 49 | 149 | 31 | 8 | 301 | - | - | 538 |
| Cash flow from operating activities | 3,536 | (1,285) | 4,536 | (851) | (673) | (130) | - | 5,133 |
27
| INFORMATION BY BUSINESS SEGMENT | |||||||
| TotalEnergies | |||||||
| (unaudited) | |||||||
4th quarter 2022
(M$) | Integrated LNG | Integrated Power | Exploration & Production | Refining & Chemicals | Marketing & Services | Corporate | Intercompany | Total |
| External sales | 4,628 | 10,055 | 2,600 | 26,650 | 24,637 | 12 | - | 68,582 |
| Intersegment sales | 5,783 | 1,807 | 12,866 | 11,730 | 274 | 63 | (32,523) | - |
| Excise taxes | - | - | - | (199) | (4,430) | - | - | (4,629) |
| Revenues from sales | 10,411 | 11,862 | 15,466 | 38,181 | 20,481 | 75 | (32,523) | 63,953 |
| Operating expenses | (8,361) | (9,836) | (6,173) | (37,107) | (19,939) | (266) | 32,523 | (49,159) |
| Depreciation, depletion and impairment of tangible assets and mineral interests | (405) | (54) | (1,343) | (393) | (276) | (34) | - | (2,505) |
| Operating income | 1,645 | 1,972 | 7,950 | 681 | 266 | (225) | - | 12,289 |
| Net income (loss) from equity affiliates and other items | 1,150 | 103 | (3,874) | 161 | (62) | 113 | - | (2,409) |
| Tax on net operating income | (269) | (112) | (4,635) | (898) | (113) | 22 | - | (6,005) |
| Net operating income | 2,526 | 1,963 | (559) | (56) | 91 | (90) | - | 3,875 |
| Net cost of net debt | (434) | |||||||
| Non-controlling interests | (177) | |||||||
| Net income - TotalEnergies share | 3,264 | |||||||
4th quarter 2022 (adjustments)(a)
(M$) | Integrated LNG | Integrated Power | Exploration & Production | Refining & Chemicals | Marketing & Services | Corporate | Intercompany | Total |
| External sales | 69 | - | - | - | - | - | - | 69 |
| Intersegment sales | - | - | - | - | - | - | - | - |
| Excise taxes | - | - | - | - | - | - | - | - |
| Revenues from sales | 69 | - | - | - | - | - | - | 69 |
| Operating expenses | 382 | 1,719 | (108) | (821) | (211) | (88) | - | 873 |
| Depreciation, depletion and impairment of tangible assets and mineral interests | (108) | - | 844 | - | (37) | - | - | 699 |
| Operating income (b) | 343 | 1,719 | 736 | (821) | (248) | (88) | - | 1,641 |
| Net income (loss) from equity affiliates and other items | (195) | (113) | (4,025) | (101) | (9) | - | - | (4,443) |
| Tax on net operating income | (30) | (124) | (798) | (621) | 14 | 23 | - | (1,536) |
| Net operating income (b) | 118 | 1,482 | (4,087) | (1,543) | (243) | (65) | - | (4,338) |
| Net cost of net debt | 8 | |||||||
| Non-controlling interests | 33 | |||||||
| Net income - TotalEnergies share | (4,297) | |||||||
| (a) Adjustments include special items, inventory valuation effect and the effect of changes in fair value. | ||||||||
| (b) Of which inventory valuation effect | ||||||||
| - On operating income | - | - | (712) | (184) | - | |||
| - On net operating income | - | - | (586) | (137) | - | |||
4th quarter 2022 (adjusted)
(M$) | Integrated LNG | Integrated Power | Exploration & Production | Refining & Chemicals | Marketing & Services | Corporate | Intercompany | Total |
| External sales | 4,559 | 10,055 | 2,600 | 26,650 | 24,637 | 12 | - | 68,513 |
| Intersegment sales | 5,783 | 1,807 | 12,866 | 11,730 | 274 | 63 | (32,523) | - |
| Excise taxes | - | - | - | (199) | (4,430) | - | - | (4,629) |
| Revenues from sales | 10,342 | 11,862 | 15,466 | 38,181 | 20,481 | 75 | (32,523) | 63,884 |
| Operating expenses | (8,743) | (11,555) | (6,065) | (36,286) | (19,728) | (178) | 32,523 | (50,032) |
| Depreciation, depletion and impairment of tangible assets and mineral interests | (297) | (54) | (2,187) | (393) | (239) | (34) | - | (3,204) |
| Adjusted operating income | 1,302 | 253 | 7,214 | 1,502 | 514 | (137) | - | 10,648 |
| Net income (loss) from equity affiliates and other items | 1,345 | 216 | 151 | 262 | (53) | 113 | - | 2,034 |
| Tax on net operating income | (239) | 12 | (3,837) | (277) | (127) | (1) | - | (4,469) |
| Adjusted net operating income | 2,408 | 481 | 3,528 | 1,487 | 334 | (25) | - | 8,213 |
| Net cost of net debt | (442) | |||||||
| Non-controlling interests | (210) | |||||||
| Adjusted net income - TotalEnergies share | 7,561 | |||||||
4th quarter 2022
(M$) | Integrated LNG | Integrated Power | Exploration & Production | Refining & Chemicals | Marketing & Services | Corporate | Intercompany | Total |
| Total expenditures | 310 | 640 | 2,478 | 588 | 507 | 49 | - | 4,572 |
| Total divestments | 319 | 186 | 215 | 125 | 42 | 4 | - | 891 |
| Cash flow from operating activities | 134 | 861 | 4,035 | 232 | 707 | (351) | - | 5,618 |
28
| INFORMATION BY BUSINESS SEGMENT | |||||||
| TotalEnergies | |||||||
| (unaudited) | |||||||
1st quarter 2022
(M$) | Integrated LNG | Integrated Power | Exploration & Production | Refining & Chemicals | Marketing & Services | Corporate | Intercompany | Total |
| External sales | 5,507 | 6,787 | 2,151 | 31,008 | 23,149 | 4 | - | 68,606 |
| Intersegment sales | 3,498 | 521 | 13,818 | 9,277 | 267 | 63 | (27,444) | - |
| Excise taxes | - | - | - | (192) | (4,464) | - | - | (4,656) |
| Revenues from sales | 9,005 | 7,308 | 15,969 | 40,093 | 18,952 | 67 | (27,444) | 63,950 |
| Operating expenses | (6,886) | (7,294) | (5,708) | (37,411) | (17,984) | (293) | 27,444 | (48,132) |
| Depreciation, depletion and impairment of tangible assets and mineral interests | (278) | (43) | (2,661) | (380) | (273) | (44) | - | (3,679) |
| Operating income | 1,841 | (29) | 7,600 | 2,302 | 695 | (270) | - | 12,139 |
| Net income (loss) from equity affiliates and other items | (2,495) | (5) | 242 | 156 | (42) | 108 | - | (2,036) |
| Tax on net operating income | (261) | (33) | (3,863) | (525) | (225) | 105 | - | (4,802) |
| Net operating income | (915) | (67) | 3,979 | 1,933 | 428 | (57) | - | 5,301 |
| Net cost of net debt | (250) | |||||||
| Non-controlling interests | (107) | |||||||
| Net income - TotalEnergies share | 4,944 | |||||||
1st quarter 2022 (adjustments)(a)
(M$) | Integrated LNG | Integrated Power | Exploration & Production | Refining & Chemicals | Marketing & Services | Corporate | Intercompany | Total |
| External sales | (3) | 15 | - | - | - | - | - | 12 |
| Intersegment sales | - | - | - | - | - | - | - | - |
| Excise taxes | - | - | - | - | - | - | - | - |
| Revenues from sales | (3) | 15 | - | - | - | - | - | 12 |
| Operating expenses | (107) | (10) | (791) | 947 | 268 | (132) | - | 175 |
| Depreciation, depletion and impairment of tangible assets and mineral interests | - | - | (493) | - | (29) | (9) | - | (531) |
| Operating income (b) | (110) | 5 | (1,284) | 947 | 239 | (141) | - | (344) |
| Net income (loss) from equity affiliates and other items | (3,948) | 9 | (14) | 117 | (3) | 106 | - | (3,733) |
| Tax on net operating income | 10 | 1 | 262 | (251) | (80) | 20 | - | (38) |
| Net operating income (b) | (4,048) | 15 | (1,036) | 813 | 156 | (15) | - | (4,115) |
| Net cost of net debt | 113 | |||||||
| Non-controlling interests | (31) | |||||||
| Net income - TotalEnergies share | (4,033) | |||||||
| (a) Adjustments include special items, inventory valuation effect and the effect of changes in fair value. | ||||||||
| (b) Of which inventory valuation effect | ||||||||
| - On operating income | - | - | 947 | 308 | - | |||
| - On net operating income | - | - | 845 | 228 | - | |||
1st quarter 2022 (adjusted)
(M$) | Integrated LNG | Integrated Power | Exploration & Production | Refining & Chemicals | Marketing & Services | Corporate | Intercompany | Total |
| External sales | 5,510 | 6,772 | 2,151 | 31,008 | 23,149 | 4 | - | 68,594 |
| Intersegment sales | 3,498 | 521 | 13,818 | 9,277 | 267 | 63 | (27,444) | - |
| Excise taxes | - | - | - | (192) | (4,464) | - | - | (4,656) |
| Revenues from sales | 9,008 | 7,293 | 15,969 | 40,093 | 18,952 | 67 | (27,444) | 63,938 |
| Operating expenses | (6,779) | (7,284) | (4,917) | (38,358) | (18,252) | (161) | 27,444 | (48,307) |
| Depreciation, depletion and impairment of tangible assets and mineral interests | (278) | (43) | (2,168) | (380) | (244) | (35) | - | (3,148) |
| Adjusted operating income | 1,951 | (34) | 8,884 | 1,355 | 456 | (129) | - | 12,483 |
| Net income (loss) from equity affiliates and other items | 1,453 | (14) | 256 | 39 | (39) | 2 | - | 1,697 |
| Tax on net operating income | (271) | (34) | (4,125) | (274) | (145) | 85 | - | (4,764) |
| Adjusted net operating income | 3,133 | (82) | 5,015 | 1,120 | 272 | (42) | - | 9,416 |
| Net cost of net debt | (363) | |||||||
| Non-controlling interests | (76) | |||||||
| Adjusted net income - TotalEnergies share | 8,977 | |||||||
1st quarter 2022
(M$) | Integrated LNG | Integrated Power | Exploration & Production | Refining & Chemicals | Marketing & Services | Corporate | Intercompany | Total |
| Total expenditures | 290 | 1,149 | 1,971 | 228 | 140 | 9 | - | 3,787 |
| Total divestments | 844 | 171 | 283 | 27 | 79 | 5 | - | 1,409 |
| Cash flow from operating activities | 2,219 | (1,904) | 5,768 | 1,107 | 898 | (471) | - | 7,617 |
29
| Reconciliation of the information by business segment with Consolidated Financial Statements | |||||||
| TotalEnergies | |||||||
| (unaudited) | |||||||
| Consolidated | |||||
| 1st quarter 2023 | statement | ||||
| (M$) | Adjusted | Adjustments(a) | of income | ||
| Sales | 62,679 | (76) | 62,603 | ||
| Excise taxes | (4,370) | - | (4,370) | ||
| Revenues from sales | 58,309 | (76) | 58,233 | ||
| Purchases net of inventory variation | (37,479) | (872) | (38,351) | ||
| Other operating expenses | (7,752) | (33) | (7,785) | ||
| Exploration costs | (94) | 2 | (92) | ||
| Depreciation, depletion and impairment of tangible assets and mineral interests | (3,026) | (36) | (3,062) | ||
| Other income | 77 | 264 | 341 | ||
| Other expense | (137) | (163) | (300) | ||
| Financial interest on debt | (710) | - | (710) | ||
| Financial income and expense from cash & cash equivalents | 373 | 20 | 393 | ||
| Cost of net debt | (337) | 20 | (317) | ||
| Other financial income | 248 | 10 | 258 | ||
| Other financial expense | (183) | - | (183) | ||
| Net income (loss) from equity affiliates | 1,079 | (119) | 960 | ||
| Income taxes | (4,090) | 19 | (4,071) | ||
| Consolidated net income | 6,615 | (984) | 5,631 | ||
| TotalEnergies share | 6,541 | (984) | 5,557 | ||
| Non-controlling interests | 74 | - | 74 | ||
| (a) Adjustments include special items, inventory valuation effect and the effect of changes in fair value. | |||||
| Consolidated | |||||
| 1st quarter 2022 | statement | ||||
| (M$) | Adjusted | Adjustments(a) | of income | ||
| Sales | 68,594 | 12 | 68,606 | ||
| Excise taxes | (4,656) | - | (4,656) | ||
| Revenues from sales | 63,938 | 12 | 63,950 | ||
| Purchases net of inventory variation | (40,762) | 1,114 | (39,648) | ||
| Other operating expenses | (7,409) | (214) | (7,623) | ||
| Exploration costs | (136) | (725) | (861) | ||
| Depreciation, depletion and impairment of tangible assets and mineral interests | (3,148) | (531) | (3,679) | ||
| Other income | 121 | 22 | 143 | ||
| Other expense | (269) | (2,021) | (2,290) | ||
| Financial interest on debt | (462) | - | (462) | ||
| Financial income and expense from cash & cash equivalents | 59 | 155 | 214 | ||
| Cost of net debt | (403) | 155 | (248) | ||
| Other financial income | 119 | 84 | 203 | ||
| Other financial expense | (135) | - | (135) | ||
| Net income (loss) from equity affiliates | 1,861 | (1,818) | 43 | ||
| Income taxes | (4,724) | (80) | (4,804) | ||
| Consolidated net income | 9,053 | (4,002) | 5,051 | ||
| TotalEnergies share | 8,977 | (4,033) | 4,944 | ||
| Non-controlling interests | 76 | 31 | 107 | ||
| (a) Adjustments include special items, inventory valuation effect and the effect of changes in fair value. | |||||
30
TotalEnergies
NOTES TO THE CONSOLIDATED FINANCIAL STATEMENTS
FOR THE FIRST THREE MONTHS 2023
(unaudited)
1) Basis of preparation of the consolidated financial statements
The consolidated financial statements are prepared in accordance with International Financial Reporting Standards (IFRS) as adopted by the European Union and IFRS as published by the International Accounting Standards Board (IASB).
The interim consolidated financial statements of TotalEnergies SE and its subsidiaries (the Company) as of March 31, 2023, are presented in U.S. dollars and have been prepared in accordance with International Accounting Standard (IAS) 34 “Interim Financial Reporting”.
The accounting principles applied for the consolidated financial statements at March 31, 2023, are consistent with those used for the financial statements at December 31, 2022.
The preparation of financial statements in accordance with IFRS for the closing as of March 31, 2023 requires the General Management to make estimates, assumptions and judgments that affect the information reported in the Consolidated Financial Statements and the Notes thereto.
These estimates, assumptions and judgments are based on historical experience and other factors believed to be reasonable at the date of preparation of the financial statements. They are reviewed on an on-going basis by General Management and therefore could be revised as circumstances change or as a result of new information.
The main estimates, judgments and assumptions relate to the estimation of hydrocarbon reserves in application of the successful efforts method for the oil and gas activities, asset impairments, employee benefits, asset retirement obligations and income taxes. These estimates and assumptions are described in the Notes to the Consolidated Financial Statements as of December 31, 2022.
Different estimates, assumptions and judgments could significantly affect the information reported, and actual results may differ from the amounts included in the Consolidated Financial Statements and the Notes thereto.
Furthermore, when the accounting treatment of a specific transaction is not addressed by any accounting standard or interpretation, the General Management of the Company applies its judgment to define and apply accounting policies that provide information consistent with the general IFRS concepts: faithful representation, relevance and materiality.
31
2) Changes in the Company structure
2.1) Main acquisitions and divestments
| Ø | Integrated LNG |
| · | On June 12, 2022, following the request for proposals in relation to partner selection for the North Field East (NFE) liquified natural gas project, TotalEnergies has been awarded, a 25% interest in a new joint venture (JV), alongside the national company QatarEnergy (75%). The new JV will hold a 25% interest in the 32 million tons per annum (Mtpa) NFE project, equivalent to one 8 Mtpa LNG train. The acquisition of the interest in this project was finalized in January 2023. |
| Ø | Integrated Power |
| · | On October 26, 2022, TotalEnergies and Casa dos Ventos (CDV), Brazil's leading renewable energy developer, announced the creation of a 34%(TTE)/66%(CDV) joint venture to jointly develop, build and operate the renewable portfolio of Casa Dos Ventos. This portfolio includes 700 MW of onshore wind capacity in operation, 1 GW of onshore wind under construction, 2.8 GW of onshore wind and 1.6 GW of solar projects under well advanced development (COD1 within 5 years). Besides, the newly formed JV will have the right to acquire the current and new projects that are or will be developed by CDV as they reach execution stage. The transaction amounts to a payment of $0.5 billion and an earn-out of up to $30 million for the acquisition of a 34% stake in the JV. In addition, TotalEnergies will have the option to acquire an additional 15% equity share in 2027. The transaction was completed in January 2023. |
| Ø | Exploration & Production |
| · | In March 2023, TotalEnergies has signed an agreement with CEPSA to acquire CEPSA’s upstream assets in the United Arab Emirates with an effective date of January 1, 2023. The assets to be acquired are: |
| o | a 20% participating interest in the Satah Al Razboot (SARB), Umm Lulu, Bin Nasher and Al Bateel (SARB and Umm Lulu) offshore concession. The SARB and Umm Lulu concession includes two major offshore fields. ADNOC holds a 60% interest in this concession, alongside OMV (20%). The concession is operated by ADNOC Offshore. |
| o | a 12.88% indirect interest in the Mubarraz concession held by Abu Dhabi Oil Company Ltd (ADOC), through the acquisition of 20% of Cosmo Abu Dhabi Energy Exploration & Production Co. Ltd (CEPAD), a company holding a 64.4% interest in ADOC. The Mubarraz concession is comprised of four producing offshore fields. |
The SARB and Umm Lulu transaction was completed on March 15, 2023. The Mubarraz transaction is subject to satisfaction of customary conditions precedent, including formalization of documentation and final approvals.
2.2) Major business combinations
| Ø | Exploration & Production |
| · | Acquisition of participating interest in SARB and Umm Lulu offshore concession |
In accordance with IFRS 3 “Business combinations”, TotalEnergies is assessing the fair value of identifiable acquired assets, liabilities and contingent liabilities on the basis of available information. This assessment will be finalised within 12 months following the acquisition date.
1 Commercial Operation Date
32
2.3) Divestment projects
As of March 31, 2023, there is no material divestment project recorded in “assets held for sale”.
| Ø | Exploration & Production |
In line with its low-carbon strategy, TotalEnergies announced in September 2022 its intention to exit the Canadian oil sands.
As of March 31, 2023, the subsidiary TotalEnergies EP Canada is not presented as an asset held for sale in the consolidated financial statements, as IFRS 5 classification criteria are not met.
| Ø | Marketing & Services |
On March 16, 2023, TotalEnergies and Alimentation Couche-Tard have signed agreements covering TotalEnergies' retail networks in four European countries. As part of this agreement, TotalEnergies will join forces with Couche-Tard in Belgium and Luxembourg and transfer its networks in Germany and the Netherlands.
This planned transaction is subject to the usual conditions for completion, including the consultation processes of employee representatives and securing of the mandatory authorizations from competition authorities.
As of March 31, 2023, this project has no impact on the consolidated financial statements.
3) Business segment information
Description of the business segments
Financial information by business segment is reported in accordance with the internal reporting system and shows internal segment information that is used to manage and measure the performance of TotalEnergies and which is reviewed by the main operational decision-making body of the Company, namely the Executive Committee.
The operational profit and assets are broken down by business segment prior to the consolidation and inter-segment adjustments.
Sales prices between business segments approximate market prices.
The profitable growth in the LNG and power integrated value chains are two of the key axes of TotalEnergies’s strategy.
In order to give more visibility to these businesses, the Board of Directors has decided that from the first quarter 2023, Integrated LNG and Integrated Power results, previously grouped in the Integrated Gas, Renewables & Power (iGRP) segment, would be reported separately as two segments.
A new reporting structure for the business segments’ financial information has been put in place, effective January 1, 2023. It is based on the following five business segments:
| - | An Integrated LNG segment covering LNG production and trading activities as well as biogas, hydrogen and gas trading activities; |
| - | An Integrated Power segment covering generation, storage, electricity trading and B2B-B2C distribution of gas and electricity; |
| - | An Exploration-Production segment; |
| - | A Refining & Chemicals segment constituting a major industrial hub comprising the activities of refining, petrochemicals and specialty chemicals. This segment also includes the activities of oil Supply, Trading and marine Shipping; |
| - | A Marketing & Services segment including the global activities of supply and marketing in the field of petroleum products; |
In addition the Corporate segment includes holdings operating and financial activities.
33
This new segment reporting has been prepared in accordance with IFRS 8 and according to the same principles as the internal reporting followed by the TotalEnergies's Executive Committee.
For the Integrated LNG and Integrated Power segments, the principles for the preparation of this segment information are as follows:
- The management of balance sheet positions (including margin calls) related to to centralized markets access for LNG, gas and power activities since 2022 has been fully included in the Integrated LNG segment.
- Effects of changes in the fair value of gas and LNG positions are allocated to the operating income of Integrated LNG segment.
- Effects of changes in the fair value of power positions are allocated to the operating income of Integrated Power segment.
Due to the change in the Company's internal organizational structure affecting the composition of the business segments, the segment reporting data for the years 2021 and 2022 has been restated.
Adjustment items
Performance indicators excluding the adjustment items, such as adjusted operating income, adjusted net operating income, and adjusted net income are meant to facilitate the analysis of the financial performance and the comparison of income between periods.
Adjustment items include:
| (i) | Special items |
Due to their unusual nature or particular significance, certain transactions qualified as "special items" are excluded from the business segment figures. In general, special items relate to transactions that are significant, infrequent or unusual. However, in certain instances, transactions such as restructuring costs or assets disposals, which are not considered to be representative of the normal course of business, may be qualified as special items although they may have occurred within prior years or are likely to occur again within the coming years.
(ii) The inventory valuation effect
The adjusted results of the Refining & Chemicals and Marketing & Services segments are presented according to the replacement cost method. This method is used to assess the segments’ performance and facilitate the comparability of the segments’ performance with those of its competitors.
In the replacement cost method, which approximates the LIFO (Last-In, First-Out) method, the variation of inventory values in the statement of income is, depending on the nature of the inventory, determined using either the month-end prices differential between one period and another or the average prices of the period rather than the historical value. The inventory valuation effect is the difference between the results according to the FIFO (First-In, First-Out) and the replacement cost methods.
(iii) Effect of changes in fair value
The effect of changes in fair value presented as adjustment items reflects for certain transactions differences between the internal measure of performance used by TotalEnergies’s management and the accounting for these transactions under IFRS.
IFRS requires that trading inventories be recorded at their fair value using period end spot prices. In order to best reflect the management of economic exposure through derivative transactions, internal indicators used to measure performance include valuations of trading inventories based on forward prices.
TotalEnergies, in its trading activities, enters into storage contracts, whose future effects are recorded at fair value in the Company’s internal economic performance. IFRS precludes recognition of this fair value effect.
Furthermore, TotalEnergies enters into derivative instruments to risk manage certain operational contracts or assets. Under IFRS, these derivatives are recorded at fair value while the underlying operational transactions are recorded as they occur. Internal indicators defer the fair value on derivatives to match with the transaction occurrence.
The adjusted results (adjusted operating income, adjusted net operating income, adjusted net income) are defined as replacement cost results, adjusted for special items and the effect of changes in fair value.
34
3.1) Information by business segment
1st quarter 2023
(M$) | Integrated LNG | Integrated Power | Exploration & Production | Refining & Chemicals | Marketing & Services | Corporate | Intercompany | Total |
| External sales | 4,872 | 8,555 | 1,954 | 24,855 | 22,359 | 8 | - | 62,603 |
| Intersegment sales | 5,999 | 1,685 | 10,728 | 9,061 | 120 | 57 | (27,650) | - |
| Excise taxes | - | - | - | (184) | (4,186) | - | - | (4,370) |
| Revenues from sales | 10,871 | 10,240 | 12,682 | 33,732 | 18,293 | 65 | (27,650) | 58,233 |
| Operating expenses | (9,445) | (9,831) | (4,762) | (31,892) | (17,787) | (161) | 27,650 | (46,228) |
| Depreciation, depletion and impairment of tangible assets and mineral interests | (288) | (47) | (2,066) | (414) | (224) | (23) | - | (3,062) |
| Operating income | 1,138 | 362 | 5,854 | 1,426 | 282 | (119) | - | 8,943 |
| Net income (loss) from equity affiliates and other items | 804 | (70) | 68 | 52 | 243 | (21) | - | 1,076 |
| Tax on net operating income | (205) | (111) | (3,398) | (325) | (119) | 63 | - | (4,095) |
| Net operating income | 1,737 | 181 | 2,524 | 1,153 | 406 | (77) | - | 5,924 |
| Net cost of net debt | (293) | |||||||
| Non-controlling interests | (74) | |||||||
| Net income - TotalEnergies share | 5,557 |
1st quarter 2023 (adjustments)(a)
(M$) | Integrated LNG | Integrated Power | Exploration & Production | Refining & Chemicals | Marketing & Services | Corporate | Intercompany | Total |
| External sales | (76) | - | - | - | - | - | - | (76) |
| Intersegment sales | - | - | - | - | - | - | - | - |
| Excise taxes | - | - | - | - | - | - | - | - |
| Revenues from sales | (76) | - | - | - | - | - | - | (76) |
| Operating expenses | (300) | (70) | (8) | (424) | (101) | - | - | (903) |
| Depreciation, depletion and impairment of tangible assets and mineral interests | - | - | - | (36) | - | - | - | (36) |
| Operating income (b) | (376) | (70) | (8) | (460) | (101) | - | - | (1,015) |
| Net income (loss) from equity affiliates and other items | (4) | (111) | (73) | (37) | 217 | - | - | (8) |
| Tax on net operating income | 45 | (8) | (48) | 32 | 10 | - | - | 31 |
| Net operating income (b) | (335) | (189) | (129) | (465) | 126 | - | - | (992) |
| Net cost of net debt | 8 | |||||||
| Non-controlling interests | - | |||||||
| Net income - TotalEnergies share | (984) | |||||||
| (a) Adjustments include special items, inventory valuation effect and the effect of changes in fair value. | ||||||||
| (b) Of which inventory valuation effect | ||||||||
| - On operating income | - | - | (415) | (87) | - | |||
| - On net operating income | - | - | (327) | (64) | - | |||
1st quarter 2023 (adjusted)
(M$) | Integrated LNG | Integrated Power | Exploration & Production | Refining & Chemicals | Marketing & Services | Corporate | Intercompany | Total |
| External sales | 4,948 | 8,555 | 1,954 | 24,855 | 22,359 | 8 | - | 62,679 |
| Intersegment sales | 5,999 | 1,685 | 10,728 | 9,061 | 120 | 57 | (27,650) | - |
| Excise taxes | - | - | - | (184) | (4,186) | - | - | (4,370) |
| Revenues from sales | 10,947 | 10,240 | 12,682 | 33,732 | 18,293 | 65 | (27,650) | 58,309 |
| Operating expenses | (9,145) | (9,761) | (4,754) | (31,468) | (17,686) | (161) | 27,650 | (45,325) |
| Depreciation, depletion and impairment of tangible assets and mineral interests | (288) | (47) | (2,066) | (378) | (224) | (23) | - | (3,026) |
| Adjusted operating income | 1,514 | 432 | 5,862 | 1,886 | 383 | (119) | - | 9,958 |
| Net income (loss) from equity affiliates and other items | 808 | 41 | 141 | 89 | 26 | (21) | - | 1,084 |
| Tax on net operating income | (250) | (103) | (3,350) | (357) | (129) | 63 | - | (4,126) |
| Adjusted net operating income | 2,072 | 370 | 2,653 | 1,618 | 280 | (77) | - | 6,916 |
| Net cost of net debt | (301) | |||||||
| Non-controlling interests | (74) | |||||||
| Adjusted net income - TotalEnergies share | 6,541 |
1st quarter 2023
(M$) | Integrated LNG | Integrated Power | Exploration & Production | Refining & Chemicals | Marketing & Services | Corporate | Intercompany | Total |
| Total expenditures | 1,195 | 1,234 | 4,052 | 225 | 159 | 35 | - | 6,900 |
| Total divestments | 49 | 149 | 31 | 8 | 301 | - | - | 538 |
| Cash flow from operating activities | 3,536 | (1,285) | 4,536 | (851) | (673) | (130) | - | 5,133 |
35
1st quarter 2022
(M$) | Integrated LNG | Integrated Power | Exploration & Production | Refining & Chemicals | Marketing & Services | Corporate | Intercompany | Total |
| External sales | 5,507 | 6,787 | 2,151 | 31,008 | 23,149 | 4 | - | 68,606 |
| Intersegment sales | 3,498 | 521 | 13,818 | 9,277 | 267 | 63 | (27,444) | - |
| Excise taxes | - | - | - | (192) | (4,464) | - | - | (4,656) |
| Revenues from sales | 9,005 | 7,308 | 15,969 | 40,093 | 18,952 | 67 | (27,444) | 63,950 |
| Operating expenses | (6,886) | (7,294) | (5,708) | (37,411) | (17,984) | (293) | 27,444 | (48,132) |
| Depreciation, depletion and impairment of tangible assets and mineral interests | (278) | (43) | (2,661) | (380) | (273) | (44) | - | (3,679) |
| Operating income | 1,841 | (29) | 7,600 | 2,302 | 695 | (270) | - | 12,139 |
| Net income (loss) from equity affiliates and other items | (2,495) | (5) | 242 | 156 | (42) | 108 | - | (2,036) |
| Tax on net operating income | (261) | (33) | (3,863) | (525) | (225) | 105 | - | (4,802) |
| Net operating income | (915) | (67) | 3,979 | 1,933 | 428 | (57) | - | 5,301 |
| Net cost of net debt | (250) | |||||||
| Non-controlling interests | (107) | |||||||
| Net income - TotalEnergies share | 4,944 |
1st quarter 2022 (adjustments)(a)
(M$) | Integrated LNG | Integrated Power | Exploration & Production | Refining & Chemicals | Marketing & Services | Corporate | Intercompany | Total |
| External sales | (3) | 15 | - | - | - | - | - | 12 |
| Intersegment sales | - | - | - | - | - | - | - | - |
| Excise taxes | - | - | - | - | - | - | - | - |
| Revenues from sales | (3) | 15 | - | - | - | - | - | 12 |
| Operating expenses | (107) | (10) | (791) | 947 | 268 | (132) | - | 175 |
| Depreciation, depletion and impairment of tangible assets and mineral interests | - | - | (493) | - | (29) | (9) | - | (531) |
| Operating income (b) | (110) | 5 | (1,284) | 947 | 239 | (141) | - | (344) |
| Net income (loss) from equity affiliates and other items | (3,948) | 9 | (14) | 117 | (3) | 106 | - | (3,733) |
| Tax on net operating income | 10 | 1 | 262 | (251) | (80) | 20 | - | (38) |
| Net operating income (b) | (4,048) | 15 | (1,036) | 813 | 156 | (15) | - | (4,115) |
| Net cost of net debt | 113 | |||||||
| Non-controlling interests | (31) | |||||||
| Net income - TotalEnergies share | (4,033) | |||||||
| (a) Adjustments include special items, inventory valuation effect and the effect of changes in fair value. | ||||||||
| (b) Of which inventory valuation effect | ||||||||
| - On operating income | - | - | 947 | 308 | - | |||
| - On net operating income | - | - | 845 | 228 | - | |||
1st quarter 2022 (adjusted)
(M$) | Integrated LNG | Integrated Power | Exploration & Production | Refining & Chemicals | Marketing & Services | Corporate | Intercompany | Total |
| External sales | 5,510 | 6,772 | 2,151 | 31,008 | 23,149 | 4 | - | 68,594 |
| Intersegment sales | 3,498 | 521 | 13,818 | 9,277 | 267 | 63 | (27,444) | - |
| Excise taxes | - | - | - | (192) | (4,464) | - | - | (4,656) |
| Revenues from sales | 9,008 | 7,293 | 15,969 | 40,093 | 18,952 | 67 | (27,444) | 63,938 |
| Operating expenses | (6,779) | (7,284) | (4,917) | (38,358) | (18,252) | (161) | 27,444 | (48,307) |
| Depreciation, depletion and impairment of tangible assets and mineral interests | (278) | (43) | (2,168) | (380) | (244) | (35) | - | (3,148) |
| Adjusted operating income | 1,951 | (34) | 8,884 | 1,355 | 456 | (129) | - | 12,483 |
| Net income (loss) from equity affiliates and other items | 1,453 | (14) | 256 | 39 | (39) | 2 | - | 1,697 |
| Tax on net operating income | (271) | (34) | (4,125) | (274) | (145) | 85 | - | (4,764) |
| Adjusted net operating income | 3,133 | (82) | 5,015 | 1,120 | 272 | (42) | - | 9,416 |
| Net cost of net debt | (363) | |||||||
| Non-controlling interests | (76) | |||||||
| Adjusted net income - TotalEnergies share | 8,977 |
1st quarter 2022
(M$) | Integrated LNG | Integrated Power | Exploration & Production | Refining & Chemicals | Marketing & Services | Corporate | Intercompany | Total |
| Total expenditures | 290 | 1,149 | 1,971 | 228 | 140 | 9 | - | 3,787 |
| Total divestments | 844 | 171 | 283 | 27 | 79 | 5 | - | 1,409 |
| Cash flow from operating activities | 2,219 | (1,904) | 5,768 | 1,107 | 898 | (471) | - | 7,617 |
36
3.2) Reconciliation of the information by business segment with consolidated financial statements
| Consolidated | |||||
| 1st quarter 2023 | statement | ||||
| (M$) | Adjusted | Adjustments(a) | of income | ||
| Sales | 62,679 | (76) | 62,603 | ||
| Excise taxes | (4,370) | - | (4,370) | ||
| Revenues from sales | 58,309 | (76) | 58,233 | ||
| Purchases net of inventory variation | (37,479) | (872) | (38,351) | ||
| Other operating expenses | (7,752) | (33) | (7,785) | ||
| Exploration costs | (94) | 2 | (92) | ||
| Depreciation, depletion and impairment of tangible assets and mineral interests | (3,026) | (36) | (3,062) | ||
| Other income | 77 | 264 | 341 | ||
| Other expense | (137) | (163) | (300) | ||
| Financial interest on debt | (710) | - | (710) | ||
| Financial income and expense from cash & cash equivalents | 373 | 20 | 393 | ||
| Cost of net debt | (337) | 20 | (317) | ||
| Other financial income | 248 | 10 | 258 | ||
| Other financial expense | (183) | - | (183) | ||
| Net income (loss) from equity affiliates | 1,079 | (119) | 960 | ||
| Income taxes | (4,090) | 19 | (4,071) | ||
| Consolidated net income | 6,615 | (984) | 5,631 | ||
| TotalEnergies share | 6,541 | (984) | 5,557 | ||
| Non-controlling interests | 74 | - | 74 | ||
| (a) Adjustments include special items, inventory valuation effect and the effect of changes in fair value. | |||||
| Consolidated | |||||
| 1st quarter 2022 | statement | ||||
| (M$) | Adjusted | Adjustments(a) | of income | ||
| Sales | 68,594 | 12 | 68,606 | ||
| Excise taxes | (4,656) | - | (4,656) | ||
| Revenues from sales | 63,938 | 12 | 63,950 | ||
| Purchases net of inventory variation | (40,762) | 1,114 | (39,648) | ||
| Other operating expenses | (7,409) | (214) | (7,623) | ||
| Exploration costs | (136) | (725) | (861) | ||
| Depreciation, depletion and impairment of tangible assets and mineral interests | (3,148) | (531) | (3,679) | ||
| Other income | 121 | 22 | 143 | ||
| Other expense | (269) | (2,021) | (2,290) | ||
| Financial interest on debt | (462) | - | (462) | ||
| Financial income and expense from cash & cash equivalents | 59 | 155 | 214 | ||
| Cost of net debt | (403) | 155 | (248) | ||
| Other financial income | 119 | 84 | 203 | ||
| Other financial expense | (135) | - | (135) | ||
| Net income (loss) from equity affiliates | 1,861 | (1,818) | 43 | ||
| Income taxes | (4,724) | (80) | (4,804) | ||
| Consolidated net income | 9,053 | (4,002) | 5,051 | ||
| TotalEnergies share | 8,977 | (4,033) | 4,944 | ||
| Non-controlling interests | 76 | 31 | 107 | ||
| (a) Adjustments include special items, inventory valuation effect and the effect of changes in fair value. | |||||
37
3.3) Adjustment items
The detail of the adjustment items is presented in the table below.
| ADJUSTMENTS TO OPERATING INCOME | |||||||||||||||
| (M$) | Integrated LNG | Integrated Power | Exploration & Production | Refining & Chemicals | Marketing & Services | Corporate | Total | ||||||||
| 1st quarter 2023 | Inventory valuation effect | - | - | - | (415) | (87) | - | (502) | |||||||
| Effect of changes in fair value | (376) | (70) | - | - | - | - | (446) | ||||||||
| Restructuring charges | - | - | - | - | - | - | - | ||||||||
| Asset impairment and provisions charges | - | - | - | (45) | - | - | (45) | ||||||||
| - | - | - | - | - | (14) | - | (14) | ||||||||
| Other items | - | - | (8) | - | - | - | (8) | ||||||||
| Total | (376) | (70) | (8) | (460) | (101) | - | (1,015) | ||||||||
| 1st quarter 2022 | Inventory valuation effect | - | - | - | 947 | 308 | - | 1,255 | |||||||
| Effect of changes in fair value | (110) | 22 | - | - | - | - | (88) | ||||||||
| Restructuring charges | - | (5) | - | - | - | - | (5) | ||||||||
| Asset impairment and provisions charges | - | - | (1,284) | - | (69) | (9) | (1,362) | ||||||||
| Other items | - | (12) | - | - | - | (132) | (144) | ||||||||
| Total | (110) | 5 | (1,284) | 947 | 239 | (141) | (344) | ||||||||
ADJUSTMENTS TO NET INCOME, TotalEnergies SHARE | |||||||||||||||
| (M$) | Integrated LNG | Integrated Power | Exploration & Production | Refining & Chemicals | Marketing & Services | Corporate | Total | ||||||||
| 1st quarter 2023 | Inventory valuation effect | - | - | - | (325) | (66) | - | (391) | |||||||
| Effect of changes in fair value | (331) | (103) | - | - | - | - | (434) | ||||||||
| Restructuring charges | - | - | - | - | - | - | - | ||||||||
| Asset impairment and provisions charges | - | - | - | (60) | - | - | (60) | ||||||||
| Gains (losses) on disposals of assets | - | - | - | - | 203 | - | 203 | ||||||||
| Other items | (4) | (86) | (85) | (78) | (13) | (36) | (302) | ||||||||
| Total | (335) | (189) | (85) | (463) | 124 | (36) | (984) | ||||||||
| - | |||||||||||||||
| 1st quarter 2022 | Inventory valuation effect | - | - | - | 835 | 205 | - | 1,040 | |||||||
| Effect of changes in fair value | (100) | 20 | - | - | - | - | (80) | ||||||||
| Restructuring charges | - | (3) | - | - | - | - | (3) | ||||||||
| Asset impairment and provisions charges | (3,948) | - | (1,032) | - | (72) | (9) | (5,061) | ||||||||
| Gains (losses) on disposals of assets | - | - | - | - | - | - | - | ||||||||
| Other items | - | - | 14 | (32) | - | 89 | 71 | ||||||||
| Total | (4,048) | 17 | (1,018) | 803 | 133 | 80 | (4,033) | ||||||||
38
4) Shareholders’ equity
Treasury shares (TotalEnergies shares held directly by TotalEnergies SE)
| December 31, 2022 | March 31, 2023 | |
| Number of treasury shares | 137,187,667 | 35,714,880 |
| Percentage of share capital | 5.24% | 1.43% |
| Of which shares acquired with the intention to cancel them | 128,869,261 | 32,238,645 |
| Of which shares allocated to TotalEnergies share performance plans for Company employees | 8,231,365 | 3,389,344 |
| Of which shares intended to be allocated to new share performance or purchase options plans | 87,041 | 86,891 |
At its meeting on February 7, 2023, the Board of Directors decided, following the authorization of the Extraordinary Shareholder's Meeting on May 25, 2022, to cancel the 128,869,261 treasury shares bought back during 2022.
Dividend
On February 7, 2023, the Board of Directors after approving the financial statements for fiscal year 2022, decided to propose to the Shareholders’ Meeting on May 26, 2023 the distribution of an ordinary €2.81 dividend per share for fiscal year 2022. Subject to the Shareholders’ decision on May 26, 2023, considering the first three interim dividends already decided by the Board of Directors, the final ordinary dividend for the fiscal year 2022 will be €0.74 per share.
| 2022 Dividend | First interim | Second interim | Third interim | Final |
| Amount | €0.69 | €0.69 | €0.69 | €0.74 |
| Set date | April 27, 2022 | July 27, 2022 | October 26, 2022 | May 26, 2023 |
| Ex-dividend date | September 21, 2022 | January 2, 2023 | March 22, 2023 | June 21, 2023 |
| Payment date | October 3, 2022 | January 12, 2023 | April 3, 2023 | July 3, 2023 |
Following its decisions of September 28, 2022, the Board of Directors of October 26, 2022 confirmed the distribution of a special interim dividend of €1 per share. This interim dividend has been detached on December 6, 2022, and paid in cash on December 16, 2022.
Subject to the Shareholders’ decision on May 26, 2023, given the special interim dividend for the 2022 financial year already paid, this special dividend of 1 euro per share would not give rise to the payment of a balance.
| Special interim dividend | |
| Amount per share | €1 |
| Ex-dividend date | December 6, 2022 |
| Payment date | December 16, 2022 |
Subject to the Shareholder's decision on May 26, 2023, dividend for fiscal year 2022 (ordinary plus special) will amount to €3.81 per share.
The Board of Directors, during its April 26, 2023 meeting, set the first interim dividend for the fiscal year 2023 at €0.74 per share. The ex-dividend date of this intermin dividend will be September 20, 2023 and it will be paid in cash on October 2, 2023.
39
Earnings per share in Euro
Earnings per share in Euro, calculated from the earnings per share in U.S. dollars converted at the average Euro/USD exchange rate for the period, amounted to €2.08 per share for the 1st quarter 2023 (€1.30 per share for the 4th quarter 2022 and €1.67 per share for the 1st quarter 2022). Diluted earnings per share calculated using the same method amounted to €2.06 per share for the 1st quarter 2023 (€1.28 per share for the 4th quarter 2022 and €1.65 per share for the 1st quarter 2022).
Earnings per share are calculated after remuneration of perpetual subordinated notes.
Perpetual subordinated notes
TotalEnergies SE has not issued any perpetual subordinated notes during the first three months of 2023.
TotalEnergies SE has announced that it will fully reimburse the outstanding nominal amount of €1,000 million of its perpetual subordinated notes 2.708% issued in October 2016, on their first call date on May 5, 2023.
40
Other comprehensive income
Detail of other comprehensive income is presented in the table below:
| (M$) | 1st quarter 2023 | 1st quarter 2022 | |
| Actuarial gains and losses | 3 | - | |
| Change in fair value of investments in equity instruments | 4 | 3 | |
| Tax effect | (8) | 11 | |
| Currency translation adjustment generated by the parent company | 1,466 | (1,750) | |
| Sub-total items not potentially reclassifiable to profit and loss | 1,465 | (1,736) | |
| Currency translation adjustment | (1,250) | 1,012 | |
| - unrealized gain/(loss) of the period | (1,334) | 1,012 | |
| - less gain/(loss) included in net income | (84) | - | |
| Cash flow hedge | 1,202 | (263) | |
| - unrealized gain/(loss) of the period | 1,022 | (151) | |
| - less gain/(loss) included in net income | (180) | 112 | |
| Variation of foreign currency basis spread | (3) | 49 | |
| - unrealized gain/(loss) of the period | (12) | 60 | |
| - less gain/(loss) included in net income | (9) | 11 | |
Share of other comprehensive income of equity affiliates, net amount | (98) | (84) | |
| - unrealized gain/(loss) of the period | (91) | (97) | |
| - less gain/(loss) included in net income | 7 | (13) | |
| Other | 3 | - | |
| Tax effect | (336) | 53 | |
| Sub-total items potentially reclassifiable to profit and loss | (482) | 767 | |
| Total other comprehensive income (net amount) | 983 | (969) |
41
Tax effects relating to each component of other comprehensive income are as follows:
| 1st quarter 2023 | 1st quarter 2022 | |||||
| (M$) | Pre-tax amount | Tax effect | Net amount | Pre-tax amount | Tax effect | Net amount |
| Actuarial gains and losses | 3 | (7) | (4) | - | - | - |
| Change in fair value of investments in equity instruments | 4 | - | 4 | 3 | 11 | 14 |
| Currency translation adjustment generated by the parent company | 1,466 | - | 1,466 | (1,750) | - | (1,750) |
| Sub-total items not potentially reclassifiable to profit and loss | 1,473 | (7) | 1,466 | (1,747) | 11 | (1,736) |
| Currency translation adjustment | (1,250) | - | (1,250) | 1,012 | - | 1,012 |
| Cash flow hedge | 1,202 | (337) | 865 | (263) | 66 | (197) |
| Variation of foreign currency basis spread | (3) | 1 | (2) | 49 | (13) | 36 |
| Share of other comprehensive income of equity affiliates, net amount | (98) | - | (98) | (84) | - | (84) |
| Other | 3 | - | 3 | - | - | - |
| Sub-total items potentially reclassifiable to profit and loss | (146) | (336) | (482) | 714 | 53 | 767 |
| Total other comprehensive income | 1,327 | (343) | 984 | (1,033) | 64 | (969) |
5) Financial debt
The Company has not issued any new senior bond during the first three months of 2023.
The Company reimbursed two senior bonds during the first three months of 2023:
| - | Bond 2.700% issued by TotalEnergies Capital International in 2012 and maturing in January 2023 ($1,000 million); |
| - | Bond 2.125% issued by TotalEnergies Capital International in 2012 (€500 million) and tapped in 2013 (€250 million) forming a single series (€750 million) and maturing in March 2023. |
In addition, the $8 billion credit line, put in place in March 2022, has not been extended and therefore ended in March 2023.
6) Related parties
The related parties are mainly equity affiliates and non-consolidated investments.
There were no major changes concerning transactions with related parties during the first three months of 2023.
42
7) Other risks and contingent liabilities
TotalEnergies is not currently aware of any exceptional event, dispute, risks or contingent liabilities that could have a material impact on the assets and liabilities, results, financial position or operations of the TotalEnergies, other than those mentioned below.
Yemen
In Yemen, the deterioration of security conditions in the vicinity of the Balhaf site caused the company Yemen LNG, in which TotalEnergies holds a stake of 39.62%, to stop its commercial production and export of LNG and to declare force majeure to its various stakeholders in 2015. The plant has been put in preservation mode.
Mozambique
Considering the evolution of the security situation in the north of the Cabo Delgado province in Mozambique, TotalEnergies has confirmed on April 26, 2021, the withdrawal of all Mozambique LNG project personnel from the Afungi site. This situation led TotalEnergies, as operator of Mozambique LNG project, to declare force majeure.
8) Subsequent events
On April 26, 2023, TotalEnergies’ Board of Directors accepted an offer from Suncor for its oil sands assets.
Following the announcement of its project to spin-off its Canadian assets, TotalEnergies received several unsolicited offers among which an offer from Suncor Energy Inc. for the acquisition of the entirety of the shares of TotalEnergies EP Canada Ltd; this offer materialized recently.
Per the signed agreement, Suncor would acquire the entirety of the shares of TotalEnergies EP Canada Ltd for a consideration including a C$5.5 billion cash payment at closing (about US$4.1 billion) and additional payments that could reach a maximum of C$600 million (about US$450 million) under specific conditions.
This amount is comparable to the C$5 to 6 billion valuation at initial listing of the spin-off company had the spin-off project concluded; this transaction thus represents an alternative to the envisaged spin-off, for the benefit of the Company and its shareholders
The transaction is subject to the waiver of TotalEnergies EP Canada Ltd’s partners pre-emption rights and customary closing conditions, notably the required approval from public authorities. TotalEnergies and Suncor target closing by end 3rd quarter 2023.
43