* Average €-$ exchange rate: 1.1629 in the third quarter 2018 and 1.1942 in the first nine months 2018.
Highlights since the beginning of the third quarter 201810
• Started production at Kaombo in Angola, Ichthys LNG in Australia and the second train at Yamal LNG in Russia
• Signed an agreement to increase its share in the Danish Underground Consortium in Denmark
• Signed a new concession contract with Sonatrach for the TFT Sud permit in Algeria
• Three positive exploration wells : Glendronach in the United Kingdom, Shwe Yee Htun 2 in Myanmar and Sururu in Brazil
• Sold its interest in the Joslyn oil sands project in Canada
• Finalized the acquisition of Engie’s LNG business: Total becomes second-largest publicly-traded LNG player in the world
1Adjusted results are defined as income using replacement cost, adjusted for special items, excluding the impact of changes for fair value; adjustment items are on page 11.
2 Tax on adjusted net operating income / (adjusted net operating income - income from equity affiliates - dividends received from investments - impairment of goodwill. + tax on adjusted net operating income).
3 In accordance with IFRS norms, adjusted fully-diluted earnings per share is calculated from the adjusted net income less the interest on the perpetual subordinated bond
4 Including acquisitions and increases in non-current loans.
5 Including divestments and reimbursements of non-current loans.
6 Net investments = investments - divestments - repayment of non-current loans - other operations with non-controlling interests.
7 Organic investments = net investments excluding acquisitions, asset sales and other operations with non-controlling interests.
8 Operating cash flow before working capital changes, previously referred to as adjusted cash flow from operations, is defined as cash flow from operating activities before changes in working capital at replacement cost. The inventory valuation effect is explained on page 14. The reconciliation table for different cash flow figures is on page 12.
9 DACF = debt adjusted cash flow, is defined as operating cash flow before working capital changes and financial charges.
10 Certain transactions referred to in the highlights are subject to approval by authorities or to other conditions as per the agreements.
• Finalized the acquisition of Direct Energie
• Acquired two gas-fired power plants (Combined Cycle Gas Turbine) from KKR-Energas
• Sold its interest in the Hazira LNG terminal in India and signed an LNG contract with Shell
• Final investment decision for a new 625 kt/y polyethylene unit at Bayport in the United States
• Launched engineering studies with Saudi Aramco for a giant petrochemical complex at Jubail in Saudi Arabia
• Signed a shareholder agreement with Sonatrach to create a petrochemical complex at Arzew in Algeria
• Sold its polystyrene activities in China to INEOS Styrolution
• Acquired G2mobility, a company specializing in charging solutions for electric vehicles
• Alliance with private Indian partner Adani to develop LNG and retail fuel in India
Analysis of business segments
Exploration & Production
> Environment - liquids and gas price realizations*

* Consolidated subsidiaries, excluding fixed margins.
** 2017 data restated.
> Production

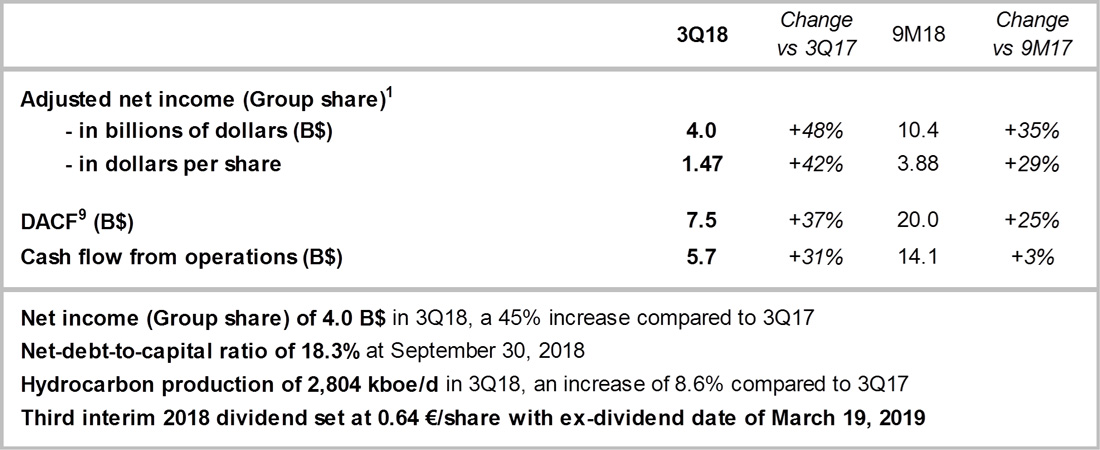
Hydrocarbon production was 2,804 thousand barrels of oil equivalent per day (kboe/d) in the third quarter 2018, an increase of close to 9% compared to last year, due to:
• +10% for start-ups and ramp-ups on new projects, notably Yamal LNG, Ofon 2, Fort Hills, Edradour-Glenlivet, Kaombo Norte, Moho Nord and Kashagan.
• + 3% portfolio effect. The integration of Maersk Oil, Waha, Lapa and Iara as well as the acquisition of an additional 0.5% of Novatek, were partially offset by the expiration of the Mahakam permit at the end of 2017 and the sales of Visund and assets in Gabon.
• -4% for natural field declines and PSC price effect.
For the first nine months 2018, hydrocarbon production was 2,742 kboe/d, an increase of 8% compared to last year, due to:
• +9% for start-ups and ramp-ups on new projects, notably Yamal LNG, Moho Nord, Ofon 2, Edradour-Glenlivet, Fort Hills, Kashagan and Kaombo Norte.
• +3% portfolio effect, mainly the addition of Maersk Oil, Al Shaheen, Waha, Lapa and Iara as well as the acquisition of an additional 0.5% of Novatek, which were partially offset by the expiration of the Mahakam permit at end-2017 and the sales of Visund and assets in Gabon.
• -4% for natural field declines and PSC price effect.
> Results
* Details of adjustment items are shown in the business segment information annex to financial statements.
** Tax on adjusted net operating income / (adjusted net operating income - income from equity affiliates - dividends received from investments - impairment of goodwill + tax on adjusted net operating income).
*** excluding financial charges.
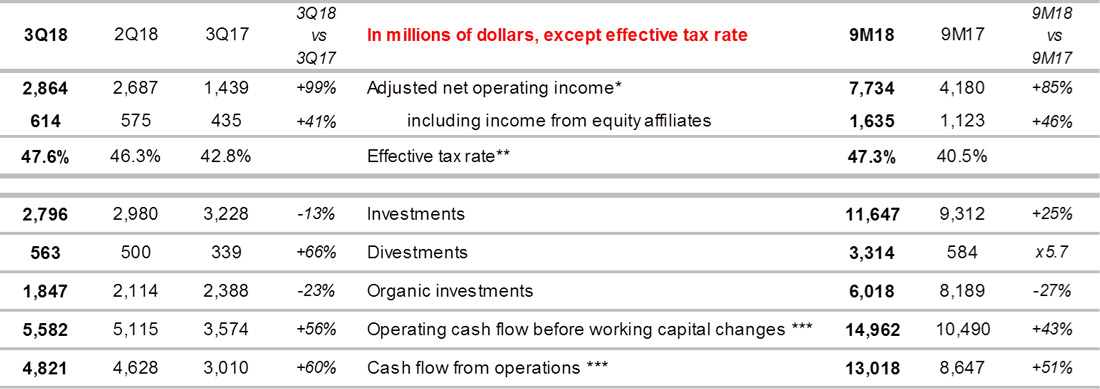
Exploration & Production adjusted net operating income was:
• 2,864 M$ in the third quarter 2018, double the same quarter last year. The Group benefited fully from higher hydrocarbon prices thanks to production growth and lower costs, despite a tax rate that increased in line with the rebound in oil prices.
• 7,734 M$ for the first nine months 2018, an increase of 85% compared to last year, for the same reasons.
Operating cash flow before working capital changes was 5.6 B$ in the third quarter 2018 and 15.0 B$ for the first nine months 2018, increases of 56% and 43% respectively. Exploration & Production generated 8.9 B$ of cash flow after organic investments for the first nine months 2018.
Gas, Renewables & Power
> Results

* Detail of adjustment items shown in the business segment information annex to financial statements.
** excluding financial charges
Adjusted net operating income for the Gas, Renewables & Power segment was 272 M$ in the third quarter 2018 and 580 M$ for the first nine months 2018, notably thanks to good performance of LNG and gas/power trading. The acquisitions of Direct Energie and the LNG business of Engie account for the increase in investments to 3 B$ in this quarter.
Refining & Chemicals
> Refinery throughput and utilization rates*

* Includes share of TotalErg, and African refineries reported in the Marketing & Services segment.
** Based on distillation capacity at the beginning of the year.
*** 2017 data restated.
Refinery throughput:
• increased by 4% in the third quarter 2018 compared to the third quarter 2017, thanks to the excellent availability of the units and high utilization rate.
• was stable in the first nine months 2018 compared to the same period 2017. Lower throughput in Europe linked to planned maintenance, notably at Antwerp during the second quarter, was offset by higher throughput outside Europe.
> Results
* Detail of adjustment items shown in the business segment information annex to financial statements.
** excluding financial charges.
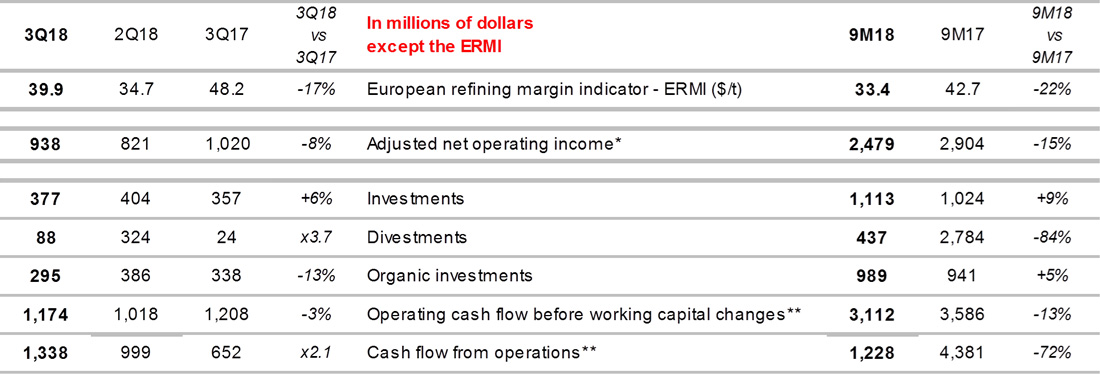
The European Refining Margin Indicator (ERMI) for the Group decreased by 17% from a year ago to 39.9 $/t in the third quarter, and decreased by 22% to 33.4 $/t in the first nine months 2018. The petrochemicals environment remained favorable in the third quarter; although margins in Europe were lower than last year, affected by the higher price of feedstocks.
In this context, Refining & Chemicals adjusted net operating income was:
• 938 M$ in the third quarter, a decrease of 8% compared to the same period last year.
• 2,479 M$ for the first nine months 2018, a decrease of 15% compared to the same period last year.
Marketing & Services
> Petroleum product sales

* Excludes trading and bulk refining sales, includes share of TotalErg.
Petroleum product sales increased by:
• 1% in the third quarter 2018 compared to the third quarter 2017. The sale of TotalErg in Italy was offset by higher sales in the rest of the world.
• 2% for the first nine months 2018 compared to the first nine months 2017 for the same reasons.
> Results

* Detail of adjustment items shown in the business segment information annex to financial statements.
** excluding financial charges.
Marketing & Services adjusted net operating income was:
• 474 M$ in the third quarter 2018, a decrease of 6% compared to the third quarter 2017.
• 1,319 M$ for the first nine months 2018, an increase of 6% compared to last year.
Group results
> Adjusted net operating income from business segments
Thanks notably to the strong performance by Exploration & Production, adjusted net operating income from the business segments was:
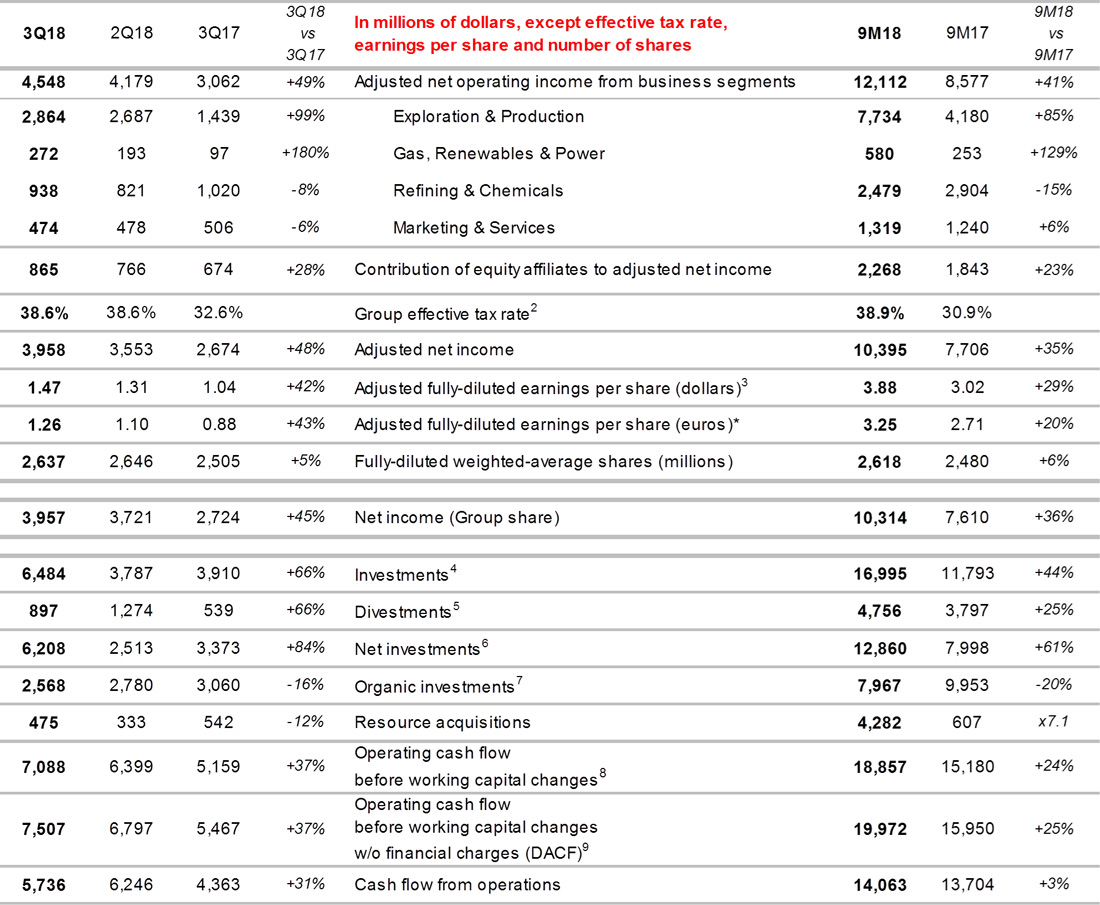
• 4,548 M$ in the third quarter 2018, a 49% increase compared to the third quarter last year.
• 12,112 M$ for the first nine months 2018, a 41% increase compared to the first nine months 2017.
> Adjusted net income (Group share)
In line with the contribution from the segments, adjusted net income was:
• 3,958 M$ in the third quarter 2018, a 48% increase compared to the third quarter last year.
• 10,395 M$ for the first nine months 2018, a 35% increase compared to the first nine months last year.
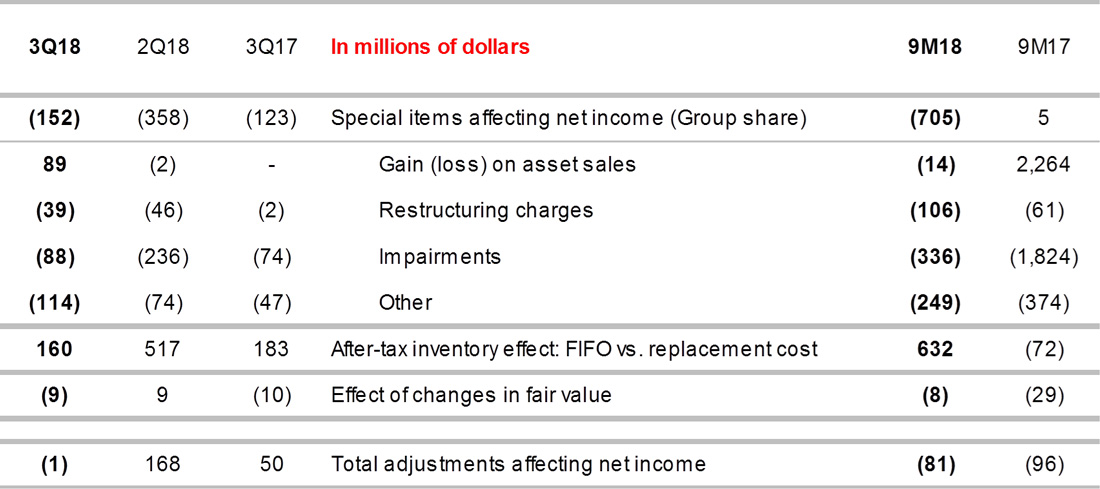
Adjusted net income excludes the after-tax inventory effect, special items and the impact of changes in fair value11.
Total adjustments affecting net income12 were:
• -1 M$ in the third quarter 2018.
• -81 M$ for the first nine months 2018.
11 Details shown on page 11.
12 Details shown on page 11 and in the annex to the financial statements.
The effective tax rate for the Group was:
• 38.6% in the third quarter 2018, compared to 32.6% a year ago, due to the increase in the effective tax rate for Exploration & Production in line with higher hydrocarbon prices, and the larger contribution of this segment to the Group’s results this quarter.
• 38.9% for the first nine months 2018, compared to 30.9% for the first nine months 2017, for the same reasons.
> Adjusted fully-diluted earnings per share and share buyback
Adjusted earnings per share increased by:
• 42% to $1.47 in the third quarter 2018, calculated based on a weighted average of 2,637 million fully-diluted shares, compared to $1.04 in the third quarter 2017.
• 29% to $3.88 for the first nine months 2018, calculated based on a weighted average of 2,618 million fully-diluted shares, compared to $3.02 for the first nine months 2017.
On September 30, 2018, the number of fully-diluted shares was 2,636 million.
In the framework of the shareholder return policy announced in February 2018, since the beginning of the year, the Group has bought back shares, including:
• shares issued in 2018 as scrip dividend to eliminate dilution: 7.2 million shares repurchased in the third quarter 2018 and 25.6 million shares over the first nine months 2018.
• additional shares : 6.2 million shares repurchased in the third quarter 2018 for 400 M$ and 16.1 million shares over the first nine months 2018 for 1 B$.
> Divestments - acquisitions
Asset sales:
• 209 M$ in the third quarter 2018, comprised mainly of the sale of Joslyn in Canada, Rabi in Gabon and the Marketing & Services network in Haiti.
• 3,071 M$ in the first nine months 2018, comprised mainly of the elements above as well as the sale of the Martin Linge and Visund fields in Norway, an interest in Fort Hills in Canada, SunPower’s sale of its interest in 8point3, the marketing activities of TotalErg in Italy and the contribution of the Bayport polyethylene unit in the United States to the joint venture formed with Borealis and Nova in which Total holds 50%.
Acquisitions:
• 3,849 M$ in the third quarter 2018, comprised mainly of the acquisition of Engie’s LNG business, Direct Energie, two gas-fired power plants from KKR-Energas and the increase in our interest in Novatek to 19.4%.
• 7,964 M$ in the first nine months of 2018, comprised of the elements above as well as notably the acquisitions of interests in the Iara and Lapa fields in Brazil, two new 40-year offshore concessions in Abu Dhabi, the Waha field in Libya and the acquisition of offshore assets from Cobalt in the Gulf of Mexico.
> Net cash flow
The Group’s net cash flow13 was:
• 880 M$ in the third quarter 2018 compared to 1,786 M$ in the third quarter 2017, as a result of the increase of 2,835 M$ in net investments, driven mainly by the acquisitions of Direct Energie and Engie’s LNG business, partially offset by a 1,929 M$ increase in operating cash flow before changes in working capital.
• 5,997 M$ in the first nine months 2018 compared to 7,182 M$ in the first nine months 2017, as a result of a 4,862 M$ increase in net investments driven by the Group’s strategy of countercyclical acquisitions, partially offset by a 3,677 M$ increase in operating cash flow before changes in working capital.
13 Net cash flow = operating cash flow before working capital changes - net investments (including other transactions with non-controlling interests)
> Profitability
Return on equity was 11.9% for the twelve months ended September 30, 2018, an increase compared to the twelve months ended September 30, 2017.

Return on average capital employed was 11.1% for the twelve months ended September 30, 2018, an increase compared to the twelve months ended September 30, 2017.

TOTAL S.A., parent company accounts
Net income for TOTAL S.A., the parent company, was 4,814 M€ in the first nine months 2018, compared to 2,620 M€ in the first nine months 2017.
2018 Sensitivities*

* Sensitivities are revised once per year upon publication of the previous year’s fourth quarter results. Sensitivities are estimates based on assumptions about the Group’s portfolio in 2018. Actual results could vary significantly from estimates based on the application of these sensitivities. The impact of the $-€ sensitivity on adjusted net operating income is essentially attributable to Refining & Chemicals.
** Assumes constant liquids price differentials.
Summary and outlook
At the start of the fourth quarter, Brent continues to trade around 80 $/b due to supply tensions and the geopolitical context. The Group resolutely maintains its programs to improve operational efficiency and reduce the breakeven to remain profitable in any environment.
The Upstream is well positioned to profit from the increase in the oil price thanks to projected production growth on the order of 8% in 2018 and 6-7% per year between 2017 and 2020. It will benefit in the coming months from the start-ups of the third train at Yamal LNG in Russia, Egina in Nigeria and Tempa Rossa in Italy as well as the second train at Ichthys LNG in Australia.
European refining margins remain very volatile, having reached 50 $/t on average in August and falling to around 20 $/t since the beginning of October. This decrease reflects the combined result of the increase in oil prices and the seasonal effect on demand. However, having already generated 4.8 B$ of cash flow over the first nine months, the Downstream is well positioned to achieve its objectives in 2018, thus confirming its robustness.
In line with announced cash allocation priorities for the period 2018-20, the Group maintains its discipline on net investments with a projected level of around 16 B$ in 2018 and 15-17 B$ for 2019-20. It is implementing the 10% increase in the dividend over three years while continuing to buy back shares issued as scrip to eliminate dilution. Maintaining a low gearing ratio is a priority, and the Group intends to buy back 1.5 B$ of shares in 2018 within the framework of its 5 B$ buyback program over the 2018-20 period.
• • •
To listen to the presentation by CFO Patrick de La Chevardière today at 14:00 (London time) please log on to total.com or call +44 (0) 330 336 9126 in Europe or +1 323 794 2551 in the United States (code: 6006933). For a replay, please consult the website or call +44 (0) 207 660 0134 in Europe or +1 719 457 0820 in the United States (code: 6006933).
* * * * *
Total contacts
Media Relations: +33 1 47 44 46 99 l presse@total.com l @TotalPress
Investors Relations: +44 (0)207 719 7962 l ir@total.com
Operating information by segment
> Exploration & Production
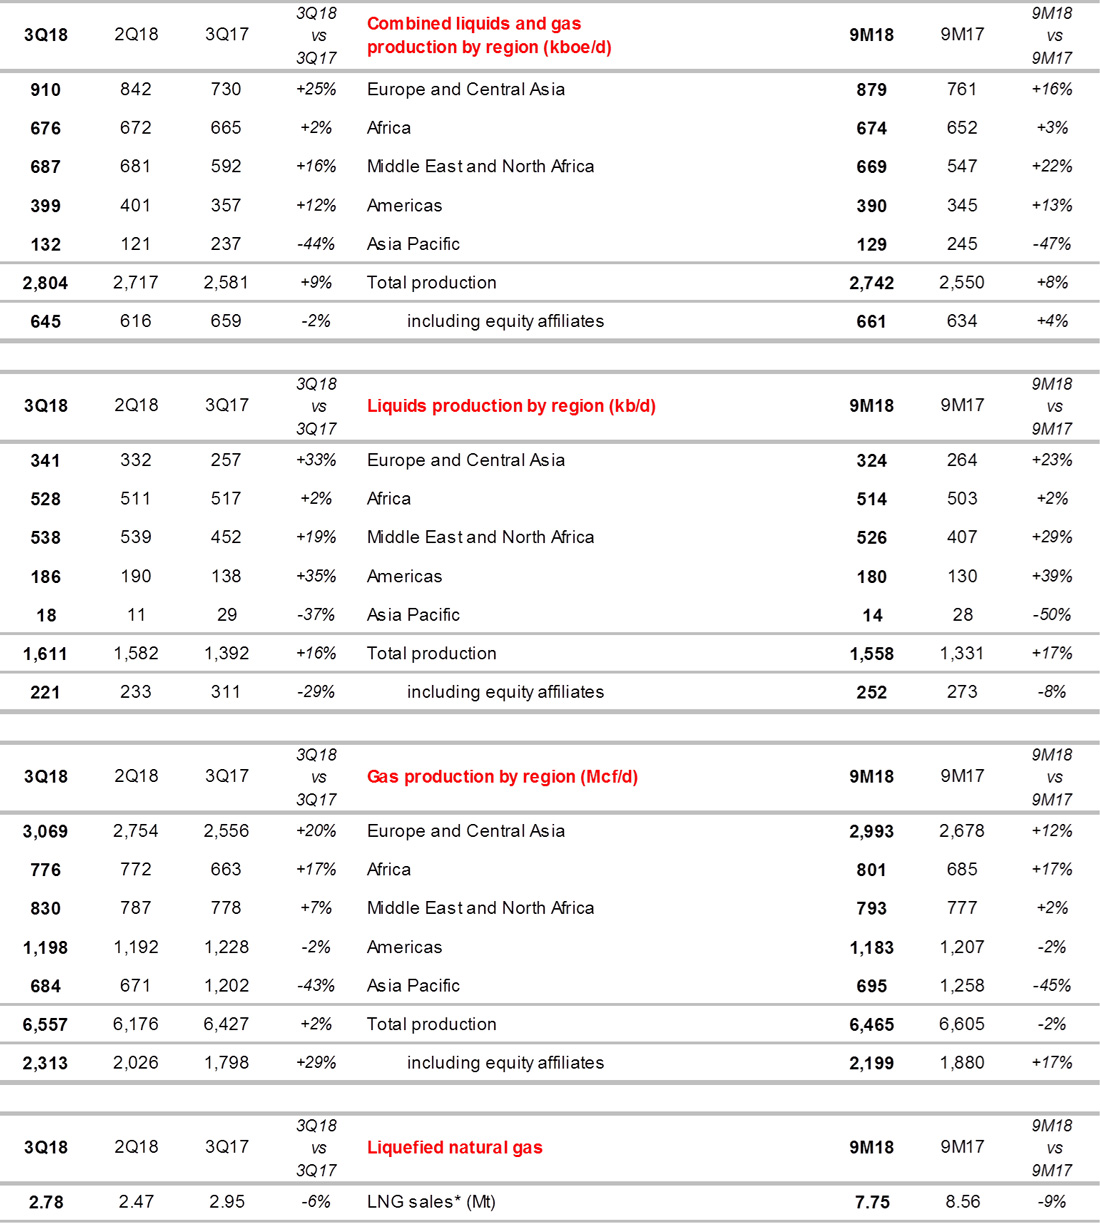
* Sales, Group share, excluding trading; 2017 data restated to reflect volume estimates for Bontang LNG in Indonesia based on the 2017 SEC coefficient.
> Downstream (Refining & Chemicals and Marketing & Services)

* 2017 data restated.
**Includes share of TotalErg.
Adjustment items to net income (Group share)
Investments - Divestments

Cash flow
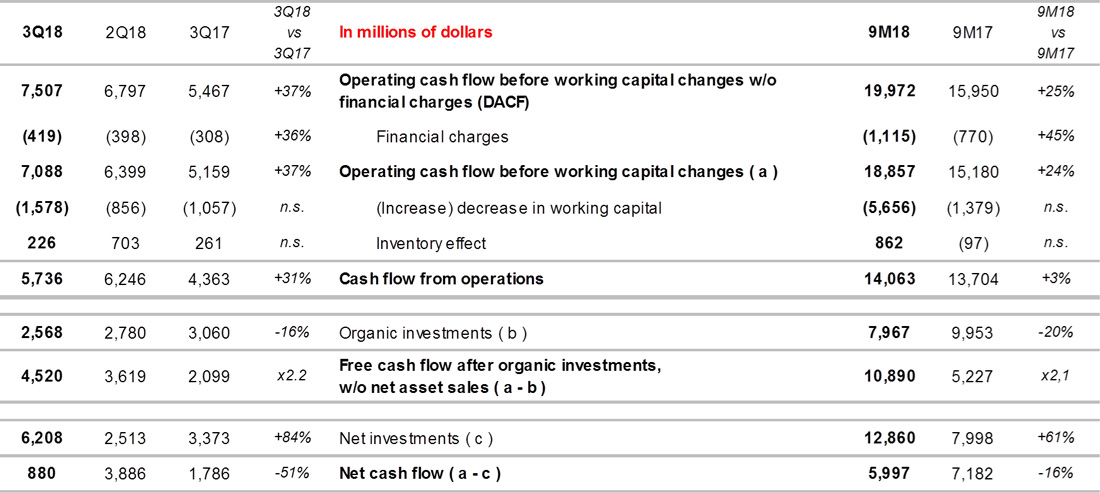
Increase in working capital after the inventory effect:
• 1.4 B$ in the third quarter 2018 due to the consolidation of Engie LNG and Direct Energie and the increase in oil prices at the end of the quarter.
• 4.8 B$ over the first nine months 2018 for the same reasons, as well as the consolidation of Maersk Oil and the strong increase in oil prices.
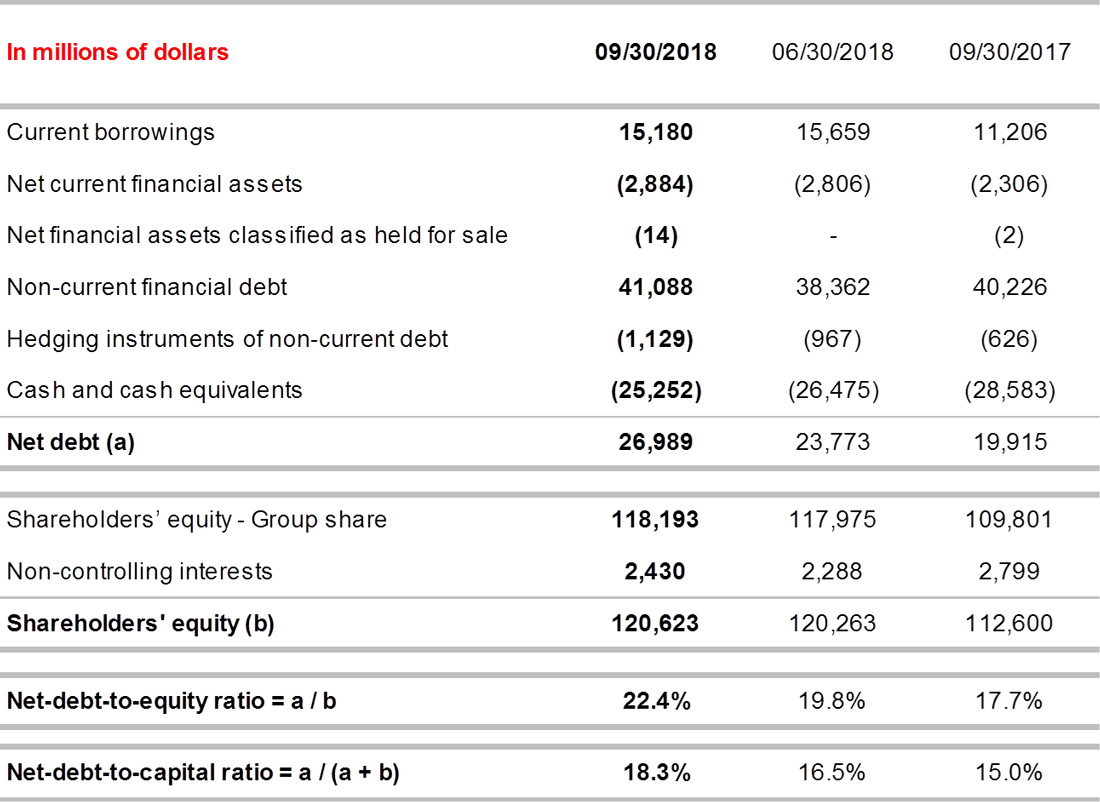
Gearing ratios
Return on average capital employed
> Twelve months ended September 30, 2018

> Twelve months ended June 30, 2018

> Twelve months ended September 30, 2017

* At replacement cost (excluding after-tax inventory effect).
This press release presents the results for the third quarter and first nine months 2018 from the consolidated financial statements of TOTAL S.A. as of September 30, 2018 (unaudited). The audit procedures by the Statutory Auditors are underway. The notes to these consolidated financial statements (unaudited) are available on the TOTAL website total.com
This document may contain forward-looking information on the Group (including objectives and trends), as well as forward-looking statements within the meaning of the Private Securities Litigation Reform Act of 1995, notably with respect to the financial condition, results of operations, business, strategy and plans of TOTAL. These data do not represent forecasts within the meaning of European Regulation No. 809/2004.
Such forward-looking information and statements included in this document are based on a number of economic data and assumptions made in a given economic, competitive and regulatory environment. They may prove to be inaccurate in the future, and are subject to a number of risk factors that could lead to a significant difference between actual results and those anticipated, the price of petroleum products, the ability to realize cost reductions and operating efficiencies without unduly disrupting business operations, changes in regulations including environmental and climate, currency fluctuations, as well as economic and political developments and changes in business conditions. Certain financial information is based on estimates particularly in the assessment of the recoverable value of assets and potential impairments of assets relating thereto.
Neither TOTAL nor any of its subsidiaries assumes any obligation to update publicly any forward-looking information or statement, objectives or trends contained in this document whether as a result of new information, future events or otherwise. Further information on factors, risks and uncertainties that could affect the Group’s business, financial condition, including its operating income and cash flow, reputation or outlook is provided in the most recent Registration Document, the French language version of which is filed by the Company with the French Autorité des Marchés Financiers and annual report on Form 20-F filed with the United States Securities and Exchange Commission (“SEC”).
Financial information by business segment is reported in accordance with the internal reporting system and shows internal segment information that is used to manage and measure the performance of TOTAL. In addition to IFRS measures, certain alternative performance indicators are presented, such as performance indicators excluding the adjustment items described below (adjusted operating income, adjusted net operating income, adjusted net income), return on equity (ROE), return on average capital employed (ROACE) and gearing ratio. These indicators are meant to facilitate the analysis of the financial performance of TOTAL and the comparison of income between periods. They allow investors to track the measures used internally to manage and measure the performance of the Group.
These adjustment items include:
(i) Special items
Due to their unusual nature or particular significance, certain transactions qualified as "special items" are excluded from the business segment figures. In general, special items relate to transactions that are significant, infrequent or unusual. However, in certain instances, transactions such as restructuring costs or asset disposals, which are not considered to be representative of the normal course of business, may be qualified as special items although they may have occurred within prior years or are likely to occur again within the coming years.
(ii) Inventory valuation effect
The adjusted results of the Refining & Chemicals and Marketing & Services segments are presented according to the replacement cost method. This method is used to assess the segments’ performance and facilitate the comparability of the segments’ performance with those of its competitors.
In the replacement cost method, which approximates the LIFO (Last-In, First-Out) method, the variation of inventory values in the statement of income is, depending on the nature of the inventory, determined using either the month-end price differentials between one period and another or the average prices of the period rather than the historical value. The inventory valuation effect is the difference between the results according to the FIFO (First-In, First-Out) and the replacement cost.
(iii) Effect of changes in fair value
The effect of changes in fair value presented as an adjustment item reflects, for some transactions, differences between internal measures of performance used by TOTAL’s management and the accounting for these transactions under IFRS.
IFRS requires that trading inventories be recorded at their fair value using period-end spot prices. In order to best reflect the management of economic exposure through derivative transactions, internal indicators used to measure performance include valuations of trading inventories based on forward prices.
Furthermore, TOTAL, in its trading activities, enters into storage contracts, whose future effects are recorded at fair value in Group’s internal economic performance. IFRS precludes recognition of this fair value effect.
The adjusted results (adjusted operating income, adjusted net operating income, adjusted net income) are defined as replacement cost results, adjusted for special items, excluding the effect of changes in fair value.
Euro amounts presented for the fully adjusted-diluted earnings per share represent dollar amounts converted at the average euro-dollar (€-$) exchange rate for the applicable period and are not the result of financial statements prepared in euros.
Cautionary Note to U.S. Investors - The SEC permits oil and gas companies, in their filings with the SEC, to separately disclose proved, probable and possible reserves that a company has determined in accordance with SEC rules. We may use certain terms in this press release, such as “potential reserves” or “resources”, that the SEC’s guidelines strictly prohibit us from including in filings with the SEC. U.S. investors are urged to consider closely the disclosure in our Form 20-F, File N° 1-10888, available from us at 2, place Jean Millier - Arche Nord Coupole/Regnault - 92078 Paris-La Défense Cedex, France, or at our website total.com. You can also obtain this form from the SEC by calling 1-800-SEC-0330 or on the SEC’s website sec.gov.

