Exhibit 99.1 Q1 FY24 Investor Update NASDAQ: JBSS JOHN.B SANFILIPPO & SON,INC. Proprietary & Confidential John B. Sanfilippo & Son, Inc.
Forward-Looking Statements Some of the statements in this presentation and any statements by management constitute “forward-looking statements” about John B. Sanfilippo & Son, Inc. Such statements include, in particular, statements about our plans, strategies, business prospects, changes and trends in our business and the markets in which we operate. In some cases, you can identify forward-looking statements by the use of words such as may, will, could, would, should, expect, plan, anticipate, intend, believe, estimate, forecast, predict, propose, potential or continue or the negative of those terms or other comparable terminology. These statements represent our present expectations or beliefs concerning future events and are not guarantees. Such statements speak only as of the date they are made, and we do not undertake any obligation to update any forward-looking statement. Proprietary & Confidential| John B. Sanfilippo & Son, Inc. 2
JBSS Corporate Overview One of the largest nut processors in the world with net sales of approximately $1.0B (FY23) State-of-the-art nut processing capabilities, including what we believe is the single largest nut processing facility in the world A North American market leader in every selling channel – from consumer and commercial ingredient customers to contract manufacturing customers Dual consumer strategy of offering branded nut and dried fruit programs (Fisher, Orchard Valley Harvest, Squirrel Brand and Southern Style Nuts) and private brands Commodity procurement expertise with buyers averaging over 25+ years’ experience Vertically integrated nut processing operation for pecans, peanuts and walnuts 4th generation family managed company Consistent and profitable growth over multiple economic cycles Returning cash to shareholders since 2013 Proprietary & Confidential| John B. Sanfilippo & Son, Inc. 3
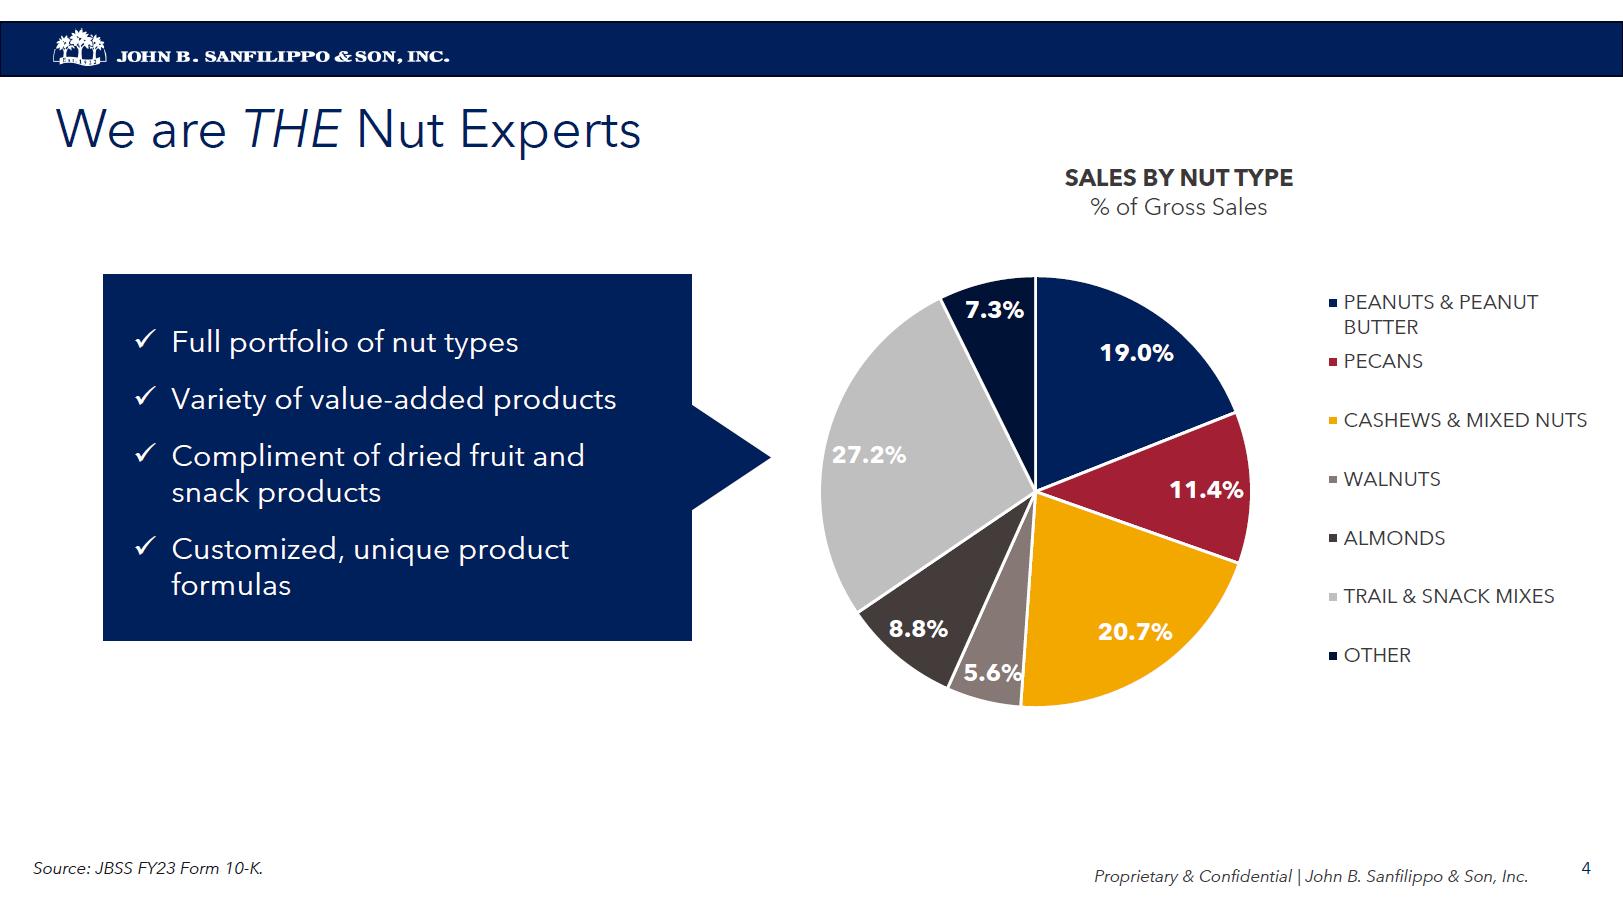 We are THE Nut Experts SALES BY NUT TYPE Full portfolio of nut types Variety of value-added products Compliment of dried fruit and snack products Customized, unique product formulas Proprietary & Confidential| John B. Sanfilippo & Son, Inc. 4
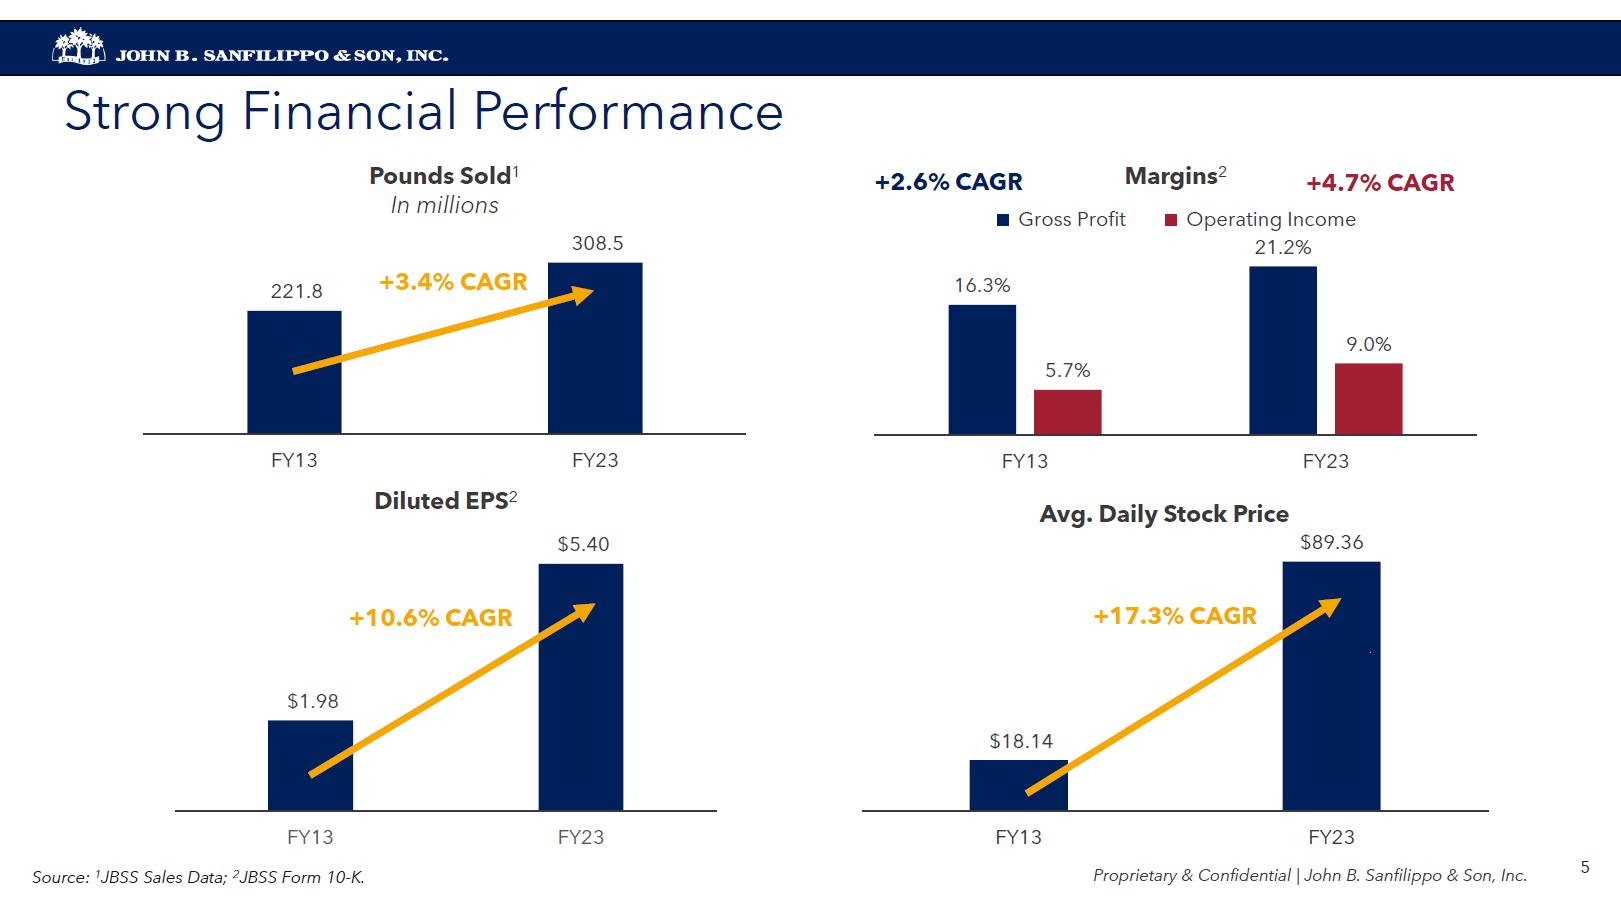
Strong Financial Performance Pounds Sold1 +3.4% CAGR Diluted EPS2 +10.6% CAGR +2.6% CAGR Margins2 +4.7% CAGR Avg. Daily Stock Price +17.3% CAGR Proprietary & Confidential| John B. Sanfilippo & Son,Inc.Source:1JBSS Sales Data: 2JBSS Form 10-k. 5
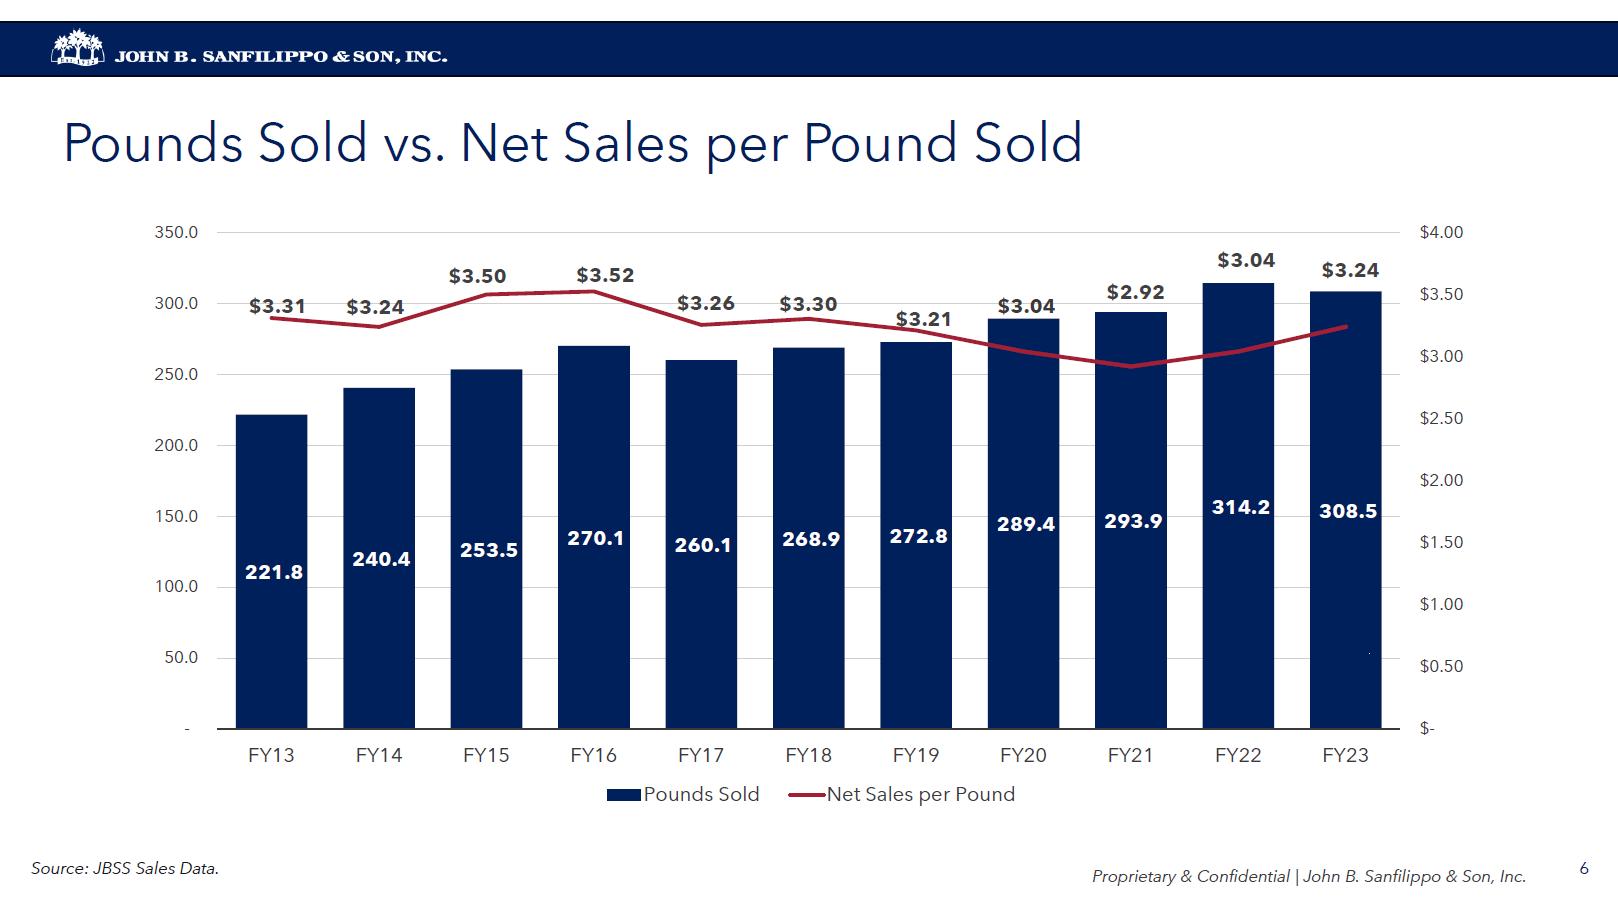
Pounds Sold vs. Net Sales per Pound Sold JOHN B. SANFILIPPO & SON,INC. Proprietary & Confidential| John B. Sanfilippo & Son ,Inc. Source: JBSS Sales Date.350.0 300.0 250.0 200.0 150.0 100.0 50.0 221.8 240.4 253.5 270.1 260.1 268.9 2728 2728 289.4 289.4 293.9 314.2 308.5 $3.31 $3.24 $3.50 $3.52 $3.26 $3.30 $3.21 $3.04 $2.92 $3.04 $3.24 221.8 240.4 253.5 270.1 260.1 268.9 272.8 289.4 293.9 314.2 308.5 FY13 FY14 FY15 FY16 FY17 FY18 FY19 FY20 FY21 FY22 FY23 6
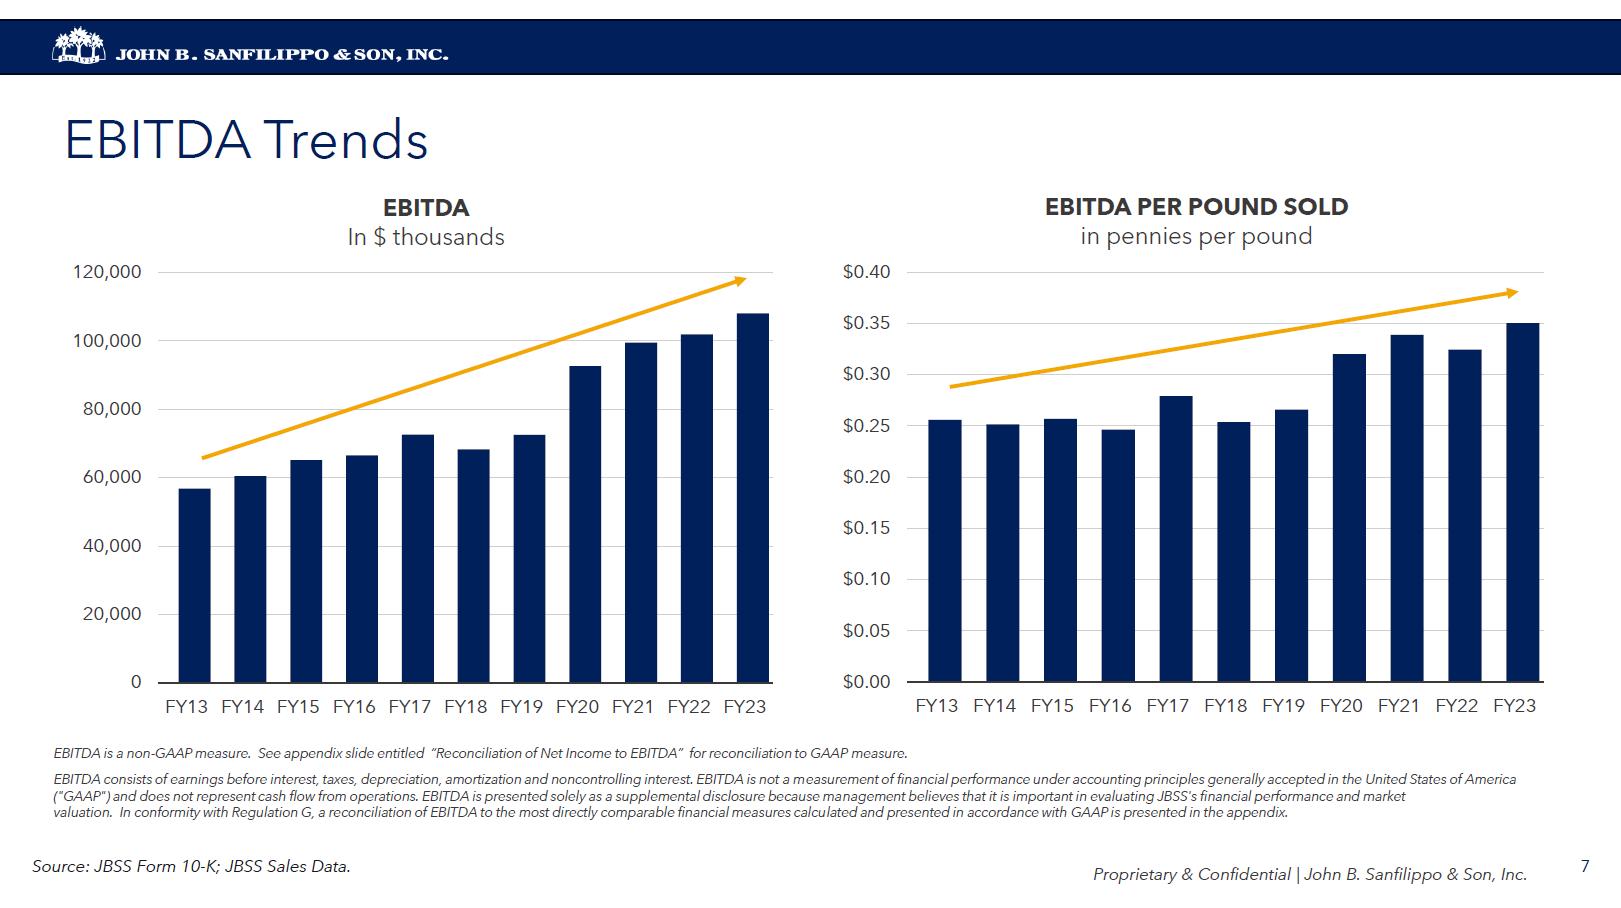
EBITDA Trends EBITDA In $ thousands EBITDA PER POUND SOLD in pennies per pound EBITDA is a non-GAAP measure. See appendix slide entitled “Reconciliation of Net Income to EBITDA” for reconciliation to GAAP measure. EBITDA consists of earnings before interest, taxes, depreciation, amortization and noncontrolling interest. EBITDA is not a measurement of financial performance under accounting principles generally accepted in the United States of America ("GAAP") and does not represent cash flow from operations. EBITDA is presented solely as a supplemental disclosure because management believes that it is important in evaluating JBSS's financial performance and market valuation. In conformity with Regulation G, a reconciliation of EBITDA to the most directly comparable financial measures calculated and presented in accordance with GAAP is presented in the appendix. Source: JBSS Form 10-K; JBSS Sales Data. Proprietary & Confidential| John B. Sanfilippo & Son, Inc. 120,000 100,000 80,000 60,000 40,000 20,000 0 $0.40 $0.35 $0.30 $0.25 $0.20 $0.15 $0.15 $0.10 $0.05 $0.00 FY13 FY14 FY15 FY16 FY17 FY18 FY19 FY20 FY21 FY22 FY23 7
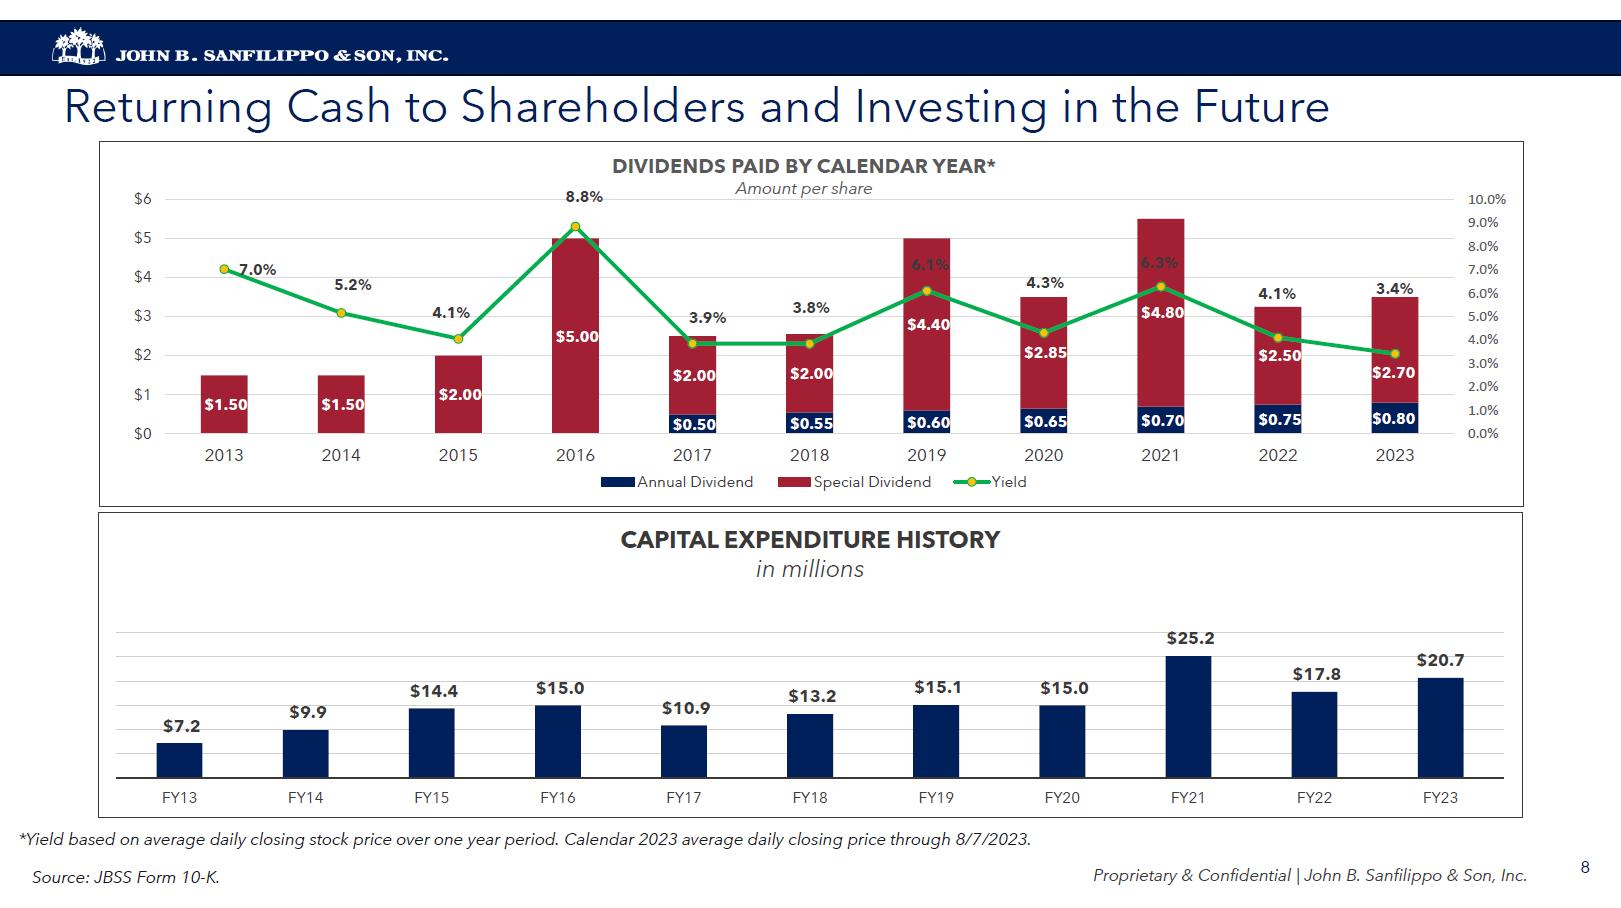
Returning Cash to Shareholders and Investing in the Future DIVIDENDS PAID BY CALENDAR YEAR* Amount per share CAPITAL EXPENDITURE HISTORY in millions *Yield based on average daily closing stock price over one year period. Calendar 2023 average daily closing price through 8/7/2023.Source: JBSS Form 10-K.Proprietary & Confidential| John B. Sanfilippo & Son, Inc. $6 $5 $4 $3 $2 $1 $0 7.0% 5.2% 4.1% 8.8% 3.9% 3.8% 6.1% 4.3% 6.3% 4.1% 3.4% $1.50 $1.50 $2.00 $5.00 $2.00 $2.00 $0.50 $0.55 $4.40 $0.60 $2.85 $0.65 $4.80 $0.70 $2.50 $0.75 $2.70 $0.80 2013 2014 2015 2016 2017 2018 2019 2020 2021 2022 2023 Annual Dividend Special Dividend Yield $7.2 FY13 $9.9 FY14 $14.4 FY15 $15.0 FY16 $10.9 FY17 $13.2 FY18 $15.1 FY19 $15.0 FY20 $25.2 FY21 $17.8 FY22 $20.7 $6 $5 $4 $3 $2 $1 $0 10.0% 9.0% 8.0% 7.0% 6.0% 5.0% 4.0% 3.0% 2.0% 1.0% 0.0% 8
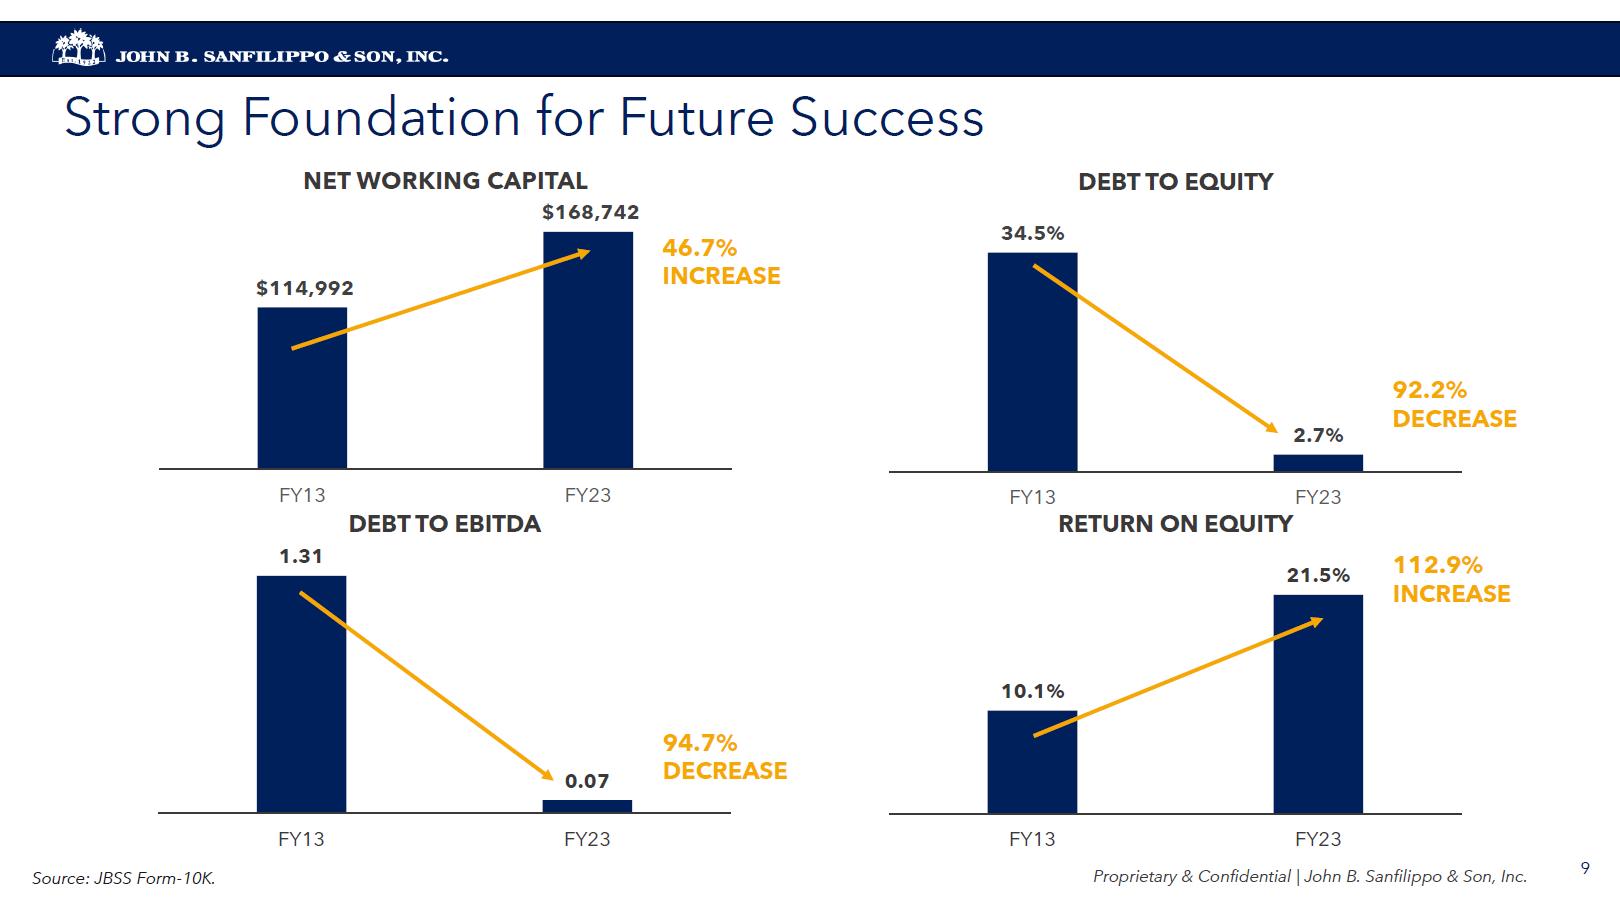
Strong Foundation for Future Success NET WORKING CAPITAL DEBT TO EQUITY DEBT TO EBITDA RETURN ON EQUITY Source: JBSS fORM-10k Proprietary & Confidential| John B. Sanfilippo & Son,Inc.$114,992 $168,742 46.7% INCREASE 34.5% 2.7% 92.2% DECREASE FY13 FY23 FY13 FY23 FY13 FY23 FY13 FY23 1.31 0.07 10.1% 21.5% 94.7% DECREASE 112.9% INCREASE Source: JBSS From-10K.Proprietary & Confidential| John B. Sanfilippo & Son, Inc. JOHN B. SANFILIPPO & SON,INC. 9
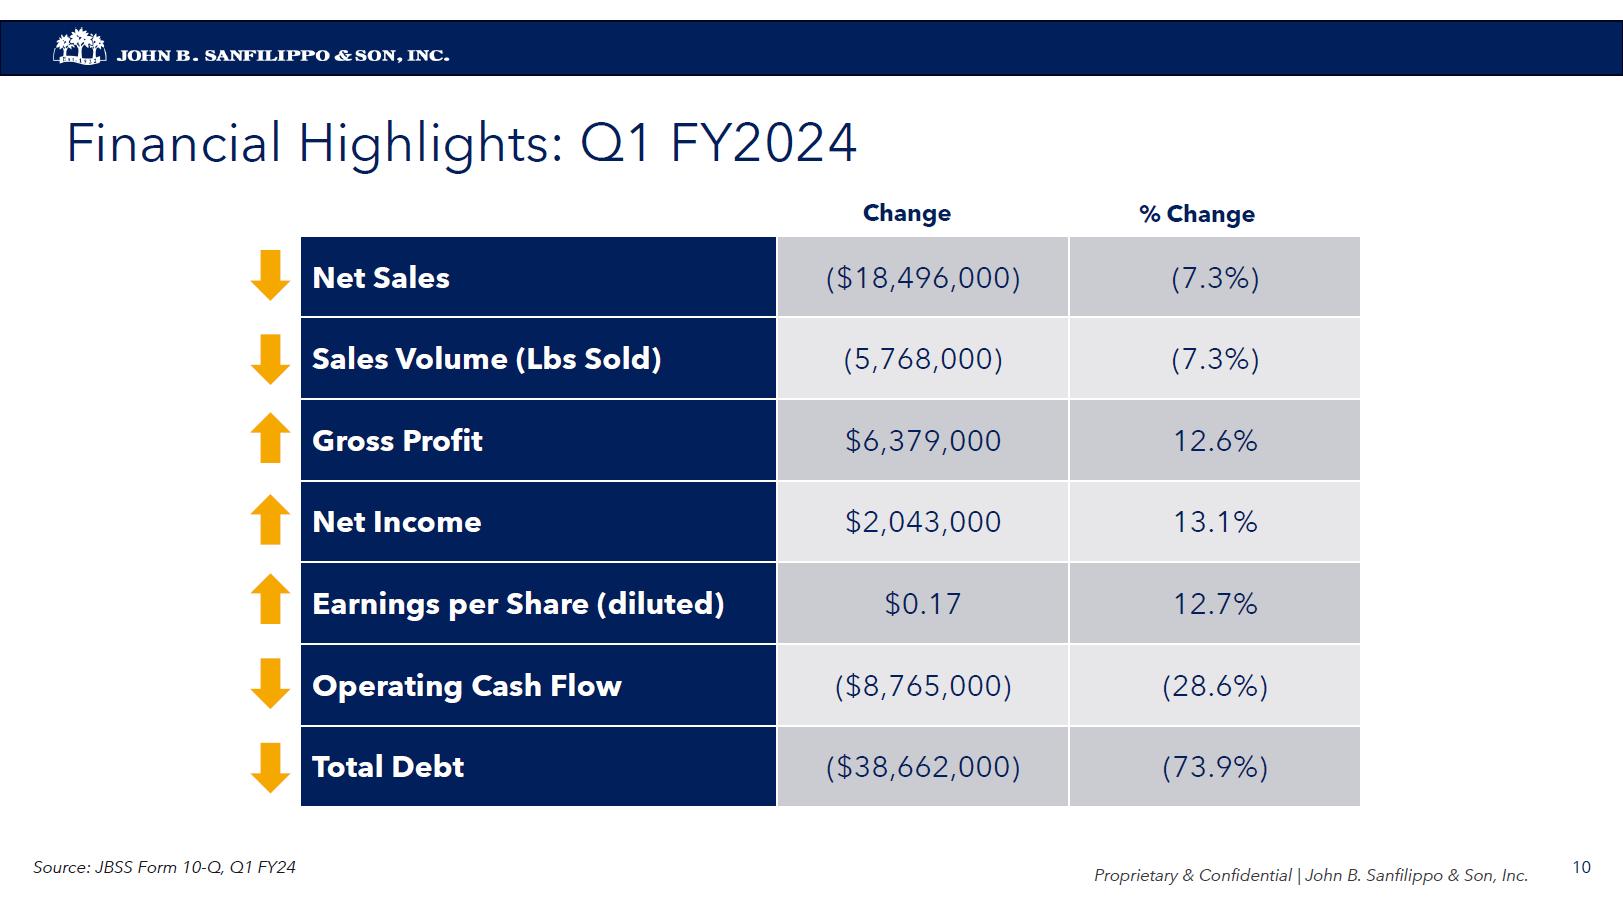
John B. Sanfilippo & son, inc Financial Highlights: Q1 FY2024 Change % Change Net Sales ($18,496,000) (7.3%) Sales Volume (Lbs Sold) (5,768,000) (7.3%) Gross Profit$6,379,000 12.6% Net Income $2,043,000 13.1% Earnings per Share (diluted) $0.17 12.7% Operating Cash Flow ($8,765,000) (28.6%) Total Debt ($38,662,000) (73.9%) Source: JBSS Form 10-Q, Q1 FY24 Proprietary & confidential john B. Sanfilippo & son, inc John B. Sanfilippo & son, inc 10

FY 2023 ResultsProprietary & confidential john B. Sanfilippo & son, inc 11
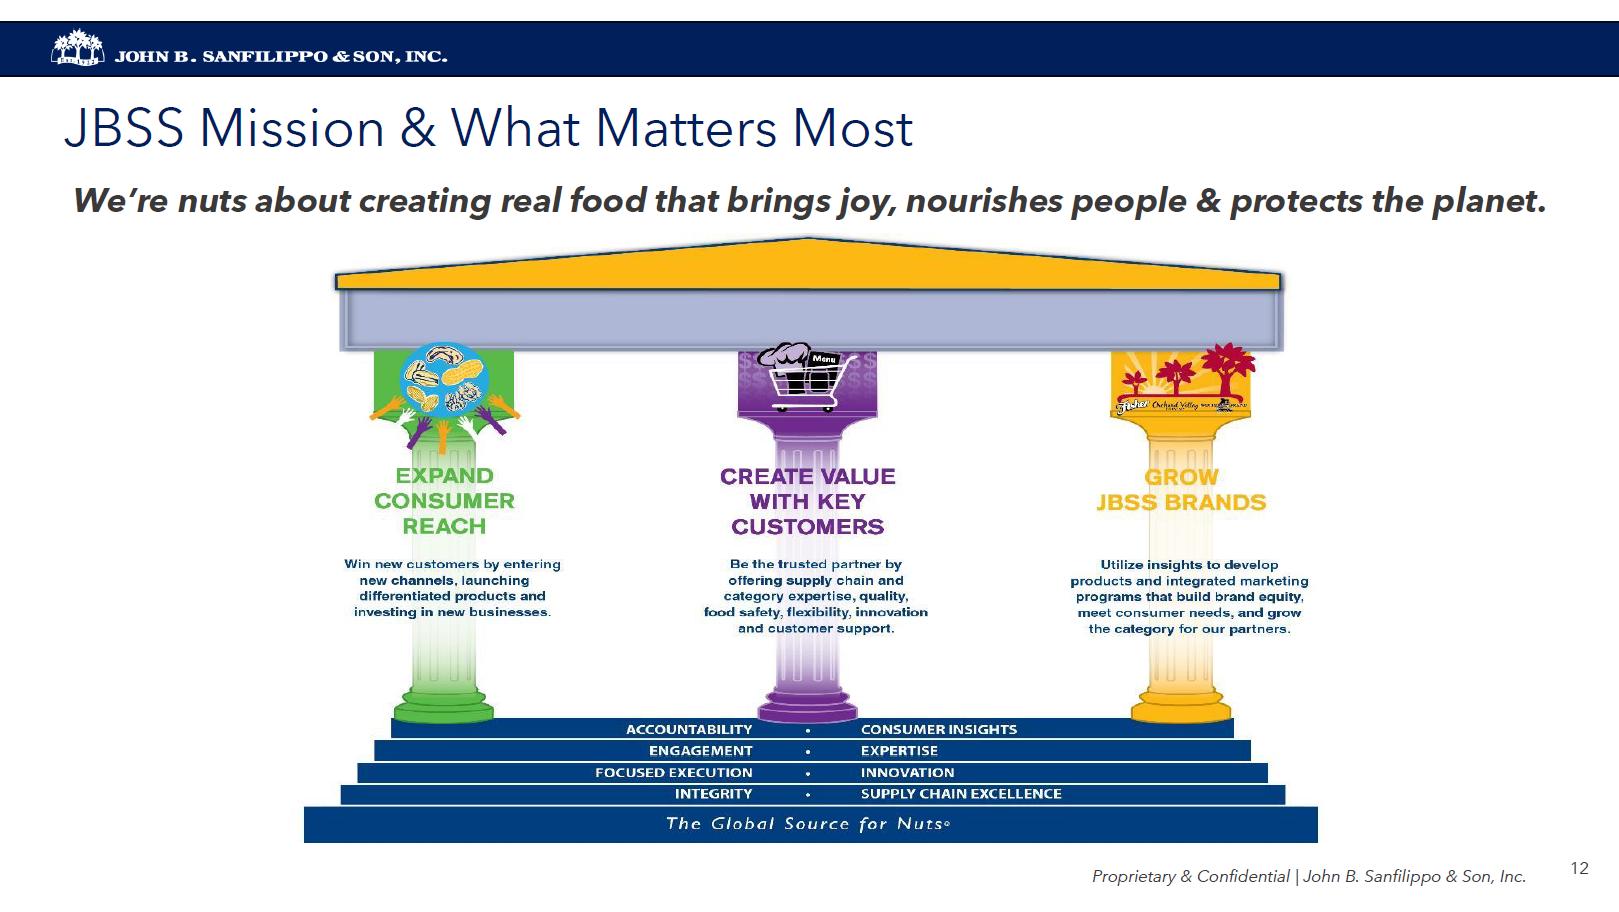
John B. Sanfilippo & son, inc JBSS Mission & What Matters Most We’re nuts about creating real food that brings joy, nourishes people & protects the planet.expand consumer reach create value with key customers grow jbss brands win new customers by entering new channels launching differentiated products and investing in new businesses be the trusted parter by offering supply chain and category expertise, quality, food safety flexibility innovation and customer support utilize insights to develop products and integrated marketing programs that build brand equity meet consumer needs and grow the category for our partners accountability engagement focused execution integrity consumer insights expertise innovation supply chain excellence the global source for nuts Proprietary & confidential john B. Sanfilippo & son, inc 12
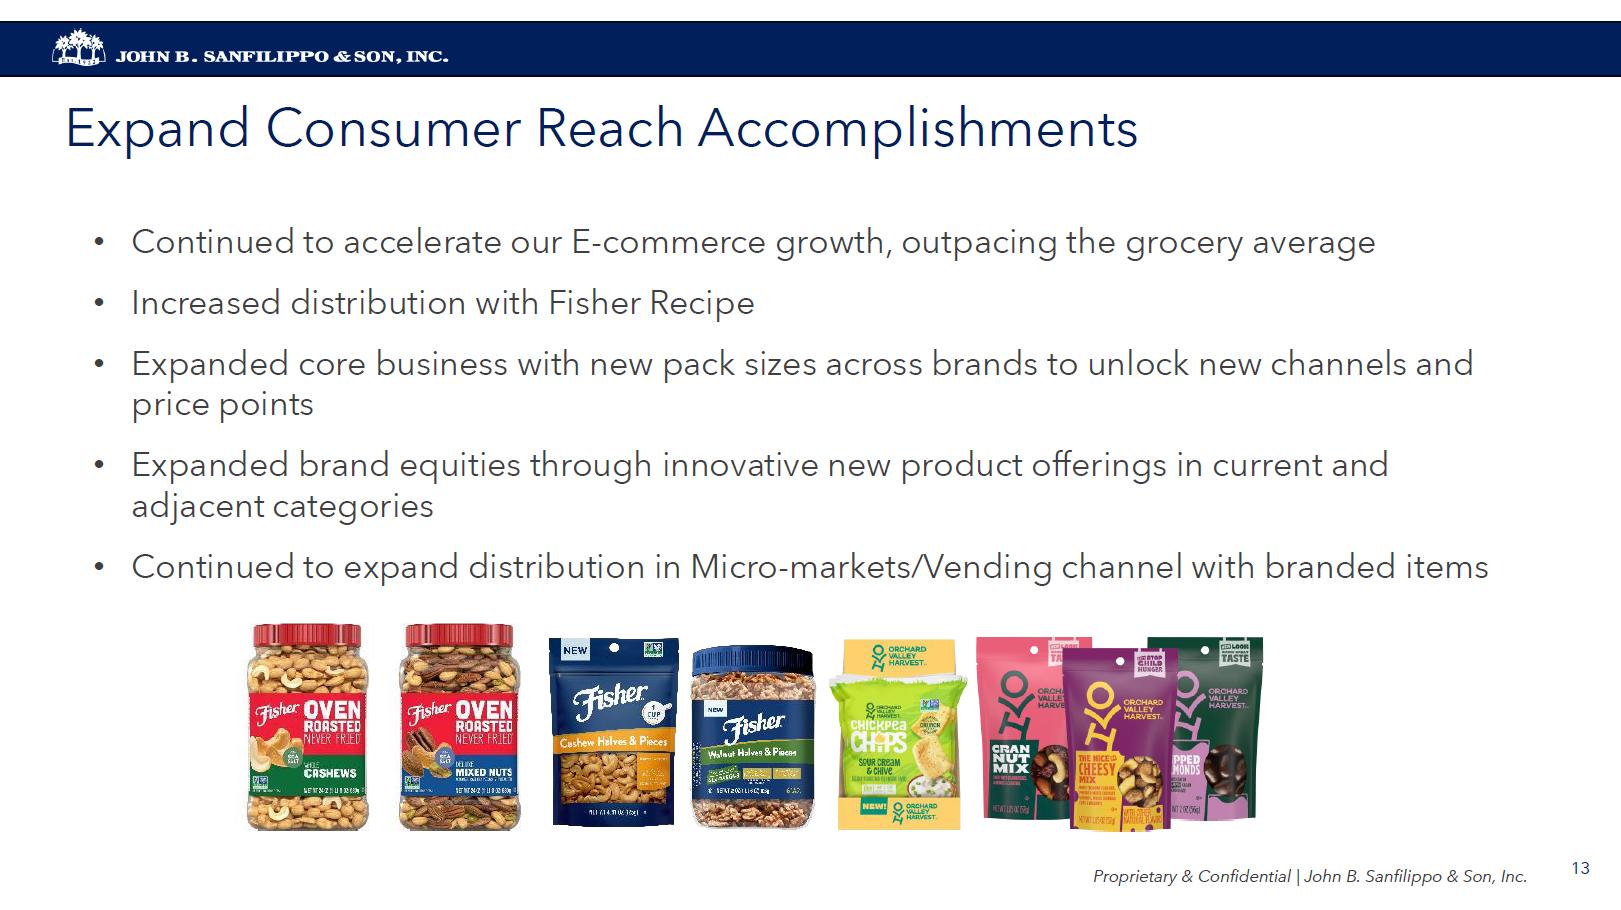
John B. Sanfilippo & son, inc Expand Consumer Reach Accomplishments Continued to accelerate our E-commerce growth, outpacing the grocery average Increased distribution with Fisher Recipe Expanded core business with new pack sizes across brands to unlock new channels and price points Expanded brand equities through innovative new product offerings in current and adjacent categories Continued to expand distribution in Micro markets/Vending channel with branded items Proprietary & confidential john B. Sanfilippo & son, inc 13
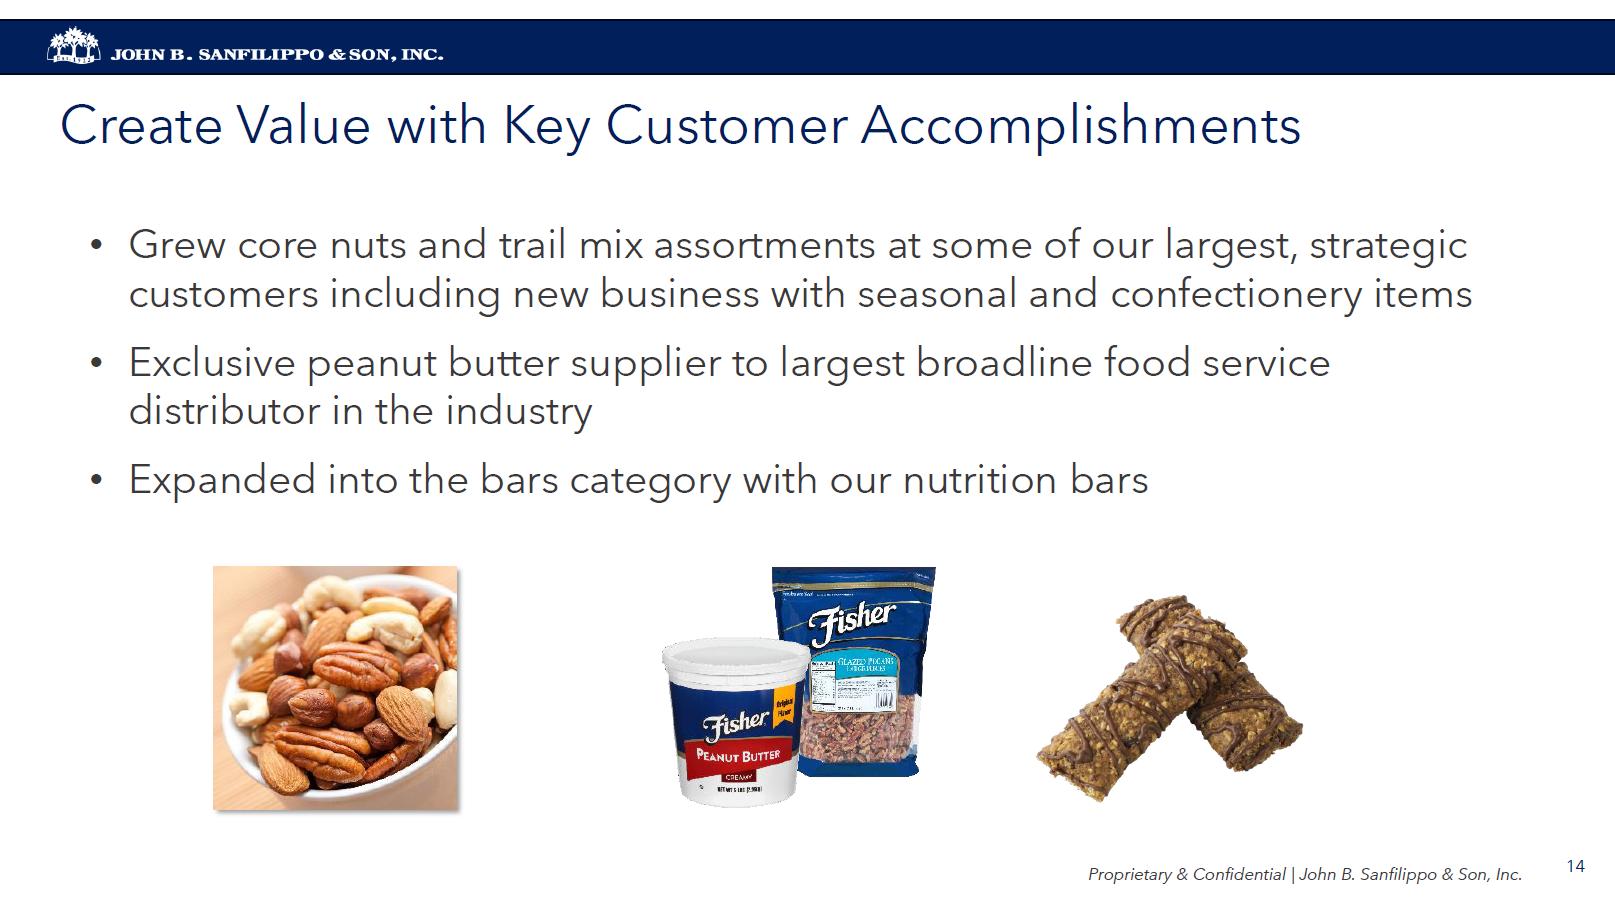
John B. Sanfilippo & son, inc Create Value with Key Customer Accomplishments Grew core nuts and trail mix assortments at some of our largest, strategic customers including new business with seasonal and confectionery items Exclusive peanut butter supplier to largest broadline food service distributor in the industry Expanded into the bars category with our nutrition barsProprietary & confidential john B. Sanfilippo & son, inc 14
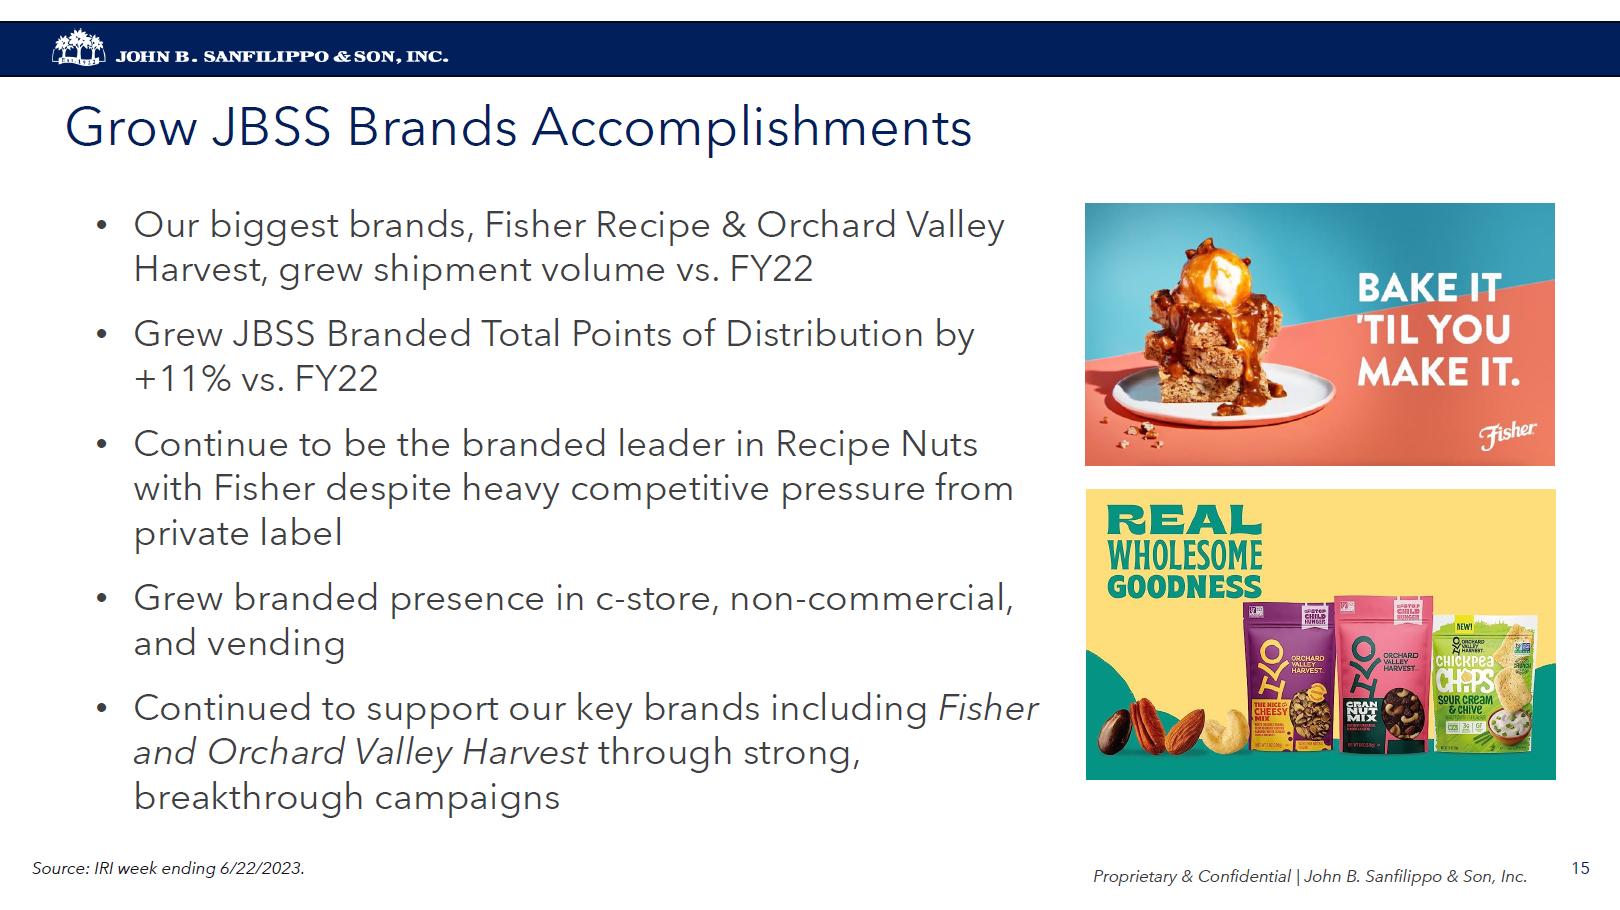
John B. Sanfilippo & son, inc Grow JBSS Brands Accomplishments Our biggest brands, Fisher Recipe & Orchard Valley Harvest, grew shipment volume vs. FY22 Grew JBSS Branded Total Points of Distribution by +11% vs. FY22 Continue to be the branded leader in Recipe Nuts with Fisher despite heavy competitive pressure from private label Grew branded presence in c-store, non-commercial, and vending Continued to support our key brands including Fisher and Orchard Valley Harvest through strong, breakthrough campaigns Source: IRI week ending 6/22/2023. Proprietary & confidential john B. Sanfilippo & son, inc 15
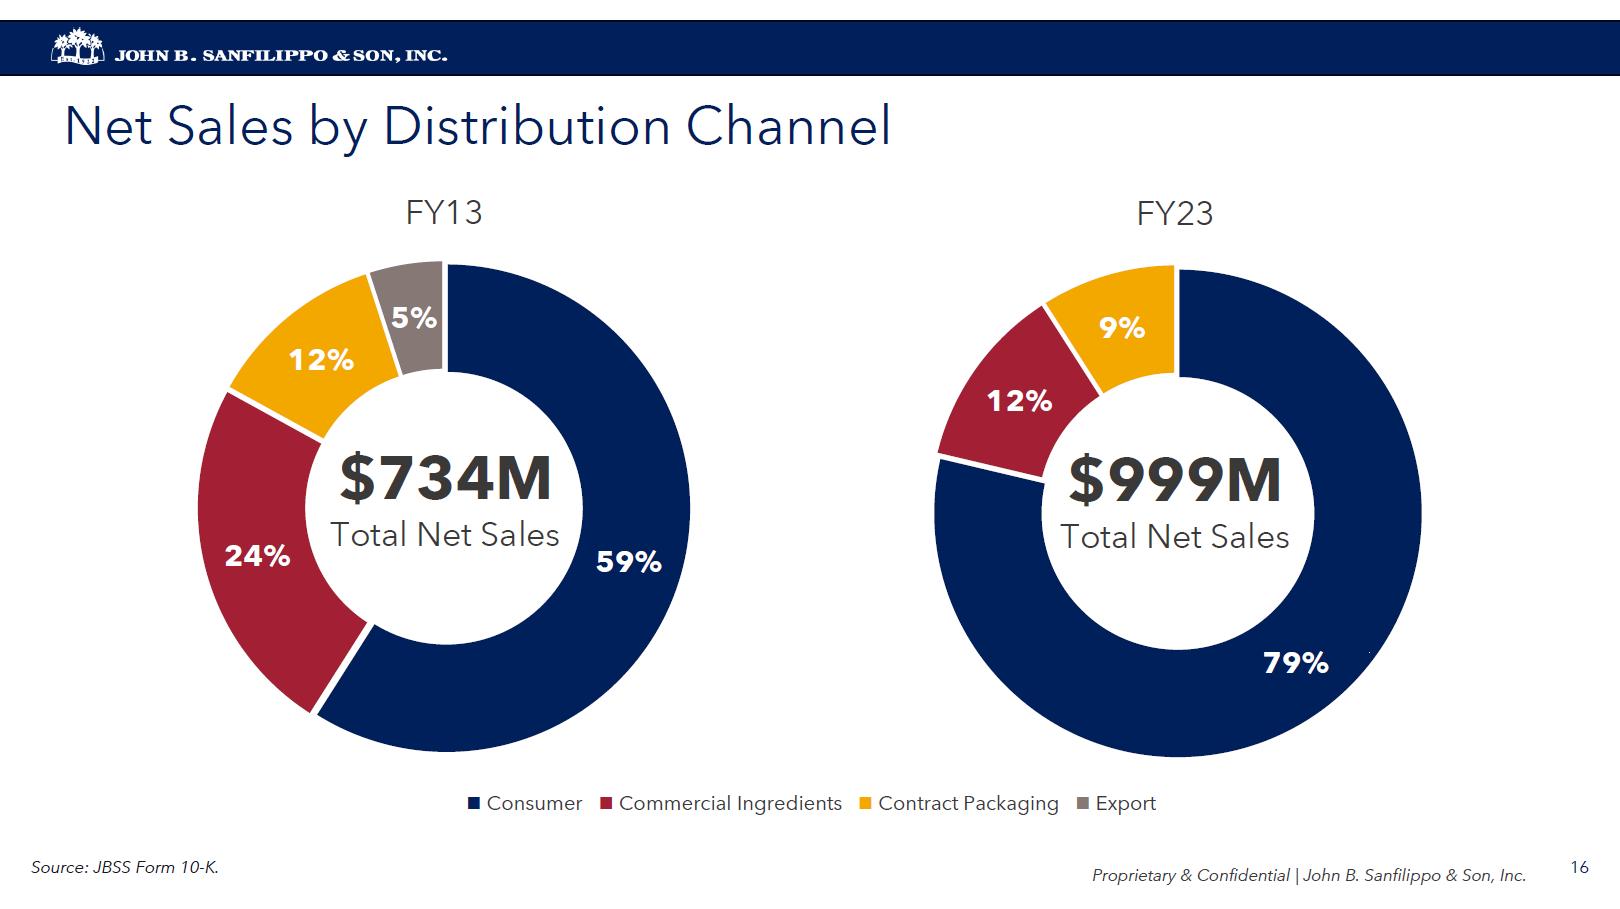
John B. Sanfilippo & son, inc Net Sales by Distribution Channel FY13 FY2312% 5% 24% 59% $734M Tatal ner sales 12% 9% 79% $999M total net sales Export Contract Packaging Commercial Ingredients Consumer Source: JBSS Form 10-K.Proprietary confidential john B. Sanfilippo & son, inc 16
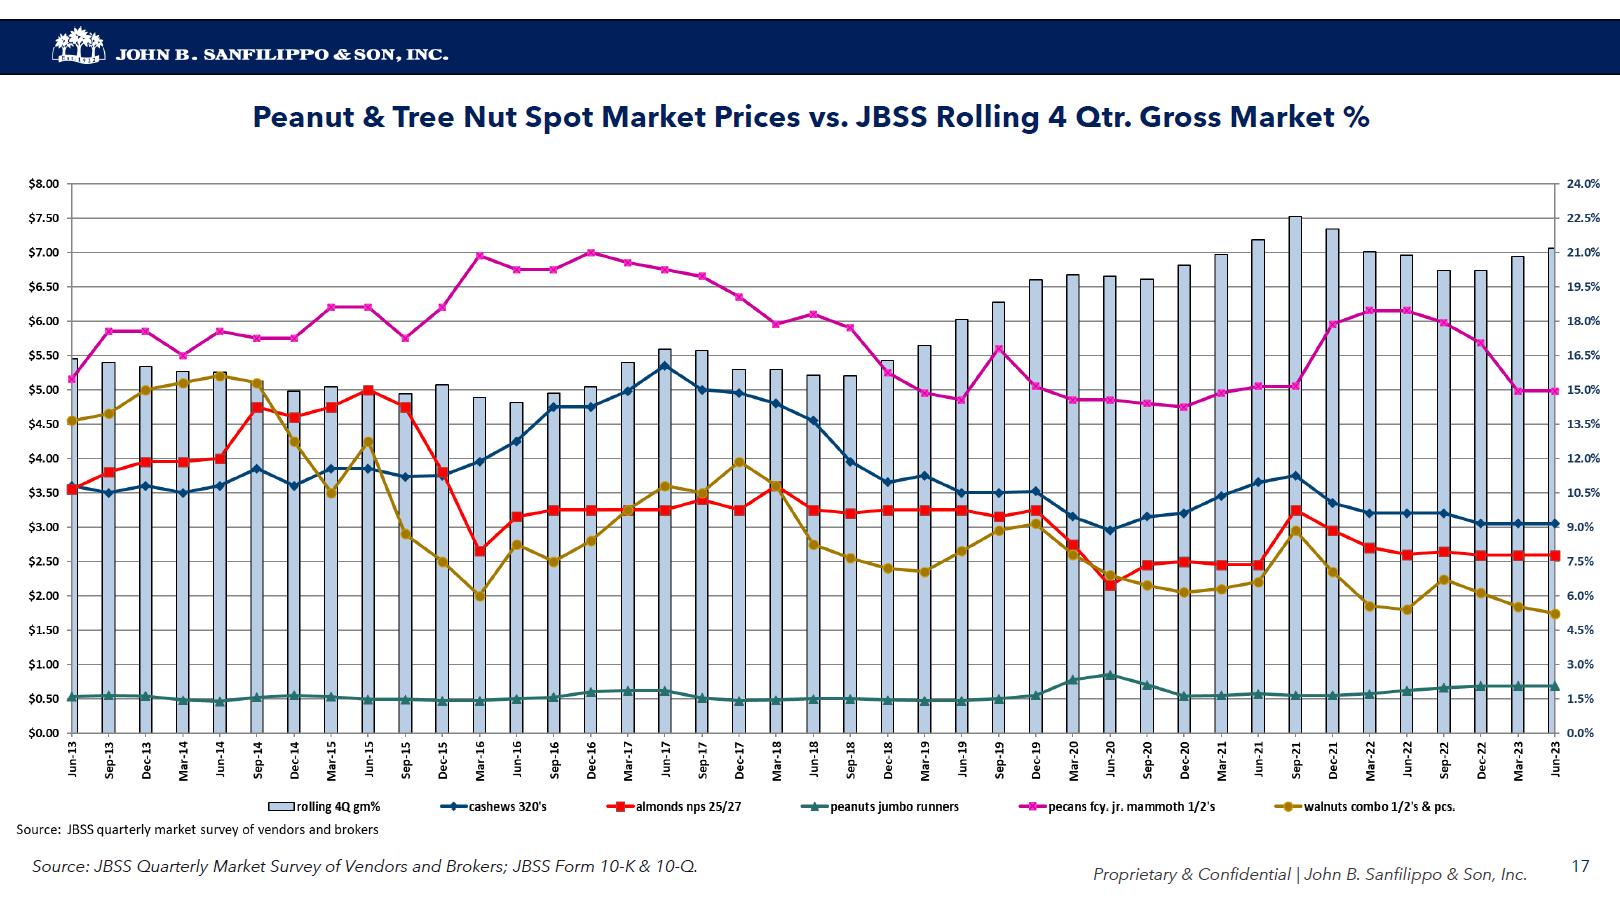
John B. Sanfilippo & son, inc Peanut & Tree Nut Spot Market Prices vs. JBSS Rolling 4 Qtr. Gross Market % $8.00 $7.50 $7.00 $6.50 $6.00 $5.50 $5.00 $4.50 $4.00 $3.50 $3.00 $2.50 $2.00 $1.50 $1.00 $0.50 $0.00 24.0% 22.5% 21.0% 19.5% 18.0% 16.5% 15.0% 13.5% 12.0% 10.05% 9.0% 7.5% 6.0% 4.5% 3.0% 1.5% 0.0% jun-13 sep-13 dec-13 mar-14 jun-14 sep-14 dec-14 mar-15 jun-15 sep-15 dec-15 mar-16 jun-16 sep-16 dec-16 mar-17 jun-17 sep-17 dec-17 mar-18 jun-18 sep-18 dec-18 mar-19 jun-19 sep-19 dec-19 mar-20 jun-20 dec-20 dec-20 mar-21 jun-21 sep-21 dec-21 mar-22 jun-22 sep-22 dec-22 mar-23 jun-23 rolling 4q gm% cashews 320’s almonds nps 25/27 peaunuts jumbo runners source JBSS quarterly market survey of vendors and brokers Proprietary & confidential john B. Sanfilippo & son, inc 17
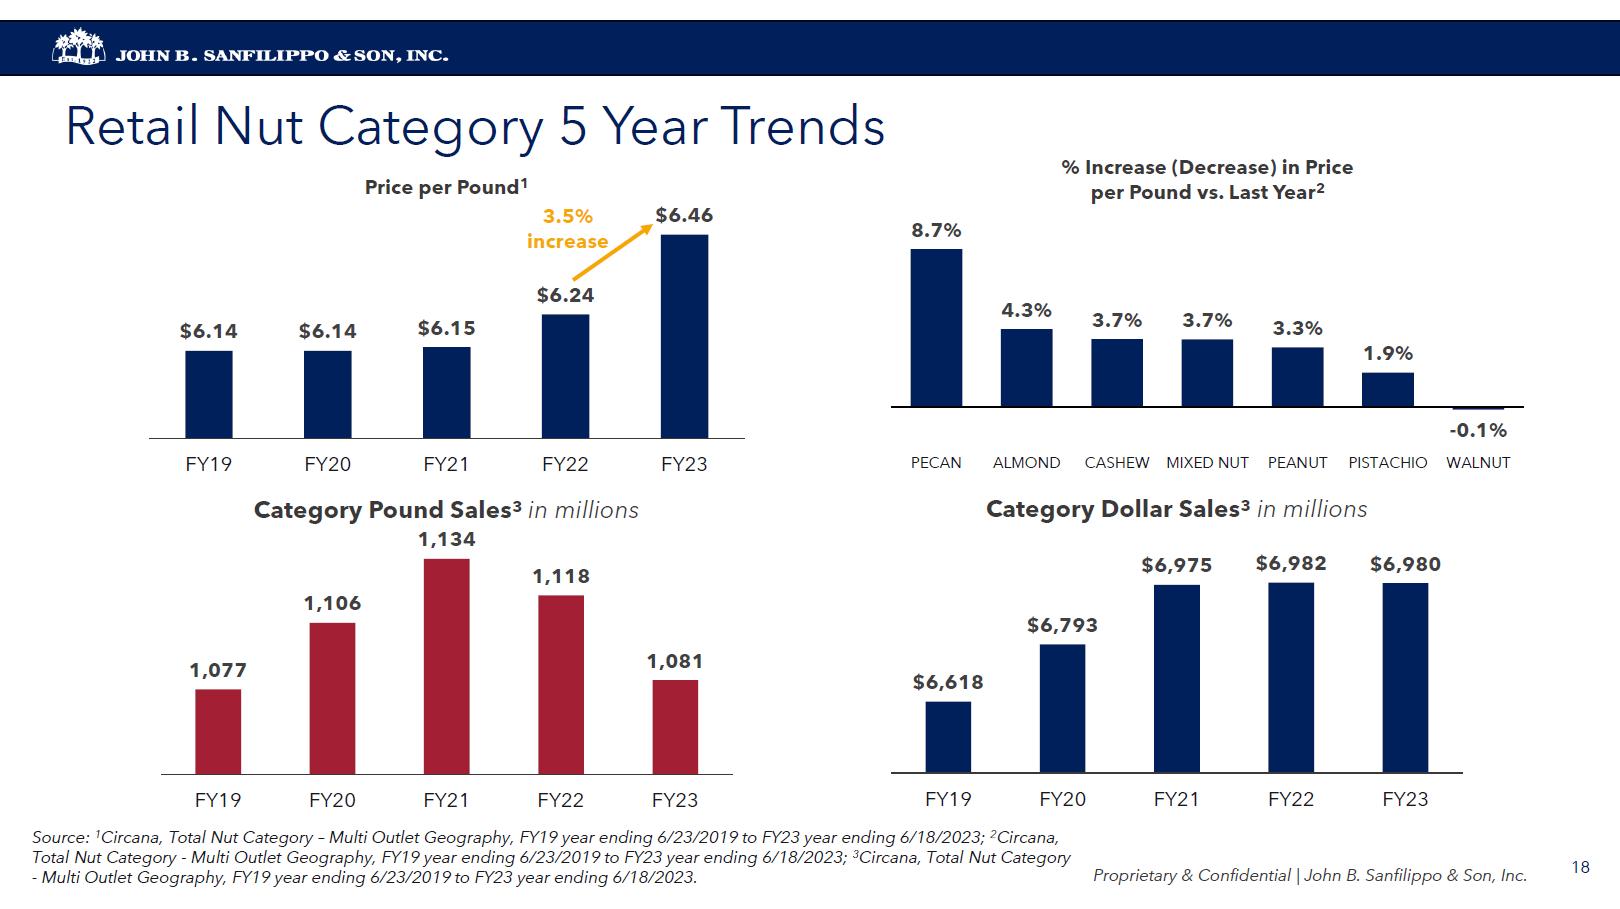
John B. Sanfilippo & son, inc Retail Nut Category 5 Year Trends % Increase (Decrease) in Price per Pound vs. Last Year2 Price per Pound1 3.5% increase$6.14 $6.14 $6.15 $6.24 $6.46 FY19 FY20 FY21 FY22 FY23 Category Pound Sales3 in millions 8.7% 4.3% 3.7% 3.7% 3.3% 1.9% -0.1% pecan almond cashew mixed peanut pistachio walnut Category Dollar Sales3 in millions $6,975 $6,975 $6,618 $6,618 FY19 FY20 FY21 FY22 FY23 Source: 1Circana, Total Nut Category – Multi Outlet Geography, FY19 year ending 6/23/2019 to FY23 year ending 6/18/2023; 2Circana, Total Nut Category - Multi Outlet Geography, FY19 year ending 6/23/2019 to FY23 year ending 6/18/2023; 3Circana, Total Nut Category - Multi Outlet Geography, FY19 year ending 6/23/2019 to FY23 year ending 6/18/2023. Proprietary& confidential john B. Sanfilippo & son, inc 1,106 1,106 1,106 1,118 1,118 FY19 FY20 FY21 FY22 FY23 $6,793 $6,618 $6,618 $6,982 $6,982 FY19 FY20 FY21 FY22 FY23 18
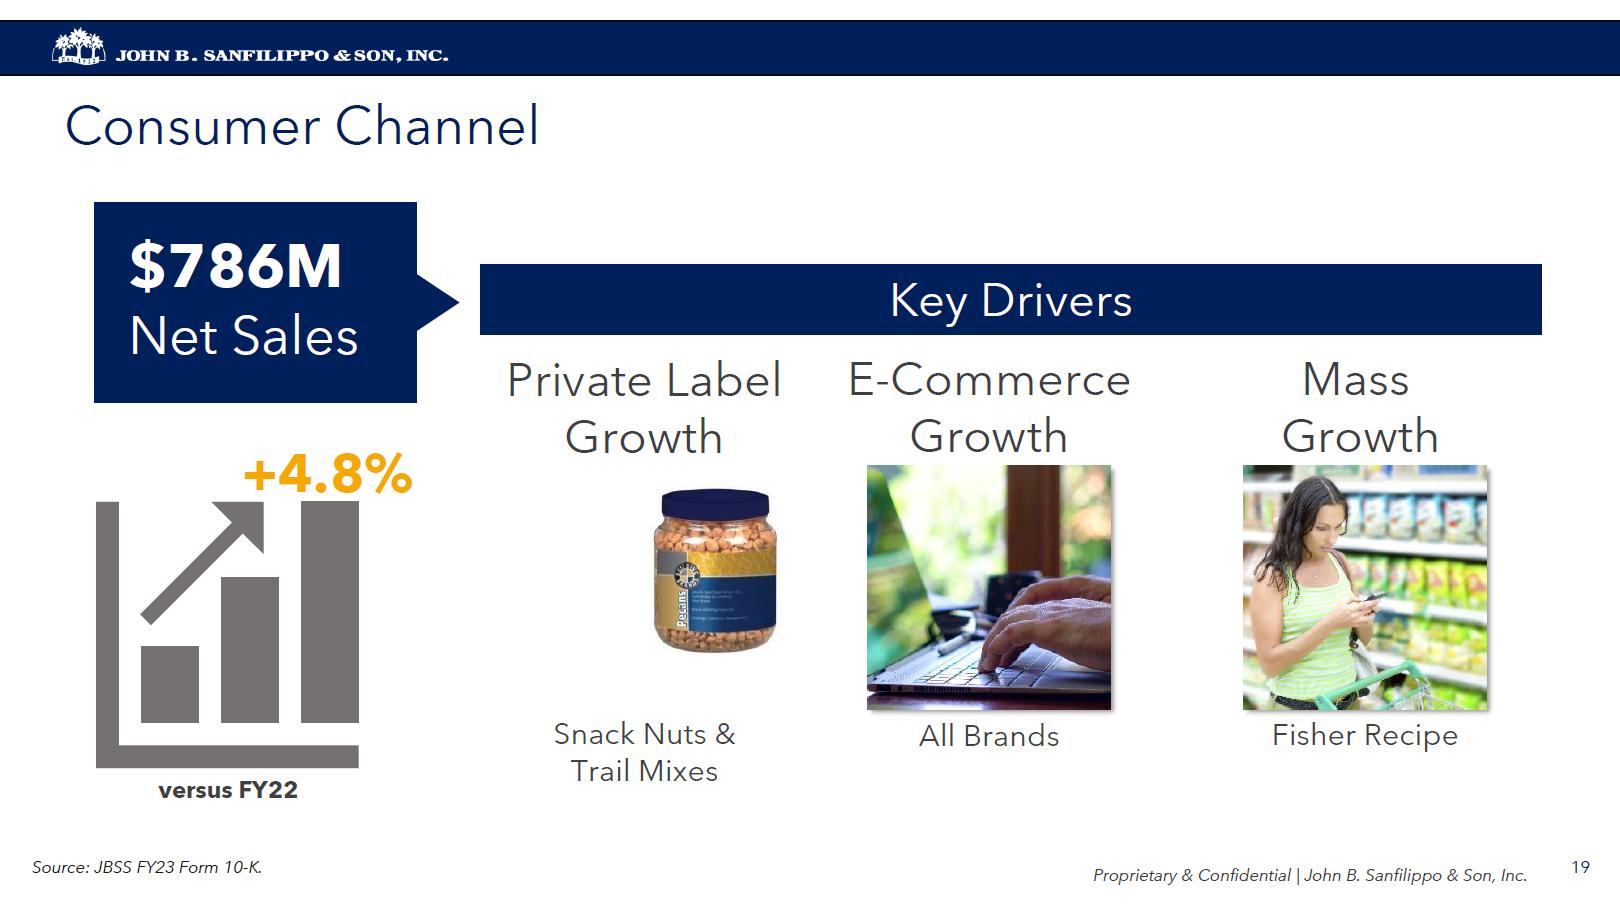
John B. Sanfilippo & son, inc. Consumer Channel $786M Net Sales Key Drivers Private Label Growth E-Commerce Growth Mass Growth +4.8% versus FY22 Snack Nuts & Trail Mixes All Brands Fisher Recipe Source: JBSS FY23 Form 10-K. proprietary & confidential| John B. Sanfinlippo & Son, Inc 19

John B. Sanfilippo & son, inc. Commercial Ingredients Channel $123M Net Sales Key Drivers Foodservice Channel Net Sales +11% vs. LY Industrial Channel Net Sales -22% vs. LY Distributor / Operator Growth Favorable Pricing Soft consumer Spending JBSS business priorities 20
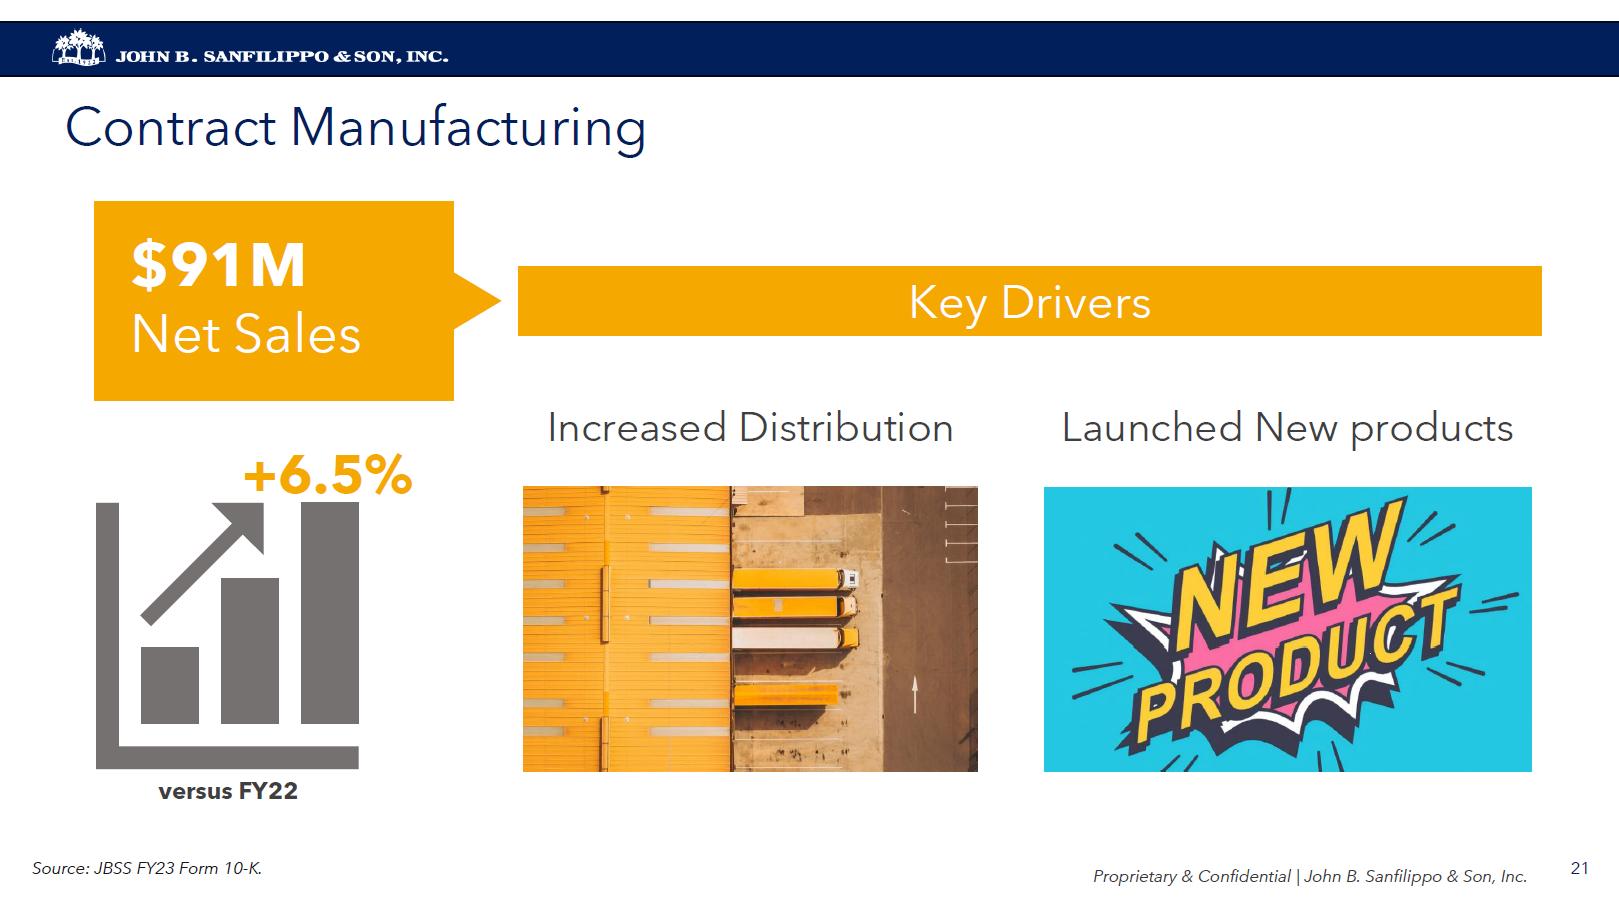
John B. Sanfilippo & son, inc. Contract Manufacturing $91M Net Sales Key Drivers +6.5% Increased Distribution Launched New products versus FY22 Source: JBSS FY23 Form 10-K. proprietary & confidential| john B. Sanfilippo & Son, Inc. 21
John B. Sanfilippo & son, inc. FY 2023 Brand Marketing Review proprietary & confidential| john B. Sanfilippo & Son, Inc. 22
John B. Sanfilippo & son, inc. Grown JBSS Brands Fisher recipe nuts ovh orchard valley harvest Fisher nuts Squirrel Nuts since 1888 southern style nuts est.1922 just the cheese proprietary & confidential| john B. Sanfilippo & Son, Inc. 23
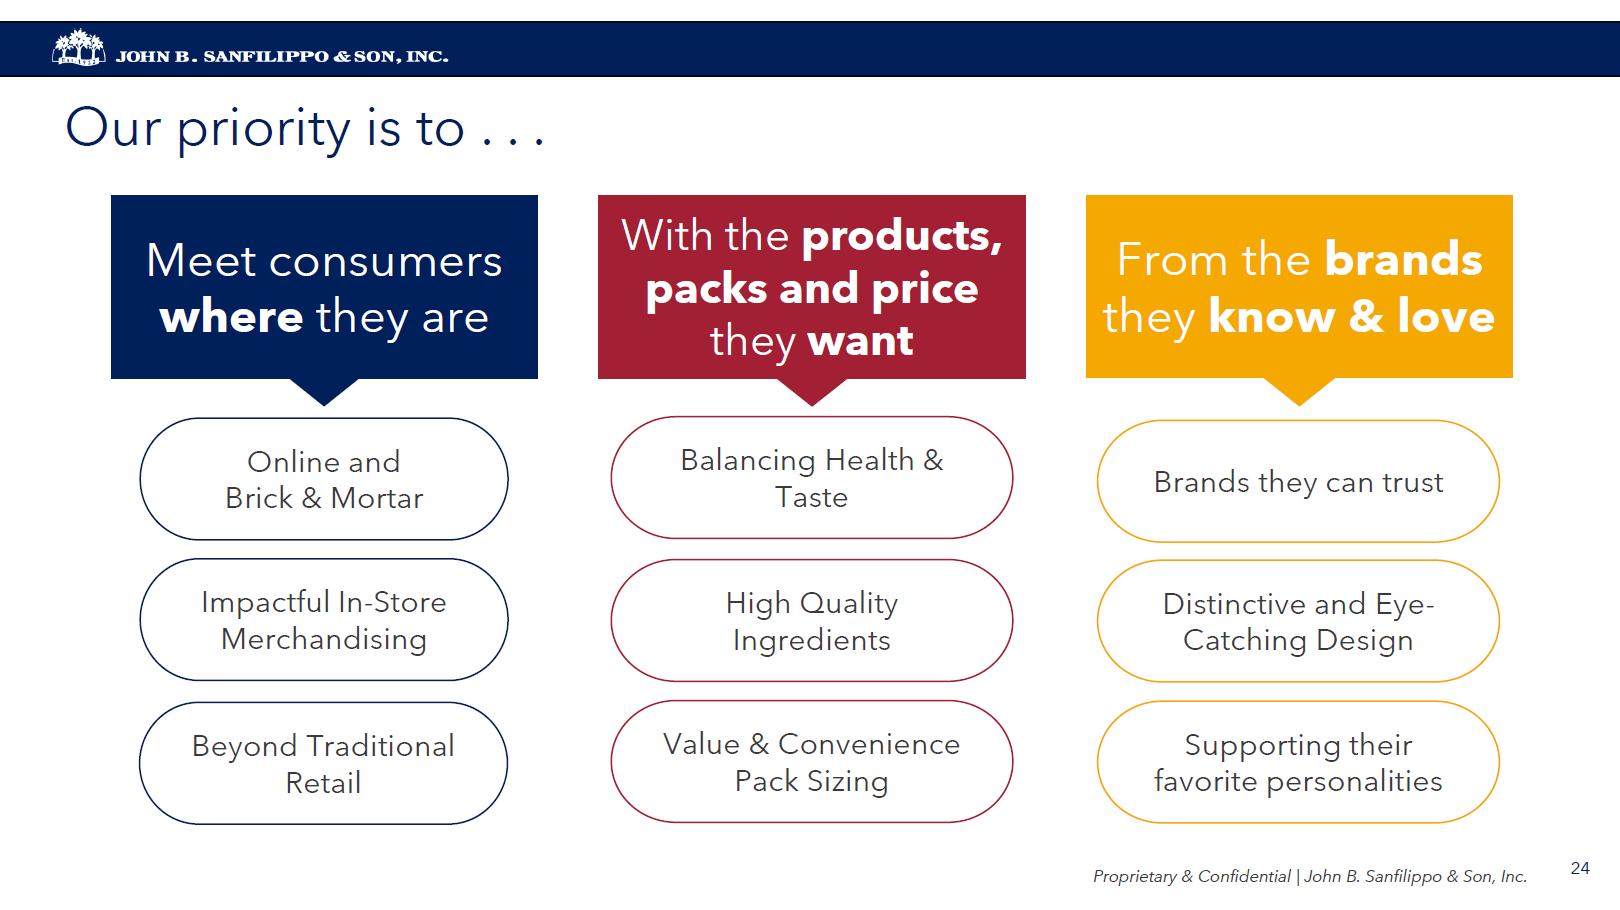
John B. Sanfilippo & son, inc. Our priority is to Meet consumers where they are With the products, packs and price they want From the brands they know & love Online and Brick & Mortar Balancing Health & Taste Brands they can trust Impactful In-Store Merchandising High Quality Ingredients Distinctive and Eye- Catching Design Beyond Traditional Retail Value & Convenience Pack Sizing Supporting their favorite personalities proprietary & confidential john B. Sanfilippo & Son, Inc. 24
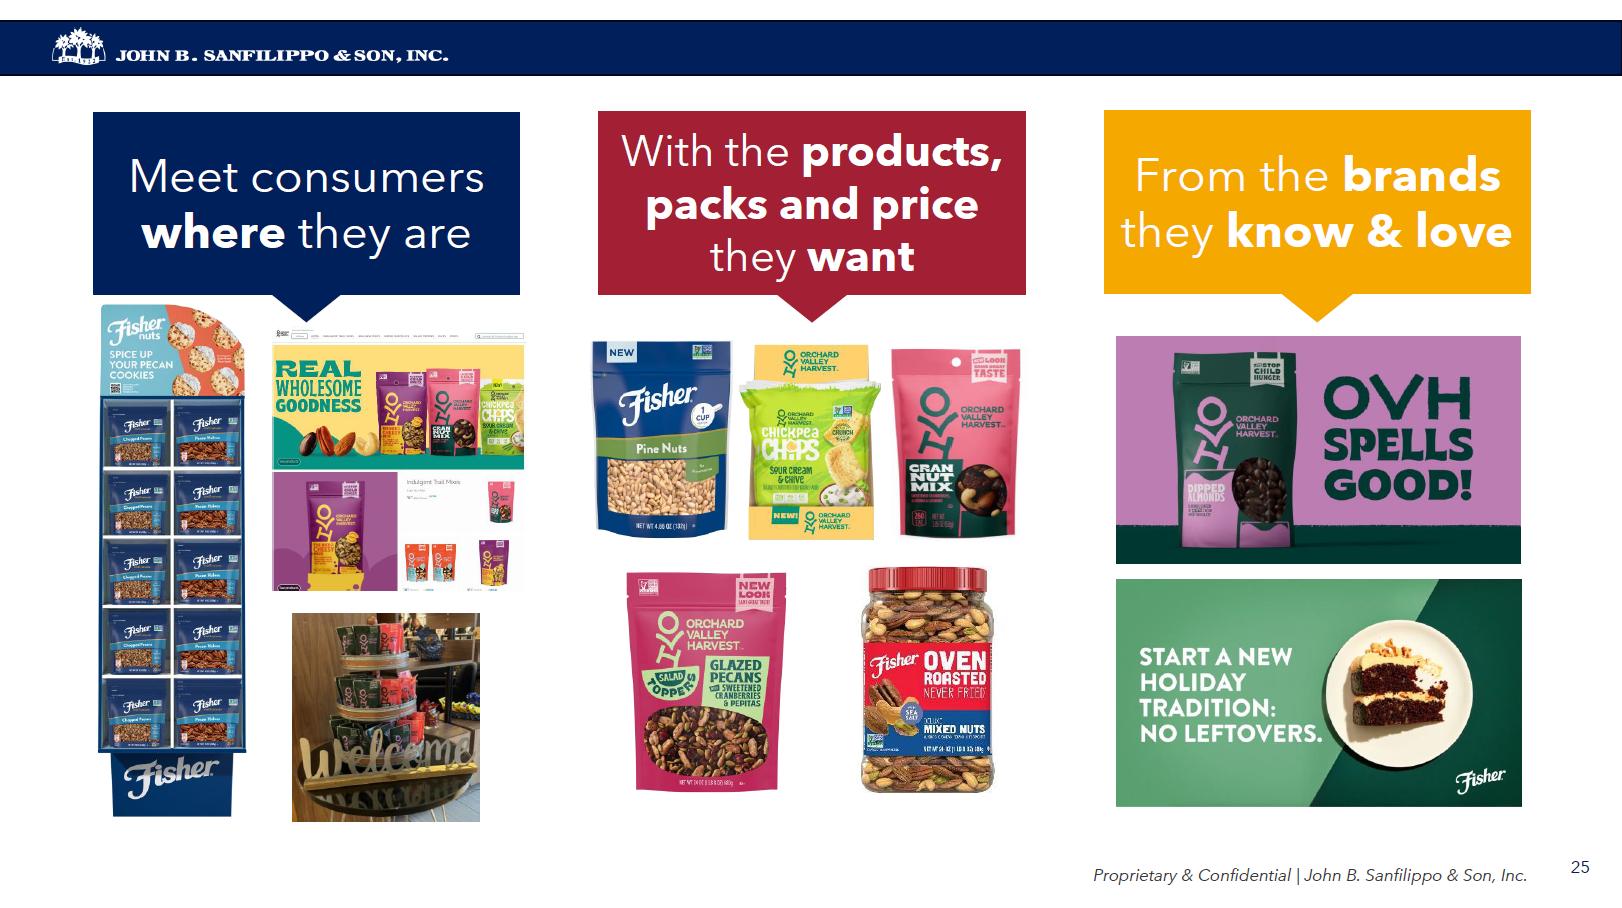
John B. Sanfilippo & son, inc. Meet consumers where they are With the products, packs and price they want From the brands they know & love OVH spells Good! Start a new holiday tradition: no leftovers. proprietary & confidential| john B. Sanfilippo & Son, Inc. 25
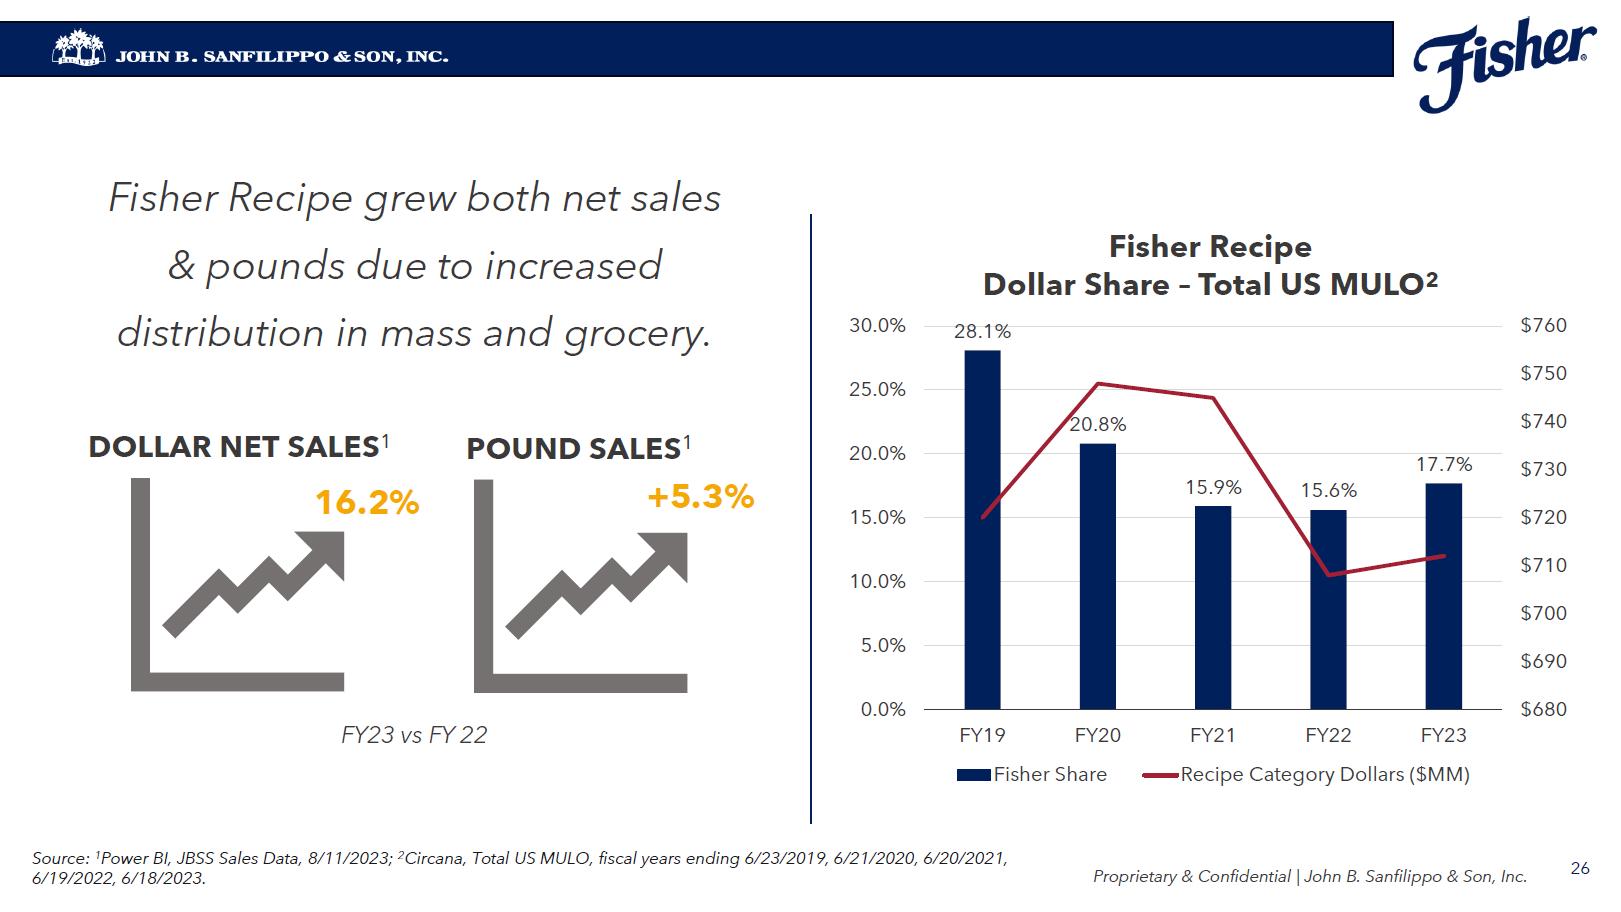
John B. Sanfilippo & son, inc. Fisher Recipe grew both net sales & pounds due to increased distribution in mass and grocery. DOLLAR NET SALES1 POUND SALES1 16.2% +5.3% FY23 vs FY 22 Source: 1Power BI, JBSS Sales Data, 8/11/2023; 2Circana, Total US MULO, fiscal years ending 6/23/2019, 6/21/2020, 6/20/2021, 6/19/2022, 6/18/2023. Fisher Recipe Dollar Share – Total US MULO2 30.0% 25.2% 20.0% 15.0% 10.0% 5.0% 0.0% 28.1% 20.8% 20.8% 15.9% 15.6% 17.7% FY19 FY20 FY21 FY22 FY23 $760 $750 $740 $730 $720 $710 $700 $670 $680 Source: 1Power BI, JBSS Sales Data, 8/11/2023; 2Circana, Total US MULO, fiscal years ending 6/23/2019, 6/21/2020, 6/20/2021, 6/19/2022, 6/18/2023. proprietary & confidential| john B. Sanfilippo & Son, Inc. 26
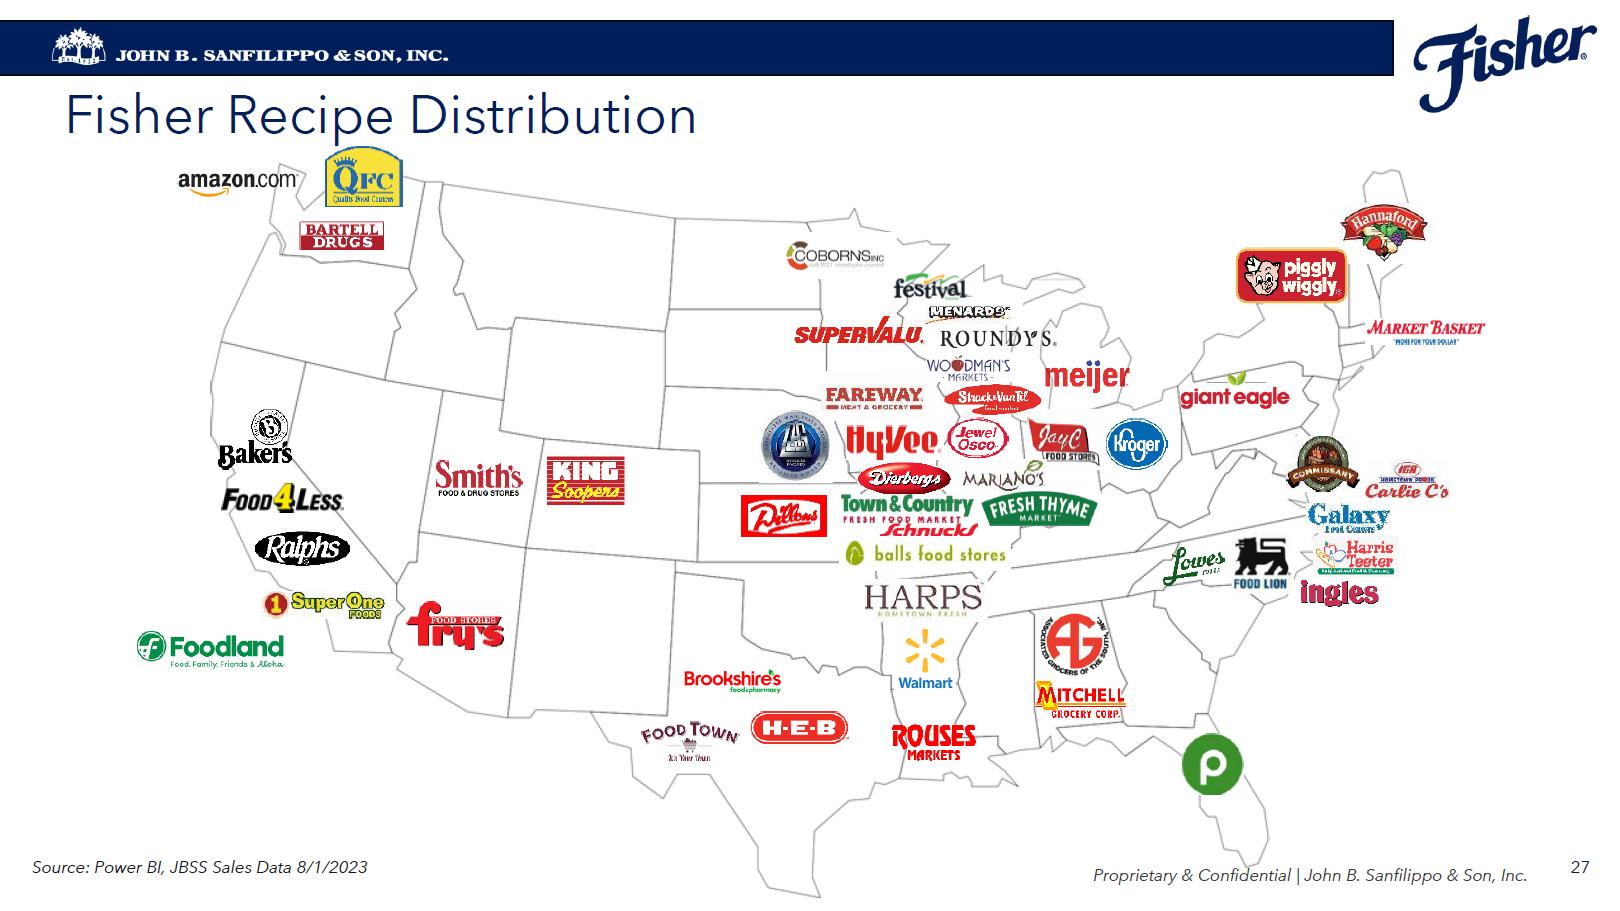
John B. Sanfilippo & son, inc. Fisher Recipe Distribution Amazon.com Source: Power BI, JBSS Sales Data 8/1/2023 proprietary & confidential| john B. Sanfilippo & Son, Inc. 27
Fisher Recipe Distribution JOHN B. SANFILIPPO & SON, INC. Source: Power BI, JBSS Sales Data 8/1/2023 Proprietary & Confidential | John B. Sanfilippo & Son, Inc. fisher graphic 28
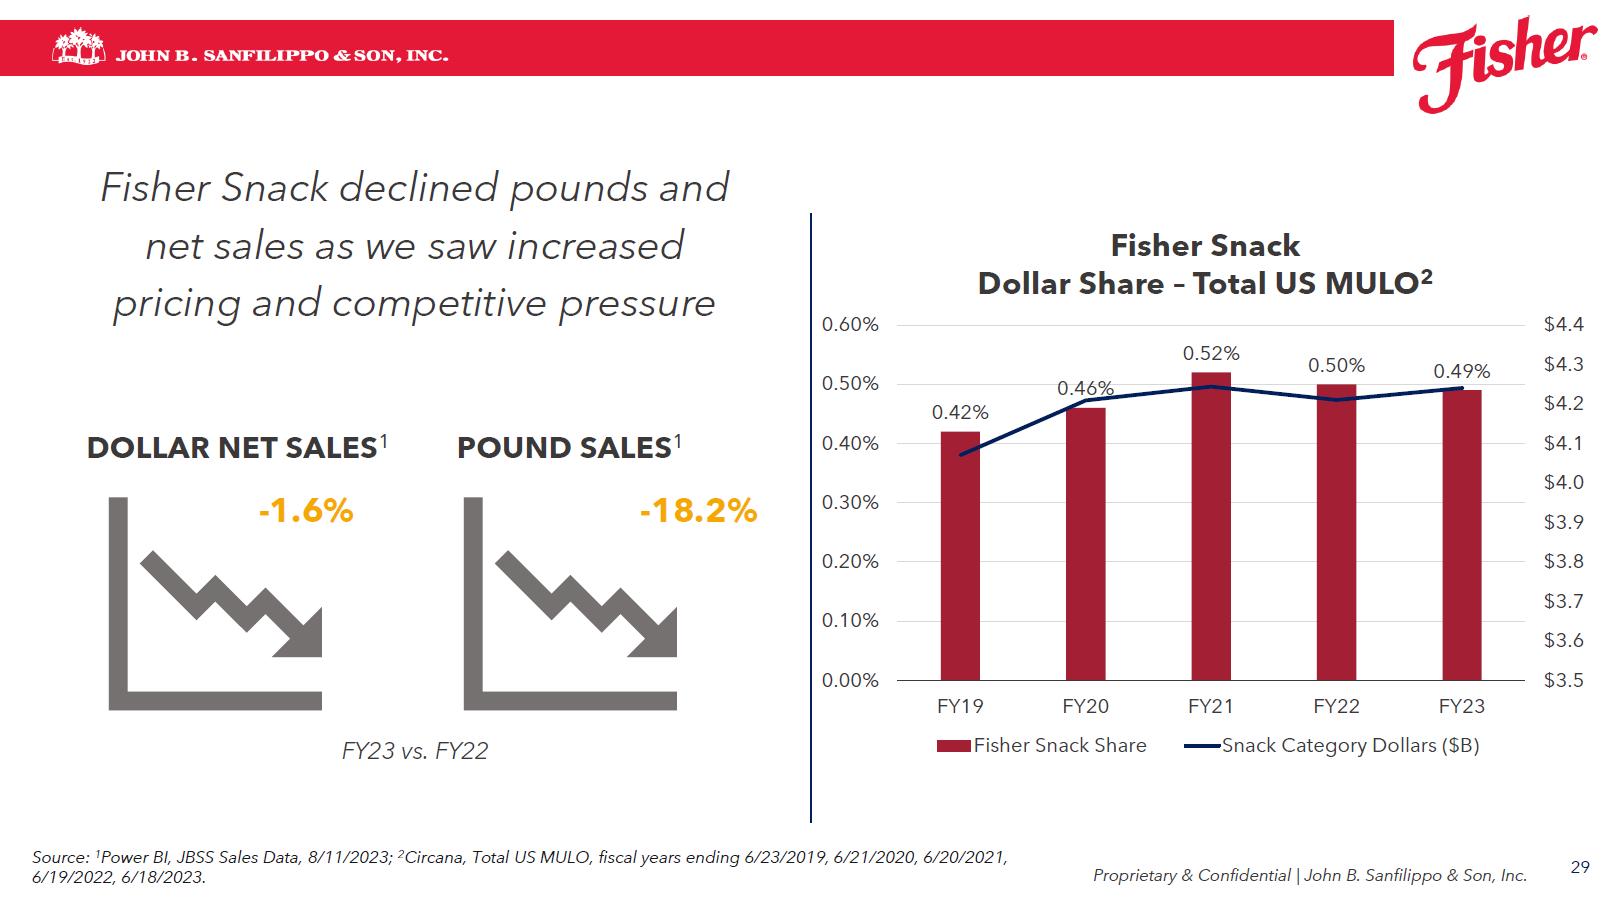
JOHN B. SANFILIPPO & SON, INC. Fisher Snack declined pounds and net sales as we saw increased pricing and competitive pressure DOLLAR NET SALES1 POUND SALES1 -1.6% -18.2% FY23 vs. FY22 Fisher Snack Dollar Share – Total US MULO2 Source: 1Power BI, JBSS Sales Data, 8/11/2023; 2Circana, Total US MULO, fiscal years ending 6/23/2019, 6/21/2020, 6/20/2021, 6/19/2022, 6/18/2023. Proprietary & Confidential John B. Sanfilippo & Son, Inc. Fisher Snack Share Snack Category Dollars ($B) fisher Bar Chart 29
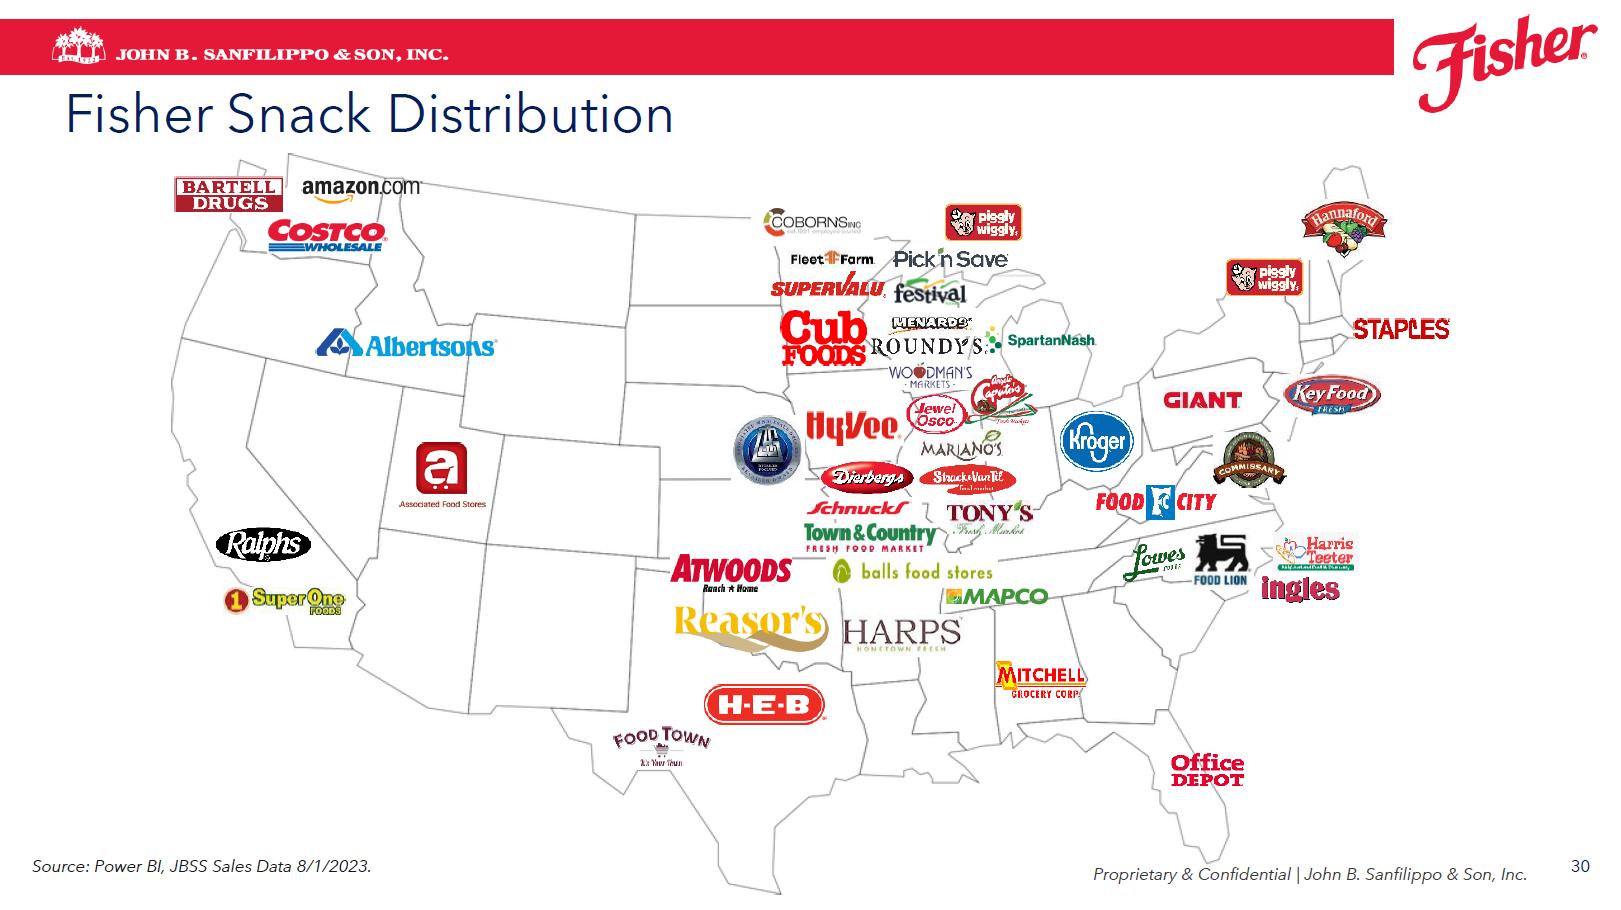
JOHN B. SANFILIPPO & SON, INC. Fisher Snack Distribution Source: Power BI, JBSS Sales Data 8/1/2023. Proprietary & Confidential John B. Sanfilippo & Son, Inc. fisher Graphic logo 30
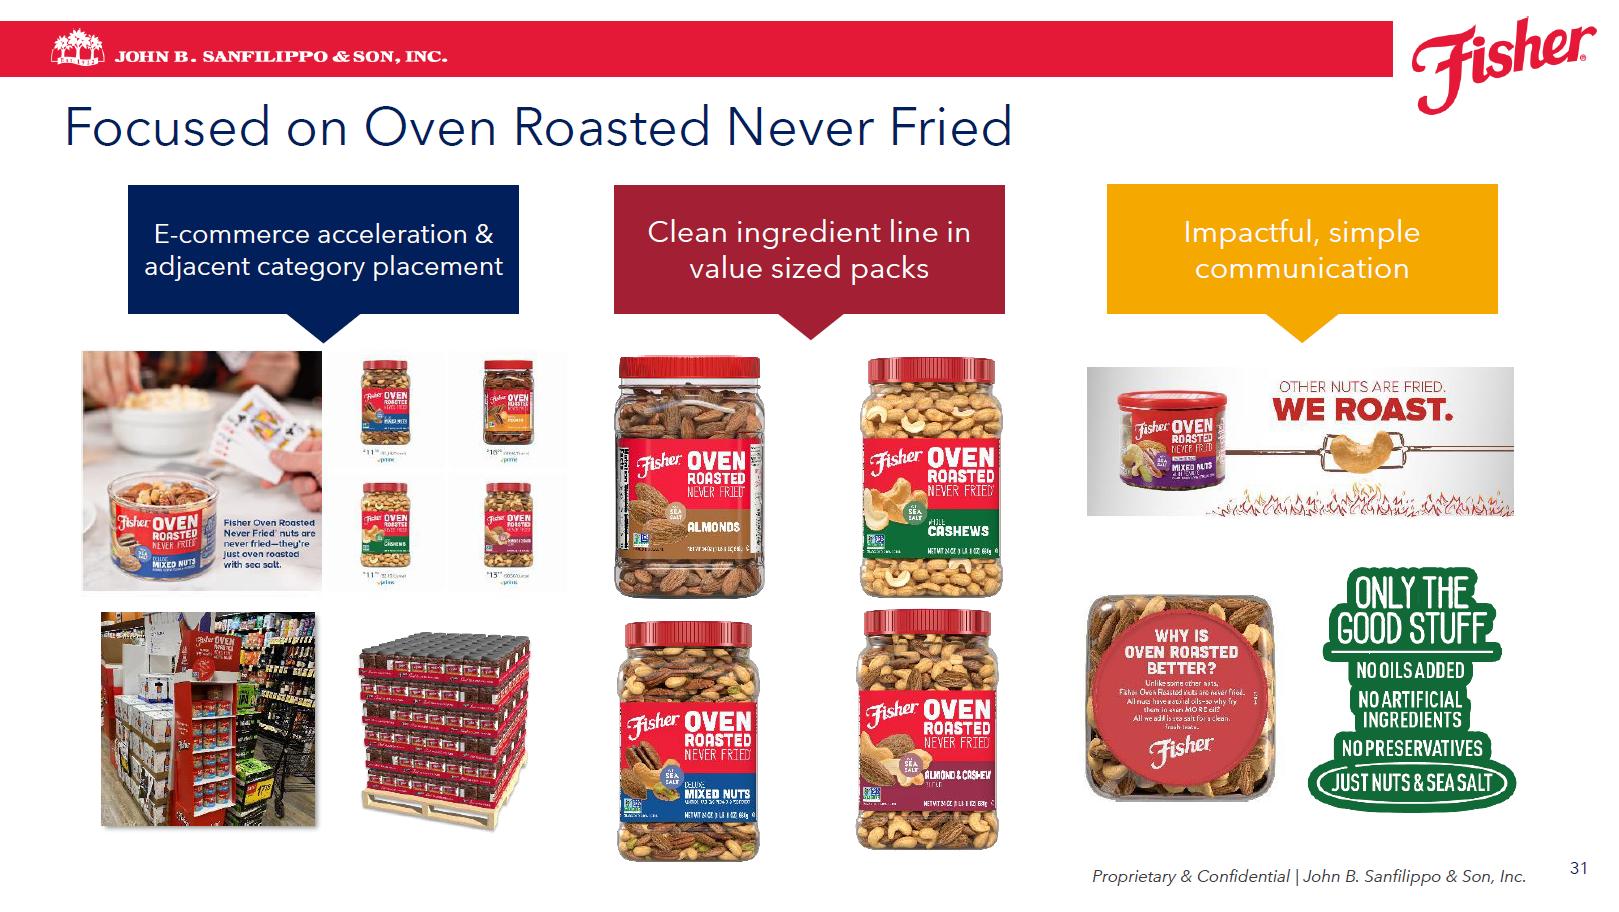
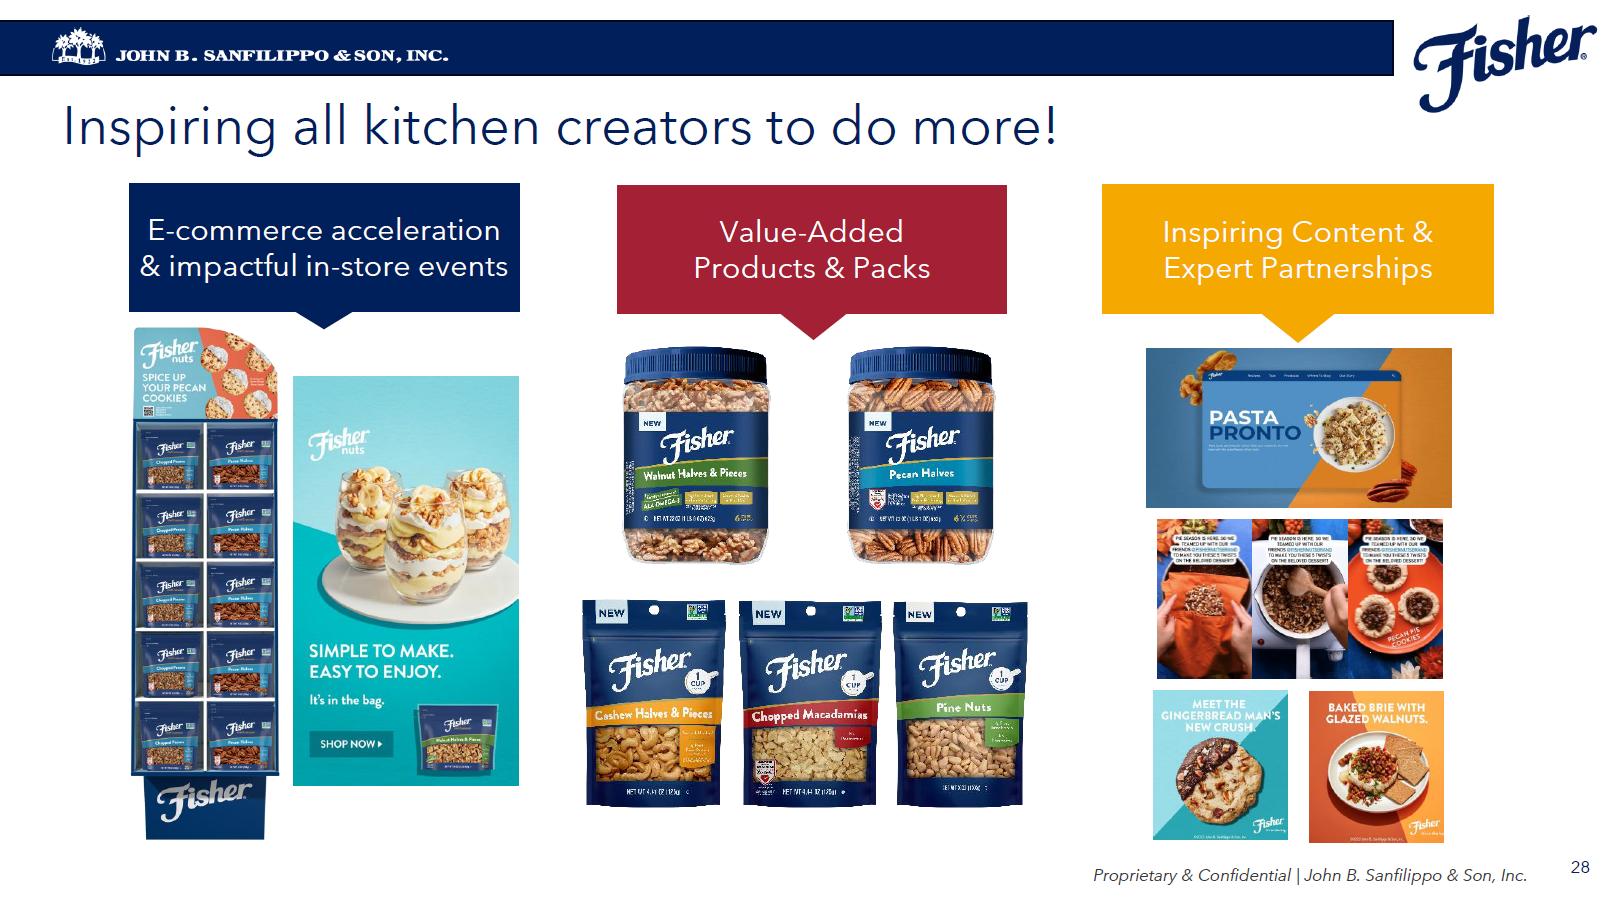
Focused on Oven Roasted Never Fried JOHN B. SANFILIPPO & SON, INC. E-commerce acceleration & adjacent category placement Clean ingredient line in value sized packs Impactful, simple communication Proprietary & Confidential | John B. Sanfilippo & Son, Inc. ONLY THE GOOD STUFF NO OILS ADDED NO ARTIFICIAL INGREDIENTS NO PRESERVATIVES JUST NUTS & SEA SALT fisher graphic 31
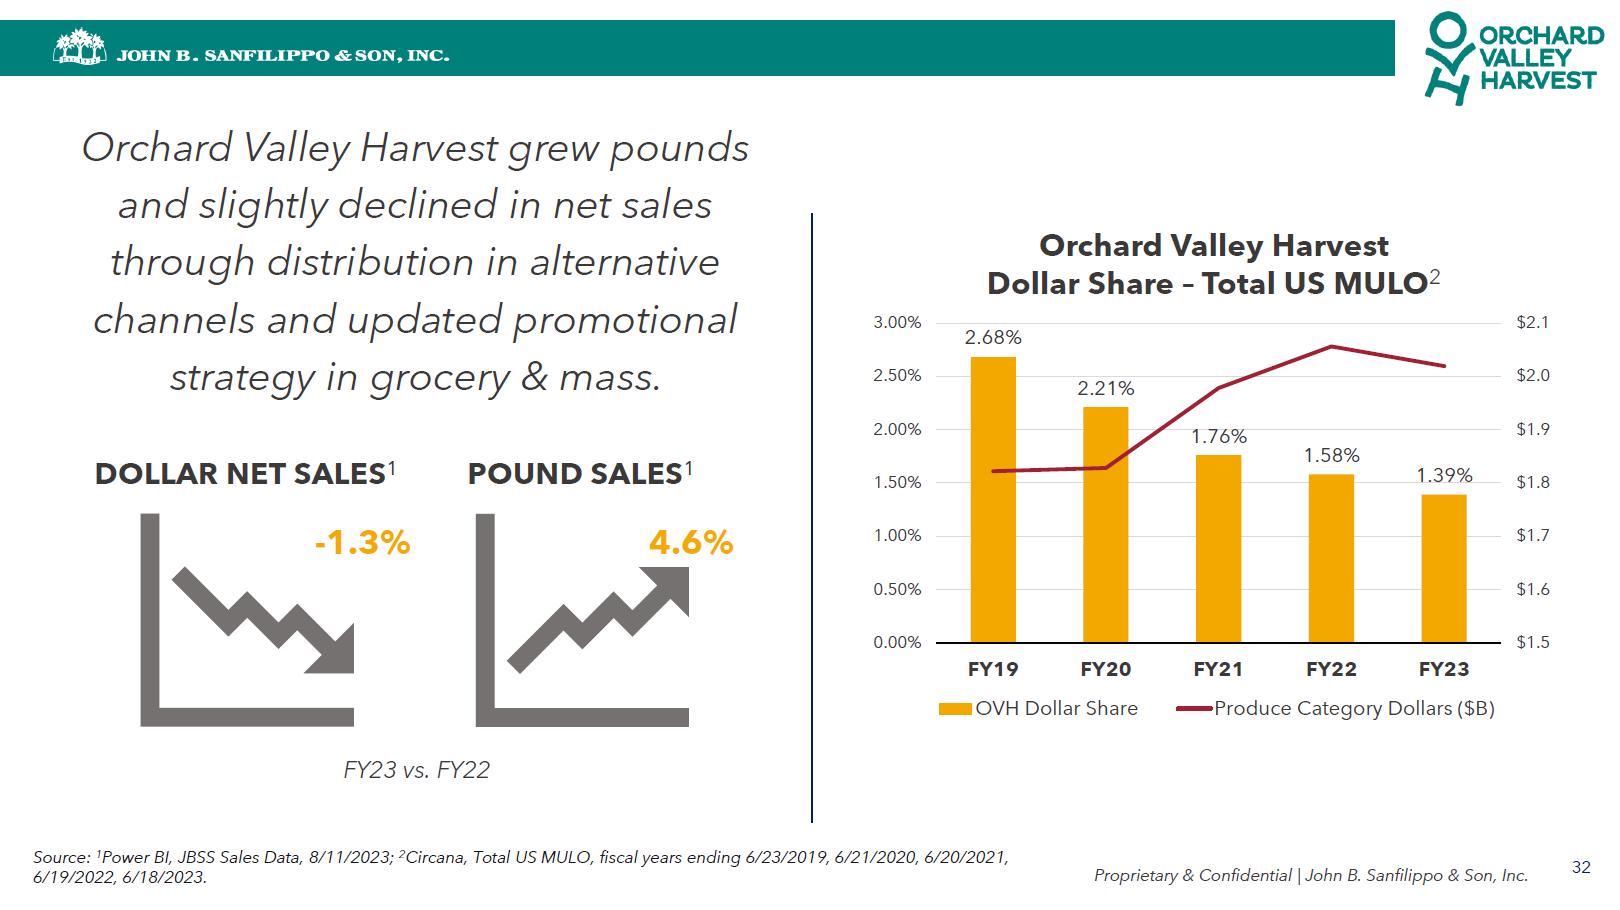
JOHN B. SANFILIPPO & SON, INC. Orchard Valley Harvest grew pounds and slightly declined in net sales through distribution in alternative channels and updated promotional strategy in grocery & mass. DOLLAR NET SALES1 DOLLAR NET SALES1 -1.3% 4.6% FY23 vs. FY22 Source: 1Power BI, JBSS Sales Data, 8/11/2023; 2Circana, Total US MULO, fiscal years ending 6/23/2019, 6/21/2020, 6/20/2021, 6/19/2022, 6/18/2023. Orchard Valley Harvest Dollar Share – Total US MULO2 Proprietary & Confidential | John B. Sanfilippo & Son, Inc. orchard valley harvest ovh dollar share produce category dollars ($B) Bar Chart 32
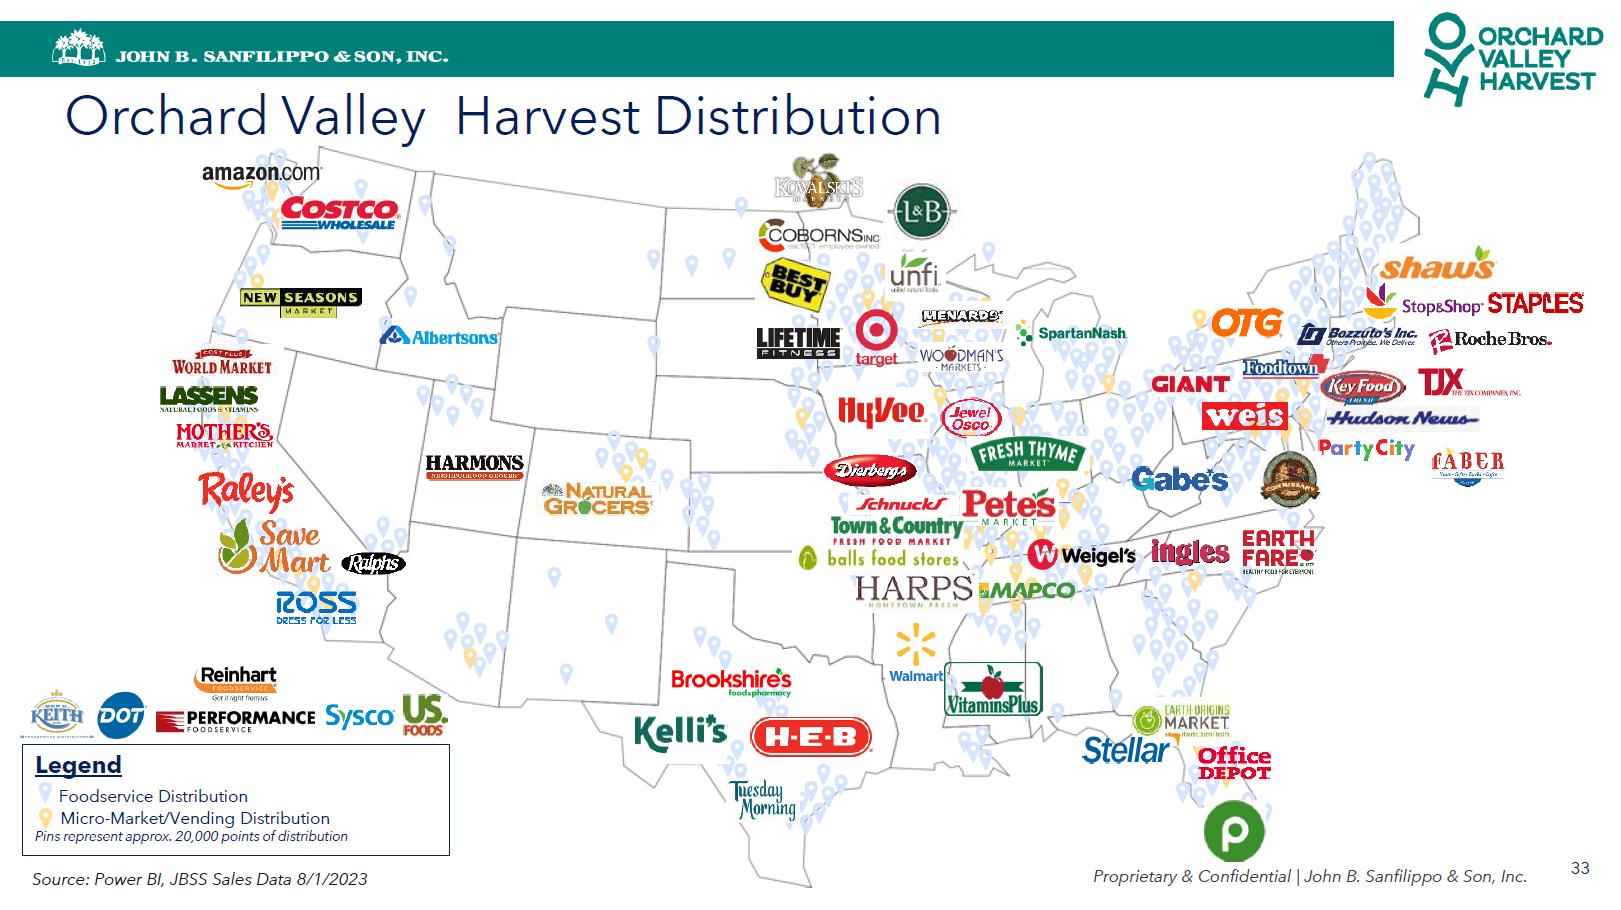
JOHN B. SANFILIPPO & SON, INC. Orchard Valley Harvest Distribution orchard valley harvest Legend Foodservice Distribution Micro-Market/Vending Distribution Pins represent approx. 20,000 points of distribution Source: Power BI, JBSS Sales Data 8/1/2023 Proprietary & Confidential | John B. Sanfilippo & Son, Inc.logo 33
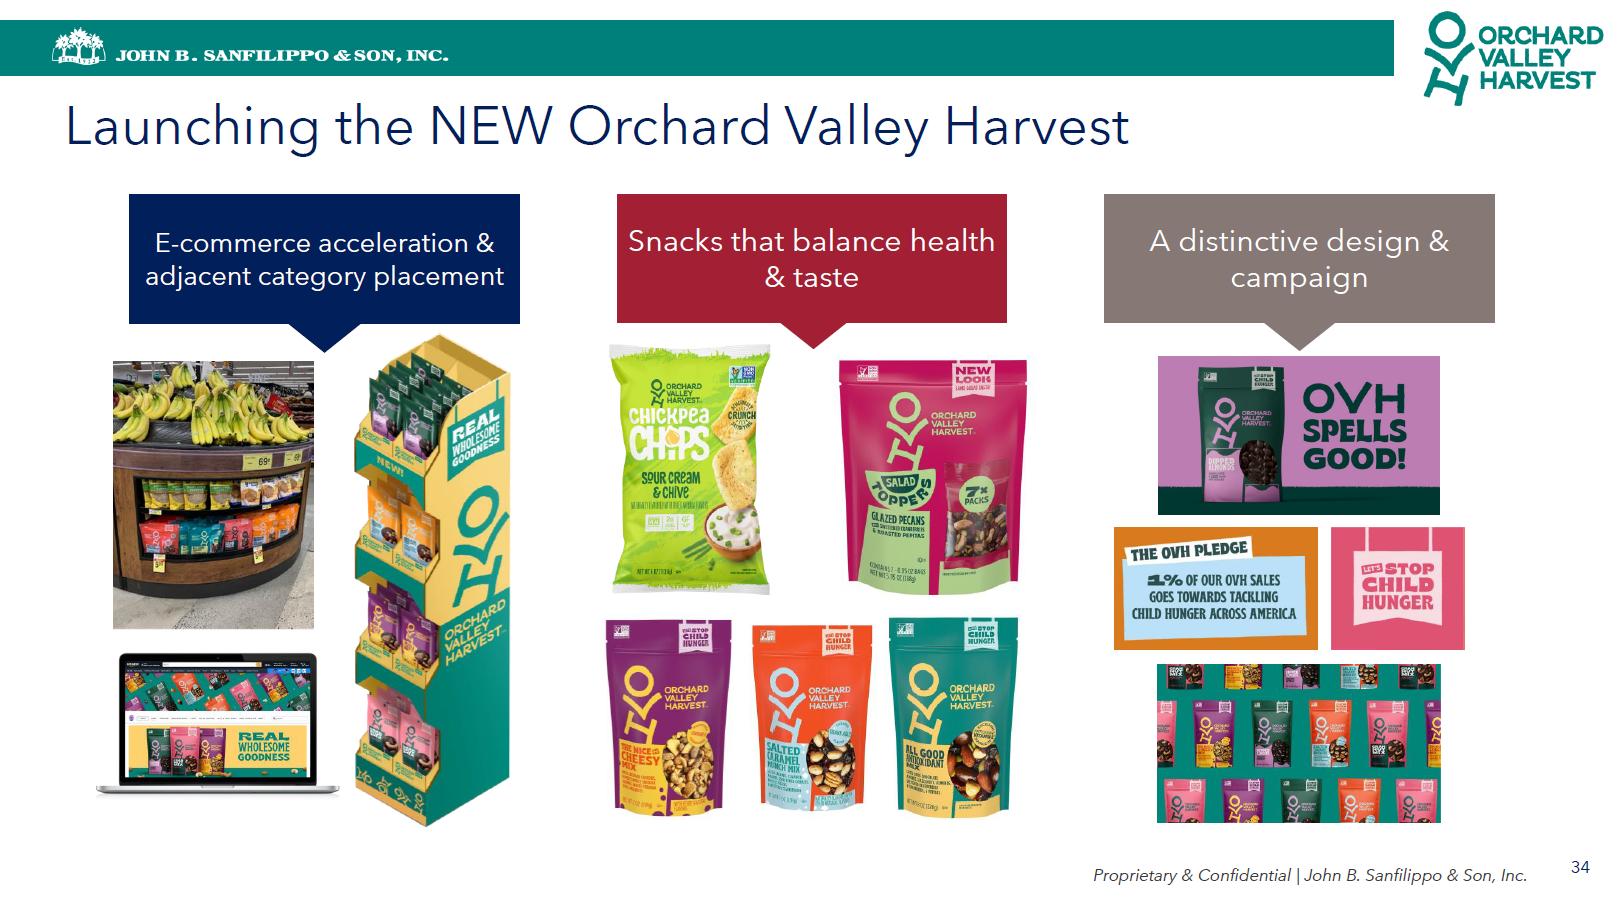
JOHN B. SANFILIPPO & SON, INC. Orchard Valley Harvest Launching the NEW Orchard Valley Harvest E-commerce acceleration & adjacent category placement Snacks that balance health & taste A distinctive design & campaign Proprietary & Confidential | John B. Sanfilippo & Son, Inc.graphic 34
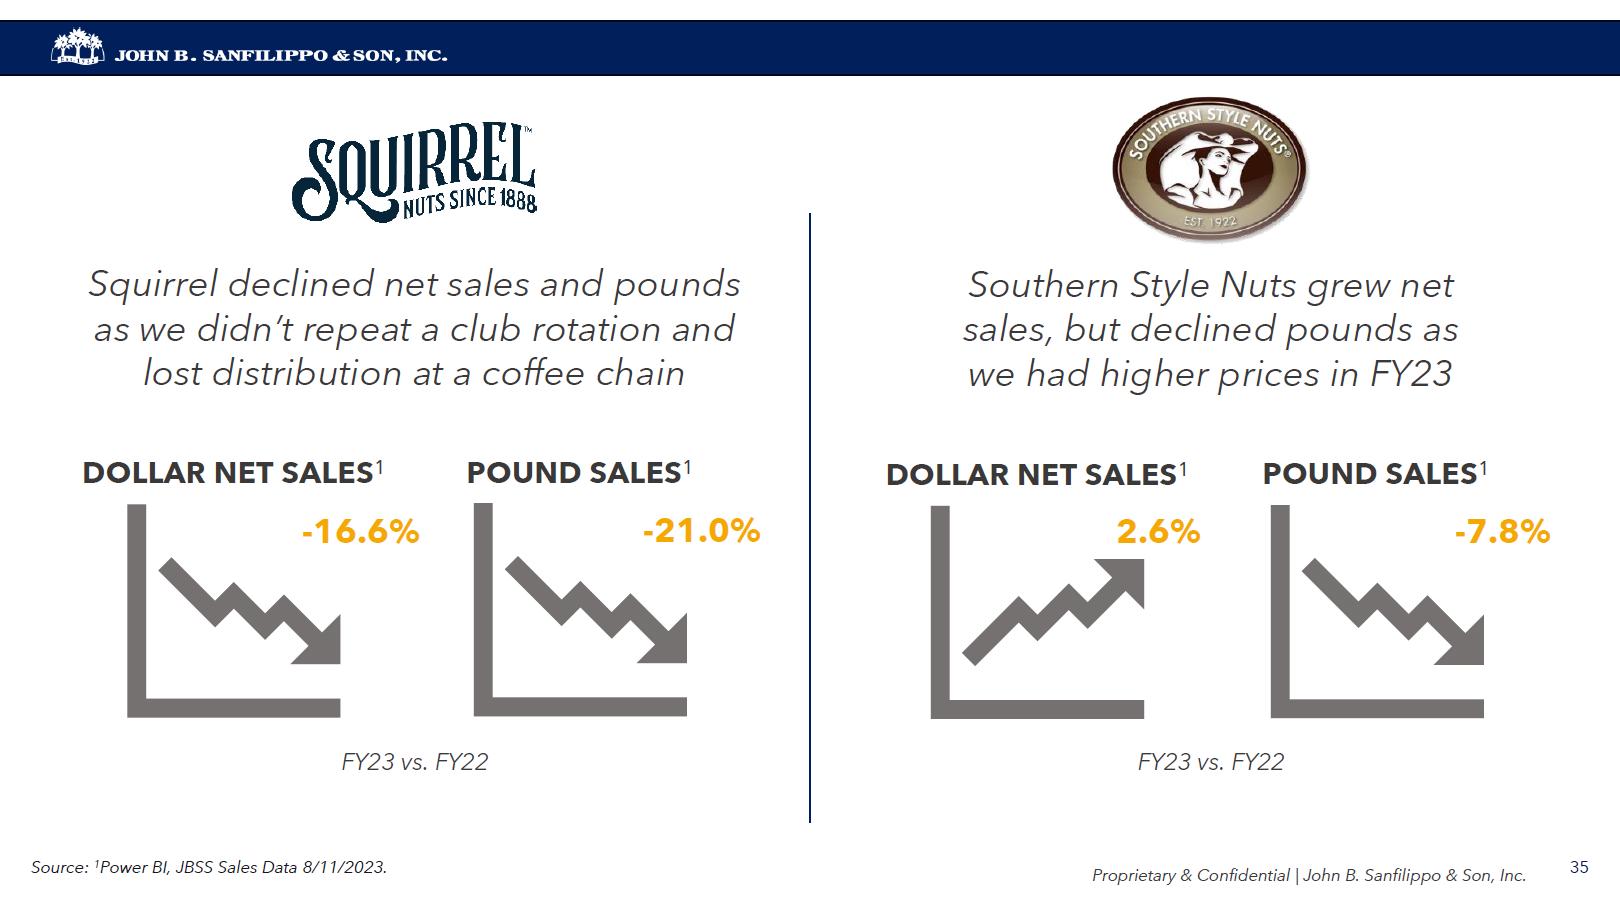
JOHN B. SANFILIPPO & SON, INC. Squirrel declined net sales and pounds as we didn’t repeat a club rotation and lost distribution at a coffee chain DOLLAR NET SALES1 POUND SALES1 -16.6% -21.0% FY23 vs. FY22 Southern Style Nuts grew net sales, but declined pounds as we had higher prices in FY23 DOLLAR NET SALES1 POUND SALES1 2.6% 7.8% FY23 vs. FY22 Source: 1Power BI, JBSS Sales Data 8/11/2023. Proprietary & Confidential | John B. Sanfilippo & Son, Inc.line graph 35
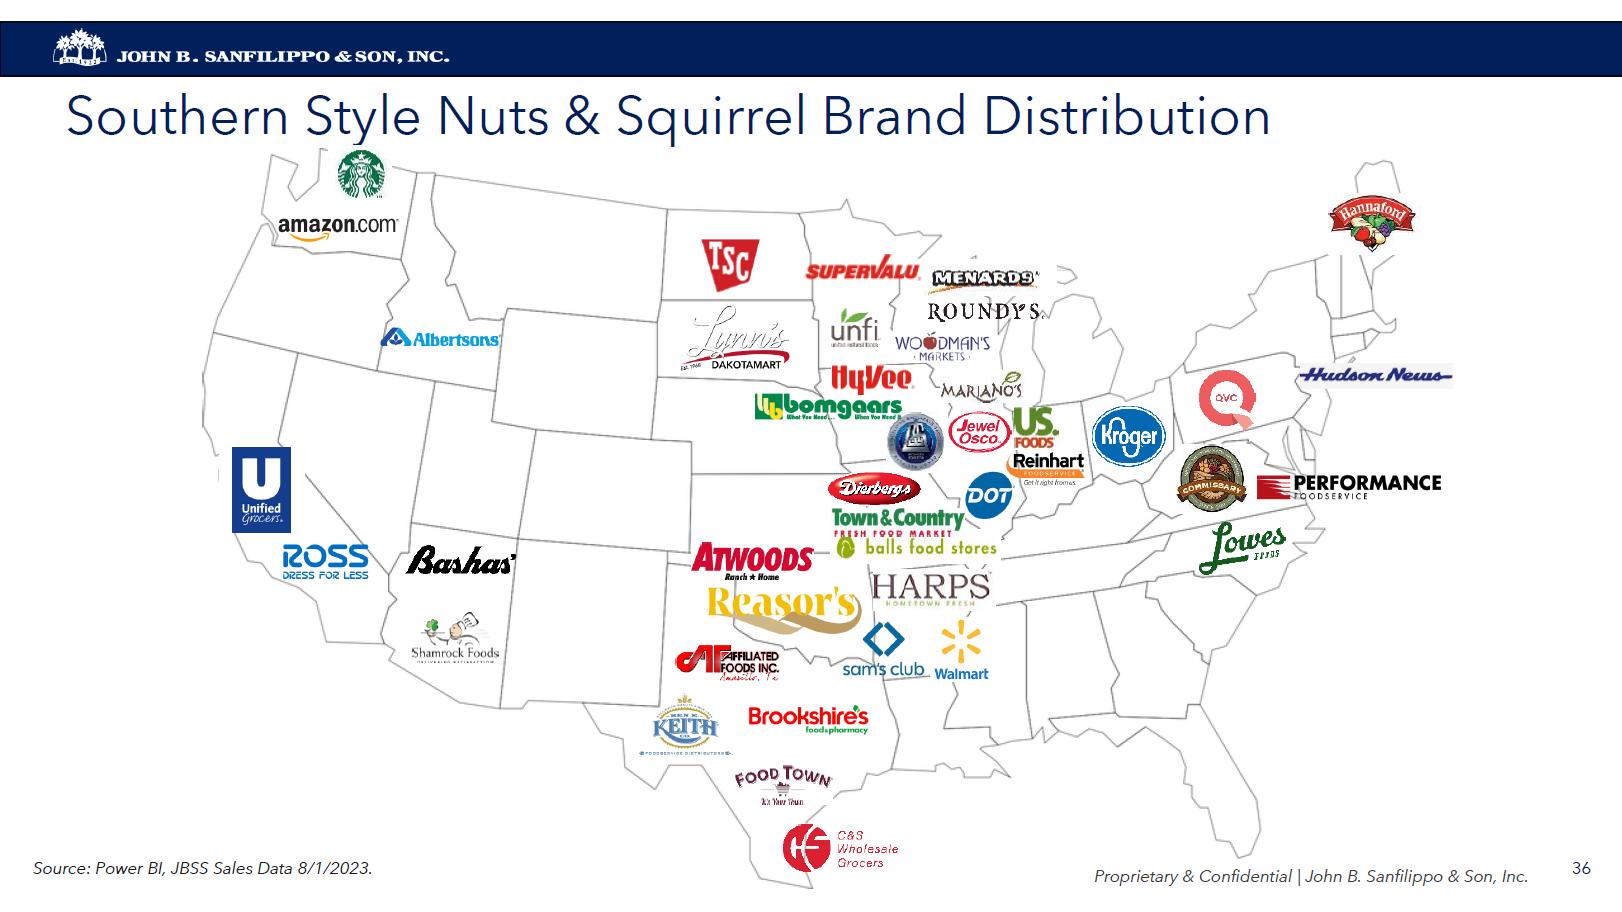
JOHN B. SANFILIPPO & SON, INC. Southern Style Nuts & Squirrel Brand Distribution Source: Power BI, JBSS Sales Data 8/1/2023. Proprietary & Confidential | John B. Sanfilippo & Son, Inc.logo 36
Long-Term Strategy Property & confidential John B. Sanfilippo & Son, Inc 37
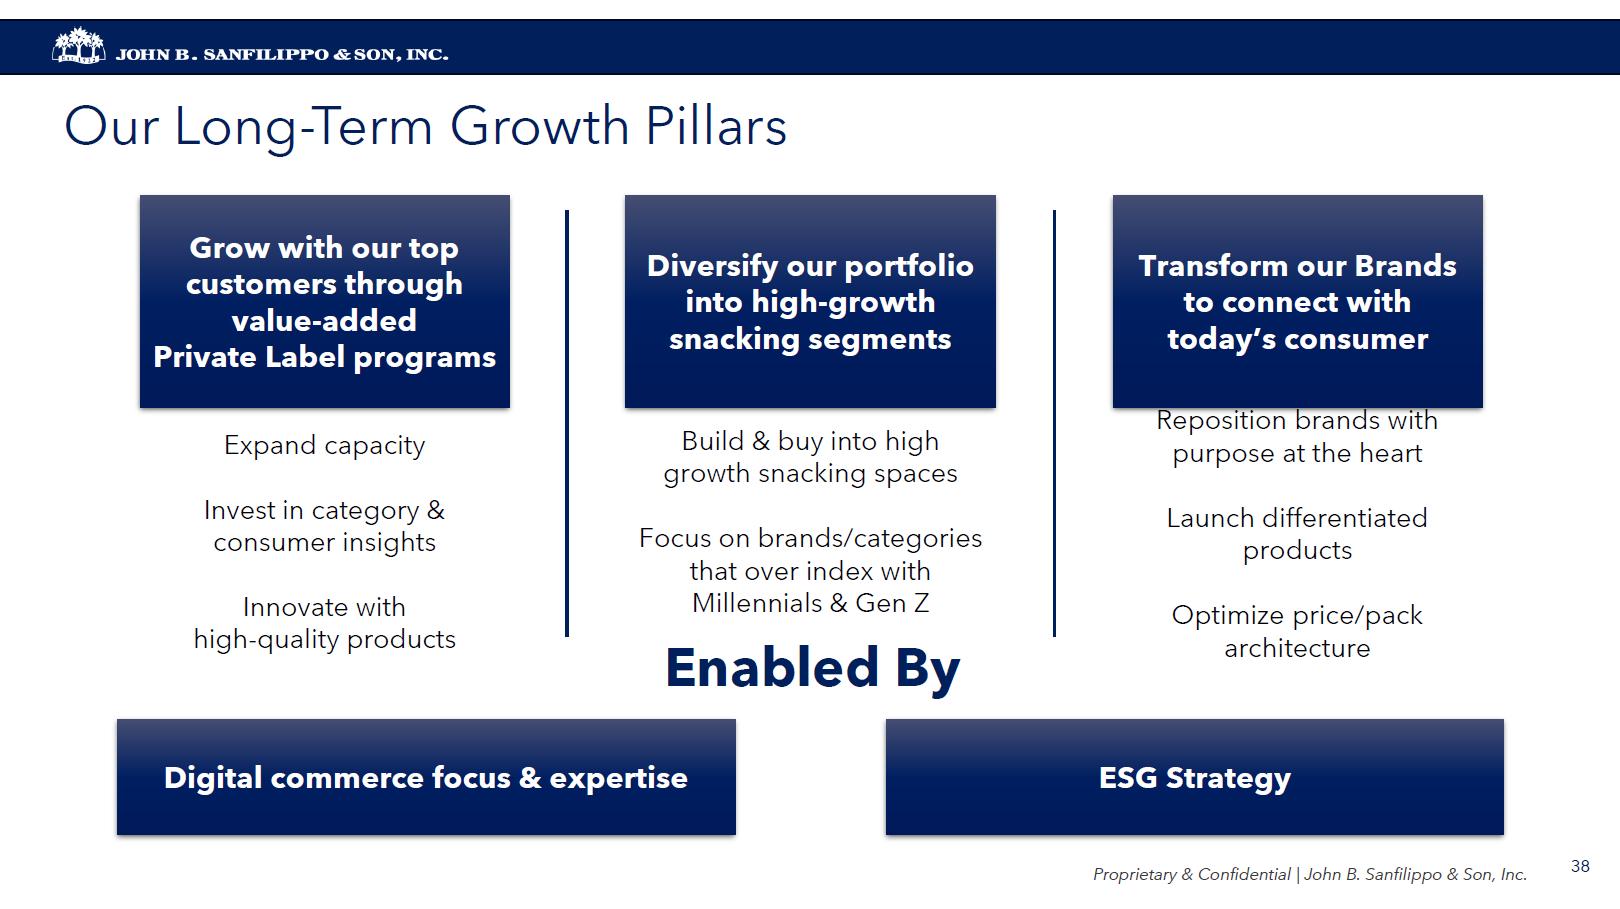
Our Long-Term Growth Pillars Grow with our top customers through value-added Private Label programs Expand capacity Invest in category & consumer insights Innovate with high-quality products Diversify our portfolio into high-growth snacking segments Build & buy into high growth snacking spaces Focus on brands/categories that over index with Millennials & Gen Z Transform our Brands to connect with today’s consumer Reposition brands with purpose at the heart Launch differentiated products Optimize price/pack architecture Enabled By Digital commerce focus & expertise ESG Strategy Property & confidential John B. Sanfilippo & Son, Inc 38
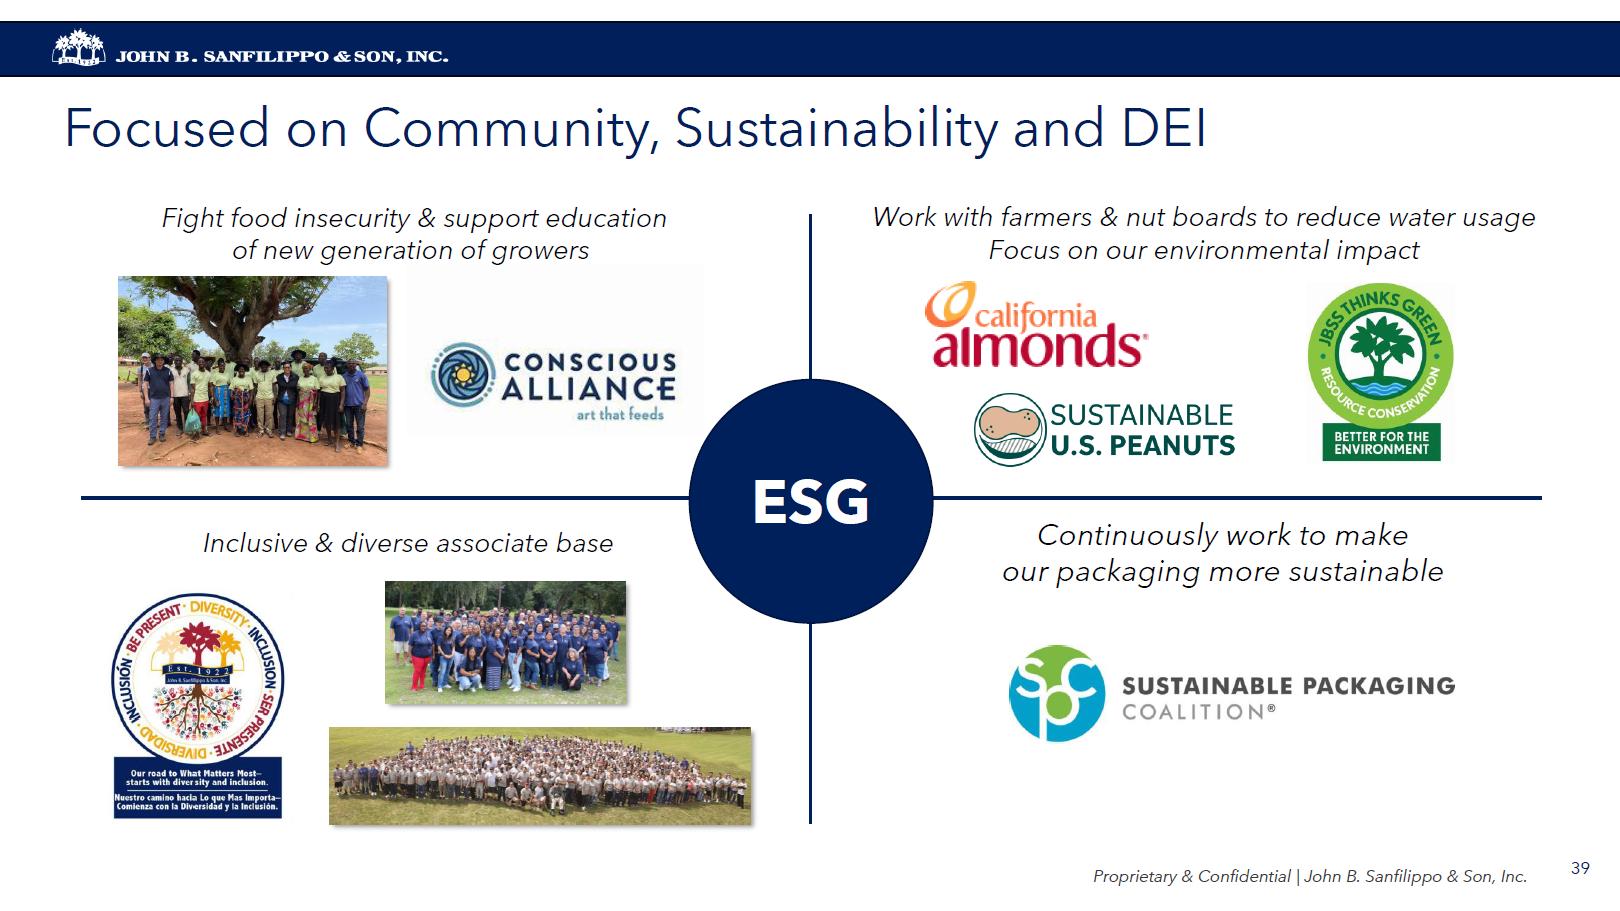
Focused on Community, Sustainability and DEI Fight food insecurity & support education of new generation of growers CONSCIOUS ALLIANCE art that feeds Work with farmers & nut boards to reduce water usage Focus on our environmental impact sustainable U.S. peanuts JBBS Thinks green resource conservations bettre for the environment ESG Inclusive & diverse associate base Continuously work to make our packaging more sustainable Logo. Calfornia almonds Property & confidential John B. Sanfilippo & Son, Inc 39 logo
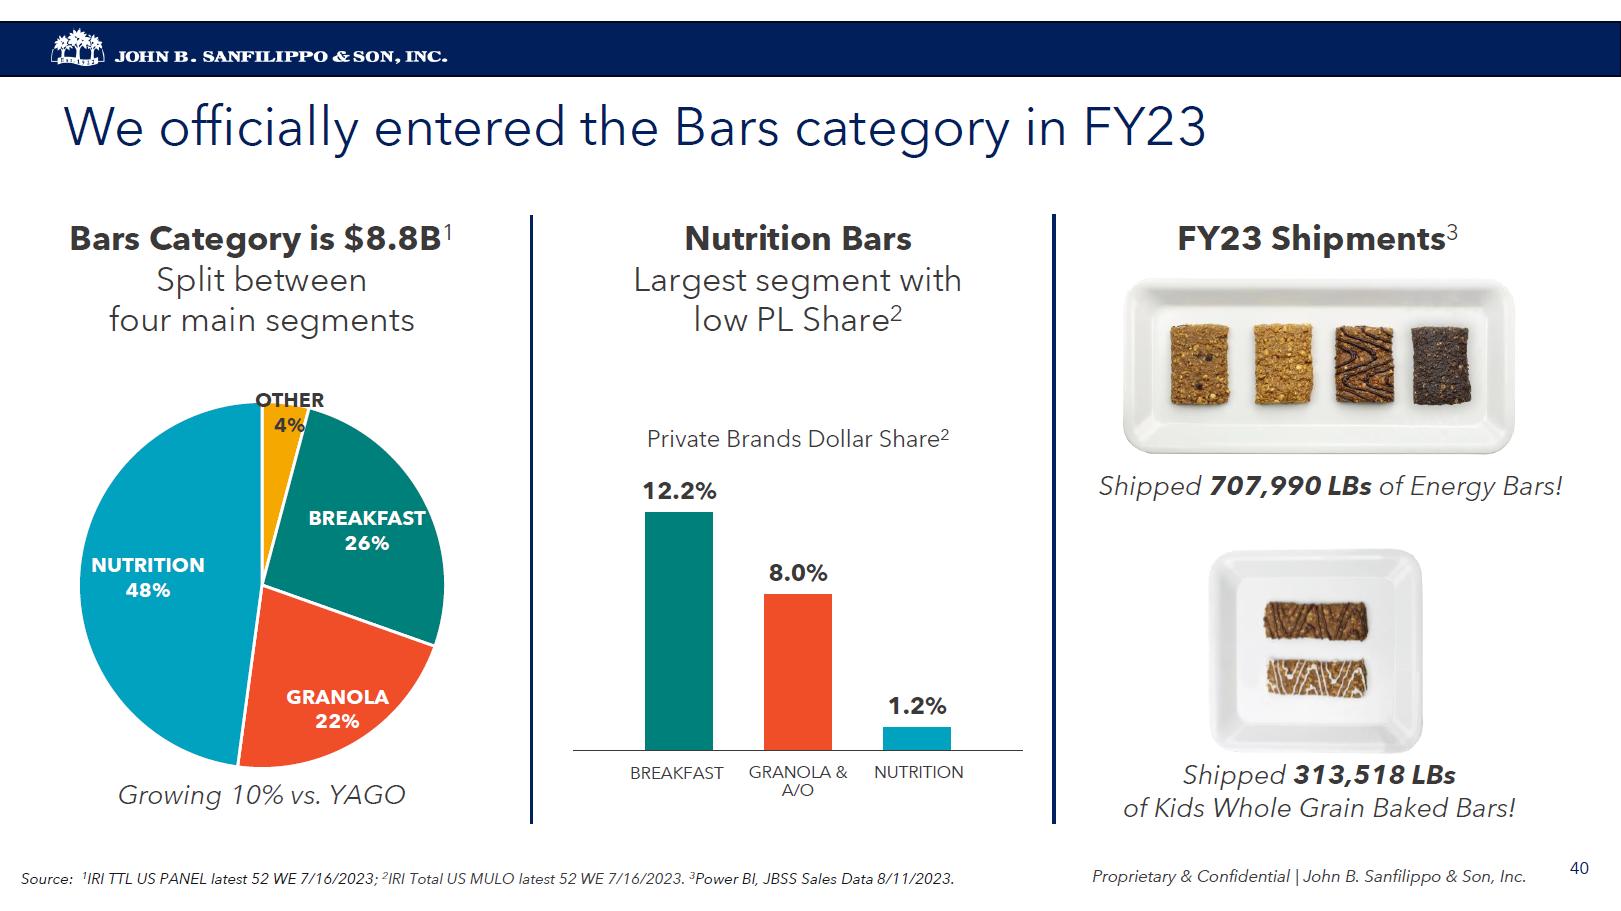
We officially entered the Bars category in FY23 Bars Category is $8.8B1 Split between four main segments NUTRITION 48% OTHER BREAKFAST 26% 4% GRANOLA 22% Growing 10% vs. YAGO Nutrition Bars Largest segment with low PL Share2 Private Brands Dollar Share2 12.2% 8.0% 1.2% BREAKFAST GRANOLA & A/O NUTRITION FY23 Shipments3 Shipped 707,990 LBs of Energy Bars! Shipped 313,518 LBs of Kids Whole Grain Baked Bars! Source: 1IRI TTL US PANEL latest 52 WE 7/16/2023; 2IRI Total US MULO latest 52 WE 7/16/2023. 3Power BI, JBSS Sales Data 8/11/2023. Property & confidential John B. Sanfilippo & Son, Inc 40
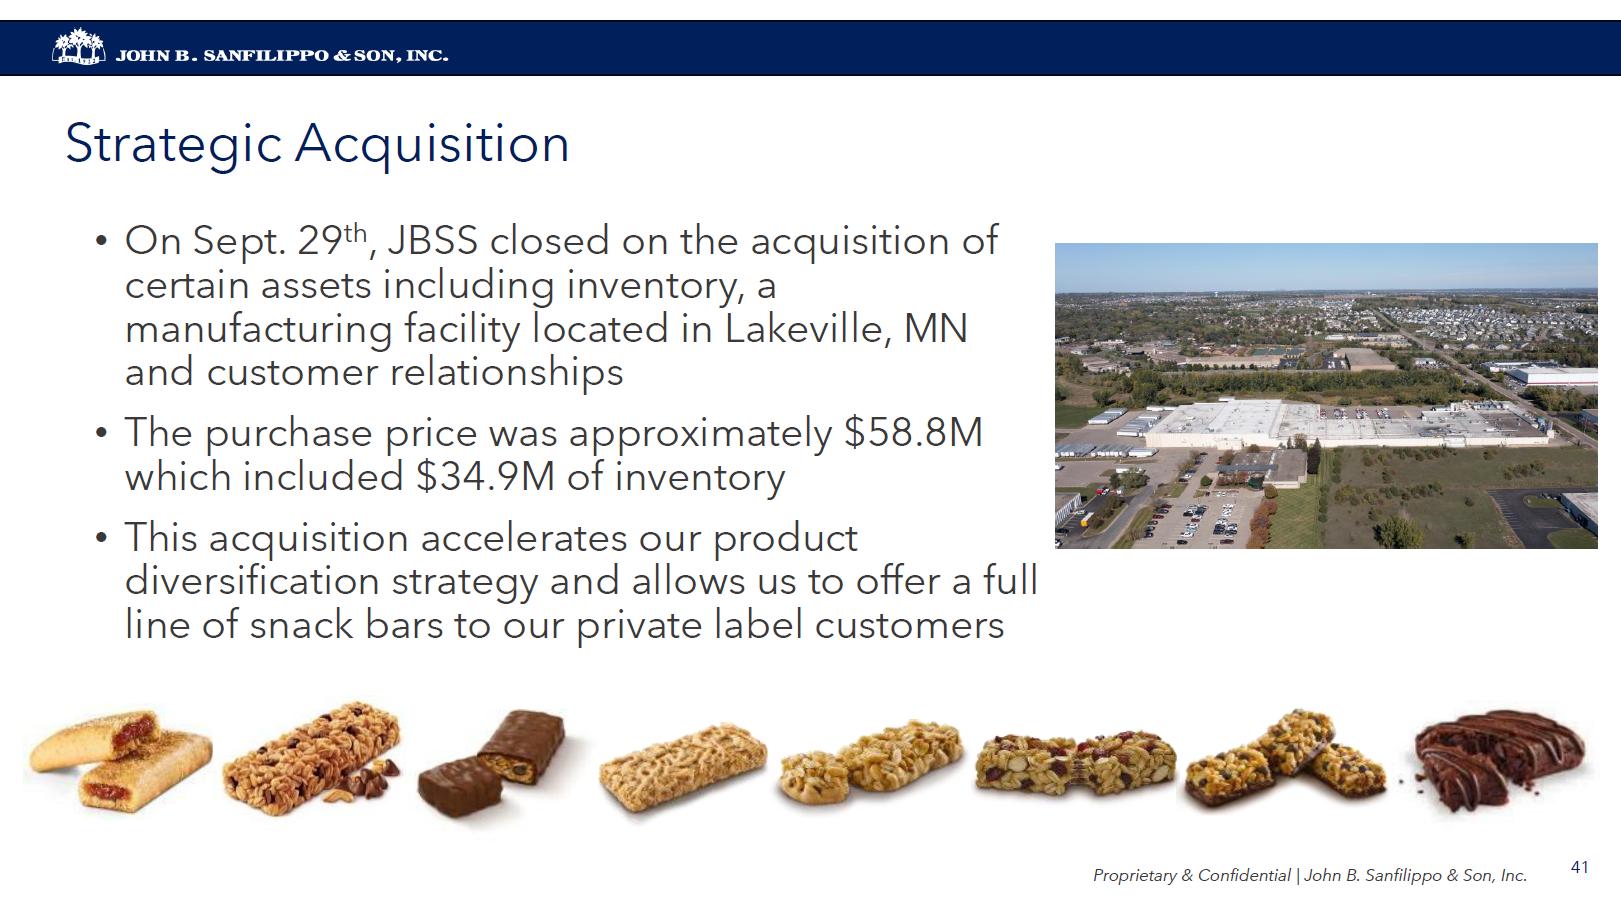
Strategic Acquisition On Sept. 29th, JBSS closed on the acquisition of certain assets including inventory, a manufacturing facility located in Lakeville, MN and customer relationships The purchase price was approximately $58.8M which included $34.9M of inventory This acquisition accelerates our product diversification strategy and allows us to offer a full line of snack bars to our private label customers Property & confidential John B. Sanfilippo & Son, Inc 41
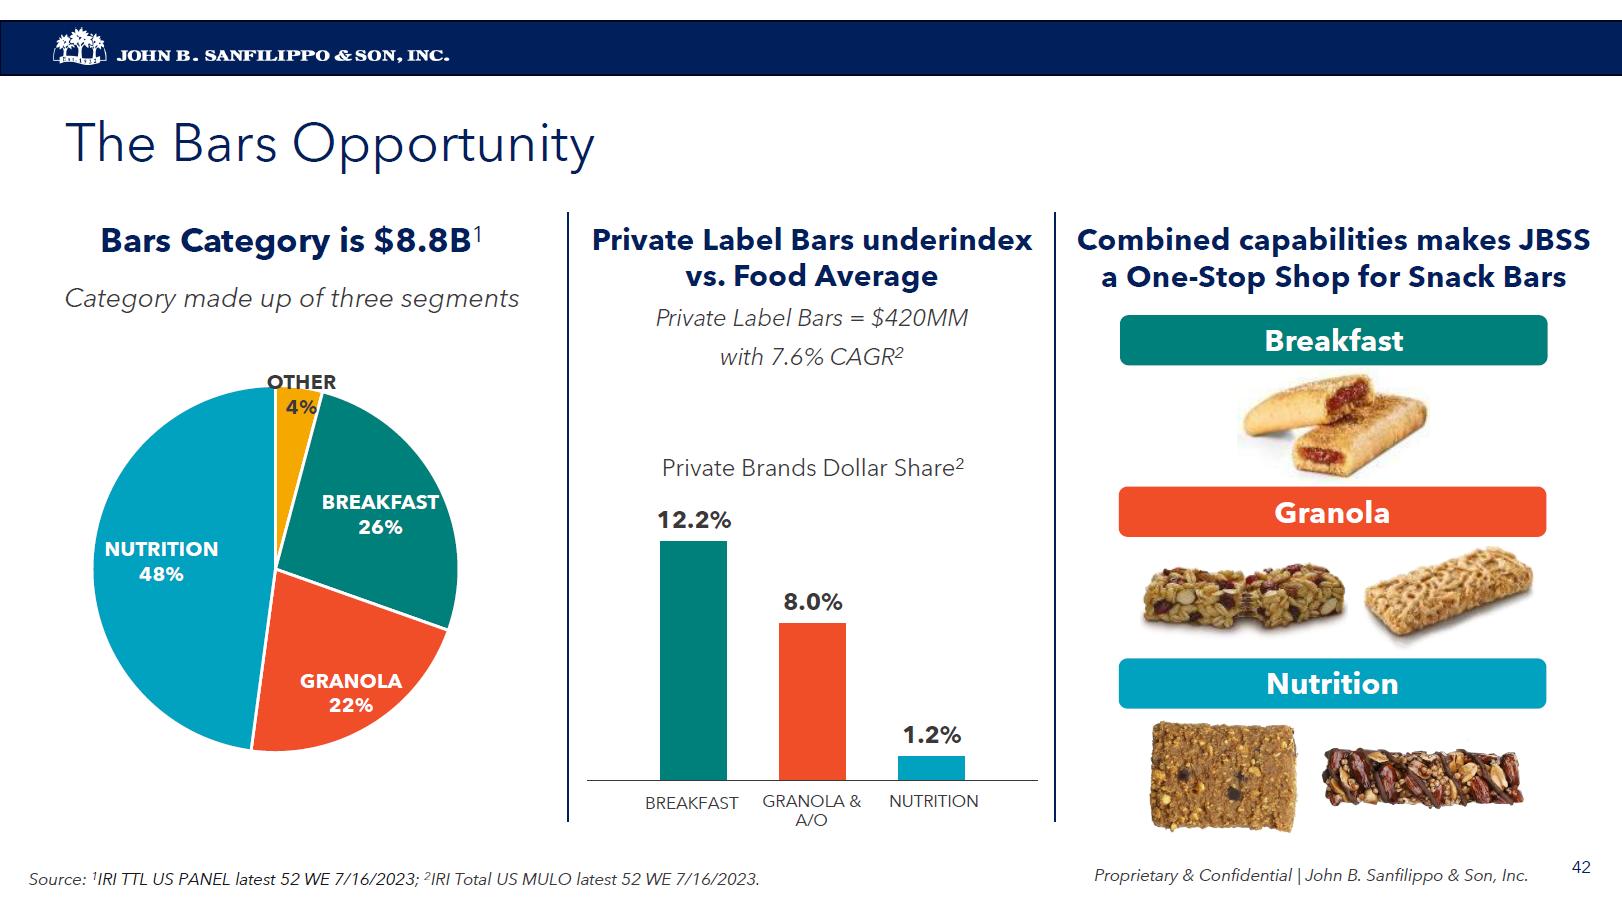
The Bars Opportunity Bars Category is $8.8B1 Category made up of three segments OTHER 4% BREAKFAST 26% NUTRITION 48% GRANOLA 22% Private Label Bars underindex vs. Food Average Private Label Bars = $420MM with 7.6% CAGR2 Private Brands Dollar Share2 12.2% 8.0% 1.2% BREAKFAST GRANOLA & A/O NUTRITION Combined capabilities makes JBSS a One-Stop Shop for Snack Bars Breakfast Granola Nutrition Source: 1IRI TTL US PANEL latest 52 WE 7/16/2023; 2IRI Total US MULO latest 52 WE 7/16/2023. Property & confidential John B. Sanfilippo & Son, Inc 42
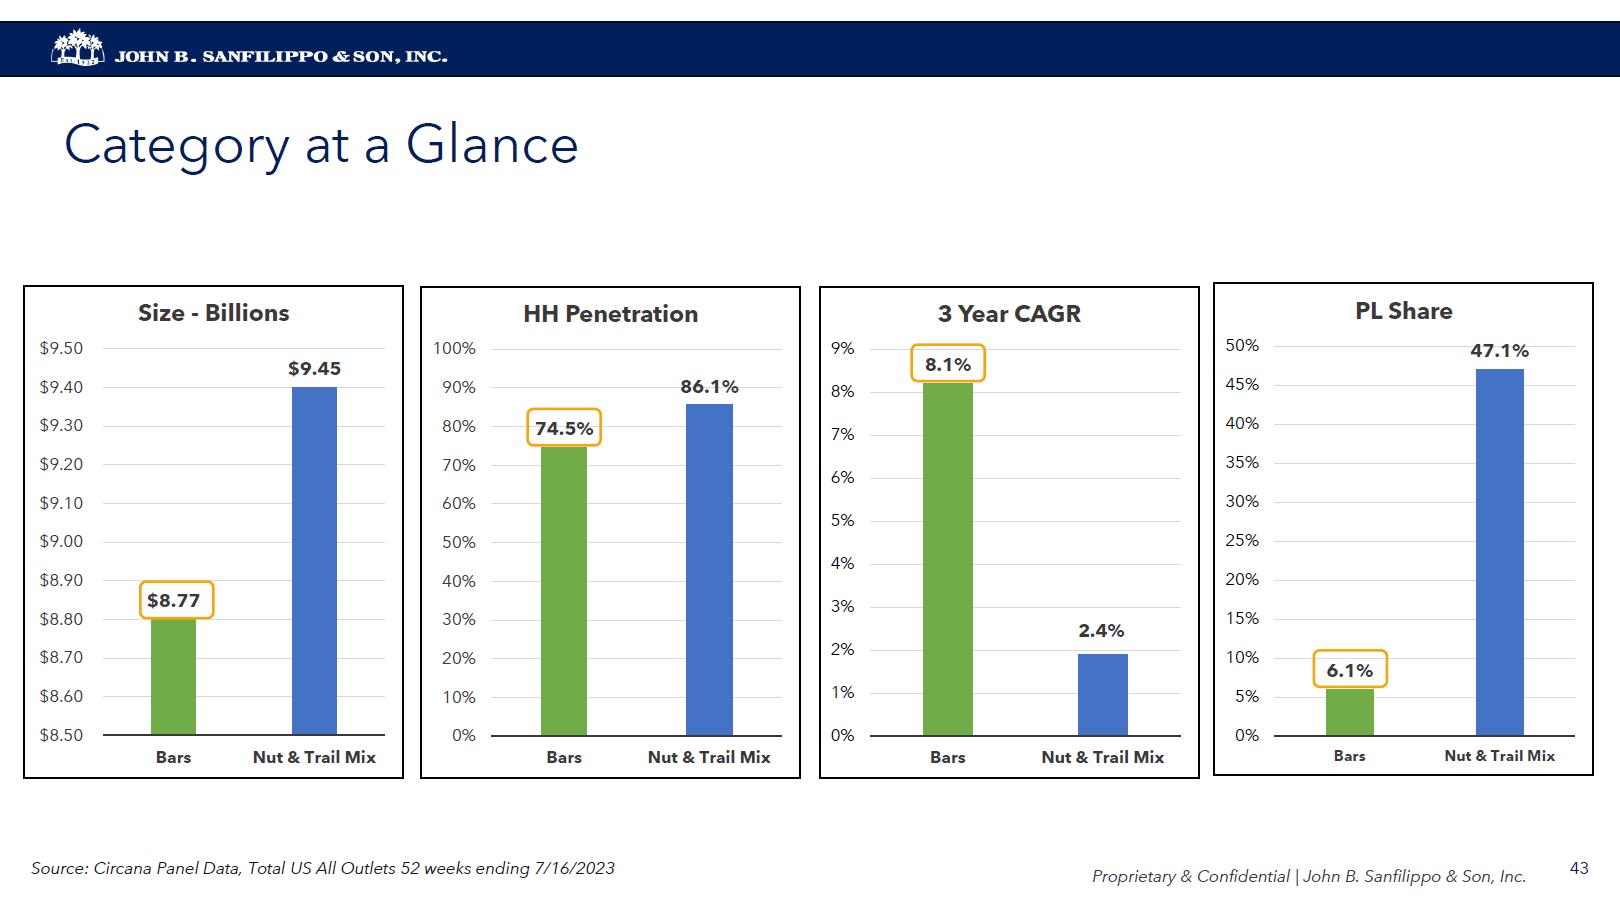
Category at a Glance $8.50 $8.60 $8.70 $8.80 $8.90 $9.00 $9.10 $9.20 $9.30 $9.40 $.50 Size - Billions Bars Nut & Trail Mix HH Penetration 0% 10% 20% 30% 40% 50% 60% 70% 80% 90% 100% 74.5% 86.1% Bars Nut & Trail Mix 3 Year CAGR 0% 1% 2% 3% 4% 5% 6% 7% 8% 9% 8.1% 2.4% Bars Nut & Trail Mix PL Share %0 5% 10% 15% 20% 25% 30% 35% 40% 45% 50% 6.1% 47.1% Bars Nut & Trail Mix Source: Circana Panel Data, Total US All Outlets 52 weeks ending 7/16/2023 Proprietary & Confidential | John B. Sanfilippo & Son, Inc 43

Appendix Proprietary & Confidential | John B. Sanfilippo & Son, Inc 44
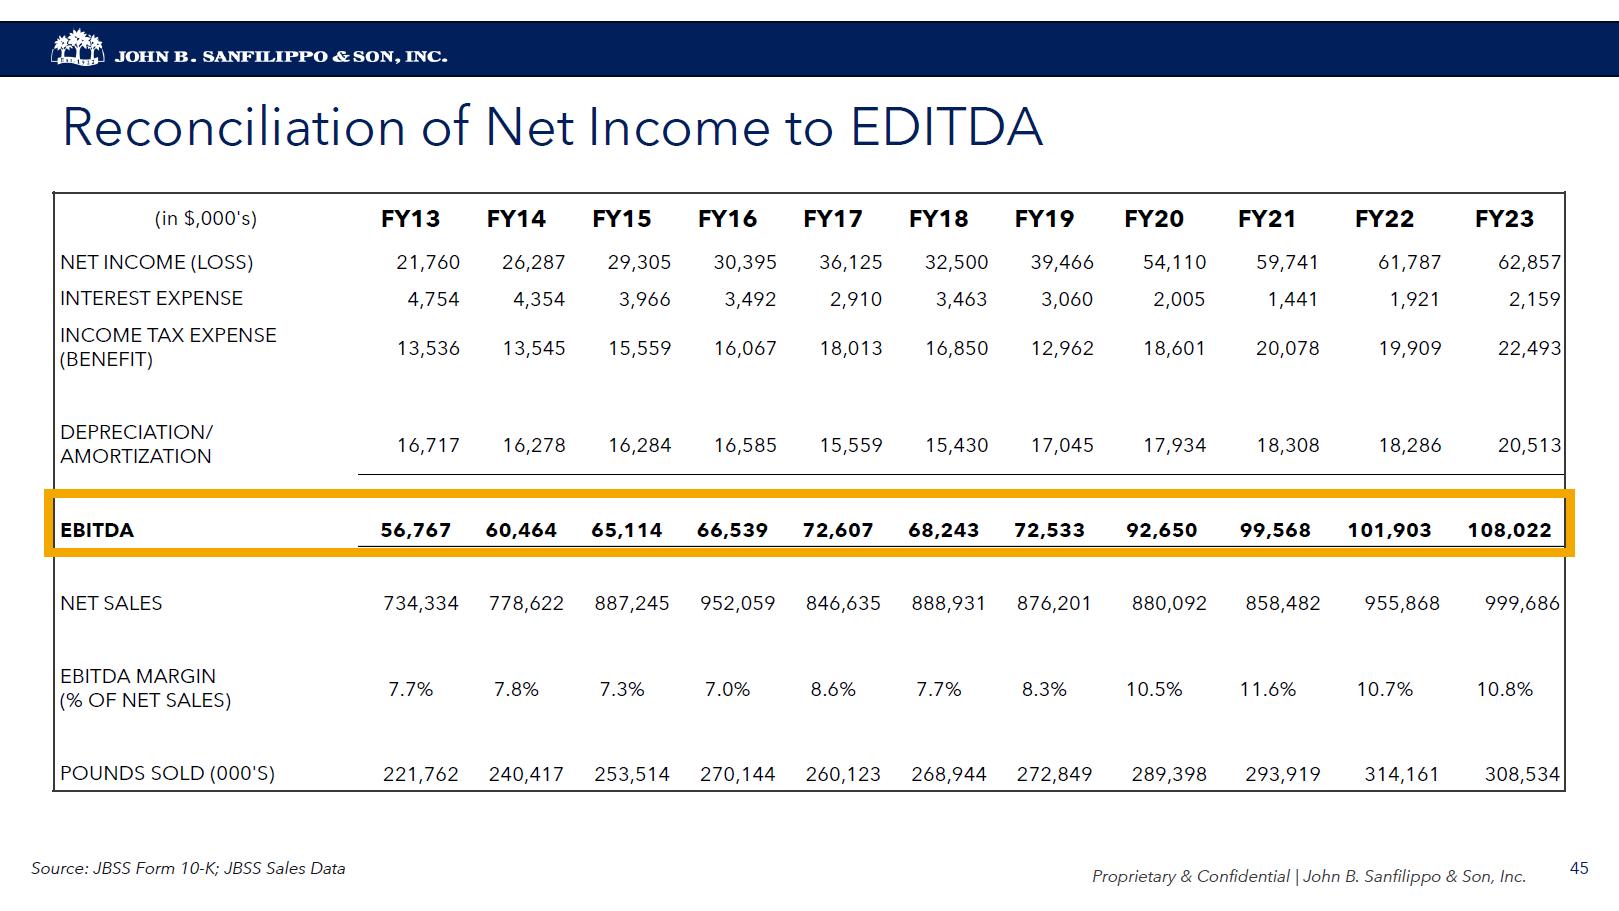
Reconciliation of Net Income to EDITDA (in $,000's) FY13 FY14 FY15 FY16 FY17 FY18 FY19 FY20 FY21 FY22 FY23 NET INCOME (LOSS) 21,760 26,287 29,305 30,395 36,125 32,500 39,466 54,110 59,741 61,787 62,857 INTEREST EXPENSE 4,754 4,354 3,966 3,492 2,910 3,463 3,060 2,005 1,441 1,921 2,159 INCOME TAX EXPENSE (BENEFIT) 13,536 13,545 15,559 16,067 18,013 16,850 12,962 18,601 20,078 19,909 22,493 DEPRECIATION/ AMORTIZATION 16,717 16,278 16,284 16,585 15,559 15,430 17,045 17,934 18,308 18,286 20,513 EBITDA 56,767 60,464 65,114 66,539 72,607 68,243 72,533 92,650 99,568 101,903 108,022 NET SALES 734,334 778,622 887,245 952,059 846,635 888,931 876,201 880,092 858,482 955,868 999,686 EBITDA MARGIN (% OF NET SALES) 7.7% 7.8% 7.3% 7.0% 8.6% 7.7% 8.3% 10.5% 11.6% 10.7% 10.8% POUNDS SOLD (000'S) 221,762 240,417 253,514 270,144 260,123 268,944 272,849 289,398 293,919 314,161 308,534 Source: JBSS Form 10-K; JBSS Sales Data Proprietary & Confidential | John B. Sanfilippo & Son, Inc. 45