 1 WELCOME JBSS STOCKHOLDERS FISCAL 2011 MEETING November 9, 2011 Exhibit 99.1 |
 Some of the statements in this presentation constitute “forward-looking statements” about John B. Sanfilippo & Son, Inc. Such statements include, in particular, statements about our plans, strategies, business prospects, changes and trends in our business and the markets in which we operate. In some cases, you can identify forward-looking statements by the use of words such as “may,” “will,” “could,” “would,” “should,” “expect,” “plan,” “anticipate,” “intend,” “believe,” “estimate,” “forecast,” “predict,” “propose,” “potential” or “continue” or the negative of those terms or other comparable terminology. These statements represent our present expectations or beliefs concerning future events and are not guarantees. Such statements speak only as of the date they are made, and we do not undertake any obligation to update any forward-looking statement. We caution that forward-looking statements are qualified by important factors, risks and uncertainties that could cause actual results to differ materially from those in the forward looking statements. Our periodic reports filed with the Securities and Exchange Commission, including our Forms 10-K and 10-Q and any amendments thereto, describe some of these factors, risks and uncertainties. 2 Forward-Looking Statements |
 Vision To be the global source for nuts, committed to quality, expertise and innovation that delivers an unmatched experience to our customer and consumer. Mission To be the global leader of quality driven, innovative nut solutions that enhance the customer and consumer experience and achieve consistent, profitable growth for our shareholders. We will accomplish this through our commitment to a dynamic infrastructure that maximizes the potential of our brands, people and processes. Core Values Integrity People Investment Customer Driven Quality Innovation Execution Continuous Improvement Safety Resource Conservation 3 |
 4 Acting Today For Tomorrow’s Results At the beginning of the day, it's all about possibilities. At the end of the day, it's all about results.“ - Bob Prosen |
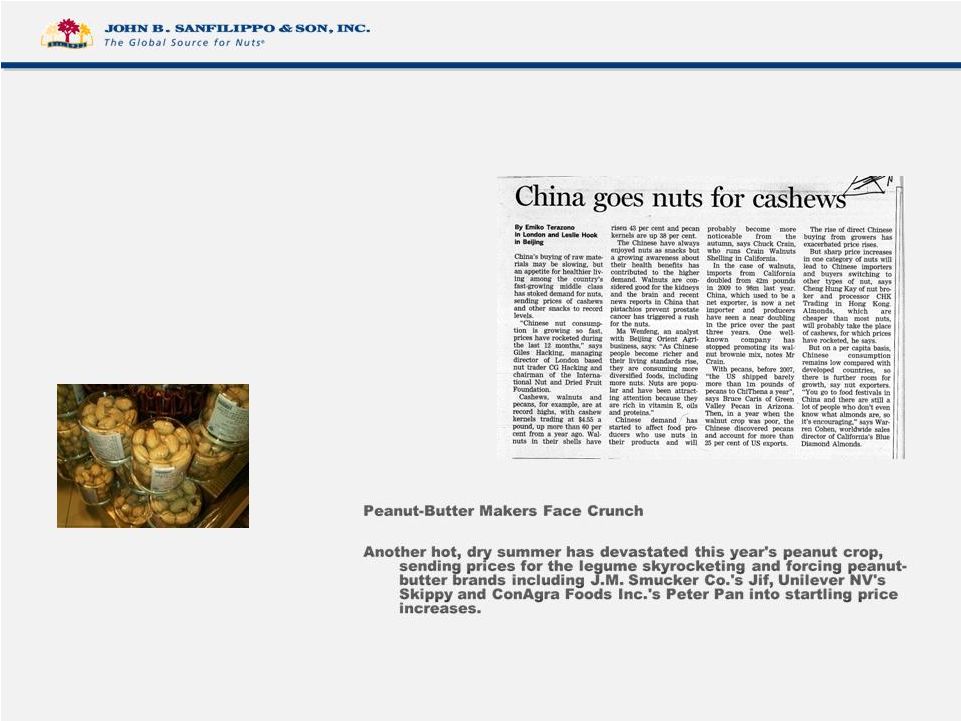 FY 2011 Market Conditions: The Headlines U.S. NEWS U.S. NEWS Shell Shock: Chinese Demand Reshapes U.S. Pecan Business 'Explosive' Food Prices the Biggest Risk 5 |
 6 Business Transformation Over Past 4 years |
 2007 Business Diversification 2007 Business Diversification 7 Industrial 21% Foodservice 11% Contract Mfg. 8% Consumer Products 51% Export 9% Fiscal 2007 Sales $541 Million |
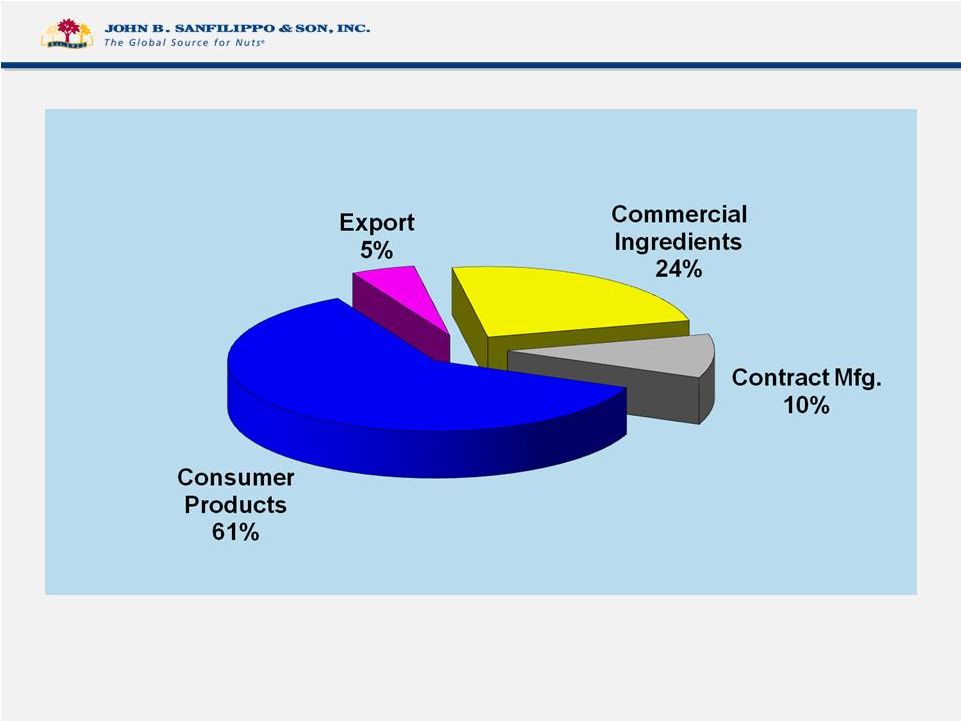 2011 Business Diversification 2011 Business Diversification 8 Includes Industrial & Foodservice Fiscal 2011 Sales $674 Million |
 9 Peanuts 20.0% Pecans 22.3% Cashews & Mixed Nuts 21.1% Walnuts 13.7% Almonds 13.3% Other/Snack Mixes 9.6% Product Diversification % Of Sales FY 2007 |
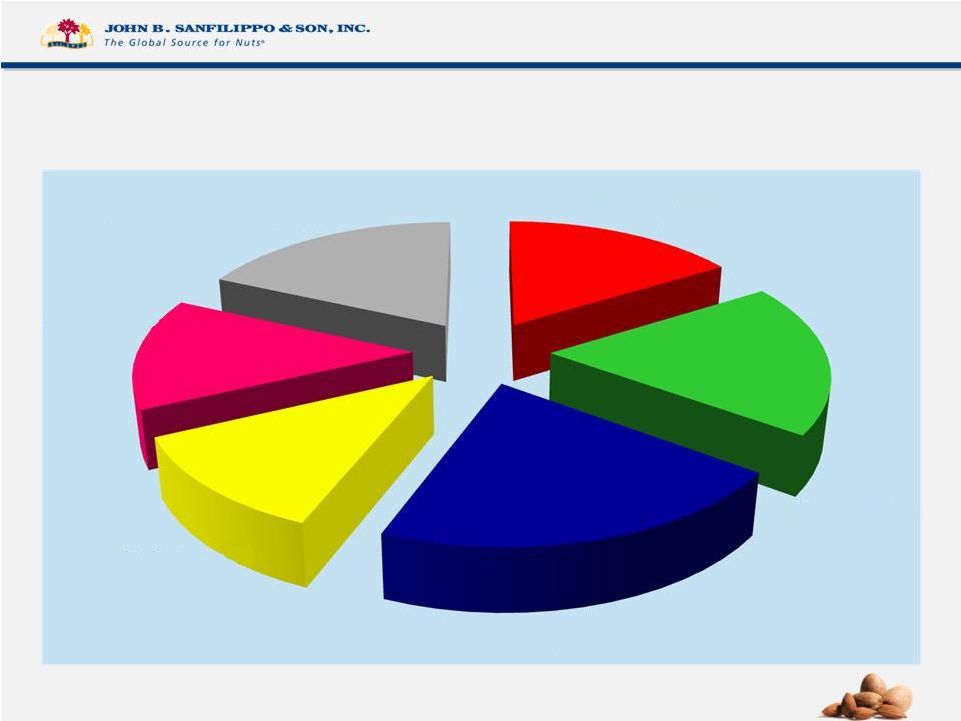 10 Product Diversification % Of Sales FY2011 Peanuts 16.2 % Pecans 18.8 % Cashews & Mixed Nuts 21.0% Walnuts 12.0% Almonds 13.8 % Other/Snack Mixes 18.2% |
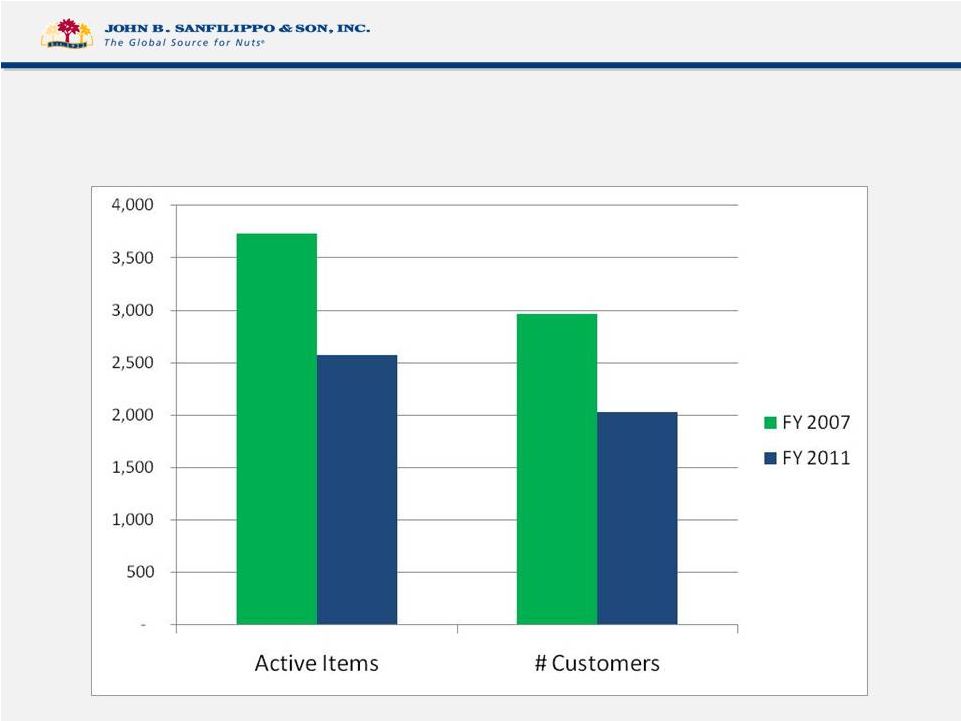 -31.5% -30.9% 11 Item & Customer Optimization |
 12 * Fiscal net sales / average number of employees as reported on Form 10-K. Temporary employees not included. 100,000 200,000 300,000 400,000 500,000 600,000 700,000 800,000 900,000 2008 2009 2010 2011 JBSS RALCORP DIAMOND LANCE Sales Per Employee* |
 Consolidation of OVH to Gustine 13 |
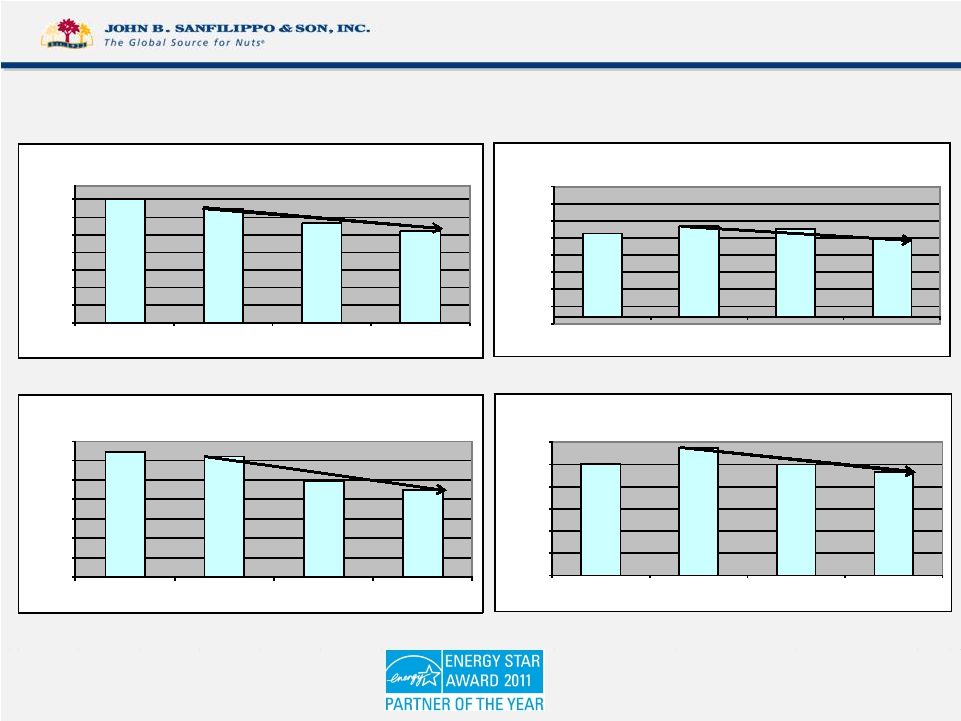 14 Total Company electricity metric decreased approximately 6% for FY11! Total Company gas metric decreased approximately 9% for FY11! Total Company nitrogen metric decreased approximately 8% for FY11! Total Company water metric decreased approximately 5% for FY11! - 0.0100 0.0200 0.0300 0.0400 0.0500 0.0600 0.0700 KwH 08 KwH 09 KwH 10 KwH 11 Total Company Electric KwH Usage/LBS. - 0.0010 0.0020 0.0030 0.0040 0.0050 0.0060 0.0070 CCF 08 CCF 09 CCF 10 CCF 11 Total Company Nitrogen CCF Usage/LBS. - 0.0100 0.0200 0.0300 0.0400 0.0500 0.0600 Gal 08 Gal 09 Gal 10 Gal 11 Total Company Water Gallon Usage/LBS. (0.0002) 0.0003 0.0008 0.0013 0.0018 0.0023 0.0028 0.0033 0.0038 Therms 08 Therms 09 Therms 10 Therms 11 Total Company Natural Gas Therms Usage/LBS. Resource Conservation Efforts |
 15 Fiscal 2011 Business Review |
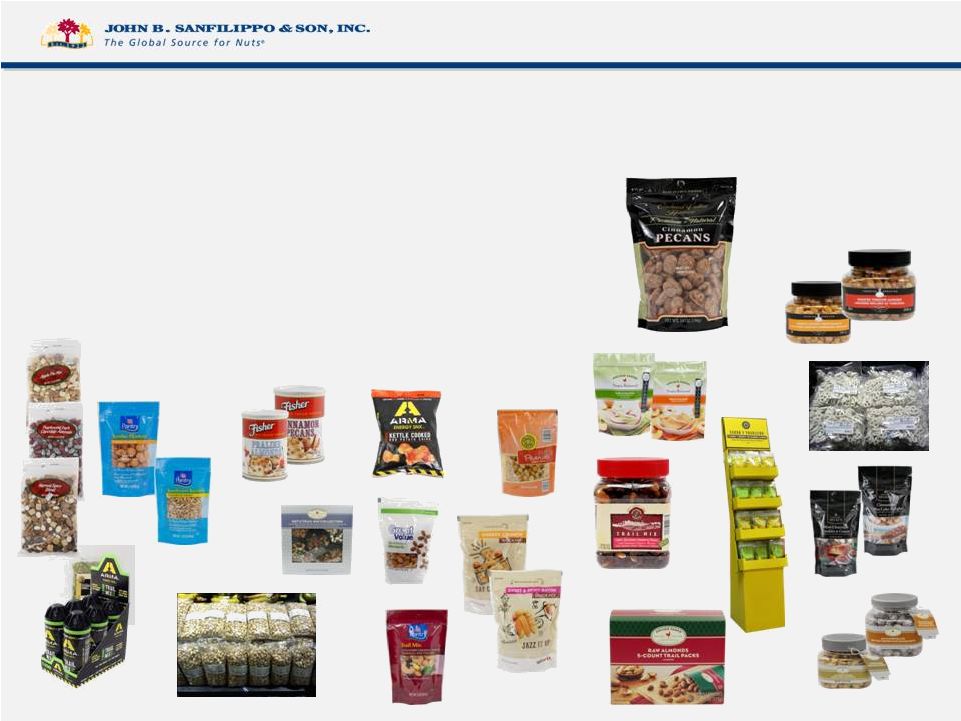 Committed to Innovation • 182 new items in Consumer Channel • 13 new items in Commercial Ingredients Channel • 8 new items in Export Channel • 16 new items for Contract Manufacturing 16 |
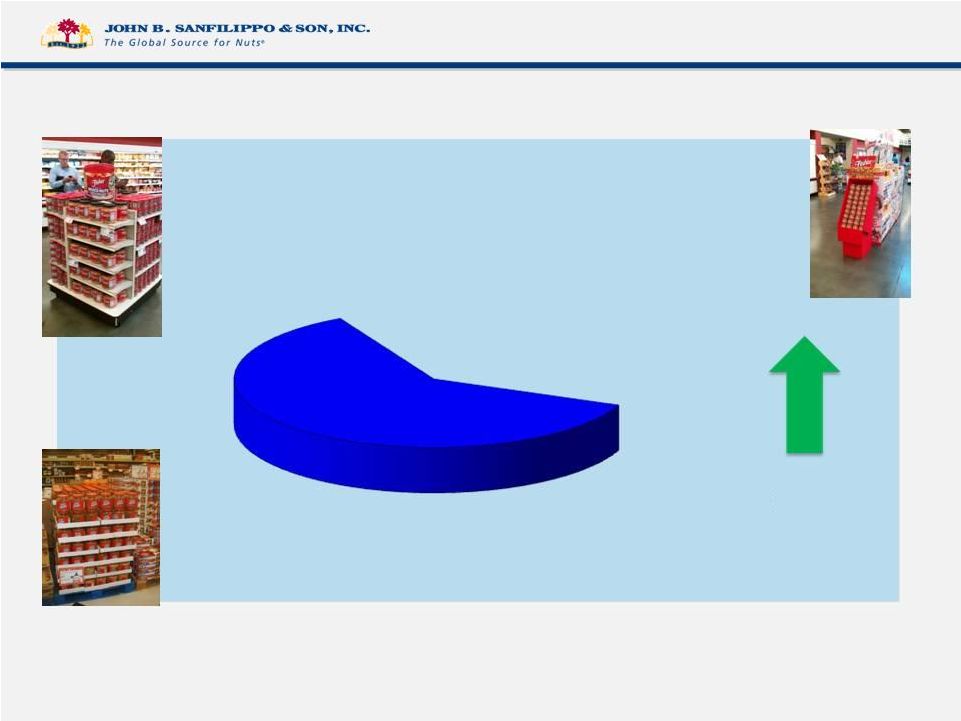 Consumer Products 61% 17 25% vs. FY ‘10 Fiscal 2011 Sales $414 Million 2011 Business Diversification 2011 Business Diversification 2011 Business Diversification |
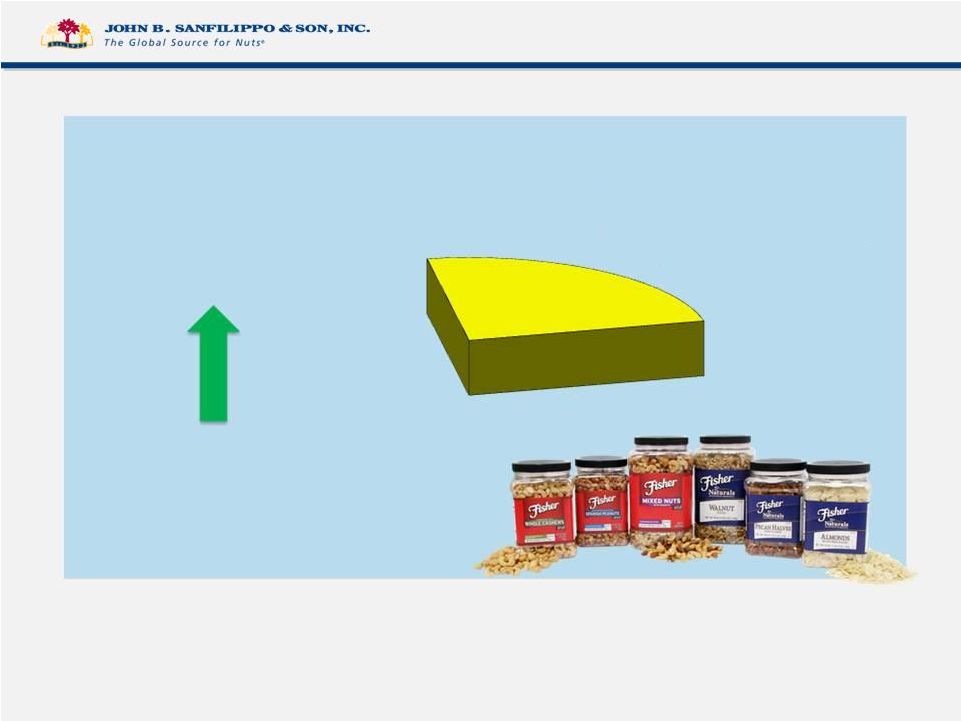 2011 Business Diversification 2011 Business Diversification 18 Fiscal 2011 Sales $161 Million Commercial Ingredients 24% 14% vs. FY’10 Includes Industrial & Foodservice |
 2011 Business Diversification 2011 Business Diversification Contract Manufacturing 10% 19 Fiscal 2011 Sales $64 Million 22% vs. FY ‘10 |
 2011 Business Diversification 2011 Business Diversification 20 Fiscal 2011 Sales $35 Million Export 5% - 4% vs. FY’10 |
 21 FY 2011 Financial Milestones |
 ($ Millions) JBSS Stockholders Equity FYE 1991- 2011 22 |
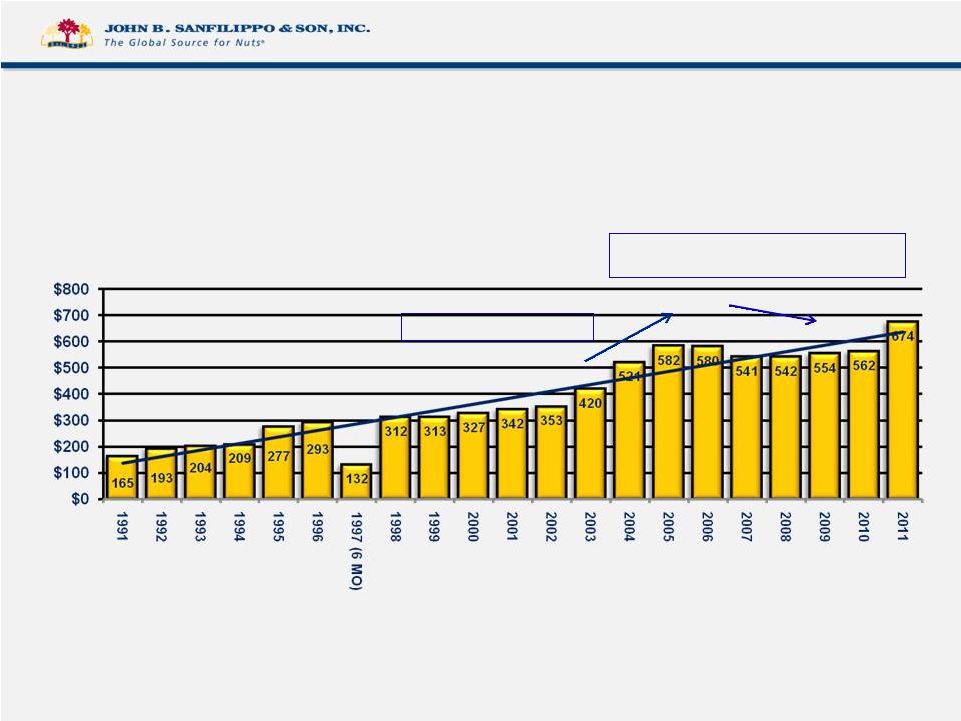 JBSS Net Sales FYs 1991- 2011 ($ Millions) Note: FY 1997 reflects stub year Item Rationalization, De-emphasized Commodity Sales, Lower Prices Low Carb Diet Run Up 23 |
 ($ Millions) JBSS Total Outstanding Debt FYE 1991- 2011 Facility consolidation Improved operating performance 24 |
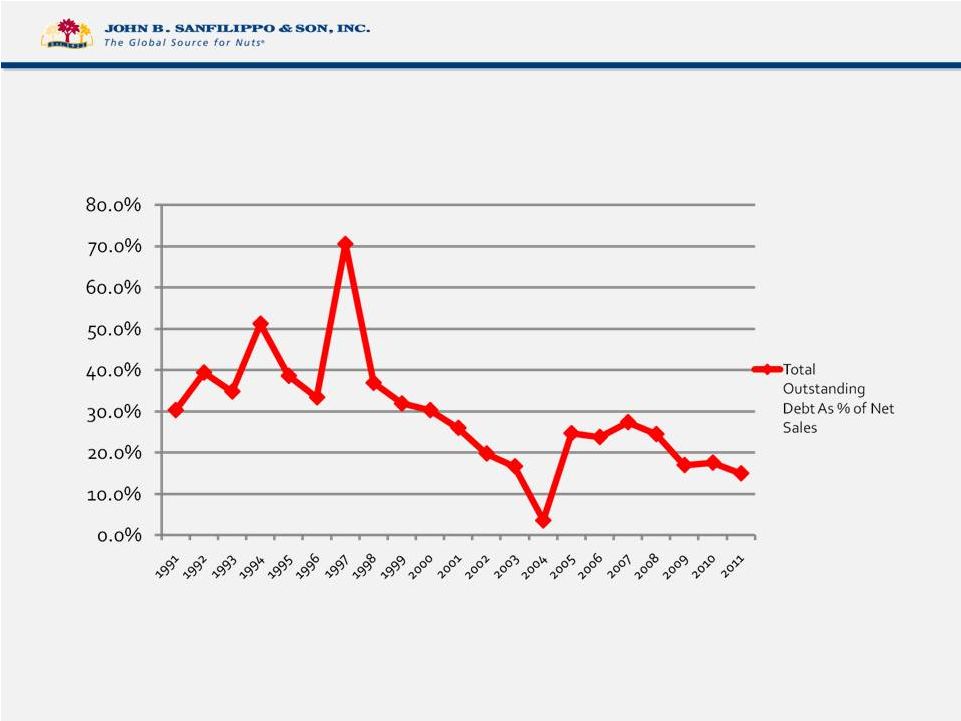 JBSS Total Outstanding Debt As % of Net Sales FY’s 1991 – 2011 Note: FY 1997 reflects stub year 25 |
 EBITDA consists of earnings before interest, taxes, depreciation, amortization and noncontrolling interest. EBITDA is not a measurement of financial performance under accounting principles generally accepted in the United States of America ("GAAP"), and does not represent cash flow from operations. EBITDA is presented solely as a supplemental disclosure because management believes that it is important in evaluating JBSS's financial performance and market valuation. In conformity with Regulation G, a reconciliation of EBITDA to the most directly comparable financial measures calculated and presented in accordance with GAAP is presented in the following slide. EBITDA 26 |
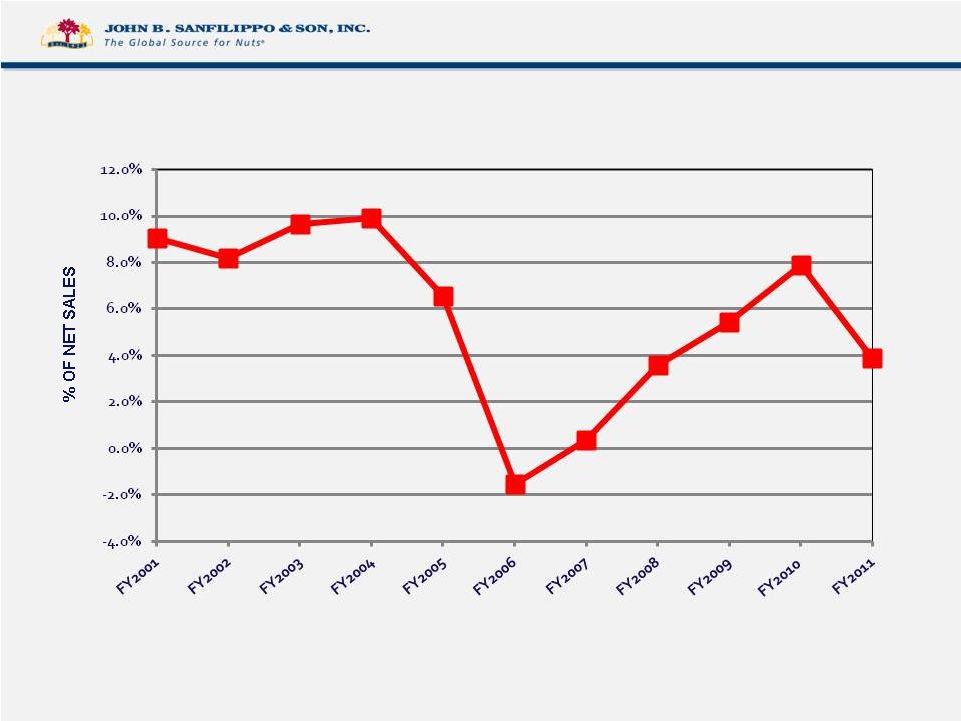
 Reconciliation of Net (Loss) Income to EBITDA 27 (In $,000's) FY2001 FY2002 FY2003 FY2004 FY2005 FY2006 FY2007 FY2008 FY2009 FY2010 FY2011 NET (LOSS) INCOME 7,595 7,691 15,027 22,630 14,499 -16,721 -13,577 -5,957 6,917 14,425 2,835 INTEREST EXPENSE 8,365 5,757 4,681 3,434 3,998 6,516 9,347 10,502 7,646 5,653 6,444 INCOME TAX (BENEFIT) EXPENSE 5,063 5,044 9,607 14,468 9,269 -8,689 -7,520 -897 -259 8,447 -49 DEPRECIATION & AMORTIZATION 9,974 10,428 11,248 11,190 10,501 10,000 13,584 15,742 15,922 15,825 16,968 EBITDA 30,997 28,920 40,563 51,722 38,267 -8,894 1,834 19,390 30,226 44,350 26,198 NET SALES 342,357 352,799 419,677 520,811 581,729 579,564 540,858 541,771 553,846 561,633 674,212 EBITDA MARGIN (% OF NET SALES) 9.1% 8.2% 9.7% 9.9% 6.6% -1.5% 0.3% 3.6% 5.5% 7.9% 3.9% SHIPPED LBS 201,650 211,960 250,629 284,576 278,741 248,137 246,142 221,958 217,465 224,302 232,746 EBITDA PER SHIPPED LB 0.154 0.136 0.162 0.182 0.137 (0.036) 0.007 0.087 0.139 0.198 0.113 |
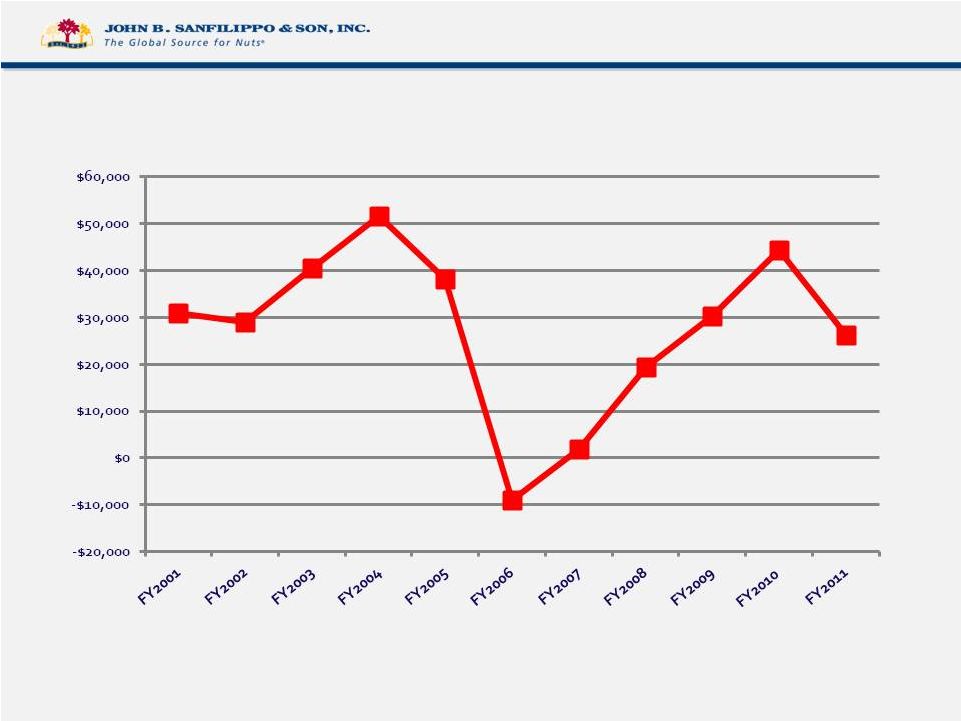 In $,000’s * EBITDA is a non-GAAP measure. See slide entitled “Reconciliation of Net (Loss) Income to EBITDA” for reconciliation to GAAP measure 28 EBITDA* |
 * EBITDA is a non-GAAP measure. See slide entitled “Reconciliation of Net (Loss) Income to EBITDA” for reconciliation to GAAP measure 29 EBITDA* Margin (% of Net Sales) |
 * EBITDA is a non-GAAP measure. See slide entitled “Reconciliation of Net (Loss) Income to EBITDA” for reconciliation to GAAP measure 30 EBITDA* Per Shipped Pound |
 Market prices from survey of JBSS brokers and suppliers Nut Spot Mkt. Prices vs. JBSS Gross Margins 31 |
 32 Highlights: Q1 2012 vs. Q1 2011 (in $‘000s except EPS) $ Chng. % Chng. Net Sales 6.8% Sales Volume (lbs. shipped) (6.8%) Gross Profit Net Income Earnings Per Share Operating Cash Flows Total Debt $10,012 (3,666) $ 1,225 6.0% $ 1,363 126.3% 130.0% $ 0.13 114.5% $ 6,566 (2.9%) ($ 2,764) |
 33 JBSS Strategy Overview |
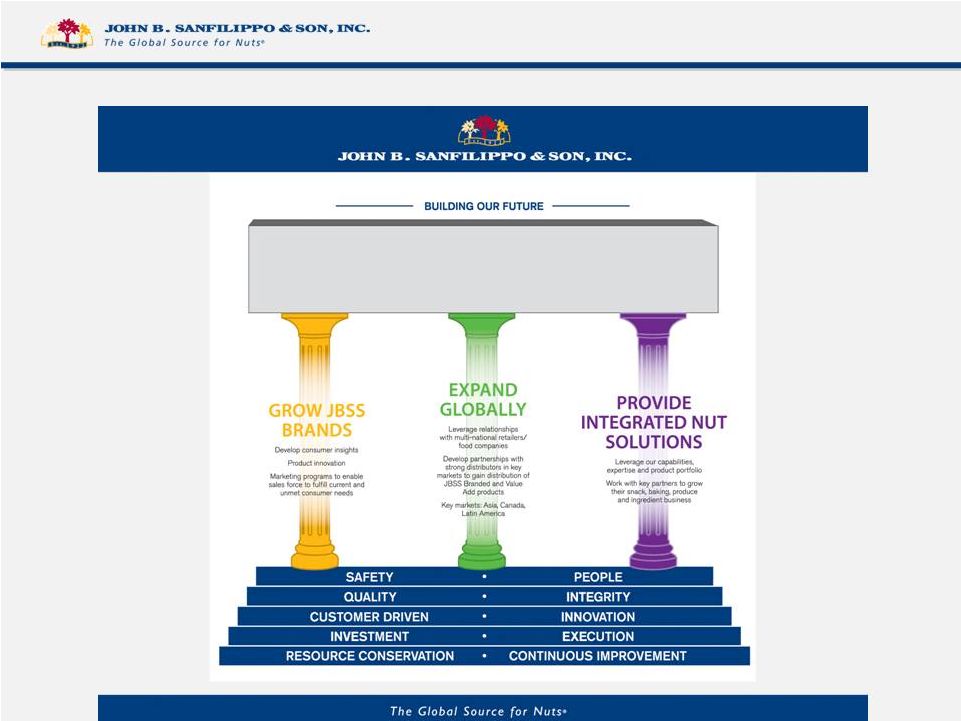 34 JBSS Strategy Overview |
 35 Snack Nuts: Snack Nuts: Re-launched Snack Nuts with “Freshness You Can See” campaign Targeted marketing program in key markets Aligned dedicated sales force Baking Nuts Launched Freshness Seal stand up bag in Q1 of FY 2012 Growing Brands to Drive Growth and Profitability |
 Introduced several new products under the OVH brand Currently engaged in consumer insight studies Three new regional customers began buying OVH products 36 Growing Brands to Drive Growth and Profitability |
 Introduction of Fisher snack nuts into Shanghai, China via new distribution relationship Increased penetration of Fisher products with global retailers Introduction of new Fisher products in Puerto Rico, Mexico and Central America 37 Growing Brands to Drive Growth and Profitability Internationally |
 • Achieved significant volume growth with Commercial Ingredient customers through innovative new products and tailoring product offerings to changing end user needs • Brought added value to our private brand customers through new packaging and new formulations (especially in response to higher raw material costs) and expanded product offerings • Increased utilization of alternative paths to serve smaller customers • Identified the right product and packaging options to resonate with private brand customers in markets outside the US Provide Integrated Nut Solutions 38 |
 39 Growing Brands |
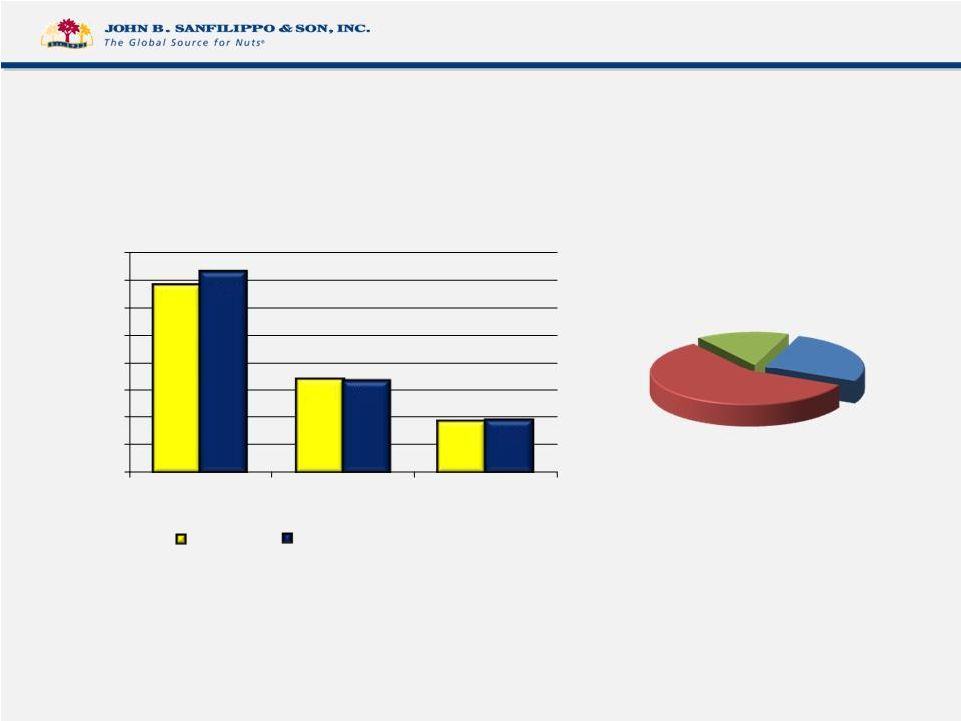 % $ Sales +7.5% (1.5)% +2.3% ($ Millions) Source: Nielsen FDM (Dollars) 52 Weeks Ending 07/23/11 vs. Year Ago Nuts. Does not include Trail Mixes Category Nut Category Dollar Growth 40 $+2.8% U+0.3% $+8.0% U+3.1% $+7.1% U-0.3% 1359 678 372 1460 667 381 $0 $200 $400 $600 $800 $1,000 $1,200 $1,400 $1,600 Snack Produce Baking Year Ago Current Year Produce, $667, 27% Snack, $1,460, 58% Baking, $381, 15% |
 Private Brands Branded +3.3% Branded versus Private Brand +4.3% Source: Nielsen FDM (Dollars and Units) 52 Weeks Ending 07/23/11 vs. Year Ago Nuts. Does not include Trail Mixes 41 2005 2006 2007 2008 2009 2010 2011 $573 $580 $625 $682 $780 $825 $852 Dollars vs. Units (in Millions) 2005 2006 2007 2008 2009 2010 2011 $1,556 $1,582 $1,621 $1,688 $1,664 $1,808 $1,886 Dollars vs. Units (in Millions) |
 Fisher Snacks Relaunched with “Freshness You Can See” • Consumers can see the quality • Updated, contemporary graphics • Recyclable, Reusable 42 |
 Supported at the Point of Purchase 43 |
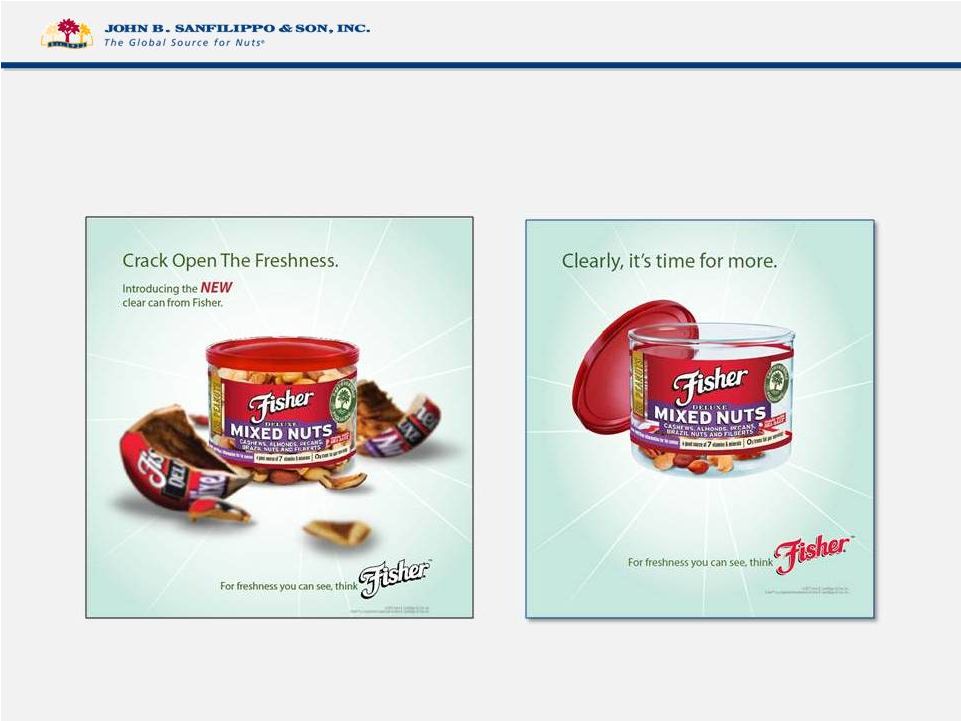 Print Advertising 44 |
 “Freshness You Can See” Radio: Happy “Freshness You Can See” Radio: Sing “Freshness You Can See” Radio: Pantry “Freshness You Can See” Radio: Peanut Targeted Radio in Select Markets 45 |
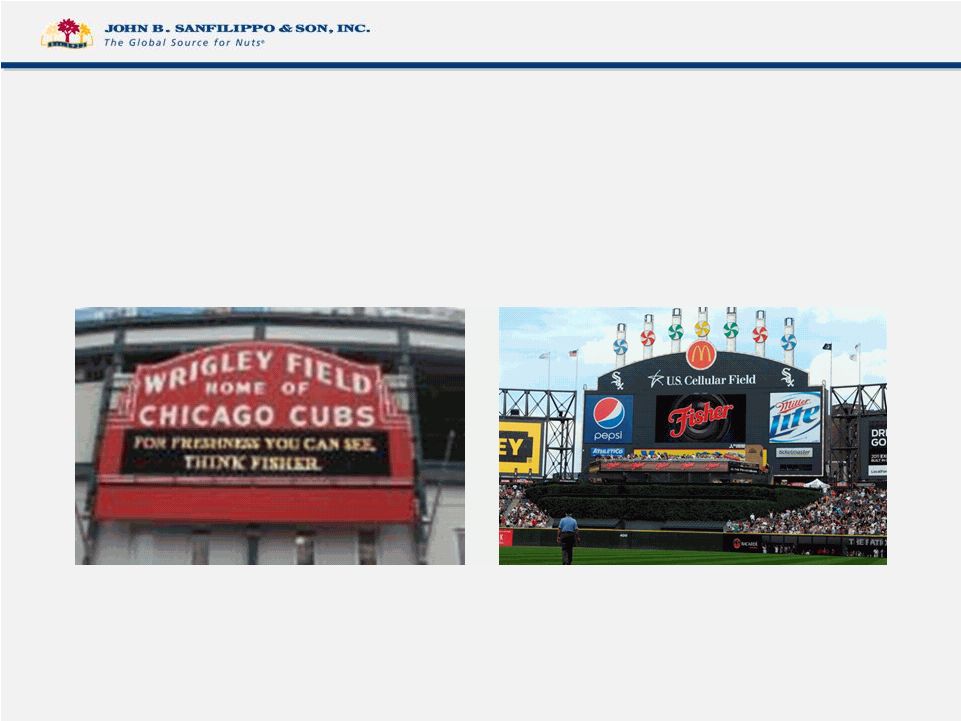 46 Leveraging Sports Sponsorships to Grow the Brand |
 Old Packaging Laydown Bag New New Packaging "Freshness Seal” Stand-up Bag 47 Reinventing the Baking Nut Category |
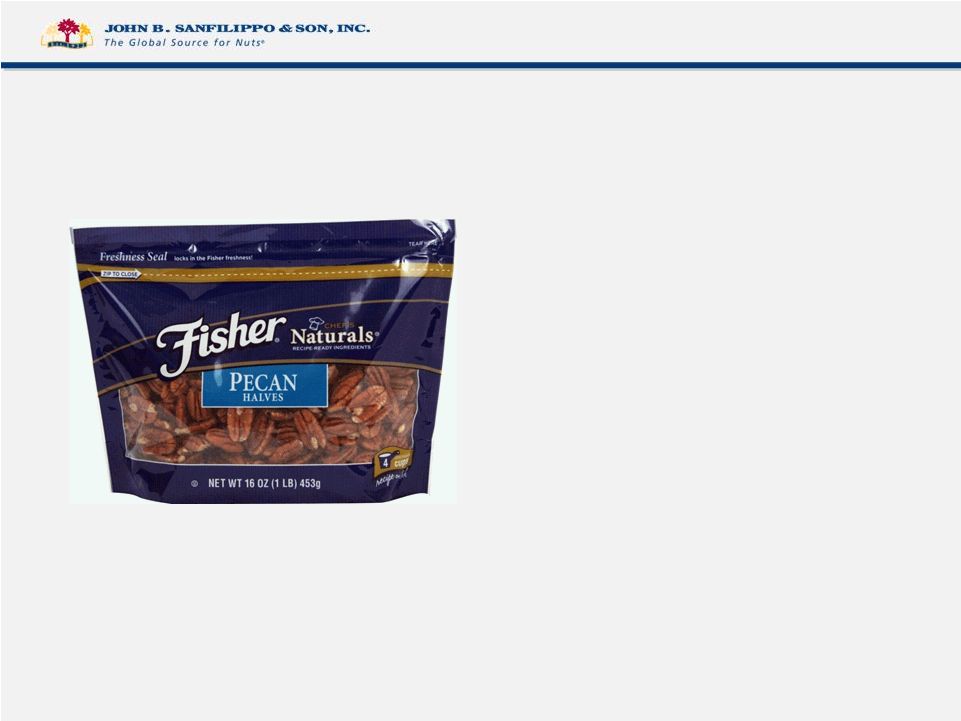 Consumers love the Fisher “Freshness Seal” Stand Up Bag • Easier to store between uses • Easier to reclose and seal • Easier to scoop 48 |
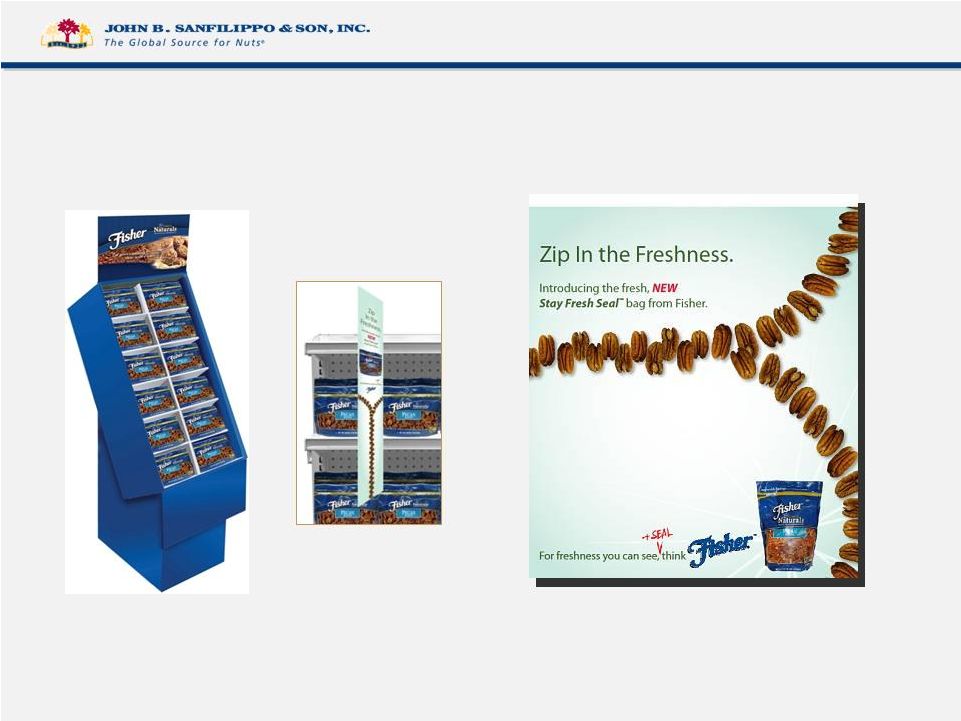 Building the Brand with Marketing Support In-Store Merchandising and Point of Sale Targeted Communication in Key Markets 49 |
 Will Build Our Private Brand Partnerships by Adding Value 50 |
 51 Closing Comments |
 “ It'll be all of our efforts together. It won't ever be exactly the way I imagined it. And that is, I think, an important lesson is that in any group enterprise it's going to be the sum total of the group.” - James Cameron (filmmaker) 52 |
 53 Thank You |