Exhibit 99.1
Annual Stockholder Meeting-FY’12 Review
October 30, 2012
Forward-Looking Statements
Some of the statements in this presentation constitute “forward-looking statements” about John B. Sanfilippo & Son, Inc. Such statements include, in particular, statements about our plans, strategies, business prospects, changes and trends in our business and the markets in which we operate. In some cases, you can identify forward-looking statements by the use of words such as “may,” “will,” “could,” “would,” “should,” “expect,” “plan,” “anticipate,” “intend,” “believe,” “estimate,” “forecast,” “predict,” “propose,” “potential” or “continue” or the negative of those terms or other comparable terminology. These statements represent our present expectations or beliefs concerning future events and are not guarantees. Such statements speak only as of the date they are made, and we do not undertake any obligation to update any forward-looking statement.
We caution that forward-looking statements are qualified by important factors, risks and uncertainties that could cause actual results to differ materially from those in the forward looking statements. Our periodic reports filed with the Securities and Exchange Commission, including our Forms 10-K and 10-Q and any amendments thereto, describe some of these factors, risks and uncertainties.
Agenda
JBSS Overview and Jeffrey Sanfilippo Chairman & CEO
Strategic Vision
Financial Review Mike Valentine CFO & Group President
Brand Marketing Howard Brandeisky VP Global Marketing &
Customer Solutions
Brand Sales Chris Gardier Sr. VP Consumer Sales
Closing Remarks Jeffrey Sanfilippo Chairman & CEO
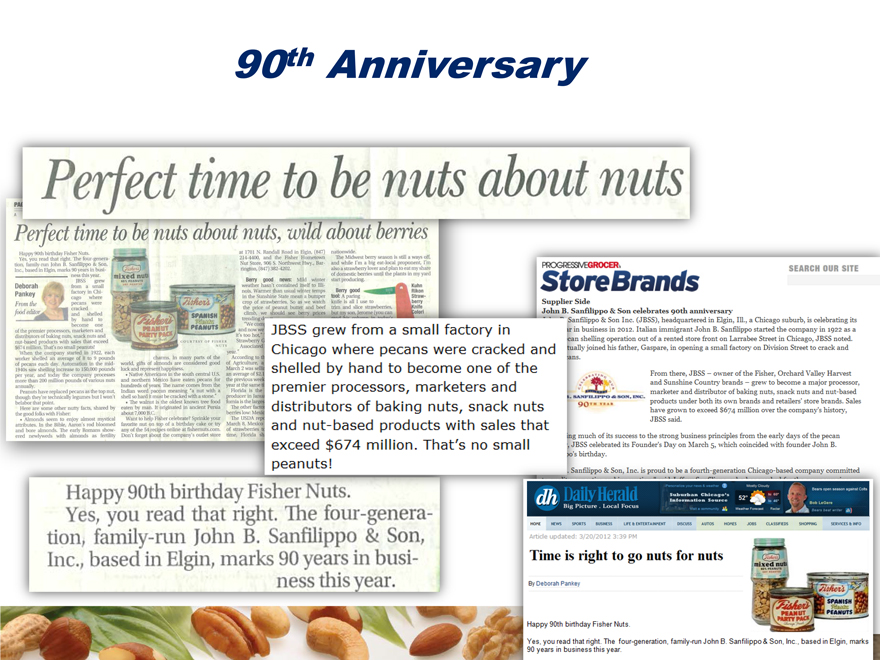
90th Anniversary
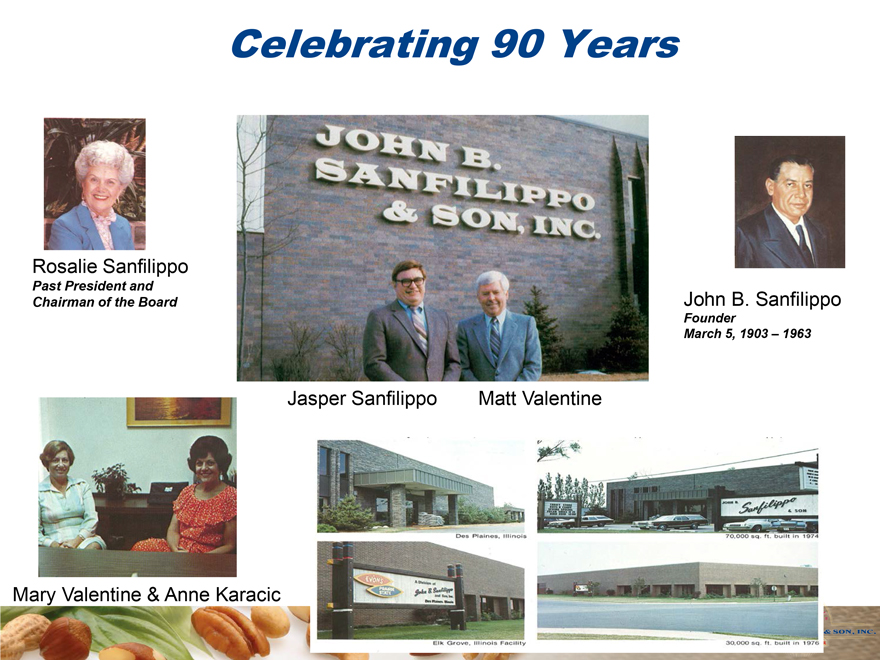
Celebrating 90 Years
Rosalie Sanfilippo
Past President and Chairman of the Board
Jasper Sanfilippo Matt Valentine
John B. Sanfilippo
Founder
March 5, 1903 – 1963
Mary Valentine & Anne Karacic
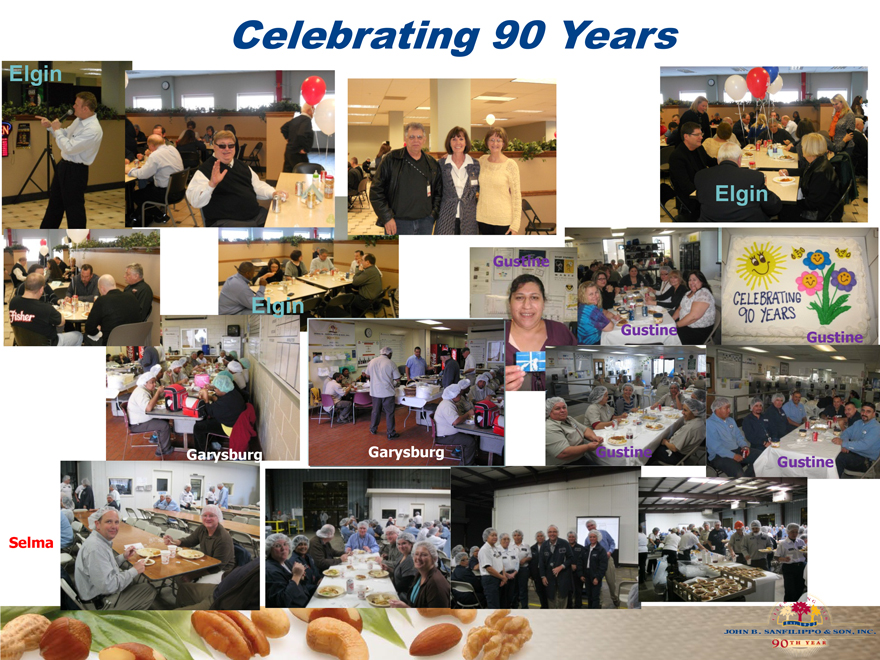
Celebrating 90 Years
Elgin
Garysburg
Gustine
Selma
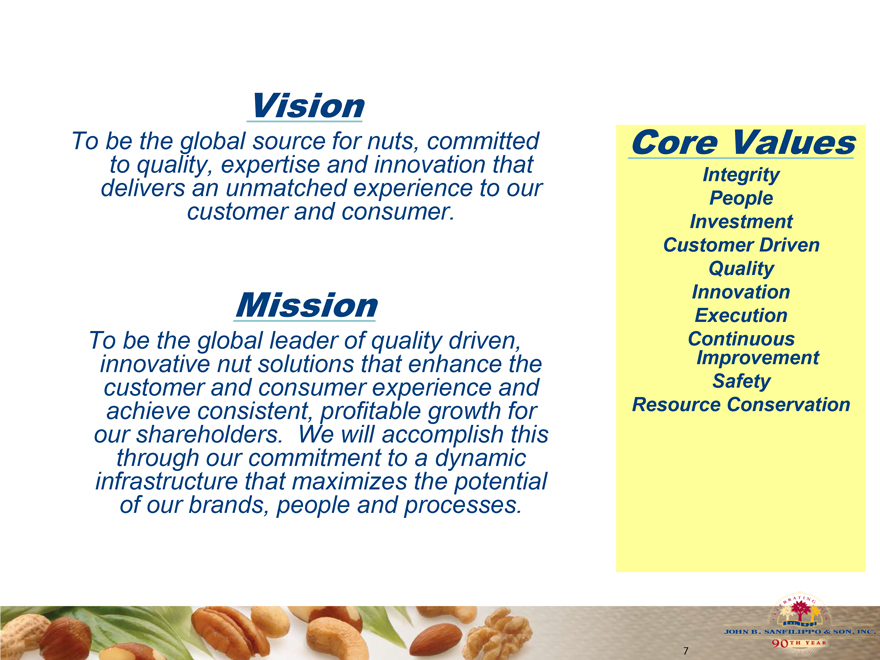
Vision
To be the global source for nuts, committed to quality, expertise and innovation that delivers an unmatched experience to our customer and consumer.
Mission
To be the global leader of quality driven, innovative nut solutions that enhance the customer and consumer experience and achieve consistent, profitable growth for our shareholders. We will accomplish this through our commitment to a dynamic infrastructure that maximizes the potential of our brands, people and processes.
Core Values
Integrity People Investment Customer Driven Quality Innovation Execution Continuous Improvement Safety Resource Conservation
7
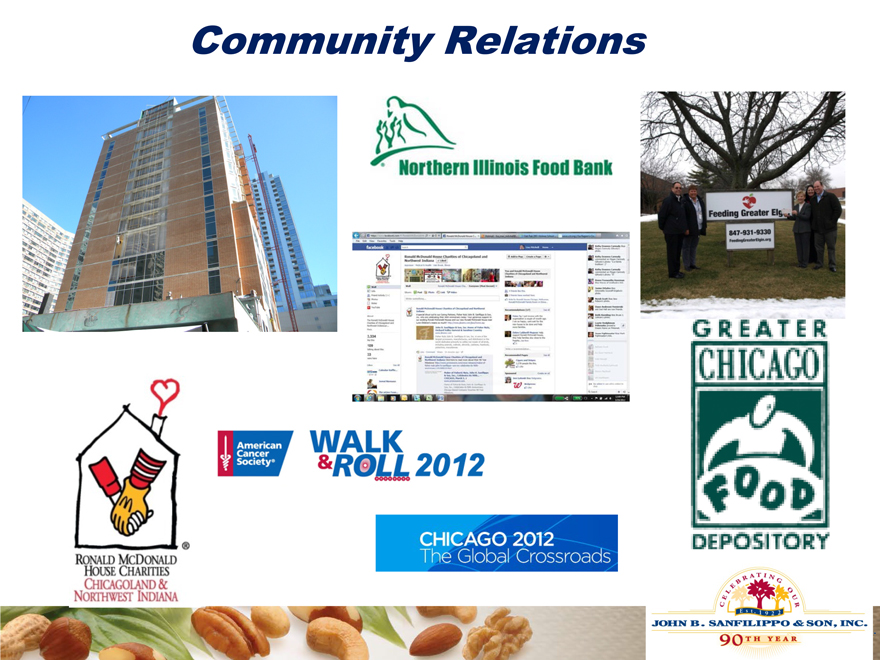
Community Relations
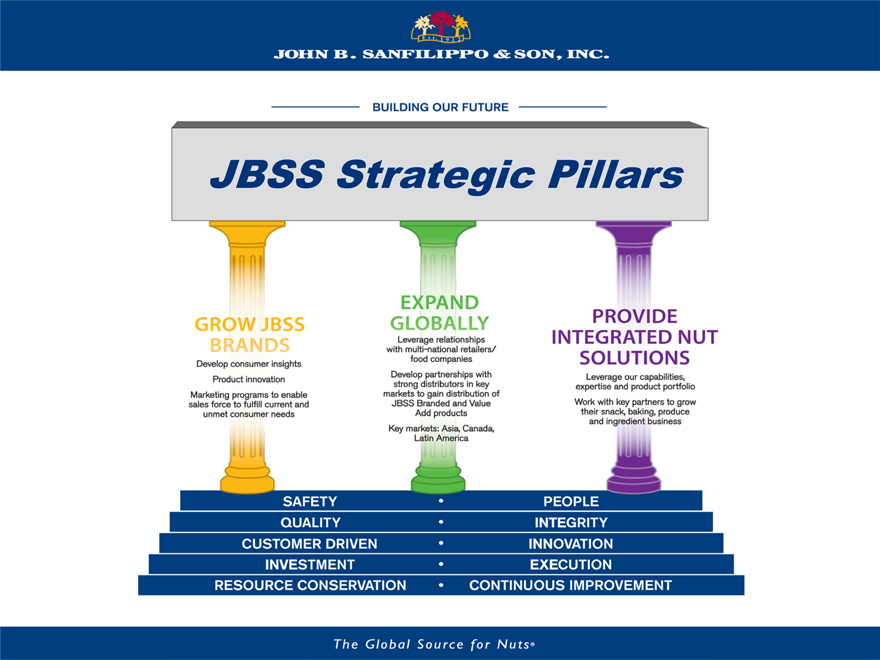
JBSS Strategic Pillars
Talent and knowledge will continue to facilitate the execution of our Strategic Plan
• Experienced management team
• Expanding global knowledge
• Investments in consumer insights & brand development
• Procurement expertise
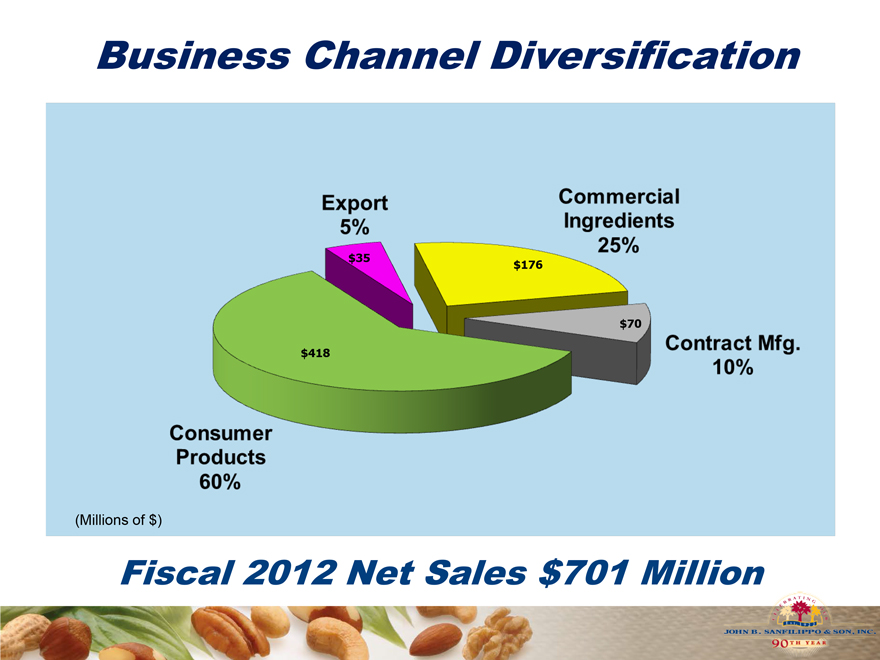
Business Channel Diversification
Fiscal 2012 Net Sales $701 Million
(Millions of $)
Export 5%
Commericial Ingredients 25%
Consumer Products 60%
Contract Mfg. 10%
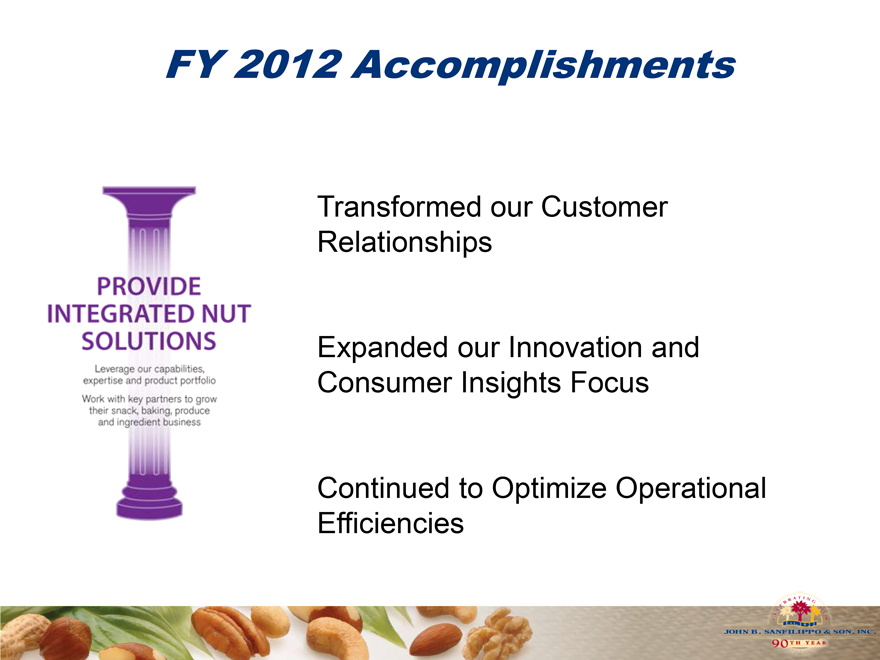
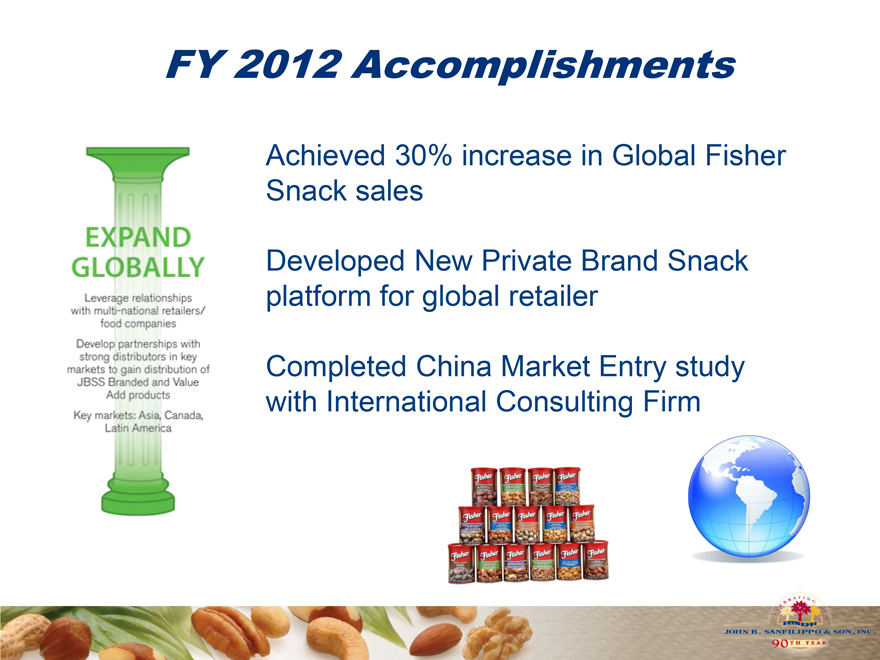
FY 2012 Accomplishments
Transformed our Customer Relationships
Expanded our Innovation and Consumer Insights Focus
Continued to Optimize Operational Efficiencies
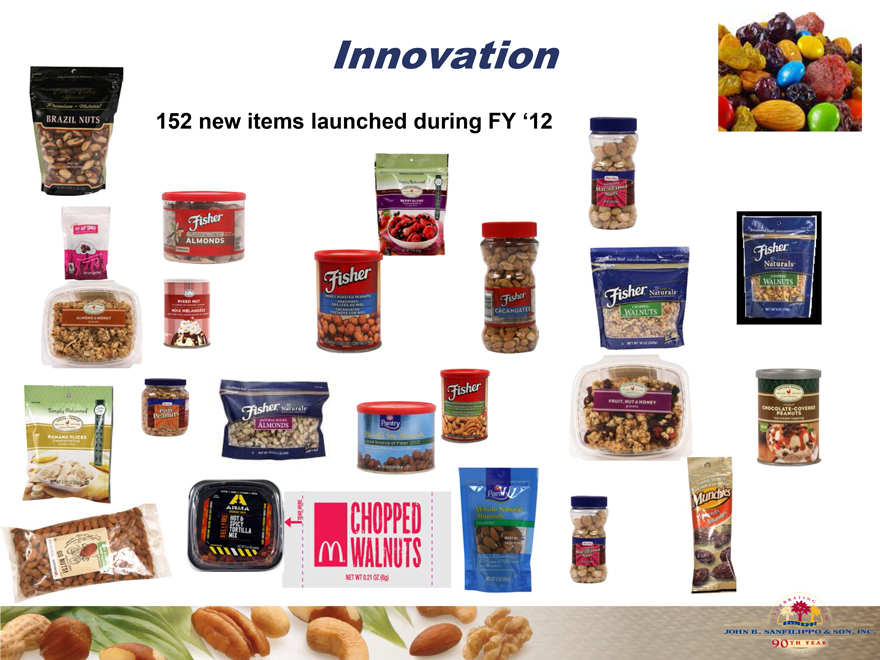
Innovation
152 new items launched during FY ‘12
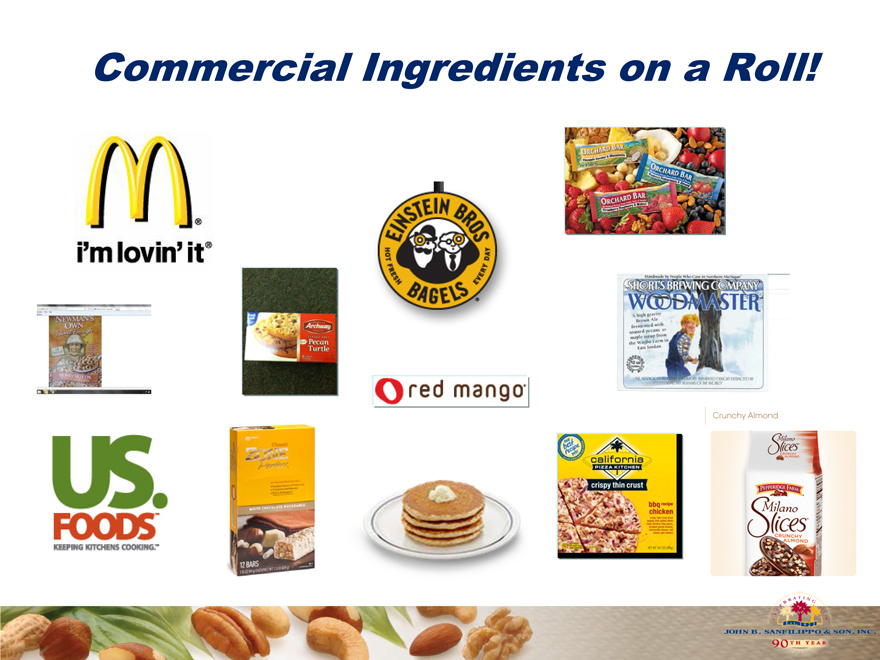
Commercial Ingredients on a Roll!
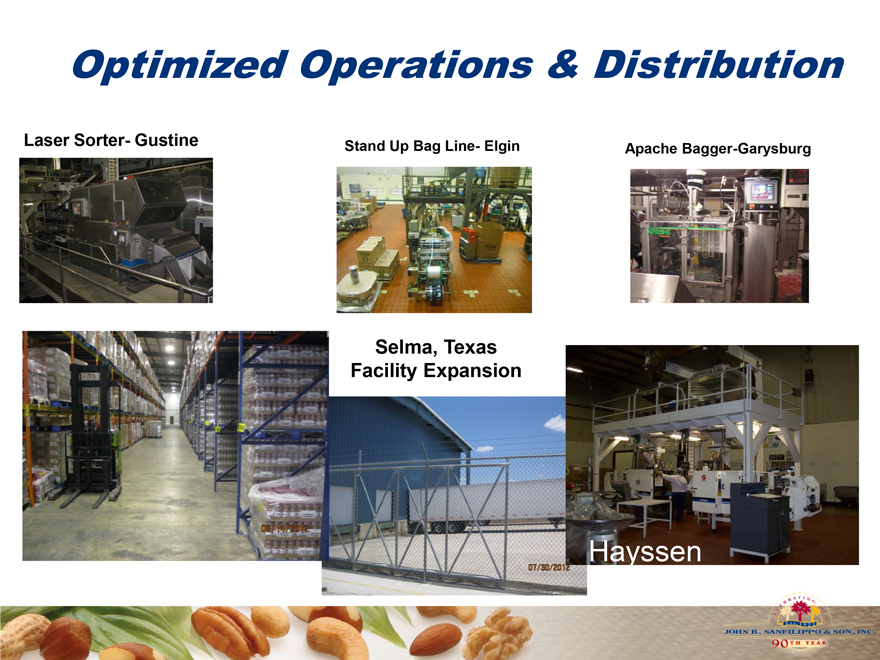
Optimized Operations & Distribution
Laser Sorter- Gustine
Stand Up Bag Line- Elgin
Apache Bagger-Garysburg
Selma, Texas Facility Expansion
Hayssen
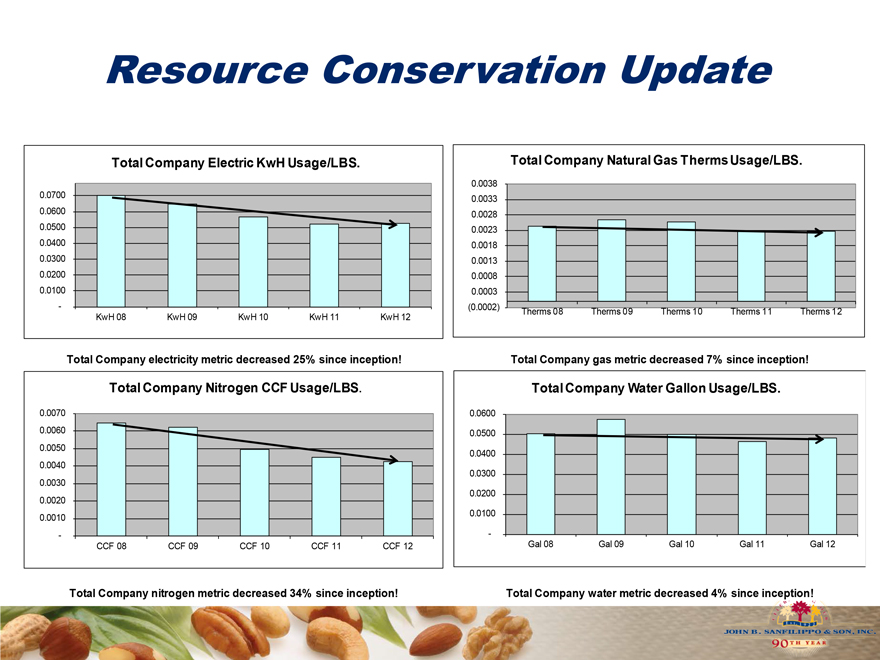
Resource Conservation Update
Total Company Electric KwH Usage/LBS. Total Company Natural Gas Therms Usage/LBS.
0.0038
0.0700 0.0033
0.0600 0.0028
0.0500 0.0023
0.0400 0.0018
0.0300 0.0013
0.0200 0.0008
0.0100 0.0003
- (0.0002) Therms 08 Therms 09 Therms 10 Therms 11 Therms 12
KwH 08 KwH 09 KwH 10 KwH 11 KwH 12
Total Company electricity metric decreased 25% since inception! Total Company gas metric decreased 7% since inception!
Total Company Nitrogen CCF Usage/LBS. Total Company Water Gallon Usage/LBS.
0.0070 0.0600
0.0060 0.0500
0.0050 0.0400
0.0040
0.0300
0.0030
0.0020 0.0200
0.0010 0.0100
- —
CCF 08 CCF 09 CCF 10 CCF 11 CCF 12 Gal 08 Gal 09 Gal 10 Gal 11 Gal 12
Total Company nitrogen metric decreased 34% since inception! Total Company water metric decreased 4% since inception!
FY 2012 Accomplishments
Fisher Baking—created a best in class integrated marketing program and gained tantial new distribution and market e
fisher Snack – stabilized distribution and improved unit volume sales per store per
Orchard Valley Harvest – refreshed brand age, product portfolio and positioning
Our Brands Over The Years
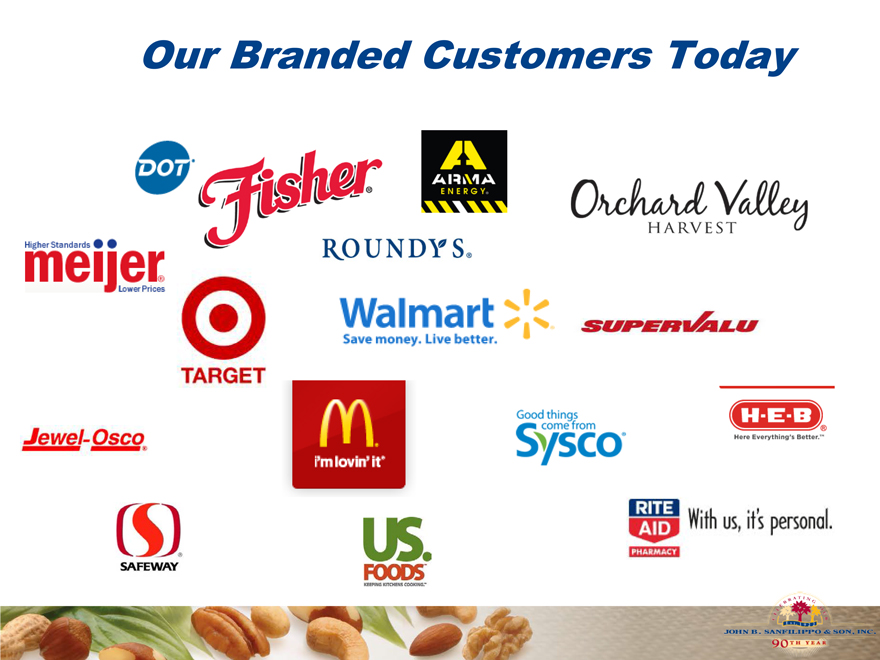
Our Branded Customers Today
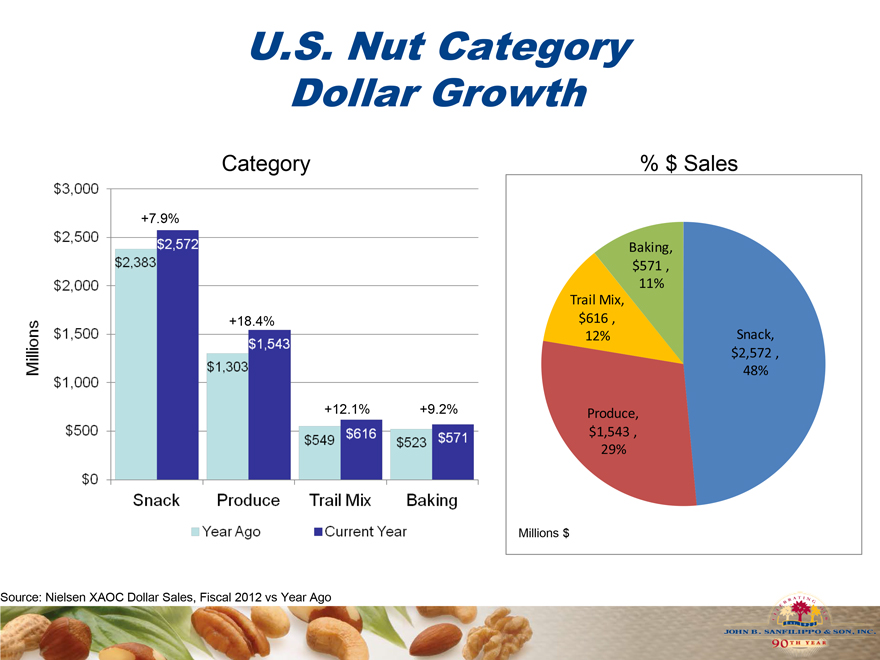
U.S. Nut Category Dollar Growth
Category
% $ Sales
Category
+7.9%
+18.4%
+12.1% +9.2%
Baking, $571 , 11% Trail Mix, $616 ,
12% Snack, $2,572 , 48%
Produce, $1,543 , 29%
Millions $
Source: Nielsen XAOC Dollar Sales, Fiscal 2012 vs Year Ago
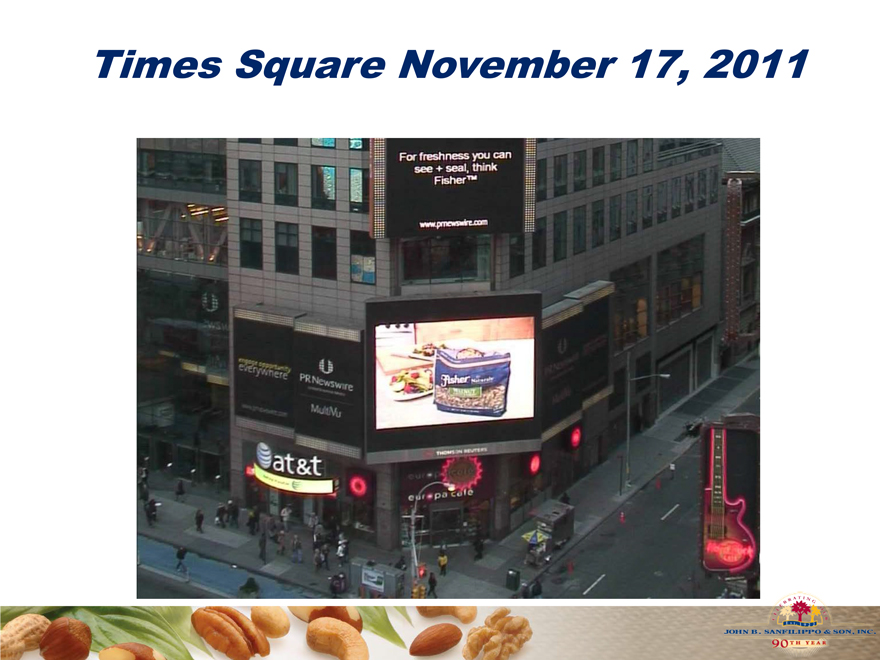
Times Square November 17, 2011
FY 2012 Accomplishments
Achieved 30% increase in Global Fisher Snack sales
Developed New Private Brand Snack platform for global retailer
Completed China Market Entry study with International Consulting Firm
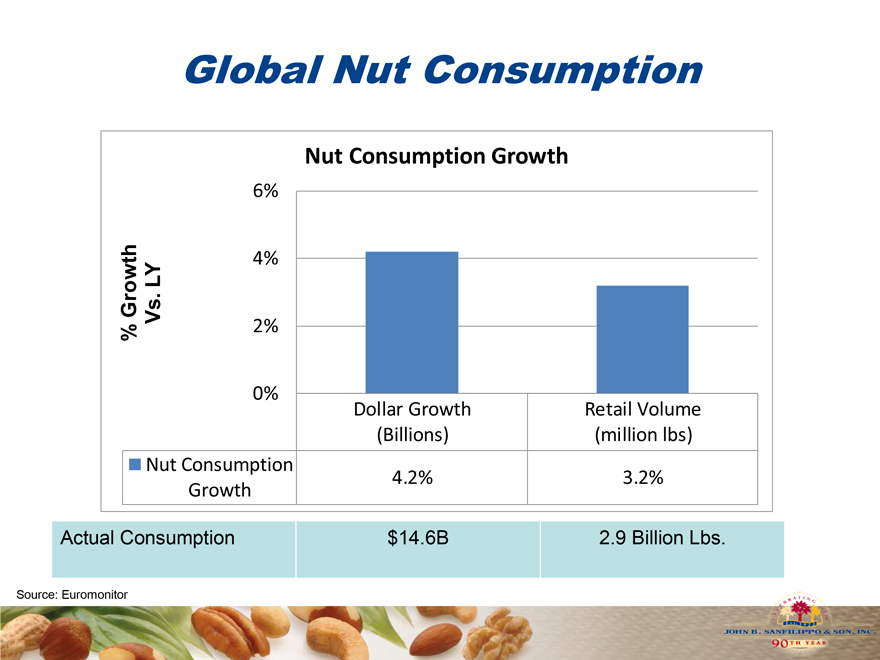
Global Nut Consumption
Nut Consumption Growth
% Growth Vs. LY
6% 4% 2% 0%
Nut Consumption Growth
4.2% 3.2%
$14.6B 2.9 Billion Lbs.
Actual Consumption
Source: Euromonitor
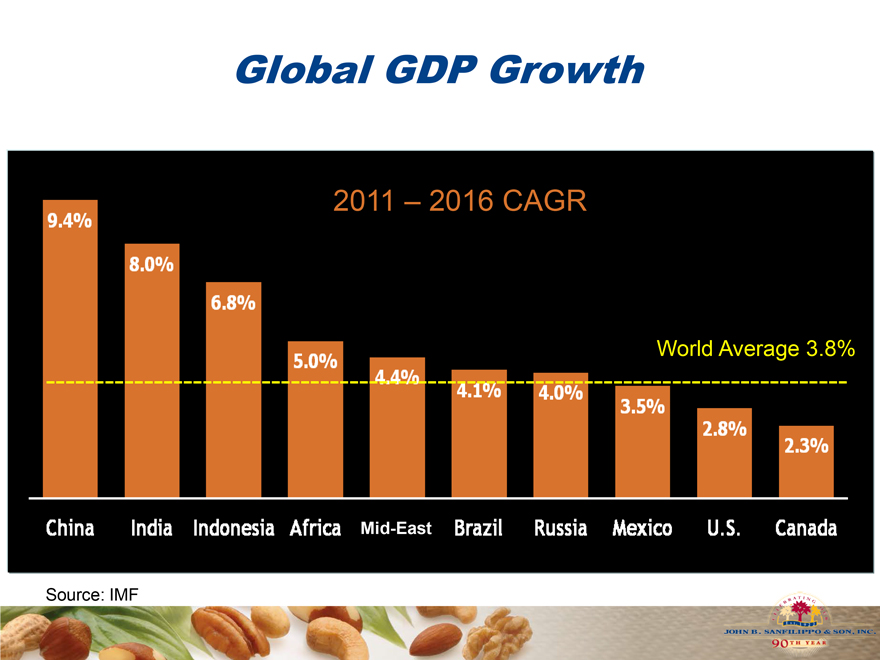
Global GDP Growth
2011 – 2016 CAGR
2011 – 2016 CAGR
2011 – 2016 CAGR
World Average 3.8%
Mid-East
World Average 3.8%
Source: IMF
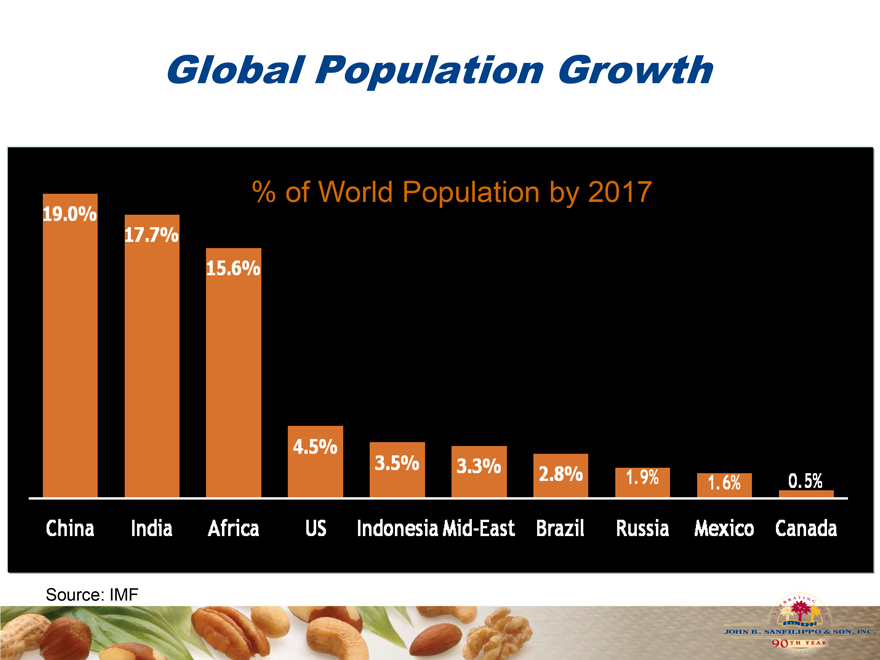
Global Population Growth
% of World Population by 2017
19.0%
17.7%
15.6%
4.5%
3.5%
3.3%
2.8%
1.9%
1.6%
0.5%
Source: IMF
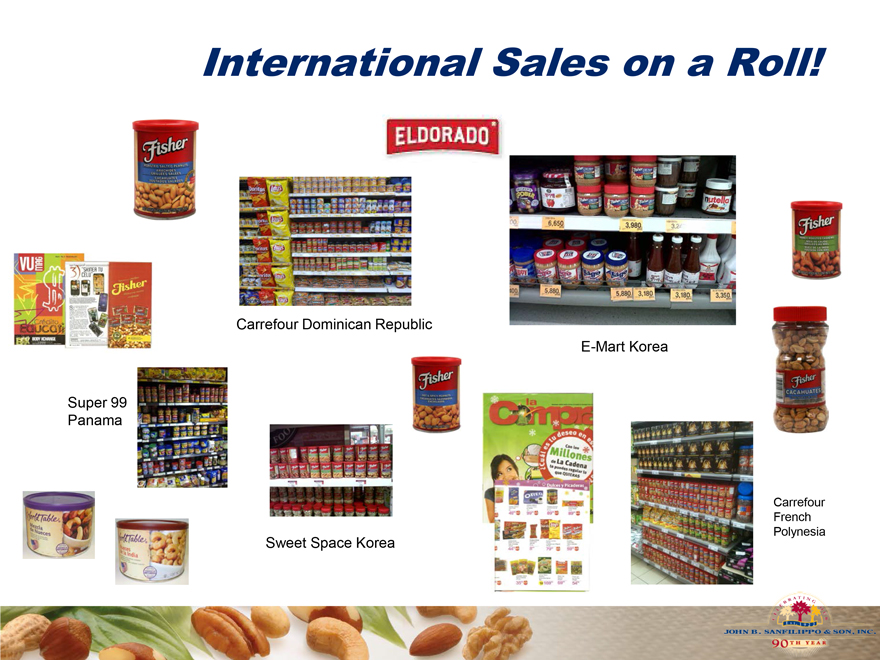
International Sales on a Roll!
Super 99 Panama
Carrefour Dominican Republic
E-Mart Korea
Sweet Space Korea
Carrefour French Polynesia
Fisher in China 2012
FY 2012
Financial Milestones
28
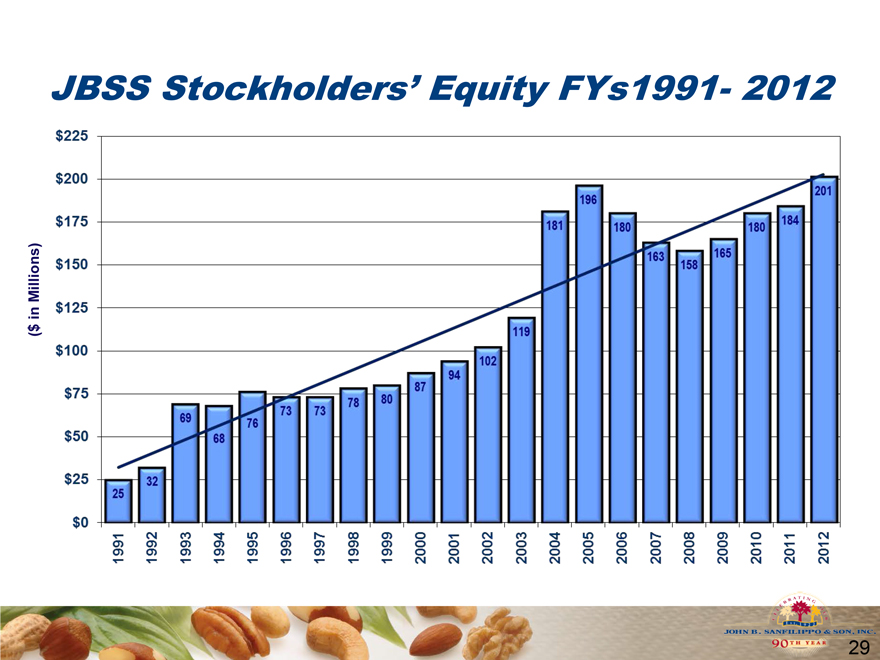
JBSS Stockholders’ Equity FYs1991- 2012
($ in Millions)
25 32 69 68 76 73 73 78 80 87 84 102 119 181 196 180 163 158 165 180 184 201
1991 1992 1993 1994 1995 1996 1997 1998 1999 2000 2001 2002 2003 2004 2005 2006 2007 2008 2009 2010 2011 2012
$225
$200
$175
$150
$125
$100
$75
$50
$25
$0
29
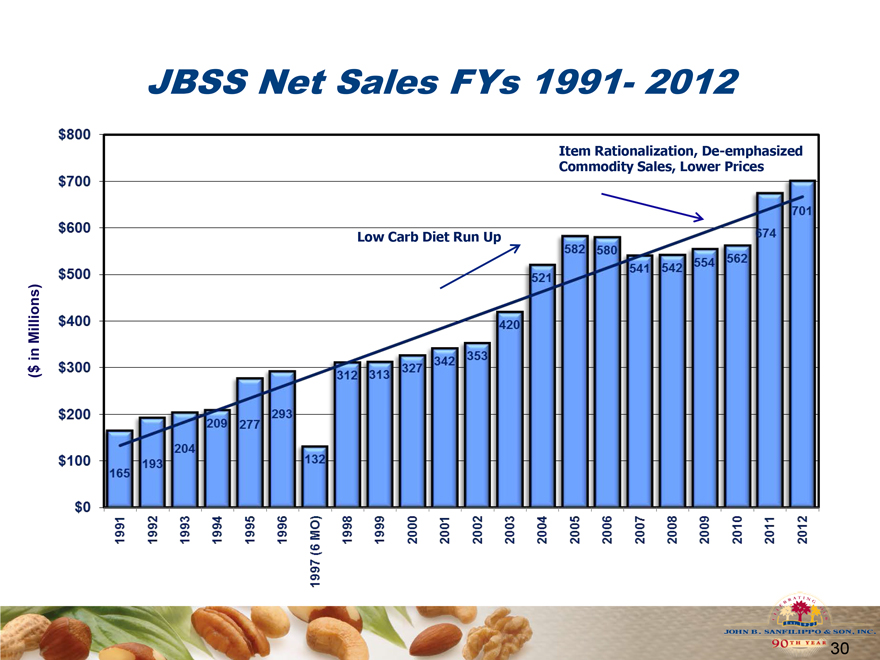
JBSS Net Sales FYs 1991- 2012
Low Carb Diet Run Up
Item Rationalization, De-emphasized Commodity Sales, Lower Prices
($ in Millions)
1991 1992 1993 1994 1995 1996 1997 1998 1999 2000 2001 2002 2003 2004 2005 2006 2007 2008 2009 2010 2011 2012
$800
$700
$600
$500
$400
$300
$200
$100
$0
165 193 204 209 277 293 132 312 313 327 342
353 420
521
582
580
541
542
554
562
674
701
6MO
30
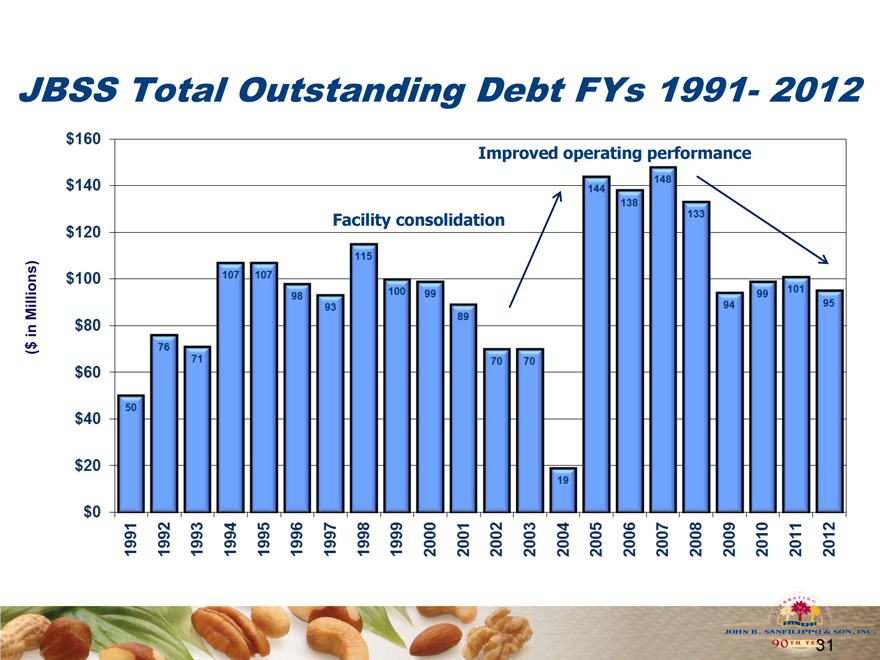
JBSS Total Outstanding Debt FYs 1991- 2012
Facility consolidation
Improved operating performance
1991 1992 1993 1994 1995 1996 1997 1998 1999 2000 2001 2002 2003 2004 2005 2006 2007 2008 2009 2010 2011 2012
$160
$140
$120
$100
$80
$60
$40
$20
$0
50
76
71
107
98
93
115
100
99
89
70
19
144
138
148
133
94
99
101
95
31
JBSS Total Outstanding Debt As % of Net Sales FYs 1991 – 2012
1991 1992 1993 1994 1995 1996 1997 1998 1999 2000 2001 2002 2003 2004 2005 2006 2007 2008 2009 2010 2011 2012
75.0%
70.0%
65.0%
60.0%
55.0%
50.0%
45.0%
40.0%
35.0%
30.0%
25.0%
20.0%
15.0%
5.0%
0%
32
EBITDA
EBITDA consists of earnings before interest, taxes, depreciation,
amortization and noncontrolling interest. EBITDA is not a measurement
of financial performance under accounting principles generally accepted
in the United States of America (“GAAP”), and does not represent cash
flow from operations. EBITDA is presented solely as a supplemental
disclosure because management believes that it is important in
evaluating JBSS’s financial performance and market
valuation. In conformity with Regulation G, a reconciliation of EBITDA to
the most directly comparable financial measures calculated and
presented in accordance with GAAP is presented in the following slide.
33
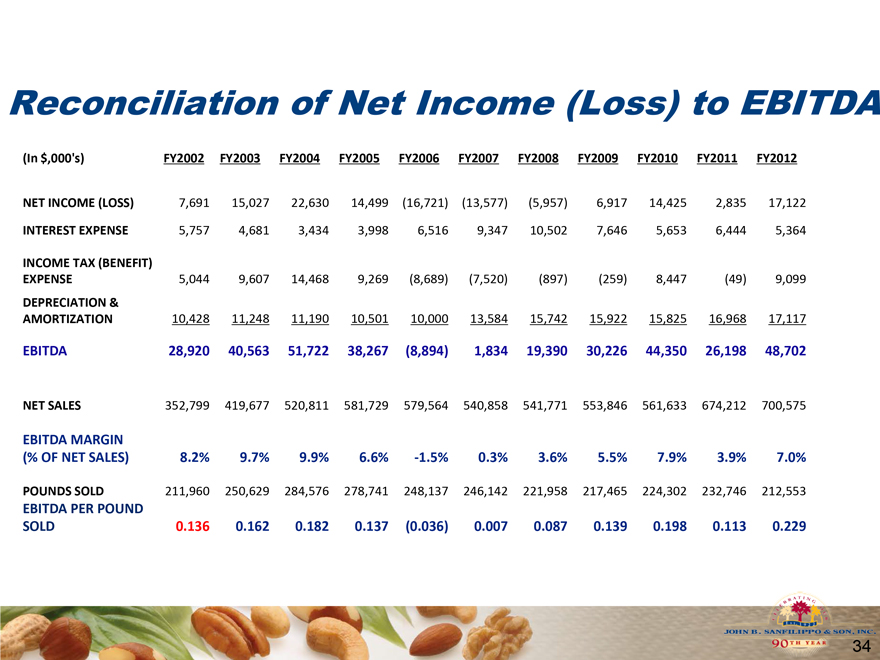
Reconciliation of Net Income (Loss) to EBITDA
(In $,000’s) FY2002 FY2003 FY2004 FY2005 FY2006 FY2007 FY2008 FY2009 FY2010 FY2011 FY2012
NET INCOME (LOSS) 7,691 15,027 22,630 14,499 (16,721) (13,577) (5,957) 6,917 14,425 2,835 17,122
INTEREST EXPENSE 5,757 4,681 3,434 3,998 6,516 9,347 10,502 7,646 5,653 6,444 5,364
INCOME TAX (BENEFIT)
EXPENSE 5,044 9,607 14,468 9,269 (8,689) (7,520) (897) (259) 8,447 (49) 9,099
DEPRECIATION &
AMORTIZATION 10,428 11,248 11,190 10,501 10,000 13,584 15,742 15,922 15,825 16,968 17,117
EBITDA 28,920 40,563 51,722 38,267 (8,894) 1,834 19,390 30,226 44,350 26,198 48,702
NET SALES 352,799 419,677 520,811 581,729 579,564 540,858 541,771 553,846 561,633 674,212 700,575
EBITDA MARGIN
(% OF NET SALES) 8.2% 9.7% 9.9% 6.6% -1.5% 0.3% 3.6% 5.5% 7.9% 3.9% 7.0%
POUNDS SOLD 211,960 250,629 284,576 278,741 248,137 246,142 221,958 217,465 224,302 232,746 212,553
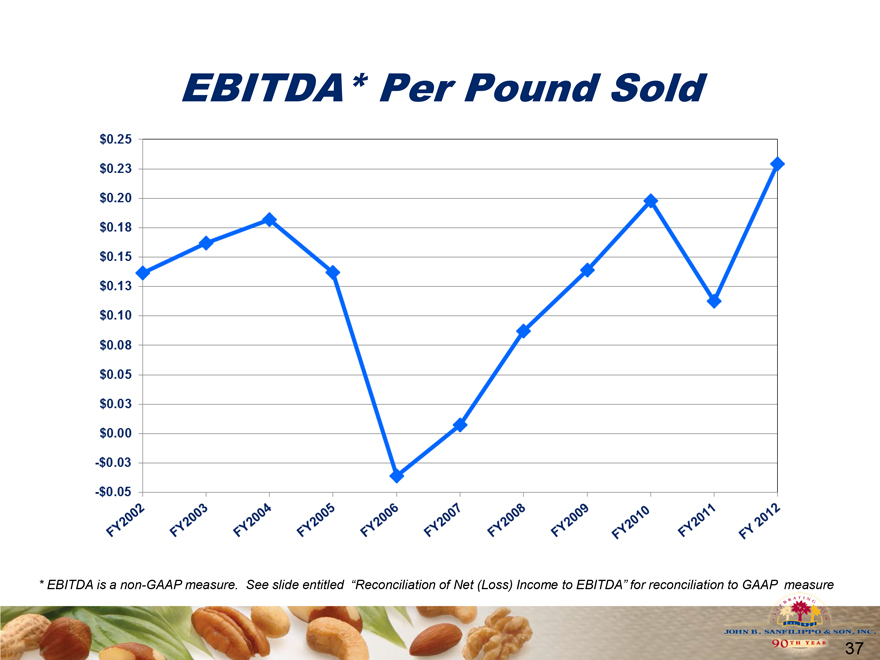
EBITDA PER POUND
SOLD 0.136 0.162 0.182 0.137 (0.036) 0.007 0.087 0.139 0.198 0.113 0.229
34
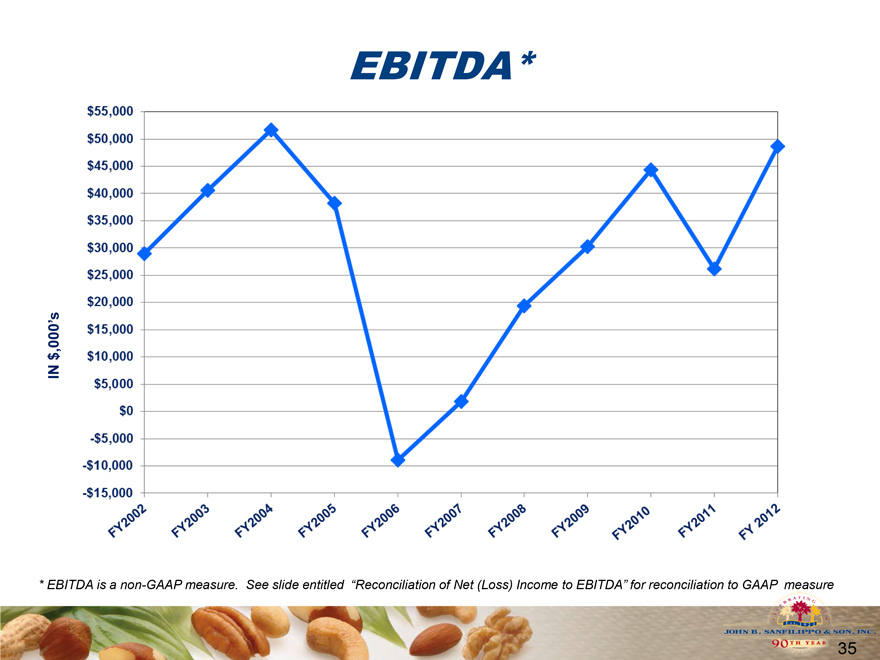
EBITDA*
IN $,000’s
* EBITDA is a non-GAAP measure. See slide entitled “Reconciliation of Net (Loss) Income to EBITDA” for reconciliation to GAAP measure
FY2002
FY2003
FY2004
FY2005
FY2006
FY2007
FY2008
FY2009
FY2010
FY2011
FY2012
35
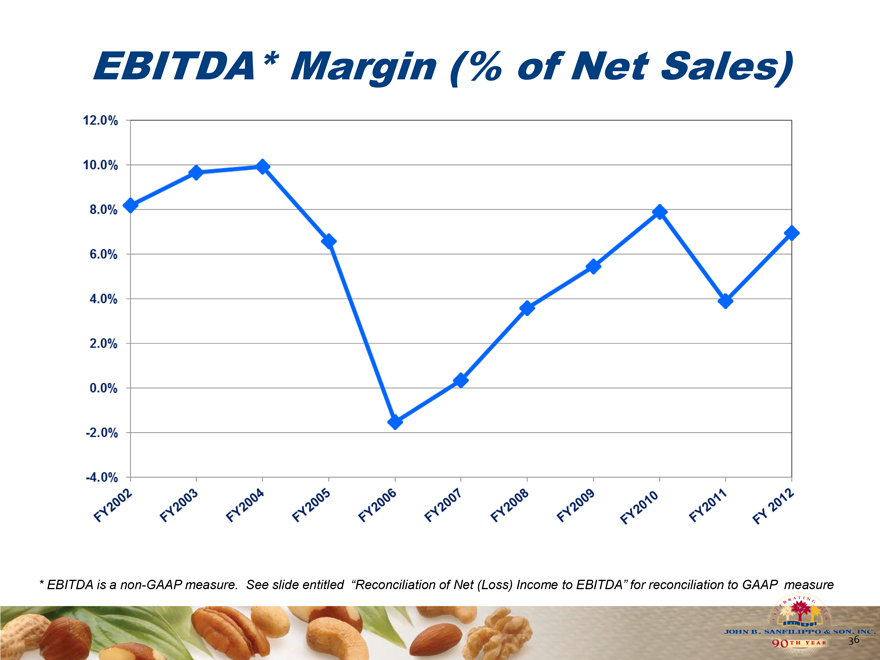
EBITDA* Margin (% of Net Sales)
* EBITDA is a non-GAAP measure. See slide entitled “Reconciliation of Net (Loss) Income to EBITDA” for reconciliation to GAAP measure
FY2002
FY2003
FY2004
FY2005
FY2006
FY2007
FY2008
FY2009
FY2010
FY2011
FY2012
12.0%
10.0%
8.0%
4.0%
2.0%
0%
-2.0%
-4.0%
36
EBITDA* Per Pound Sold
FY2002
FY2003
FY2004
FY2005
FY2006
FY2007
FY2008
FY2009
FY2010
FY2011
FY2012
* EBITDA is a non-GAAP measure. See slide entitled “Reconciliation of Net (Loss) Income to EBITDA” for reconciliation to GAAP measure
37
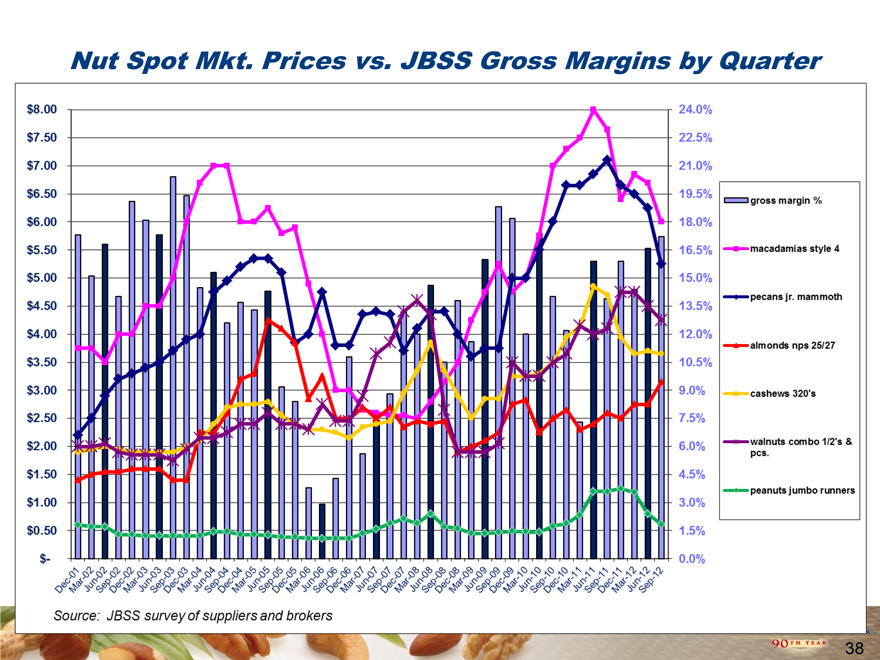
Nut Spot Mkt. Prices vs. JBSS Gross Margins by Quarter
$8.00%
$7.50%
$7.00%
$6.50%
$6.00%
$5.50%
$5.00%
$4.50%
$4.00%
$3.50%
$3.00%
$2.50%
$2.00%
$1.50%
$1.00%
$0.50%
24.0%
22.5%
21.0%
19.5%
18.0%
16.5%
15.0%
13.5%
12.0%
10.5%
9.0%
7.5%
6.0%
4.5%
3.0%
1.5%
1.5%
0.0%
38
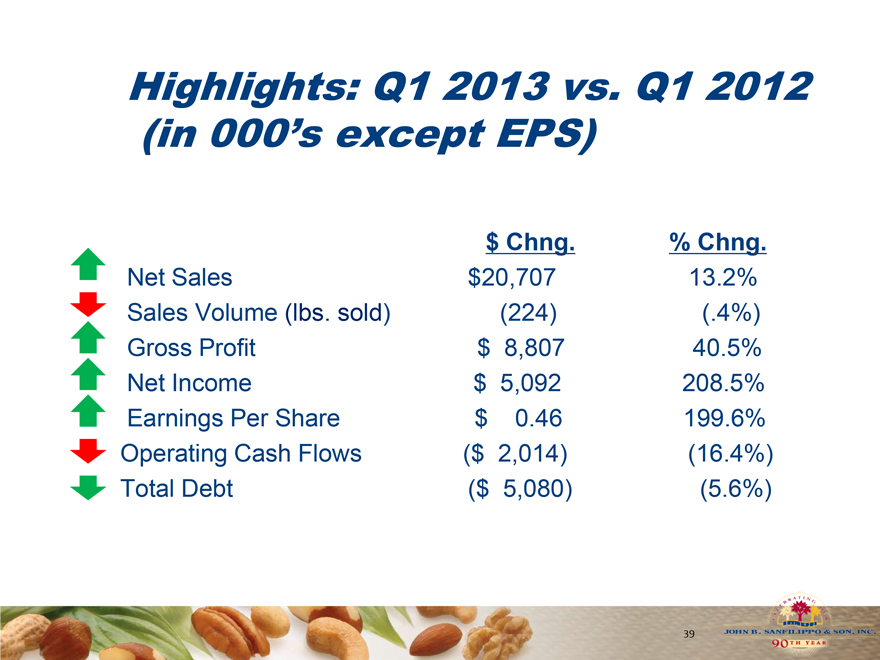
Highlights: Q1 2013 vs. Q1 2012
(in 000’s except EPS)
$ Chng. % Chng.
Net Sales $20,707 13.2%
Sales Volume (lbs. sold) (224) (.4%)
Gross Profit $ 8,807 40.5%
Net Income $ 5,092 208.5%
Earnings Per Share $ 0.46 199.6%
Operating Cash Flows ($ 2,014) (16.4%)
Total Debt ($ 5,080) (5.6%)
39
Sales & Marketing Update
40
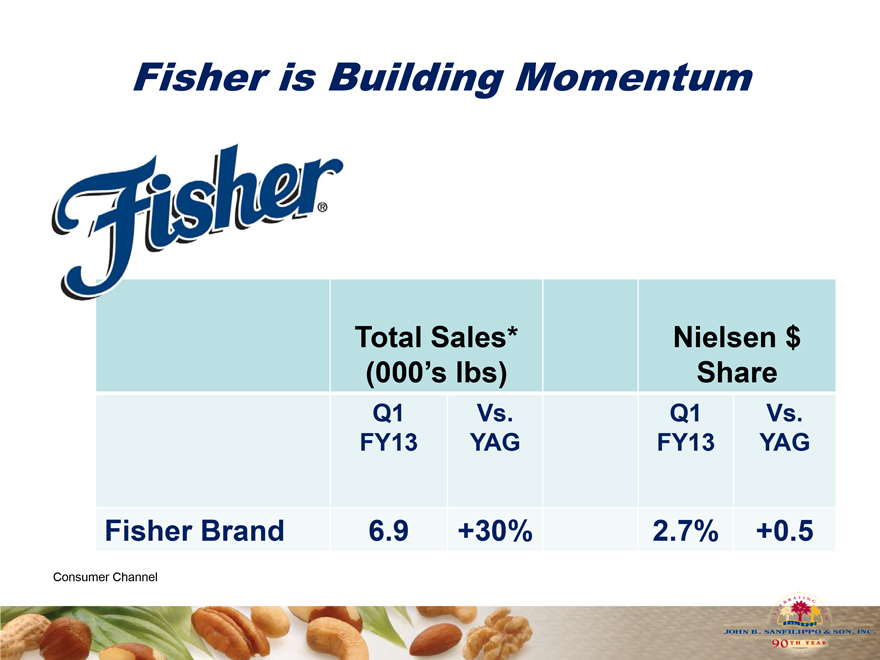
Fisher is Building Momentum
Total Sales* Nielsen $
(000’s lbs) Share
Q1 Vs. Q1 Vs.
FY13 YAG FY13 YAG
Fisher Brand 6.9 +30% 2.7% +0.5
Consumer Channel
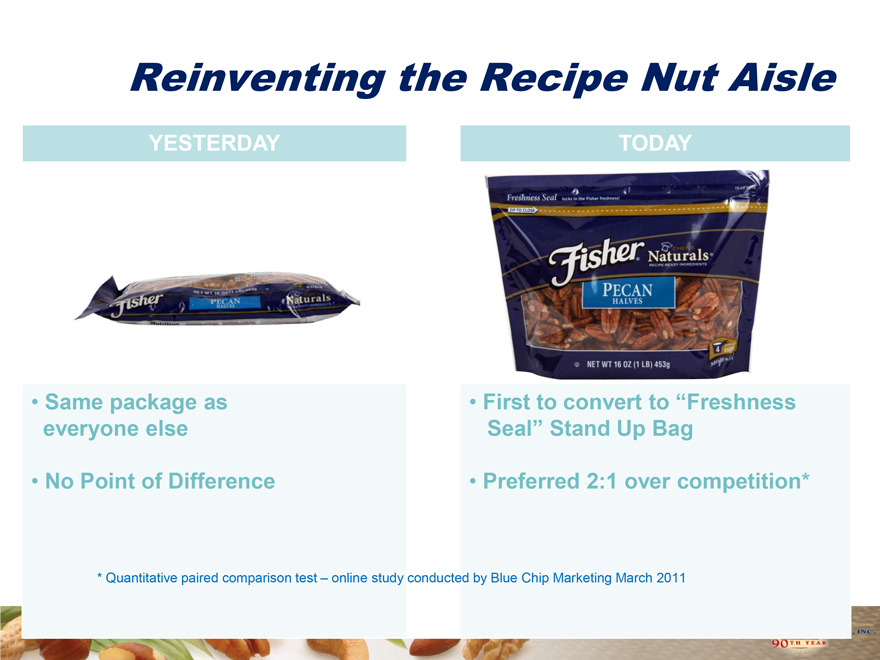
Reinventing the Recipe Nut Aisle
YESTERDAY TODAY
Same package as everyone else
No Point of Difference
First to convert to “Freshness Seal” Stand Up Bag
Preferred 2:1 over competition*
* | | Quantitative paired comparison test – online study conducted by Blue Chip Marketing March 2011 |
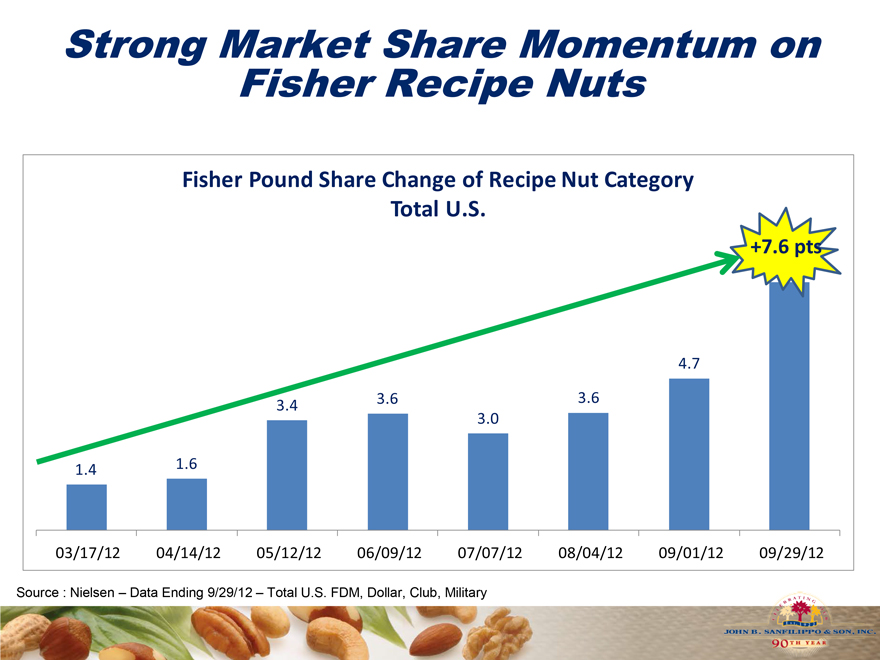
Strong Market Share Momentum on Fisher Recipe Nuts
Fisher Pound Share Change of Recipe Nut Category Total U.S.
4.7
3.4 3.6 3.6
3.0
1.4 1.6
03/17/12 04/14/12 05/12/12 06/09/12 07/07/12 08/04/12 09/01/12 09/29/12
Source : Nielsen – Data Ending 9/29/12 – Total U.S. FDM, Dollar, Club, Military
Supporting Fisher with Strong Branding Campaign
Custom TV vignettes Alex Guarnaschelli
Food Network Magazine
FoodNetwork.com
Vignettes will be featured on Food Network TV and Cooking Channel TV
Holiday Vignettes
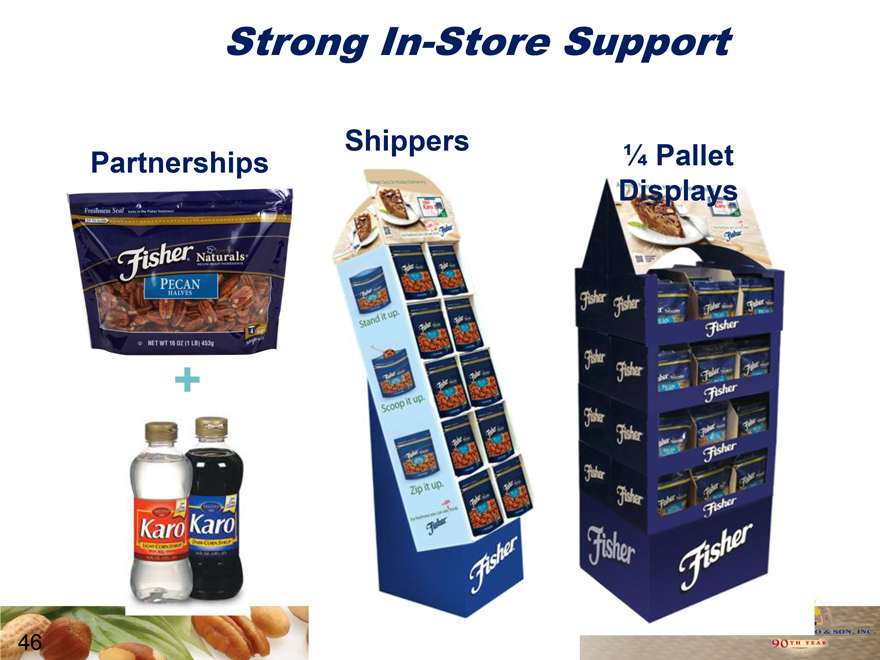
Strong In-Store Support
Partnerships
Shippers
1/4 Pallet Displays
46
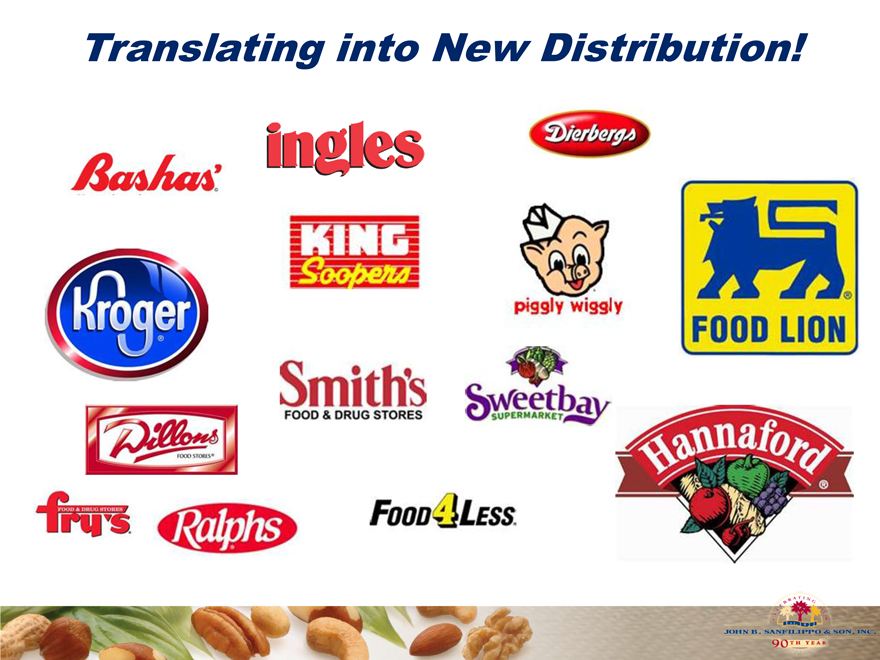
Translating into New Distribution!
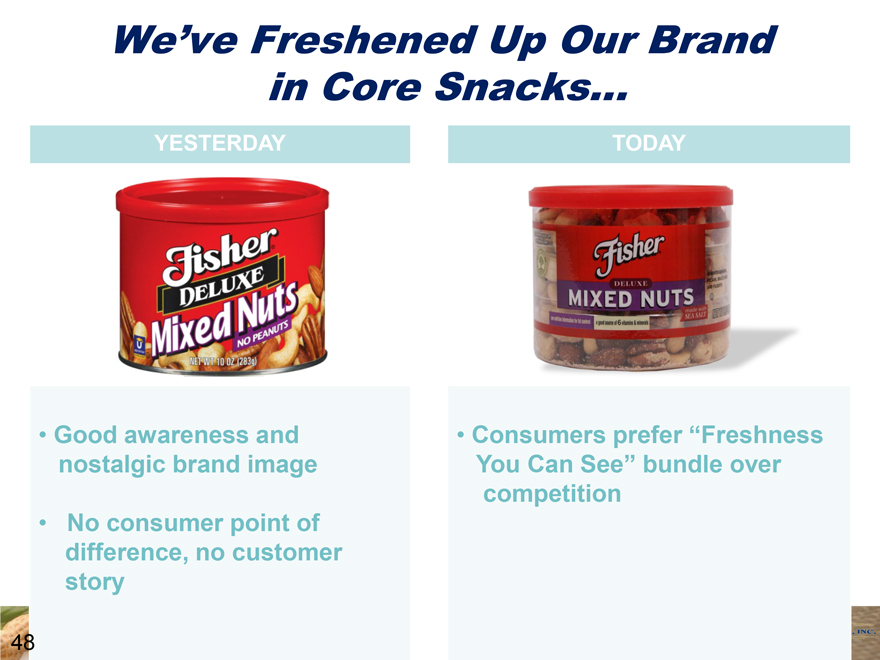
We’ve Freshened Up Our Brand in Core Snacks…
YESTERDAY TODAY
Good awareness and nostalgic brand image
No consumer point of difference, no customer story
• Consumers prefer “Freshness You Can See” bundle over competition
48
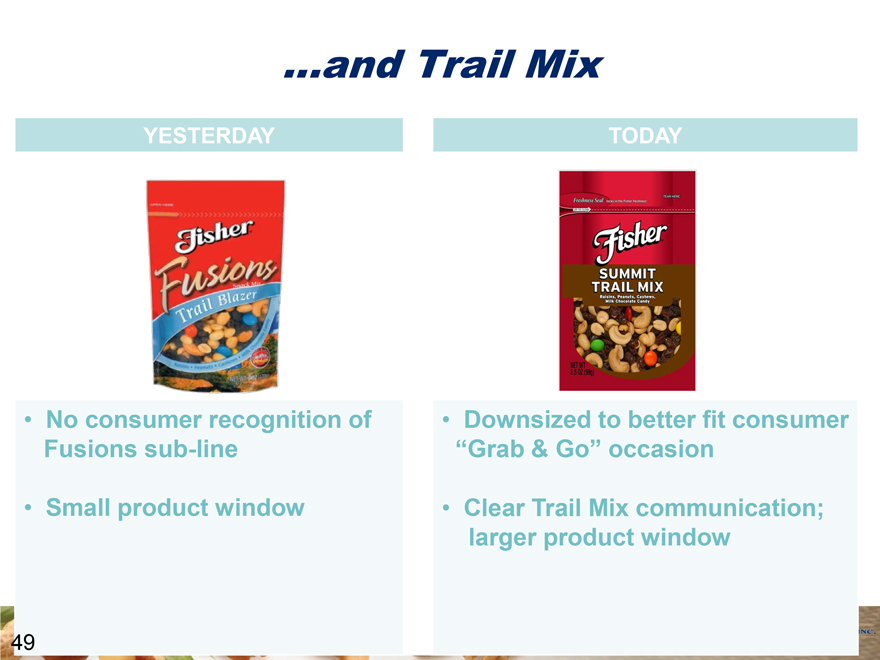
…and Trail Mix
YESTERDAY TODAY
No consumer recognition of Fusions sub-line
Small product window
Downsized to better fit consumer “Grab & Go” occasion
Clear Trail Mix communication; larger product window
49
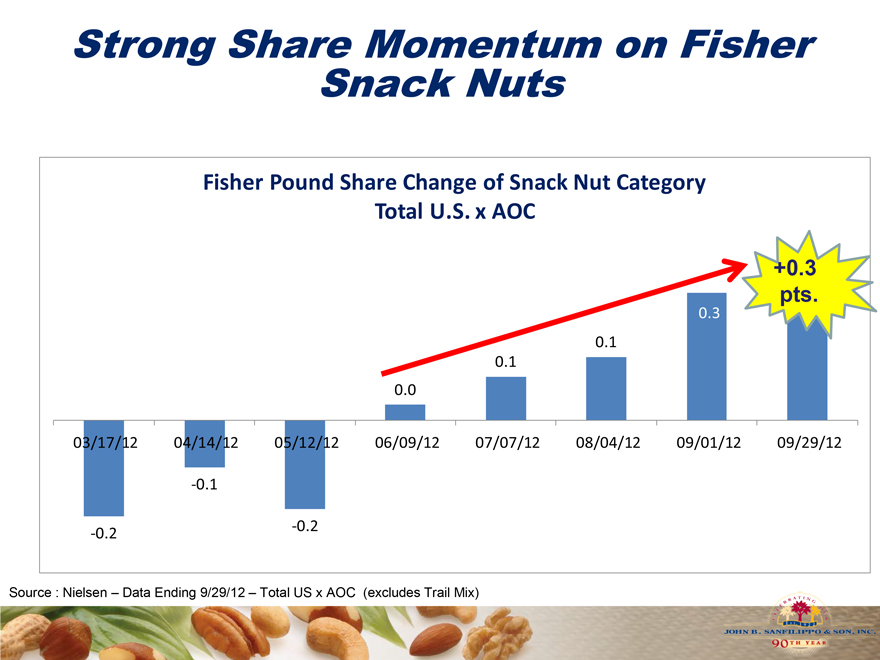
Strong Share Momentum on Fisher Snack Nuts
Fisher Pound Share Change of Snack Nut Category Total U.S. x AOC
+0.3 pts.
0.3 pts.
0.1
0.1
0.0
03/17/12 04/14/12 05/12/12 06/09/12 07/07/12 08/04/12 09/01/12 09/29/12
-0.1
-0.2 -0.2
Source : Nielsen – Data Ending 9/29/12 – Total US x AOC (excludes Trail Mix)
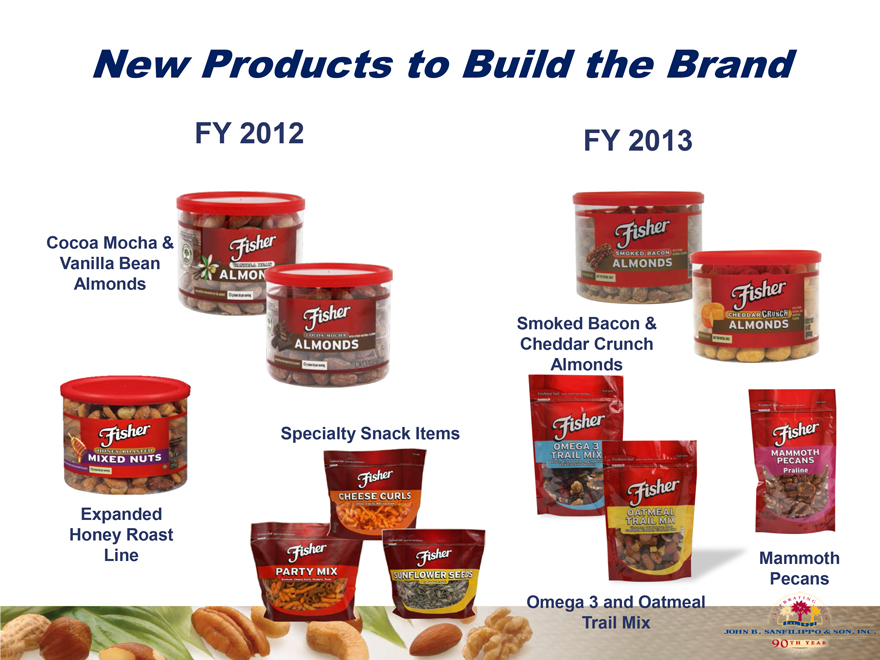
New Products to Build the Brand
FY 2012 FY 2013
Cocoa Mocha & Vanilla Bean Almonds
Specialty Snack Items
Smoked Bacon & Cheddar Crunch Almonds
Expanded Honey Roast Line
Omega 3 and Oatmeal Trail Mix
Mammoth Pecans
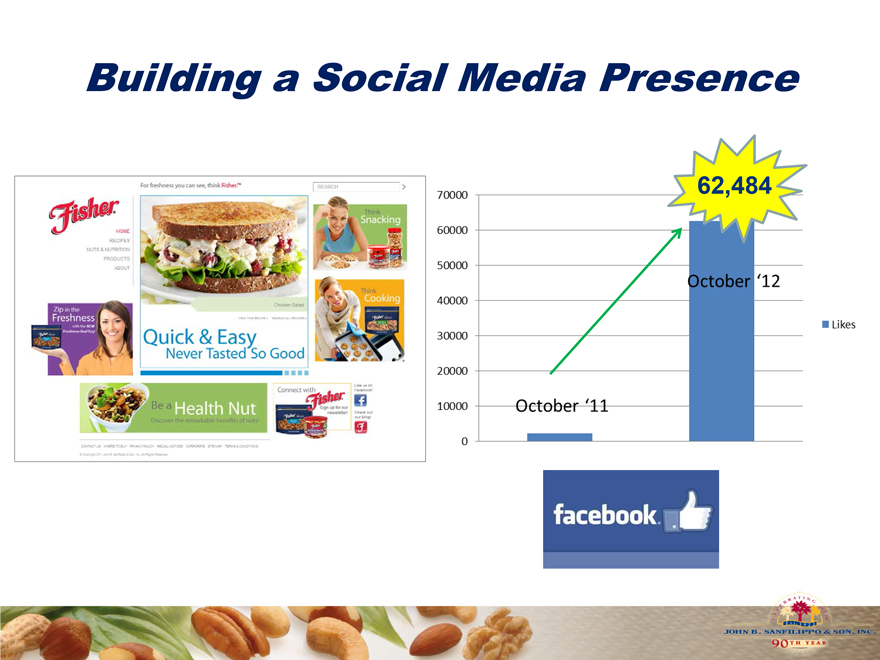
Building a Social Media Presence
62,484
October ‘11 October ‘12
70000
60000
50000
40000
30000
20000
10000
0
Likes
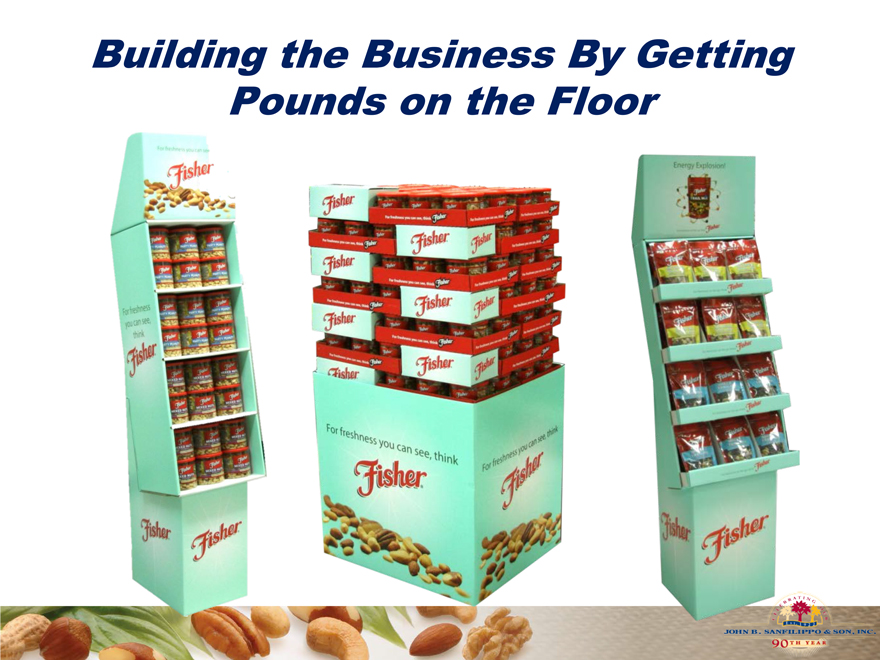
Building the Business By Getting Pounds on the Floor
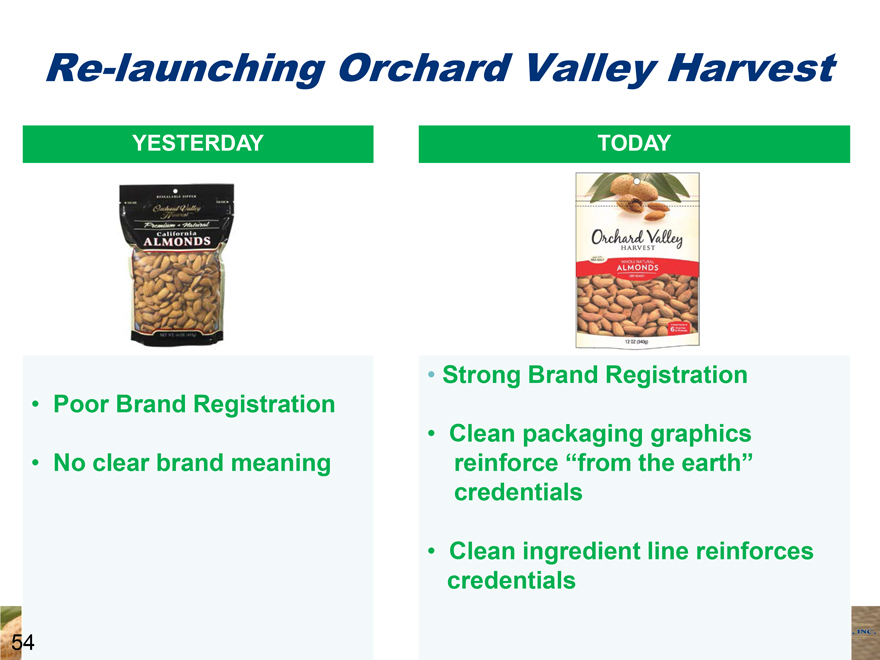
Re-launching Orchard Valley Harvest
YESTERDAY TODAY
Poor Brand Registration
No clear brand meaning
Strong Brand Registration
Clean packaging graphics reinforce “from the earth” credentials
Clean ingredient line reinforces credentials
54
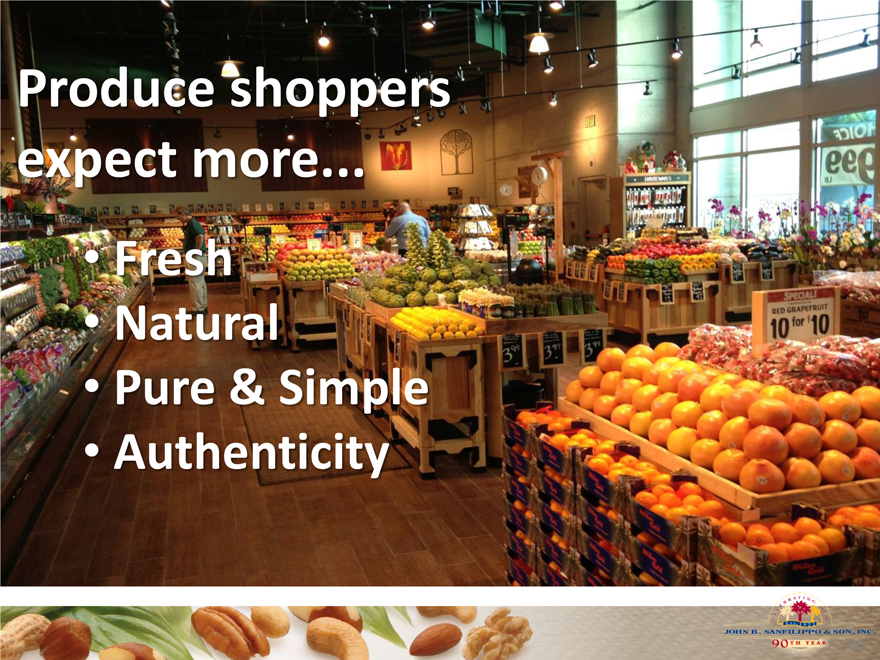
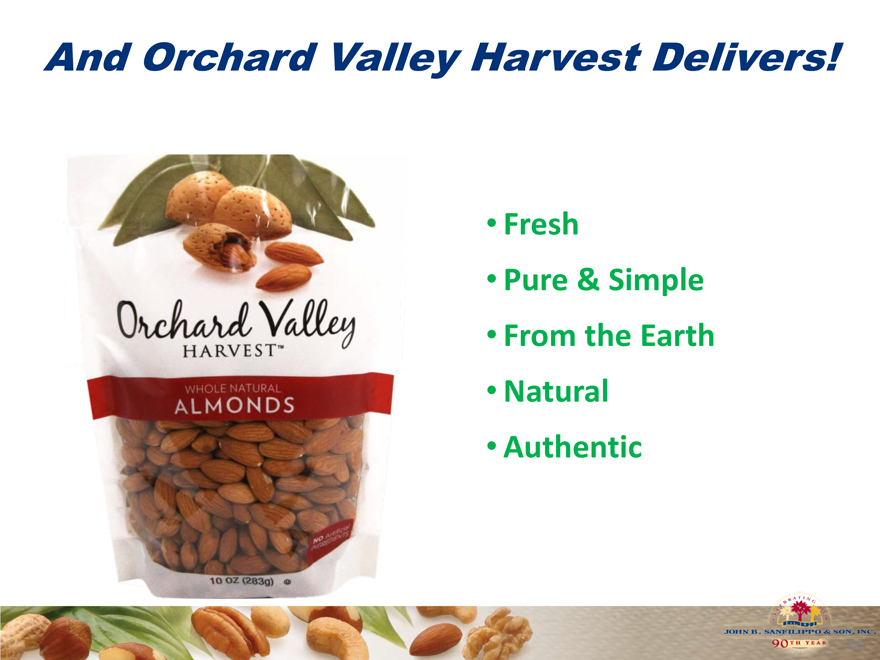
Produce shoppers expect more
• Fresh
• Natural
• Pure & Simple
• Authenticity
And Orchard Valley Harvest Delivers!
Fresh
Pure & Simple
From the Earth
Natural
Authentic
Integrated Program to Build the Brand
Right Brand Win In-Store Products Building
Closing Comments
58
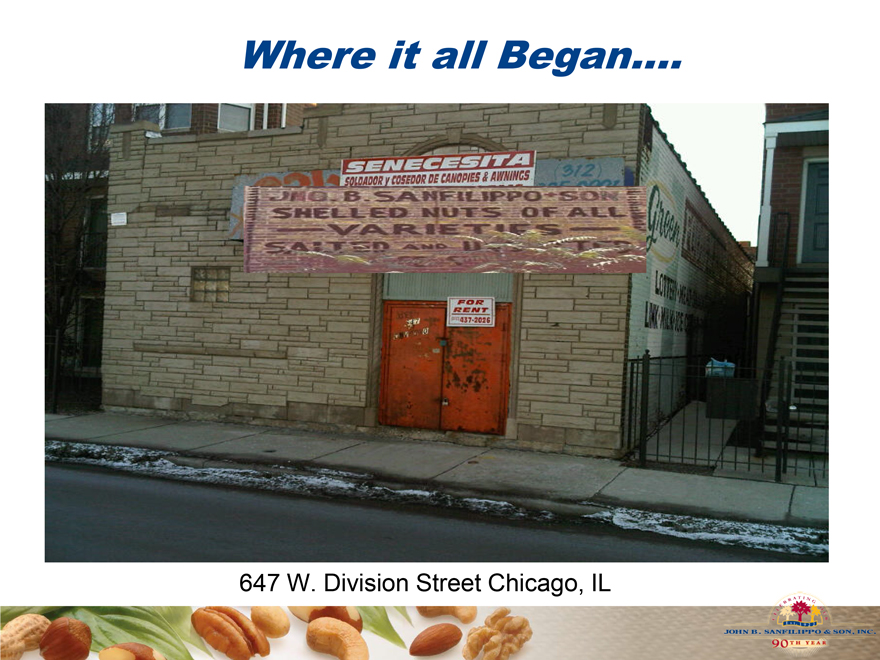
Where it all Began….
647 W. Division Street Chicago, IL
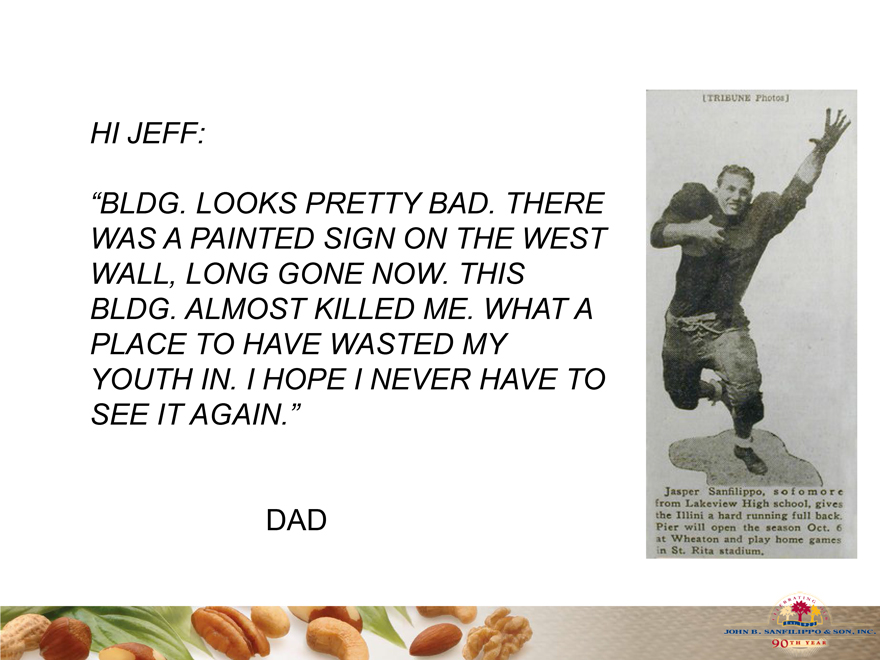
HI JEFF:
“BLDG. LOOKS PRETTY BAD. THERE WAS A PAINTED SIGN ON THE WEST WALL, LONG GONE NOW. THIS BLDG. ALMOST KILLED ME. WHAT A PLACE TO HAVE WASTED MY YOUTH IN. I HOPE I NEVER HAVE TO SEE IT AGAIN.”
DAD
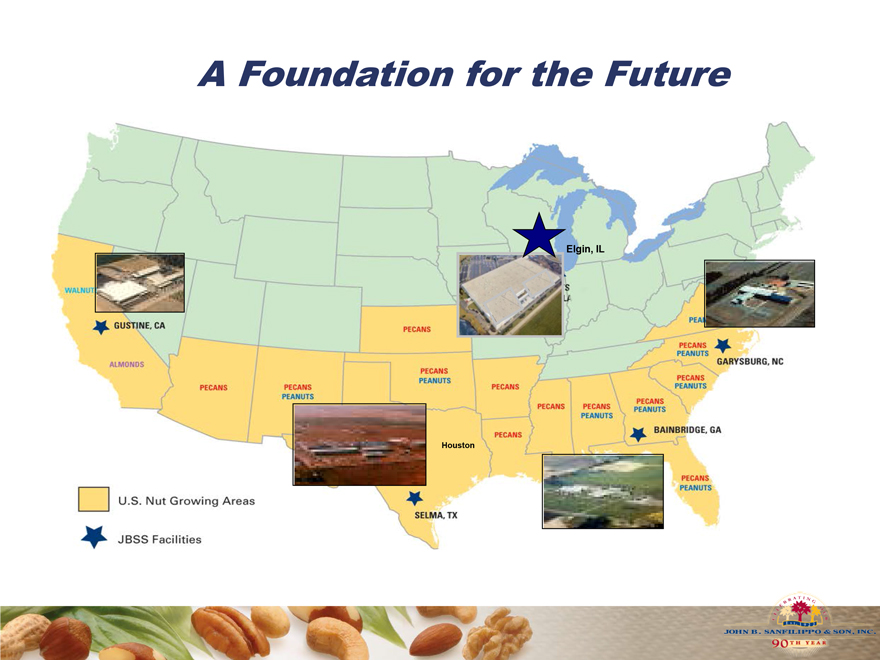
A Foundation for the Future
Elgin, IL
Houston
GARYSBURG, NC
BAINBRIDGE, GA
PECANS PEANUTS
SELMA, TX
GUSTINE, CA
ALMOMONDS
Wallnut
Pecans
U.S Nut Growing Areas
JBSS Facilities
THANK YOU