 SOUTHWEST IDEAS INVESTOR CONFERENCE November 20, 2014 Exhibit 99.1 |
 Forward-Looking Statements Some of the statements in this presentation constitute “forward-looking statements” about John B. Sanfilippo & Son, Inc. Such statements include, in particular, statements about our plans, strategies, business prospects, changes and trends in our business and the markets in which we operate. In some cases, you can identify forward-looking statements by the use of words such as “may,” “will,” “could,” “would,” “should,” “expect,” “plan,” “anticipate,” “intend,” “believe,” “estimate,” “forecast,” “predict,” “propose,” “potential” or “continue” or the negative of those terms or other comparable terminology. These statements represent our present expectations or beliefs concerning future events and are not guarantees. Such statements speak only as of the date they are made, and we do not undertake any obligation to update any forward-looking statement. We caution that forward-looking statements are qualified by important factors, risks and uncertainties that could cause actual results to differ materially from those in the forward- looking statements. Our periodic reports filed with the Securities and Exchange Commission, including our Forms 10-K and 10-Q and any amendments thereto, describe some of these factors, risks and uncertainties. 2 |
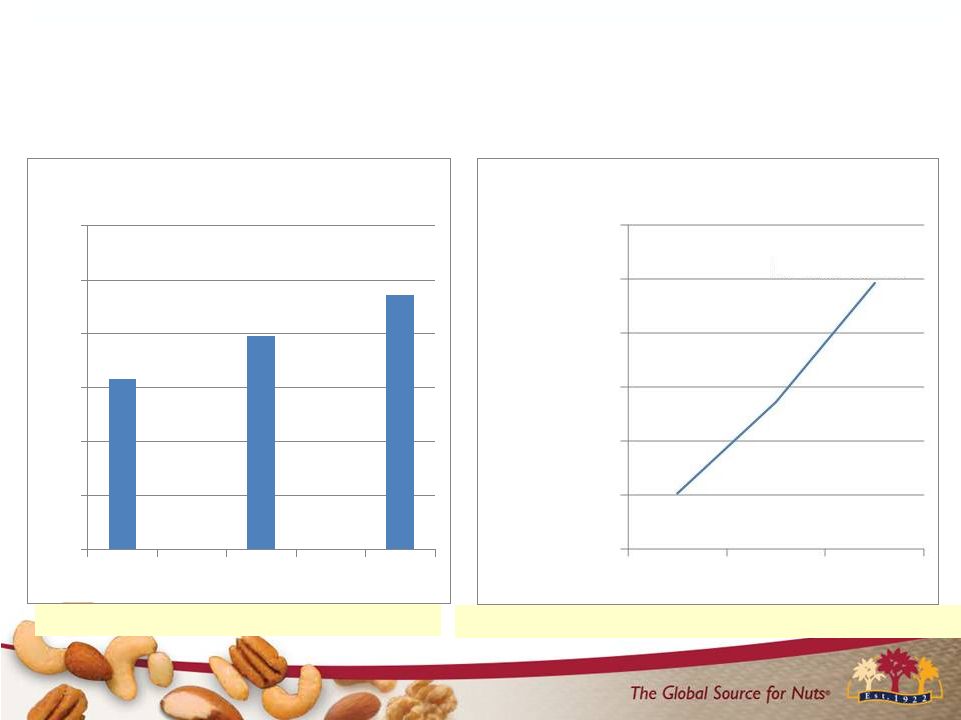 Diluted EPS Improvement of 49% Time to Celebrate Successful Results over the last three years 3 0 0.5 1 1.5 2 2.5 3 FY12 FY13 FY14 EPS FY 12-FY 14 680,000,000 700,000,000 720,000,000 740,000,000 760,000,000 780,000,000 800,000,000 FY12 FY13 FY14 Net Sales FY 12 -FY 14 $778,622,000 Net Sales increased by 11% to a record $778.6 million |
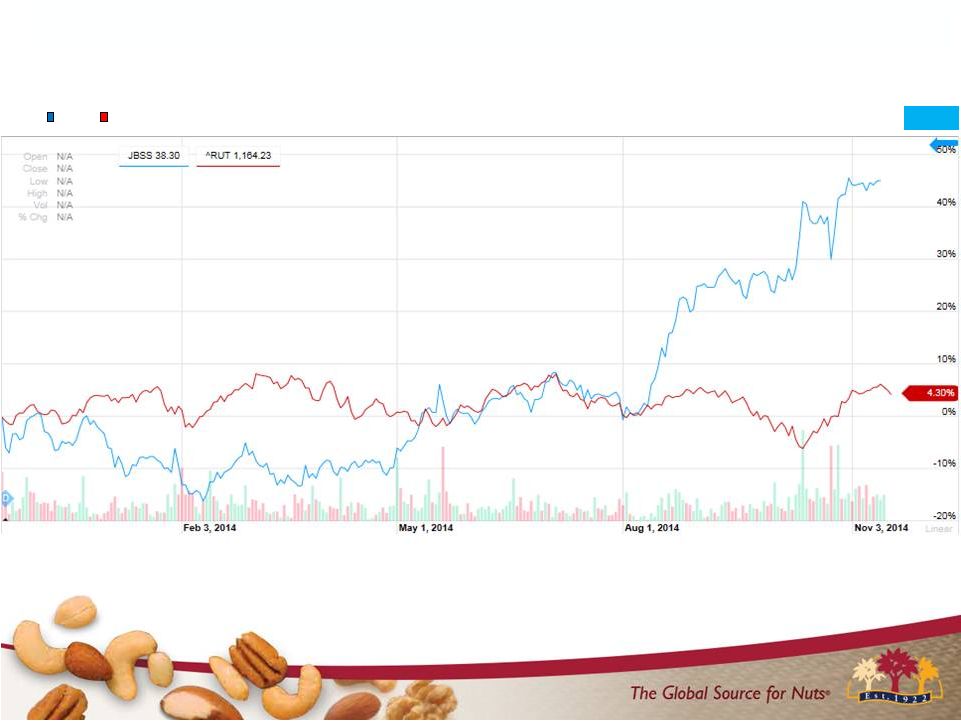 Creating Shareholder Value JBSS Russell 2000 Outperformed the Russell 2000 Index by over 55%! 4 Stock Price $23.99 11/15/2013 Stock Price $38.30 11/17/2014 59.65% |
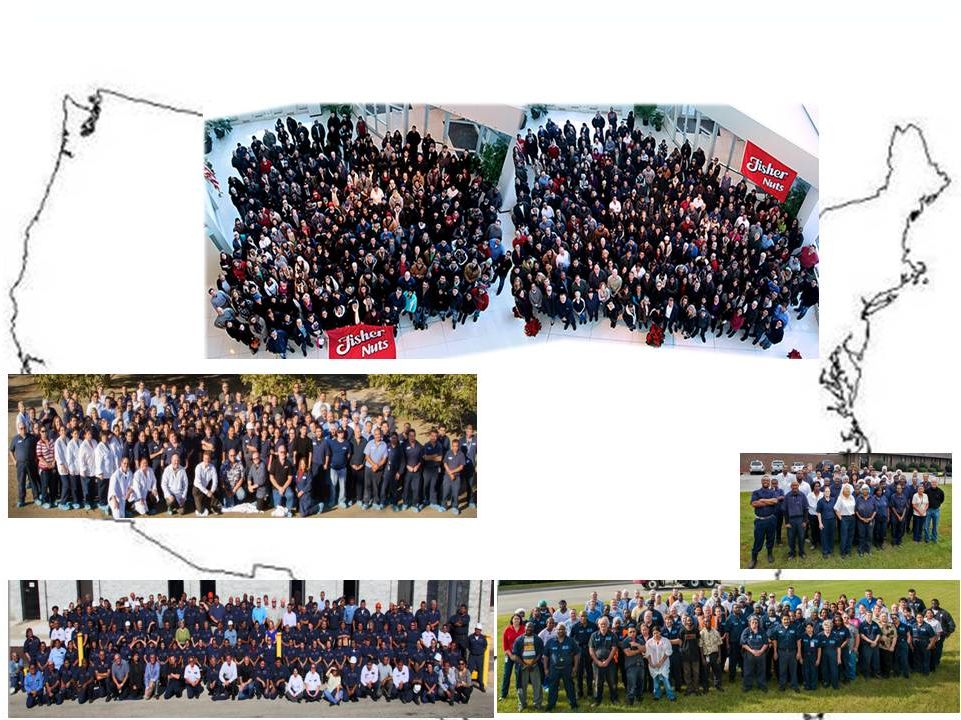 “The success of any company is contingent upon having a strong team to manage and grow the business. We have that here at JBSS.” Gustine, CA 130 Employees Garysburg, NC 38 Employees Bainbridge, GA 102 Employees Selma, TX 167 Employees Elgin, IL 857 Employees |
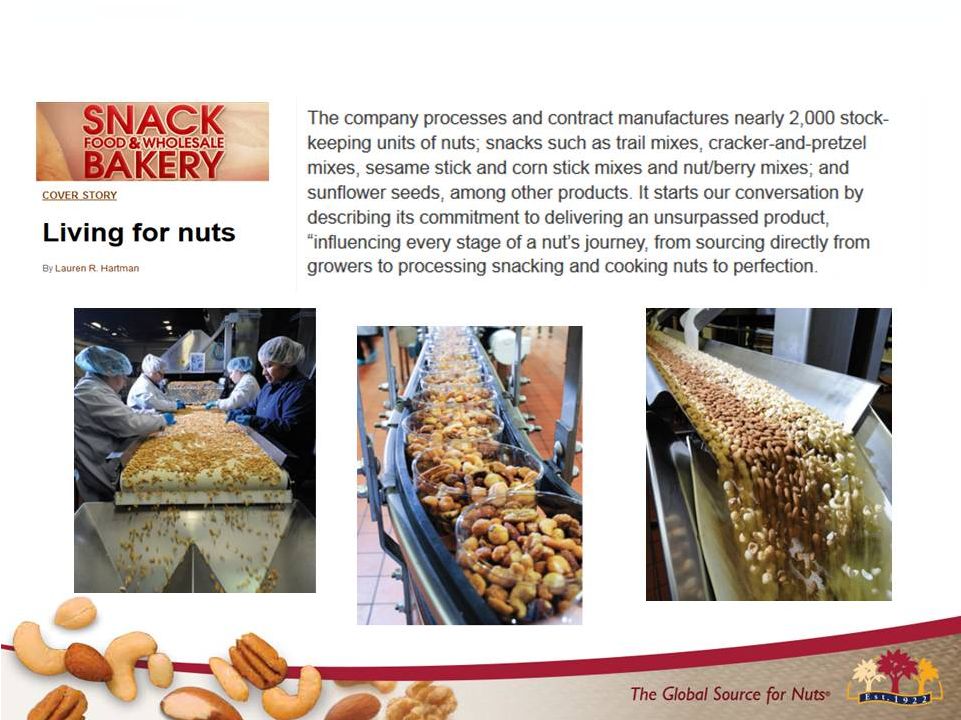 6 John B. Sanfilippo & Son, Inc.: Transformed Consumer Products Company … Reproduced with permission of Snack Food & Wholesale Bakery magazine |
 Nut Category Trends 7 |
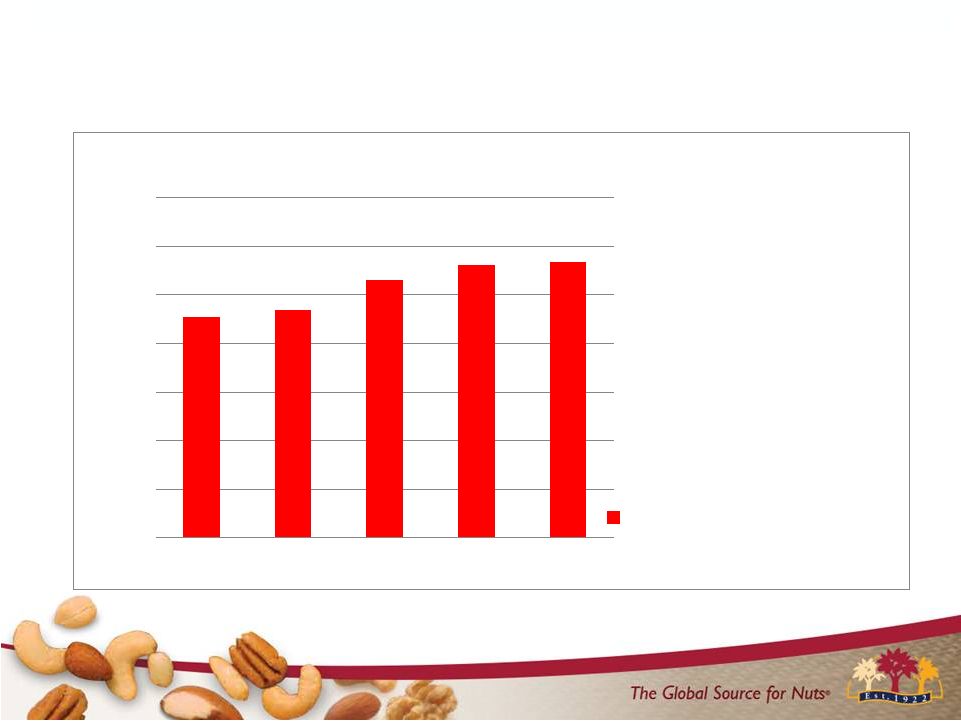 $4.53 $4.70 $5.31 $5.62 $5.68 $0.00 $1.00 $2.00 $3.00 $4.00 $5.00 $6.00 $7.00 FY 2010 FY 2011 FY 2012 FY 2013 FY 2014 Price Per Pound Price Per Pound Category Retail Prices Higher Over the Last 5 Years 8 Source: IRI: Total Nut Category – Multi Outlet Geography –Year Ending 6/29/14 |
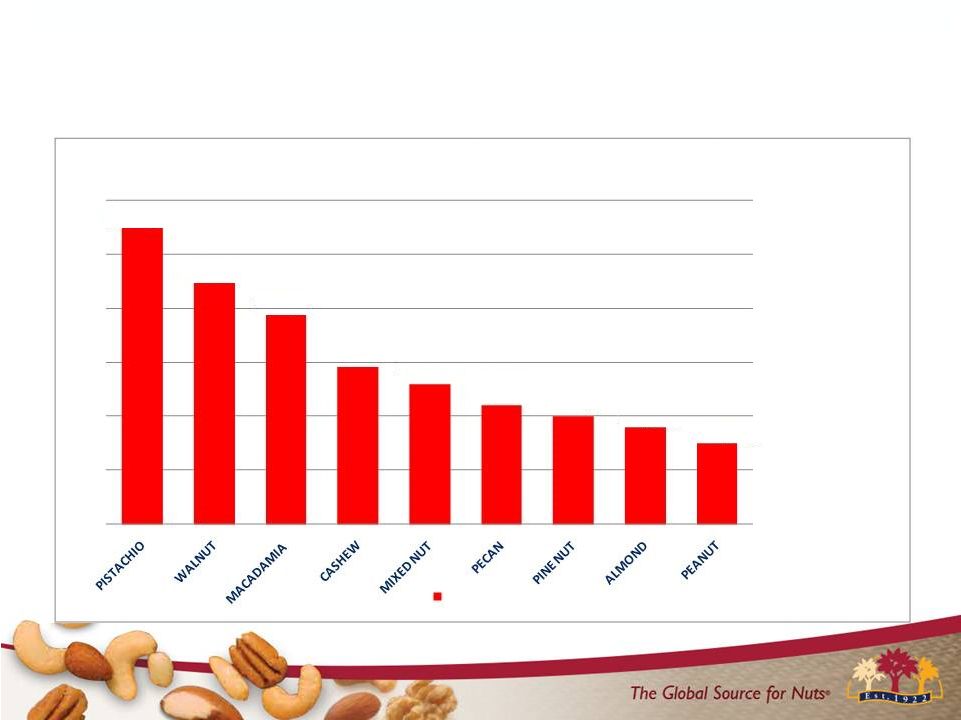 9 Retail Prices Up Across All Nut Types over the Last 5 Years +56% +46% +20% +18% +15% +29% +39% +26% +22% 0% 10% 20% 30% 40% 50% 60% Price Per Pound – Percent Change Over Last 5 Years Change vs. FY 2010 Source: IRI: Total Nut Category – Multi Outlet Geography – Year Ending 6/29/14 |
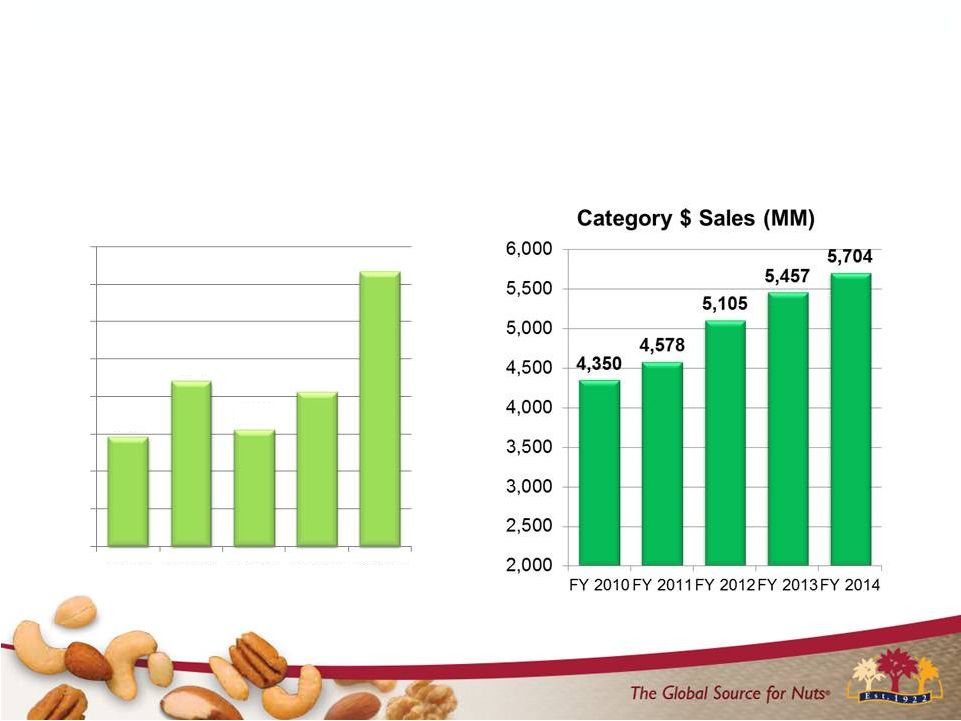 10 Nut Category has had strong Sales Growth 930 940 950 960 970 980 990 1000 1010 Category LB Sales (MM) 959 974 961 971 1,003 FY 2010 FY 2011 FY 2012 FY 2013 FY 2014 Source: IRI: Total Nut Category – Multi Outlet Geography – Year Ending 6/29/14 |
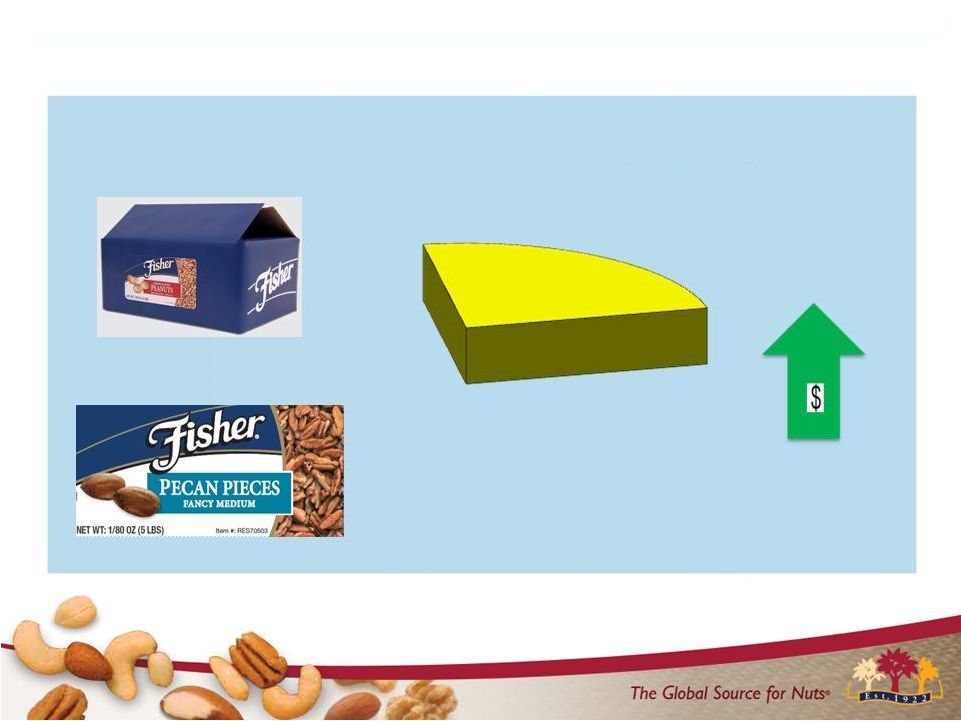
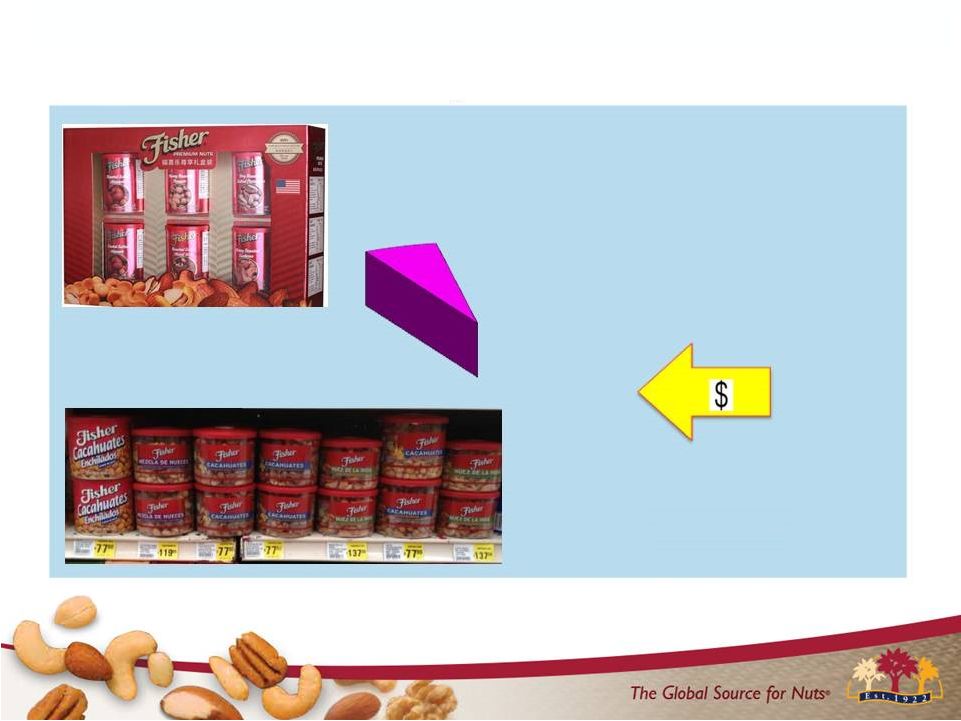
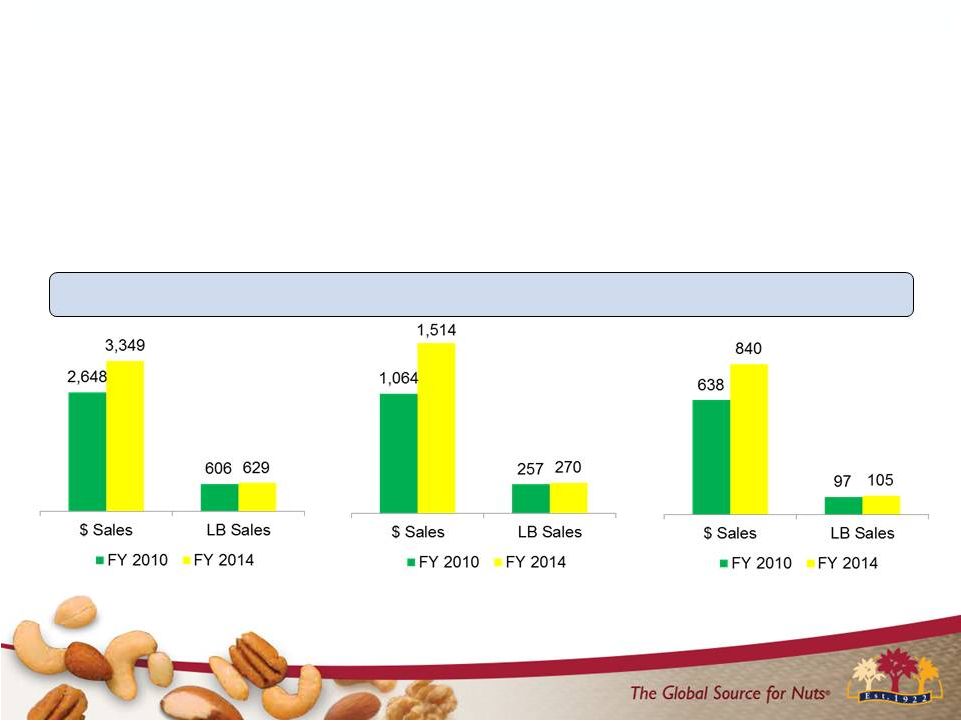 Category Growth Across the Store +26% +4% +42% +5% +32% +8% Snack Nuts Produce Nuts Recipe Nuts 11 Source: IRI: Total Nut Category – Multi Outlet Geography – Year Ending 6/29/14 |
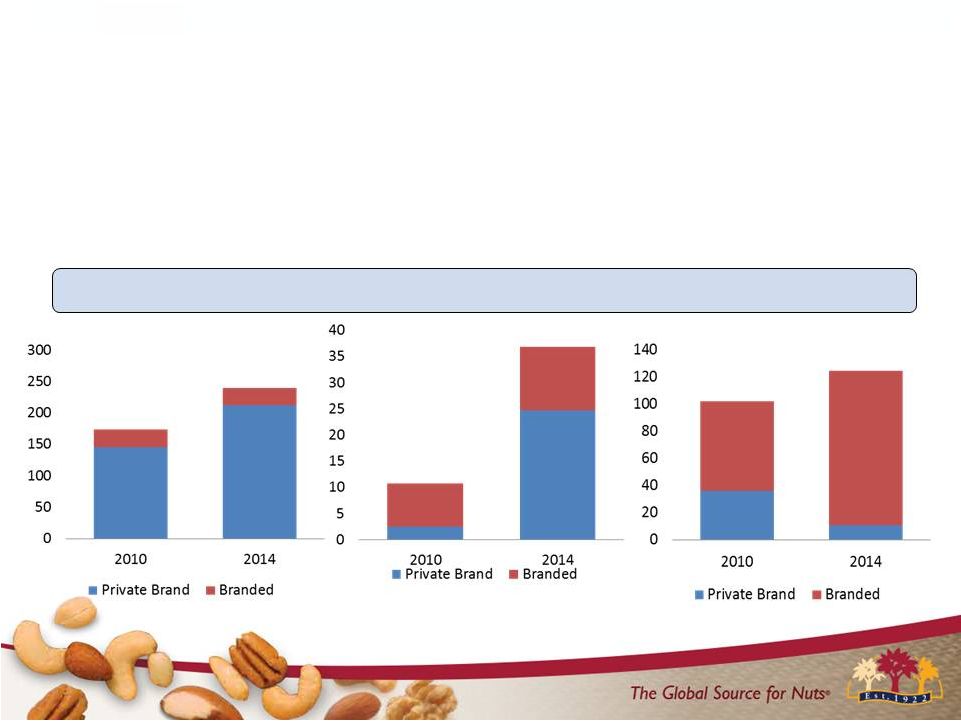 JBSS Growth (Gross Sales) Across the Store +38% +244% +22% Source: Internal JBSS Shipment Data Snack Nuts Produce Nuts Recipe Nuts 12 |
 JBSS SALES CHANNEL UPDATES 13 |
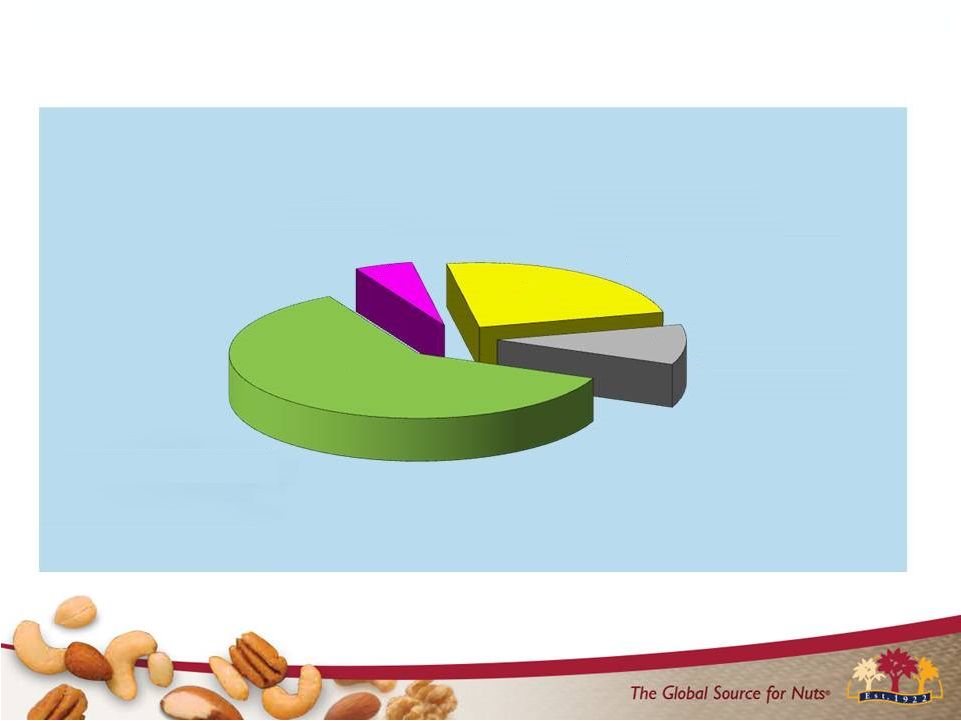 $193 $98 $454 Business Channel Diversification (Millions of $) $34 14 Commercial Ingredients 25% Contract Pkg. 13% Consumer 58% Export 4 % Fiscal 2014 Net Sales $779 Million |
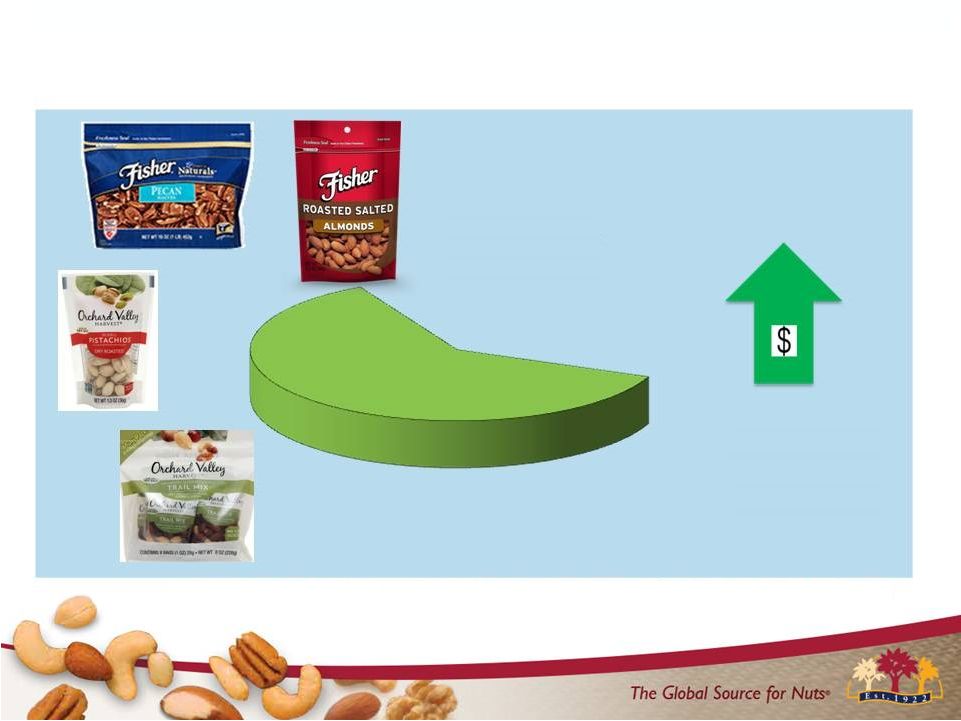 15 Consumer 58% vs. FY ‘13 FY 2014 Consumer Channel 4.1% Fiscal 2014 Net Sales $454 Million |
 16 FY 2014 Commercial Ingredients Channel Fiscal 2014 Net Sales $193 Million Commercial Ingredients 25% 8.4% vs. FY ‘13 |
 FY 2014 Export Channel 17 Export 4% 0% Vs. FY ‘13 Fiscal 2014 Net Sales $34 Million |
 18 Contract Packaging 13% Vs. FY ‘13 FY 2014 Contract Packaging Channel Fiscal 2014 Net Sales $98 Million 14.0% |
 CORPORATE STRATEGIES 19 |
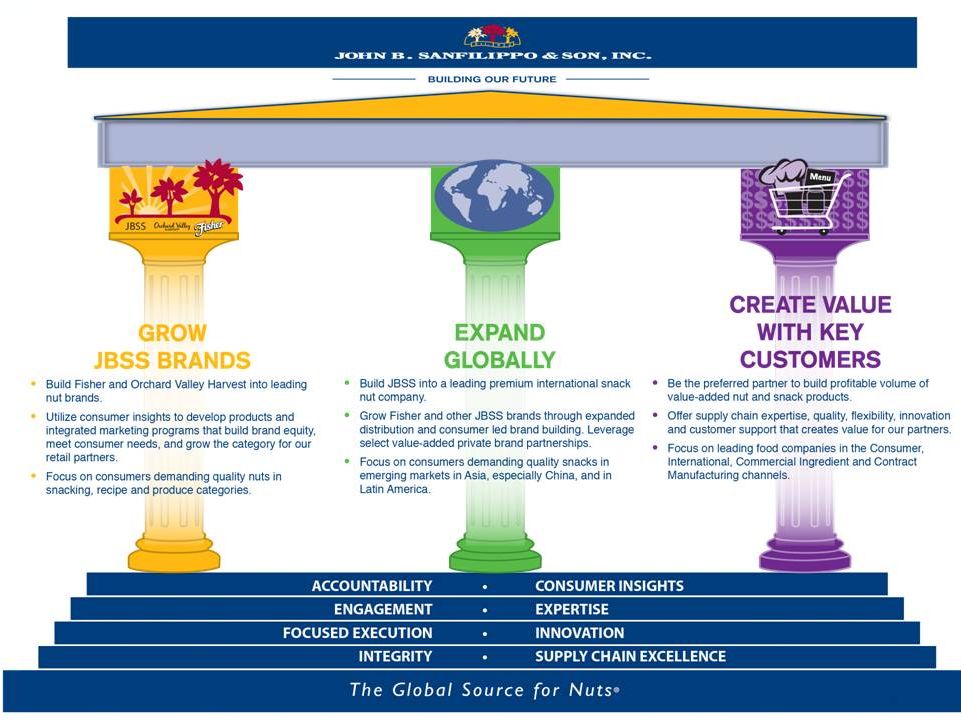 20 |
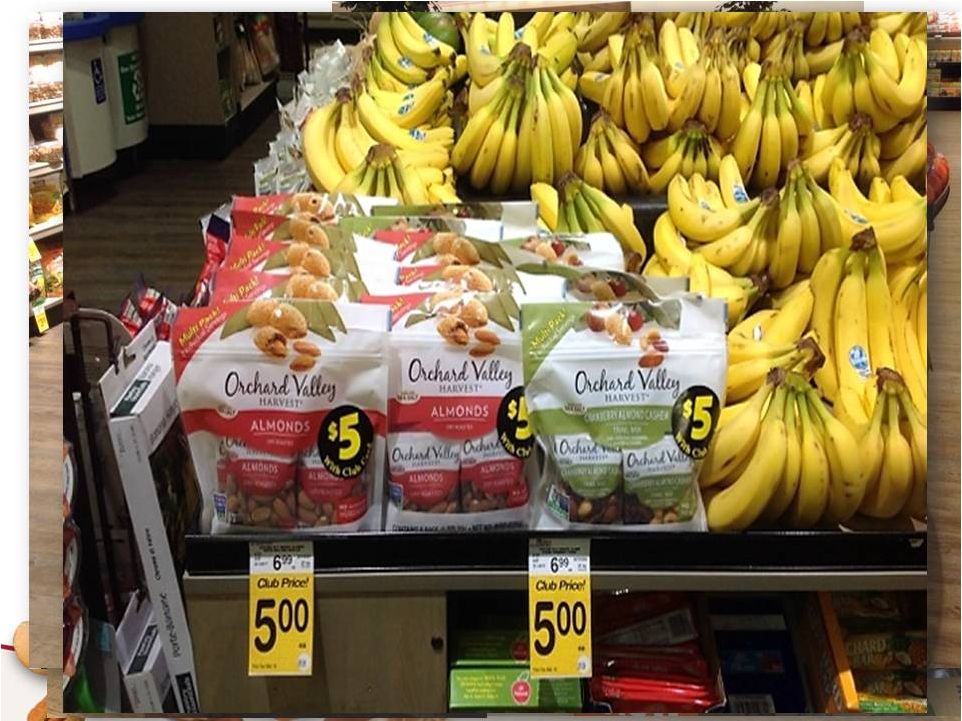
 Fisher Recipe Nuts market share leadership excluding club size items Fisher Snack Nuts market share growth in high franchise Midwest Orchard Valley Harvest expanded distribution and increased velocity resulting in double-digit revenue growth Award-winning marketing programs FY 2014 Accomplishments 21 |
 Established a Foreign Invested Commercial Enterprise (FICE) in China Expanded Fisher Snacks in Asia and the Middle East Continued to leverage key retail partnerships for a record year with private brands FY 2014 Accomplishments 22 |
 Received Contract Manufacturing supplier quality award Optimized Food Service and Industrial Ingredient customer and product portfolios Expanded Continuous Improvement efforts throughout our organization FY 2014 Accomplishments 23 |
 FY 2014 Sales & Marketing Update 24 |
 Recipe Nuts Snack Nuts 25 |
 Fisher is a Growing Brand Sales Pounds +7% Net Sales +6% Sales Pounds +1% Net Sales +8% Fiscal 2014 Actual vs. Prior Year 3 Year CAGR 26 |
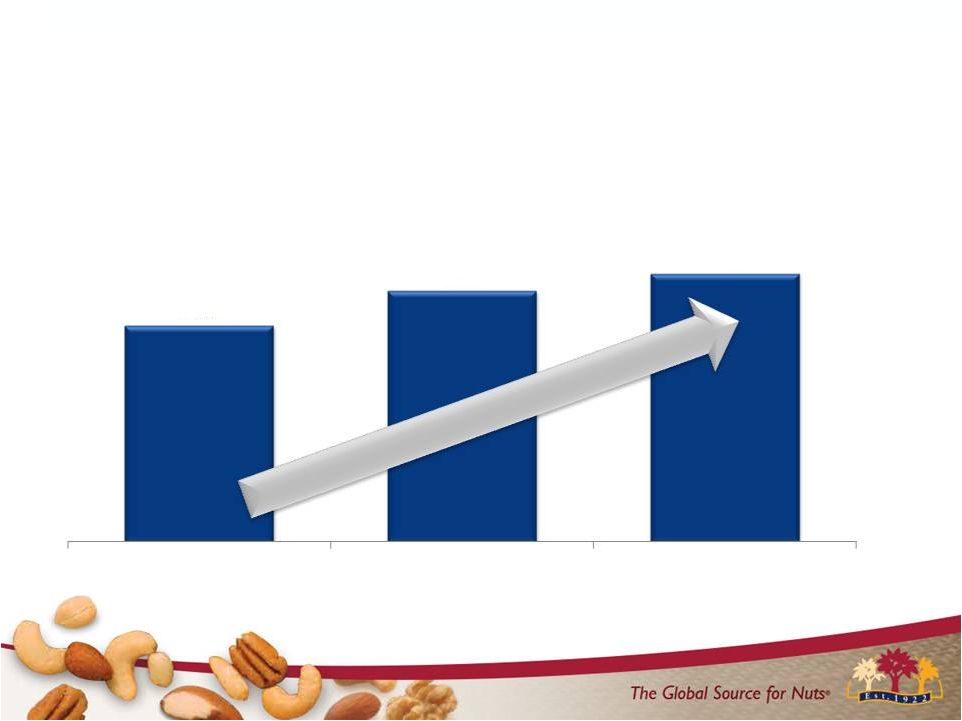 27 Total Fisher Brand has Grown Dollar Share over the last 3 Years 2.5 2.9 3.1 FY 2012 FY 2013 FY 2014 Fisher Dollar Share Source: IRI:Ttl Nut Category – Multi Outlet Geography Year Ending 6/29/14 |
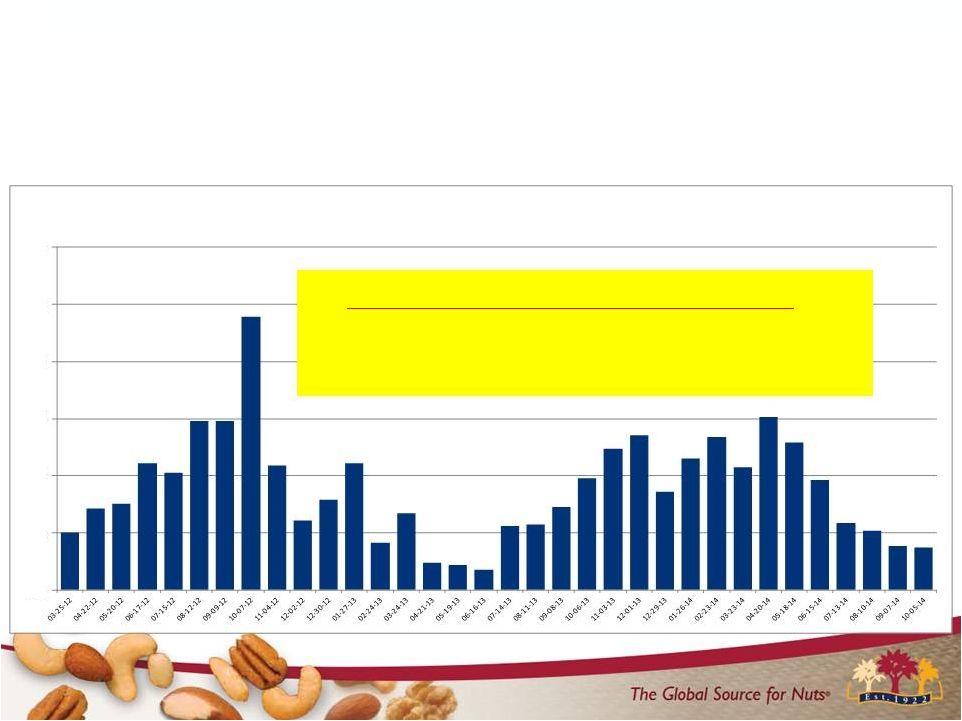 Strong and Sustained Growth on Fisher Recipe Nuts 34 Consecutive Quad-Weeks of Increased IRI measured Consumption! 28 0% 10% 20% 30% 40% 50% 60% Fisher LB % Change vs. Last Year Source: IRI: Ttl Recipe Nut Category – Multi Outlet Geography – Latest 34 Quad Weeks Ending 10/5/14 |
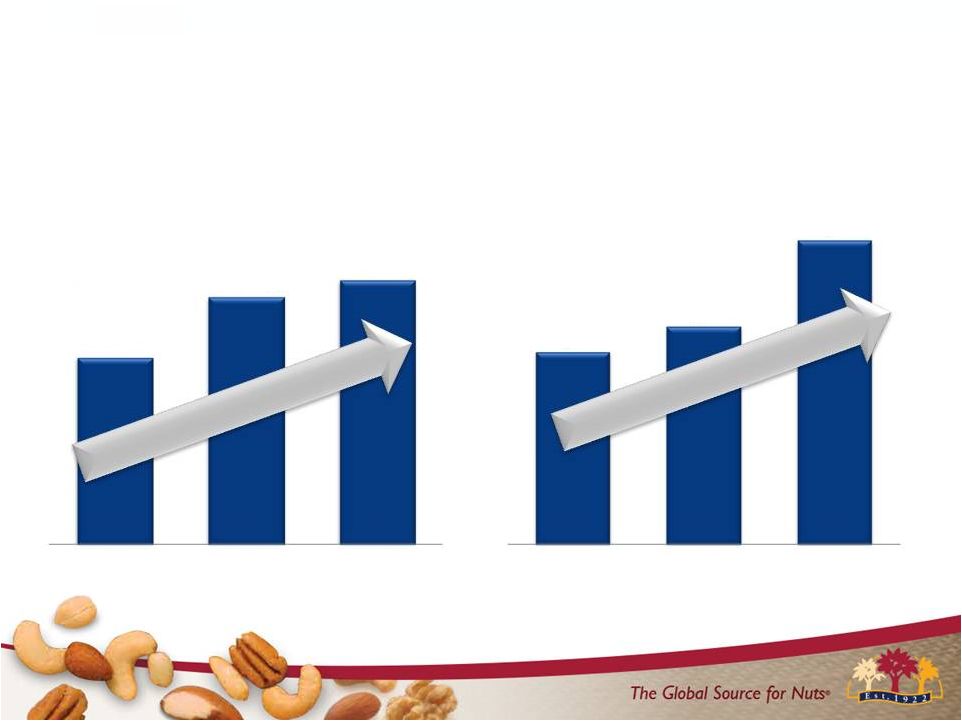 29 Success Driven by both Increased Distribution and Movement 33.0% 43.5% 46.5% FY 2012 FY 2013 FY 2014 Fisher ACV Growth* 14,160 16,022 22,372 FY 2012 FY 2013 FY 2014 Fisher Pound Velocity* Source: IRI: Ttl Recipe Nut Category – Multi Outlet Geography –Year Ending 6/29/14 *Note: ACV refers to “All Commodity Volume” and “Velocity” is pounds per point of distribution as measured by IRI |
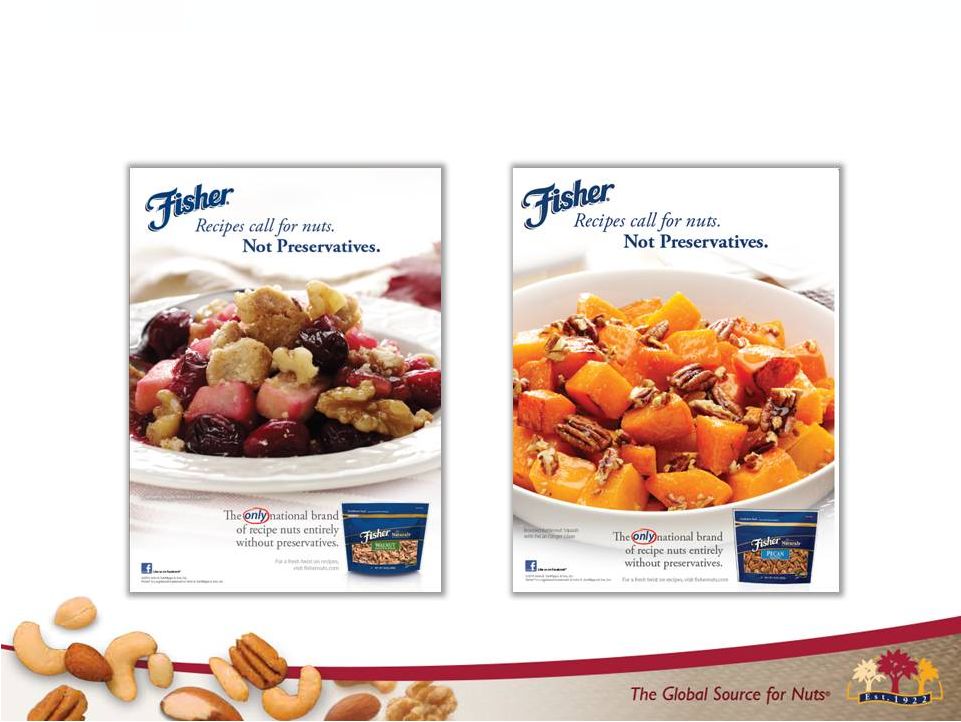 Differentiating versus competition with “No Preservatives” Message Print 30 |
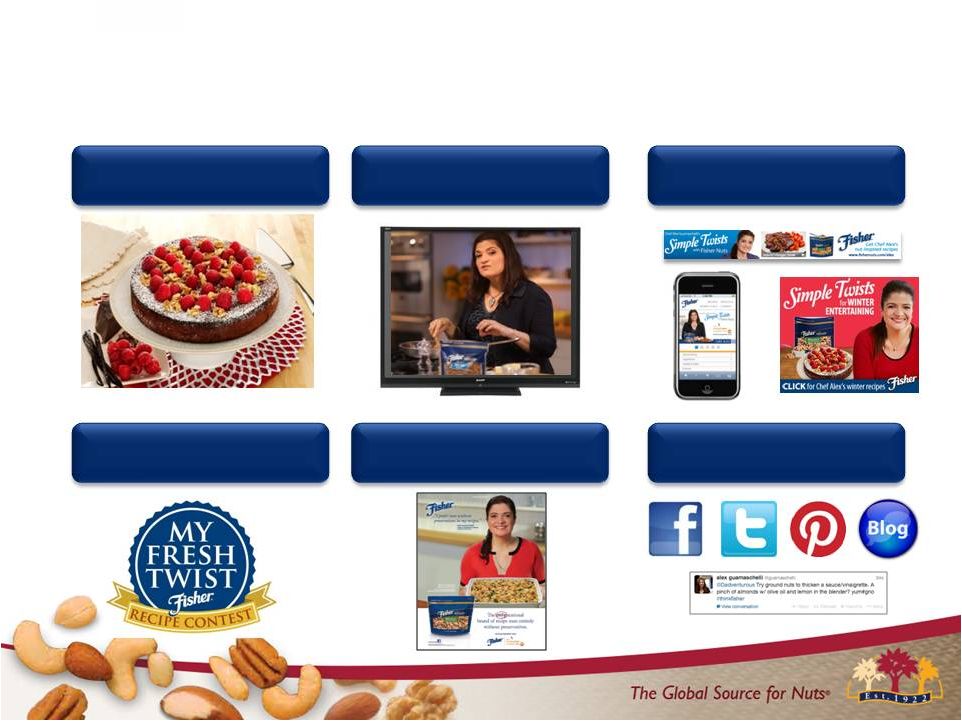 Building Fisher Brand Equity with Food Network Sponsorship 31 Recipes Food Network Vignettes Digital and Mobile Recipe Contest Food Network Magazine Social Media and PR |
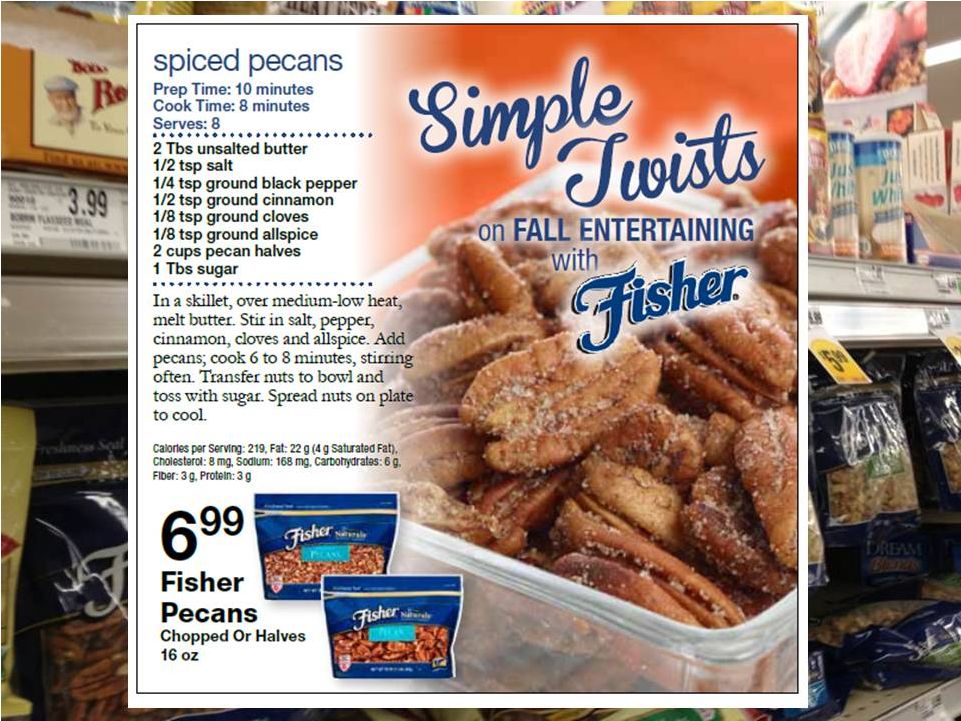
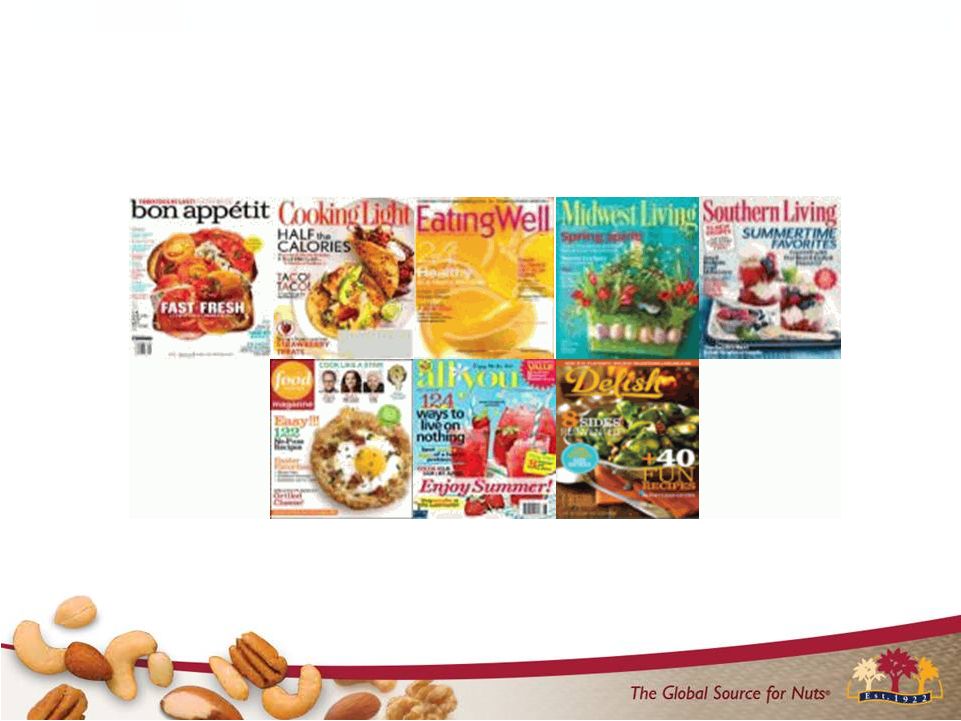 We extend our reach through Print that reaches our Core Consumer 32 |
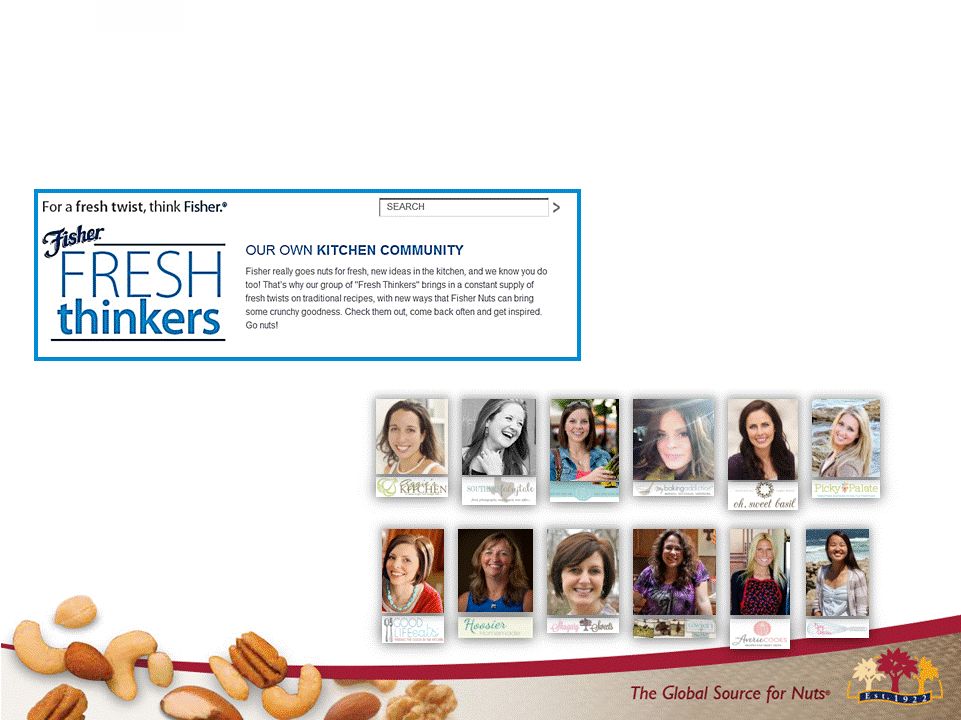 Expanding Social Media Presence with “Fisher Fresh Thinkers” 33 |
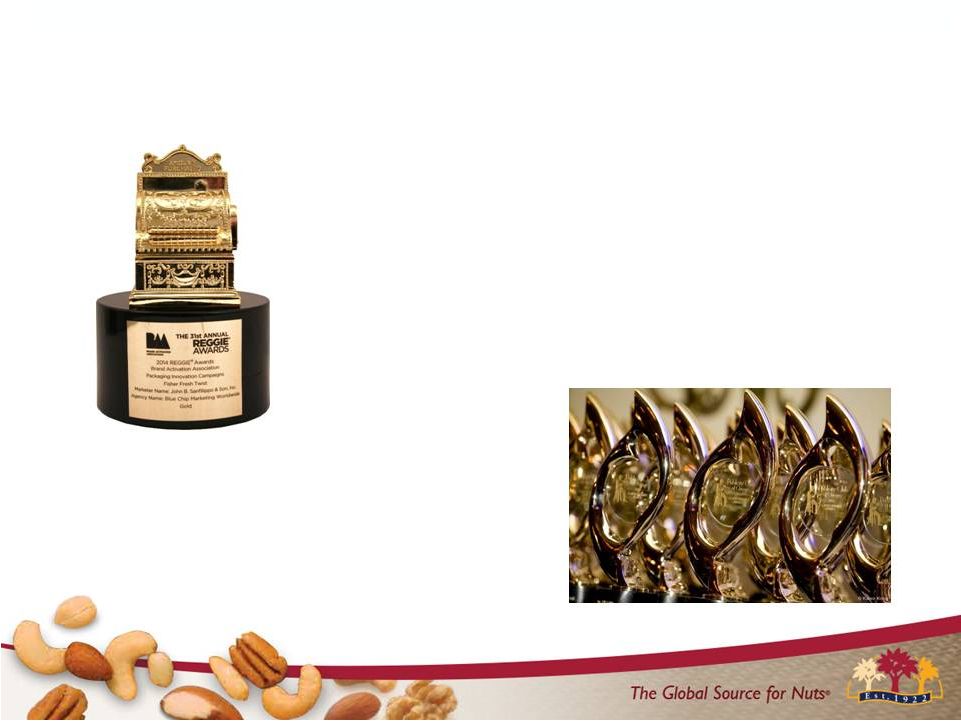 Reggie Gold Award Brand Activation Association (March 2014) Golden Trumpet Gold Award Publicity Club of Chicago (June 2014) Brand -Building Marketing Recognized with Industry Awards 34 |
 Winning the year is about Pounds-on-the-floor 35 26.7 37.2 41.2 FY 2012 FY 2013 FY 2014 Fisher % ACV Any Display* Source: IRI: Ttl Recipe Nut Category – Multi Outlet Geography –Year Ending 6/29/14 *Note: ACV refers to “All Commodity Volume” as measured by IRI |
 36 |
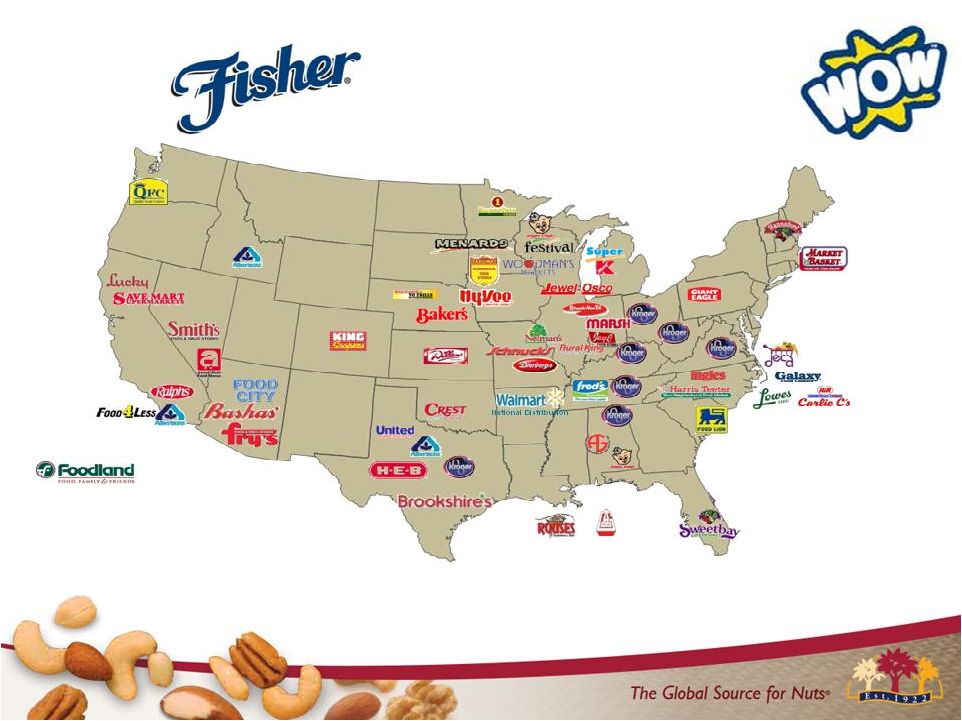 Recipe Recipe Nut Nut Distribution Distribution 37 Hawaii |
 38 |
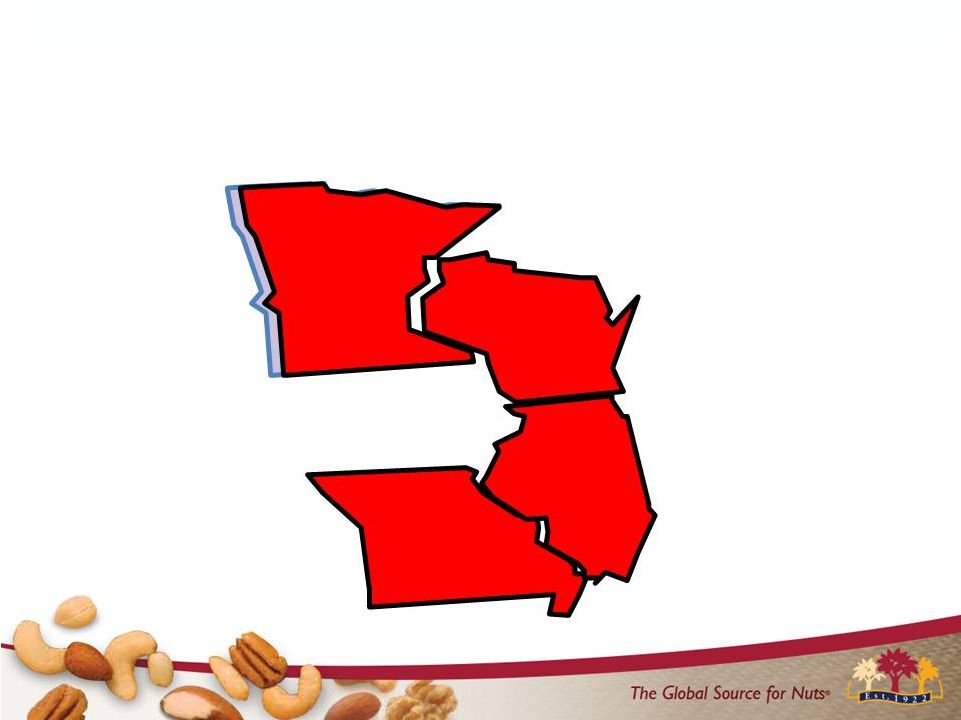 Fisher snack nut Strategy Focused on Midwest High Franchise Markets 39 |
 40 Fisher snack nuts Growing Pound Share in High Franchise Markets 1.8 2.7 3.1 FY 2012 FY 2013 FY 2014 Fisher snack nuts Pound Share (High Franchise Markets) Source: IRI: Ttl Snack Nut Category – Fisher High Franchise Geography –Years Ending 6/29/14 |
 41 Success driven by Improved Distribution and Movement 473 669 674 FY 2012 FY 2013 FY 2014 Fisher TPD* 1,354 1,386 1,634 FY 2012 FY 2013 FY 2014 Fisher Pound Velocity* Source: IRI: Ttl Snack Nut Category – Fisher High Franchise Geography –Year Ending 6/29/14 *Note: TPDs refers to Total Points of Distribution and Velocity refers to pounds per point of distribution as measured by IRI |
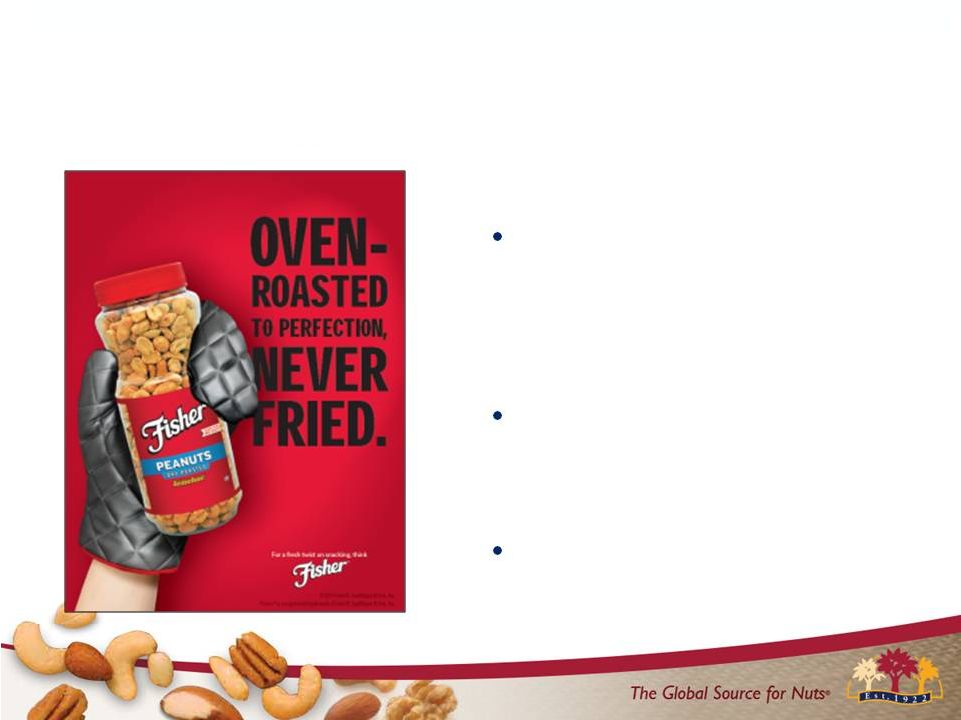 Source: Blue Chip Worldwide SPARQ concept research, December 2013 Driving Results on Core Dry Roast Peanut Business “Oven Roasted, Never Fried” communication drives purchase interest Elevates taste and healthy snack perceptions Supported through FSIs, In-Store and via Digital 42 |
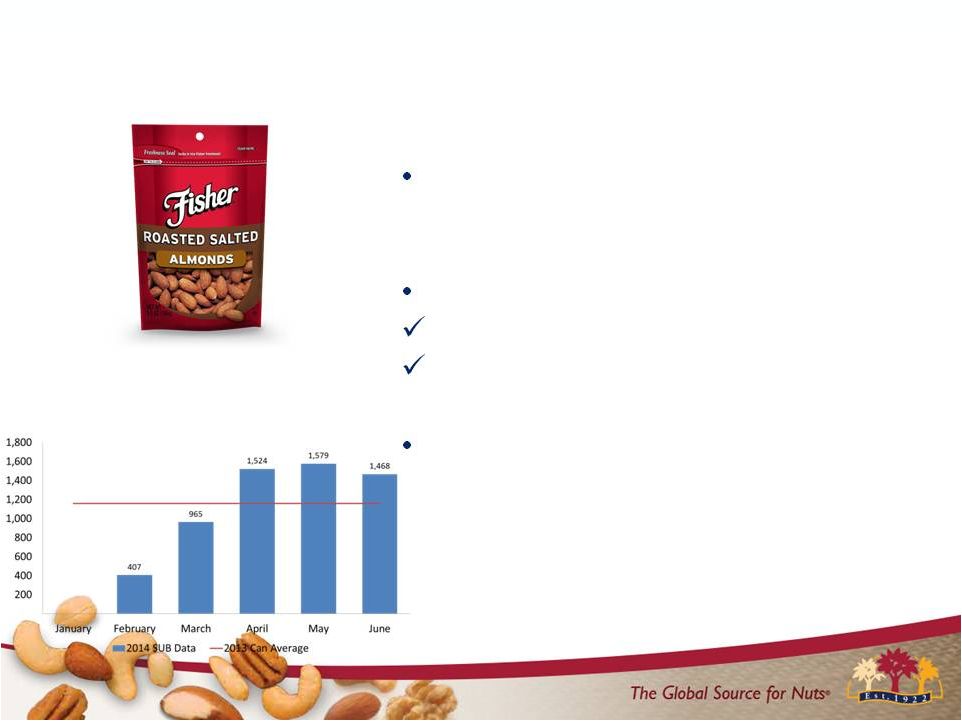 Velocity (Pound Sales per Distribution Point) Source IRI Growing Fisher Almond line Converted Almond line to 5.5 oz Stand Up Re-sealable bags Consumer Value Proposition: Better per package price; Re-closeable to seal-in freshness Result: Increased movement per point of distribution 43 Source: IRI Quad Week Data Ending 6/29/14 Multi-Outlet Geography Note: Velocity refers to pounds per point of distribution as measured by IRI |
 Importantly, we are increasing the # of SKUs* on-shelf 44 9.5 9.8 12.7 FY 2012 FY 2013 FY 2014 Avg # of Items per Store Selling Source: IRI Ttl Snack Nut Category – Fisher High Franchise Geography –Year Ending 6/29/14 *Note: SKUs refer to Stock Keeping Units |
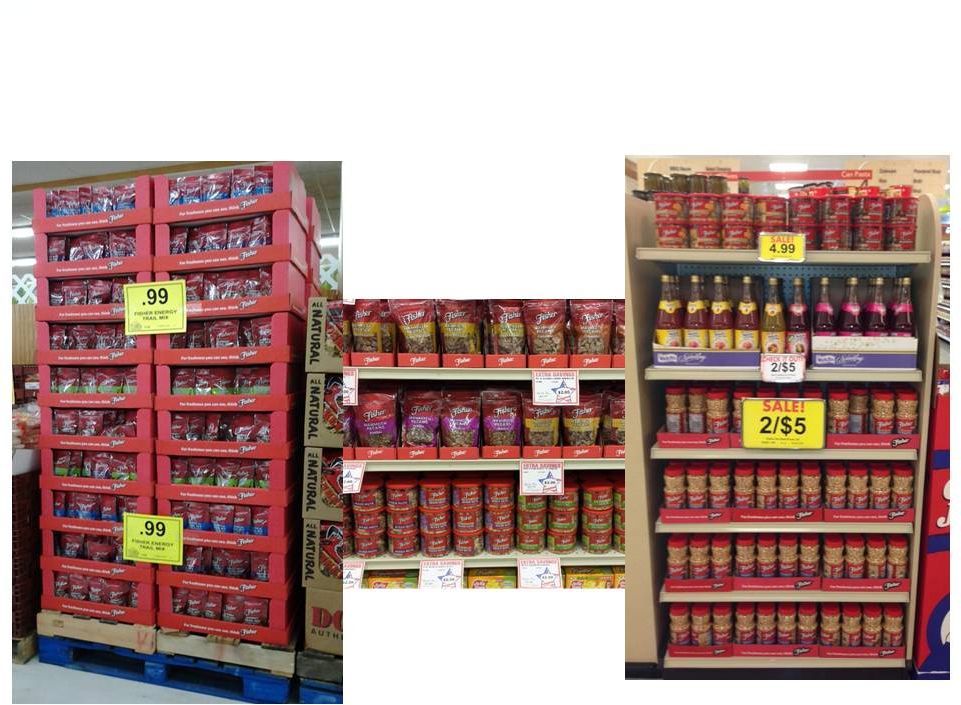 We are fast adapting to key retailers’ rules on displays… winning again! 45 |
 Snacks Distribution Snacks Distribution 46 |
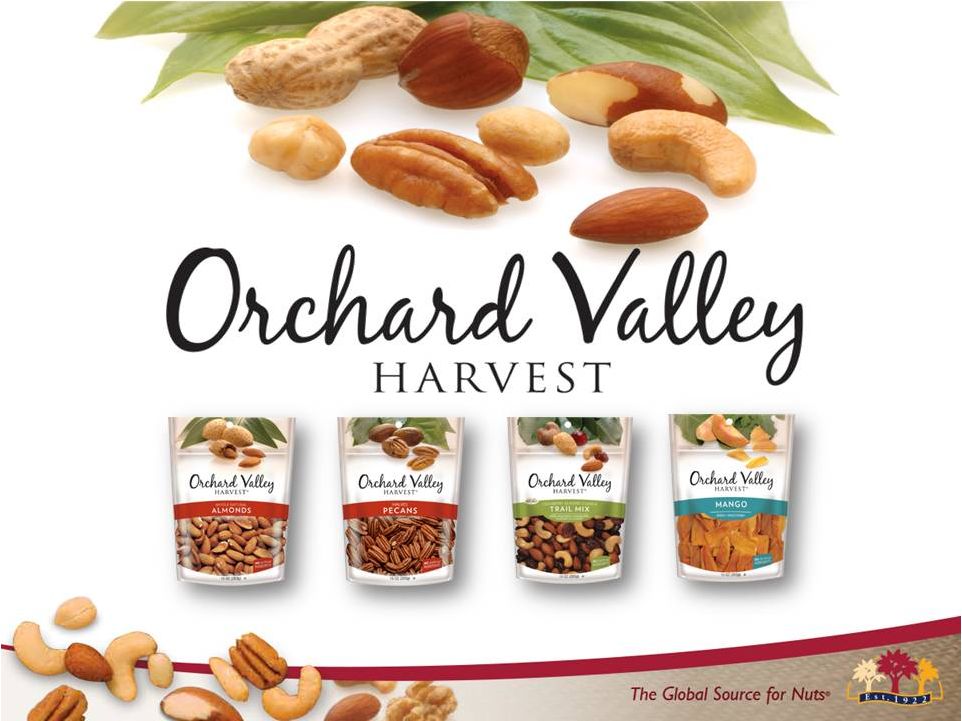 Pure and Simple Goodness 47 |
 Orchard Valley Harvest Brand Equity 48 Pure & Simple Goodness Support a healthy lifestyle Close to the earth |
 Orchard Valley Harvest Delivers 49 |
 Sales Pounds + 9% Net Sales +16% Orchard Valley Harvest is a Growing Brand 50 Fiscal 2014 Actual vs. Prior Year |
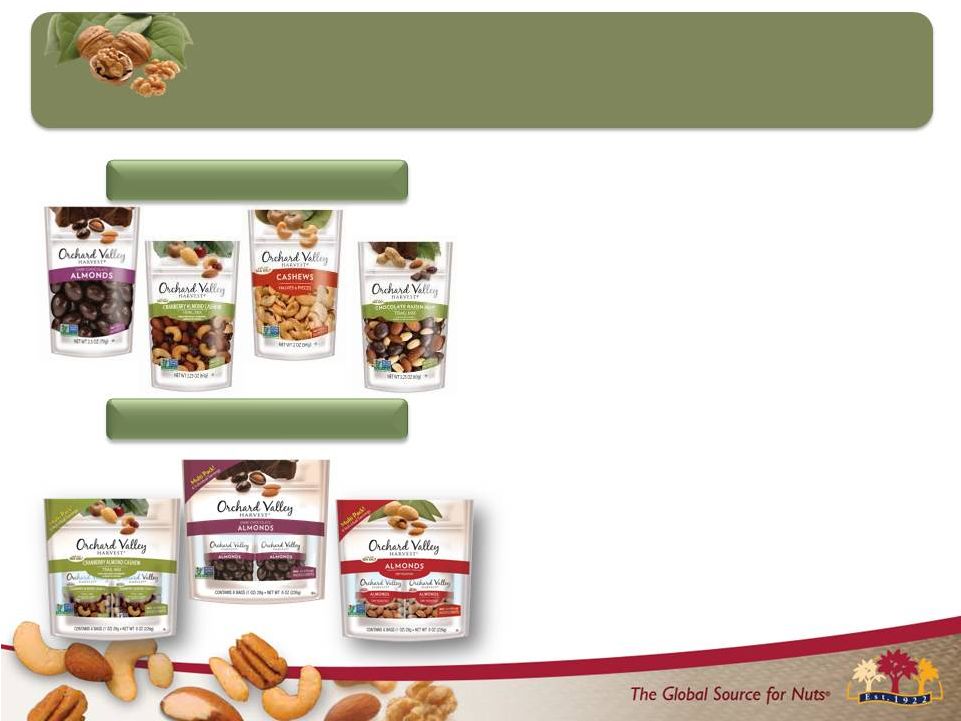 Source: The Hartman Group : Eating Occasions, Compass 2012 The Hartman Group: Reimagining Health and Wellness, 2013 Mini’s and Multi-Packs Tap into “On the Go” Snacking • Snacking accounts for over 53% of all eating occasions in the US • 38% of consumers snack several times per day 51 Grab ‘n Go Mini’s Multi-Packs |
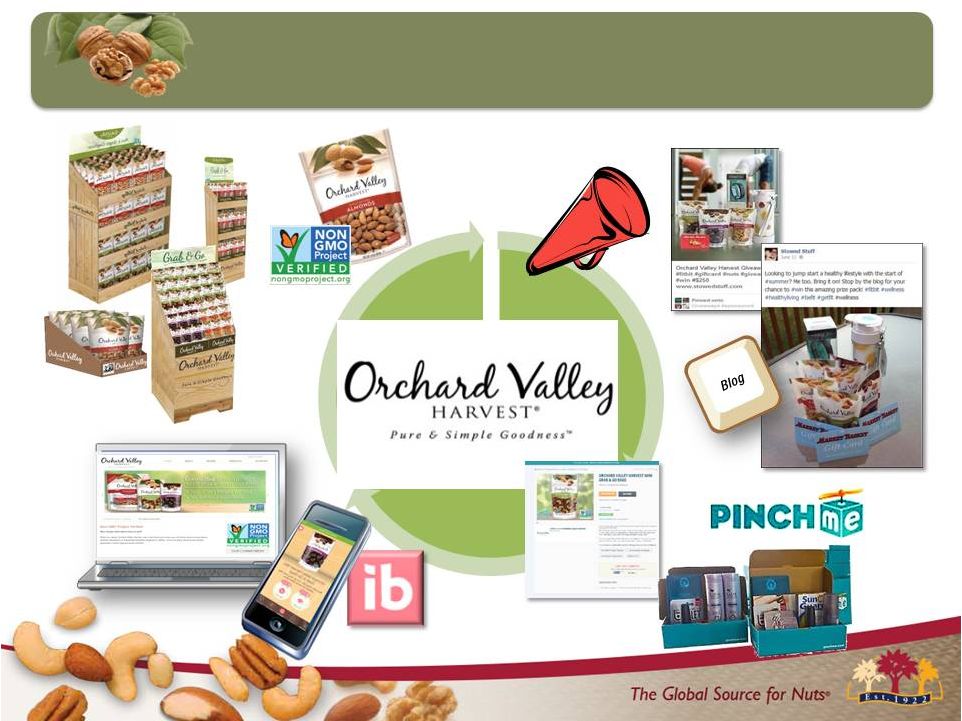 FY15 OVH Marketing Support Bloggers Ibotta Website PR In-Store Merchandising New Packaging 52 |
 Driving Increased Distribution 53 FY13 Driver: FY14 Driver: Source: IRI: Ttl Produce Nut Category – Total US Food Geography–Year Ending 6/29/14 *Note: % ACV refers to % “All Commodity Volume” as measured by IRI |
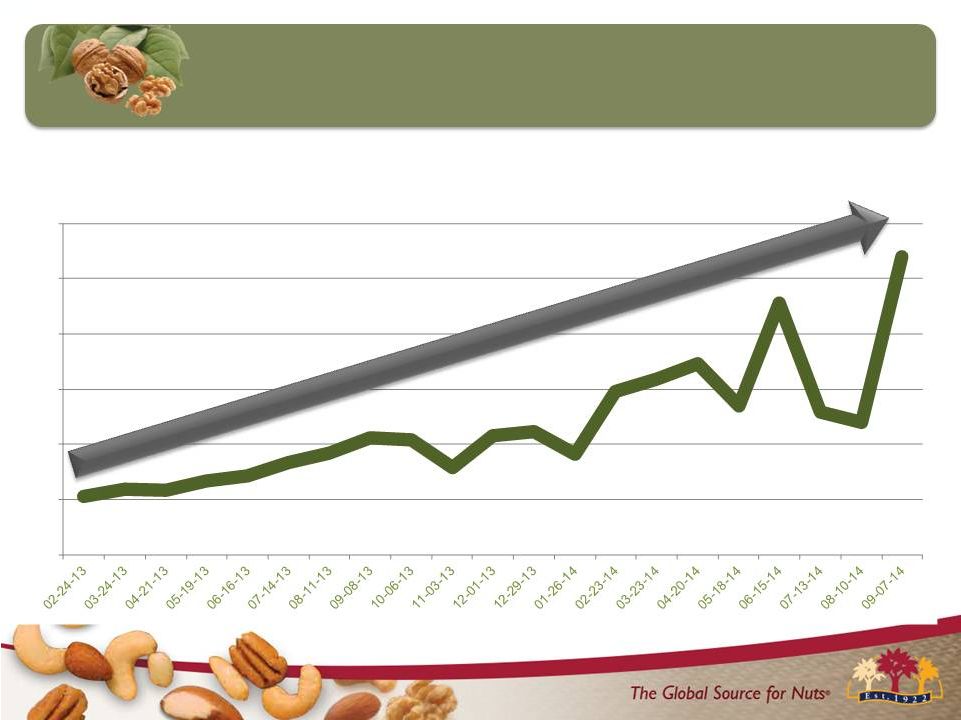 Driving Increased Movement 54 - 1,000 2,000 3,000 4,000 5,000 6,000 Units Sales Per Point of Distribution – Total OVH Source: IRI Ttl Produce Nut Category – Total US Food Geography– Quad Weeks Ending 9-7-14 |
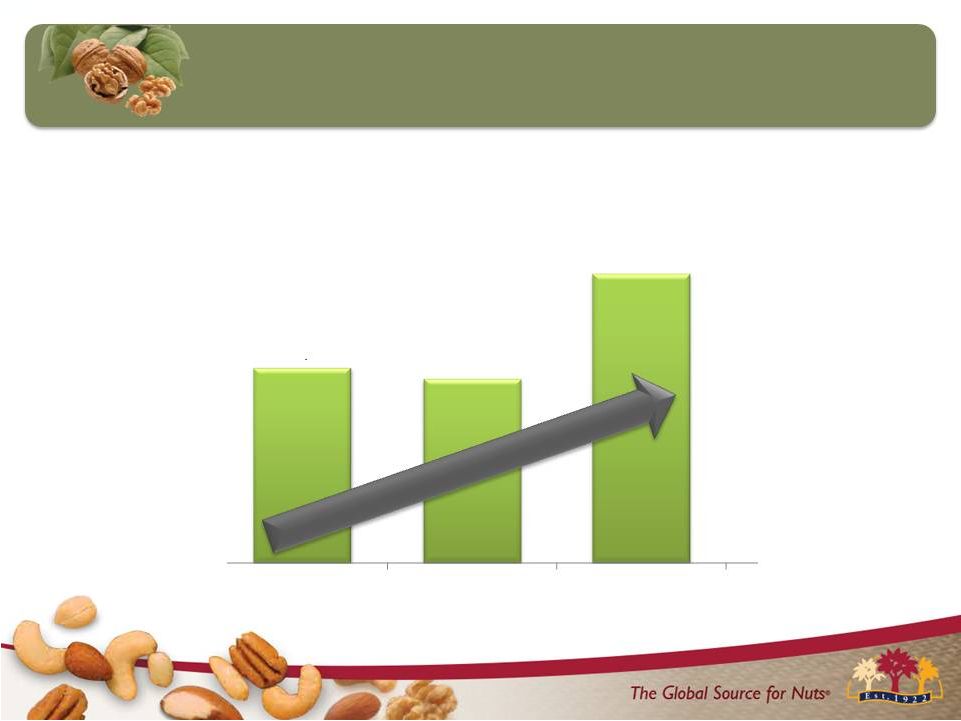 Displays drive sales in produce 55 Source: Internal JBSS Shipment Data 392,656 370,401 582,077 FY 2012 FY 2013 FY 2014 Shipper & 1/4 Pallet Lb Displays |
 |
 FY 2014 Financial Milestones 57 |
 JBSS Stockholders’ Equity FYs 1991- 2014 58 25 32 69 68 76 73 73 78 80 87 94 102 119 181 196 180 163 158 165 180 184 201 215 227 $0 $25 $50 $75 $100 $125 $150 $175 $200 $225 $250 |
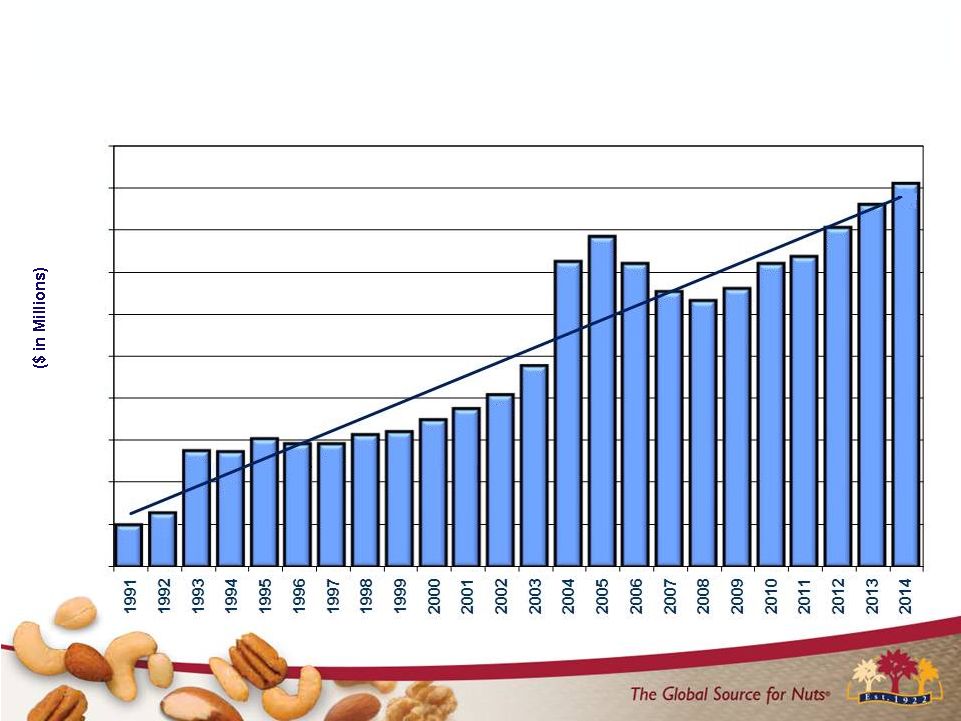
 JBSS Net Sales FYs 1991- 2014 59 Item Rationalization, De-emphasized Commodity Sales, Lower Prices Low Carb Diet Run Up 165 193 204 209 277 293 132 312 313 327 342 353 420 521 582 580 541 542 554 562 674 701 734 779 $0 $100 $200 $300 $400 $500 $600 $700 $800 $900 |
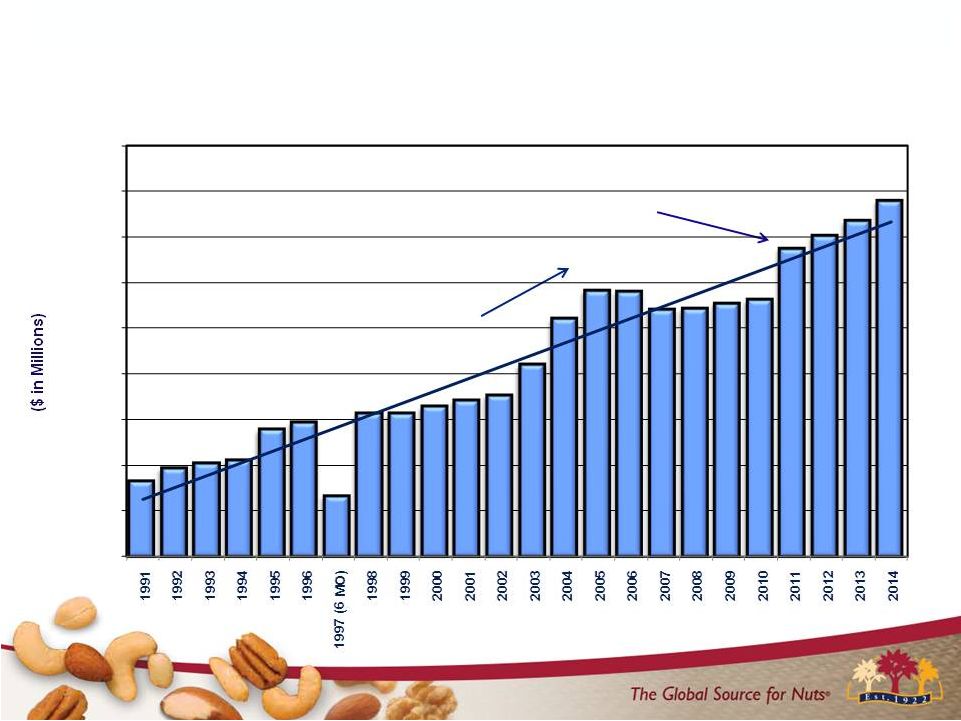
 JBSS Total Outstanding Debt FYs 1991- 2014 Facility consolidation Improved operating performance 60 50 76 71 107 107 98 93 115 100 99 89 70 70 19 144 138 148 133 94 99 101 95 74 80 $0 $20 $40 $60 $80 $100 $120 $140 $160 |
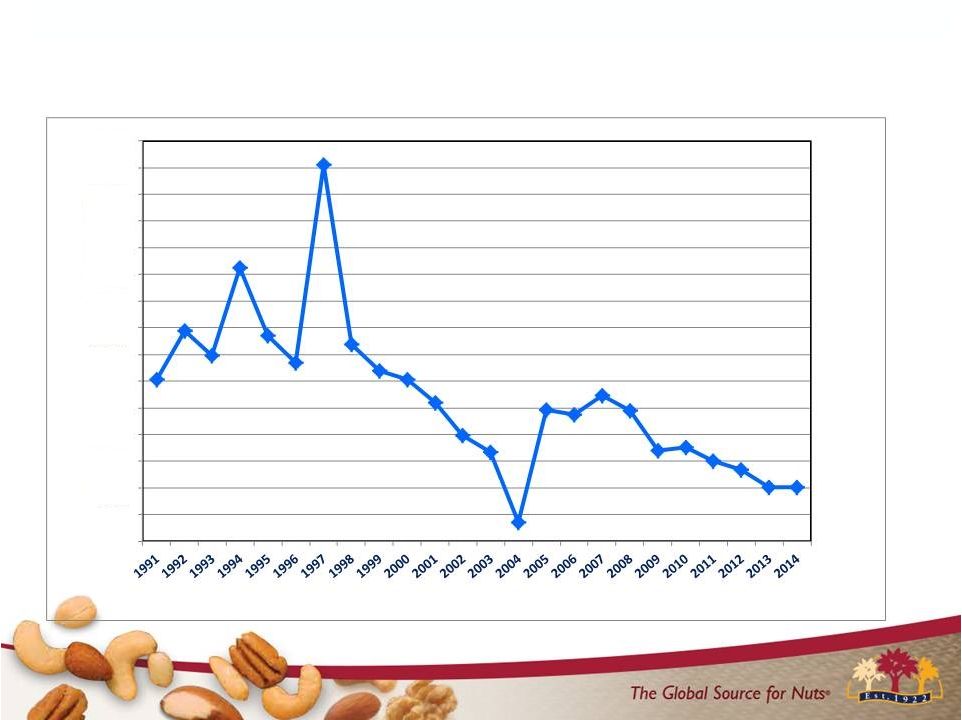 JBSS Total Outstanding Debt As % of Net Sales FYs 1991 – 2014 Note: FY 1997 reflects stub year 61 0.0% 5.0% 10.0% 15.0% 20.0% 25.0% 30.0% 35.0% 40.0% 45.0% 50.0% 55.0% 60.0% 65.0% 70.0% 75.0% |
 EBITDA 62 EBITDA consists of earnings before interest, taxes, depreciation, amortization and noncontrolling interest. EBITDA is not a measurement of financial performance under accounting principles generally accepted in the United States of America ("GAAP"), and does not represent cash flow from operations. EBITDA is presented solely as a supplemental disclosure because management believes that it is important in evaluating JBSS's financial performance and market valuation. In conformity with Regulation G, a reconciliation of EBITDA to the most directly comparable financial measures calculated and presented in accordance with GAAP is presented in the following slide. |
 Reconciliation of Net Income (Loss) to EBITDA (In $,000's) FY2004 FY2005 FY2006 FY2007 FY2008 FY2009 FY2010 FY2011 FY2012 FY2013 FY2014 NET INCOME (LOSS) 22,630 14,499 (16,721) (13,577) (5,957) 6,917 14,425 2,835 17,122 21,760 26,287 INTEREST EXPENSE 3,434 3,998 6,516 9,347 10,502 7,646 5,653 6,444 5,364 4,754 4,354 INCOME TAX (BENEFIT) EXPENSE 14,468 9,269 (8,689) (7,520) (897) (259) 8,447 (49) 9,099 13,536 13,545 DEPRECIATION & AMORTIZATION 11,190 10,501 10,000 13,584 15,742 15,922 15,825 16,968 17,117 16,717 16,278 EBITDA 51,722 38,267 (8,894) 1,834 19,390 30,226 44,350 26,198 48,702 56,767 60,464 NET SALES 520,811 581,729 579,564 540,858 541,771 553,846 561,633 674,212 700,575 734,334 778,622 EBITDA MARGIN (% OF NET SALES) 9.9% 6.6% -1.5% 0.3% 3.6% 5.5% 7.9% 3.9% 7.0% 7.7% 7.8% POUNDS SOLD 284,576 278,741 248,137 246,142 221,958 217,465 224,302 232,746 212,553 221,762 240,417 EBITDA PER POUND SOLD 0.182 0.137 (0.036) 0.007 0.087 0.139 0.198 0.113 0.229 0.256 0.252 63 |
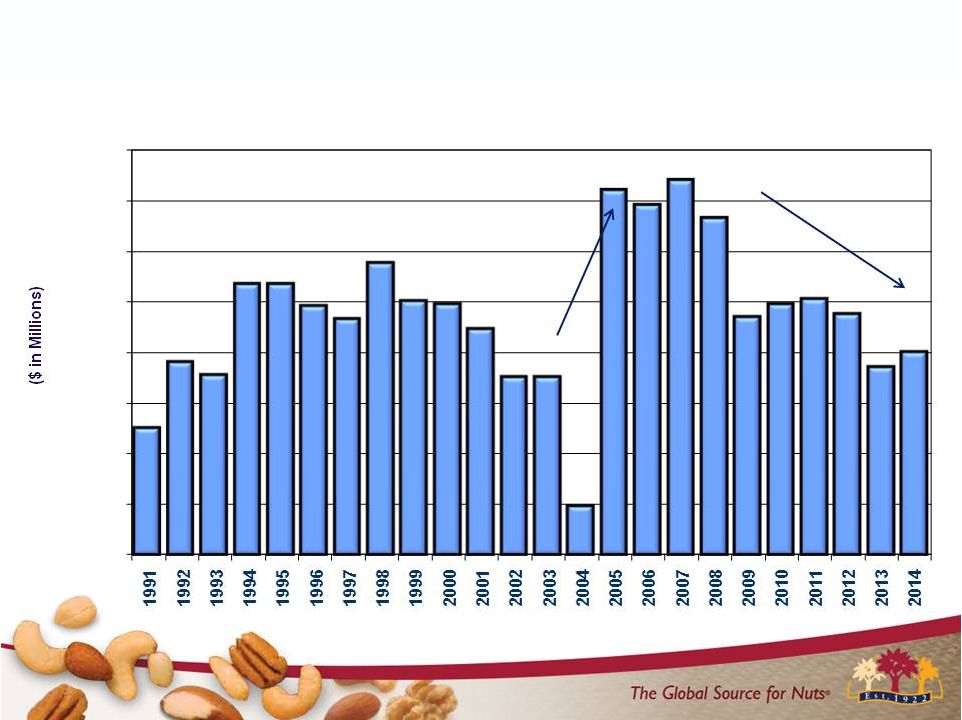
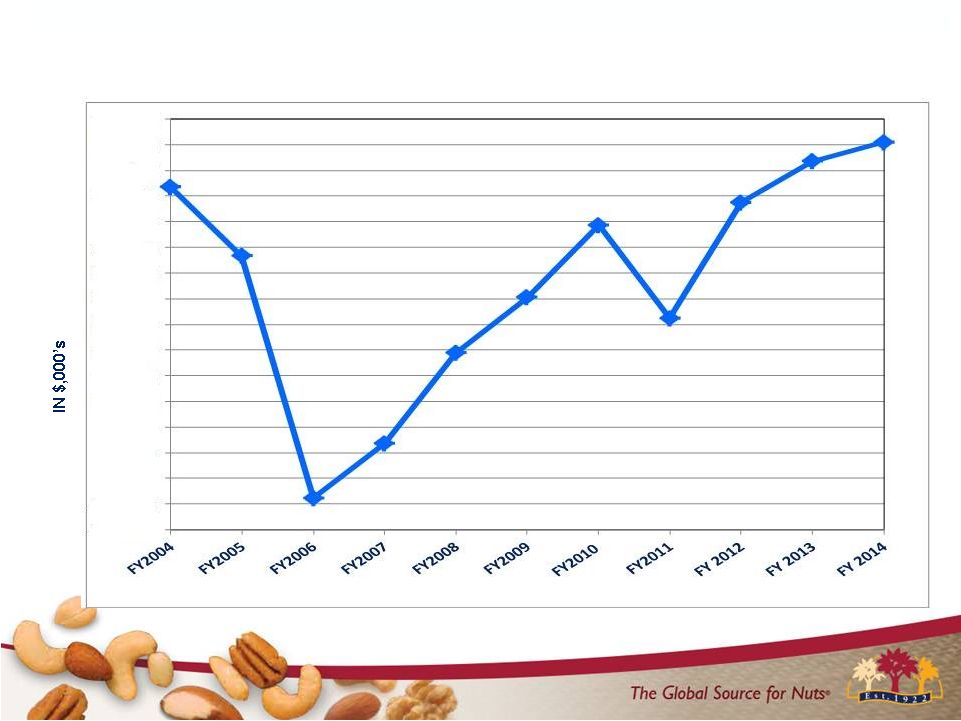 EBITDA* * EBITDA is a non-GAAP measure. See slide entitled “Reconciliation of Net (Loss) Income to EBITDA” for reconciliation to GAAP measure 64 -$15,000 -$10,000 -$5,000 $0 $5,000 $10,000 $15,000 $20,000 $25,000 $30,000 $35,000 $40,000 $45,000 $50,000 $55,000 $60,000 $65,000 |
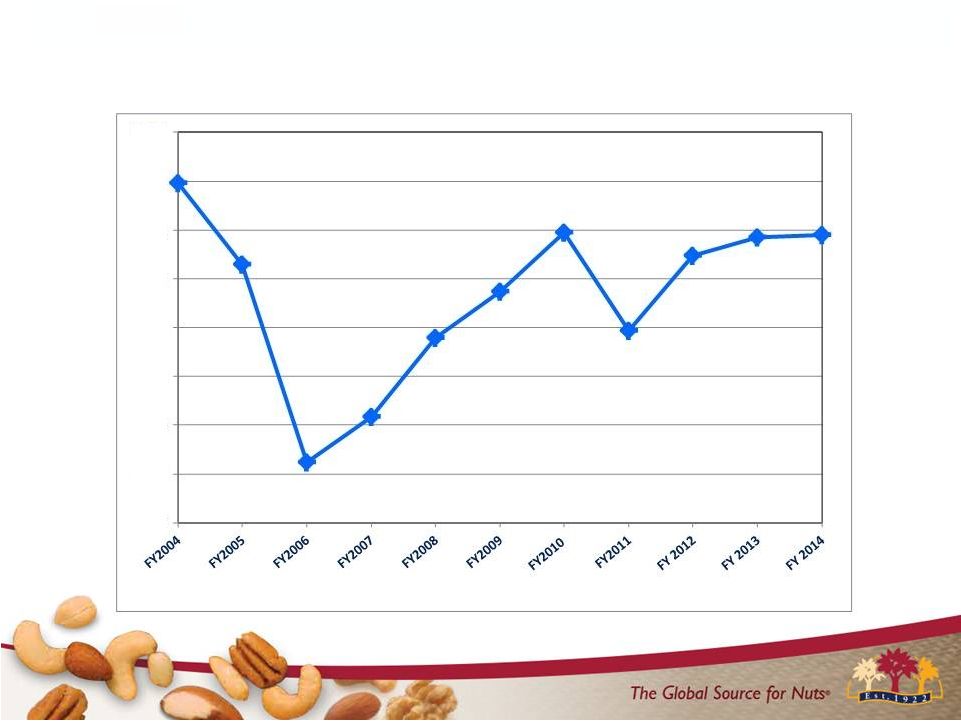 EBITDA* Margin (% of Net Sales) * EBITDA is a non-GAAP measure. See slide entitled “Reconciliation of Net (Loss) Income to EBITDA” for reconciliation to GAAP measure 65 -4.0% -2.0% 0.0% 2.0% 4.0% 6.0% 8.0% 10.0% 12.0% |
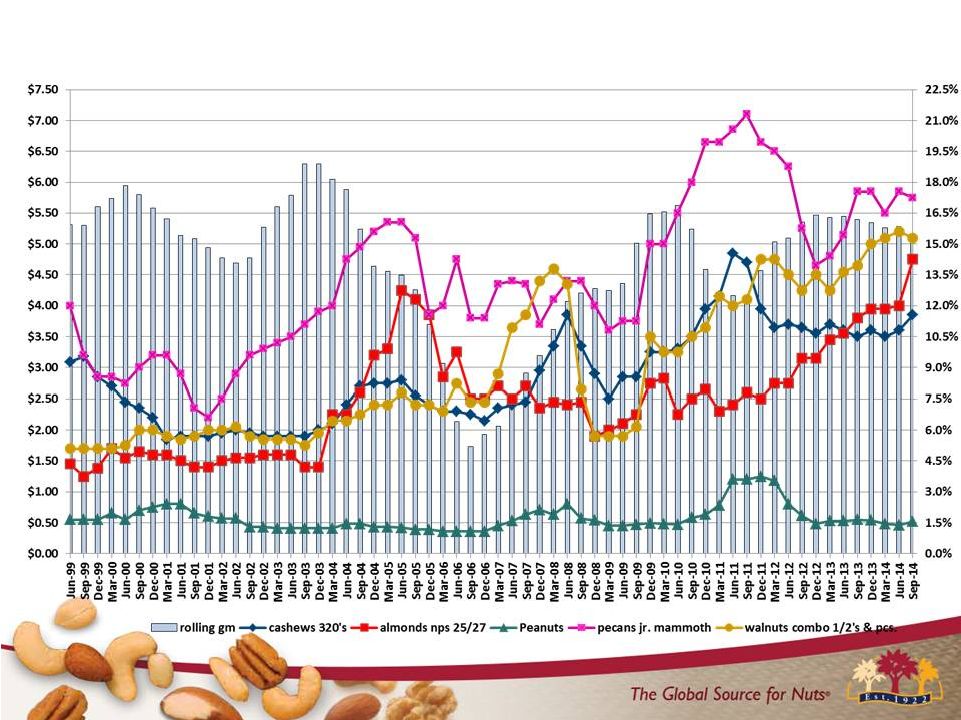 PEANUT AND TREE NUT SPOT MARKET PRICES VS. JBSS ROLLING 4 QTR. GROSS MARGIN % Source: Spot market prices from survey of JBSS vendors and brokers 66 |
 Highlights: Q1 2015 vs. Q1 2014 (in 000’s except EPS) 67 $ Chng. % Chng. Net Sales $ 28,340 16.0% Sales Volume (lbs. sold) 4,055 7.1% Gross Profit $ 1,315 4.5% Net Income * ($ 860) (12.7%) Earnings Per Share ($ 0.08) (13.1%) Operating Cash Flows $ 20,455 276.3% Total Debt ($11,385) (16.4%) * Adversely impacted by $1.4 million pretax increase in maintenance expenses for the exterior of our office building. |
 THANK YOU 68 |